Embed Size (px)
Citation preview

Fieldwork efforts
Monitoring fieldwork effortsMonitoring fieldwork efforts: Did interviewers /survey organisations implement fieldwork guidelines and procedures?
Evaluation of fieldwork effortsEvaluation of fieldwork efforts: Did fieldwork efforts result in increased response rates and more representative surveys?
UnderstandingUnderstanding the reasons of success/failure by combining information on monitoring and evaluation
1. Data
Call record data from 12 countries: The Netherlands, Hungary, Poland, Portugal, Finland, Switzerland, Great Britain, Ireland, Hungary, Spain, Greece, Israël
Information on timing, outcome and mode of each visiteach visit made to each sample uniteach sample unit
2. Reducing noncontact rates
Reduce noncontact rate by:– making many calls or visits– making visits at varied times of day and week
Contacting procedure– minimum of four calls– minimum of 1 weekend call– minimum of 1 evening call – all visits before first contact face-to-face
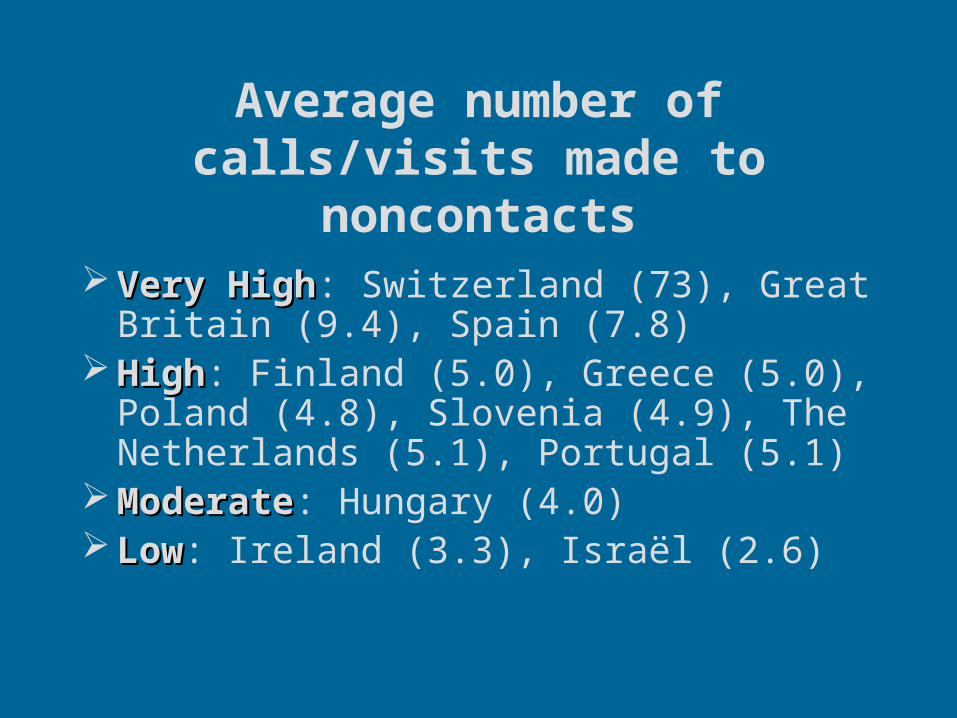
Average number of calls/visits made to
noncontacts
Very HighVery High: Switzerland (73), Great Britain (9.4), Spain (7.8)
HighHigh: Finland (5.0), Greece (5.0), Poland (4.8), Slovenia (4.9), The Netherlands (5.1), Portugal (5.1)
ModerateModerate: Hungary (4.0) LowLow: Ireland (3.3), Israël (2.6)
Number of call attempts
Countries with rather high noncontact rates and low number of call attempts (e.g. Ireland) might increase call attempts
No “clear-cut” relationship between number of call attempts and noncontact rates
Some countries achieve the target noncontact rate with only moderate or low efforts
Other countries rely heavily on extended extended interviewer effortsinterviewer efforts
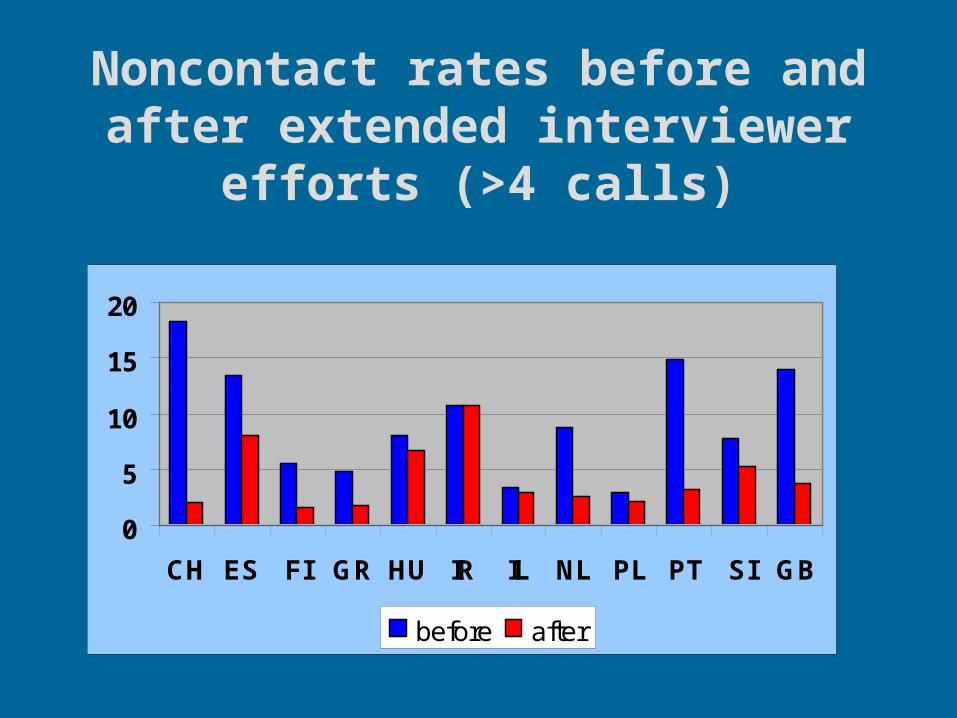
Noncontact rates before and after extended interviewer efforts (>4 calls)
0
5
10
15
20
CH ES FI GR HU IR IL NL PL PT SI GB
before after
Number of call attempts
Necessity to make many calls/visits is especially high in Great Britain, Spain, Portugal and Switzerland: Why?
Less favourable “at-home patternsat-home patterns” ?Less optimal timing of visitstiming of visits?
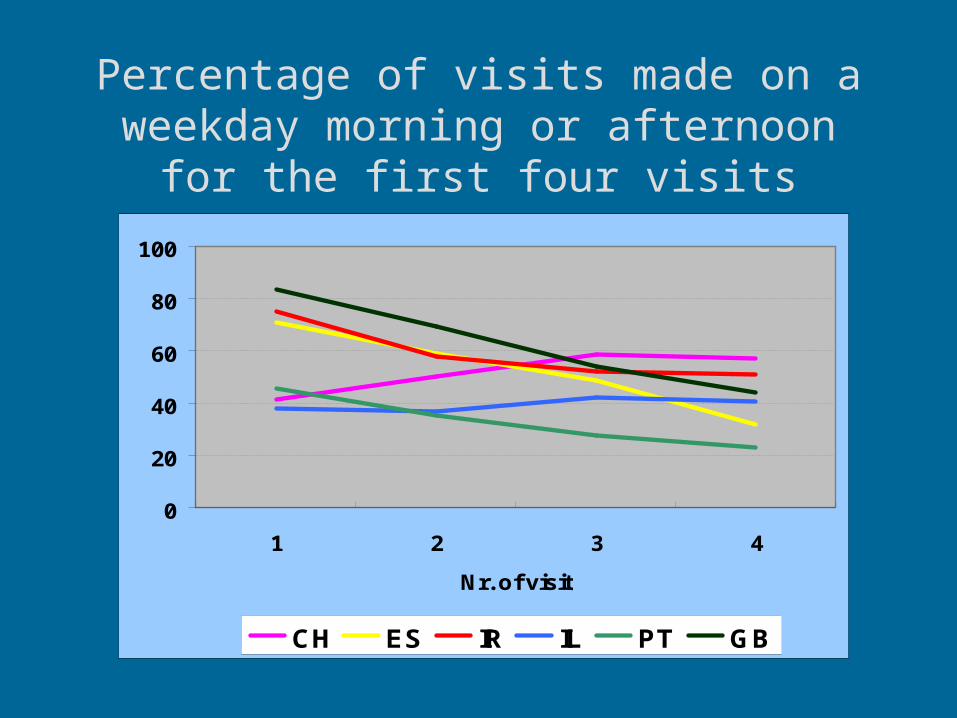
Percentage of visits made on a weekday morning or afternoon for the first four visits
0
20
40
60
80
100
1 2 3 4
Nr. of visit
CH ES IR IL PT GB
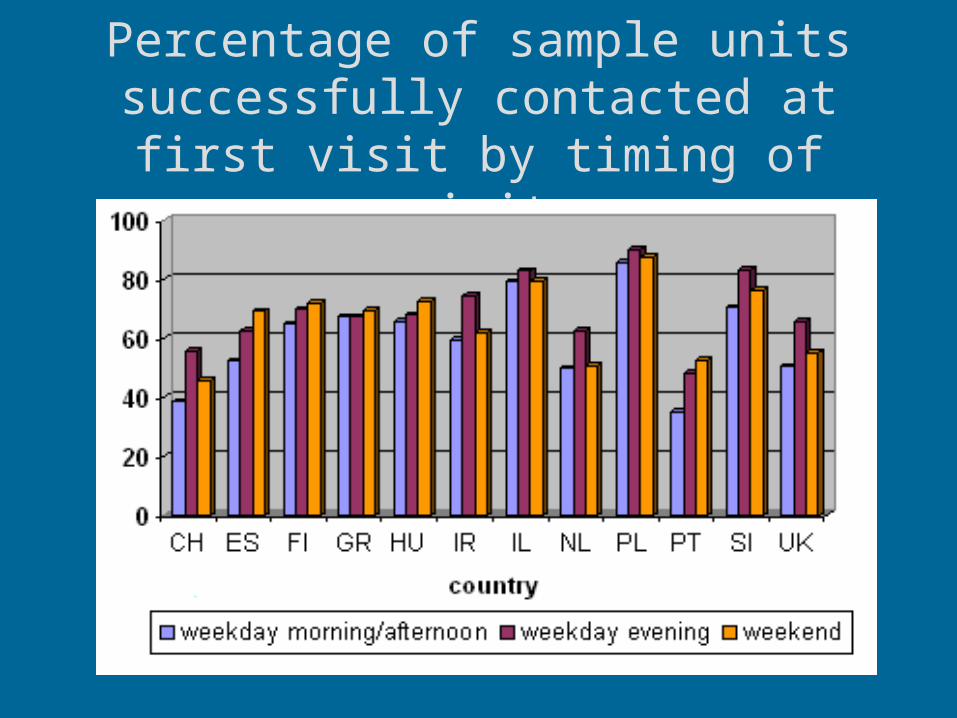
Percentage of sample units successfully contacted at first visit by timing of visit
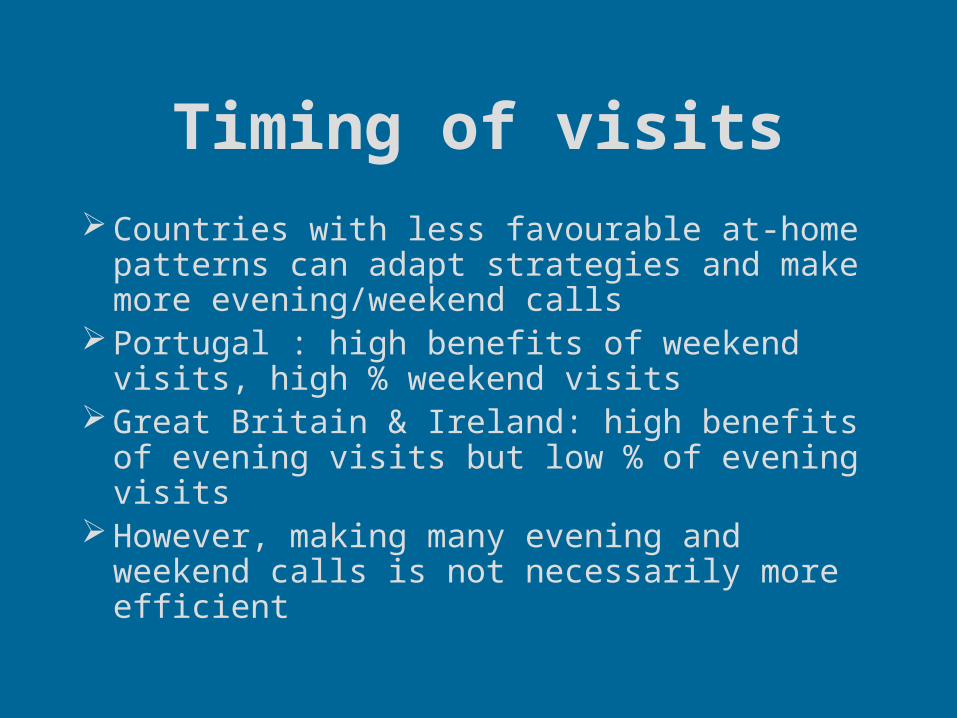
Timing of visits
Countries with less favourable at-home patterns can adapt strategies and make more evening/weekend calls
Portugal : high benefits of weekend visits, high % weekend visits
Great Britain & Ireland: high benefits of evening visits but low % of evening visits
However, making many evening and weekend calls is not necessarily more efficient
3. Increasing survey participation
Advance letterRespondent IncentivesInterviewer trainingRefusal conversionRefusal conversion
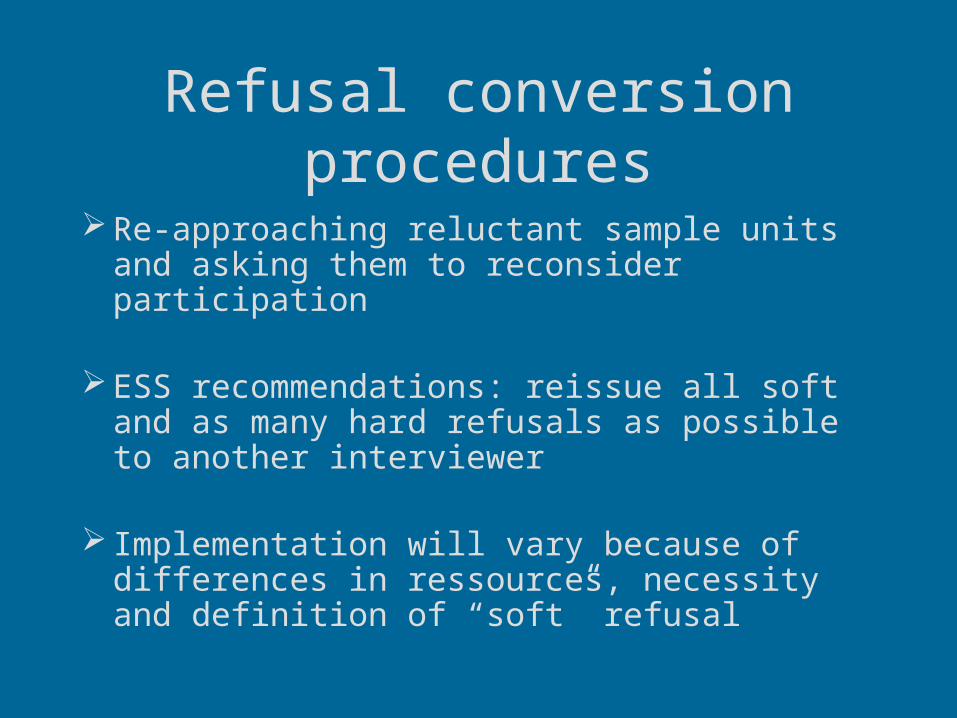
Refusal conversion procedures
Re-approaching reluctant sample units and asking them to reconsider participation
ESS recommendations: reissue all soft and as many hard refusals as possible to another interviewer
Implementation will vary because of differences in ressources, necessity and definition of “soft” refusal
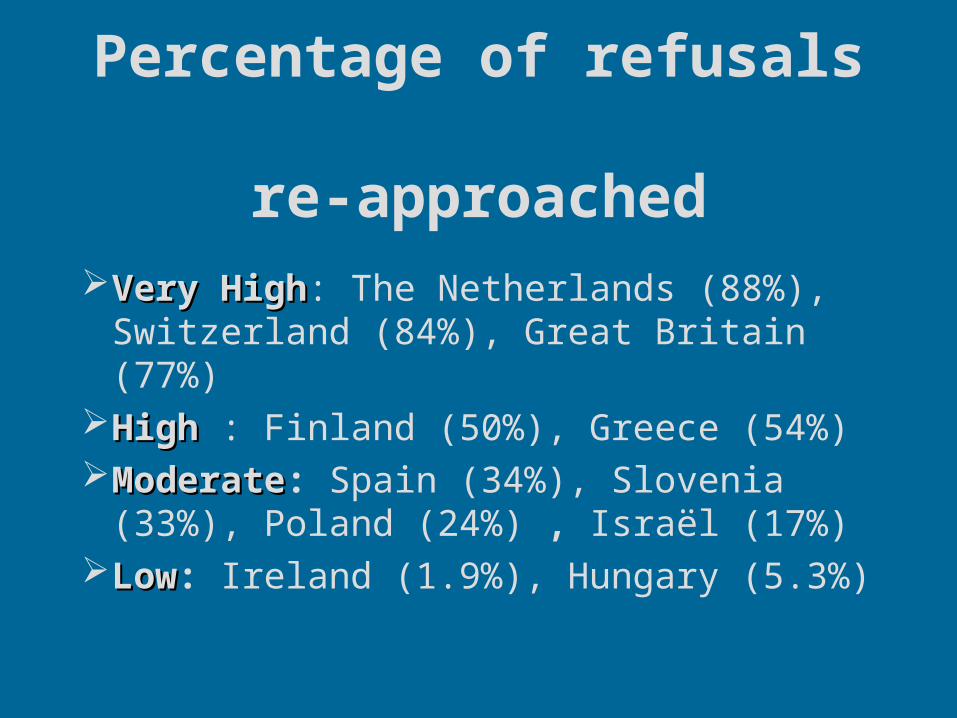
Percentage of refusals re-approached
Very HighVery High: The Netherlands (88%), Switzerland (84%), Great Britain (77%)
HighHigh : Finland (50%), Greece (54%) ModerateModerate: Spain (34%), Slovenia (33%),
Poland (24%) , Israël (17%) LowLow: Ireland (1.9%), Hungary (5.3%)
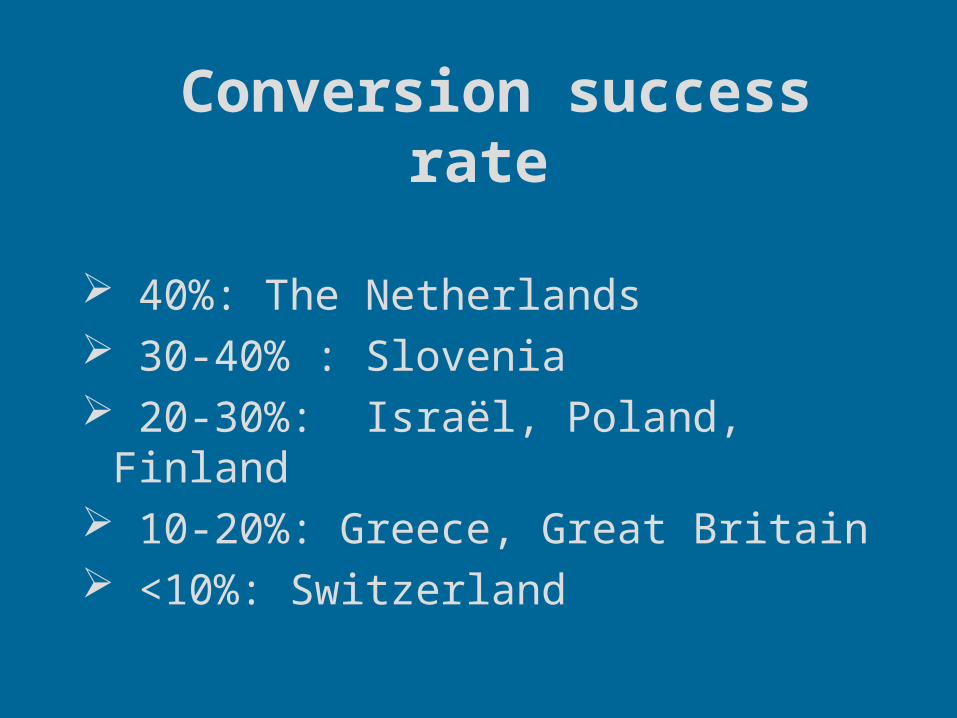
Conversion success rate
40%: The Netherlands 30-40% : Slovenia 20-30%: Israël, Poland, Finland 10-20%: Greece, Great Britain <10%: Switzerland
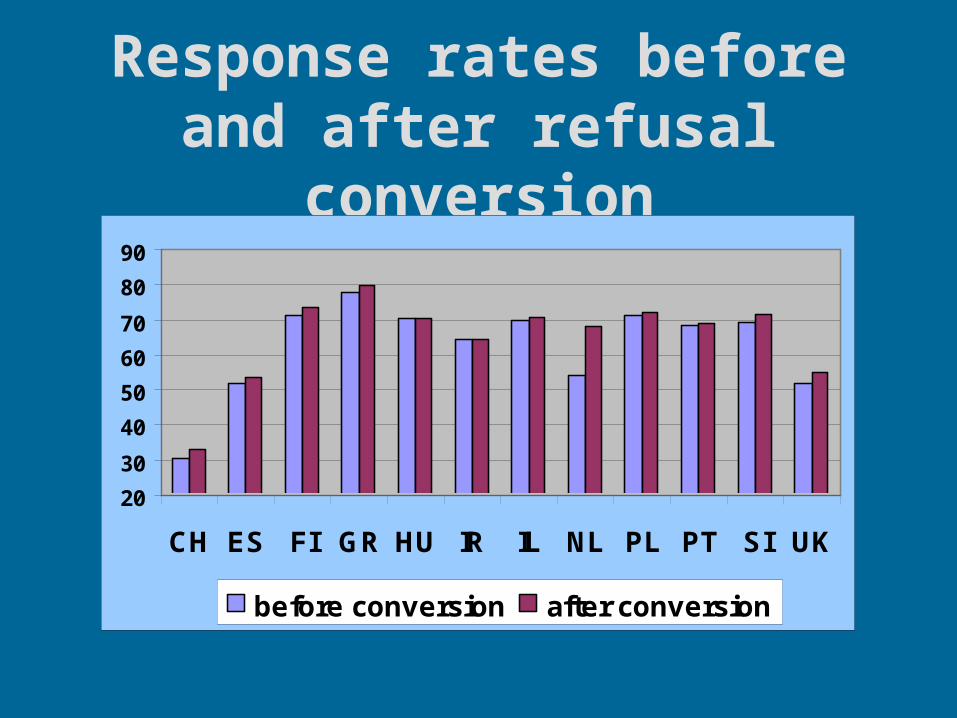
Response rates before and after refusal conversion
20
30
40
50
60
70
80
90
CH ES FI GR HU IR IL NL PL PT SI UK
before conversion after conversion

How to explain success in the Netherlands?
Second letter to reluctant sample units
Incentives increased with financial donations up to 5 Euro
Incentives supplemented with quiz
Highly motivated survey organisation and interviewers?
Does refusal conversion reduce nonresponse bias?
Evaluation of refusal conversion procedures should also take into account relationship between increasing response rates and reduction of bias (Stoop,2003)
This can be done by comparing converted refusals with cooperative respondents
The Netherlands The Netherlands represents an interesting case: what happens with survey estimates if response rates increase from 54% to 68%
Effects on survey estimates% Cooperative
respondentsConverted
refusals
Total
EDUCATION (HIGH) 24.0 19.2 23.3
INCOME (HIGH) 42.8 34.1 41.0
SEX (MALE) 55.6 57.2 55.9
AGE (+65) 18.1 21.1 18.7
SINGLE 23.0 22.3 22.9
MEMBER ORG. (NO) 15.7 20.2 16.6
FRIENDS (NO) 33.4 40.1 34.7
SOC. TRUST (LOW) 22.4 24.6 22.8
POL. INTEREST (HIGH) 69.0 58.9 66.9
IMMIGRANTS 65.7 60.9 64.7
NN 1880 484 2364
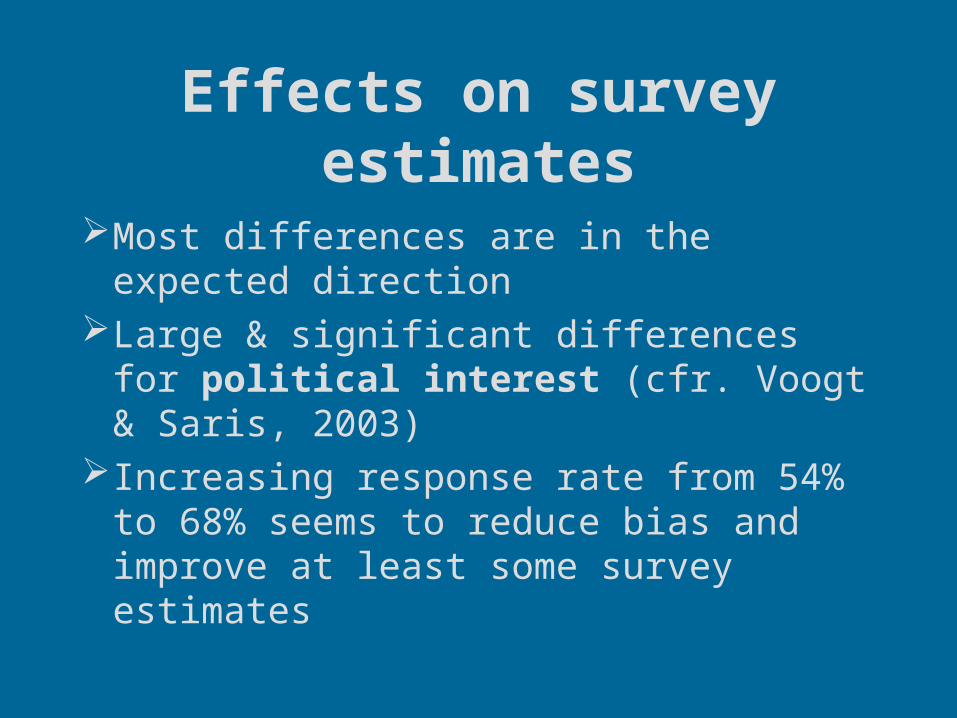
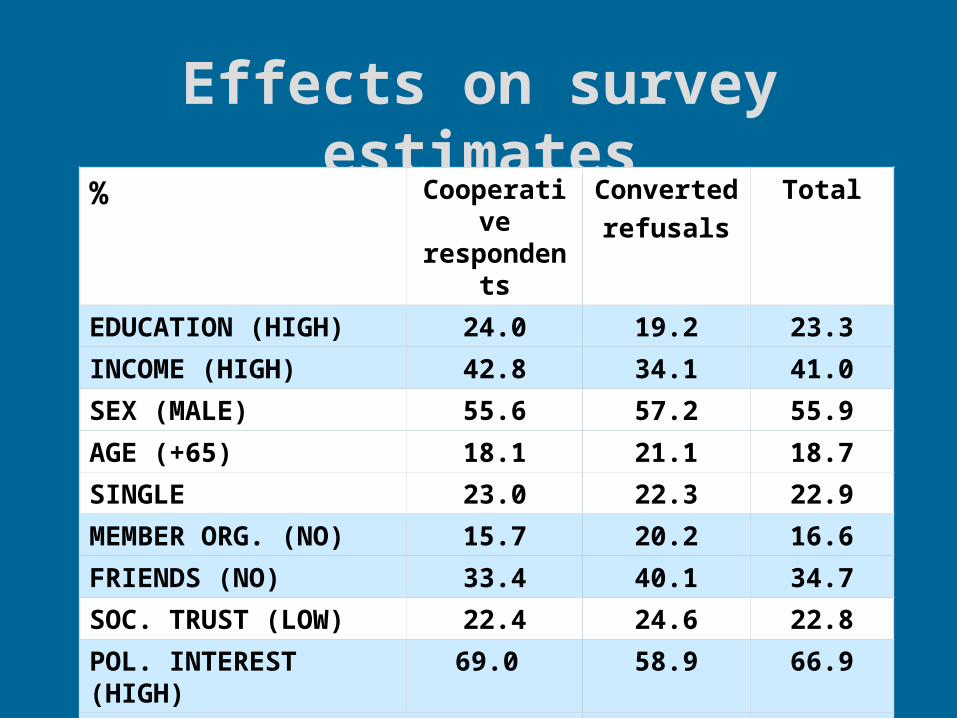
Effects on survey estimates
Most differences are in the expected direction
Large & significant differences for political interest (cfr. Voogt & Saris, 2003)
Increasing response rate from 54% to 68% seems to reduce bias and improve at least some survey estimates
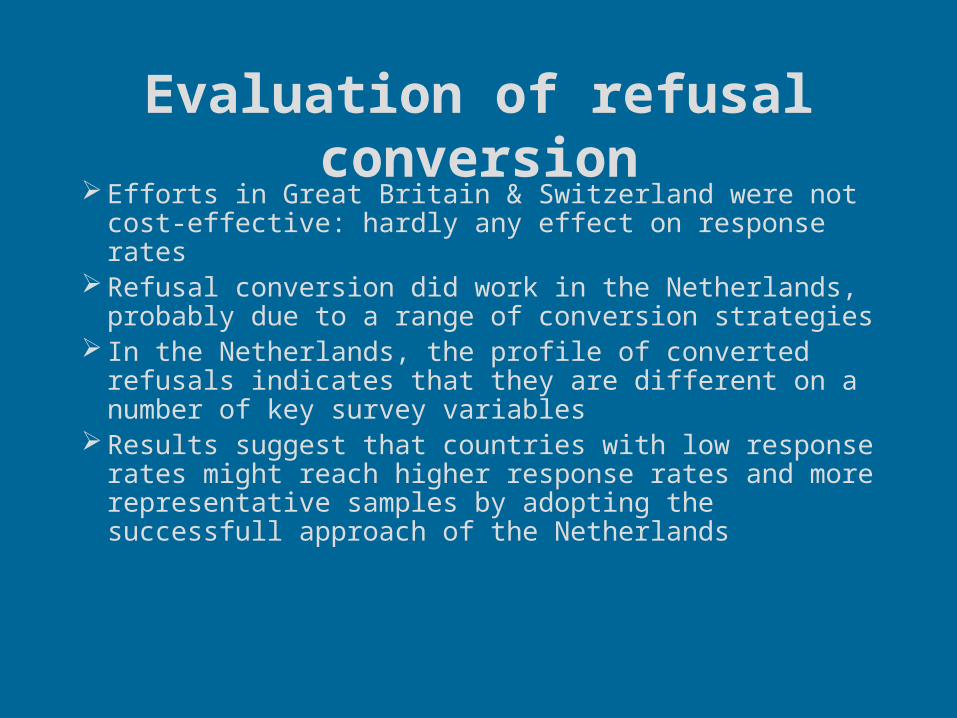
Evaluation of refusal conversion Efforts in Great Britain & Switzerland were not cost-
effective: hardly any effect on response rates Refusal conversion did work in the Netherlands,
probably due to a range of conversion strategies In the Netherlands, the profile of converted refusals
indicates that they are different on a number of key survey variables
Results suggest that countries with low response rates might reach higher response rates and more representative samples by adopting the successfull approach of the Netherlands

4. Conclusions
Call record data are a very usefull and essential tool for monitoring and evaluating fieldwork strategies
The analysis raises some interesting questions: e.g. about refusal conversion and timing of visits
Results should feed back into survey process and lead to actions to improve fieldwork procedures