Embed Size (px)
Citation preview
SANDIA REPORT SAND97-2035 UC-126 Unlimited Release Printed February 1998
r2m
Field Testing Results for the Strategic Petroleum Reserve Pipeline Corrosion Control Program
Prepared by Sandia National Laborat Albuquerque, New Mexic
I
9
L
SF29000(8-81) I
Issued by S a n h a National Laboratories, operated for the United States Department of Energy by Sandia Corporation. NOTICE: This report was prepared as an account of work sponsored by an agency of the United States Government. Neither the United States Govern- ment nor any agency thereof, nor any of their employees, nor any of their contractors, subcontractors, o r their employees, makes any warranty, express or implied, o r assumes any legal liability or responsibility for the accuracy, completeness, or usefulness of any information, apparatus. prod- uct, or process hsclosed, or represents that its use would not infringe pri- vately owned rights. Reference herein t o any specific commercial product, process, or service by trade name, trademark, manufacturer, or otherwise, does not necessanly constitute or imply its endorsement, recommendation, or favoring by the United States Government, any agency thereof, or any of their contractors or subcontractors. The views and opinions expressed herein do not necessarily state or reflect those of the United States Govern- ment, any agency thereof, or any of their contractors.
Printed in the United States of America. This report has been reproduced dwectly from the best available copy.
Available to DOE and DOE contractors from Office of Scientific and Technical Information P.O. Box62 Oak Ridge, TN 37831
Prices avadable from (615) 576-8401, FTS 626-8401
Available to the public from National Technical Information Service U.S. Department of Commerce 5285 Port Royal Rd Springfield, VA 22161
NTIS price codes Printed copy: A03 Microfiche copy: A01
DISCLAIMER
Portions of this document may be illegible electronic image products. Images are produced from the best available original document,
a
SAND97-2035 Unlimited Release
Printed February 1998 Distribution
Category UC- 126
Field Testing Results for the Strategic Petroleum Reserve Pipeline Corrosion Control Program
R. G. Buchheit, L. M. Maestas Materials Aging and Reliability Department
T. E. Hinkebein Underground Storage Technology Department
Sandia National Laboratories P.O. Box 5800
Albuquerque, NM 871 85-0340
Abstract
Results of two studies conducted as part of the Strategic Petroleum Reserve (SPR) Pipeline Corrosion Control Program are reported. These studies focused on evaluation of rotary-applied concrete materials for internal pipeline protection against the erosive and corrosive effects of flowing brine. The study also included evaluation of liners applied by hand on pipe pieces that cannot be lined by rotary methods. Such pipe pieces include tees, elbows and flanged pipe sections. Results are reported from a corrosion survey of 17 different liner formulations tested at the Big Hill SPR site. Testing consisted of electrochemical corrosion rate measurements made on lined pipe sections exposed, in a test manifold, to flowing SPR generated fluids. Testing also involved cumulative immersion exposure where samples were exposed to static site-generated brine for increasing periods of time. Samples were returned to the laboratory for various diagnostic analyses. Results of this study showed that standard calcium silicate concrete (API RP1 OE) and a rotary calcium aluminate concrete formulation were excellent performers. Hand- lined pipe pieces did not provide as much corrosion protection. The focus of the second part of the study was on further evaluation of the calcium silicate, calcium aluminate and hand-applied liners in actual SPR equipment and service. It was a further objective to assess the practicality of electrochemical impedance spectroscopy (EIS) for field corrosion monitoring of concrete lined pipe compared to the more well-known linear polarization technique. This study showed that concrete linings reduced the corrosion rate for bare steel from 10 to 15 mils per year to 1 mil per year or less. Again, the hand-applied liners did not provide as much corrosion protection as the rotary-applied liners. The EIS technique was found to be robust for field corrosion measurements. Mechanistic and kinetic corrosion rate data were reliably obtained. However, the simplicity and rapidity of linear polarization make this technique more suitable for routine corrosion monitoring.
Contents
Page
1 e
1 .O Introduction
2.0 Materials Selection Description and Preparation for Corrosion Monitoring Studies at the Big Hill SPR Site
2
2.1 Internal concrete lining by rotary application * 2
2.1.1 API IWlOE ”baseline” concrete 2.1.2 Hand trowel applicaGon of concrete liners 2.1.3 Polymer modified concretes 2.1.4 Portland cement-fly ash variants 2.1.5 Sulfate resistant Portland cement variants 2.1.6 Aluminate cements and concretes 2.1.7 Baseline concrete plus corrosion inhibitors
5 5 6 7 7 8 10
2.2 Corrosion monitoring experiments at Big Hill 1 1
2.2.1 Corrosion rate measurements 2.2.2 Big Hill corrosion monitoring results
11 12
2.3 Cumulative immersion testing 1 3
2.3.1 Overview 2.3.2 Visual inspection 2.3.3 Mechanical testing 2.3.4 Electron probe microchemical analysis (EPMA)
13 14 15 16
3.0 Corrosion Monitoring at the West Hackberry SPR Site
2 0
3.1 Corrosion monitoring by electrochemical impedance spectroscopy (EIS)
2 0
20 3.2 Probe configuration and installation
3.3 Corrosion monitoring methods and data analysis 22
3.4 Results from corrosion testing 28
4.0 Summary and Conclusions 3 0
5.0 References
Appendix A: Standard Cement Chemist’s Notation
3 2
Figures 1 Centrifugal application of an internal concrete liner at Permian
Enterprises, Odessa, TX.
2 Hand trowel application of an internal concrete liner on a spool piece for the 24" brine header at West Hackberry.
3 Cross sectional optical images of the API RPlOE liner (a) and the calcium aluminate liner (b)
4 The flow loop test manifold at Big Hill.
5 Linear polarization corrosion rate data summary.
6 Localized corrosion at the steel-concrete interface.
7 Plot of interfacial shear strength as a function of exposure time for the baseline material and the calcium aluminate liners.
8 A profile of the chloride ion concentration as a function of position through the baseline material showing typical features observed.
9 Plot of chloride penetration depth (the position of the chloride front passing through the cement paste) as a function of exposure time for the baseline and calcium aluminate materials.
10 Plot of the interfacial chloride ion concentration as a function of exposure time for the baseline and calcium aluminate materials.
1 1 Schematic illustration of the EIS probes for corrosion monitoring at West Hackberry.
12 An EIS probe installed in a pipe section ready for application of the internal liner.
13 Complex plane plot of EIS data from a probe located under a rotary calcium aluminate concrete liner indicating corrosion through a passivating layer.
14 Complex plane plot of EIS data from a probe located under a rotary API RP 1 OE concrete liner indicating that active corrosion is occurring.
15 Complex plane plot of EIS data from a probe located under a hand- trowelled calcium aluminate concrete liner indicating that diffusion-control corrosion is occurring.
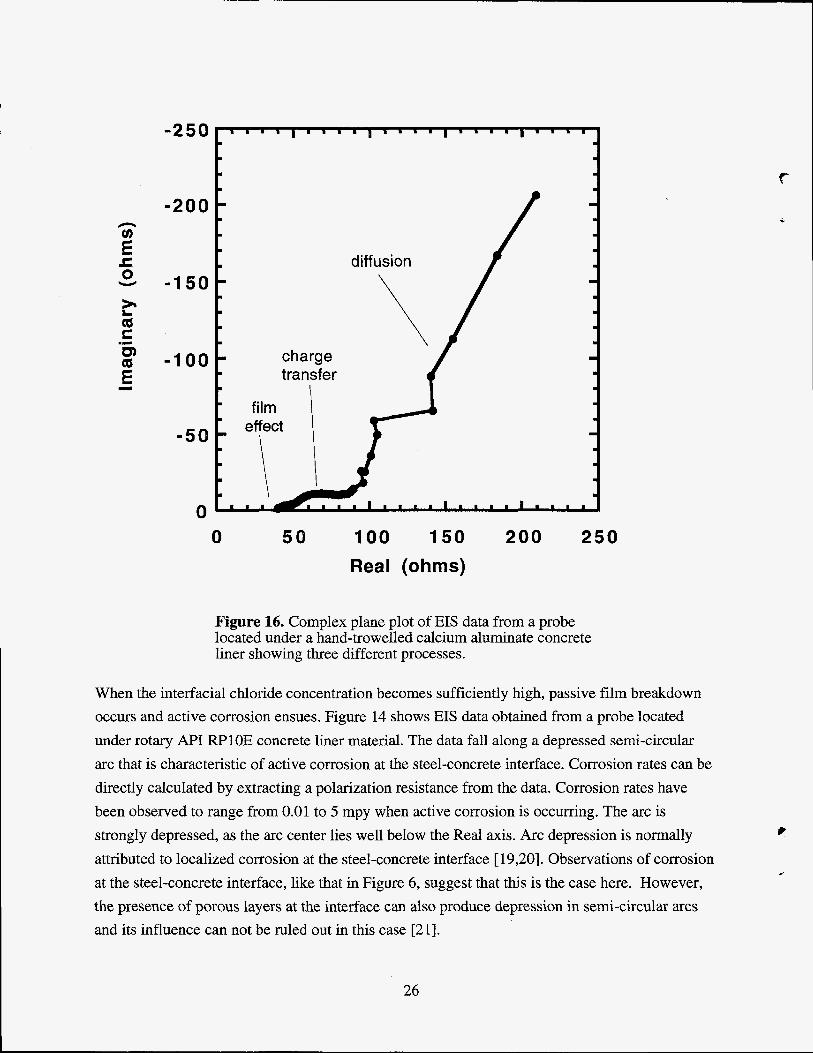
16 Complex plane plot of EIS data from a probe located under a hand- trowelled calcium aluminate concrete liner showing three different processes.
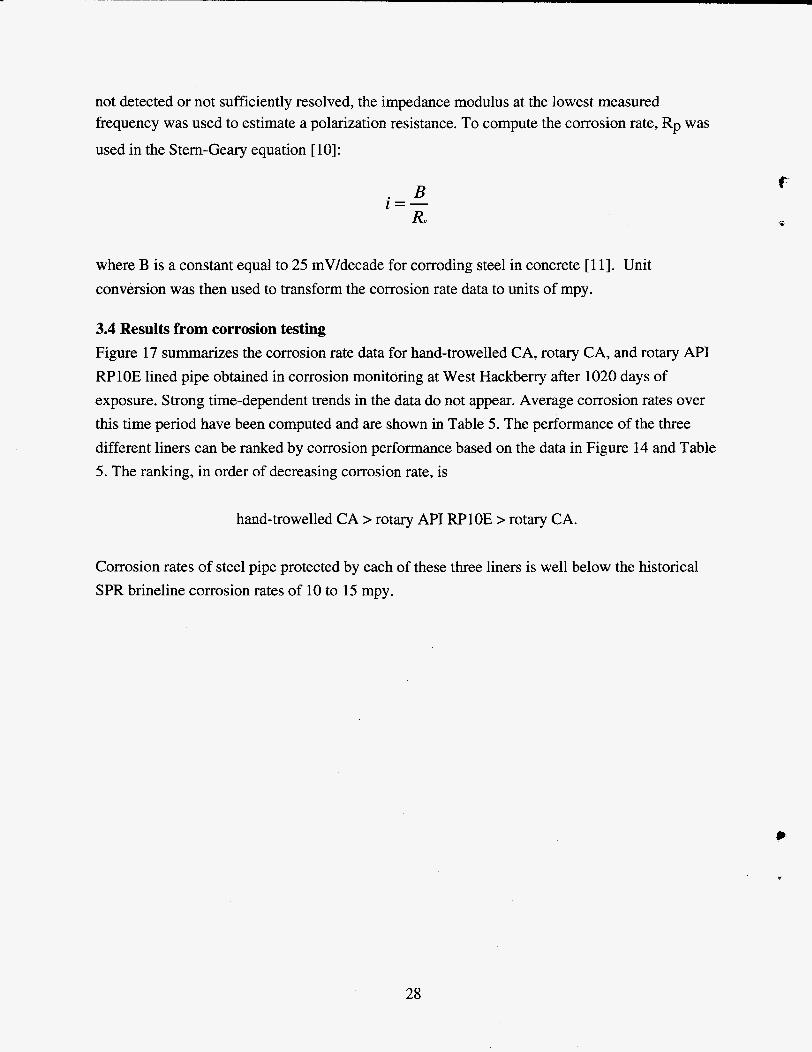
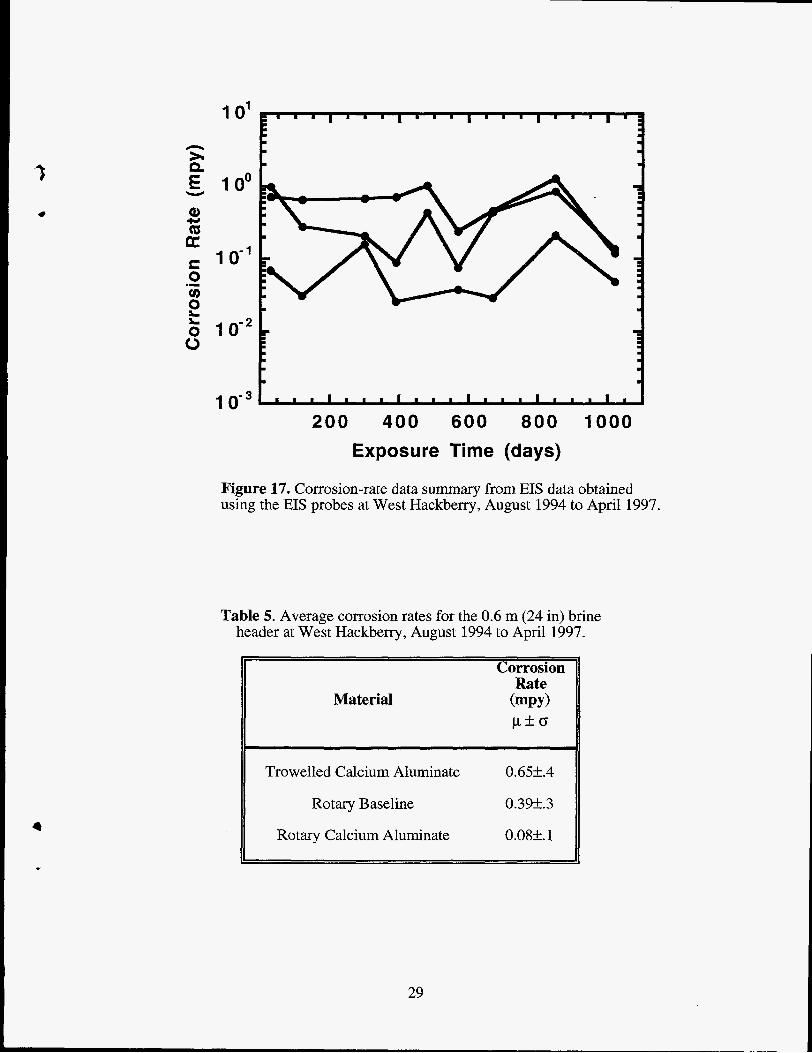
17 Corrosion rate data summary from EIS data obtained using the EIS probes at West Hackberry, August, 1994 to April, 1997.
,Page 5
6
10
12
13
15
16
17
18
19
21
21
23
24
25
26
29
.
4
.
Tables
1 Nominal concrete compositions for the concrete materials used in this study.
2 Ingredients and amounts used for the as-built concrete lined pipe sections used in this study.
3 Concrete mixes, final liner thicknesses, and densities for the latex modified concretes used in this study.
4 Nominal compositions (by weight percent) for Portland cement and calcium aluminate cements.
5 Average corrosion rates for the 0.6 m (24 in.) brine header at West Hackberry, August, 1994 to April, 1997.
Page
3
4
7
8
29
1 .O Introduction
*
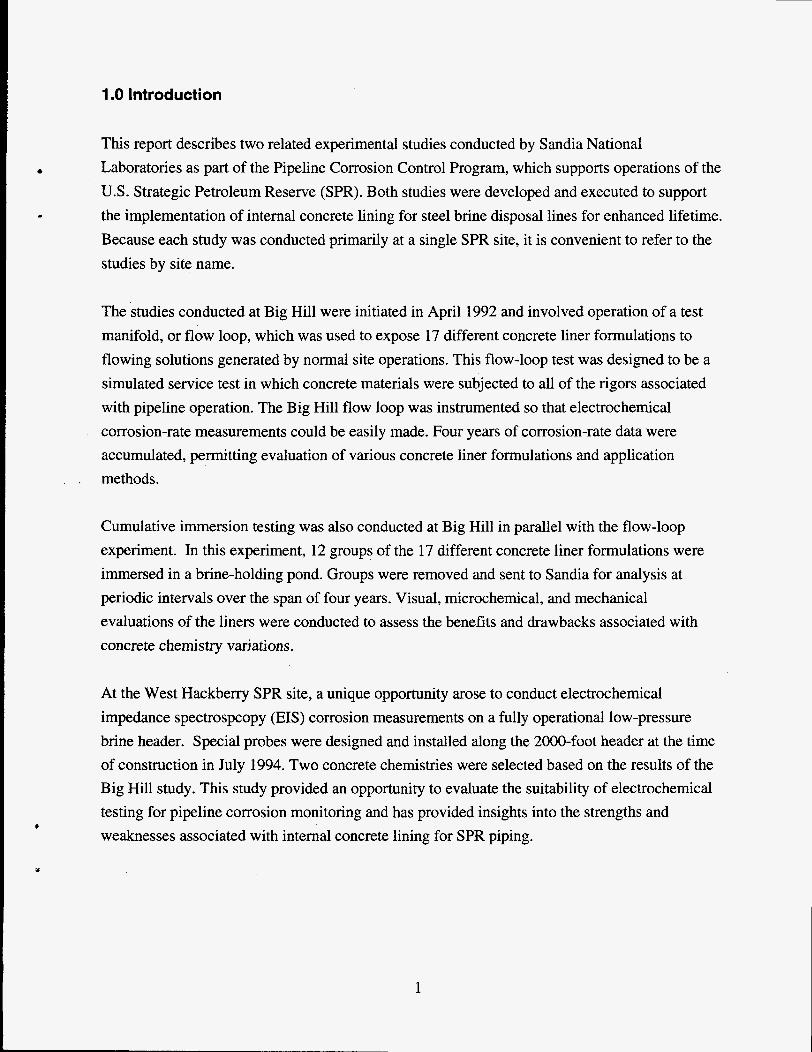
This report describes two related experimental studies conducted by Sandia National Laboratories as part of the Pipeline Corrosion Control Program, which supports operations of the U.S. Strategic Petroleum Reserve (SPR). Both studies were developed and executed to support the implementation of internal concrete lining for steel brine disposal lines for enhanced lifetime. Because each study was conducted primarily at a single SPR site, it is convenient to refer to the studies by site name.
The studies conducted at Big Hill were initiated in April 1992 and involved operation of a test manifold, or flow loop, which was used to expose 17 different concrete liner formulations to flowing solutions generated by normal site operations. This flow-loop test was designed to be a simulated service test in which concrete materials were subjected to all of the rigors associated with pipeline operation. The Big Hill flow loop was instrumented so that electrochemical corrosion-rate measurements could be easily made. Four years of corrosion-rate data were accumulated, permitting evaluation of various concrete liner formulations and application methods.
Cumulative immersion testing was also conducted at Big Hill in parallel with the flow-loop experiment. In this experiment, 12 groups of the 17 different concrete liner formulations were immersed in a brine-holding pond. Groups were removed and sent to Sandia for analysis at periodic intervals over the span of four years. Visual, microchemical, and mechanical evaluations of the liners were conducted to assess the benefits and drawbacks associated with concrete chemistry variations.
At the West Hackberry SPR site, a unique opportunity arose to conduct electrochemical impedance spectrospcopy (EIS) corrosion measurements on a fully operational low-pressure brine header. Special probes were designed and installed along the 2000-foot header at the time of construction in July 1994. Two concrete chemistries were selected based on the results of the Big Hill study. This study provided an opportunity to evaluate the suitability of electrochemical testing for pipeline corrosion monitoring and has provided insights into the strengths and weaknesses associated with internal concrete lining for SPR piping.
a
1
2.0 Materials Selection, Description and Preparation for Corrosion Monitoring Studies at the Big Hill SPR Site.
2.1 Internal concrete lining by rotary application Internal concrete linings were applied to steel pipe sections using commercially available methods and materials. Plain carbon steel pipe sections (Grade 1020) 5.8 to 6.8 m (19 to 22 ft) in length with a 76-mm (3-in) inner diameter were procured from a commercial source and prepared for lining by sandblasting the pipe interior just prior to liner application.
Fabrication was conducted at Permian Enterprises, Odessa, TX using their standard centrifugal casting production methods (Figure 1) [ 11. A variety of different concrete compositions was applied, but all were prepared in a similar manner. The ingredients for a given concrete were combined in a mixing bin then pumped through a delivery lmce into the pipe section. The pipe section was capped at one end, and the concrete was pumped through the lance as it was withdrawn. The concrete delivery rate and lance removal rate were chosen to deliver enough concrete for a uniform 12.5-mm-thick (0.5-in) liner in each pipe joint. After charging the pipe section with concrete, the remaining end of the pipe was capped and the section was loaded onto rollers for the spin-casting operation. Pipe sections were spun at speeds ranging from 12.7 m/s (2500 ft/rnin) to 14.2 m / s (2800 ft/min) for 1.5 to 4 minutes, generating forces in excess of 20 g. After spinning, individual pipe sections were removed from the rollers, the ends were uncapped and excess water and fluid additives were drained from the pipes. The ends of each pipe joint were finished smooth and flush by hand with a high-sulfate-resistance cement mortar. Pipe section ends were then recapped and kiln cured at 1500F for approximately 18 hours, except for one calcium aluminate concrete pipe section, which was cured at ambient temperatures 15k5"C (6W 1 OOF).
The nominal compositions of the concrete materials used in this study are given in Table 1, and the as-built compositions are listed in Table 2. Brief descriptions of the materials used, and the rationale for their selection are provided below.
2
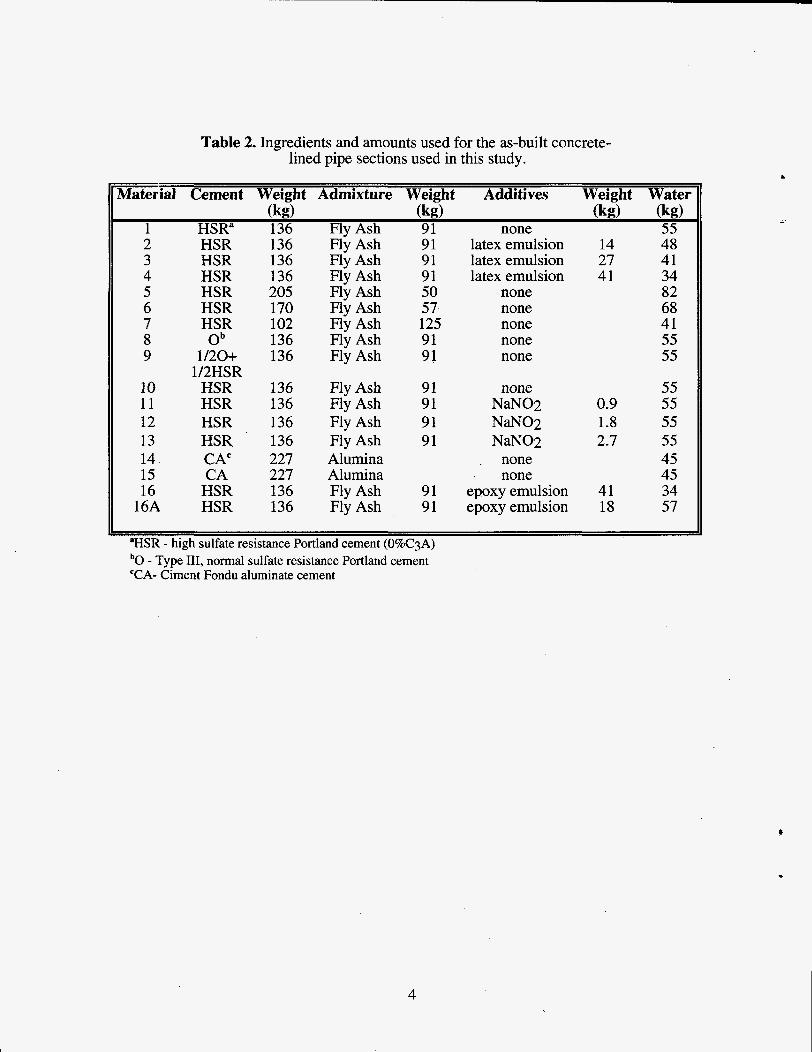
Table 1. Nominal concrete compositions for the concrete materials used in this study.
11 Identification Nominal composition
1 aAPI class C high sulfate resistance Portland cement + 40 w/o class F fly ash (Baseline)
2 bBaseline + 4.9w/o latex 3 Baseline + 10.5w/o latex 4 Baseline + 15 w/o latex 5 90% class C Portland cement + 10% fly ash 6 75% class C Portland cement + 25% fly ash 7 45% class C Portland cement + 55% fly ash 8 low sulfate resistance Portland cement + 40% fly ash 9 medium sulfate resistance Portland cement + 40% fly ash 10 Baseline, hand-trowel application 11 Baseline + 0.67% sodium nitrite 12 Baseline + 1.33% sodium nitrite 13 Baseline + 2.00% sodium nitrite 14 CAluminate concrete, kiln cured 15 Aluminate concrete, air cured 16 dBaseline + 23% epoxy
16A Baseline + 10% epoxy aall Portland cements are API Class C and all fly ash is silica fume ASTM Class F blatex additions were a styrene-butadiene co-polymer emulsion Caluminate concretes were Ciment Fondu modified with sized graded alumina aggregate depoxy additions were Rhone-Poulenc two part epoxies curable in the presence of water
3
2 3 4 5 6 7 8 9
10 11 12 13 14 15 16
16A,
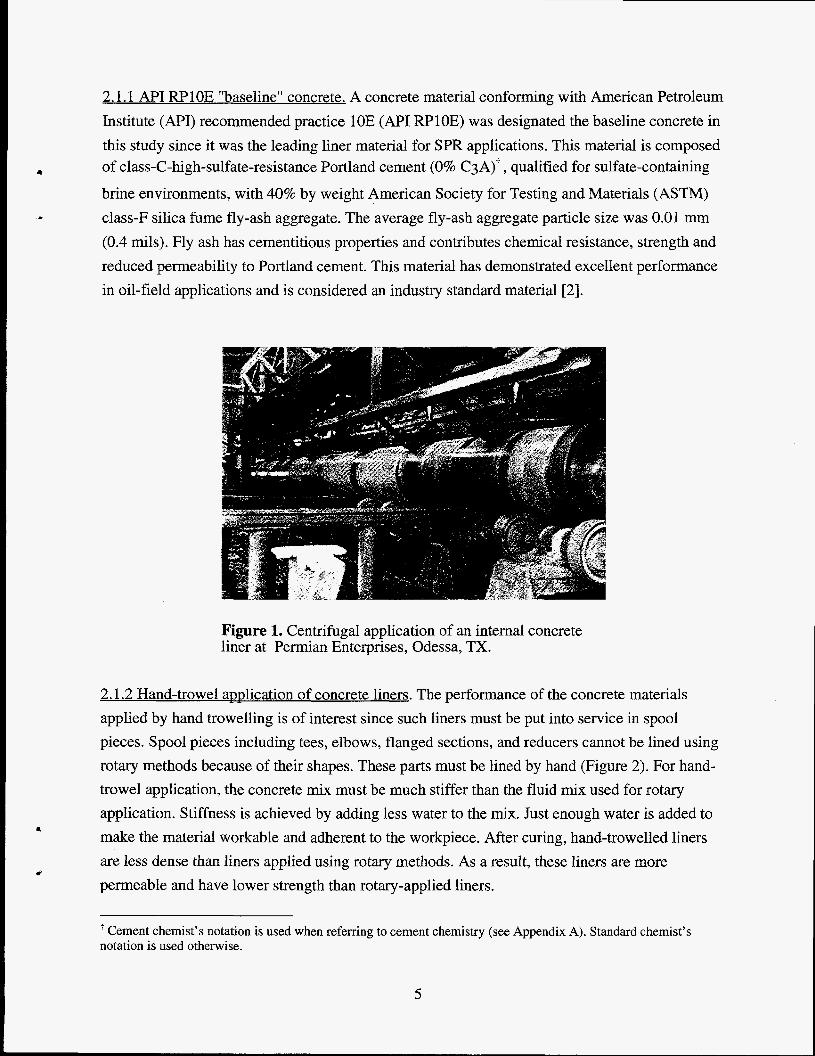
Table 2. Ingredients and amounts used for the as-built concrete- lined pipe sections used in this study.
HSR HSR HSR HSR HSR HSR Ob
1 /20+ 1/2HSR
HSR HSR HSR HSR CA' CA
HSR HSR
136 136 136 205 170 102 136 136
136 136 136 136 227 227 136 136
FG Ash Fly Ash Fly Ash Fly Ash Fly Ash Fly Ash Fly Ash Fly Ash
Fly Ash Fly Ash Fly Ash Fly Ash Alumina Alumina Fly Ash Fly Ash
Material Cement Weight Admixture Weight Additives Weight Water (kg) (kg) (kg) (kg)
1 HSR" 136 Flv Ash 91 none 55
'HSR. - high sulfate resistance Portland cement (O%C3A)
'CA- Ciment Fondu aluminate cement - 'Type 111, normal sulfate resistance Portland cement
91 91 91 50 57 125 91 91
latex emulsion latex emulsion latex emulsion
none none none none none
14 48 27 41 41 34
82 68 41 55 55
91 91 91 91
91 91
none NaN02 NaN02 NaN02
. none none
epoxy emulsion epoxy emulsion
0.9 1.8 2.7
41 18
55 55 55 55 45 45 34 57
b
4
2.1.1 API RPlOE "baseline" concrete. A concrete material conforming with American Petroleum Institute (API) recommended practice 10E (API RPlOE) was designated the baseline concrete in this study since it was the leading liner material for SPR applications. This material is composed
a of class-C-high-sulfate-resistance Portland cement (0% C3A)' , qualified for sulfate-containing brine environments, with 40% by weight American Society for Testing and Materials (ASTM)
(0.4 mils). Fly ash has cementitious properties and contributes chemical resistance, strength and reduced permeability to Portland cement. This material has demonstrated excellent performance in oil-field applications and is considered an industry standard material [2].
* class-F silica fume fly-ash aggregate. The average fly-ash aggregate particle size was 0.01 mm
Figure 1. Centrifugal application of an internal concrete liner at Permian Enterprises, Odessa, TX.
2.1.2 Hand-trowel application of concrete liners. The performance of the concrete materials applied by hand trowelling is of interest since such liners must be put into service in spool pieces. Spool pieces including tees, elbows, flanged sections, and reducers cannot be lined using rotary methods because of their shapes. These parts must be lined by hand (Figure 2). For hand- trowel application, the concrete mix must be much stiffer than the fluid mix used for rotary application. Stiffness is achieved by adding less water to the mix. Just enough water is added to make the material workable and adherent to the workpiece. After curing, hand-trowelled liners are less dense than liners applied using rotary methods. As a result, these liners are more permeable and have lower strength than rotary-applied liners.
I
P
' Cement chemist's notation is used when refemng to cement chemistry (see Appendix A). Standard chemist's notation is used otherwise.
5
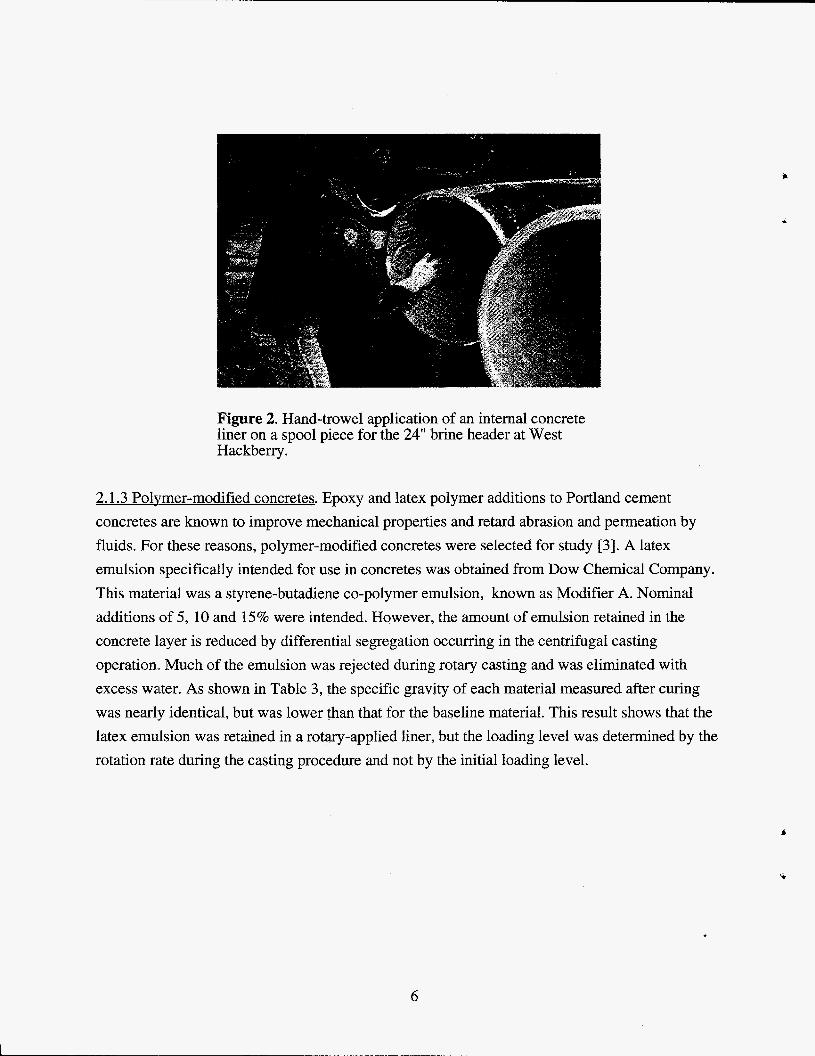
Figure 2. Hand-trowel application of an internal concrete liner on a spool piece for the 24" brine header at West Hackberry.
2.1.3 Polvmer-modified concretes. Epoxy and latex polymer additions to Portland cement concretes are known to improve mechanical properties and retard abrasion and permeation by fluids. For these reasons, polymer-modified concretes were selected for study [3]. A latex emulsion specifically intended for use in concretes was obtained from Dow Chemical Company. This material was a styrene-butadiene co-polymer emulsion, known as Modifier A. Nominal additions of 5, 10 and 15% were intended. However, the amount of emulsion retained in the concrete layer is reduced by differential segregation occurring in the centrifugal casting operation.. Much of the emulsion was rejected during rotary casting and was eliminated with excess waiter. As shown in Table 3, the specific gravity of each material measured after curing was nearly identical, but was lower than that for the baseline material. This result shows that the latex emulsion was retained in a rotary-applied liner, but the loading level was determined by the rotation rate during the casting procedure and not by the initial loading level.
b
c
6
L
I
I
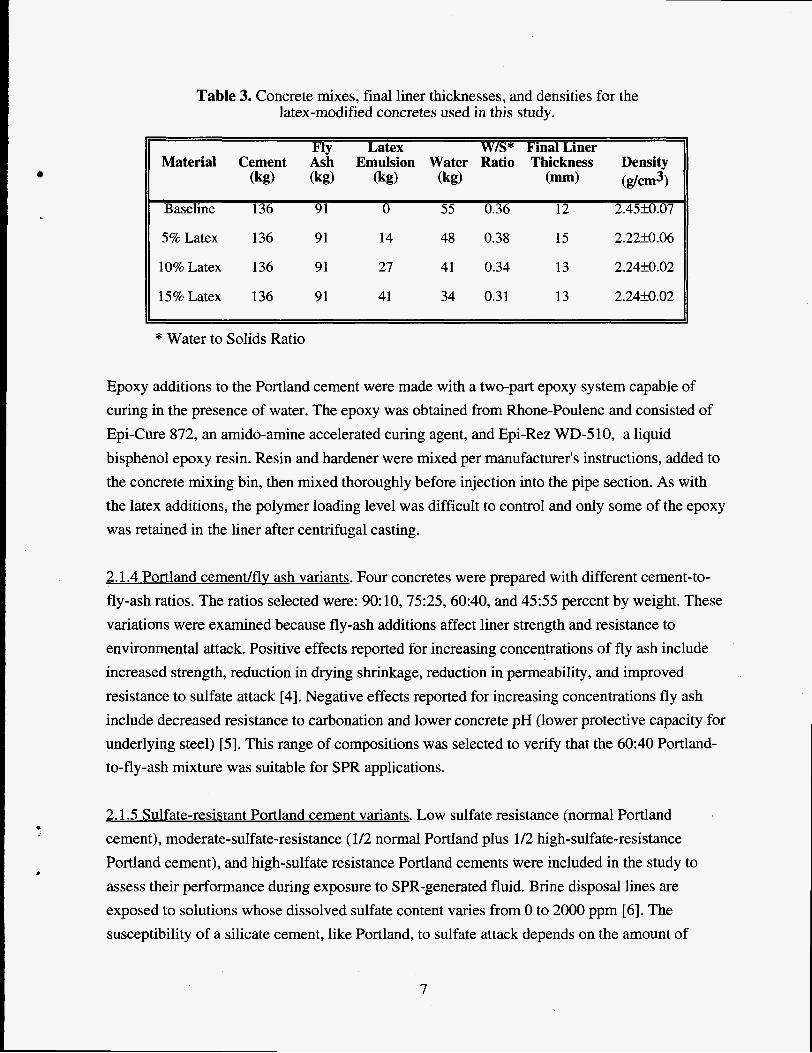
Table 3. Concrete mixes, final liner thicknesses, and densities for the latex-modified concretes used in this study.
Fly Latex W/S* Final Liner Material Cement Ash Emulsion Water Ratio Thickness Density
36 Baseline 136 91 55 0. 12 2.45M.07
(kg) (kg) (kg) (kg) (mm) (g/cm3)
5% Latex 136 91 14 48 0.38 15 2.22M.06
10% Latex 136 91 27 41 0.34 13 2.24M.02
15%Latex 136 91 41 34 0.31 13 2.24M.02
* Water to Solids Ratio
Epoxy additions to the Portland cement were made with a two-part epoxy system capable of curing in the presence of water. The epoxy was obtained from Rhone-Poulenc and consisted of Epi-Cure 872, an amido-amine accelerated curing agent, and Epi-Rez WD-5 10, a liquid bisphenol epoxy resin. Resin and hardener were mixed per manufacturer's instructions, added to the concrete mixing bin, then mixed thoroughly before injection into the pipe section. As with the latex additions, the polymer loading level was difficult to control and only some of the epoxy was retained in the liner after centrifugal casting.
2.1.4 Portland cemenvflv ash variants. Four concretes were prepared with different cement-to- fly-ash ratios. The ratios selected were: 90: 10,75:25,60:40, and 4555 percent by weight. These variations were examined because fly-ash additions affect liner strength and resistance to environmental attack. Positive effects reported for increasing concentrations of fly ash include increased strength, reduction in drying shrinkage, reduction in permeability, and improved resistance to sulfate attack [4]. Negative effects reported for increasing concentrations fly ash include decreased resistance to carbonation and lower concrete pH (lower protective capacity for underlying steel) [5 ] . This range of compositions was selected to verify that the 60:40 Portland- to-fly-ash mixture was suitable for SPR applications.
2.1.5 Sulfate-resistant Portland cement variants. Low sulfate resistance (normal Portland cement), moderate-sulfate-resistance (1/2 normal Portland plus 1/2 high-sulfate-resistance Portland cement), and high-sulfate resistance Portland cements were included in the study to assess their performance during exposure to SPR-generated fluid. Brine disposal lines are exposed to solutions whose dissolved sulfate content varies from 0 to 2000 ppm [6] . The susceptibility of a silicate cement, like Portland, to sulfate attack depends on the amount of
a
7
tricalcium aluminate, C3A, in the dry cement. Soluble sulfates react with C3A in hydrated
cement leading to reactions whose products form with a volume expansion. This results in softening and spalling of the concrete. According to American Concrete Institute (ACI) definitions, SPR fluids typically fall in the moderate to severe range for sulfate attack. ACI recommends the use of high-sulfate-resistance Portland cements (ASTM Type V, or API class C) for service where sulfate concentrations are in excess of 1500 ppm.
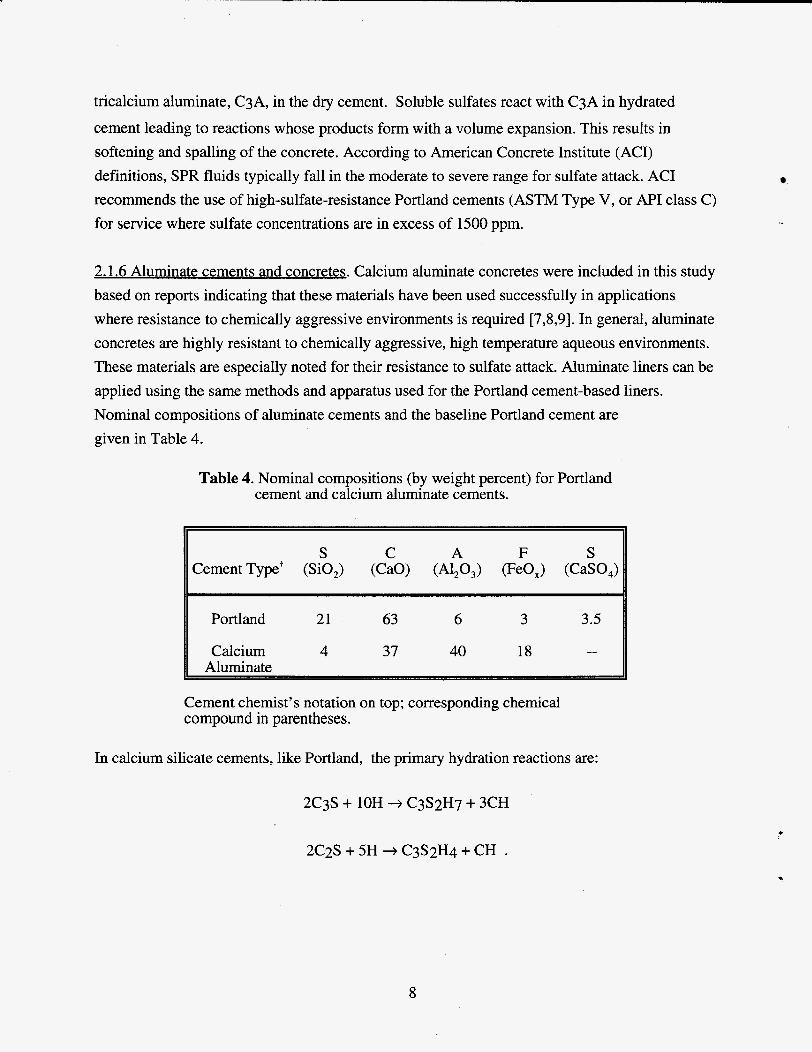
2.1.6 Aluminate cements and concretes. Calcium aluminate concretes were included in this study based on reports indicating that these materials have been used successfully in applications where resistance to chemically aggressive environments is required [7,8,9]. In general, aluminate concretes are highly resistant to chemically aggressive, high temperature aqueous environments. These materials are especially noted for their resistance to sulfate attack. Aluminate liners can be applied using the same methods and apparatus used for the Portland cement-based liners. Nominal compositions of aluminate cements and the baseline Portland cement are given in Table 4.
Table 4. Nominal compositions (by weight percent) for Portland cement and calcium aluminate cements.
S Cement Typet (SiO,)
Portland 21 63 6 3 3.5
Calcium 4 37 40 18 --
Cement chemist’s notation on top; corresponding chemical compound in parentheses.
In calciuni silicate cements, like Portland, the primary hydration reactions are:
2C3S + 10H + C3S2H7 + 3CH
2C2S + 5H + C3S2H4 + CH .
8
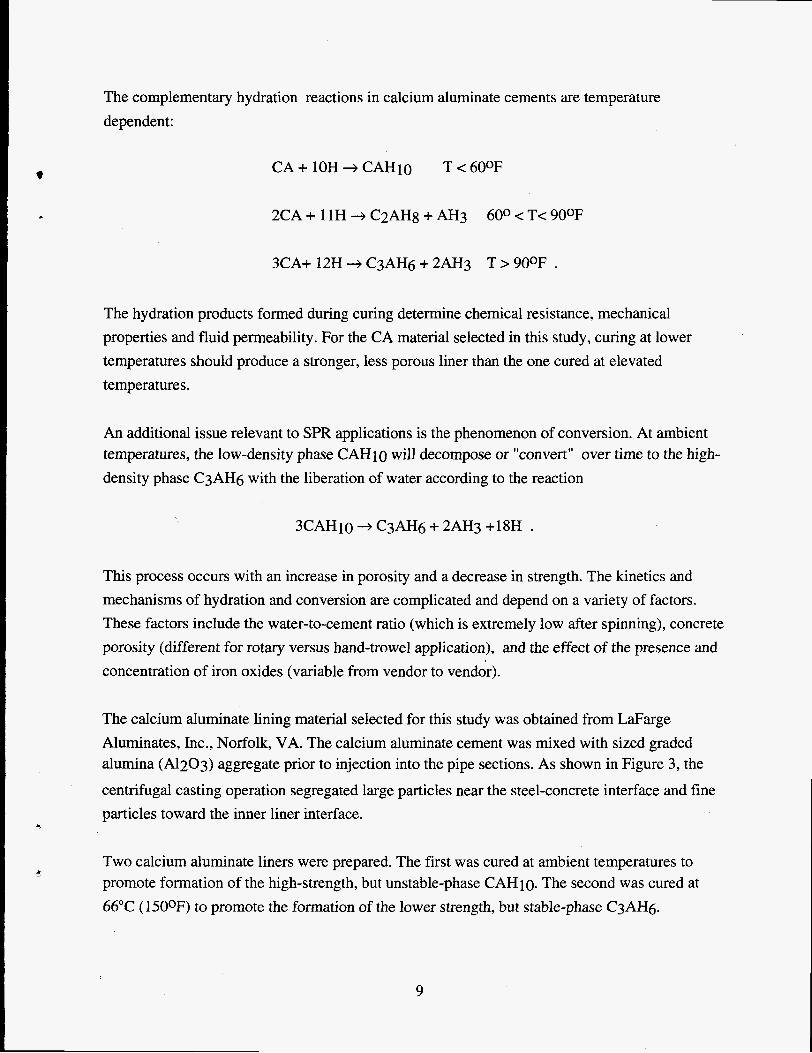
The complementary hydration reactions in calcium aluminate cements are temperature dependent:
CA + 10H + CAHlO T < 600F 9
* 2CA + 11H + C2AH8 + AH3 600 e T< 900F
3CA+ 12H + C3AH6 + 2AH3 T > 9OOF .
The hydration products formed during curing determine chemical resistance, mechanical properties and fluid permeability. For the CA material selected in this study, curing at lower temperatures should produce a stronger, less porous liner than the one cured at elevated temperatures.
An additional issue relevant to SPR applications is the phenomenon of conversion. At ambient temperatures, the low-density phase CAHlO will decompose or "convert" over time to the high- density phase C3AH6 with the liberation of water according to the reaction
This process occurs with an increase in porosity and a decrease in strength. The kinetics and mechanisms of hydration and conversion are complicated and depend on a variety of factors. These factors include the water-to-cement ratio (which is extremely low after spinning), concrete porosity (different for rotary versus hand-trowel application), and the effect of the presence and concentration of iron oxides (variable from vendor to vendor).
The calcium aluminate lining material selected for this study was obtained from LaFarge Aluminates, Inc., Norfolk, VA. The calcium aluminate cement was mixed with sized graded alumina (Al2O3) aggregate prior to injection into the pipe sections. As shown in Figure 3, the centrifugal casting operation segregated large particles near the steel-concrete interface and fine particles toward the inner liner interface.
c
Two calcium aluminate liners were prepared. The first was cured at ambient temperatures to promote formation of the high-strength, but unstable-phase CAH 10. The second was cured at 66°C (1500F) to promote the formation of the lower strength, but stable-phase C3AH6.
r. -
9
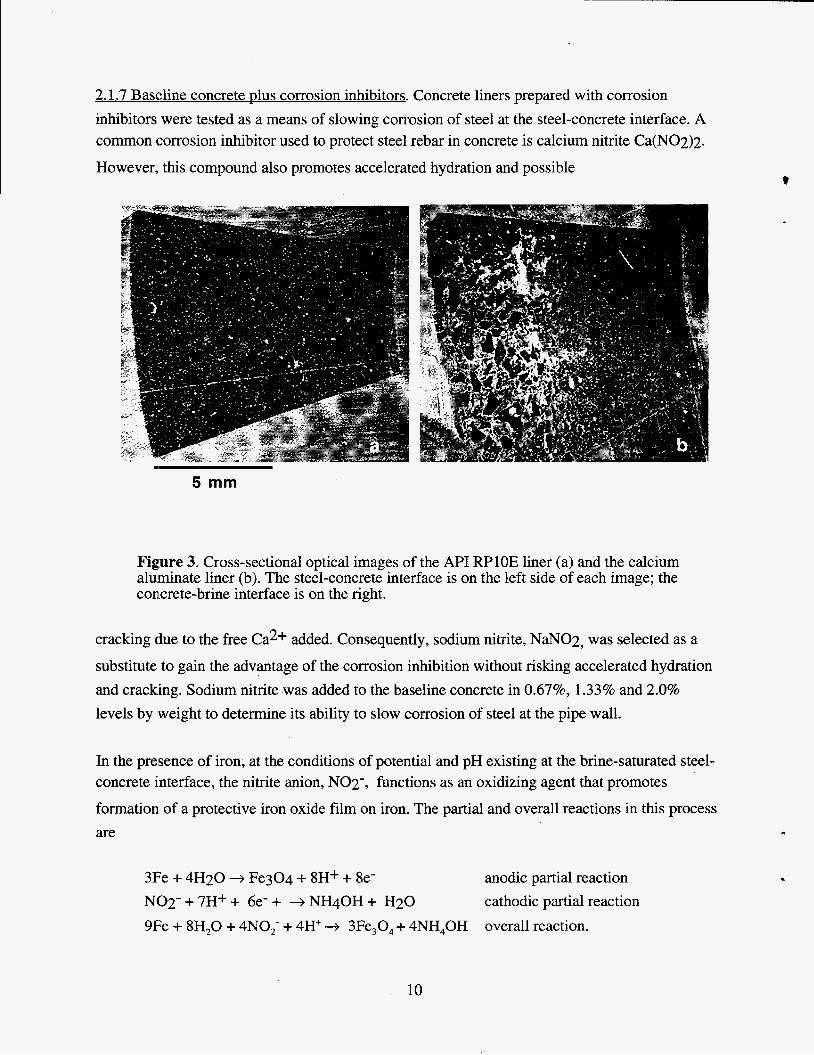
2.1.7 Baseline concrete Dlus corrosion inhibitors. Concrete liners prepared with corrosion inhibitors were tested as a means of slowing corrosion of steel at the steel-concrete interface. A common corrosion inhibitor used to protect steel rebar in concrete is calcium nitrite Ca(N02)2.
However, this compound also promotes accelerated hydration and possible
5 mm
Figvre 3. Cross-sectional optical images of the API RPlOE liner (a) and the calcium aluminate liner (b). The steel-concrete interface is on the left side of each image; the concrete-brine interface is on the right.
cracking due to the free Ca2+ added. Consequently, sodium nitrite, NaN02, was selected as a
substitute to gain the advantage of the corrosion inhibition without risking accelerated hydration and cracking. Sodium nitrite was added to the baseline concrete in 0.67%, 1.33% and 2.0% levels by weight to determine its ability to slow corrosion of steel at the pipe wall.
In the presence of iron, at the conditions of potential and pH existing at the brine-saturated steel- concrete interface, the nitrite anion, N02-, functions as an oxidizing agent that promotes
formation of a protective iron oxide film on iron. The partial and overall reactions in this process are
3E;e + 4H20 + Fe304 + 8H+ + 8e- N102- + 7H+ + 6e- + + NmOH + H20 9E:e + 8H20 + 4N0,- + 4H' + 3Fe,04 + 4NH40H
anodic partial reaction cathodic partial reaction overall reaction.
10
2.2 Corrosion monitoring experiments at Big Hill 2.2.1 Corrosion-rate measurements. The flow loop was operated from May 1992 to September 1996 to test concrete liners described in Section 2.1 under simulated service conditions using fluids (brackish water to saturated brine) generated from site operations. The intent was not to
salinity, oxygen content and temperature over ranges typical for normal site-disposal lines. Corrosion rates were measured using linear polarization (LP) probes whose sensing surface was situated at the pipe inner diameter (ID) prior to application of the liner. These probes provided a quantitative measure of corrosion rate at a fixed location along a pipe section. Due to space limitations in the flow loop, certain samples fitted with linear polarization probes were immersed in the brine pond under non-flowing (stagnant) conditions.
i d
, create idealized exposure conditions, but to perform exposure tests with solutions that varied in
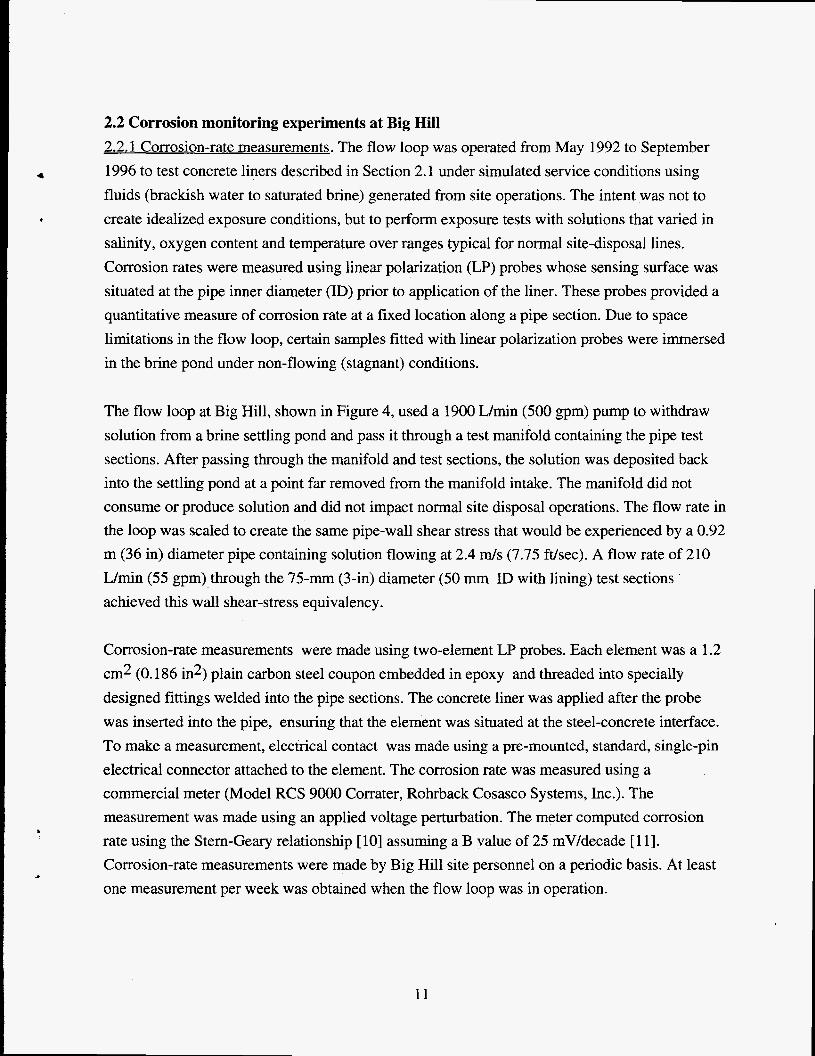
The flow loop at Big Hill, shown in Figure 4, used a 1900 Wmin (500 gpm) pump to withdraw solution from a brine settling pond and pass it through a test manifold containing the pipe test sections. After passing through the manifold and test sections, the solution was deposited back into the settling pond at a point far removed from the manifold intake. The manifold did not consume or produce solution and did not impact normal site disposal operations. The flow rate in the loop was scaled to create the same pipe-wall shear stress that would be experienced by a 0.92 m (36 in) diameter pipe containing solution flowing at 2.4 m/s (7.75 ft/sec). A flow rate of 210 Wmin (55 gpm) through the 75-mm (3-in) diameter (50 mm ID with lining) test sections achieved this wall shear-stress equivalency.
Corrosion-rate measurements were made using two-element LP probes. Each element was a 1.2 cm2 (0.186 in2) plain carbon steel coupon embedded in epoxy and threaded into specially designed fittings welded into the pipe sections. The concrete liner was applied after the probe was inserted into the pipe, ensuring that the element was situated at the steel-concrete interface. To make a measurement, electrical contact was made using a pre-mounted, standard, single-pin electrical connector attached to the element. The corrosion rate was measured using a commercial meter (Model RCS 9000 Corrater, Rohrback Cosasco Systems, Inc.). The measurement was made using an applied voltage perturbation. The meter computed corrosion rate using the Stern-Geary relationship [ 101 assuming a B value of 25 mV/decade [ 1 11. Corrosion-rate measurements were made by Big Hill site personnel on a periodic basis. At least one measurement per week was obtained when the flow loop was in operation.
11
&
Figure 4. The flow-loop test manifold at Big Hill.
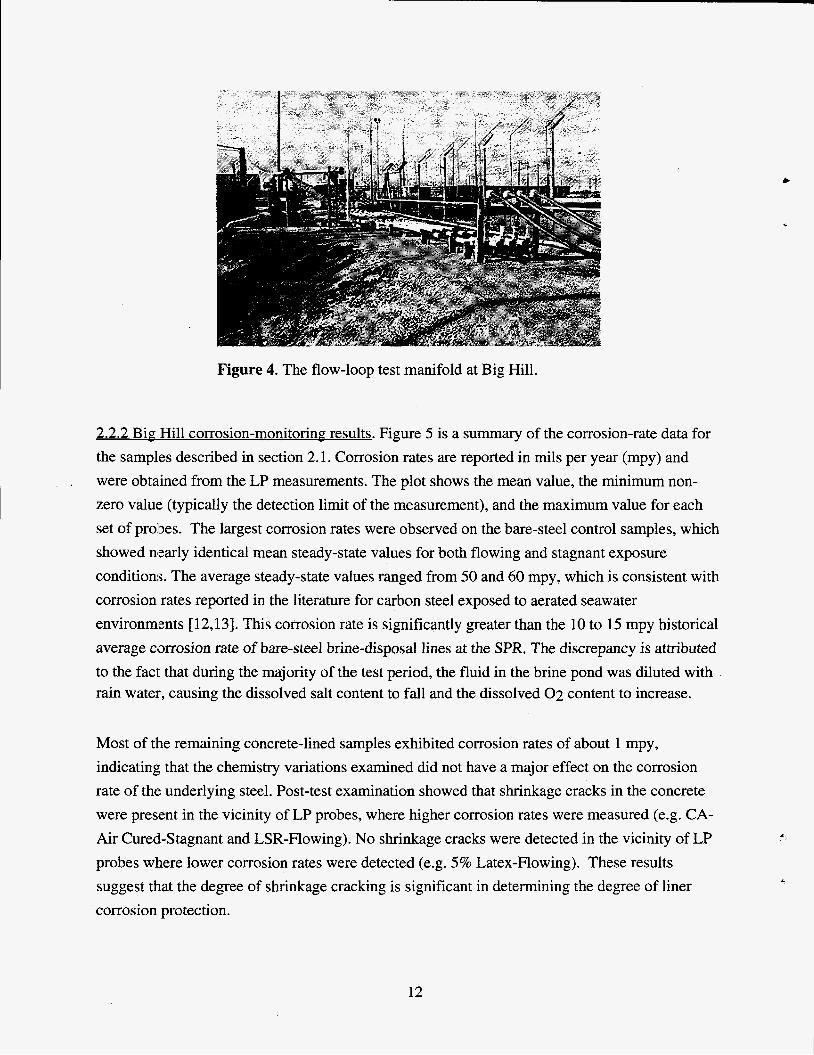
2.2.2 Big Hill corrosion-monitoring results. Figure 5 is a summary of the corrosion-rate data for the samples described in section 2.1. Corrosion rates are reported in mils per year (mpy) and were obtained from the LP measurements. The plot shows the mean value, the minimum non- zero value (typically the detection limit of the measurement), and the maximum value for each set of prolbes. The largest corrosion rates were observed on the bare-steel control samples, which showed nearly identical mean steady-state values for both flowing and stagnant exposure conditions. The average steady-state values ranged from 50 and 60 mpy, which is consistent with corrosion rates reported in the literature for carbon steel exposed to aerated seawater environmlents [12,13]. This corrosion rate is significantly greater than the 10 to 15 mpy historical average corrosion rate of bare-steel brine-disposal lines at the SPR. The discrepancy is attributed to the fact that during the majority of the test period, the fluid in the brine pond was diluted with rain water, causing the dissolved salt content to fall and the dissolved 0 2 content to increase.
.
Most of the remaining concrete-lined samples exhibited corrosion rates of about 1 mpy, indicating that the chemistry variations examined did not have a major effect on the corrosion rate of the underlying steel. Post-test examination showed that shrinkage cracks in the concrete were present in the vicinity of LP probes, where higher corrosion rates were measured (e.g. CA- Air Cured-Stagnant and LSR-Flowing). No shrinkage cracks were detected in the vicinity of LP probes where lower corrosion rates were detected (e.g. 5% Latex-Flowing). These results suggest that the degree of shrinkage cracking is significant in determining the degree of liner corrosion protection.
12
I ' """1 ' """1 ' ' ""'1 ' ' 111' '1~ ' ' 'T T
a
Steel-Stagnant Steel-Flowing
CA-Air Cured-Stagnant LSR-Flowing
55% Fly Ash-Flowing CA-Kiln Cured-stagnant
10% Fly Ash-Flowing 25% Fly Ash-Flowing
CA-Air Cured-Flowing Hand Trowelled-Stagnant
1.67% Nitrite-Stagnant 23%Epoxy-Stagnant
0.67% Nitrite-Stagnant MSR-Flowing
15% Latex-Flowing API RP1 OE-Flowing
1.33% Nitrite-Stagnant 10.5% Latex-Flowing
5% Latex-Flowing
I o-2 l o - ' 1 oo 10' I o2 Corrosion Rate (mpy)
Figure 5. Linear polarization corrosion-rate data summary.
I o3
The effect of shrinkage cracking on LP probe corrosion rate determination must be considered in future corrosion-rate monitoring activities. LP probes with small sensing surface areas may give anomalously high corrosion rates if they are located near a shrinkage crack. Conversely, probes located far away from a shrinkage crack may yield anomalously low corrosion rates. One of two strategies should be used to combat anomalous readings: 1 ) use LP probes with the largest sensing surface area possible, and 2) use multiple probes and average the individual measurements. These two strategies will ensure that a representative measure of corrosion is measured.
2.3 Cumulative immersion testing 2.3.1 Overview. Cumulative immersion testing was conducted to track the performance of concrete-lined steel pipe test specimens as a function of exposure time to static SPR-generated
13
effluent. Samples were prepared in the same manner as in the flow-loop experiment. Approximately 650 samples, 75 mm (3 in) in length, representing each of the 17 different materials under test were immersed in the brine pond at Big Hill in April 1992. Twelve groups of samples were hung on ropes and tied off to nearby fence stanchions so that the samples were fully immersed but not in contact with the bottom of the brine pond. Individual groups were returned to Sandia for analysis at periodic intervals. Evaluations included visual examination, mechanical testing, and microchemical analysis of the concrete liner.
2.3.2 Visual inspection. Visual examination was conducted to check the integrity of both the concrete liner and the underlying steel. The liner was inspected for large-scale changes, such as cracking, softening, spalling or marine growth. The steel-concrete interface was inspected to qualitatively assess the type and degree of corrosion occurring. For examination, a single 75-mm (3 in.) sample was cut in half longitudinally, and the liner was physically removed from one of the halves. Each half was inspected, relevant notes were made, and photographs were taken.
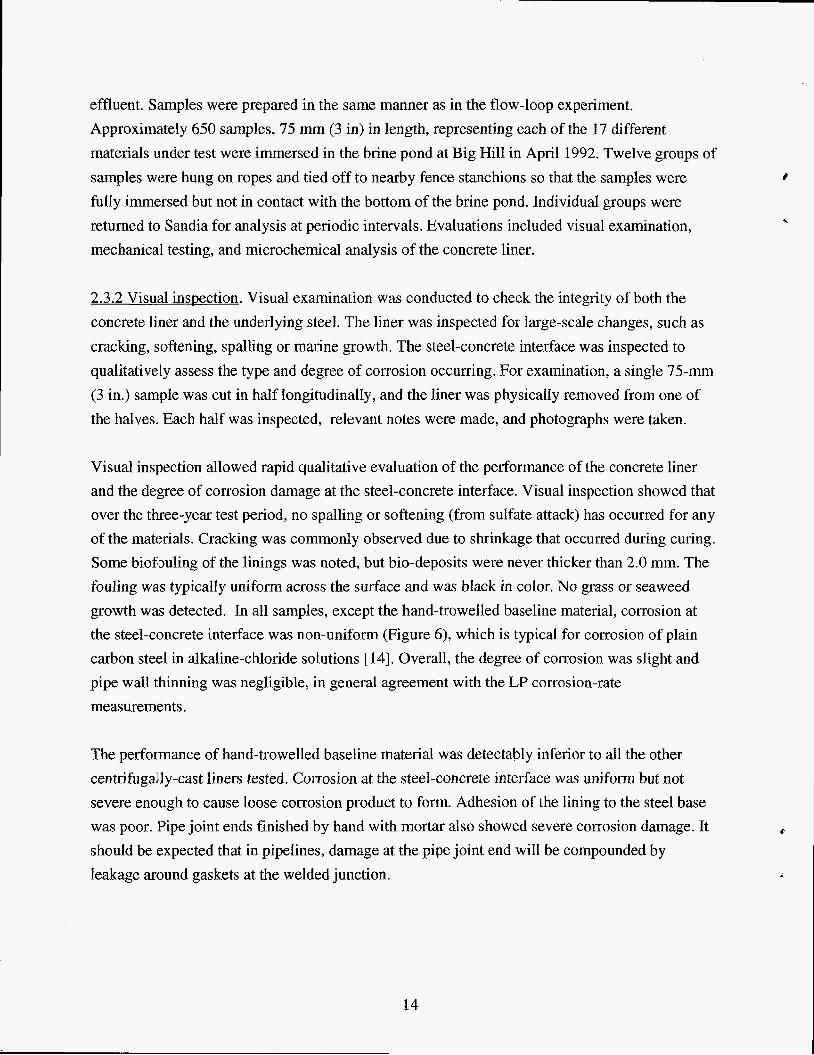
Visual inspection allowed rapid qualitative evaluation of the performance of the concrete liner and the degree of corrosion damage at the steel-concrete interface. Visual inspection showed that over the three-year test period, no spalling or softening (from sulfate attack) has occurred for any of the materials. Cracking was commonly observed due to shrinkage that occurred during curing. Some biofiouling of the linings was noted, but bio-deposits were never thicker than 2.0 mm. The fouling was typically uniform across the surface and was black in color. No grass or seaweed growth was detected. In all samples, except the hand-trowelled baseline material, corrosion at the steel-concrete interface was non-uniform (Figure 6), which is typical for corrosion of plain carbon steel in alkaline-chloride solutions [ 141. Overall, the degree of corrosion was slight and pipe wall thinning was negligible, in general agreement with the LP corrosion-rate measurements.
The performance of hand-trowelled baseline material was detectably inferior to all the other centrifugally-cast liners tested. Corrosion at the steel-concrete interface was uniform but not severe enough to cause loose corrosion product to form. Adhesion of the lining to the steel base was poor. Pipe joint ends finished by hand with mortar also showed severe corrosion damage. It should be expected that in pipelines, damage at the pipe joint end will be compounded by leakage around gaskets at the welded junction.
1
z
f
14
4
Figure 6. Localized corrosion at the steel-concrete interface.
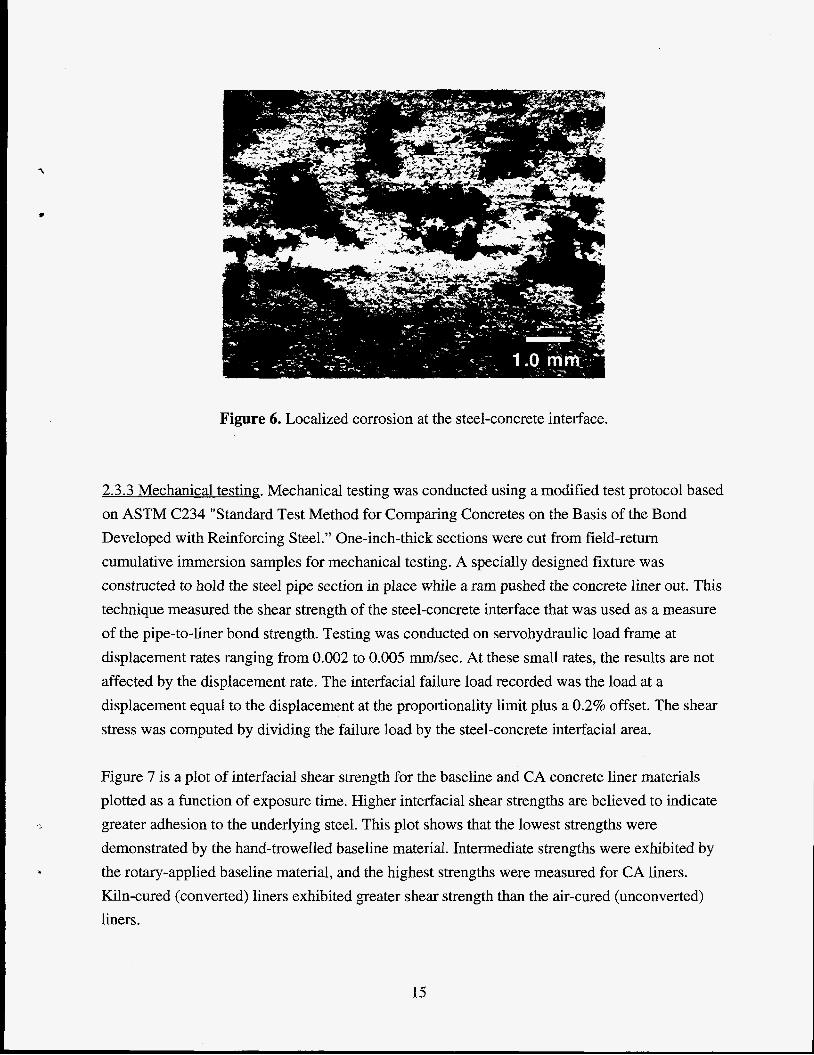
2.3.3 Mechanical testing. Mechanical testing was conducted using a modified test protocol based on ASTM C234 “Standard Test Method for Comparing Concretes on the Basis of the Bond Developed with Reinforcing Steel.” One-inch-thick sections were cut from field-return cumulative immersion samples for mechanical testing. A specially designed fixture was constructed to hold the steel pipe section in place while a ram pushed the concrete liner out. This technique measured the shear strength of the steel-concrete interface that was used as a measure of the pipe-to-liner bond strength. Testing was conducted on servohydraulic load frame at displacement rates ranging from 0.002 to 0.005 d s e c . At these small rates, the results are not affected by the displacement rate. The interfacial failure load recorded was the load at a displacement equal to the displacement at the proportionality limit plus a 0.2% offset. The shear stress was computed by dividing the failure load by the steel-concrete interfacial area.
Figure 7 is a plot of interfacial shear strength for the baseline and CA concrete liner materials plotted as a function of exposure time. Higher interfacial shear strengths are believed to indicate greater adhesion to the underlying steel. This plot shows that the lowest strengths were demonstrated by the hand-trowelled baseline material. Intermediate strengths were exhibited by the rotary-applied baseline material, and the highest strengths were measured for CA liners. Kiln-cured (converted) liners exhibited greater shear strength than the air-cured (unconverted) liners.
15
7.0
6.0
5.0
4.0
3.0
2.0
1 .o
0.0 0
+ Rotary RP1 OE --ci--- Trowelled RPIOE -$-CA Kiln Cured
-CA Air Cured
100 200 300 400 500 600 700 800
Exposure Time (days)
Figure 7. Plot of interfacial shear strength as a function of exposure time for the baseline material and the calcium aluminate liners.
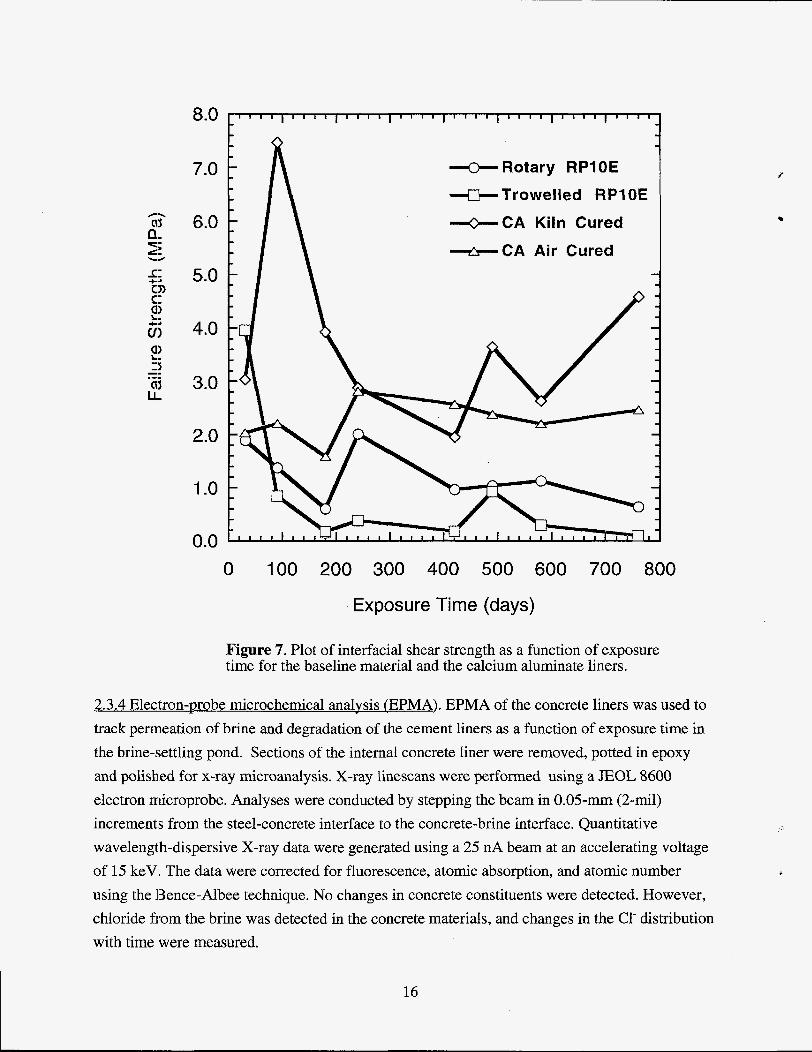
2.3.4 E l e c ~ . EPMA of the concrete liners was used to track permeation of brine and degradation of the cement liners as a function of exposure time in the brine-settling pond. Sections of the internal concrete liner were removed, potted in epoxy and polished for x-ray microanalysis. X-ray linescans were performed using a JEOL 8600 electron nucroprobe. Analyses were conducted by stepping the beam in 0.05-mm (2-mil) increments from the steel-concrete interface to the concrete-brine interface. Quantitative wavelength-dispersive X-ray data were generated using a 25 nA beam at an accelerating voltage of 15 keV. The data were corrected for fluorescence, atomic absorption, and atomic number using the IBence-Albee technique. No changes in concrete constituents were detected. However, chloride from the brine was detected in the concrete materials, and changes in the C1- distribution with time were measured.
16
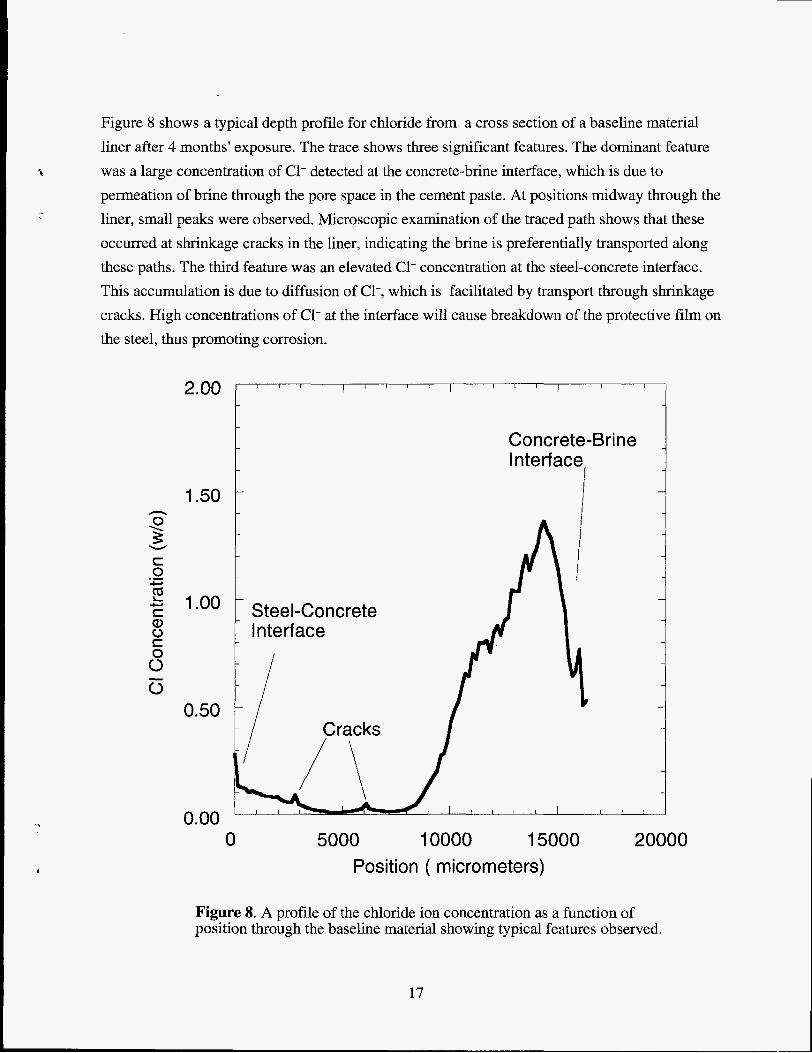
Figure 8 shows a typical depth profile for chloride from a cross section of a baseline material liner after 4 months' exposure. The trace shows three significant features. The dominant feature was a large concentration of C1- detected at the concrete-brine interface, which is due to permeation of brine through the pore space in the cement paste. At positions midway through the liner, small peaks were observed. Microscopic examination of the traced path shows that these occurred at shrinkage cracks in the liner, indicating the brine is preferentially transported along these paths. The third feature was an elevated C1- concentration at the steel-concrete interface. This accumulation is due to diffusion of C1-, which is facilitated by transport through shrinkage cracks. High concentrations of Cl- at the interface will cause breakdown of the protective film on the steel, thus promoting corrosion.
I
2.00' ' I I I I I I ' ' 1 I I I I ' ' ' '
Concrete-Brine I n terf ace
I 1.50
1 -00 . Steel-Concrete 1 Int,yface
I / Cracks 0.50
0 5000 10000 15000 20000 Position ( micrometers)
Figure 8. A profile of the chloride ion concentration as a function of position through the baseline material showing typical features observed.
17
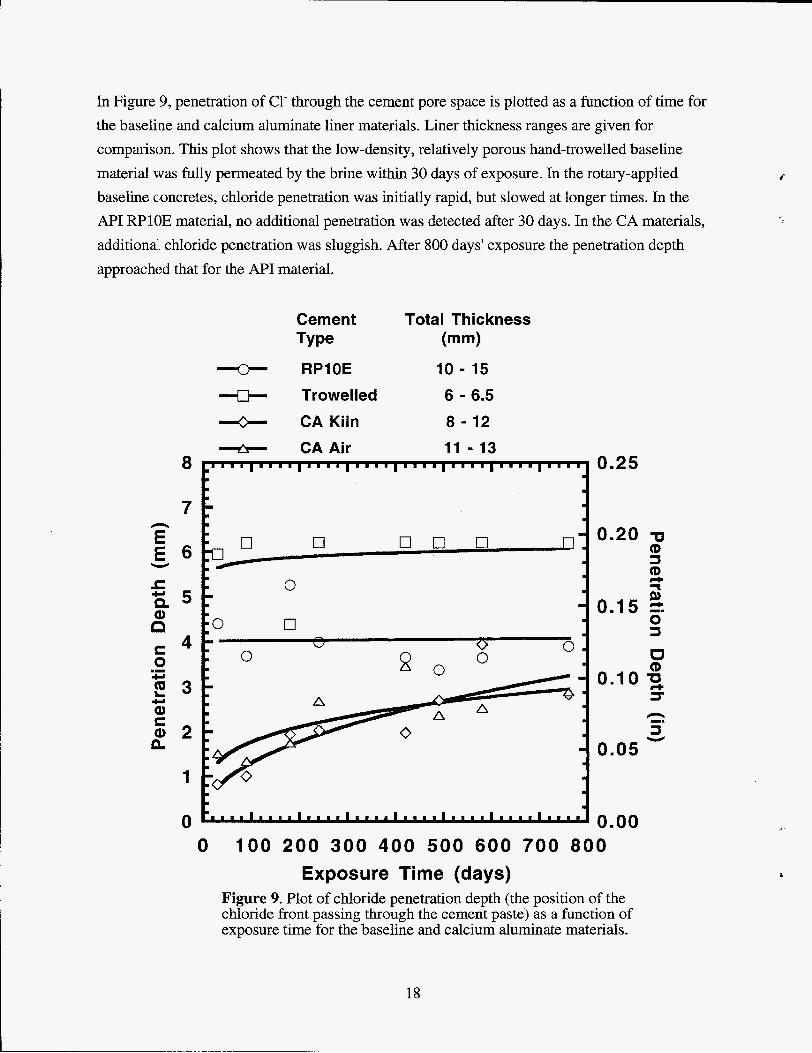
In Figure 9, penetration of C1' through the cement pore space is plotted as a function of time for the baseline and calcium aluminate liner materials. Liner thickness ranges are given for comparison. This plot shows that the low-density, relatively porous hand-trowelled baseline material was fully permeated by the brine within 30 days of exposure. In the rotary-applied baseline concretes, chloride penetration was initially rapid, but slowed at longer times. In the API RPlOE material, no additional penetration was detected after 30 days. In the CA materials, additionall chloride penetration was sluggish. After 800 days' exposure the penetration depth approached that for the API material.
Cement Total Thickness Type (mm)
V RPIOE IO - 15 +I- Trowelled 6 - 6.5 v-C- CA Kiln 8 - 12
CA Air 11 - 13 0.25
0.20 Q
z CD J
T
0.15 0 S
O iD
5
e S
0.10 2
0.05 - 0.00
0 100 200 300 400 500 600 7 0 0 800 Exposure Time (days)
Figure 9. Plot of chloride penetration depth (the position of the chloride front passing through the cement paste) as a function of exposure time for the baseline and calcium aluminate materials.
c
18
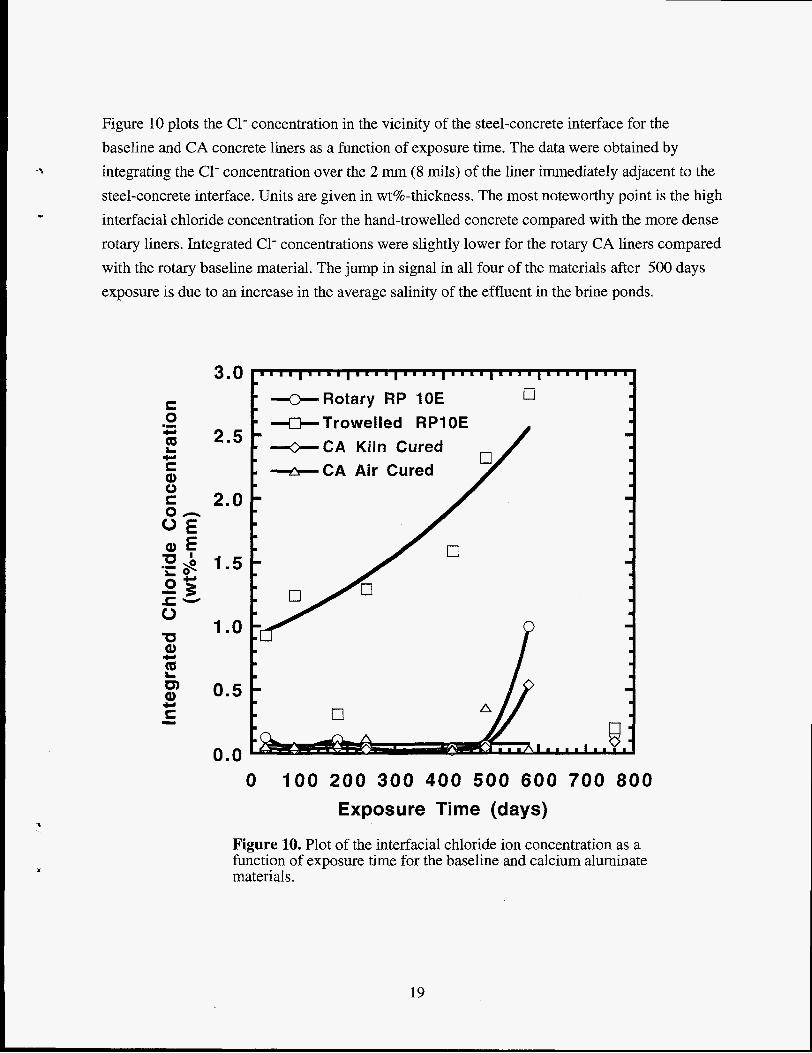
Figure 10 plots the C1- concentration in the vicinity of the steel-concrete interface for the baseline and CA concrete liners as a function of exposure time. The data were obtained by integrating the C1- concentration over the 2 mm (8 mils) of the liner immediately adjacent to the steel-concrete interface. Units are given in wt%-thickness. The most noteworthy point is the high interfacial chloride concentration for the hand-trowelled concrete compared with the more dense rotary liners. Integrated C1- concentrations were slightly lower for the rotary CA liners compared with the rotary baseline material. The jump in signal in all four of the materials after 500 days exposure is due to an increase in the average salinity of the effluent in the brine ponds.
4
Q
3.0
2.5
2.0
1.5
1 .o
0.5
0.0
IC)I Rotary RP 10E -Ct- Trowelled RP1 OE -+-CA Kiln Cured *CA Air Cured
0 100 200 300 400 500 600 7 0 0 800 Exposure Time (days)
Figure 10. Plot of the interfacial chloride ion concentration as a function of exposure time for the baseline and calcium aluminate materials.
19
3.0 Corrosion Monitoring at the West Hackberry Strategic Petroleum Reserve Site
3.1 Corrosion monitoring by electrochemical impedance spectroscopy Electrochemical impedance spectroscopy (EIS) is a powerful tool for making electrochemical measurements. It can provide both kinetic (corrosion rate) and mechanistic information. It is essential1.y a steady-state measurement, since the applied overvoltages used to make the measurement are never more than a few tens of millivolts away from the steady-state open circuit potential. EIS is well suited for resolving passive corrosion, active corrosion and diffusion-limited corrosion. The measurement is not invalidated by the large solution resistances that sometimes exist in measurement of steel in concrete. For these reasons, EIS corrosion-rate monitoring of a cement-lined brine header was initiated in August 1994. The objective of the monitoring study was to determine:
1) if EIS measurements could be successfully carried out in the field,
2) if EIS was suitable as a long-term corrosion-monitoring technique,
3) if EIS yielded corrosion rate data consistent with past and present experience for corrosion of concrete-lined SPR pipelines,
4) the differences in the corrosion rate and mechanisms of steel pipe with rotary API RPlOE, rotary calcium aluminate, and trowelled calcium aluminate concrete liners.
3.2 Probe configuration and installation Specially designed probes were built into the pipe sections of the brine header to support EIS measurements. Ten sets of probes were installed on the 0.6-m (24-in) diameter concrete-lined brine header at West Hackberry, which was put into service in July 1994. Eight sets of measurements have been made since August 1994. The first measurement was performed approximately 3 weeks after the line was put into operation.
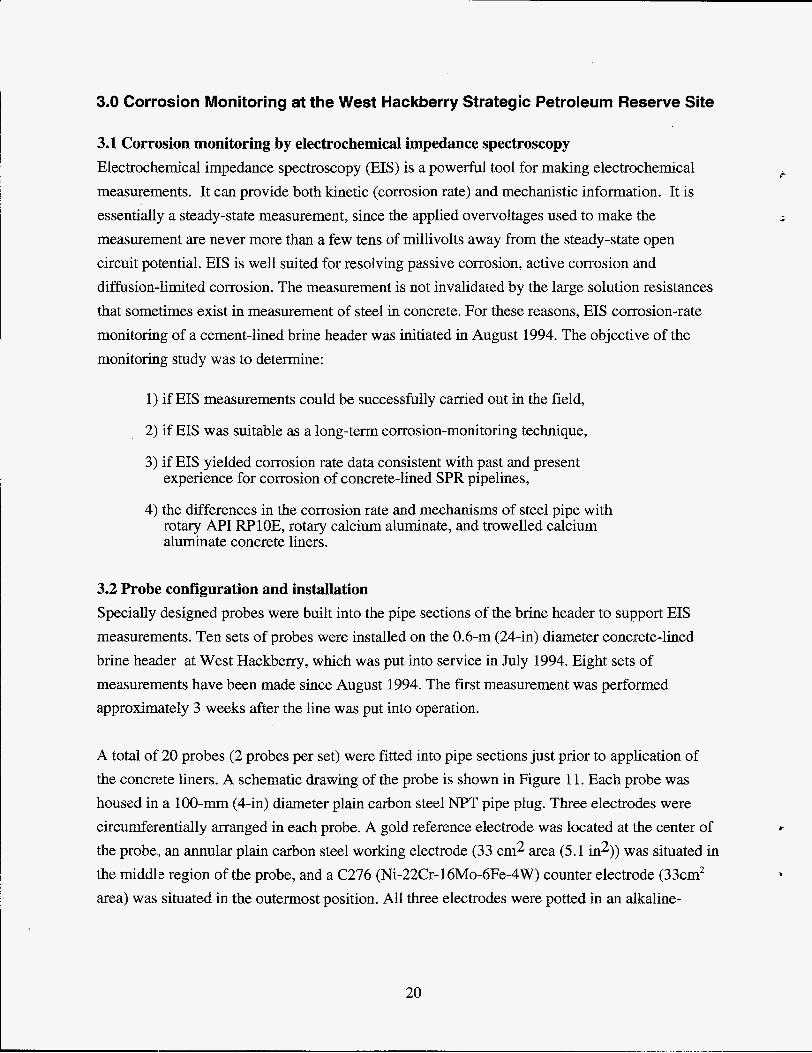
A total of 20 probes (2 probes per set) were fitted into pipe sections just prior to application of the concrete liners. A schematic drawing of the probe is shown in Figure 11. Each probe was housed in a 100-mm (4-in) diameter plain carbon steel NPT pipe plug. Three electrodes were circumferentially arranged in each probe. A gold reference electrode was located at the center of the probe., an annular plain carbon steel working electrode (33 cm2 area (5.1 in2)) was situated in the middlle region of the probe, and a C276 (Ni-22Cr-16Mo-6Fe-4W) counter electrode (33cm2 area) was situated in the outermost position. All three electrodes were potted in an alkaline-
resistant epoxy and electrical connections were run through the probe body to a military connector that was used on the backside for external connections.
CE
RE
WE
- c 276
- Gold
-Steel
1 inch 25 mm
I - -
Figure 11. Schematic illustration of the EIS probes for corrosion monitoring at West Hackberry.
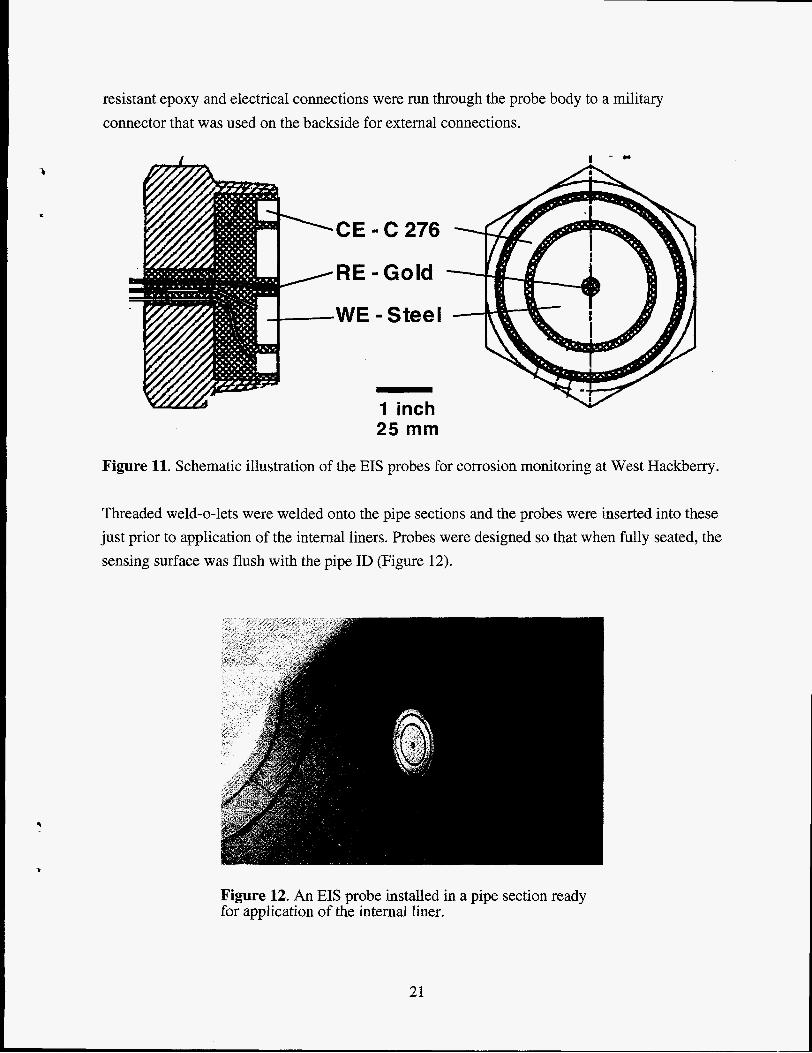
Threaded weld-0-lets were welded onto the pipe sections and the probes were inserted into these just prior to application of the internal liners. Probes were designed so that when fully seated, the sensing surface was flush with the pipe ID (Figure 12).
Figure 12. An EIS probe installed in a pipe section ready for application of the internal liner.
21
Three different liner materials were used in this brine header. They were rotary-applied API Rp 1 OE, rotary-applied calcium aluminate formulation supplied by Lehigh Cement company, and a similar calcium aluminate formulation but with less water, applied by hand trowelling on spool pieces. Three sets of EIS probes were located under each of the rotary liners and 4 sets were located under the hand-trowelled liner.
I'
3.3 Corrosion-monitoring methods and data analysis EIS measurements were made using standard laboratory equipment set up in minivans for transport along the 2000-foot-long header. Electrical power provided by gas-powered generators was used to run the instrumentation. EIS measurements were typically made using a two- electrode configuration at the open-circuit potential of the working electrode. To combat occasional electrical noise problems, the electrode was potentiostatically polarized to a potential 10 to 20 mV positive of the open-circuit potential during the EIS measurement. A 10- to 20-mV sinusoidalL voltage modulation was used, and data were taken at a rate of 4 to 7 points per decade frequency from 10 kHz to 1 mHz. This frequency range was sufficient to capture significant charge transfer and diffusion processes occurring without making the measurements unreasonably long.
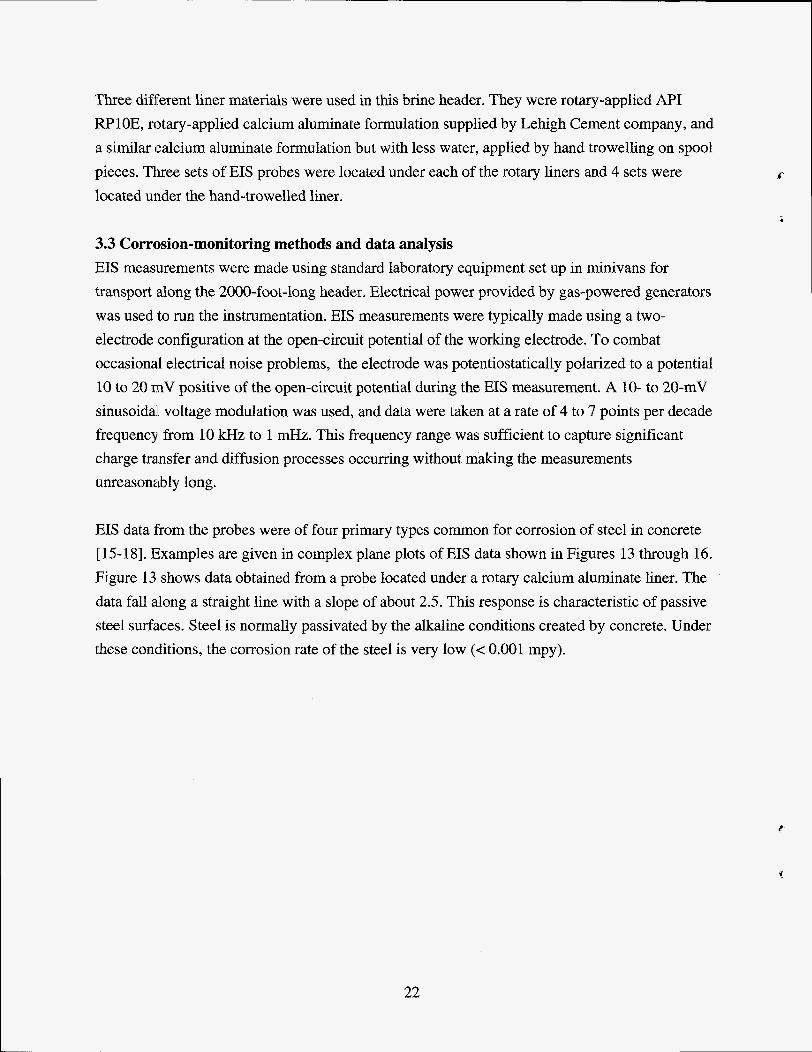
EIS data from the probes were of four primary types common for corrosion of steel in concrete [ 15-18]. Examples are given in complex plane plots of EIS data shown in Figures 13 through 16. Figure 13 shows data obtained from a probe located under a rotary calcium aluminate liner. The data fall along a straight line with a slope of about 2.5. This response is characteristic of passive steel surfaces. Steel is normally passivated by the alkaline conditions created by concrete. Under these conditions, the corrosion rate of the steel is very low (< 0.001 mpy).
c
22
n v)
E G 0 v
-30000
-25000
-20000
-1 5000
-1 0000
-5000
0 0 5000 10000 15000 20000 25000 30000
Real (ohms)
Figure 13. Complex plane plot of EIS data from a probe located under a rotary calcium aluminate concrete liner indicating corrosion through a passivating layer.
23
-1 0000
-2000
-8000 I
I
I
I
I
I
I
I
I
-6000
-4000
0 2000 4000 6000 8000 10000 Real (ohms)
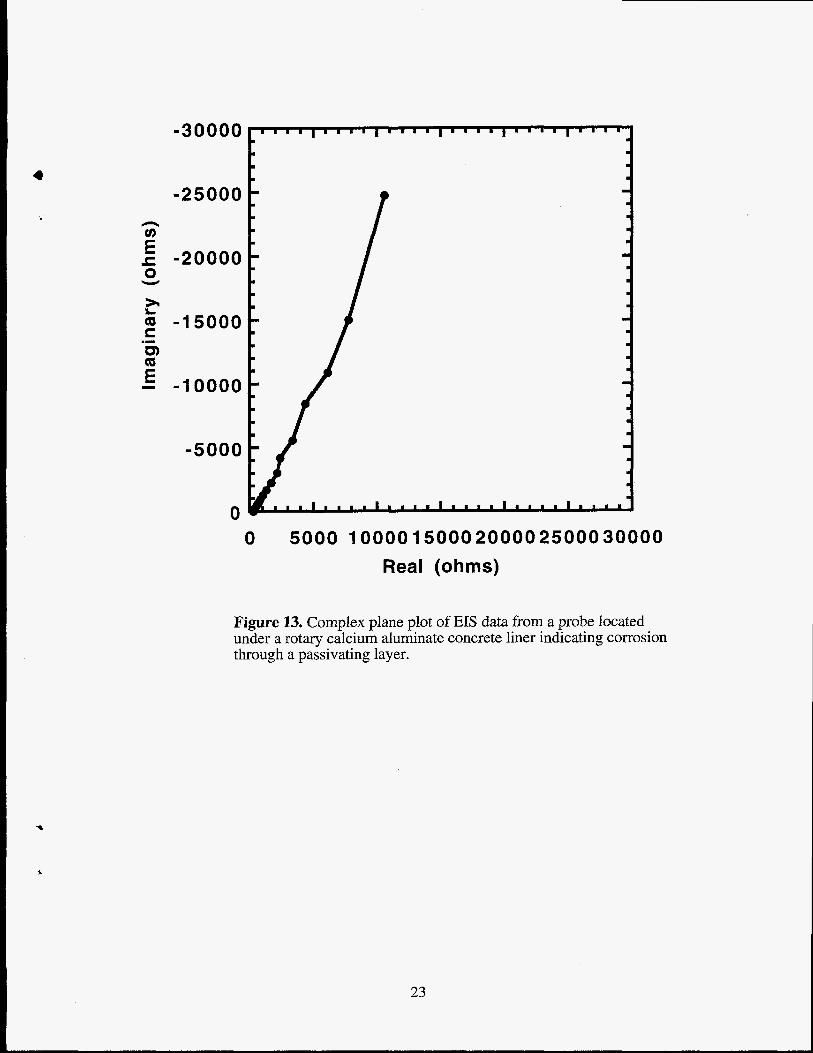
Figure 14. Complex plane plot of EIS data from a probe located under a rotary API RPlOE concrete liner indicating that active corrosion is occurring.
i
24
-5000
-4000
-3000
-2000
-1 000
0 0 1000 2000 3000 4000 5000
Real (ohms)
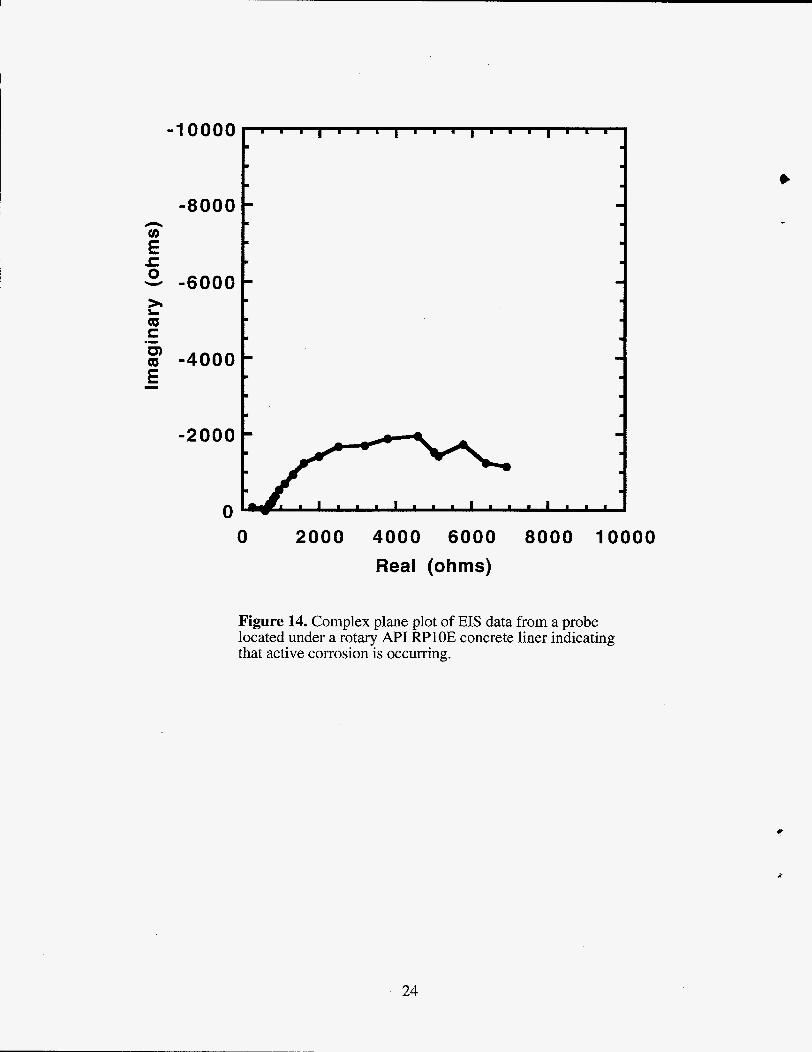
Figure 15. Complex plane plot of EIS data from a probe located under a hand-trowelled calcium aluminate concrete liner indicating that diffusion-control corrosion is occurring.
2
25
I
I . -200 =
I
I
I
-150 I
I
I
I
-100 - I
I
I
I
- 5 0 I
I
I
charge
I I
I
0 5 0 100 150 2 0 0 2 5 0 Real (ohms)
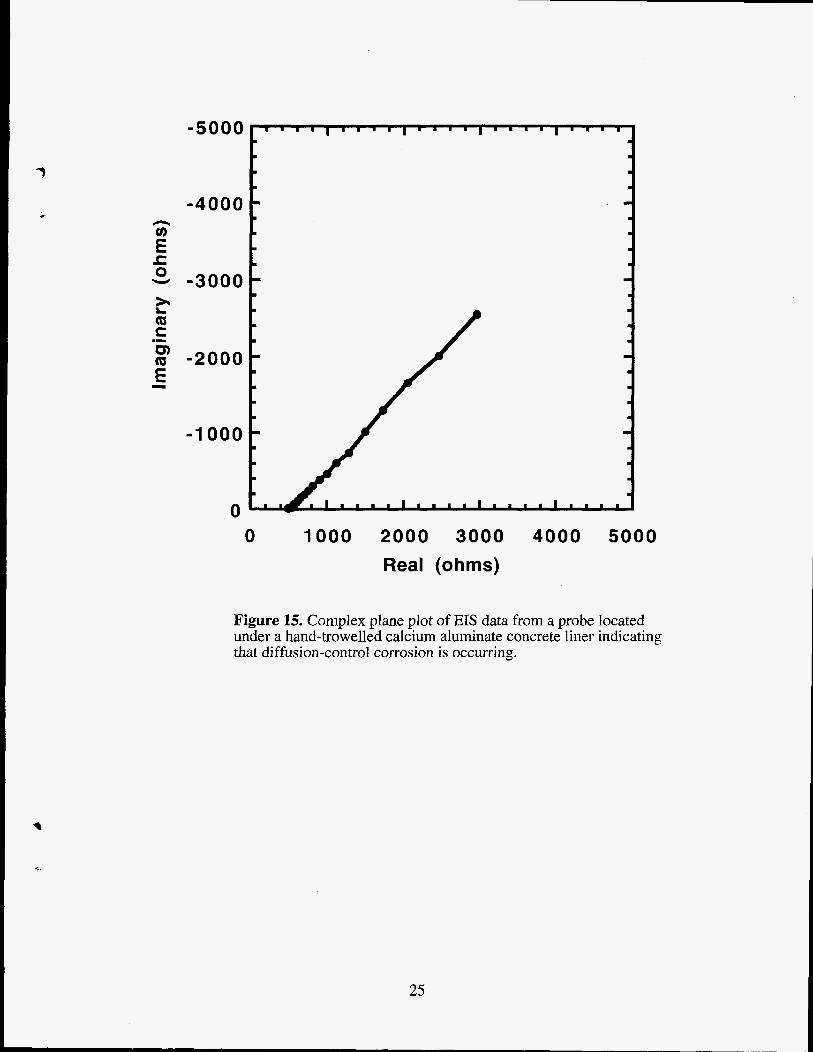
Figure 16. Complex plane plot of EIS data from a probe located under a hand-trowelled calcium aluminate concrete liner showing three different processes.
When the interfacial chloride concentration becomes sufficiently high, passive film breakdown occurs and active corrosion ensues. Figure 14 shows EIS data obtained from a probe located under rotary API WlOE concrete liner material. The data fall along a depressed semi-circular arc that is characteristic of active corrosion at the steel-concrete interface. Corrosion rates can be directly calculated by extracting a polarization resistance from the data. Corrosion rates have been observed to range from 0.01 to 5 mpy when active corrosion is occurring. The arc is strongly depressed, as the arc center lies well below the Real axis. Arc depression is normally attributed to localized corrosion at the steel-concrete interface [ 19,201. Observations of corrosion at the steel-concrete interface, like that in Figure 6, suggest that this is the case here. However, the presence of porous layers at the interface can also produce depression in semi-circular arcs and its influence can not be ruled out in this case [21].
26
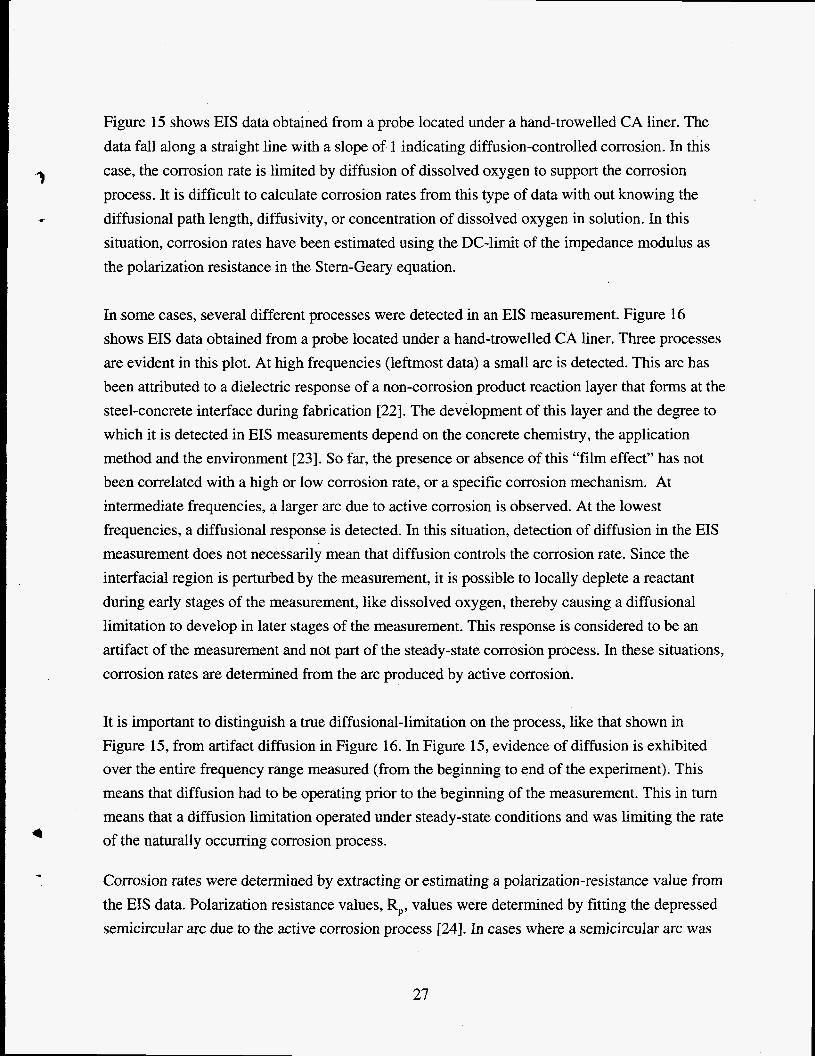
Figure 15 shows EIS data obtained from a probe located under a hand-trowelled CA liner. The data fall along a straight line with a slope of 1 indicating diffusion-controlled corrosion. In this case, the corrosion rate is limited by diffusion of dissolved oxygen to support the corrosion
diffusional path length, diffusivity, or concentration of dissolved oxygen in solution. In this situation, corrosion rates have been estimated using the DC-limit of the impedance modulus as the polarization resistance in the Stern-Geary equation.
-9
4
I process. It is difficult to calculate corrosion rates from this type of data with out knowing the
In some cases, several different processes were detected in an EIS measurement. Figure 16 shows EIS data obtained from a probe located under a hand-trowelled CA liner. Three processes are evident in this plot. At high frequencies (leftmost data) a small arc is detected. This arc has been attributed to a dielectric response of a non-corrosion product reaction layer that forms at the steel-concrete interface during fabrication [22]. The development of this layer and the degree to which it is detected in EIS measurements depend on the concrete chemistry, the application method and the environment [23]. So far, the presence or absence of this “film effect” has not been correlated with a high or low corrosion rate, or a specific corrosion mechanism. At intermediate frequencies, a larger arc due to active corrosion is observed. At the lowest frequencies, a diffusional response is detected. In this situation, detection of diffusion in the EIS measurement does not necessarily mean that diffusion controls the corrosion rate. Since the interfacial region is perturbed by the measurement, it is possible to locally deplete a reactant during early stages of the measurement, like dissolved oxygen, thereby causing a diffusional limitation to develop in later stages of the measurement. This response is considered to be an artifact of the measurement and not part of the steady-state corrosion process. In these situations, corrosion rates are determined from the arc produced by active corrosion.
It is important to distinguish a true diffusional-limitation on the process, like that shown in Figure 15, from artifact diffusion in Figure 16. In Figure 15, evidence of diffusion is exhibited over the entire frequency range measured (from the beginning to end of the experiment). This means that diffusion had to be operating prior to the beginning of the measurement. This in turn means that a diffusion limitation operated under steady-state conditions and was limiting the rate of the naturally occurring corrosion process. (I
-? Corrosion rates were determined by extracting or estimating a polarization-resistance value from the EIS data. Polarization resistance values, R,, values were determined by fitting the depressed semicircular arc due to the active corrosion process [24]. In cases where a semicircular arc was
27
not detected or not sufficiently resolved, the impedance modulus at the lowest measured frequency was used to estimate a polarization resistance. To compute the corrosion rate, Rp was
used in the Stern-Geary equation [ 101:
B i = - RP
where B is a constant equal to 25 mV/decade for corroding steel in concrete [l 11. Unit conversion was then used to transform the corrosion rate data to units of mpy.
3.4 Results from corrosion testing Figure 17 summarizes the corrosion rate data for hand-trowelled CA, rotary CA, and rotary API RPlOE lined pipe obtained in corrosion monitoring at West Hackberry after 1020 days of exposure. Strong time-dependent trends in the data do not appear. Average corrosion rates over this time period have been computed and are shown in Table 5. The performance of the three different liners can be ranked by corrosion performance based on the data in Figure 14 and Table 5 . The ranking, in order of decreasing corrosion rate, is
hand-trowelled CA > rotary API RPlOE > rotary CA.
t
c
Corrosion rates of steel pipe protected by each of these three liners is well below the historical SPR brineline corrosion rates of 10 to 15 mpy.
28
IO’ n )r
v IO0
c 10-l
2 I
5 lo-*
I o - ~
a 0 K
0 v)
*
.I
0 I I
I
I
I . I 1 1 . I . I
2 0 0 400 600 800 1000 Exposure Time (days)
Figure 17. Corrosion-rate data summary from EIS data obtained using the EIS probes at West Hackberry, August 1994 to April 1997.
Table 5. Average corrosion rates for the 0.6 m (24 in) brine header at West Hackberry, August 1994 to April 1997.
Corrosion Rate
Material b P Y )
Trowelled Calcium Aluminate 0.65k.4
Rotary Baseline 0.39k.3
Rotary Calcium Aluminate 0.08+. 1
29
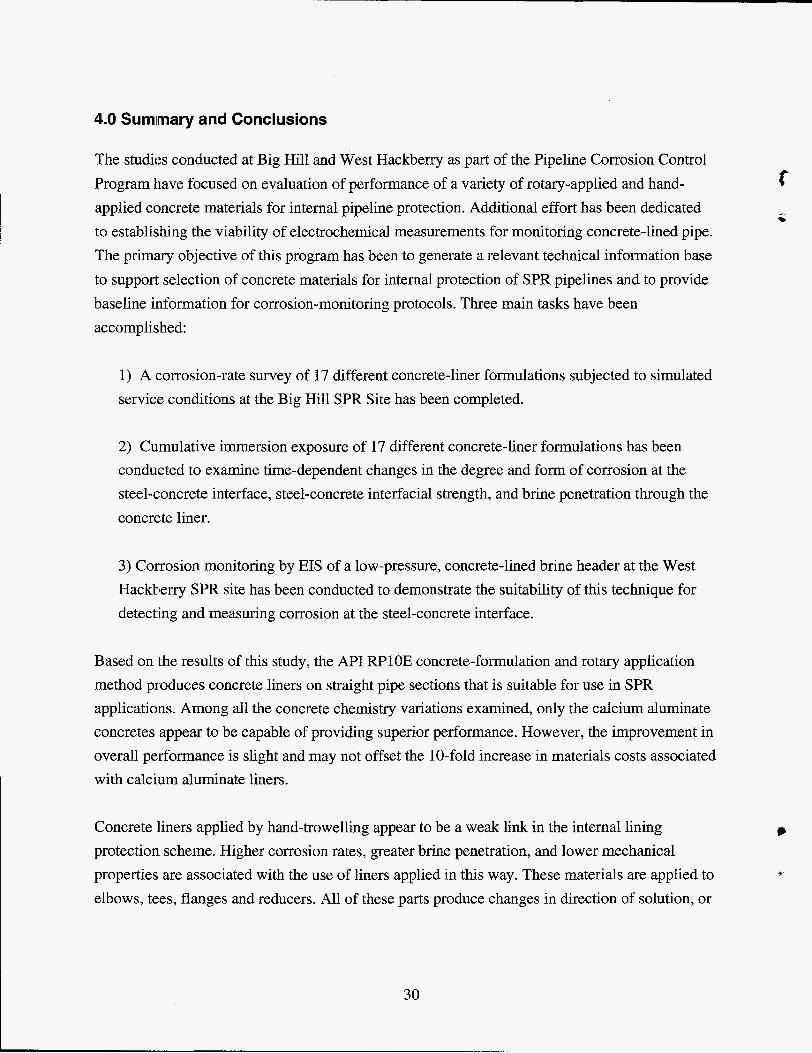
4.0 Sumimary and Conclusions
The studit:s conducted at Big Hill and West Hackberry as part of the Pipeline Corrosion Control Program have focused on evaluation of performance of a variety of rotary-applied and hand- applied concrete materials for internal pipeline protection. Additional effort has been dedicated to establishing the viability of electrochemical measurements for monitoring concrete-lined pipe. The primary objective of this program has been to generate a relevant technical information base to support selection of concrete materials for internal protection of SPR pipelines and to provide baseline information for corrosion-monitoring protocols. Three main tasks have been accomplis,hed:
1) A corrosion-rate survey of 17 different concrete-liner formulations subjected to simulated service conditions at the Big Hill SPR Site has been completed.
2) Cumulative immersion exposure of 17 different concrete-liner formulations has been conducted to examine time-dependent changes in the degree and form of corrosion at the steel-concrete interface, steel-concrete interfacial strength, and brine penetration through the concrete liner.
3) Corrosion monitoring by EIS of a low-pressure, concrete-lined brine header at the West Hackberry SPR site has been conducted to demonstrate the suitability of this technique for detect:ing and measuring corrosion at the steel-concrete interface.
Based on the results of this study, the API RPlOE concrete-formulation and rotary application method produces concrete liners on straight pipe sections that is suitable for use in SPR applications. Among all the concrete chemistry variations examined, only the calcium aluminate concretes appear to be capable of providing superior performance. However, the improvement in overall performance is slight and may not offset the 10-fold increase in materials costs associated with calcium aluminate liners.
Concrete lliners applied by hand-trowelling appear to be a weak link in the internal lining protection scheme. Higher corrosion rates, greater brine penetration, and lower mechanical properties are associated with the use of liners applied in this way. These materials are applied to elbows, tees, flanges and reducers. All of these parts produce changes in direction of solution, or
30
m
solution cavitation, which can add stress to the liners. As a result, the risk of spalling is likely to be greater for hand-applied liners.
Similarly, risk of spalling is likely to be greater in the vicinity of welded joints; especially where pipe joint ends damaged during handling have been repaired by hand trowelling. The junction of two pipe joints may provide and effective crack that permits brine penetration to the steel- concrete interface, creating the possibility of increased corrosion rates.
During the course of these studies, considerable experience with linear polarization and electrochemical impedance spectroscopy as field corrosion monitoring techniques has been gained. Both techniques appear to provide useful information on corrosion rates and mechanisms. Linear polarization is well suited for monitoring because of the ease in conducting the measurement, the short measurement time and the ease of data interpretation. EIS provides a more detailed mechanistic picture of the corrosion process, but this information is not necessary in routine monitoring activities. Nevertheless, the EIS technique should still be regarded as a valuable electrochemical monitoring technique suitable for use when more sohpisticated corrosion diagnosis is required.
31
5.0 References
1) B. Jackson, J.F. Armstrong, Mat. Perf., 29,36 (1990).
2) S.H. Kosmatka, W.C. Panarese, Design and Control of Concrete Mixtures, 13th Ed., p. 19, Portland Cement Association, Skokie IL, (1988).
3) S.H. Kosmatka, W.C. Panarese, Design and Control of Concrete Mixtures, 13th Ed., p. 193, Portland Cement Association, Skokie IL, (1988).
4) S.H. Kosmatka, W.C. Panarese, Desizn and Control of Concrete Mixtures, 13th Ed., p. 71, Portland Cement Association, Skokie IL, (1988).
5) S.H. Kosmatka, W.C. Panarese, Design and Control of Concrete Mixtures, 13th Ed., p. 19, Portland Cement Association, Skokie IL, (1988).
6) Daily Meter Reading Data Sheets, Big Hill SPR Site, Winnie, TX, 1990- 199 1.
7) C.M. George, “Industrial Aluminous Cements,” p. 415, Structure and Performance of --7 Cements P. Barnes, ed., Applied Science Publishers, New York (1983).
8) SewperCoatTM, Product information, LaFarge Calcium Aluminates, Norfolk, VA ( 1992).
9) Atlas Lumnite & Refcon, Product Information, Bulletin 1-01 , Lehigh Cement Company, Allentown, PA, (1 994).
10) M. St’ern, A.L. Geary, J. Electrochem. SOC., 104,56 (1957).
11) R. Grauer, P.J. Moreland, G. Pini, A Literature Review of Polarisation Resistance Constant {B) Values For the Measurement of Corrosion Rate, NACE, Houston, TX, (1982).
12) Corrolsion Data Handbook, B.D. Craig, ed., ASM International, Materials Park, OH, p. 460 (1989).
13) Corrolsion Data Survey, N.E. Hamner, ed., NACE, Houston, TX, p. 165 (1974).
14) J.E. Slater, “Corrosion in Structures”, Metals Handbook, Vol. 13, Corrosion, ASM, International, Materials Park, OH, p. 1299 (1987).
15) J.A. Gonzales, A. Molina. M.L. Escudero, C. Andrade, Corrosion Sci., 25,5 19 (1985).
16) C. Anidrade, V. Castelo, C. Alonso, J.A. Gonzales, “The Determination of the Corrosion Rate of Steel Embedded in Concrete by the Polarization Resistance and AC Impedance Methods,” p. 43,. Corrosion Effect of Stray Currents and the Techniaues for Evaluating Corrosion of Rebars in Concrete, ASTM STP 906, V. Chaker, ED., American Society for Testing and Materials, Philadelphia, PA, 1986.
17) K.K. Sagoe-Crentsil, F.P. Glasser, J.T.S. Irvine, Br. Corrosion J., 27, 113 (1 13).,
18) L. Hachani, J. Carpio, C. Fiaud, A. Raharinaivo, E. Triki, Cement and Concrete Research, 22,5tI (1992).
19) K. Hlady, L.M. Callow, J.L. Dawson, Br. Corrosion J., 12,20 (1980).
32
20) K.K. Sagoe-Crentsil, V.T. Yilmaz, F.P. Glassner, J. Mater. Sci., 27, 3400 (1992).
2 1) R deLevie in Advances in Electrochemistrv and Electrochemical Engineering, Vol. 6, P. Delahay, Ed., Wiley-Interscience, New York, 1969, p. 329.
22) D.G. John, P.C. Searson, J.L. Dawson, Br. Corrosion J., 16, 103 (1981).
23) J.L. Dawson, “Corrosion Monitoring of Steel in Concrete,” Corrosion of Reinforcement in Concrete Construction, A.P. Crane, Ed., Ellis Horwood, Ltd., Chichester, p. 175 (1983).
24) “Basics of Electrochemical Impedance Spectroscopy (EIS)” Aplication Note AC- 1, EG&G Princeton Applied Research.
33
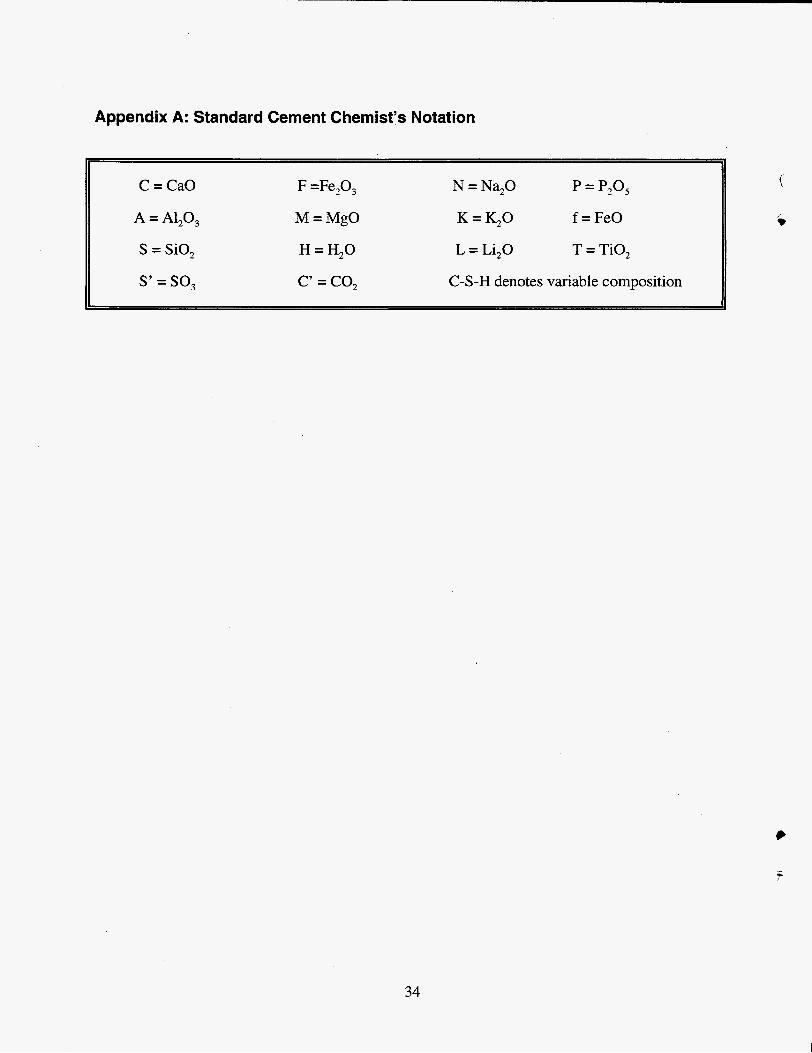
Appendix A: Standard Cement Chemist’s Notation
F =Fe,O, N = N%O P = P,O,
M = MgO K = & O f = FeO
S =: SiO, H = H,O L = Li,O T = TiO,
C’ = co, C-S-H denotes variable composition
34
Distribution
U.S. DOE SPR PMO (1 1) 900 Commerce Road East New Orleans, LA 70123 Attn: G. B. Berndsen, FE 443-1 (3) L.A. Boston, FE 4432 J. Culbert, FE 431 J.C. Kilroy, FE 443 J. W. Kunkel, FE 4422.1 R.E. Myers, FE 4422 J.L. Maldonado FE 443 1 P.B. Zuyus, FE 4422 TDCS (2)
U.S. Department of Energy Strategic Petroleum Reserve 1000 Independence Avenue SW Washington, D. C. 20585 Attn: D. F. Johnson, FE 421 H.N. Giles, FE 423 (3)
DynMcDermott (4) 850 South Clearview Parkway New Orleans, LA 70123 Attn:
L.L. Eldredge, EF 20' G. K. Hughes, EF 32 K.E. Mills, EF 20 P. L. Mihalik, EF 25
Weeks Island SPR Site P.O. Box 434 New Iberia, LA 70560 Attn: M. Jackson R.N. Phillips
Bayou Choctaw SPR Site 60825 Hwy. 1148 Plaquemine, LA 70764 Attn: J. C. Morris G. B. Tuminello
Big Hill SPR Site P.O. Box 1270 Winnie, TX Attn: A.Fruge
T.W. Lewis
Bryan Mound SPR Site P.O. Box 2276 Freeport, TX 77541 Attn: C. Bellam
W. Denton
West Hackberry SPR Site 1450 Black Lake Road Hackberry, LA 70645 Attn: R. Francoeur
L. M. Johnson
Sandia Internal: MS 1434 G. Pike, 1802 MS 0340 MS 0340 MS 0340 MS 0340 MS 0340 MS 0340 MS 0701 MS 0706 MS 0706 MS 0706 MS 0706 MS 0706 MS 0706 MS 0706 MS 0706 MS 0706 MS 0706 MS 0706 MS 9018 MS 0899 MS 0619
W. R. Cieslak, 1832 R. G. Buchheit, 1832 L. M. Maestas, 1832 N. R. Sorensen, 1832 J. W. Braithwaite, 1832 L. Montes, 1832 R. W. Lynch, 6100 J. K. Linn, 61 13 (10) S. J. Bauer, 61 13 B.L. Ehgartner, 61 13 T. E. Hinkebein, 6 1 13 (1 0) B. L. Levin, 61 13 S. E. Lott, 61 13 M. A. Molecke, 61 13 D.E. Munson A. R. Sattler, 61 13 C.V. Williams, 61 13 S. Ballard, 61 16 Central Tech Files, 8940-2 Technical Library, 491 6 (5) Review & Approval Desk, 12690 for DOE/OSTI (2)
35