Embed Size (px)
Citation preview
building sciencecom copy 2007 Building Science Press All rights of reproduction in any form reserved
Field test of room-to-room uniformity of ventilation air distribution in two new houses Research Report - 0602 2006 December Robert Hendron Amrin Rudd Ren Anderson Dennis Barley Ed Hancock Aaron Townsend
Abstract
In order for dilution ventilation systems to provide predictable results independent of the geometry of
individual homes outside air must be uniformly distributed throughout the house The primary
purpose of this field test was to characterize the uniformity of room-to-room ventilation air distribution
under various operating conditions by examining multi-zone tracer gas decay curves and calculating
local age-of-air The tests were conducted in two Sacramento houses and were designed to allow direct
quantitative comparisons of various ventilation approaches which could potentially be factored into
ventilation rate trade-offs in future updates to ASHRAE Standard 622 We observed the effects of
providing single-point exhaust ventilation versus central-fan-integrated supply ventilation and the
Research Report - 0602
Field test of room-to-room uniformity of ventilation air distribution in two new houses
impacts of operating the central fan at a minimum duty cycle for mixing closing the bedroom doors
and covering passive return air transfer grilles above the doors Analysis of the measured data showed
that reciprocal age-of-air analysis worked well to characterize room-to-room uniformity of ventilation
air distribution as long as the house was well mixed at the beginning of the test and weather
conditions were sufficiently steady-state A test period of at least 15 air changes was necessary to
obtain valid age-of-air results when there was significant divergence in tracer gas concentration among
the rooms Both houses had relatively low natural infiltration and duct leakage to outdoors
Ventilation supplied through the central air distribution system provided much more uniform
distribution of ventilation air than the single-point exhaust system Operation of the central fan at a
33 duty cycle maintained relatively well-mixed conditions regardless of ventilation rate type of
ventilation system (supply or exhaust) or house configuration (1-story or 2-story) For single-point
exhaust ventilation opening bedroom doors appeared to significantly improve the mixing of ventilation
air among rooms Passive air transfer grilles improved the distribution of ventilation air only slightly
2 of 49
Research Report - 0602
Field test of room-to-room uniformity of ventilation air distribution in two new houses
Robert Hendron Armin Rudd Ren Anderson Dennis Barley Ed Hancock Aaron Townsend
(Robert Hendron Ren Anderson Dennis Barley are with National Renewable Energy Laboratory Armin Rudd and Aaron Townsend are with Building Science Corporation Ed Hancock is with Mountain Energy Partnership)
KEY WORDS ventilation air distribution age-of-air multi-zone tracer gas decay
ABSTRACT In order for dilution ventilation systems to provide predictable results independent of the geometry of individual homes outside air must be uniformly distributed throughout the house The primary purpose of this field test was to characterize the uniformity of room-to-room ventilation air distribution under various operating conditions by examining multi-zone tracer gas decay curves and calculating local age-of-air The tests were conducted in two Sacramento houses and were designed to allow direct quantitative comparisons of various ventilation approaches which could potentially be factored into ventilation rate trade-offs in future updates to ASHRAE Standard 622 We observed the effects of providing single-point exhaust ventilation versus central-fan-integrated supply ventilation and the impacts of operating the central fan at a minimum duty cycle for mixing closing the bedroom doors and covering passive return air transfer grilles above the doors Analysis of the measured data showed that reciprocal age-of-air analysis worked well to characterize room-to-room uniformity of ventilation air distribution as long as the house was well mixed at the beginning of the test and weather conditions were sufficiently steady-state A test period of at least 15 air changes was necessary to obtain valid age-of-air results when there was significant divergence in tracer gas concentration among the rooms Both houses had relatively low natural infiltration and duct leakage to outdoors Ventilation supplied through the central air distribution system provided much more uniform distribution of ventilation air than the single-point exhaust system Operation of the central fan at a 33 duty cycle maintained relatively well-mixed conditions regardless of ventilation rate type of ventilation system (supply or exhaust) or house configuration (1-story or 2-story) For single-point exhaust ventilation opening bedroom doors appeared to significantly improve the mixing of ventilation air among rooms Passive air transfer grilles improved the distribution of ventilation air only slightly
INTRODUCTION
ASHRAE Standard 622 (ASHRAE 2004) ldquoVentilation and Acceptable Indoor Air Quality in Low-Rise Residential Buildingsrdquo specifies a minimum ventilation flow rate that depends on the timing of ventilation air delivery but it is silent on whole-house distribution of ventilation air The Washington State Ventilation and Indoor Air Quality Code (WAC 2004) is also silent regarding ventilation air distribution Both the Minnesota Building Code (MN Chapter 7672) and the National Building Code of Canada (NBC 2005) referring to Canadian Standard F326shyM91 (CSA 2005) require whole-house ventilation air distribution by means of fully ducted
3 of 49
Research Report - 0602
ventilation systems or by mixing via a central air handling system A large US private-sector high-performance home program also requires periodic central air handler operation to assure whole-house mixing for ventilation air distribution and thermal comfort Prior work by Rudd (2000) showed that ventilation systems that utilized whole-house distribution and mixing via the central air handling system had much less room-to-room variation in ventilation air exchange than systems that did not
This research program evaluated the distribution of ventilation air in two new test houses using several different ventilation system configurations and air-mixing scenarios The test program was conducted in late December 2005 and early January 2006 during relatively mild winter weather in Sacramento The first test house was a one-story model with four bedrooms The second was a two-story model also with four bedrooms Both houses were designed to be energy efficient had slab-on-grade foundations ducts in conditioned space and met the builderrsquos airtightness target measured with a blower door (lt125 in2 effective leakage area per 100 ft2 envelope area) Other key specifications for both houses are summarized in Table 1 and photos are shown in Figures 1 and 2 Floor plans are shown in Figures 3 and 4
The primary purpose of this test program was to characterize the uniformity of room-to-room distribution of outside air under various conditions by examining multi-zone tracer gas decay curves In order for dilution ventilation systems to provide predictable results independent of the geometry of individual homes outside air must be uniformly distributed throughout the house The tests in the Sacramento houses were designed to allow direct quantitative comparisons of various ventilation approaches which could potentially be factored into ventilation rate tradeshyoffs in future updates to ASHRAE Standard 622 (ASHRAE 2004)
4 of 49
Research Report - 0602
Table 1 Specifications for DR Horton test houses
1-Story (1111 Montague) 2-Story (1117 Montague)
Geometry 4-bedrooms 2-bath 4-bedrooms 2-bath 2075 ft2 2582 ft2
10 ft ceilings 10 ft ceilings
Building envelope Ceiling amp wal Optima advanced insulation system ls Optima advanced insulation system Foundation Slab-on-grade Slab-on-grade Infiltration 1583 CFM50 as tested using a blower-door 1383 CFM50 as tested using a blower-
door Mechanical systems Heat Sealed-combustion gas furnace Sealed-combustion gas furnace Cooling 14 SEER air conditioner 14 SEER air conditioner Air distribution Ducts inside conditioned space 49 CFM25 Ducts inside conditioned space 44
duct leakage to the inside transfer grilles CFM25 duct leakage to the inside between bedrooms and main living space transfer grilles between bedrooms and
main living space Ventilation Central fan integrated supply (CFIS) Central fan integrated supply ventilation
ventilation w Aprilaire VCS model 8126 (CFIS) w Aprilaire VCS model 8126 motorized damper 33 duty cycle motorized damper 33 duty cycle
Figure 1 DR Horton 1-story test house (1111 Montague)
5 of 49
Research Report - 0602
Figure 2 DR Horton 2-story test house (1117 Montague)
6 of 49
Research Report - 0602
BR1
BR2
BR3
MBR Living Rm
Entry
copy buildingsciencecom
Figure 3 1-story test house floor plan (1111 Montague)
7 of 49
Research Report - 0602
MBR
BR1
BR3
BR2
Kitchen
Living
copy buildingsciencecom
Figure 4 2-story test house floor plan (mirror image of 1117 Montague)
TEST PLAN
Research Questions
The following series of research questions were identified by the researchers to quantify the ventilation distribution characteristics of the test houses under various operating conditions
1 What is the natural air change rate (ACH) for each house with bedroom doors open no air handler operation and no mechanical ventilation What is the room-to-room uniformity in outside air distribution
2 What is the change in whole-house ACH caused by air handler operation What is the change in room-to-room uniformity of outside air distribution
3 What is the change in whole-house ACH caused by closing the bedroom doors What is the change in room-to-room uniformity of outside air distribution
4 What is the change in whole-house ACH caused by taping over the transfer grilles What is the change in room-to-room uniformity of outside air distribution
5 What is the difference in whole-house ACH for a central-fan integrated supply ventilation system (CFIS) operating at 33 duty cycle compared to a continuous exhaust ventilation
8 of 49
Research Report - 0602
system with both systems meeting the ASHRAE 622 recommended minimum ventilation rate on average How does the resulting room-to-room uniformity of outside air distribution compare
6 How does the whole-house ACH and uniformity of outside air distribution change for a CFIS ventilation system when the ventilation rate is lowered from 100 of the ASHRAE 622 recommendation to 60 and to 33
7 How does the whole-house ACH and uniformity of outside air distribution change for the continuous exhaust ventilation system when the location of the exhaust port is changed from the utility room to the master bathroom
8 How uniform is the outside air distribution for the two-story house compared to the one-story house
Test Set-Up
Single-tracer gas decay with multi-zone sampling was used to evaluate the performance of each ventilation system based on how uniformly outside air was distributed to each room or zone within the house The decay curves demonstrate the rate at which the tracer gas (representing a pollutant) which is initially distributed uniformly throughout the house is diluted within each zone as a result of outside air that enters the zone directly as well as air that is exchanged among zones Air entering one zone from another may contain either a higher or lower concentration of the tracer than the air already in the zone This test method is designed as a practical method to evaluate the uniformity of ventilation air distribution within a home assuming that dangerous pollutants such as radon are controlled using appropriate source mitigation strategies Uniform distribution of outside air is required for dilution ventilation systems to provide predictable results independent of the geometry of individual homes
A multi-zone tracer gas sampling system was installed in each house for the test This equipment consisted of a Bruel and Kjaer model 1302 multi-gas monitor and a model 1303 multi-point sampler as shown in Figure 5 Sample tubes were placed in six locations in each house and attached to the multi-point sampler The six sampled locations are designated with red stars on the floor plans in Figures 3 and 4 The sampler was programmed to draw a sample from each sequential location at an interval of about 2 minutes thus all six locations were sampled at an interval of about 12 minutes
The air sample in each zone was taken near the center of the room at a height of four feet above the floor The zone air temperature was measured at the same location The local zone air temperature measurement was used to control the electric heater in each zone (see Test Procedure section below) to achieve a uniform and constant air temperature throughout the house Mixing fans were used to maintain uniform temperatures and concentrations within each room A photo of this set up is shown in Figure 6
9 of 49
Research Report - 0602
copy buildingsciencecom
Figure 5 Multi-zone tracer gas sampling and monitoring equipment
Mixing Fan
Heater
Temperature Sampling Location
Figure 6 Tracer gas sampling point temperature sensor room air mixing and co-heating set-up
The air flow rates for both supply and exhaust ventilation were carefully controlled during the test using a Duct Blaster fan and measurement system For exhaust ventilation the Duct Blaster fan was placed near the location of the ceiling exhaust fan and a length of flexible duct was used to connect the normal entrance for the exhaust fan to the Duct Blaster All of the air flowing through the exhaust fan during the test was first routed through the Duct Blaster The Duct Blaster speed control was adjusted to achieve the desired flow rate and the Duct Blaster flow ring and pressure tap were used to measure the air flow rate The exhaust fan itself was operated in
10 of 49
Research Report - 0602
conjunction with the duct blaster to reduce the resistance to air flow Figure 7 shows the Duct Blaster installed at the laundry room exhaust register
copy buildingsciencecom
Figure 7 Duct Blaster installed at the laundry room exhaust register
A similar application of the Duct Blaster was used to control and measure the supply air flow rate during the tests of the CFIS system The normal configuration of flexible duct connecting the air handler return to the outside was changed so that all outside air would flow through the Duct Blaster The flexible duct was disconnected from the air handler return and attached to the inlet to the Duct Blaster The Duct Blaster outlet duct was attached to the air handler return The Duct Blaster speed control was used to achieve the desired air flow rate and the Duct Blaster flow ring and pressure tap were used to measure the flow rate This installation is shown in Figure 8
Natural infiltration rates varied during the tests depending on weather conditions which were monitored using a portable weather station
It should be noted that the supply ventilation ducts in the test houses were not sized for the flow rates desired in the tests The ventilation flow rate measured during normal operation of the air handler in the 1-story house was about 10 cfm compared to 174 cfm required to meet the ASHRAE 622 recommendations This flow rate was also significantly less than the design flow rate of about 40-60 cfm It was necessary to operate the Duct Blaster fan at maximum power to achieve the required air flow rate during some tests It was unclear if the outside air duct was too long too small or too tortuous or if insufficient negative pressure was present at the return of the air handler because the central return grille was just a few inches away (see Figure 8)
11 of 49
Research Report - 0602
copy buildingsciencecom
Figure 8 Duct Blaster installed between the outside air duct and the return of the air handler to provide supply ventilation
Test Procedure
The tracer gas used was sulfur hexafluoride (SF6) a stable non-toxic gas that was injected into each house volume from a small compressed gas cylinder carried by hand around the house During the dosing period the furnace fan was used to achieve an initially well-mixed condition with a concentration of about 15 parts per million (PPM) During this period the doors were kept open and a portable de-stratification fan was used in the 2-story house to improve mixing between floors Then the mixing fans were stopped and the divergence in concentration from zone to zone was observed (with doors either open or closed depending on the test objective) Small portable fans in each zone continued running to maintain a well-mixed condition within each zone The interior air temperature in each zone was controlled during the test period using portable electric heaters instead of the furnace so that operation of the air handler could be controlled independently from the demand for heating At the conclusion of the test the whole house was again mixed by opening the doors and turning on the air handler This allowed the calculation of an average whole-house air change rate for each set of test conditions
The tests were planned for rather mild weather to minimize infiltration effects so as to isolate and test the performance of the mechanical ventilation systems The general design goal was to provide the minimum amount of mechanical ventilation recommended by ASHRAE Standard 622-2004 (ASHRAE 2004) (58 cfm for the 1-story house 63 cfm for the 2-story house) and observe the effects of providing central fan integrated supply versus single-point exhaust ventilation operating the central fan closing the bedroom doors and taping the transfer grilles above the doors
12 of 49
Research Report - 0602
The results of the multi-zone tracer gas decay tests are presented graphically as families of decay curves These graphs illustrate the uniformity or non-uniformity of the ventilation effect among the various rooms and allow ranking of the rooms from the least to the most ventilation effect
In addition if the ventilation rates were sufficiently steady for the duration of the test period we used local mean age-of-air analysis to evaluate the results more quantitatively Age-of-air analysis is a well-established approach to testing ventilation rates at various points or in various zones within a building (Grieve 1991) Age-of-air is defined as the average length of time that air molecules have resided within the building The formula for calculating local mean age-ofshyair in a tracer gas decay test is given in ASHRAE Standard 129-1997 (ASHRAE 1997) as follows
Ai = 1 intinfin
Ci (t)dt (1)C0 0
where
i = Index for measurement point representing a well-mixed zone Ai = Local mean age-of-air at point i (hr) C = Concentration of tracer gas (lbmft3) C0 = Initial value of C in well-mixed building (lbmft3) Ci = Time-varying concentration of tracer gas at point i (lbmft3) t = Time (hr)
In order to compare the ventilation rates among the rooms or zones in the home we use the metric Reciprocal Age-of-Air
Reciprocal Age-of-Air = 1Ai (2)
Reciprocal Age-of-Air has units of 1hr and is equivalent to the air change rate (ACH) in a single well-mixed zone (Persily 2000)
The definition of Ai in Equation (1) involves an integral of infinite duration This is handled in the test procedure through a two-step process
Step 1 The tracer gas decay test is continued until (a) the initial transient effects of interzonal airflow have subsided and all of the decay curves resemble simple exponential functions and (b) the tracer concentrations are rather small compared to their initial values so that any extrapolation errors will have a small effect on the result In this field test most of the multi-zone tests were continued for 12 hours These portions of the decay curves were integrated numerically using the trapezoid rule
13 of 49
Research Report - 0602
Step 2 The remaining portions (the tails) of the decay curves were extrapolated to infinity using a simple exponential decay function which was matched to the decay rate of the final portion of each measured decay curve These portions of the curves were integrated analytically
Once the conditions of Step 1 were satisfied the rooms were re-mixed by opening the bedroom doors and operating the air handler This allowed the calculation of an effective whole-house air change rate using the relationship in Equation 3
Average whole-house air change rate (ACH) = ln(C0Cf)∆t (3)
where
Cf = Concentration of tracer gas after rooms are re-mixed (lbmft3) ∆t = Elapsed time between initial and final well-mixed cases (hr)
Test Matrix
The series of test conditions for the 1-story and 2-story houses are described in Tables 2 and 3 Most of the important tests were conducted for a 12-hour period overnight to ensure sufficient accuracy when calculating reciprocal age-of-air
Table 2 Test sequence for 1-story test house
Central fan
cycling Duration Vent Vent flow (min off
Test Date Time (hrs) Config rate (cfm) min on) Doors Notes
A1 Dec 28 AM 3 Exhaust 58 none closed
A2 PM 3 Exhaust 58 2010 closed
A3 overnight 12 Exhaust 58 none closed A4 Dec 29 AM 4 Supply 104 33 2010 closed
duty cycle A5 PM 4 Supply 58 33 duty 2010 closed
cycle A6 overnight 12 Supply 174 33 2010 closed
duty cycle
A7 Dec 30 AM-PM 8 None 0 none open Natural infiltration
A8 PM 2 None 0 none open AH bump
A9 overnight 12 Exhaust 58 none open
A10 Dec 31 AM-PM 6 Exhaust 58 none closed Transfer grills taped
A11 PM 6 Exhaust 58 2010 closed Transfer grills taped
A12 Jan 1 overnight 12 Exhaust 58 2010 closed
A13 PM 6 Exhaust 58 2010 open
A14 overnight 12 Exhaust 58 54 none closed
A15 Jan 2 AM-PM 6 None 0 none closed Natural infiltration
A16 overnight 12 Exhaust 58 none closed Master bath exhaust
14 of 49
Research Report - 0602
Table 3 Test sequence for 2-story test house
Central fan
cycling Duration Vent Vent flow (min off
Test Date Time (hrs) Config rate (cfm) min on) Doors Notes B1 Jan 3 overnight 14 Exhaust 63 none closed
B2 Jan 4 PM 5 Supply 114 33 20 10 closed 60 ASHRAE 622 duty cycle
B3 overnight 11 Supply 180 33 20 10 closed 95 ASHRAE 622 duty cycle
B4 Jan 5 PM 4 Supply 63 33 duty 20 10 closed 33 ASHRAE 622 cycle
B5 overnight 13 Exhaust 63 5010 closed
B6 Jan 6 PM 6 Exhaust 63 2010 closed
B7 overnight 12 Exhaust 63 none closed Transfer grilles taped
B8 Jan 7 AM 4 Exhaust 63 50 10 closed Transfer grilles taped
B9 PM 4 Exhaust 63 none closed Transfer grilles taped extra injection in MBR
B10 PM 2 Exhaust 63 none open
B11 overnight 9 Supply 114 33 20 10 closed Transfer grilles taped duty cycle
B12 Jan 8 PM 3 None 0 100 closed Transfer grilles taped air handler bump test
B13 PM 2 None 0 100 closed Transfer grilles untaped
B14 PM 2 None 0 none open Natural infiltration
B15 overnight 9 Exhaust 63 none closed Master bath exhaust transfer grilles taped
B16 Jan 9 AM 4 Exhaust 63 50 10 closed Master bath exhaust
B17 PM 4 Supply 178 33 20 10 closed duty cycle
B18 overnight 12 Exhaust 63 none closed Master bath exhaust
TEST RESULTS FROM 1-STORY HOUSE (1111 MONTAGUE)
Natural Infiltration
A test of natural infiltration was conducted for an 8-hour period on December 30 to examine the magnitude and variability of outside air entering the house through leaks in the building envelope (Test A7) The tracer gas decay curves are shown in Figure 9 It is evident that the house was very well mixed during this test which allows a running instantaneous calculation of whole-house ACH over the same time period (see Figure 10) Although the air change rate indicated that the house is relatively tight (about 0085 ACH on average) the effect of natural infiltration was far from negligible especially when the wind was blowing This variability of natural infiltration must be kept in mind when interpreting the decay curves and reciprocal age-of-air calculations that follow
15 of 49
Research Report - 0602
An air handler bump test was performed between 1300 and 1500 hours to examine the effect of air handler operation on whole house air exchange rate including duct leakage to the outside and changes in room-to-room pressurization caused by moving air from the supply registers in each room to the central return in the main living area Figure 10 shows both the hourly average ACH and the wind speed during this period At first glance it appears that the air change rate increased by about 003 ACH when the fan was turned on but there was a coincident jump in wind speed that complicates this interpretation There was no corresponding decrease in ACH when the air handler was turned off at 1500 hours Ultimately we cannot conclusively quantify the change in ACH associated with operation of the air handler but it appears to have been no more than 003 ACH
3
Co
ncen
trati
on
(m
gm
)
70
60
50
40
30
20
10
0
Living
Entry
BR1
BR2
BR3
MBR
Air Handler On
Air Handler Off
8 9 10 11 12 13 14 15 16 17 18
Hour
Figure 9 Tracer gas decay for 1-story house with no ventilation and bedroom doors open with and without central fan operation (Test A7)
16 of 49
Research Report - 0602
40016
35014 Air Handler On Air Handler Off
ACH
Wind Speed
Air
Ch
an
ge
Ra
te (
AC
H) 30012
25010
20008
15006
10004
Win
d S
pe
ed
(m
ph
)
002 05
00
8 10 12 14 16 18
000
Hour
Figure 10 Average air change rate for 1-story house with no ventilation no central fan operation and bedroom doors open (Test A7)
The natural ventilation test was repeated on January 2 with the doors closed instead of open (Test A15) providing the decay curves shown in Figure 11 The average air change rate for this case was 0086 ACH calculated based on the two well-mixed cases at the beginning and end of the test It is difficult to compare this number with the doors-open case because it was windy (4-5 mph) for the first few hours of this test However it is very clear that the uniformity of room-toshyroom distribution of outside air was significantly less when the doors were closed even with transfer grilles We did not calculate age-of-air for this test because the test conditions were not sufficiently steady state This fact is very evident at about hour 15 where the BR2 and BR3 curves suddenly begin to diverge from the MBR curve
17 of 49
Research Report - 0602
0
10
20
30
40
50
60
70
80
90
Co
ncen
trati
on
(m
gm
3 )
Living
Entry
BR1
BR2
BR3
MBR
Mixing stopped
Mixing restarted
10 11 12 13 14 15 16 17 18 19
Hour
Figure 11 Tracer gas decay for 1-story house with no ventilation no central fan operation and bedroom doors closed (Test A15)
Distributed Supply vs Point Exhaust Ventilation
Two of the most common ventilation schemes in Building America homes are continuous single-point exhaust ventilation and intermittent central-fan integrated supply (CFIS) ventilation Exhaust ventilation is most commonly installed in a bathroom laundry room or utility room Make-up air enters through the cracks and holes in the building envelope upon depressurization of the house The distribution of outside air in a given room is fairly unpredictable because it depends on the amount of depressurization in the room the number and size of openings in exterior walls and the influence of adjacent rooms Supply ventilation provided by a central-fan integrated system tends to be distributed more uniformly throughout the house However the fan is usually operated on a duty cycle of about 33 to limit the electricity used by the central fan and one of the goals of this testing is to evaluate the effect of that duty cycle on the consistency of the air mixing
The decay curves for a 12-hour overnight test with exhaust ventilation (Test A3) are shown in Figure 12 The exhaust fan register in the laundry room was used as the exhaust point and the Duct Blaster was used to exhaust 58 cfm continuously corresponding to the minimum ventilation rate recommended by ASHRAE for a 2075 ft2 4-bedroom house It is evident from the decay curves that significantly more outside air reached the master bedroom and less reached Bedroom 2 compared to the other rooms in the house
18 of 49
Research Report - 0602
0
2
4
6
8
10
12
14
Co
nc
en
tra
tio
n
mg
m3
Living
Entry
BR1
BR2
BR3
MBR
Mixing stopped
Mixing restarted
17 18 19 20 21 22 23 0 1 2 3 4 5 6
Hour
Figure 12 Tracer gas decay for 1-story house with exhaust ventilation from the laundry room at ASHRAE 622 level no central fan operation and bedroom doors closed (Test A3)
The corresponding decay curves for the central fan integrated supply system (Test A6) are shown in Figure 13 The air handler operated at a 33 duty cycle (20 min off 10 min on) with a ventilation rate of 174 cfm resulting in an average ventilation rate of 58 cfm again meeting the minimum ASHRAE 622 recommendations The whole house appeared to be well-mixed in this case because the decay curves were clustered together throughout the test Even during the 20 minute periods when the air handler was off there was very little divergence A comparison of Figure 12 to Figure 13 indicates that much more uniform distribution of ventilation air was achieved by using the CFIS system
19 of 49
Research Report - 0602
0
2
4
6
8
10
12
14
16
Co
nc
en
trati
on
(m
gm
3 )
Living
Entry
BR1
BR2
BR3
MBR
Mixing stopped
Mixing restarted
185 195 205 215 225 235 05 15 25 35 45 55 65
Hour
Figure 13 Tracer gas decay for 1-story house with supply ventilation at ASHRAE 622 level 33 central fan operation (20 min off 10 min on) and bedroom doors closed (Test
A6)
Reciprocal age-of-air calculations were performed to provide a quantitative comparison of the two ventilation systems as shown in Figure 14 Values were in the range of 0169 hr-1 +0042shy0038 hr-1 for the exhaust ventilation system compared to 0173 hr-1 +0002-0003 hr-1 for the supply ventilation system expressed in terms of the range of differences between the reciprocal age-of-air in each room and the whole-house air change rate With the exhaust ventilation at the laundry room the master bedroom received the greatest amount of fresh air We suspect this may have been caused by the presence of the exhaust ducts used for spot ventilation of the master bathroom possibly providing greater leakage area near the master bathroom than is present in other areas of the house The supply system distributed the ventilation air more uniformly but it is not entirely clear whether this result was primarily caused by the introduction of ventilation air through the supply ducts or by the air handler mixing air throughout the house Since it is clear that the exhaust ventilation showed better uniformity of ventilation with central system mixing it follows that mixing is likely to be the primary factor in the room-to-room uniformity shown by CFIS ventilation
It is also noteworthy that the average net air change rates provided by both the supply and exhaust ventilation systems were only about 018 ACH compared to the 025 ACH that would be expected if the mechanical ventilation rate (017 ACH) and the natural infiltration rate (008 ACH) were additive as they might be with a balanced ventilation system Adding mechanical ventilation to natural infiltration in quadrature results in an estimated average air change rate of 019 ACH which is fairly consistent with the measured values
20 of 49
Research Report - 0602
Recip
rocal
Ag
e o
f A
ir (
1h
r) 025
020
015
010
005
000
Simple Exhaust vs Central Fan Integrated
Supply
Centralized supply mixing
33 duty cycle 100
ASHRAE doors closed
Living
Entry
BR1
BR2
BR3
MBR
Exhaust in utility room no
mixing 100 ASHRAE
doors closed
Figure 14 Reciprocal age-of-air for 1-story house with continuous exhaust ventilation (Test A3) compared to central fan integrated supply ventilation (Test A6)
Air Handler Operation
To determine how much room-to-room mixing was caused by the air handler the exhaust only test was re-run with the air handler operating at 33 duty cycle (20 min off 10 min on) (Test A12) The decay curves are shown in Figure 15 Compared to Test A3 (Figure 12) there was a noticeable increase in uniformity when the air handler was operating even though the entry points for the ventilation air were uncontrolled As shown in Figure 16 the range of reciprocal age of air was reduced from +0042-0038 hr-1 to +0019-0011 hr-1) It appears that operation of the air handler explains most of the difference between the supply and exhaust ventilation systems discussed earlier Although it also appears that the overall average air change rate was higher in the case where the air handler was operating (0216 ACH vs 0176) it should be noted that the average wind speed was also significantly higher It is likely that the wind speed was the primary cause of the difference in average ACH not a difference in the mechanical ventilation rate
21 of 49
Research Report - 0602
0
5
10
15
20
25
30
35
Co
nce
ntr
ati
on
(m
gm
3 )
Living
Entry
BR1
BR2
BR3
MBR
Mixing stopped
Mixing restarted
0 1 2 3 4 5 6 7 8 9 10 11 12 13 14
Hour
Figure 15 Tracer gas decay for 1-story house with continuous exhaust ventilation at ASHRAE 622 level 33 central fan operation (20 min off 10 min on) and bedroom
doors closed (Test A12)
Exhaust Ventilation No Mixing vs 33 Air Handler Duty Cycle
000
005
010
015
020
025
Recip
rocal A
ge o
f A
ir (
1h
r)
Living
Entry
BR1
BR2
BR3
MBR
Exhaust in utility room 33 air handler
no mixing 100 operation exhaust in
ASHRAE doors closed utility room 100
ASHRAE doors closed
Figure 16 Reciprocal age-of-air for 1-story house with continuous exhaust ventilation with and without air handler operation (Tests A3 and A12)
22 of 49
Research Report - 0602
Exhaust Location
The preceding analysis of exhaust ventilation was based on an exhaust point in the laundry room which was relatively centrally located in the 1-story house To examine the effect of moving the exhaust point the duct blaster was moved to the master bathroom which was located in a far corner of the house (Test A16) A continuous exhaust ventilation rate of 58 cfm was again applied to the house resulting in the tracer gas decay curve shown in Figure 17 It is difficult to visually identify a significant difference between this series of curves and those shown in Figure 12 for the laundry room exhaust location
Because the curves were steady it is again possible to compare the results based on reciprocal age-of-air as shown in Figure 18 There appeared to be very little change in the distribution of outside air to most rooms However the reciprocal age-of-air in the master bedroom dropped noticeably when the exhaust location was moved to the master bathroom probably because a greater fraction of the outside air now passed through other rooms before reaching the master bedroom With the exhaust point centrally located most of the ventilation air passing through the master bedroom probably entered from the outside In both cases however the master bedroom had the highest reciprocal age-of-air of all of the rooms in the house and the BR2 location had the lowest
Co
nc
en
tra
tio
n (
mg
m3)
40
35
30
25
20
15
10
5
0
Living
Entry
BR1
BR2
BR3
MBR
Mixing stopped
Mixing restarted
19 20 21 22 23 0 1 2 3 4 5 6 7 8
Hour
Figure 17 Tracer gas decay for 1-story house with exhaust ventilation from the master bathroom at ASHRAE 622 level no central fan operation and bedroom doors closed (Test
A16)
23 of 49
Research Report - 0602
Exhaust Ventilation
Laundry Room vs Master Bathroom
000
005
010
015
020
025
Exhaust in laundry
room no mixing 100
ASHRAE doors closed
Exhaust in master
bathroom no mixing
100 ASHRAE doors
closed
Re
cip
roc
al A
ge
of
Air
(1
hr)
Living
Entry
BR1
BR2
BR3
MBR
Figure 18 Reciprocal age-of-air for 1-story house with exhaust ventilation from the master bathroom compared to the laundry room at ASHRAE 622 level no central fan operation
and bedroom doors closed (Tests A3 and A16)
Ventilation Rate
The supply ventilation test was repeated using flow rates corresponding to 60 and 33 of the ASHRAE recommendations The intent of this series of tests was to evaluate the room-to-room ventilation uniformity for ventilation rates consistent with ASHRAE 622 compared to the uniformity for reduced mechanical ventilation rates Each test was conducted for only 4 hours because of time limitations The decay curves are shown in Figures 19 and 20 Because the rooms were well-mixed during the supply ventilation tests the average whole-house ACH can be compared directly to the reciprocal age-of-air for the exhaust ventilation tests Figure 21 shows the supply ventilation air change rate for each of the three ventilation levels (33 60 100) compared to room-by-room reciprocal age-of-air for the exhaust ventilation system based on the boundary conditions present during the tests It appears that in the supply ventilation case all rooms receive more outside air than the least-ventilated room in the exhaust case (BR2) even at 60 of ASHRAE 622 These results serve to illustrate the trade-off between whole-house ventilation rate and room-to-room ventilation uniformity in terms of their impact on the worst room(s)
24 of 49
Research Report - 0602
The ASHRAE 622 committee has not currently defined the level of mixing that is required when choosing the minimum ventilation rate Some might interpret the results of this test to suggest that a house without mixing can have individual rooms that do not receive sufficient outside air even though the ventilation system is operating at 622 specified rates Because the 622 committee has not specified the level of mixing that is required when choosing the minimum ventilation rate the ventilation rate required by different ventilation systems is open to interpretation For example if the exhaust system performance shown in Figure 21 is acceptable does this mean that a ventilation system that provides good distribution of outside air may be sufficiently well-ventilated at 60 of the ASHRAE 622 level or perhaps even less Alternatively it might be concluded that exhaust ventilation rates should be increased over current ASHRAE 622 recommendations because of the possibility that certain rooms may receive very little fresh air Unfortunately because the current 622 standard does not specify air mixing requirements and the committeersquos assumptions about ventilation air distribution are not well documented it is difficult to make any firm recommendations in this area However we can conclude that air mixing is required for dilution ventilation systems to provide predictable results independent of the geometry of individual homes
8 9 10 11 12 13 14
Hour
Figure 19 Tracer gas decay for 1-story house with supply ventilation at 60 of ASHRAE 622 level 33 central fan operation (20 min off 10 min on) and bedroom doors closed
(Test A4)
0
10
20
30
40
50
60
Co
nce
ntr
ati
on
m
gm
3
Living
Entry
BR1
BR2
BR3
MBR
Mixing stopped
Mixing restarted
25 of 49
Research Report - 0602
0
5
10
15
20
25
30
Co
nce
ntr
ati
on
(m
gm
3 )
Living
Entry
BR1
BR2
BR3
MBR
Mixing stopped
Mixing restarted
12 13 14 15 16 17 18 19 20
Hour
Figure 20 Tracer gas decay for 1-story house with supply ventilation at 33 of ASHRAE 622 level 33 central fan operation (20 min off 10 min on) and bedroom doors closed
(Test A5)
Simple Exhaust vs Central Fan Integrated
Supply with Lower Ventilation Rates
025
Re
cip
roc
al A
ge
of
Air
(1
hr)
Well Mixed
100
ASHRAE 60
ASHRAE 33
ASHRAE Living Entry 010 Natural
BR1 Infilt
BR2 BR3 005
MBR
Exhaust in laundry room no
000
Central supply Natural infil-
mixing 100 ASHRAE doors mixing 33 duty tration doors
closed cycle doors closed open
Figure 21 Reciprocal age-of-air for 1-story house with supply ventilation at 33 60 and 100 of ASHRAE 622 level (Tests A5 A4 A6) compared to exhaust ventilation with
no central fan operation (Test A3) Bedroom doors were closed
020
015
26 of 49
Research Report - 0602
Simulations by Walker (2006) have shown that all systems will not provide the same service in terms of annual average air change rate For the same air flow rate and duty cycle balanced ventilation will yield a higher average air exchange than supply ventilation and supply ventilation will yield a higher average air exchange than exhaust ventilation That can be explained in general terms by understanding that wind and stack effects act to depressurize a building most of the time Exhaust fans increase the building depressurization further but supply fans decrease the depressurization Balanced fans donrsquot change the enclosure differential pressure and air flow at all Because of the non-linear relationship between differential pressure and air flows across the building enclosure a supply fan changes the pressures across the enclosure less than an exhaust fan acting more like a balanced fan The result is that the effect on ventilation air change rate from a supply fan is somewhere between that of an exhaust fan and a true balanced system
Bedroom Doors
Except for the natural ventilation test the preceding tests were all conducted with the bedroom doors closed to simulate a worst-case situation for air circulation within the house The exhaust ventilation test was repeated with the bedroom doors open (Test A9) producing the tracer gas decay curve shown in Figure 22 It is evident that the decay curves were much more tightly bundled with the doors open than they were with the doors closed (compare Figure 12) A comparison based on reciprocal age-of-air is shown in Figure 23 A significant improvement in room-to-room mixing is evident during the open-door test
It is also evident that the average air change rate was higher when the doors were open (0202 vs 0176 ACH) but it must be remembered that the ventilation rate was controlled using a duct blaster and average wind speed was higher during the open-door test period compared to the closed-door test period (20 mph compared to 06 mph) Therefore this test alone does not necessarily indicate that closing doors reduces the average air change rate associated with an exhaust system In future tests continuous measurement of the depressurization of the house with respect to outside along with single-point pressure measurements across interior doors would provide more information about the effect of closing doors when exhaust ventilation systems are used It would also be valuable to conduct this test during steady weather conditions using the exhaust fan (with uncontrolled ventilation rate) instead of the duct blaster to observe the net effect of closed doors on whole-house air change rate
27 of 49
Research Report - 0602
0
5
10
15
20
25
30
Co
ncen
trati
on
(m
gm
3 )
Living
Entry
BR1
BR2
BR3
MBR
Mixing stopped
Mixing restarted
181 191 201 211 221 231 01 11 21 31 41 51 61 71
Hour
Figure 22 Tracer gas decay for 1-story house with exhaust ventilation from the laundry room at ASHRAE 622 level no central fan operation and bedroom doors open (Test A9)
Exhaust Ventilation
Doors Closed vs Doors Open
000
005
010
015
020
025
Re
cip
roc
al
Ag
e o
f A
ir (
1h
r)
Living
Entry
BR1
BR2
BR3
MBR
Exhaust in laundry room Doors open no mixing
no mixing 100 exhaust in laundry room
ASHRAE doors closed 100 ASHRAE
Figure 23 Reciprocal age-of-air for 1-story house with exhaust ventilation from the laundry room at ASHRAE 622 level no central fan operation In the first case the bedroom doors were closed (Test A3) in the second the doors were open (Test A9)
28 of 49
Research Report - 0602
Transfer Grilles
Because the test houses used central returns instead of hard ducted returns in the bedrooms transfer grilles were installed over the bedroom doors to provide a flow path for return air without excessive room pressurization when the doors were closed These transfer grilles also allowed ventilation air to pass more freely from the bedrooms to the main living space The effect of transfer grilles on ventilation air distribution was evaluated by taping over the grilles (see Figure 24) and re-running the exhaust ventilation test (Test A10) The corresponding tracer gas decay curve is shown in Figure 25 and the reciprocal age-of-air analysis is shown in Figure 26 Taping the transfer grilles did not appear to significantly affect the room-to-room variability in ventilation rate although there appeared to be some slight re-ranking of rooms from highest to lowest reciprocal age-of-air It should be noted that there was an increase in average wind speed from 26 mph to 41 mph starting at 1 pm including a half hour period where the average wind speed was 7 mph This weather effect produced noticeable kinks in the decay curves and therefore would be expected to introduce significant errors into the reciprocal age-of-air results
Itrsquos possible that the transfer grilles played a much smaller role in providing a path for ventilation air than the supply ducts Because the air handler was not operating the ducts were not pressurized and were thus available as passive airflow conduits The resistance to air flow was probably smaller for the air ducts than for the transfer grilles depending on their size and the number of supply registers in each bedroom The existing door undercuts are also thought to have played a role The effect of ducts and door undercuts can be tested in the future by running separate tests with ducts and door undercuts taped over
copy buildingsciencecom
Figure 24 Transfer grilles over bedroom doors taped closed
29 of 49
Research Report - 0602
0
10
20
30
40
50
60
70
Co
nc
en
tra
tio
n (
mg
m3 )
Living
Entry
BR1
BR2
BR3
MBR
Mixing stopped
Mixing restarted
8 9 10 11 12 13 14 15 16 17
Hour
Figure 25 Tracer gas decay for 1-story house with exhaust ventilation from the laundry room at ASHRAE 622 level no central fan operation bedroom doors closed and transfer
grilles taped (Test A10)
Exhaust Ventilation
000
005
010
015
020
025
Re
cip
roc
al
Ag
e o
f A
ir (
1h
r)
Living
Entry
BR1
BR2
BR3
MBR
Transfer Grilles Untaped vs Taped
Exhaust in laundry room no Exhaust in laundry room no
mixing 100 ASHRAE mixing 100 ASHRAE
doors closed doors closed transfer
grilles taped
Figure 26 Reciprocal age-of-air for 1-story house with exhaust ventilation from the laundry room at ASHRAE 622 level no central fan operation and doors closed In the
30 of 49
Research Report - 0602
first case the transfer grilles are untaped (Test A3) in the second they are taped closed (Test A10)
Minimum Test Duration
We were fortunate that DR Horton provided two full weeks of access to these homes to conduct this series of tests which allowed us to run some of the more important tracer gas decay tests as long as 12 hours to help ensure that we could accurately calculate reciprocal age-of-air In most cases test houses would not be available for such a long time period To evaluate the length of time needed to estimate the reciprocal age-of-air with reasonable accuracy we examined the results that we would have obtained for one of the exhaust ventilation tests had we halted the test period after less than 12 hours For the supply ventilation tests the rooms were sufficiently well-mixed that the test could have been stopped after 3 or 4 hours assuming weather effects were steady
The reciprocal age-of-air calculations for the exhaust ventilation decay curves (Test A3 see Figure 12) based on test durations of 3 6 9 and 12 hours are shown in Figure 27 These test durations range from 053 to 21 air changes based on the average air change rate of 018 ACH (56 hours per air change) calculated for this test The ratio of highest to lowest reciprocal ageshyof-air is shown above the data points for each case These results suggest that shorter tests tend to overestimate the range and that perhaps 1frac12-2 air changes (roughly 9 to 12 hours in this case) may be necessary to obtain accurate calculations of reciprocal age-of-air when there is significant divergence among rooms From a qualitative standpoint one air change may be sufficient to determine the basic trend Without knowing in advance what mixing pattern will occur it is difficult to recommend a minimum test duration But assuming this test is fairly representative of a worst-case scenario a minimum of 15 air changes would be necessary to have a high degree of confidence in the quantitative difference in reciprocal age-of-air among rooms
31 of 49
Research Report - 0602
000
005
010
015
020
025
030
035
Re
cip
roc
al
Ag
e-O
f-A
ir (
hr-1
)
Living
Entry
BR1
BR2
BR3
MBR HighLow = 297
HighLow = 168 HighLow = 184 HighLow = 161
3-hour Test 6-hour Test 9-hour Test 12-hour Test
(053 Air Changes) (11 Air Changes) (16 Air Changes) (21 Air Changes)
Test Duration
Figure 27 Reciprocal age-of-air based on alternate test durations for 1-story house with exhaust ventilation from the laundry room at ASHRAE 622 level no central fan operation
and doors closed (Test A3) Average air change rate was 018 ACH
TEST RESULTS FROM 2-STORY HOUSE (1117 MONTAGUE)
The 2-story house was tested from January 3-10 2006 Three zones were selected on the first floor and three more were selected on the second floor as indicated by the red stars in Figure 4 The initial mixing of air among the rooms at the start of each test in this 2-story house was not as thorough as it was in the 1-story house Evidently the combined effects of the air handler and the portable de-stratification fan were not sufficient to overcome upward transport of tracer gas driven by the stack effect from the first to the second floor The resulting difference in initial tracer gas concentration among the rooms was about 5-10 This outcome emphasizes the significant effect of stack-driven infiltration on ventilation non-uniformity in multi-story homes Because our test method and equipment did not achieve a well-mixed condition at the start of each test there were some errors introduced into the reciprocal age-of-air analysis For future tests we would recommend larger de-stratification fans to obtain more well-mixed conditions in multi-story houses
Typical errors introduced by incomplete mixing of the tracer gas at the start of such a test were analyzed by examining two hypothetical cases where either all of the air entering a room comes from the outside or all of the air comes from an adjacent room with a different starting concentration If all of the air entering a space comes from the outside then a change in the initial concentration would have no effect on the reciprocal age-of-air because the decay curve would be exponential from the start and the area under the curve would be normalized based on
32 of 49
Research Report - 0602
the starting concentration in that zone However if the air entering a room passes through another room with a lower initial concentration the room receiving the air will have a lower concentration of tracer gas throughout the test compared to what the concentration would have been if the starting points were the same in both rooms This case is illustrated in Figure 28 where assumptions are made that the rooms are the same size the air exchange rate is 01 ACH for both rooms and the initial tracer gas concentration is 10 lower in the first room (upstream) than it is in the second room
The effect on reciprocal age-of-air is shown in Figure 29 A 10 difference in starting concentration results in an error of about 75 in reciprocal age-of-air for a room downstream of a room with a lower starting concentration assuming 01 ACH for both rooms The error would be somewhat smaller (about 5) if the air change rate was higher for both rooms (02 ACH) There would be no error introduced for rooms where all of the air infiltration comes from the outside Although the amount of error in the reciprocal age-of-air calculations can be affected by additional variables not examined here we feel that these percentages are reasonable estimates of the errors in our results for the 2-story house due to incomplete initial mixing of air
In each case an engineering judgment must be made regarding the significance of the error introduced by incomplete initial mixing As a general rule the differences in concentration at the start of the test should be small compared to the differences that are being measured in order for the results to be considered valid
Figure 28 Theoretical decay curves for a well-mixed case with uniform tracer gas concentration compared to a case where the upstream room starts with a concentration
10 lower than the downstream room
33 of 49
Research Report - 0602
Figure 29 Theoretical reciprocal age-of-air for a well-mixed case with uniform tracer gas concentration compared to a case where the upstream room starts with a concentration
10 lower than the downstream room
Natural Infiltration and Duct Leakage
A natural infiltration test was performed over a two hour period on the evening of January 8 (Test B14) The tracer gas decay curves are shown in Figure 30 There was a slight divergence between the first floor and second floor once the air handler was turned off but the rooms on each floor appeared to remain fairly well-mixed The average air change rate during the test period was about 011 ACH which was somewhat higher than the 1-story house as might be expected with an increased stack height
An air handler bedroom door bump test was conducted just prior to the test period shown in Figure 30 allowing observation of the combined effect of duct leakage to the outside and increased infiltration caused by room pressurization The average air change rate during that bump test was 013 ACH suggesting that closing doors and operating the fan added approximately 002 ACH to the whole-house average air change rate The average wind speed was a bit higher while the air handler was running (17 mph compared to 05 mph) so the effect of air handler operation may actually be somewhat less than the average ACH numbers indicate
34 of 49
Research Report - 0602
0
1
2
3
4
SF
6 C
on
ce
ntr
ati
on
(m
gm
3)
BR1
Living
Kitchen
BR2
BR3
MBR
Mixing stopped
Mixing restarted
1814 1843 1912 1940 2009 2038 2107 2136
Hour
Figure 30 Tracer gas decay for 2-story house with no ventilation no central fan operation and bedroom doors open (Test B14)
Distributed Supply vs Point Exhaust Ventilation
A 14-hour test (Test B1) was performed with an exhaust ventilation rate of 63 cfm in the laundry room which was located near the stairwell in the middle of the first floor The ventilation rate was again consistent with the ASHRAE 622 recommendations The tracer gas decay curves are shown in Figure 31 It is interesting that all three second floor rooms showed a delay before entering an exponential decay suggesting that some amount of air was moving from the first floor to the second floor even though the mechanical exhaust point was on the first floor It appears that the further depressurization of the first floor was insufficient to overcome the stack effect and draw a significant amount of outside air in through the rooms on the second floor
35 of 49
Research Report - 0602
182
9
192
9
202
9
212
9
222
9
232
9
029
129
229
329
429
529
629
729
828
929
102
8
112
8
122
8
0
10
20
30
40
50
60
70
SF
6 C
on
ce
ntr
ati
on
(m
gm
3)
BR1
Living
Kitchen
BR2
BR3
MBR
Mixing stopped
Mixing restarted
Hour
Figure 31 Tracer gas decay for 2-story house with exhaust ventilation from the laundry room at ASHRAE 622 level no central fan operation and bedroom doors closed (Test B1)
A supply ventilation test was performed on the 2-story house for about 11 hours starting late on January 4 (Test B3) The duct blaster was unable to provide the ventilation rate necessary to meet the minimum specified in ASHRAE 622 supplying 180 cfm instead of 189 cfm (95) The decay curves are shown in Figure 32 Although the curves are much more tightly packed than they were with the exhaust system there is more divergence than we saw with the supply system in the 1-story house most notably in the master bedroom
The reciprocal age-of-air calculations for both the exhaust and supply ventilation systems are shown in Figure 33 Again the results indicate that much better room-to-room distribution of ventilation air was achieved by the central-fan integrated supply system compared to the single-point exhaust system However for the supply ventilation test the differences in the initial tracer gas concentration were of the same magnitude as the differences in decay rates among the rooms As a result no conclusions should be drawn about the relative ranking of the supply ventilation rate among rooms based on Figure 33
36 of 49
Research Report - 0602
0
10
20
30
40
50
60
SF
6 C
on
ce
ntr
ati
on
(m
gm
3)
BR1
Living
Kitchen
BR2
BR3
MBR
Mixing stopped
Mixing restarted
2136 000 224 448 712 936 1200
Hour
Figure 32 Tracer gas decay for 2-story house with supply ventilation just under ASHRAE 622 level central fan operation at 33 duty cycle (20 min off 10 min on) and bedroom
doors closed (Test B3)
Simple Exhaust vs Central Fan Integrated
Supply )
000
005
010
015
020
025
Recip
rocal A
ge o
f A
ir (
1h
r
BR1
Living
Kitchen
BR2
BR3
MBR
Exhaust in laundry room no Centralized supply mixing
mixing 100 ASHRAE 33 duty cycle 95
doors closed ASHRAE doors closed
Figure 33 Reciprocal age-of-air for 2-story house with continuous exhaust ventilation (Test B1) compared to central fan integrated supply ventilation (Test B3) (Note
Uncertainties introduced by non-uniform starting concentration are of the same order of magnitude as the differences in reciprocal age-of-air among rooms for the supply ventilation case The relative ranking of rooms is not meaningful for that case)
37 of 49
Research Report - 0602
Air Handler Operation
The effect of occasional air handler operation on the distribution of exhaust ventilation air was evaluated on the afternoon of January 6 (Test B6) The tracer gas decay curves are shown in Figure 34 and reciprocal age-of-air calculations are shown in Figure 35 It should again be noted that before the test started the house was mixed using both the air handler and a de-stratification fan with the doors open During the test the doors were closed the de-stratification fan was turned off and the air handler operated at a 33 duty cycle (20 minutes off 10 minutes on) As was the case in the 1-story house this occasional operation of the air handler substantially improved the distribution of ventilation air among rooms even in conjunction with the point exhaust ventilation system There was very little divergence noticeable even with the air handler cycling on and off every half hour However because the initial differences in tracer gas concentration among rooms were as large as the differences in reciprocal age-of-air for the case with air handler operation no conclusions should be drawn about the relative ranking of ventilation rates among the rooms for that case
SF
6 C
on
cen
trati
on
(m
gm
3)
80
70
60
50
40
30
20
10
0
BR1
Living
Kitchen
BR2
BR3
MBR
Mixing stopped
Mixing restarted
1048 1200 1312 1424 1536 1648 1800 1912 2024
Hour
Figure 34 Tracer gas decay for 2-story house with continuous exhaust ventilation at ASHRAE 622 level central fan operation at 33 duty cycle (20 min off 10 min on) and
bedroom doors closed (Test B6)
38 of 49
Research Report - 0602
020
015 R
ec
ipro
ca
l A
ge
of
Air
(1
hr)
Exhaust Ventilation
No Mixing vs 33 Air Handler Duty Cycle
Exhaust in laundry room
no mixing 100
ASHRAE doors closed
33 air handler
operation exhaust in
laundry room 100
ASHRAE doors closed
BR1
Living
Kitchen
BR2
BR3
MBR
010
005
000
Figure 35 Reciprocal age-of-air for 2-story house with continuous exhaust ventilation with and without air handler operation (Tests B1 and B6) (Note Uncertainties introduced by non-uniform starting concentration are of the same order of magnitude as the differences in reciprocal age-of-air among rooms for the case with air handler operation The relative
ranking of rooms is not meaningful for that case)
Exhaust Location
The duct blaster was moved to the master bathroom exhaust register to see if there was a resulting change in ventilation air distribution (Test B18) The master bathroom was in the back of the house on the second floor between the master bedroom and bedroom 3 The decay curves are shown in Figure 36 and the reciprocal age-of-air results are shown in Figure 37 The rooms on each floor were well mixed before the test began although the mixing between the two floors was not as good Very wide divergence among rooms can be seen during the test especially between the upstairs bedrooms and the rest of the house Once again all three upstairs rooms appear to receive some air from the first floor but the master bedroom experiences a much higher volume of circulated air than the other two second-floor bedrooms which appear to be relatively stagnant
39 of 49
Research Report - 0602
0
10
20
30
40
50
60
70
80
90
SF
6 C
on
ce
ntr
ati
on
(m
gm
3)
BR1
Living
Kitchen
BR2
BR3
MBR
Mixing stopped
Mixing restarted
1912 2136 000 224 448 712 936 1200
Hour
Figure 36 Tracer gas decay for 2-story house with exhaust ventilation from the master bathroom at ASHRAE 622 level no central fan operation and bedroom doors closed (Test
B18)
Exhaust Ventilation
Laundry Room vs Master Bathroom
000
005
010
015
020
025
030
Exhaust in laundry room no
mixing 100 ASHRAE
doors closed
Exhaust in master bathroom
no mixing 100 ASHRAE
doors closed
Re
cip
roc
al A
ge
of
Air
(1
hr)
BR1
Living
Kitchen
BR2
BR3
MBR
Figure 37 Reciprocal age-of-air for 2-story house with exhaust ventilation from the master bathroom compared to the laundry room at ASHRAE 622 level no central fan operation
and bedroom doors closed (Tests B1 and B18)
40 of 49
Research Report - 0602
Ventilation Rate
The supply ventilation tests were repeated using flow rates of 60 and 33 of ASHRAE 622 recommendations corresponding to 114 cfm and 63 cfm respectively (Tests B2 and B4) The decay curves are shown in Figures 38 and 39 Reciprocal age-of-air for all three supply ventilation rates are shown in Figure 40 In all cases the rooms remained fairly well mixed especially rooms on the same floor As we observed in the 1-story house the ventilation rate in the 2-story house appeared to have very little effect on the uniformity of outside air provided to each room as long as it was mixed using the air handler One again the initial differences in tracer gas concentration among rooms were as large as the divergence in the decay curves preventing any conclusions about the relative ranking of ventilation rates among rooms for all three cases The error in initial concentration uniformity was bigger for the cases with air handler mixing because the relative divergence in the decay curves was so small compared to that of no air handler mixing In other words the error in relative ranking of ventilation rates for the cases with air handler mixing were not very important anyway because the relative differences between rooms were so small
1536 1648 1800 1912 2024 2136 2248
Hour
Figure 38 Tracer gas decay for 2-story house with supply ventilation at 60 of ASHRAE 622 level 33 central fan operation (20 min off 10 min on) and bedroom doors closed
(Test B2)
0
5
10
15
20
25
30
SF
6 C
on
cen
trati
on
(m
gm
3)
BR1 Living Kitchen BR2 BR3 MBR
Mixing stopped
Mixing restarted
41 of 49
Research Report - 0602
0
5
10
15
20
25
30
35
40
SF
6 C
on
cen
trati
on
(m
gm
3)
BR1
Living
Kitchen
BR2
BR3
MBR
Mixing stopped
Mixing restarted
1200 1312 1424 1536 1648 1800 1912
Hour
Figure 39 Tracer gas decay for 2-story house with supply ventilation at 33 of ASHRAE 622 level 33 central fan operation (20 min off 10 min on) and bedroom doors closed
(Test B4)
Supply Ventilation Rate Comparison
000
005
010
015
020
025
Re
cip
roc
al
Ag
e o
f A
ir (
1h
r)
BR1
Living
Kitchen
BR2
BR3
MBR
Centralized supply Centralized supply Centralized supply
mixing 33 duty mixing 33 duty mixing 33 duty
cycle 95 ASHRAE cycle 60 ASHRAE cycle 33 ASHRAE
doors closed doors closed doors closed
Figure 40 Reciprocal age-of-air for 2-story house with three levels of supply ventilation central fan operation at 33 duty cycle (20 min off 10 min on) and bedroom doors closed (Tests B3 B2 B4) (Note Uncertainties introduced by non-uniform starting
concentration are of the same order of magnitude as the differences in reciprocal age-of-air among rooms for all three cases The relative ranking of rooms is not meaningful for these
cases)
42 of 49
Research Report - 0602
The average air change rates for the three supply ventilation rates compared to the two exhaust ventilation schemes are shown in Figure 41 The CFIS system at 33 of the 622 ventilation flow rate provided a uniformly higher air change rate (013 ach) than the least ventilated rooms using exhaust ventilation from either the laundry or the master bathroom (010 ach Figure 37) It is noteworthy that the combined net air change rate with exhaust ventilation from the laundry room was significantly less than the air change rates for both exhaust ventilation from the master bathroom and supply ventilation at the air handler This illustrates the unpredictability of interactions between mechanical ventilation and natural infiltration which depend strongly on the distribution and size of cracks through which the outside air must pass to enter the house There may have been a relatively large building enclosure leakage opening near the laundry room (perhaps the utility penetrations or the door to the garage) that allowed a significant amount of outside air to quickly enter and leave the house through the exhaust flow without circulating around the house
0
005
01
015
02
025
Ave
rag
e A
CH
Natural Exhaust Exhaust Supply 95 Supply 60 Supply 33
Laundry Mbath
Rm 100 100
Figure 41 Average air change rates for 2-story house with supply ventilation at 33 60 and 95 of ASHRAE 622 recommendations (Tests B4 B2 B3) compared to natural
infiltration (Test B14) and exhaust ventilation with no central fan operation (Test B1) Bedroom doors were closed except for the natural infiltration test
Bedroom Doors
The laundry room exhaust ventilation test with no air handler operation (see Figure 31) was repeated with the doors open to evaluate the change in room-to-room ventilation air distribution (Test B10) The decay curves are shown in Figure 42 and the reciprocal age-of air calculations are shown in Figure 43 It is evident from Figure 42 that the test began before the rooms were
43 of 49
Research Report - 0602
0
5
10
15
20
25
SF
6 C
on
ce
ntr
ati
on
(m
gm
3)
BR1 Living Kitchen BR2 BR3 MBR
Mixing stopped
Mixing restarted
completely well mixed resulting in decay curves that could be somewhat misleading Because the master bedroom was at a higher concentration than the other rooms at the start of the test any room that received air from the master bedroom would appear to have a slower decay rate than it would have if the rooms started out at the same concentration Despite the difference in starting concentration it is clear that outside air was well distributed when the doors were open even without operation of the air handler
1843 1912 1940 2009 2038 2107 2136 2204 2233 2302
Hour
Figure 42 Tracer gas decay for the 2-story house with exhaust ventilation from the laundry room at ASHRAE 622 level no central fan operation and bedroom doors open
(Test B10)
Reciprocal age-of-air analysis was not performed for this case because of the combined effect of a short test duration (~2 hours) and unequal starting tracer gas concentrations even though the house was relatively well-mixed The important conclusion (that opening doors greatly improves mixing) can be drawn by inspecting the decay curves alone
Transfer Grilles
A final exhaust ventilation test was run on the 2-story house with the doors closed and the transfer grilles taped over The decay curves are shown in Figure 43 and the reciprocal age-ofshyair calculations are shown in Figure 44 The curves were clearly very divergent even after 12 hours By examining the reciprocal age-of-air results it is apparent that the transfer grilles in the 2-story house caused a noticeable improvement in ventilation air distribution but the improvement was smaller than when the doors were opened (Figure 42)
44 of 49
Research Report - 0602
0
5
10
15
20
25
30
SF
6 C
on
cen
tra
tio
n (
mg
m3
) BR1 Living Kitchen BR2 BR3 MBR
Mixing stopped
Mixing restarted
1648 1912 2136 000 224 448 712 936
Hour
Figure 43 Tracer gas decay for 2-story house with exhaust ventilation from the laundry room at ASHRAE 622 level no central fan operation bedroom doors closed transfer
grilles taped closed (Test B7)
Exhaust Ventilation Transfer Grilles Untaped vs Taped
000
005
010
015
020
Re
cip
roc
al
Ag
e o
f A
ir (
1h
r)
BR1
Living
Kitchen
BR2
BR3
MBR
Exhaust in laundry room no Exhaust in laundry room no
mixing 100 ASHRAE mixing 100 ASHRAE
doors closed doors closed transfer
grilles taped
Figure 44 Reciprocal age-of-air for 2-story house with exhaust ventilation from the laundry room at ASHRAE 622 level no central fan operation and doors closed In the first case the transfer grilles are untaped (Test B3) in the second they are taped closed
(Test B7)
45 of 49
Research Report - 0602
CONCLUSIONS
bull Reciprocal age-of-air analysis was chosen as a quantitative method for characterizing distribution of ventilation air among rooms This method worked well in cases where rooms were well mixed to begin the test and weather conditions were sufficiently steady-state
bull A test period of at least 1frac12 air changes was necessary to obtain reasonably accurate ageshyof-air results when there was significant divergence in tracer gas concentration among the rooms
bull Although we did not achieve uniform initial concentration of tracer gas in the 2-story house using our test methodology and the equipment at hand we believe the reciprocal age-of-air calculations were meaningful in many of the cases as indicated in the discussion
bull Both houses were relatively tight with natural infiltration averaging 008 ACH for the 1shystory house and 011 ACH for the 2-story house
bull Both houses had relatively small (but not negligible) duct losses to the outside producing an increase in infiltration of less than 003 ACH for the 1-story house and 002 ACH for the 2-story house when the air handler runs
bull Age-of-air analysis indicated that ventilation supplied through the central air distribution system provided much more uniform distribution of ventilation air than the single-point exhaust system when the doors were closed and the air handler was not running For the 1-story house the central-fan-integrated supply ventilation case at 60 of ASHRAE 622 provided more outside air to all rooms than the least-ventilated room in the exhaust case at 100 of 622 For the 2-story house the central-fan-integrated supply system at 33 of the 622 flow rate provided more outside air to all rooms than the least ventilated rooms using exhaust ventilation at 100 of 622 from either the laundry or the master bathroom
bull Operation of the central fan at a 33 duty cycle maintained relatively well-mixed conditions regardless of ventilation rate type of ventilation system (supply or exhaust) or house configuration (1-story or 2-story)
bull Exhaust location affected both the relative amount of outside air received by different rooms and the overall uniformity among rooms but the effect was not predictable
bull For exhaust-only ventilation without central fan operation opening bedroom doors appeared to significantly improve the mixing of ventilation air among rooms
bull Transfer grilles improved the distribution of ventilation air slightly but much less than opening the bedroom doors
bull In the 2-story house the stack effect caused air movement from the first floor to the second floor even when exhaust ventilation was applied to the first floor resulting in consistently higher tracer gas concentrations on the second floor and more non-uniform ventilation air distribution in general
bull Interactions between natural infiltration and both exhaust and supply mechanical ventilation were very significant When the ventilation system was activated the combined air change rate did not increase commensurate with the measured ventilation rate but instead increased by only half that amount This result was consistent with combining ventilation and infiltration in quadrature to estimate whole-house air change rate in accordance with ASHRAE Standard 136 (ASHRAE 1993)
46 of 49
Research Report - 0602
FUTURE WORK
In future tests continuous monitoring of pressure differentials would enhance our understanding of the multi-zone combined infiltration and ventilation systems and our ability to model them That would help to explain differences between tests in more detail including the effects of multiple stories location of ventilation supply outlets and exhaust inlets interior door closure and use of passive return air transfer grilles Pressure differential measurement points should include
bull dP with respect to outside for each closed room and open space bull dP across closed interior doors bull dP between the floor cavity and outdoors and bull dP between the house and the attic
Measurement of wind direction along with wind speed could also be helpful for modeling these buildings and systems However because of micro-climate wind shielding it may be very difficult to relate a single-point wind direction measurement to actual wind vectors on the building surfaces
ACKNOWLEDGMENTS
The authors express their appreciation to Rich Coyle of DR Horton for providing the test houses and to Joseph Lstiburek of BSC Subrato Chandra and Neil Moyer of FSEC and Greg Barker of Mountain Energy Partnership for their assistance in the planning and execution of this ventilation study
47 of 49
Research Report - 0602
REFERENCES
ASHRAE (1993) ANSIASHRAE Standard 136-1993 A Method of Determining Air Change Rates in Detached Dwellings Atlanta GA American Society of Heating Refrigerating and Air-Conditioning Engineers Inc
ASHRAE (1997) ANSIASHRAE Standard 129-1997 Measuring Air-Change Effectiveness Atlanta GA American Society of Heating Refrigerating and Air-Conditioning Engineers Inc
ASHRAE (2004) ASHRAE Standard 622-2004 Ventilation and Acceptable Indoor Air Quality in Low-Rise Residential Buildings Atlanta GA American Society of Heating Refrigerating and Air-Conditioning Engineers Inc
CSA (2003) CANCSA F326-M91 Residential Mechanical Ventilation Systems Canadian Standards Association Ontario Canada httpwwwcsashyintlorgonlinestoreGetCatalogItemDetailsaspmat=2410793ampParent=102
NBC 2005 National Building Code of Canada httpircnrcshycnrcgccapubscodesnrcc47666_ehtml
Grieve PW (1991) Measuring Ventilation Using Tracer-Gases Denmark Bruumlel amp Kjaeligr
MN Chapter 7672 Minnesota Energy Code Chapter 7672 Detached Single-Family And Two-Family Dwellings httpwwwstatemnusmnexternalDocsCommerceChapter_7672_Residential_111302012428 _72rulepdf
Persily AK Martin SR (2000) A Modeling Study of Ventilation in Manufactured Houses Gaithersburg MD National Institute of Standards and Technology NISTIR 6455
Rudd A Lstiburek J (2000) ldquoMeasurement of Ventilation and Interzonal Distribution in Single-Family Homesrdquo ASHRAE Transactions 2000 MN-00-10-3 V 106 Pt2 American Society of Heating Refrigeration and Air-Conditioning Engineers Atlanta GA
WAC (2004) Washington State Title 51 WAC Community trade and economic development department of (building code council) Chapter 51-13 Ventilation and indoor air quality httpappslegwagovWACdefaultaspxcite=51-13
48 of 49
Research Report - 0602
Field test of room-to-room uniformity of ventilation air distribution in two new houses
About this Report
This report was prepared for the US Department of Energyrsquos Building America
Program The report is freely available to the public at wwwbuildingamericagov
The authors express their appreciation to Rich Coyle of DR Horton for providing the test houses and to Joseph Lstiburek of BSC Subrato Chandra and Neil Moyer of
FSEC and Greg Barker of Mountain Energy Partnership for their assistance in the planning and execution of this ventilation study
About the Authors
Robert Hendron Ren Anderson Dennis Barley are with National Renewable Energy Laboratory Armin Rudd and Aaron Townsend are with Building Science Corporation
Ed Hancock is with Mountain Energy Partnership
Direct all correspondence to Building Science Corporation 30 Forest Street Somerville MA 02143
Limits of Liability and Disclaimer of Warranty
Building Science documents are intended for professionals The author and the publisher of this article have used their best efforts to provide accurate and authoritative information in regard to the subject matter covered The author and publisher make no warranty of any kind expressed or implied with regard to the information contained in this article
The information presented in this article must be used with care by professionals who understand the implications of what they are doing If professional advice or other expert assistance is required the services of a competent professional shall be sought The author and publisher shall not be liable in the event of incidental or consequential damages in connection with or arising from the use of the information contained within this Building Science document
49 of 49
Research Report - 0602
Field test of room-to-room uniformity of ventilation air distribution in two new houses
Robert Hendron Armin Rudd Ren Anderson Dennis Barley Ed Hancock Aaron Townsend
(Robert Hendron Ren Anderson Dennis Barley are with National Renewable Energy Laboratory Armin Rudd and Aaron Townsend are with Building Science Corporation Ed Hancock is with Mountain Energy Partnership)
KEY WORDS ventilation air distribution age-of-air multi-zone tracer gas decay
ABSTRACT In order for dilution ventilation systems to provide predictable results independent of the geometry of individual homes outside air must be uniformly distributed throughout the house The primary purpose of this field test was to characterize the uniformity of room-to-room ventilation air distribution under various operating conditions by examining multi-zone tracer gas decay curves and calculating local age-of-air The tests were conducted in two Sacramento houses and were designed to allow direct quantitative comparisons of various ventilation approaches which could potentially be factored into ventilation rate trade-offs in future updates to ASHRAE Standard 622 We observed the effects of providing single-point exhaust ventilation versus central-fan-integrated supply ventilation and the impacts of operating the central fan at a minimum duty cycle for mixing closing the bedroom doors and covering passive return air transfer grilles above the doors Analysis of the measured data showed that reciprocal age-of-air analysis worked well to characterize room-to-room uniformity of ventilation air distribution as long as the house was well mixed at the beginning of the test and weather conditions were sufficiently steady-state A test period of at least 15 air changes was necessary to obtain valid age-of-air results when there was significant divergence in tracer gas concentration among the rooms Both houses had relatively low natural infiltration and duct leakage to outdoors Ventilation supplied through the central air distribution system provided much more uniform distribution of ventilation air than the single-point exhaust system Operation of the central fan at a 33 duty cycle maintained relatively well-mixed conditions regardless of ventilation rate type of ventilation system (supply or exhaust) or house configuration (1-story or 2-story) For single-point exhaust ventilation opening bedroom doors appeared to significantly improve the mixing of ventilation air among rooms Passive air transfer grilles improved the distribution of ventilation air only slightly
INTRODUCTION
ASHRAE Standard 622 (ASHRAE 2004) ldquoVentilation and Acceptable Indoor Air Quality in Low-Rise Residential Buildingsrdquo specifies a minimum ventilation flow rate that depends on the timing of ventilation air delivery but it is silent on whole-house distribution of ventilation air The Washington State Ventilation and Indoor Air Quality Code (WAC 2004) is also silent regarding ventilation air distribution Both the Minnesota Building Code (MN Chapter 7672) and the National Building Code of Canada (NBC 2005) referring to Canadian Standard F326shyM91 (CSA 2005) require whole-house ventilation air distribution by means of fully ducted
3 of 49
Research Report - 0602
ventilation systems or by mixing via a central air handling system A large US private-sector high-performance home program also requires periodic central air handler operation to assure whole-house mixing for ventilation air distribution and thermal comfort Prior work by Rudd (2000) showed that ventilation systems that utilized whole-house distribution and mixing via the central air handling system had much less room-to-room variation in ventilation air exchange than systems that did not
This research program evaluated the distribution of ventilation air in two new test houses using several different ventilation system configurations and air-mixing scenarios The test program was conducted in late December 2005 and early January 2006 during relatively mild winter weather in Sacramento The first test house was a one-story model with four bedrooms The second was a two-story model also with four bedrooms Both houses were designed to be energy efficient had slab-on-grade foundations ducts in conditioned space and met the builderrsquos airtightness target measured with a blower door (lt125 in2 effective leakage area per 100 ft2 envelope area) Other key specifications for both houses are summarized in Table 1 and photos are shown in Figures 1 and 2 Floor plans are shown in Figures 3 and 4
The primary purpose of this test program was to characterize the uniformity of room-to-room distribution of outside air under various conditions by examining multi-zone tracer gas decay curves In order for dilution ventilation systems to provide predictable results independent of the geometry of individual homes outside air must be uniformly distributed throughout the house The tests in the Sacramento houses were designed to allow direct quantitative comparisons of various ventilation approaches which could potentially be factored into ventilation rate tradeshyoffs in future updates to ASHRAE Standard 622 (ASHRAE 2004)
4 of 49
Research Report - 0602
Table 1 Specifications for DR Horton test houses
1-Story (1111 Montague) 2-Story (1117 Montague)
Geometry 4-bedrooms 2-bath 4-bedrooms 2-bath 2075 ft2 2582 ft2
10 ft ceilings 10 ft ceilings
Building envelope Ceiling amp wal Optima advanced insulation system ls Optima advanced insulation system Foundation Slab-on-grade Slab-on-grade Infiltration 1583 CFM50 as tested using a blower-door 1383 CFM50 as tested using a blower-
door Mechanical systems Heat Sealed-combustion gas furnace Sealed-combustion gas furnace Cooling 14 SEER air conditioner 14 SEER air conditioner Air distribution Ducts inside conditioned space 49 CFM25 Ducts inside conditioned space 44
duct leakage to the inside transfer grilles CFM25 duct leakage to the inside between bedrooms and main living space transfer grilles between bedrooms and
main living space Ventilation Central fan integrated supply (CFIS) Central fan integrated supply ventilation
ventilation w Aprilaire VCS model 8126 (CFIS) w Aprilaire VCS model 8126 motorized damper 33 duty cycle motorized damper 33 duty cycle
Figure 1 DR Horton 1-story test house (1111 Montague)
5 of 49
Research Report - 0602
Figure 2 DR Horton 2-story test house (1117 Montague)
6 of 49
Research Report - 0602
BR1
BR2
BR3
MBR Living Rm
Entry
copy buildingsciencecom
Figure 3 1-story test house floor plan (1111 Montague)
7 of 49
Research Report - 0602
MBR
BR1
BR3
BR2
Kitchen
Living
copy buildingsciencecom
Figure 4 2-story test house floor plan (mirror image of 1117 Montague)
TEST PLAN
Research Questions
The following series of research questions were identified by the researchers to quantify the ventilation distribution characteristics of the test houses under various operating conditions
1 What is the natural air change rate (ACH) for each house with bedroom doors open no air handler operation and no mechanical ventilation What is the room-to-room uniformity in outside air distribution
2 What is the change in whole-house ACH caused by air handler operation What is the change in room-to-room uniformity of outside air distribution
3 What is the change in whole-house ACH caused by closing the bedroom doors What is the change in room-to-room uniformity of outside air distribution
4 What is the change in whole-house ACH caused by taping over the transfer grilles What is the change in room-to-room uniformity of outside air distribution
5 What is the difference in whole-house ACH for a central-fan integrated supply ventilation system (CFIS) operating at 33 duty cycle compared to a continuous exhaust ventilation
8 of 49
Research Report - 0602
system with both systems meeting the ASHRAE 622 recommended minimum ventilation rate on average How does the resulting room-to-room uniformity of outside air distribution compare
6 How does the whole-house ACH and uniformity of outside air distribution change for a CFIS ventilation system when the ventilation rate is lowered from 100 of the ASHRAE 622 recommendation to 60 and to 33
7 How does the whole-house ACH and uniformity of outside air distribution change for the continuous exhaust ventilation system when the location of the exhaust port is changed from the utility room to the master bathroom
8 How uniform is the outside air distribution for the two-story house compared to the one-story house
Test Set-Up
Single-tracer gas decay with multi-zone sampling was used to evaluate the performance of each ventilation system based on how uniformly outside air was distributed to each room or zone within the house The decay curves demonstrate the rate at which the tracer gas (representing a pollutant) which is initially distributed uniformly throughout the house is diluted within each zone as a result of outside air that enters the zone directly as well as air that is exchanged among zones Air entering one zone from another may contain either a higher or lower concentration of the tracer than the air already in the zone This test method is designed as a practical method to evaluate the uniformity of ventilation air distribution within a home assuming that dangerous pollutants such as radon are controlled using appropriate source mitigation strategies Uniform distribution of outside air is required for dilution ventilation systems to provide predictable results independent of the geometry of individual homes
A multi-zone tracer gas sampling system was installed in each house for the test This equipment consisted of a Bruel and Kjaer model 1302 multi-gas monitor and a model 1303 multi-point sampler as shown in Figure 5 Sample tubes were placed in six locations in each house and attached to the multi-point sampler The six sampled locations are designated with red stars on the floor plans in Figures 3 and 4 The sampler was programmed to draw a sample from each sequential location at an interval of about 2 minutes thus all six locations were sampled at an interval of about 12 minutes
The air sample in each zone was taken near the center of the room at a height of four feet above the floor The zone air temperature was measured at the same location The local zone air temperature measurement was used to control the electric heater in each zone (see Test Procedure section below) to achieve a uniform and constant air temperature throughout the house Mixing fans were used to maintain uniform temperatures and concentrations within each room A photo of this set up is shown in Figure 6
9 of 49
Research Report - 0602
copy buildingsciencecom
Figure 5 Multi-zone tracer gas sampling and monitoring equipment
Mixing Fan
Heater
Temperature Sampling Location
Figure 6 Tracer gas sampling point temperature sensor room air mixing and co-heating set-up
The air flow rates for both supply and exhaust ventilation were carefully controlled during the test using a Duct Blaster fan and measurement system For exhaust ventilation the Duct Blaster fan was placed near the location of the ceiling exhaust fan and a length of flexible duct was used to connect the normal entrance for the exhaust fan to the Duct Blaster All of the air flowing through the exhaust fan during the test was first routed through the Duct Blaster The Duct Blaster speed control was adjusted to achieve the desired flow rate and the Duct Blaster flow ring and pressure tap were used to measure the air flow rate The exhaust fan itself was operated in
10 of 49
Research Report - 0602
conjunction with the duct blaster to reduce the resistance to air flow Figure 7 shows the Duct Blaster installed at the laundry room exhaust register
copy buildingsciencecom
Figure 7 Duct Blaster installed at the laundry room exhaust register
A similar application of the Duct Blaster was used to control and measure the supply air flow rate during the tests of the CFIS system The normal configuration of flexible duct connecting the air handler return to the outside was changed so that all outside air would flow through the Duct Blaster The flexible duct was disconnected from the air handler return and attached to the inlet to the Duct Blaster The Duct Blaster outlet duct was attached to the air handler return The Duct Blaster speed control was used to achieve the desired air flow rate and the Duct Blaster flow ring and pressure tap were used to measure the flow rate This installation is shown in Figure 8
Natural infiltration rates varied during the tests depending on weather conditions which were monitored using a portable weather station
It should be noted that the supply ventilation ducts in the test houses were not sized for the flow rates desired in the tests The ventilation flow rate measured during normal operation of the air handler in the 1-story house was about 10 cfm compared to 174 cfm required to meet the ASHRAE 622 recommendations This flow rate was also significantly less than the design flow rate of about 40-60 cfm It was necessary to operate the Duct Blaster fan at maximum power to achieve the required air flow rate during some tests It was unclear if the outside air duct was too long too small or too tortuous or if insufficient negative pressure was present at the return of the air handler because the central return grille was just a few inches away (see Figure 8)
11 of 49
Research Report - 0602
copy buildingsciencecom
Figure 8 Duct Blaster installed between the outside air duct and the return of the air handler to provide supply ventilation
Test Procedure
The tracer gas used was sulfur hexafluoride (SF6) a stable non-toxic gas that was injected into each house volume from a small compressed gas cylinder carried by hand around the house During the dosing period the furnace fan was used to achieve an initially well-mixed condition with a concentration of about 15 parts per million (PPM) During this period the doors were kept open and a portable de-stratification fan was used in the 2-story house to improve mixing between floors Then the mixing fans were stopped and the divergence in concentration from zone to zone was observed (with doors either open or closed depending on the test objective) Small portable fans in each zone continued running to maintain a well-mixed condition within each zone The interior air temperature in each zone was controlled during the test period using portable electric heaters instead of the furnace so that operation of the air handler could be controlled independently from the demand for heating At the conclusion of the test the whole house was again mixed by opening the doors and turning on the air handler This allowed the calculation of an average whole-house air change rate for each set of test conditions
The tests were planned for rather mild weather to minimize infiltration effects so as to isolate and test the performance of the mechanical ventilation systems The general design goal was to provide the minimum amount of mechanical ventilation recommended by ASHRAE Standard 622-2004 (ASHRAE 2004) (58 cfm for the 1-story house 63 cfm for the 2-story house) and observe the effects of providing central fan integrated supply versus single-point exhaust ventilation operating the central fan closing the bedroom doors and taping the transfer grilles above the doors
12 of 49
Research Report - 0602
The results of the multi-zone tracer gas decay tests are presented graphically as families of decay curves These graphs illustrate the uniformity or non-uniformity of the ventilation effect among the various rooms and allow ranking of the rooms from the least to the most ventilation effect
In addition if the ventilation rates were sufficiently steady for the duration of the test period we used local mean age-of-air analysis to evaluate the results more quantitatively Age-of-air analysis is a well-established approach to testing ventilation rates at various points or in various zones within a building (Grieve 1991) Age-of-air is defined as the average length of time that air molecules have resided within the building The formula for calculating local mean age-ofshyair in a tracer gas decay test is given in ASHRAE Standard 129-1997 (ASHRAE 1997) as follows
Ai = 1 intinfin
Ci (t)dt (1)C0 0
where
i = Index for measurement point representing a well-mixed zone Ai = Local mean age-of-air at point i (hr) C = Concentration of tracer gas (lbmft3) C0 = Initial value of C in well-mixed building (lbmft3) Ci = Time-varying concentration of tracer gas at point i (lbmft3) t = Time (hr)
In order to compare the ventilation rates among the rooms or zones in the home we use the metric Reciprocal Age-of-Air
Reciprocal Age-of-Air = 1Ai (2)
Reciprocal Age-of-Air has units of 1hr and is equivalent to the air change rate (ACH) in a single well-mixed zone (Persily 2000)
The definition of Ai in Equation (1) involves an integral of infinite duration This is handled in the test procedure through a two-step process
Step 1 The tracer gas decay test is continued until (a) the initial transient effects of interzonal airflow have subsided and all of the decay curves resemble simple exponential functions and (b) the tracer concentrations are rather small compared to their initial values so that any extrapolation errors will have a small effect on the result In this field test most of the multi-zone tests were continued for 12 hours These portions of the decay curves were integrated numerically using the trapezoid rule
13 of 49
Research Report - 0602
Step 2 The remaining portions (the tails) of the decay curves were extrapolated to infinity using a simple exponential decay function which was matched to the decay rate of the final portion of each measured decay curve These portions of the curves were integrated analytically
Once the conditions of Step 1 were satisfied the rooms were re-mixed by opening the bedroom doors and operating the air handler This allowed the calculation of an effective whole-house air change rate using the relationship in Equation 3
Average whole-house air change rate (ACH) = ln(C0Cf)∆t (3)
where
Cf = Concentration of tracer gas after rooms are re-mixed (lbmft3) ∆t = Elapsed time between initial and final well-mixed cases (hr)
Test Matrix
The series of test conditions for the 1-story and 2-story houses are described in Tables 2 and 3 Most of the important tests were conducted for a 12-hour period overnight to ensure sufficient accuracy when calculating reciprocal age-of-air
Table 2 Test sequence for 1-story test house
Central fan
cycling Duration Vent Vent flow (min off
Test Date Time (hrs) Config rate (cfm) min on) Doors Notes
A1 Dec 28 AM 3 Exhaust 58 none closed
A2 PM 3 Exhaust 58 2010 closed
A3 overnight 12 Exhaust 58 none closed A4 Dec 29 AM 4 Supply 104 33 2010 closed
duty cycle A5 PM 4 Supply 58 33 duty 2010 closed
cycle A6 overnight 12 Supply 174 33 2010 closed
duty cycle
A7 Dec 30 AM-PM 8 None 0 none open Natural infiltration
A8 PM 2 None 0 none open AH bump
A9 overnight 12 Exhaust 58 none open
A10 Dec 31 AM-PM 6 Exhaust 58 none closed Transfer grills taped
A11 PM 6 Exhaust 58 2010 closed Transfer grills taped
A12 Jan 1 overnight 12 Exhaust 58 2010 closed
A13 PM 6 Exhaust 58 2010 open
A14 overnight 12 Exhaust 58 54 none closed
A15 Jan 2 AM-PM 6 None 0 none closed Natural infiltration
A16 overnight 12 Exhaust 58 none closed Master bath exhaust
14 of 49
Research Report - 0602
Table 3 Test sequence for 2-story test house
Central fan
cycling Duration Vent Vent flow (min off
Test Date Time (hrs) Config rate (cfm) min on) Doors Notes B1 Jan 3 overnight 14 Exhaust 63 none closed
B2 Jan 4 PM 5 Supply 114 33 20 10 closed 60 ASHRAE 622 duty cycle
B3 overnight 11 Supply 180 33 20 10 closed 95 ASHRAE 622 duty cycle
B4 Jan 5 PM 4 Supply 63 33 duty 20 10 closed 33 ASHRAE 622 cycle
B5 overnight 13 Exhaust 63 5010 closed
B6 Jan 6 PM 6 Exhaust 63 2010 closed
B7 overnight 12 Exhaust 63 none closed Transfer grilles taped
B8 Jan 7 AM 4 Exhaust 63 50 10 closed Transfer grilles taped
B9 PM 4 Exhaust 63 none closed Transfer grilles taped extra injection in MBR
B10 PM 2 Exhaust 63 none open
B11 overnight 9 Supply 114 33 20 10 closed Transfer grilles taped duty cycle
B12 Jan 8 PM 3 None 0 100 closed Transfer grilles taped air handler bump test
B13 PM 2 None 0 100 closed Transfer grilles untaped
B14 PM 2 None 0 none open Natural infiltration
B15 overnight 9 Exhaust 63 none closed Master bath exhaust transfer grilles taped
B16 Jan 9 AM 4 Exhaust 63 50 10 closed Master bath exhaust
B17 PM 4 Supply 178 33 20 10 closed duty cycle
B18 overnight 12 Exhaust 63 none closed Master bath exhaust
TEST RESULTS FROM 1-STORY HOUSE (1111 MONTAGUE)
Natural Infiltration
A test of natural infiltration was conducted for an 8-hour period on December 30 to examine the magnitude and variability of outside air entering the house through leaks in the building envelope (Test A7) The tracer gas decay curves are shown in Figure 9 It is evident that the house was very well mixed during this test which allows a running instantaneous calculation of whole-house ACH over the same time period (see Figure 10) Although the air change rate indicated that the house is relatively tight (about 0085 ACH on average) the effect of natural infiltration was far from negligible especially when the wind was blowing This variability of natural infiltration must be kept in mind when interpreting the decay curves and reciprocal age-of-air calculations that follow
15 of 49
Research Report - 0602
An air handler bump test was performed between 1300 and 1500 hours to examine the effect of air handler operation on whole house air exchange rate including duct leakage to the outside and changes in room-to-room pressurization caused by moving air from the supply registers in each room to the central return in the main living area Figure 10 shows both the hourly average ACH and the wind speed during this period At first glance it appears that the air change rate increased by about 003 ACH when the fan was turned on but there was a coincident jump in wind speed that complicates this interpretation There was no corresponding decrease in ACH when the air handler was turned off at 1500 hours Ultimately we cannot conclusively quantify the change in ACH associated with operation of the air handler but it appears to have been no more than 003 ACH
3
Co
ncen
trati
on
(m
gm
)
70
60
50
40
30
20
10
0
Living
Entry
BR1
BR2
BR3
MBR
Air Handler On
Air Handler Off
8 9 10 11 12 13 14 15 16 17 18
Hour
Figure 9 Tracer gas decay for 1-story house with no ventilation and bedroom doors open with and without central fan operation (Test A7)
16 of 49
Research Report - 0602
40016
35014 Air Handler On Air Handler Off
ACH
Wind Speed
Air
Ch
an
ge
Ra
te (
AC
H) 30012
25010
20008
15006
10004
Win
d S
pe
ed
(m
ph
)
002 05
00
8 10 12 14 16 18
000
Hour
Figure 10 Average air change rate for 1-story house with no ventilation no central fan operation and bedroom doors open (Test A7)
The natural ventilation test was repeated on January 2 with the doors closed instead of open (Test A15) providing the decay curves shown in Figure 11 The average air change rate for this case was 0086 ACH calculated based on the two well-mixed cases at the beginning and end of the test It is difficult to compare this number with the doors-open case because it was windy (4-5 mph) for the first few hours of this test However it is very clear that the uniformity of room-toshyroom distribution of outside air was significantly less when the doors were closed even with transfer grilles We did not calculate age-of-air for this test because the test conditions were not sufficiently steady state This fact is very evident at about hour 15 where the BR2 and BR3 curves suddenly begin to diverge from the MBR curve
17 of 49
Research Report - 0602
0
10
20
30
40
50
60
70
80
90
Co
ncen
trati
on
(m
gm
3 )
Living
Entry
BR1
BR2
BR3
MBR
Mixing stopped
Mixing restarted
10 11 12 13 14 15 16 17 18 19
Hour
Figure 11 Tracer gas decay for 1-story house with no ventilation no central fan operation and bedroom doors closed (Test A15)
Distributed Supply vs Point Exhaust Ventilation
Two of the most common ventilation schemes in Building America homes are continuous single-point exhaust ventilation and intermittent central-fan integrated supply (CFIS) ventilation Exhaust ventilation is most commonly installed in a bathroom laundry room or utility room Make-up air enters through the cracks and holes in the building envelope upon depressurization of the house The distribution of outside air in a given room is fairly unpredictable because it depends on the amount of depressurization in the room the number and size of openings in exterior walls and the influence of adjacent rooms Supply ventilation provided by a central-fan integrated system tends to be distributed more uniformly throughout the house However the fan is usually operated on a duty cycle of about 33 to limit the electricity used by the central fan and one of the goals of this testing is to evaluate the effect of that duty cycle on the consistency of the air mixing
The decay curves for a 12-hour overnight test with exhaust ventilation (Test A3) are shown in Figure 12 The exhaust fan register in the laundry room was used as the exhaust point and the Duct Blaster was used to exhaust 58 cfm continuously corresponding to the minimum ventilation rate recommended by ASHRAE for a 2075 ft2 4-bedroom house It is evident from the decay curves that significantly more outside air reached the master bedroom and less reached Bedroom 2 compared to the other rooms in the house
18 of 49
Research Report - 0602
0
2
4
6
8
10
12
14
Co
nc
en
tra
tio
n
mg
m3
Living
Entry
BR1
BR2
BR3
MBR
Mixing stopped
Mixing restarted
17 18 19 20 21 22 23 0 1 2 3 4 5 6
Hour
Figure 12 Tracer gas decay for 1-story house with exhaust ventilation from the laundry room at ASHRAE 622 level no central fan operation and bedroom doors closed (Test A3)
The corresponding decay curves for the central fan integrated supply system (Test A6) are shown in Figure 13 The air handler operated at a 33 duty cycle (20 min off 10 min on) with a ventilation rate of 174 cfm resulting in an average ventilation rate of 58 cfm again meeting the minimum ASHRAE 622 recommendations The whole house appeared to be well-mixed in this case because the decay curves were clustered together throughout the test Even during the 20 minute periods when the air handler was off there was very little divergence A comparison of Figure 12 to Figure 13 indicates that much more uniform distribution of ventilation air was achieved by using the CFIS system
19 of 49
Research Report - 0602
0
2
4
6
8
10
12
14
16
Co
nc
en
trati
on
(m
gm
3 )
Living
Entry
BR1
BR2
BR3
MBR
Mixing stopped
Mixing restarted
185 195 205 215 225 235 05 15 25 35 45 55 65
Hour
Figure 13 Tracer gas decay for 1-story house with supply ventilation at ASHRAE 622 level 33 central fan operation (20 min off 10 min on) and bedroom doors closed (Test
A6)
Reciprocal age-of-air calculations were performed to provide a quantitative comparison of the two ventilation systems as shown in Figure 14 Values were in the range of 0169 hr-1 +0042shy0038 hr-1 for the exhaust ventilation system compared to 0173 hr-1 +0002-0003 hr-1 for the supply ventilation system expressed in terms of the range of differences between the reciprocal age-of-air in each room and the whole-house air change rate With the exhaust ventilation at the laundry room the master bedroom received the greatest amount of fresh air We suspect this may have been caused by the presence of the exhaust ducts used for spot ventilation of the master bathroom possibly providing greater leakage area near the master bathroom than is present in other areas of the house The supply system distributed the ventilation air more uniformly but it is not entirely clear whether this result was primarily caused by the introduction of ventilation air through the supply ducts or by the air handler mixing air throughout the house Since it is clear that the exhaust ventilation showed better uniformity of ventilation with central system mixing it follows that mixing is likely to be the primary factor in the room-to-room uniformity shown by CFIS ventilation
It is also noteworthy that the average net air change rates provided by both the supply and exhaust ventilation systems were only about 018 ACH compared to the 025 ACH that would be expected if the mechanical ventilation rate (017 ACH) and the natural infiltration rate (008 ACH) were additive as they might be with a balanced ventilation system Adding mechanical ventilation to natural infiltration in quadrature results in an estimated average air change rate of 019 ACH which is fairly consistent with the measured values
20 of 49
Research Report - 0602
Recip
rocal
Ag
e o
f A
ir (
1h
r) 025
020
015
010
005
000
Simple Exhaust vs Central Fan Integrated
Supply
Centralized supply mixing
33 duty cycle 100
ASHRAE doors closed
Living
Entry
BR1
BR2
BR3
MBR
Exhaust in utility room no
mixing 100 ASHRAE
doors closed
Figure 14 Reciprocal age-of-air for 1-story house with continuous exhaust ventilation (Test A3) compared to central fan integrated supply ventilation (Test A6)
Air Handler Operation
To determine how much room-to-room mixing was caused by the air handler the exhaust only test was re-run with the air handler operating at 33 duty cycle (20 min off 10 min on) (Test A12) The decay curves are shown in Figure 15 Compared to Test A3 (Figure 12) there was a noticeable increase in uniformity when the air handler was operating even though the entry points for the ventilation air were uncontrolled As shown in Figure 16 the range of reciprocal age of air was reduced from +0042-0038 hr-1 to +0019-0011 hr-1) It appears that operation of the air handler explains most of the difference between the supply and exhaust ventilation systems discussed earlier Although it also appears that the overall average air change rate was higher in the case where the air handler was operating (0216 ACH vs 0176) it should be noted that the average wind speed was also significantly higher It is likely that the wind speed was the primary cause of the difference in average ACH not a difference in the mechanical ventilation rate
21 of 49
Research Report - 0602
0
5
10
15
20
25
30
35
Co
nce
ntr
ati
on
(m
gm
3 )
Living
Entry
BR1
BR2
BR3
MBR
Mixing stopped
Mixing restarted
0 1 2 3 4 5 6 7 8 9 10 11 12 13 14
Hour
Figure 15 Tracer gas decay for 1-story house with continuous exhaust ventilation at ASHRAE 622 level 33 central fan operation (20 min off 10 min on) and bedroom
doors closed (Test A12)
Exhaust Ventilation No Mixing vs 33 Air Handler Duty Cycle
000
005
010
015
020
025
Recip
rocal A
ge o
f A
ir (
1h
r)
Living
Entry
BR1
BR2
BR3
MBR
Exhaust in utility room 33 air handler
no mixing 100 operation exhaust in
ASHRAE doors closed utility room 100
ASHRAE doors closed
Figure 16 Reciprocal age-of-air for 1-story house with continuous exhaust ventilation with and without air handler operation (Tests A3 and A12)
22 of 49
Research Report - 0602
Exhaust Location
The preceding analysis of exhaust ventilation was based on an exhaust point in the laundry room which was relatively centrally located in the 1-story house To examine the effect of moving the exhaust point the duct blaster was moved to the master bathroom which was located in a far corner of the house (Test A16) A continuous exhaust ventilation rate of 58 cfm was again applied to the house resulting in the tracer gas decay curve shown in Figure 17 It is difficult to visually identify a significant difference between this series of curves and those shown in Figure 12 for the laundry room exhaust location
Because the curves were steady it is again possible to compare the results based on reciprocal age-of-air as shown in Figure 18 There appeared to be very little change in the distribution of outside air to most rooms However the reciprocal age-of-air in the master bedroom dropped noticeably when the exhaust location was moved to the master bathroom probably because a greater fraction of the outside air now passed through other rooms before reaching the master bedroom With the exhaust point centrally located most of the ventilation air passing through the master bedroom probably entered from the outside In both cases however the master bedroom had the highest reciprocal age-of-air of all of the rooms in the house and the BR2 location had the lowest
Co
nc
en
tra
tio
n (
mg
m3)
40
35
30
25
20
15
10
5
0
Living
Entry
BR1
BR2
BR3
MBR
Mixing stopped
Mixing restarted
19 20 21 22 23 0 1 2 3 4 5 6 7 8
Hour
Figure 17 Tracer gas decay for 1-story house with exhaust ventilation from the master bathroom at ASHRAE 622 level no central fan operation and bedroom doors closed (Test
A16)
23 of 49
Research Report - 0602
Exhaust Ventilation
Laundry Room vs Master Bathroom
000
005
010
015
020
025
Exhaust in laundry
room no mixing 100
ASHRAE doors closed
Exhaust in master
bathroom no mixing
100 ASHRAE doors
closed
Re
cip
roc
al A
ge
of
Air
(1
hr)
Living
Entry
BR1
BR2
BR3
MBR
Figure 18 Reciprocal age-of-air for 1-story house with exhaust ventilation from the master bathroom compared to the laundry room at ASHRAE 622 level no central fan operation
and bedroom doors closed (Tests A3 and A16)
Ventilation Rate
The supply ventilation test was repeated using flow rates corresponding to 60 and 33 of the ASHRAE recommendations The intent of this series of tests was to evaluate the room-to-room ventilation uniformity for ventilation rates consistent with ASHRAE 622 compared to the uniformity for reduced mechanical ventilation rates Each test was conducted for only 4 hours because of time limitations The decay curves are shown in Figures 19 and 20 Because the rooms were well-mixed during the supply ventilation tests the average whole-house ACH can be compared directly to the reciprocal age-of-air for the exhaust ventilation tests Figure 21 shows the supply ventilation air change rate for each of the three ventilation levels (33 60 100) compared to room-by-room reciprocal age-of-air for the exhaust ventilation system based on the boundary conditions present during the tests It appears that in the supply ventilation case all rooms receive more outside air than the least-ventilated room in the exhaust case (BR2) even at 60 of ASHRAE 622 These results serve to illustrate the trade-off between whole-house ventilation rate and room-to-room ventilation uniformity in terms of their impact on the worst room(s)
24 of 49
Research Report - 0602
The ASHRAE 622 committee has not currently defined the level of mixing that is required when choosing the minimum ventilation rate Some might interpret the results of this test to suggest that a house without mixing can have individual rooms that do not receive sufficient outside air even though the ventilation system is operating at 622 specified rates Because the 622 committee has not specified the level of mixing that is required when choosing the minimum ventilation rate the ventilation rate required by different ventilation systems is open to interpretation For example if the exhaust system performance shown in Figure 21 is acceptable does this mean that a ventilation system that provides good distribution of outside air may be sufficiently well-ventilated at 60 of the ASHRAE 622 level or perhaps even less Alternatively it might be concluded that exhaust ventilation rates should be increased over current ASHRAE 622 recommendations because of the possibility that certain rooms may receive very little fresh air Unfortunately because the current 622 standard does not specify air mixing requirements and the committeersquos assumptions about ventilation air distribution are not well documented it is difficult to make any firm recommendations in this area However we can conclude that air mixing is required for dilution ventilation systems to provide predictable results independent of the geometry of individual homes
8 9 10 11 12 13 14
Hour
Figure 19 Tracer gas decay for 1-story house with supply ventilation at 60 of ASHRAE 622 level 33 central fan operation (20 min off 10 min on) and bedroom doors closed
(Test A4)
0
10
20
30
40
50
60
Co
nce
ntr
ati
on
m
gm
3
Living
Entry
BR1
BR2
BR3
MBR
Mixing stopped
Mixing restarted
25 of 49
Research Report - 0602
0
5
10
15
20
25
30
Co
nce
ntr
ati
on
(m
gm
3 )
Living
Entry
BR1
BR2
BR3
MBR
Mixing stopped
Mixing restarted
12 13 14 15 16 17 18 19 20
Hour
Figure 20 Tracer gas decay for 1-story house with supply ventilation at 33 of ASHRAE 622 level 33 central fan operation (20 min off 10 min on) and bedroom doors closed
(Test A5)
Simple Exhaust vs Central Fan Integrated
Supply with Lower Ventilation Rates
025
Re
cip
roc
al A
ge
of
Air
(1
hr)
Well Mixed
100
ASHRAE 60
ASHRAE 33
ASHRAE Living Entry 010 Natural
BR1 Infilt
BR2 BR3 005
MBR
Exhaust in laundry room no
000
Central supply Natural infil-
mixing 100 ASHRAE doors mixing 33 duty tration doors
closed cycle doors closed open
Figure 21 Reciprocal age-of-air for 1-story house with supply ventilation at 33 60 and 100 of ASHRAE 622 level (Tests A5 A4 A6) compared to exhaust ventilation with
no central fan operation (Test A3) Bedroom doors were closed
020
015
26 of 49
Research Report - 0602
Simulations by Walker (2006) have shown that all systems will not provide the same service in terms of annual average air change rate For the same air flow rate and duty cycle balanced ventilation will yield a higher average air exchange than supply ventilation and supply ventilation will yield a higher average air exchange than exhaust ventilation That can be explained in general terms by understanding that wind and stack effects act to depressurize a building most of the time Exhaust fans increase the building depressurization further but supply fans decrease the depressurization Balanced fans donrsquot change the enclosure differential pressure and air flow at all Because of the non-linear relationship between differential pressure and air flows across the building enclosure a supply fan changes the pressures across the enclosure less than an exhaust fan acting more like a balanced fan The result is that the effect on ventilation air change rate from a supply fan is somewhere between that of an exhaust fan and a true balanced system
Bedroom Doors
Except for the natural ventilation test the preceding tests were all conducted with the bedroom doors closed to simulate a worst-case situation for air circulation within the house The exhaust ventilation test was repeated with the bedroom doors open (Test A9) producing the tracer gas decay curve shown in Figure 22 It is evident that the decay curves were much more tightly bundled with the doors open than they were with the doors closed (compare Figure 12) A comparison based on reciprocal age-of-air is shown in Figure 23 A significant improvement in room-to-room mixing is evident during the open-door test
It is also evident that the average air change rate was higher when the doors were open (0202 vs 0176 ACH) but it must be remembered that the ventilation rate was controlled using a duct blaster and average wind speed was higher during the open-door test period compared to the closed-door test period (20 mph compared to 06 mph) Therefore this test alone does not necessarily indicate that closing doors reduces the average air change rate associated with an exhaust system In future tests continuous measurement of the depressurization of the house with respect to outside along with single-point pressure measurements across interior doors would provide more information about the effect of closing doors when exhaust ventilation systems are used It would also be valuable to conduct this test during steady weather conditions using the exhaust fan (with uncontrolled ventilation rate) instead of the duct blaster to observe the net effect of closed doors on whole-house air change rate
27 of 49
Research Report - 0602
0
5
10
15
20
25
30
Co
ncen
trati
on
(m
gm
3 )
Living
Entry
BR1
BR2
BR3
MBR
Mixing stopped
Mixing restarted
181 191 201 211 221 231 01 11 21 31 41 51 61 71
Hour
Figure 22 Tracer gas decay for 1-story house with exhaust ventilation from the laundry room at ASHRAE 622 level no central fan operation and bedroom doors open (Test A9)
Exhaust Ventilation
Doors Closed vs Doors Open
000
005
010
015
020
025
Re
cip
roc
al
Ag
e o
f A
ir (
1h
r)
Living
Entry
BR1
BR2
BR3
MBR
Exhaust in laundry room Doors open no mixing
no mixing 100 exhaust in laundry room
ASHRAE doors closed 100 ASHRAE
Figure 23 Reciprocal age-of-air for 1-story house with exhaust ventilation from the laundry room at ASHRAE 622 level no central fan operation In the first case the bedroom doors were closed (Test A3) in the second the doors were open (Test A9)
28 of 49
Research Report - 0602
Transfer Grilles
Because the test houses used central returns instead of hard ducted returns in the bedrooms transfer grilles were installed over the bedroom doors to provide a flow path for return air without excessive room pressurization when the doors were closed These transfer grilles also allowed ventilation air to pass more freely from the bedrooms to the main living space The effect of transfer grilles on ventilation air distribution was evaluated by taping over the grilles (see Figure 24) and re-running the exhaust ventilation test (Test A10) The corresponding tracer gas decay curve is shown in Figure 25 and the reciprocal age-of-air analysis is shown in Figure 26 Taping the transfer grilles did not appear to significantly affect the room-to-room variability in ventilation rate although there appeared to be some slight re-ranking of rooms from highest to lowest reciprocal age-of-air It should be noted that there was an increase in average wind speed from 26 mph to 41 mph starting at 1 pm including a half hour period where the average wind speed was 7 mph This weather effect produced noticeable kinks in the decay curves and therefore would be expected to introduce significant errors into the reciprocal age-of-air results
Itrsquos possible that the transfer grilles played a much smaller role in providing a path for ventilation air than the supply ducts Because the air handler was not operating the ducts were not pressurized and were thus available as passive airflow conduits The resistance to air flow was probably smaller for the air ducts than for the transfer grilles depending on their size and the number of supply registers in each bedroom The existing door undercuts are also thought to have played a role The effect of ducts and door undercuts can be tested in the future by running separate tests with ducts and door undercuts taped over
copy buildingsciencecom
Figure 24 Transfer grilles over bedroom doors taped closed
29 of 49
Research Report - 0602
0
10
20
30
40
50
60
70
Co
nc
en
tra
tio
n (
mg
m3 )
Living
Entry
BR1
BR2
BR3
MBR
Mixing stopped
Mixing restarted
8 9 10 11 12 13 14 15 16 17
Hour
Figure 25 Tracer gas decay for 1-story house with exhaust ventilation from the laundry room at ASHRAE 622 level no central fan operation bedroom doors closed and transfer
grilles taped (Test A10)
Exhaust Ventilation
000
005
010
015
020
025
Re
cip
roc
al
Ag
e o
f A
ir (
1h
r)
Living
Entry
BR1
BR2
BR3
MBR
Transfer Grilles Untaped vs Taped
Exhaust in laundry room no Exhaust in laundry room no
mixing 100 ASHRAE mixing 100 ASHRAE
doors closed doors closed transfer
grilles taped
Figure 26 Reciprocal age-of-air for 1-story house with exhaust ventilation from the laundry room at ASHRAE 622 level no central fan operation and doors closed In the
30 of 49
Research Report - 0602
first case the transfer grilles are untaped (Test A3) in the second they are taped closed (Test A10)
Minimum Test Duration
We were fortunate that DR Horton provided two full weeks of access to these homes to conduct this series of tests which allowed us to run some of the more important tracer gas decay tests as long as 12 hours to help ensure that we could accurately calculate reciprocal age-of-air In most cases test houses would not be available for such a long time period To evaluate the length of time needed to estimate the reciprocal age-of-air with reasonable accuracy we examined the results that we would have obtained for one of the exhaust ventilation tests had we halted the test period after less than 12 hours For the supply ventilation tests the rooms were sufficiently well-mixed that the test could have been stopped after 3 or 4 hours assuming weather effects were steady
The reciprocal age-of-air calculations for the exhaust ventilation decay curves (Test A3 see Figure 12) based on test durations of 3 6 9 and 12 hours are shown in Figure 27 These test durations range from 053 to 21 air changes based on the average air change rate of 018 ACH (56 hours per air change) calculated for this test The ratio of highest to lowest reciprocal ageshyof-air is shown above the data points for each case These results suggest that shorter tests tend to overestimate the range and that perhaps 1frac12-2 air changes (roughly 9 to 12 hours in this case) may be necessary to obtain accurate calculations of reciprocal age-of-air when there is significant divergence among rooms From a qualitative standpoint one air change may be sufficient to determine the basic trend Without knowing in advance what mixing pattern will occur it is difficult to recommend a minimum test duration But assuming this test is fairly representative of a worst-case scenario a minimum of 15 air changes would be necessary to have a high degree of confidence in the quantitative difference in reciprocal age-of-air among rooms
31 of 49
Research Report - 0602
000
005
010
015
020
025
030
035
Re
cip
roc
al
Ag
e-O
f-A
ir (
hr-1
)
Living
Entry
BR1
BR2
BR3
MBR HighLow = 297
HighLow = 168 HighLow = 184 HighLow = 161
3-hour Test 6-hour Test 9-hour Test 12-hour Test
(053 Air Changes) (11 Air Changes) (16 Air Changes) (21 Air Changes)
Test Duration
Figure 27 Reciprocal age-of-air based on alternate test durations for 1-story house with exhaust ventilation from the laundry room at ASHRAE 622 level no central fan operation
and doors closed (Test A3) Average air change rate was 018 ACH
TEST RESULTS FROM 2-STORY HOUSE (1117 MONTAGUE)
The 2-story house was tested from January 3-10 2006 Three zones were selected on the first floor and three more were selected on the second floor as indicated by the red stars in Figure 4 The initial mixing of air among the rooms at the start of each test in this 2-story house was not as thorough as it was in the 1-story house Evidently the combined effects of the air handler and the portable de-stratification fan were not sufficient to overcome upward transport of tracer gas driven by the stack effect from the first to the second floor The resulting difference in initial tracer gas concentration among the rooms was about 5-10 This outcome emphasizes the significant effect of stack-driven infiltration on ventilation non-uniformity in multi-story homes Because our test method and equipment did not achieve a well-mixed condition at the start of each test there were some errors introduced into the reciprocal age-of-air analysis For future tests we would recommend larger de-stratification fans to obtain more well-mixed conditions in multi-story houses
Typical errors introduced by incomplete mixing of the tracer gas at the start of such a test were analyzed by examining two hypothetical cases where either all of the air entering a room comes from the outside or all of the air comes from an adjacent room with a different starting concentration If all of the air entering a space comes from the outside then a change in the initial concentration would have no effect on the reciprocal age-of-air because the decay curve would be exponential from the start and the area under the curve would be normalized based on
32 of 49
Research Report - 0602
the starting concentration in that zone However if the air entering a room passes through another room with a lower initial concentration the room receiving the air will have a lower concentration of tracer gas throughout the test compared to what the concentration would have been if the starting points were the same in both rooms This case is illustrated in Figure 28 where assumptions are made that the rooms are the same size the air exchange rate is 01 ACH for both rooms and the initial tracer gas concentration is 10 lower in the first room (upstream) than it is in the second room
The effect on reciprocal age-of-air is shown in Figure 29 A 10 difference in starting concentration results in an error of about 75 in reciprocal age-of-air for a room downstream of a room with a lower starting concentration assuming 01 ACH for both rooms The error would be somewhat smaller (about 5) if the air change rate was higher for both rooms (02 ACH) There would be no error introduced for rooms where all of the air infiltration comes from the outside Although the amount of error in the reciprocal age-of-air calculations can be affected by additional variables not examined here we feel that these percentages are reasonable estimates of the errors in our results for the 2-story house due to incomplete initial mixing of air
In each case an engineering judgment must be made regarding the significance of the error introduced by incomplete initial mixing As a general rule the differences in concentration at the start of the test should be small compared to the differences that are being measured in order for the results to be considered valid
Figure 28 Theoretical decay curves for a well-mixed case with uniform tracer gas concentration compared to a case where the upstream room starts with a concentration
10 lower than the downstream room
33 of 49
Research Report - 0602
Figure 29 Theoretical reciprocal age-of-air for a well-mixed case with uniform tracer gas concentration compared to a case where the upstream room starts with a concentration
10 lower than the downstream room
Natural Infiltration and Duct Leakage
A natural infiltration test was performed over a two hour period on the evening of January 8 (Test B14) The tracer gas decay curves are shown in Figure 30 There was a slight divergence between the first floor and second floor once the air handler was turned off but the rooms on each floor appeared to remain fairly well-mixed The average air change rate during the test period was about 011 ACH which was somewhat higher than the 1-story house as might be expected with an increased stack height
An air handler bedroom door bump test was conducted just prior to the test period shown in Figure 30 allowing observation of the combined effect of duct leakage to the outside and increased infiltration caused by room pressurization The average air change rate during that bump test was 013 ACH suggesting that closing doors and operating the fan added approximately 002 ACH to the whole-house average air change rate The average wind speed was a bit higher while the air handler was running (17 mph compared to 05 mph) so the effect of air handler operation may actually be somewhat less than the average ACH numbers indicate
34 of 49
Research Report - 0602
0
1
2
3
4
SF
6 C
on
ce
ntr
ati
on
(m
gm
3)
BR1
Living
Kitchen
BR2
BR3
MBR
Mixing stopped
Mixing restarted
1814 1843 1912 1940 2009 2038 2107 2136
Hour
Figure 30 Tracer gas decay for 2-story house with no ventilation no central fan operation and bedroom doors open (Test B14)
Distributed Supply vs Point Exhaust Ventilation
A 14-hour test (Test B1) was performed with an exhaust ventilation rate of 63 cfm in the laundry room which was located near the stairwell in the middle of the first floor The ventilation rate was again consistent with the ASHRAE 622 recommendations The tracer gas decay curves are shown in Figure 31 It is interesting that all three second floor rooms showed a delay before entering an exponential decay suggesting that some amount of air was moving from the first floor to the second floor even though the mechanical exhaust point was on the first floor It appears that the further depressurization of the first floor was insufficient to overcome the stack effect and draw a significant amount of outside air in through the rooms on the second floor
35 of 49
Research Report - 0602
182
9
192
9
202
9
212
9
222
9
232
9
029
129
229
329
429
529
629
729
828
929
102
8
112
8
122
8
0
10
20
30
40
50
60
70
SF
6 C
on
ce
ntr
ati
on
(m
gm
3)
BR1
Living
Kitchen
BR2
BR3
MBR
Mixing stopped
Mixing restarted
Hour
Figure 31 Tracer gas decay for 2-story house with exhaust ventilation from the laundry room at ASHRAE 622 level no central fan operation and bedroom doors closed (Test B1)
A supply ventilation test was performed on the 2-story house for about 11 hours starting late on January 4 (Test B3) The duct blaster was unable to provide the ventilation rate necessary to meet the minimum specified in ASHRAE 622 supplying 180 cfm instead of 189 cfm (95) The decay curves are shown in Figure 32 Although the curves are much more tightly packed than they were with the exhaust system there is more divergence than we saw with the supply system in the 1-story house most notably in the master bedroom
The reciprocal age-of-air calculations for both the exhaust and supply ventilation systems are shown in Figure 33 Again the results indicate that much better room-to-room distribution of ventilation air was achieved by the central-fan integrated supply system compared to the single-point exhaust system However for the supply ventilation test the differences in the initial tracer gas concentration were of the same magnitude as the differences in decay rates among the rooms As a result no conclusions should be drawn about the relative ranking of the supply ventilation rate among rooms based on Figure 33
36 of 49
Research Report - 0602
0
10
20
30
40
50
60
SF
6 C
on
ce
ntr
ati
on
(m
gm
3)
BR1
Living
Kitchen
BR2
BR3
MBR
Mixing stopped
Mixing restarted
2136 000 224 448 712 936 1200
Hour
Figure 32 Tracer gas decay for 2-story house with supply ventilation just under ASHRAE 622 level central fan operation at 33 duty cycle (20 min off 10 min on) and bedroom
doors closed (Test B3)
Simple Exhaust vs Central Fan Integrated
Supply )
000
005
010
015
020
025
Recip
rocal A
ge o
f A
ir (
1h
r
BR1
Living
Kitchen
BR2
BR3
MBR
Exhaust in laundry room no Centralized supply mixing
mixing 100 ASHRAE 33 duty cycle 95
doors closed ASHRAE doors closed
Figure 33 Reciprocal age-of-air for 2-story house with continuous exhaust ventilation (Test B1) compared to central fan integrated supply ventilation (Test B3) (Note
Uncertainties introduced by non-uniform starting concentration are of the same order of magnitude as the differences in reciprocal age-of-air among rooms for the supply ventilation case The relative ranking of rooms is not meaningful for that case)
37 of 49
Research Report - 0602
Air Handler Operation
The effect of occasional air handler operation on the distribution of exhaust ventilation air was evaluated on the afternoon of January 6 (Test B6) The tracer gas decay curves are shown in Figure 34 and reciprocal age-of-air calculations are shown in Figure 35 It should again be noted that before the test started the house was mixed using both the air handler and a de-stratification fan with the doors open During the test the doors were closed the de-stratification fan was turned off and the air handler operated at a 33 duty cycle (20 minutes off 10 minutes on) As was the case in the 1-story house this occasional operation of the air handler substantially improved the distribution of ventilation air among rooms even in conjunction with the point exhaust ventilation system There was very little divergence noticeable even with the air handler cycling on and off every half hour However because the initial differences in tracer gas concentration among rooms were as large as the differences in reciprocal age-of-air for the case with air handler operation no conclusions should be drawn about the relative ranking of ventilation rates among the rooms for that case
SF
6 C
on
cen
trati
on
(m
gm
3)
80
70
60
50
40
30
20
10
0
BR1
Living
Kitchen
BR2
BR3
MBR
Mixing stopped
Mixing restarted
1048 1200 1312 1424 1536 1648 1800 1912 2024
Hour
Figure 34 Tracer gas decay for 2-story house with continuous exhaust ventilation at ASHRAE 622 level central fan operation at 33 duty cycle (20 min off 10 min on) and
bedroom doors closed (Test B6)
38 of 49
Research Report - 0602
020
015 R
ec
ipro
ca
l A
ge
of
Air
(1
hr)
Exhaust Ventilation
No Mixing vs 33 Air Handler Duty Cycle
Exhaust in laundry room
no mixing 100
ASHRAE doors closed
33 air handler
operation exhaust in
laundry room 100
ASHRAE doors closed
BR1
Living
Kitchen
BR2
BR3
MBR
010
005
000
Figure 35 Reciprocal age-of-air for 2-story house with continuous exhaust ventilation with and without air handler operation (Tests B1 and B6) (Note Uncertainties introduced by non-uniform starting concentration are of the same order of magnitude as the differences in reciprocal age-of-air among rooms for the case with air handler operation The relative
ranking of rooms is not meaningful for that case)
Exhaust Location
The duct blaster was moved to the master bathroom exhaust register to see if there was a resulting change in ventilation air distribution (Test B18) The master bathroom was in the back of the house on the second floor between the master bedroom and bedroom 3 The decay curves are shown in Figure 36 and the reciprocal age-of-air results are shown in Figure 37 The rooms on each floor were well mixed before the test began although the mixing between the two floors was not as good Very wide divergence among rooms can be seen during the test especially between the upstairs bedrooms and the rest of the house Once again all three upstairs rooms appear to receive some air from the first floor but the master bedroom experiences a much higher volume of circulated air than the other two second-floor bedrooms which appear to be relatively stagnant
39 of 49
Research Report - 0602
0
10
20
30
40
50
60
70
80
90
SF
6 C
on
ce
ntr
ati
on
(m
gm
3)
BR1
Living
Kitchen
BR2
BR3
MBR
Mixing stopped
Mixing restarted
1912 2136 000 224 448 712 936 1200
Hour
Figure 36 Tracer gas decay for 2-story house with exhaust ventilation from the master bathroom at ASHRAE 622 level no central fan operation and bedroom doors closed (Test
B18)
Exhaust Ventilation
Laundry Room vs Master Bathroom
000
005
010
015
020
025
030
Exhaust in laundry room no
mixing 100 ASHRAE
doors closed
Exhaust in master bathroom
no mixing 100 ASHRAE
doors closed
Re
cip
roc
al A
ge
of
Air
(1
hr)
BR1
Living
Kitchen
BR2
BR3
MBR
Figure 37 Reciprocal age-of-air for 2-story house with exhaust ventilation from the master bathroom compared to the laundry room at ASHRAE 622 level no central fan operation
and bedroom doors closed (Tests B1 and B18)
40 of 49
Research Report - 0602
Ventilation Rate
The supply ventilation tests were repeated using flow rates of 60 and 33 of ASHRAE 622 recommendations corresponding to 114 cfm and 63 cfm respectively (Tests B2 and B4) The decay curves are shown in Figures 38 and 39 Reciprocal age-of-air for all three supply ventilation rates are shown in Figure 40 In all cases the rooms remained fairly well mixed especially rooms on the same floor As we observed in the 1-story house the ventilation rate in the 2-story house appeared to have very little effect on the uniformity of outside air provided to each room as long as it was mixed using the air handler One again the initial differences in tracer gas concentration among rooms were as large as the divergence in the decay curves preventing any conclusions about the relative ranking of ventilation rates among rooms for all three cases The error in initial concentration uniformity was bigger for the cases with air handler mixing because the relative divergence in the decay curves was so small compared to that of no air handler mixing In other words the error in relative ranking of ventilation rates for the cases with air handler mixing were not very important anyway because the relative differences between rooms were so small
1536 1648 1800 1912 2024 2136 2248
Hour
Figure 38 Tracer gas decay for 2-story house with supply ventilation at 60 of ASHRAE 622 level 33 central fan operation (20 min off 10 min on) and bedroom doors closed
(Test B2)
0
5
10
15
20
25
30
SF
6 C
on
cen
trati
on
(m
gm
3)
BR1 Living Kitchen BR2 BR3 MBR
Mixing stopped
Mixing restarted
41 of 49
Research Report - 0602
0
5
10
15
20
25
30
35
40
SF
6 C
on
cen
trati
on
(m
gm
3)
BR1
Living
Kitchen
BR2
BR3
MBR
Mixing stopped
Mixing restarted
1200 1312 1424 1536 1648 1800 1912
Hour
Figure 39 Tracer gas decay for 2-story house with supply ventilation at 33 of ASHRAE 622 level 33 central fan operation (20 min off 10 min on) and bedroom doors closed
(Test B4)
Supply Ventilation Rate Comparison
000
005
010
015
020
025
Re
cip
roc
al
Ag
e o
f A
ir (
1h
r)
BR1
Living
Kitchen
BR2
BR3
MBR
Centralized supply Centralized supply Centralized supply
mixing 33 duty mixing 33 duty mixing 33 duty
cycle 95 ASHRAE cycle 60 ASHRAE cycle 33 ASHRAE
doors closed doors closed doors closed
Figure 40 Reciprocal age-of-air for 2-story house with three levels of supply ventilation central fan operation at 33 duty cycle (20 min off 10 min on) and bedroom doors closed (Tests B3 B2 B4) (Note Uncertainties introduced by non-uniform starting
concentration are of the same order of magnitude as the differences in reciprocal age-of-air among rooms for all three cases The relative ranking of rooms is not meaningful for these
cases)
42 of 49
Research Report - 0602
The average air change rates for the three supply ventilation rates compared to the two exhaust ventilation schemes are shown in Figure 41 The CFIS system at 33 of the 622 ventilation flow rate provided a uniformly higher air change rate (013 ach) than the least ventilated rooms using exhaust ventilation from either the laundry or the master bathroom (010 ach Figure 37) It is noteworthy that the combined net air change rate with exhaust ventilation from the laundry room was significantly less than the air change rates for both exhaust ventilation from the master bathroom and supply ventilation at the air handler This illustrates the unpredictability of interactions between mechanical ventilation and natural infiltration which depend strongly on the distribution and size of cracks through which the outside air must pass to enter the house There may have been a relatively large building enclosure leakage opening near the laundry room (perhaps the utility penetrations or the door to the garage) that allowed a significant amount of outside air to quickly enter and leave the house through the exhaust flow without circulating around the house
0
005
01
015
02
025
Ave
rag
e A
CH
Natural Exhaust Exhaust Supply 95 Supply 60 Supply 33
Laundry Mbath
Rm 100 100
Figure 41 Average air change rates for 2-story house with supply ventilation at 33 60 and 95 of ASHRAE 622 recommendations (Tests B4 B2 B3) compared to natural
infiltration (Test B14) and exhaust ventilation with no central fan operation (Test B1) Bedroom doors were closed except for the natural infiltration test
Bedroom Doors
The laundry room exhaust ventilation test with no air handler operation (see Figure 31) was repeated with the doors open to evaluate the change in room-to-room ventilation air distribution (Test B10) The decay curves are shown in Figure 42 and the reciprocal age-of air calculations are shown in Figure 43 It is evident from Figure 42 that the test began before the rooms were
43 of 49
Research Report - 0602
0
5
10
15
20
25
SF
6 C
on
ce
ntr
ati
on
(m
gm
3)
BR1 Living Kitchen BR2 BR3 MBR
Mixing stopped
Mixing restarted
completely well mixed resulting in decay curves that could be somewhat misleading Because the master bedroom was at a higher concentration than the other rooms at the start of the test any room that received air from the master bedroom would appear to have a slower decay rate than it would have if the rooms started out at the same concentration Despite the difference in starting concentration it is clear that outside air was well distributed when the doors were open even without operation of the air handler
1843 1912 1940 2009 2038 2107 2136 2204 2233 2302
Hour
Figure 42 Tracer gas decay for the 2-story house with exhaust ventilation from the laundry room at ASHRAE 622 level no central fan operation and bedroom doors open
(Test B10)
Reciprocal age-of-air analysis was not performed for this case because of the combined effect of a short test duration (~2 hours) and unequal starting tracer gas concentrations even though the house was relatively well-mixed The important conclusion (that opening doors greatly improves mixing) can be drawn by inspecting the decay curves alone
Transfer Grilles
A final exhaust ventilation test was run on the 2-story house with the doors closed and the transfer grilles taped over The decay curves are shown in Figure 43 and the reciprocal age-ofshyair calculations are shown in Figure 44 The curves were clearly very divergent even after 12 hours By examining the reciprocal age-of-air results it is apparent that the transfer grilles in the 2-story house caused a noticeable improvement in ventilation air distribution but the improvement was smaller than when the doors were opened (Figure 42)
44 of 49
Research Report - 0602
0
5
10
15
20
25
30
SF
6 C
on
cen
tra
tio
n (
mg
m3
) BR1 Living Kitchen BR2 BR3 MBR
Mixing stopped
Mixing restarted
1648 1912 2136 000 224 448 712 936
Hour
Figure 43 Tracer gas decay for 2-story house with exhaust ventilation from the laundry room at ASHRAE 622 level no central fan operation bedroom doors closed transfer
grilles taped closed (Test B7)
Exhaust Ventilation Transfer Grilles Untaped vs Taped
000
005
010
015
020
Re
cip
roc
al
Ag
e o
f A
ir (
1h
r)
BR1
Living
Kitchen
BR2
BR3
MBR
Exhaust in laundry room no Exhaust in laundry room no
mixing 100 ASHRAE mixing 100 ASHRAE
doors closed doors closed transfer
grilles taped
Figure 44 Reciprocal age-of-air for 2-story house with exhaust ventilation from the laundry room at ASHRAE 622 level no central fan operation and doors closed In the first case the transfer grilles are untaped (Test B3) in the second they are taped closed
(Test B7)
45 of 49
Research Report - 0602
CONCLUSIONS
bull Reciprocal age-of-air analysis was chosen as a quantitative method for characterizing distribution of ventilation air among rooms This method worked well in cases where rooms were well mixed to begin the test and weather conditions were sufficiently steady-state
bull A test period of at least 1frac12 air changes was necessary to obtain reasonably accurate ageshyof-air results when there was significant divergence in tracer gas concentration among the rooms
bull Although we did not achieve uniform initial concentration of tracer gas in the 2-story house using our test methodology and the equipment at hand we believe the reciprocal age-of-air calculations were meaningful in many of the cases as indicated in the discussion
bull Both houses were relatively tight with natural infiltration averaging 008 ACH for the 1shystory house and 011 ACH for the 2-story house
bull Both houses had relatively small (but not negligible) duct losses to the outside producing an increase in infiltration of less than 003 ACH for the 1-story house and 002 ACH for the 2-story house when the air handler runs
bull Age-of-air analysis indicated that ventilation supplied through the central air distribution system provided much more uniform distribution of ventilation air than the single-point exhaust system when the doors were closed and the air handler was not running For the 1-story house the central-fan-integrated supply ventilation case at 60 of ASHRAE 622 provided more outside air to all rooms than the least-ventilated room in the exhaust case at 100 of 622 For the 2-story house the central-fan-integrated supply system at 33 of the 622 flow rate provided more outside air to all rooms than the least ventilated rooms using exhaust ventilation at 100 of 622 from either the laundry or the master bathroom
bull Operation of the central fan at a 33 duty cycle maintained relatively well-mixed conditions regardless of ventilation rate type of ventilation system (supply or exhaust) or house configuration (1-story or 2-story)
bull Exhaust location affected both the relative amount of outside air received by different rooms and the overall uniformity among rooms but the effect was not predictable
bull For exhaust-only ventilation without central fan operation opening bedroom doors appeared to significantly improve the mixing of ventilation air among rooms
bull Transfer grilles improved the distribution of ventilation air slightly but much less than opening the bedroom doors
bull In the 2-story house the stack effect caused air movement from the first floor to the second floor even when exhaust ventilation was applied to the first floor resulting in consistently higher tracer gas concentrations on the second floor and more non-uniform ventilation air distribution in general
bull Interactions between natural infiltration and both exhaust and supply mechanical ventilation were very significant When the ventilation system was activated the combined air change rate did not increase commensurate with the measured ventilation rate but instead increased by only half that amount This result was consistent with combining ventilation and infiltration in quadrature to estimate whole-house air change rate in accordance with ASHRAE Standard 136 (ASHRAE 1993)
46 of 49
Research Report - 0602
FUTURE WORK
In future tests continuous monitoring of pressure differentials would enhance our understanding of the multi-zone combined infiltration and ventilation systems and our ability to model them That would help to explain differences between tests in more detail including the effects of multiple stories location of ventilation supply outlets and exhaust inlets interior door closure and use of passive return air transfer grilles Pressure differential measurement points should include
bull dP with respect to outside for each closed room and open space bull dP across closed interior doors bull dP between the floor cavity and outdoors and bull dP between the house and the attic
Measurement of wind direction along with wind speed could also be helpful for modeling these buildings and systems However because of micro-climate wind shielding it may be very difficult to relate a single-point wind direction measurement to actual wind vectors on the building surfaces
ACKNOWLEDGMENTS
The authors express their appreciation to Rich Coyle of DR Horton for providing the test houses and to Joseph Lstiburek of BSC Subrato Chandra and Neil Moyer of FSEC and Greg Barker of Mountain Energy Partnership for their assistance in the planning and execution of this ventilation study
47 of 49
Research Report - 0602
REFERENCES
ASHRAE (1993) ANSIASHRAE Standard 136-1993 A Method of Determining Air Change Rates in Detached Dwellings Atlanta GA American Society of Heating Refrigerating and Air-Conditioning Engineers Inc
ASHRAE (1997) ANSIASHRAE Standard 129-1997 Measuring Air-Change Effectiveness Atlanta GA American Society of Heating Refrigerating and Air-Conditioning Engineers Inc
ASHRAE (2004) ASHRAE Standard 622-2004 Ventilation and Acceptable Indoor Air Quality in Low-Rise Residential Buildings Atlanta GA American Society of Heating Refrigerating and Air-Conditioning Engineers Inc
CSA (2003) CANCSA F326-M91 Residential Mechanical Ventilation Systems Canadian Standards Association Ontario Canada httpwwwcsashyintlorgonlinestoreGetCatalogItemDetailsaspmat=2410793ampParent=102
NBC 2005 National Building Code of Canada httpircnrcshycnrcgccapubscodesnrcc47666_ehtml
Grieve PW (1991) Measuring Ventilation Using Tracer-Gases Denmark Bruumlel amp Kjaeligr
MN Chapter 7672 Minnesota Energy Code Chapter 7672 Detached Single-Family And Two-Family Dwellings httpwwwstatemnusmnexternalDocsCommerceChapter_7672_Residential_111302012428 _72rulepdf
Persily AK Martin SR (2000) A Modeling Study of Ventilation in Manufactured Houses Gaithersburg MD National Institute of Standards and Technology NISTIR 6455
Rudd A Lstiburek J (2000) ldquoMeasurement of Ventilation and Interzonal Distribution in Single-Family Homesrdquo ASHRAE Transactions 2000 MN-00-10-3 V 106 Pt2 American Society of Heating Refrigeration and Air-Conditioning Engineers Atlanta GA
WAC (2004) Washington State Title 51 WAC Community trade and economic development department of (building code council) Chapter 51-13 Ventilation and indoor air quality httpappslegwagovWACdefaultaspxcite=51-13
48 of 49
Research Report - 0602
Field test of room-to-room uniformity of ventilation air distribution in two new houses
About this Report
This report was prepared for the US Department of Energyrsquos Building America
Program The report is freely available to the public at wwwbuildingamericagov
The authors express their appreciation to Rich Coyle of DR Horton for providing the test houses and to Joseph Lstiburek of BSC Subrato Chandra and Neil Moyer of
FSEC and Greg Barker of Mountain Energy Partnership for their assistance in the planning and execution of this ventilation study
About the Authors
Robert Hendron Ren Anderson Dennis Barley are with National Renewable Energy Laboratory Armin Rudd and Aaron Townsend are with Building Science Corporation
Ed Hancock is with Mountain Energy Partnership
Direct all correspondence to Building Science Corporation 30 Forest Street Somerville MA 02143
Limits of Liability and Disclaimer of Warranty
Building Science documents are intended for professionals The author and the publisher of this article have used their best efforts to provide accurate and authoritative information in regard to the subject matter covered The author and publisher make no warranty of any kind expressed or implied with regard to the information contained in this article
The information presented in this article must be used with care by professionals who understand the implications of what they are doing If professional advice or other expert assistance is required the services of a competent professional shall be sought The author and publisher shall not be liable in the event of incidental or consequential damages in connection with or arising from the use of the information contained within this Building Science document
49 of 49

Research Report - 0602
ventilation systems or by mixing via a central air handling system A large US private-sector high-performance home program also requires periodic central air handler operation to assure whole-house mixing for ventilation air distribution and thermal comfort Prior work by Rudd (2000) showed that ventilation systems that utilized whole-house distribution and mixing via the central air handling system had much less room-to-room variation in ventilation air exchange than systems that did not
This research program evaluated the distribution of ventilation air in two new test houses using several different ventilation system configurations and air-mixing scenarios The test program was conducted in late December 2005 and early January 2006 during relatively mild winter weather in Sacramento The first test house was a one-story model with four bedrooms The second was a two-story model also with four bedrooms Both houses were designed to be energy efficient had slab-on-grade foundations ducts in conditioned space and met the builderrsquos airtightness target measured with a blower door (lt125 in2 effective leakage area per 100 ft2 envelope area) Other key specifications for both houses are summarized in Table 1 and photos are shown in Figures 1 and 2 Floor plans are shown in Figures 3 and 4
The primary purpose of this test program was to characterize the uniformity of room-to-room distribution of outside air under various conditions by examining multi-zone tracer gas decay curves In order for dilution ventilation systems to provide predictable results independent of the geometry of individual homes outside air must be uniformly distributed throughout the house The tests in the Sacramento houses were designed to allow direct quantitative comparisons of various ventilation approaches which could potentially be factored into ventilation rate tradeshyoffs in future updates to ASHRAE Standard 622 (ASHRAE 2004)
4 of 49
Research Report - 0602
Table 1 Specifications for DR Horton test houses
1-Story (1111 Montague) 2-Story (1117 Montague)
Geometry 4-bedrooms 2-bath 4-bedrooms 2-bath 2075 ft2 2582 ft2
10 ft ceilings 10 ft ceilings
Building envelope Ceiling amp wal Optima advanced insulation system ls Optima advanced insulation system Foundation Slab-on-grade Slab-on-grade Infiltration 1583 CFM50 as tested using a blower-door 1383 CFM50 as tested using a blower-
door Mechanical systems Heat Sealed-combustion gas furnace Sealed-combustion gas furnace Cooling 14 SEER air conditioner 14 SEER air conditioner Air distribution Ducts inside conditioned space 49 CFM25 Ducts inside conditioned space 44
duct leakage to the inside transfer grilles CFM25 duct leakage to the inside between bedrooms and main living space transfer grilles between bedrooms and
main living space Ventilation Central fan integrated supply (CFIS) Central fan integrated supply ventilation
ventilation w Aprilaire VCS model 8126 (CFIS) w Aprilaire VCS model 8126 motorized damper 33 duty cycle motorized damper 33 duty cycle
Figure 1 DR Horton 1-story test house (1111 Montague)
5 of 49
Research Report - 0602
Figure 2 DR Horton 2-story test house (1117 Montague)
6 of 49
Research Report - 0602
BR1
BR2
BR3
MBR Living Rm
Entry
copy buildingsciencecom
Figure 3 1-story test house floor plan (1111 Montague)
7 of 49
Research Report - 0602
MBR
BR1
BR3
BR2
Kitchen
Living
copy buildingsciencecom
Figure 4 2-story test house floor plan (mirror image of 1117 Montague)
TEST PLAN
Research Questions
The following series of research questions were identified by the researchers to quantify the ventilation distribution characteristics of the test houses under various operating conditions
1 What is the natural air change rate (ACH) for each house with bedroom doors open no air handler operation and no mechanical ventilation What is the room-to-room uniformity in outside air distribution
2 What is the change in whole-house ACH caused by air handler operation What is the change in room-to-room uniformity of outside air distribution
3 What is the change in whole-house ACH caused by closing the bedroom doors What is the change in room-to-room uniformity of outside air distribution
4 What is the change in whole-house ACH caused by taping over the transfer grilles What is the change in room-to-room uniformity of outside air distribution
5 What is the difference in whole-house ACH for a central-fan integrated supply ventilation system (CFIS) operating at 33 duty cycle compared to a continuous exhaust ventilation
8 of 49
Research Report - 0602
system with both systems meeting the ASHRAE 622 recommended minimum ventilation rate on average How does the resulting room-to-room uniformity of outside air distribution compare
6 How does the whole-house ACH and uniformity of outside air distribution change for a CFIS ventilation system when the ventilation rate is lowered from 100 of the ASHRAE 622 recommendation to 60 and to 33
7 How does the whole-house ACH and uniformity of outside air distribution change for the continuous exhaust ventilation system when the location of the exhaust port is changed from the utility room to the master bathroom
8 How uniform is the outside air distribution for the two-story house compared to the one-story house
Test Set-Up
Single-tracer gas decay with multi-zone sampling was used to evaluate the performance of each ventilation system based on how uniformly outside air was distributed to each room or zone within the house The decay curves demonstrate the rate at which the tracer gas (representing a pollutant) which is initially distributed uniformly throughout the house is diluted within each zone as a result of outside air that enters the zone directly as well as air that is exchanged among zones Air entering one zone from another may contain either a higher or lower concentration of the tracer than the air already in the zone This test method is designed as a practical method to evaluate the uniformity of ventilation air distribution within a home assuming that dangerous pollutants such as radon are controlled using appropriate source mitigation strategies Uniform distribution of outside air is required for dilution ventilation systems to provide predictable results independent of the geometry of individual homes
A multi-zone tracer gas sampling system was installed in each house for the test This equipment consisted of a Bruel and Kjaer model 1302 multi-gas monitor and a model 1303 multi-point sampler as shown in Figure 5 Sample tubes were placed in six locations in each house and attached to the multi-point sampler The six sampled locations are designated with red stars on the floor plans in Figures 3 and 4 The sampler was programmed to draw a sample from each sequential location at an interval of about 2 minutes thus all six locations were sampled at an interval of about 12 minutes
The air sample in each zone was taken near the center of the room at a height of four feet above the floor The zone air temperature was measured at the same location The local zone air temperature measurement was used to control the electric heater in each zone (see Test Procedure section below) to achieve a uniform and constant air temperature throughout the house Mixing fans were used to maintain uniform temperatures and concentrations within each room A photo of this set up is shown in Figure 6
9 of 49
Research Report - 0602
copy buildingsciencecom
Figure 5 Multi-zone tracer gas sampling and monitoring equipment
Mixing Fan
Heater
Temperature Sampling Location
Figure 6 Tracer gas sampling point temperature sensor room air mixing and co-heating set-up
The air flow rates for both supply and exhaust ventilation were carefully controlled during the test using a Duct Blaster fan and measurement system For exhaust ventilation the Duct Blaster fan was placed near the location of the ceiling exhaust fan and a length of flexible duct was used to connect the normal entrance for the exhaust fan to the Duct Blaster All of the air flowing through the exhaust fan during the test was first routed through the Duct Blaster The Duct Blaster speed control was adjusted to achieve the desired flow rate and the Duct Blaster flow ring and pressure tap were used to measure the air flow rate The exhaust fan itself was operated in
10 of 49
Research Report - 0602
conjunction with the duct blaster to reduce the resistance to air flow Figure 7 shows the Duct Blaster installed at the laundry room exhaust register
copy buildingsciencecom
Figure 7 Duct Blaster installed at the laundry room exhaust register
A similar application of the Duct Blaster was used to control and measure the supply air flow rate during the tests of the CFIS system The normal configuration of flexible duct connecting the air handler return to the outside was changed so that all outside air would flow through the Duct Blaster The flexible duct was disconnected from the air handler return and attached to the inlet to the Duct Blaster The Duct Blaster outlet duct was attached to the air handler return The Duct Blaster speed control was used to achieve the desired air flow rate and the Duct Blaster flow ring and pressure tap were used to measure the flow rate This installation is shown in Figure 8
Natural infiltration rates varied during the tests depending on weather conditions which were monitored using a portable weather station
It should be noted that the supply ventilation ducts in the test houses were not sized for the flow rates desired in the tests The ventilation flow rate measured during normal operation of the air handler in the 1-story house was about 10 cfm compared to 174 cfm required to meet the ASHRAE 622 recommendations This flow rate was also significantly less than the design flow rate of about 40-60 cfm It was necessary to operate the Duct Blaster fan at maximum power to achieve the required air flow rate during some tests It was unclear if the outside air duct was too long too small or too tortuous or if insufficient negative pressure was present at the return of the air handler because the central return grille was just a few inches away (see Figure 8)
11 of 49
Research Report - 0602
copy buildingsciencecom
Figure 8 Duct Blaster installed between the outside air duct and the return of the air handler to provide supply ventilation
Test Procedure
The tracer gas used was sulfur hexafluoride (SF6) a stable non-toxic gas that was injected into each house volume from a small compressed gas cylinder carried by hand around the house During the dosing period the furnace fan was used to achieve an initially well-mixed condition with a concentration of about 15 parts per million (PPM) During this period the doors were kept open and a portable de-stratification fan was used in the 2-story house to improve mixing between floors Then the mixing fans were stopped and the divergence in concentration from zone to zone was observed (with doors either open or closed depending on the test objective) Small portable fans in each zone continued running to maintain a well-mixed condition within each zone The interior air temperature in each zone was controlled during the test period using portable electric heaters instead of the furnace so that operation of the air handler could be controlled independently from the demand for heating At the conclusion of the test the whole house was again mixed by opening the doors and turning on the air handler This allowed the calculation of an average whole-house air change rate for each set of test conditions
The tests were planned for rather mild weather to minimize infiltration effects so as to isolate and test the performance of the mechanical ventilation systems The general design goal was to provide the minimum amount of mechanical ventilation recommended by ASHRAE Standard 622-2004 (ASHRAE 2004) (58 cfm for the 1-story house 63 cfm for the 2-story house) and observe the effects of providing central fan integrated supply versus single-point exhaust ventilation operating the central fan closing the bedroom doors and taping the transfer grilles above the doors
12 of 49
Research Report - 0602
The results of the multi-zone tracer gas decay tests are presented graphically as families of decay curves These graphs illustrate the uniformity or non-uniformity of the ventilation effect among the various rooms and allow ranking of the rooms from the least to the most ventilation effect
In addition if the ventilation rates were sufficiently steady for the duration of the test period we used local mean age-of-air analysis to evaluate the results more quantitatively Age-of-air analysis is a well-established approach to testing ventilation rates at various points or in various zones within a building (Grieve 1991) Age-of-air is defined as the average length of time that air molecules have resided within the building The formula for calculating local mean age-ofshyair in a tracer gas decay test is given in ASHRAE Standard 129-1997 (ASHRAE 1997) as follows
Ai = 1 intinfin
Ci (t)dt (1)C0 0
where
i = Index for measurement point representing a well-mixed zone Ai = Local mean age-of-air at point i (hr) C = Concentration of tracer gas (lbmft3) C0 = Initial value of C in well-mixed building (lbmft3) Ci = Time-varying concentration of tracer gas at point i (lbmft3) t = Time (hr)
In order to compare the ventilation rates among the rooms or zones in the home we use the metric Reciprocal Age-of-Air
Reciprocal Age-of-Air = 1Ai (2)
Reciprocal Age-of-Air has units of 1hr and is equivalent to the air change rate (ACH) in a single well-mixed zone (Persily 2000)
The definition of Ai in Equation (1) involves an integral of infinite duration This is handled in the test procedure through a two-step process
Step 1 The tracer gas decay test is continued until (a) the initial transient effects of interzonal airflow have subsided and all of the decay curves resemble simple exponential functions and (b) the tracer concentrations are rather small compared to their initial values so that any extrapolation errors will have a small effect on the result In this field test most of the multi-zone tests were continued for 12 hours These portions of the decay curves were integrated numerically using the trapezoid rule
13 of 49
Research Report - 0602
Step 2 The remaining portions (the tails) of the decay curves were extrapolated to infinity using a simple exponential decay function which was matched to the decay rate of the final portion of each measured decay curve These portions of the curves were integrated analytically
Once the conditions of Step 1 were satisfied the rooms were re-mixed by opening the bedroom doors and operating the air handler This allowed the calculation of an effective whole-house air change rate using the relationship in Equation 3
Average whole-house air change rate (ACH) = ln(C0Cf)∆t (3)
where
Cf = Concentration of tracer gas after rooms are re-mixed (lbmft3) ∆t = Elapsed time between initial and final well-mixed cases (hr)
Test Matrix
The series of test conditions for the 1-story and 2-story houses are described in Tables 2 and 3 Most of the important tests were conducted for a 12-hour period overnight to ensure sufficient accuracy when calculating reciprocal age-of-air
Table 2 Test sequence for 1-story test house
Central fan
cycling Duration Vent Vent flow (min off
Test Date Time (hrs) Config rate (cfm) min on) Doors Notes
A1 Dec 28 AM 3 Exhaust 58 none closed
A2 PM 3 Exhaust 58 2010 closed
A3 overnight 12 Exhaust 58 none closed A4 Dec 29 AM 4 Supply 104 33 2010 closed
duty cycle A5 PM 4 Supply 58 33 duty 2010 closed
cycle A6 overnight 12 Supply 174 33 2010 closed
duty cycle
A7 Dec 30 AM-PM 8 None 0 none open Natural infiltration
A8 PM 2 None 0 none open AH bump
A9 overnight 12 Exhaust 58 none open
A10 Dec 31 AM-PM 6 Exhaust 58 none closed Transfer grills taped
A11 PM 6 Exhaust 58 2010 closed Transfer grills taped
A12 Jan 1 overnight 12 Exhaust 58 2010 closed
A13 PM 6 Exhaust 58 2010 open
A14 overnight 12 Exhaust 58 54 none closed
A15 Jan 2 AM-PM 6 None 0 none closed Natural infiltration
A16 overnight 12 Exhaust 58 none closed Master bath exhaust
14 of 49
Research Report - 0602
Table 3 Test sequence for 2-story test house
Central fan
cycling Duration Vent Vent flow (min off
Test Date Time (hrs) Config rate (cfm) min on) Doors Notes B1 Jan 3 overnight 14 Exhaust 63 none closed
B2 Jan 4 PM 5 Supply 114 33 20 10 closed 60 ASHRAE 622 duty cycle
B3 overnight 11 Supply 180 33 20 10 closed 95 ASHRAE 622 duty cycle
B4 Jan 5 PM 4 Supply 63 33 duty 20 10 closed 33 ASHRAE 622 cycle
B5 overnight 13 Exhaust 63 5010 closed
B6 Jan 6 PM 6 Exhaust 63 2010 closed
B7 overnight 12 Exhaust 63 none closed Transfer grilles taped
B8 Jan 7 AM 4 Exhaust 63 50 10 closed Transfer grilles taped
B9 PM 4 Exhaust 63 none closed Transfer grilles taped extra injection in MBR
B10 PM 2 Exhaust 63 none open
B11 overnight 9 Supply 114 33 20 10 closed Transfer grilles taped duty cycle
B12 Jan 8 PM 3 None 0 100 closed Transfer grilles taped air handler bump test
B13 PM 2 None 0 100 closed Transfer grilles untaped
B14 PM 2 None 0 none open Natural infiltration
B15 overnight 9 Exhaust 63 none closed Master bath exhaust transfer grilles taped
B16 Jan 9 AM 4 Exhaust 63 50 10 closed Master bath exhaust
B17 PM 4 Supply 178 33 20 10 closed duty cycle
B18 overnight 12 Exhaust 63 none closed Master bath exhaust
TEST RESULTS FROM 1-STORY HOUSE (1111 MONTAGUE)
Natural Infiltration
A test of natural infiltration was conducted for an 8-hour period on December 30 to examine the magnitude and variability of outside air entering the house through leaks in the building envelope (Test A7) The tracer gas decay curves are shown in Figure 9 It is evident that the house was very well mixed during this test which allows a running instantaneous calculation of whole-house ACH over the same time period (see Figure 10) Although the air change rate indicated that the house is relatively tight (about 0085 ACH on average) the effect of natural infiltration was far from negligible especially when the wind was blowing This variability of natural infiltration must be kept in mind when interpreting the decay curves and reciprocal age-of-air calculations that follow
15 of 49
Research Report - 0602
An air handler bump test was performed between 1300 and 1500 hours to examine the effect of air handler operation on whole house air exchange rate including duct leakage to the outside and changes in room-to-room pressurization caused by moving air from the supply registers in each room to the central return in the main living area Figure 10 shows both the hourly average ACH and the wind speed during this period At first glance it appears that the air change rate increased by about 003 ACH when the fan was turned on but there was a coincident jump in wind speed that complicates this interpretation There was no corresponding decrease in ACH when the air handler was turned off at 1500 hours Ultimately we cannot conclusively quantify the change in ACH associated with operation of the air handler but it appears to have been no more than 003 ACH
3
Co
ncen
trati
on
(m
gm
)
70
60
50
40
30
20
10
0
Living
Entry
BR1
BR2
BR3
MBR
Air Handler On
Air Handler Off
8 9 10 11 12 13 14 15 16 17 18
Hour
Figure 9 Tracer gas decay for 1-story house with no ventilation and bedroom doors open with and without central fan operation (Test A7)
16 of 49
Research Report - 0602
40016
35014 Air Handler On Air Handler Off
ACH
Wind Speed
Air
Ch
an
ge
Ra
te (
AC
H) 30012
25010
20008
15006
10004
Win
d S
pe
ed
(m
ph
)
002 05
00
8 10 12 14 16 18
000
Hour
Figure 10 Average air change rate for 1-story house with no ventilation no central fan operation and bedroom doors open (Test A7)
The natural ventilation test was repeated on January 2 with the doors closed instead of open (Test A15) providing the decay curves shown in Figure 11 The average air change rate for this case was 0086 ACH calculated based on the two well-mixed cases at the beginning and end of the test It is difficult to compare this number with the doors-open case because it was windy (4-5 mph) for the first few hours of this test However it is very clear that the uniformity of room-toshyroom distribution of outside air was significantly less when the doors were closed even with transfer grilles We did not calculate age-of-air for this test because the test conditions were not sufficiently steady state This fact is very evident at about hour 15 where the BR2 and BR3 curves suddenly begin to diverge from the MBR curve
17 of 49
Research Report - 0602
0
10
20
30
40
50
60
70
80
90
Co
ncen
trati
on
(m
gm
3 )
Living
Entry
BR1
BR2
BR3
MBR
Mixing stopped
Mixing restarted
10 11 12 13 14 15 16 17 18 19
Hour
Figure 11 Tracer gas decay for 1-story house with no ventilation no central fan operation and bedroom doors closed (Test A15)
Distributed Supply vs Point Exhaust Ventilation
Two of the most common ventilation schemes in Building America homes are continuous single-point exhaust ventilation and intermittent central-fan integrated supply (CFIS) ventilation Exhaust ventilation is most commonly installed in a bathroom laundry room or utility room Make-up air enters through the cracks and holes in the building envelope upon depressurization of the house The distribution of outside air in a given room is fairly unpredictable because it depends on the amount of depressurization in the room the number and size of openings in exterior walls and the influence of adjacent rooms Supply ventilation provided by a central-fan integrated system tends to be distributed more uniformly throughout the house However the fan is usually operated on a duty cycle of about 33 to limit the electricity used by the central fan and one of the goals of this testing is to evaluate the effect of that duty cycle on the consistency of the air mixing
The decay curves for a 12-hour overnight test with exhaust ventilation (Test A3) are shown in Figure 12 The exhaust fan register in the laundry room was used as the exhaust point and the Duct Blaster was used to exhaust 58 cfm continuously corresponding to the minimum ventilation rate recommended by ASHRAE for a 2075 ft2 4-bedroom house It is evident from the decay curves that significantly more outside air reached the master bedroom and less reached Bedroom 2 compared to the other rooms in the house
18 of 49
Research Report - 0602
0
2
4
6
8
10
12
14
Co
nc
en
tra
tio
n
mg
m3
Living
Entry
BR1
BR2
BR3
MBR
Mixing stopped
Mixing restarted
17 18 19 20 21 22 23 0 1 2 3 4 5 6
Hour
Figure 12 Tracer gas decay for 1-story house with exhaust ventilation from the laundry room at ASHRAE 622 level no central fan operation and bedroom doors closed (Test A3)
The corresponding decay curves for the central fan integrated supply system (Test A6) are shown in Figure 13 The air handler operated at a 33 duty cycle (20 min off 10 min on) with a ventilation rate of 174 cfm resulting in an average ventilation rate of 58 cfm again meeting the minimum ASHRAE 622 recommendations The whole house appeared to be well-mixed in this case because the decay curves were clustered together throughout the test Even during the 20 minute periods when the air handler was off there was very little divergence A comparison of Figure 12 to Figure 13 indicates that much more uniform distribution of ventilation air was achieved by using the CFIS system
19 of 49
Research Report - 0602
0
2
4
6
8
10
12
14
16
Co
nc
en
trati
on
(m
gm
3 )
Living
Entry
BR1
BR2
BR3
MBR
Mixing stopped
Mixing restarted
185 195 205 215 225 235 05 15 25 35 45 55 65
Hour
Figure 13 Tracer gas decay for 1-story house with supply ventilation at ASHRAE 622 level 33 central fan operation (20 min off 10 min on) and bedroom doors closed (Test
A6)
Reciprocal age-of-air calculations were performed to provide a quantitative comparison of the two ventilation systems as shown in Figure 14 Values were in the range of 0169 hr-1 +0042shy0038 hr-1 for the exhaust ventilation system compared to 0173 hr-1 +0002-0003 hr-1 for the supply ventilation system expressed in terms of the range of differences between the reciprocal age-of-air in each room and the whole-house air change rate With the exhaust ventilation at the laundry room the master bedroom received the greatest amount of fresh air We suspect this may have been caused by the presence of the exhaust ducts used for spot ventilation of the master bathroom possibly providing greater leakage area near the master bathroom than is present in other areas of the house The supply system distributed the ventilation air more uniformly but it is not entirely clear whether this result was primarily caused by the introduction of ventilation air through the supply ducts or by the air handler mixing air throughout the house Since it is clear that the exhaust ventilation showed better uniformity of ventilation with central system mixing it follows that mixing is likely to be the primary factor in the room-to-room uniformity shown by CFIS ventilation
It is also noteworthy that the average net air change rates provided by both the supply and exhaust ventilation systems were only about 018 ACH compared to the 025 ACH that would be expected if the mechanical ventilation rate (017 ACH) and the natural infiltration rate (008 ACH) were additive as they might be with a balanced ventilation system Adding mechanical ventilation to natural infiltration in quadrature results in an estimated average air change rate of 019 ACH which is fairly consistent with the measured values
20 of 49
Research Report - 0602
Recip
rocal
Ag
e o
f A
ir (
1h
r) 025
020
015
010
005
000
Simple Exhaust vs Central Fan Integrated
Supply
Centralized supply mixing
33 duty cycle 100
ASHRAE doors closed
Living
Entry
BR1
BR2
BR3
MBR
Exhaust in utility room no
mixing 100 ASHRAE
doors closed
Figure 14 Reciprocal age-of-air for 1-story house with continuous exhaust ventilation (Test A3) compared to central fan integrated supply ventilation (Test A6)
Air Handler Operation
To determine how much room-to-room mixing was caused by the air handler the exhaust only test was re-run with the air handler operating at 33 duty cycle (20 min off 10 min on) (Test A12) The decay curves are shown in Figure 15 Compared to Test A3 (Figure 12) there was a noticeable increase in uniformity when the air handler was operating even though the entry points for the ventilation air were uncontrolled As shown in Figure 16 the range of reciprocal age of air was reduced from +0042-0038 hr-1 to +0019-0011 hr-1) It appears that operation of the air handler explains most of the difference between the supply and exhaust ventilation systems discussed earlier Although it also appears that the overall average air change rate was higher in the case where the air handler was operating (0216 ACH vs 0176) it should be noted that the average wind speed was also significantly higher It is likely that the wind speed was the primary cause of the difference in average ACH not a difference in the mechanical ventilation rate
21 of 49
Research Report - 0602
0
5
10
15
20
25
30
35
Co
nce
ntr
ati
on
(m
gm
3 )
Living
Entry
BR1
BR2
BR3
MBR
Mixing stopped
Mixing restarted
0 1 2 3 4 5 6 7 8 9 10 11 12 13 14
Hour
Figure 15 Tracer gas decay for 1-story house with continuous exhaust ventilation at ASHRAE 622 level 33 central fan operation (20 min off 10 min on) and bedroom
doors closed (Test A12)
Exhaust Ventilation No Mixing vs 33 Air Handler Duty Cycle
000
005
010
015
020
025
Recip
rocal A
ge o
f A
ir (
1h
r)
Living
Entry
BR1
BR2
BR3
MBR
Exhaust in utility room 33 air handler
no mixing 100 operation exhaust in
ASHRAE doors closed utility room 100
ASHRAE doors closed
Figure 16 Reciprocal age-of-air for 1-story house with continuous exhaust ventilation with and without air handler operation (Tests A3 and A12)
22 of 49
Research Report - 0602
Exhaust Location
The preceding analysis of exhaust ventilation was based on an exhaust point in the laundry room which was relatively centrally located in the 1-story house To examine the effect of moving the exhaust point the duct blaster was moved to the master bathroom which was located in a far corner of the house (Test A16) A continuous exhaust ventilation rate of 58 cfm was again applied to the house resulting in the tracer gas decay curve shown in Figure 17 It is difficult to visually identify a significant difference between this series of curves and those shown in Figure 12 for the laundry room exhaust location
Because the curves were steady it is again possible to compare the results based on reciprocal age-of-air as shown in Figure 18 There appeared to be very little change in the distribution of outside air to most rooms However the reciprocal age-of-air in the master bedroom dropped noticeably when the exhaust location was moved to the master bathroom probably because a greater fraction of the outside air now passed through other rooms before reaching the master bedroom With the exhaust point centrally located most of the ventilation air passing through the master bedroom probably entered from the outside In both cases however the master bedroom had the highest reciprocal age-of-air of all of the rooms in the house and the BR2 location had the lowest
Co
nc
en
tra
tio
n (
mg
m3)
40
35
30
25
20
15
10
5
0
Living
Entry
BR1
BR2
BR3
MBR
Mixing stopped
Mixing restarted
19 20 21 22 23 0 1 2 3 4 5 6 7 8
Hour
Figure 17 Tracer gas decay for 1-story house with exhaust ventilation from the master bathroom at ASHRAE 622 level no central fan operation and bedroom doors closed (Test
A16)
23 of 49
Research Report - 0602
Exhaust Ventilation
Laundry Room vs Master Bathroom
000
005
010
015
020
025
Exhaust in laundry
room no mixing 100
ASHRAE doors closed
Exhaust in master
bathroom no mixing
100 ASHRAE doors
closed
Re
cip
roc
al A
ge
of
Air
(1
hr)
Living
Entry
BR1
BR2
BR3
MBR
Figure 18 Reciprocal age-of-air for 1-story house with exhaust ventilation from the master bathroom compared to the laundry room at ASHRAE 622 level no central fan operation
and bedroom doors closed (Tests A3 and A16)
Ventilation Rate
The supply ventilation test was repeated using flow rates corresponding to 60 and 33 of the ASHRAE recommendations The intent of this series of tests was to evaluate the room-to-room ventilation uniformity for ventilation rates consistent with ASHRAE 622 compared to the uniformity for reduced mechanical ventilation rates Each test was conducted for only 4 hours because of time limitations The decay curves are shown in Figures 19 and 20 Because the rooms were well-mixed during the supply ventilation tests the average whole-house ACH can be compared directly to the reciprocal age-of-air for the exhaust ventilation tests Figure 21 shows the supply ventilation air change rate for each of the three ventilation levels (33 60 100) compared to room-by-room reciprocal age-of-air for the exhaust ventilation system based on the boundary conditions present during the tests It appears that in the supply ventilation case all rooms receive more outside air than the least-ventilated room in the exhaust case (BR2) even at 60 of ASHRAE 622 These results serve to illustrate the trade-off between whole-house ventilation rate and room-to-room ventilation uniformity in terms of their impact on the worst room(s)
24 of 49
Research Report - 0602
The ASHRAE 622 committee has not currently defined the level of mixing that is required when choosing the minimum ventilation rate Some might interpret the results of this test to suggest that a house without mixing can have individual rooms that do not receive sufficient outside air even though the ventilation system is operating at 622 specified rates Because the 622 committee has not specified the level of mixing that is required when choosing the minimum ventilation rate the ventilation rate required by different ventilation systems is open to interpretation For example if the exhaust system performance shown in Figure 21 is acceptable does this mean that a ventilation system that provides good distribution of outside air may be sufficiently well-ventilated at 60 of the ASHRAE 622 level or perhaps even less Alternatively it might be concluded that exhaust ventilation rates should be increased over current ASHRAE 622 recommendations because of the possibility that certain rooms may receive very little fresh air Unfortunately because the current 622 standard does not specify air mixing requirements and the committeersquos assumptions about ventilation air distribution are not well documented it is difficult to make any firm recommendations in this area However we can conclude that air mixing is required for dilution ventilation systems to provide predictable results independent of the geometry of individual homes
8 9 10 11 12 13 14
Hour
Figure 19 Tracer gas decay for 1-story house with supply ventilation at 60 of ASHRAE 622 level 33 central fan operation (20 min off 10 min on) and bedroom doors closed
(Test A4)
0
10
20
30
40
50
60
Co
nce
ntr
ati
on
m
gm
3
Living
Entry
BR1
BR2
BR3
MBR
Mixing stopped
Mixing restarted
25 of 49
Research Report - 0602
0
5
10
15
20
25
30
Co
nce
ntr
ati
on
(m
gm
3 )
Living
Entry
BR1
BR2
BR3
MBR
Mixing stopped
Mixing restarted
12 13 14 15 16 17 18 19 20
Hour
Figure 20 Tracer gas decay for 1-story house with supply ventilation at 33 of ASHRAE 622 level 33 central fan operation (20 min off 10 min on) and bedroom doors closed
(Test A5)
Simple Exhaust vs Central Fan Integrated
Supply with Lower Ventilation Rates
025
Re
cip
roc
al A
ge
of
Air
(1
hr)
Well Mixed
100
ASHRAE 60
ASHRAE 33
ASHRAE Living Entry 010 Natural
BR1 Infilt
BR2 BR3 005
MBR
Exhaust in laundry room no
000
Central supply Natural infil-
mixing 100 ASHRAE doors mixing 33 duty tration doors
closed cycle doors closed open
Figure 21 Reciprocal age-of-air for 1-story house with supply ventilation at 33 60 and 100 of ASHRAE 622 level (Tests A5 A4 A6) compared to exhaust ventilation with
no central fan operation (Test A3) Bedroom doors were closed
020
015
26 of 49
Research Report - 0602
Simulations by Walker (2006) have shown that all systems will not provide the same service in terms of annual average air change rate For the same air flow rate and duty cycle balanced ventilation will yield a higher average air exchange than supply ventilation and supply ventilation will yield a higher average air exchange than exhaust ventilation That can be explained in general terms by understanding that wind and stack effects act to depressurize a building most of the time Exhaust fans increase the building depressurization further but supply fans decrease the depressurization Balanced fans donrsquot change the enclosure differential pressure and air flow at all Because of the non-linear relationship between differential pressure and air flows across the building enclosure a supply fan changes the pressures across the enclosure less than an exhaust fan acting more like a balanced fan The result is that the effect on ventilation air change rate from a supply fan is somewhere between that of an exhaust fan and a true balanced system
Bedroom Doors
Except for the natural ventilation test the preceding tests were all conducted with the bedroom doors closed to simulate a worst-case situation for air circulation within the house The exhaust ventilation test was repeated with the bedroom doors open (Test A9) producing the tracer gas decay curve shown in Figure 22 It is evident that the decay curves were much more tightly bundled with the doors open than they were with the doors closed (compare Figure 12) A comparison based on reciprocal age-of-air is shown in Figure 23 A significant improvement in room-to-room mixing is evident during the open-door test
It is also evident that the average air change rate was higher when the doors were open (0202 vs 0176 ACH) but it must be remembered that the ventilation rate was controlled using a duct blaster and average wind speed was higher during the open-door test period compared to the closed-door test period (20 mph compared to 06 mph) Therefore this test alone does not necessarily indicate that closing doors reduces the average air change rate associated with an exhaust system In future tests continuous measurement of the depressurization of the house with respect to outside along with single-point pressure measurements across interior doors would provide more information about the effect of closing doors when exhaust ventilation systems are used It would also be valuable to conduct this test during steady weather conditions using the exhaust fan (with uncontrolled ventilation rate) instead of the duct blaster to observe the net effect of closed doors on whole-house air change rate
27 of 49
Research Report - 0602
0
5
10
15
20
25
30
Co
ncen
trati
on
(m
gm
3 )
Living
Entry
BR1
BR2
BR3
MBR
Mixing stopped
Mixing restarted
181 191 201 211 221 231 01 11 21 31 41 51 61 71
Hour
Figure 22 Tracer gas decay for 1-story house with exhaust ventilation from the laundry room at ASHRAE 622 level no central fan operation and bedroom doors open (Test A9)
Exhaust Ventilation
Doors Closed vs Doors Open
000
005
010
015
020
025
Re
cip
roc
al
Ag
e o
f A
ir (
1h
r)
Living
Entry
BR1
BR2
BR3
MBR
Exhaust in laundry room Doors open no mixing
no mixing 100 exhaust in laundry room
ASHRAE doors closed 100 ASHRAE
Figure 23 Reciprocal age-of-air for 1-story house with exhaust ventilation from the laundry room at ASHRAE 622 level no central fan operation In the first case the bedroom doors were closed (Test A3) in the second the doors were open (Test A9)
28 of 49
Research Report - 0602
Transfer Grilles
Because the test houses used central returns instead of hard ducted returns in the bedrooms transfer grilles were installed over the bedroom doors to provide a flow path for return air without excessive room pressurization when the doors were closed These transfer grilles also allowed ventilation air to pass more freely from the bedrooms to the main living space The effect of transfer grilles on ventilation air distribution was evaluated by taping over the grilles (see Figure 24) and re-running the exhaust ventilation test (Test A10) The corresponding tracer gas decay curve is shown in Figure 25 and the reciprocal age-of-air analysis is shown in Figure 26 Taping the transfer grilles did not appear to significantly affect the room-to-room variability in ventilation rate although there appeared to be some slight re-ranking of rooms from highest to lowest reciprocal age-of-air It should be noted that there was an increase in average wind speed from 26 mph to 41 mph starting at 1 pm including a half hour period where the average wind speed was 7 mph This weather effect produced noticeable kinks in the decay curves and therefore would be expected to introduce significant errors into the reciprocal age-of-air results
Itrsquos possible that the transfer grilles played a much smaller role in providing a path for ventilation air than the supply ducts Because the air handler was not operating the ducts were not pressurized and were thus available as passive airflow conduits The resistance to air flow was probably smaller for the air ducts than for the transfer grilles depending on their size and the number of supply registers in each bedroom The existing door undercuts are also thought to have played a role The effect of ducts and door undercuts can be tested in the future by running separate tests with ducts and door undercuts taped over
copy buildingsciencecom
Figure 24 Transfer grilles over bedroom doors taped closed
29 of 49
Research Report - 0602
0
10
20
30
40
50
60
70
Co
nc
en
tra
tio
n (
mg
m3 )
Living
Entry
BR1
BR2
BR3
MBR
Mixing stopped
Mixing restarted
8 9 10 11 12 13 14 15 16 17
Hour
Figure 25 Tracer gas decay for 1-story house with exhaust ventilation from the laundry room at ASHRAE 622 level no central fan operation bedroom doors closed and transfer
grilles taped (Test A10)
Exhaust Ventilation
000
005
010
015
020
025
Re
cip
roc
al
Ag
e o
f A
ir (
1h
r)
Living
Entry
BR1
BR2
BR3
MBR
Transfer Grilles Untaped vs Taped
Exhaust in laundry room no Exhaust in laundry room no
mixing 100 ASHRAE mixing 100 ASHRAE
doors closed doors closed transfer
grilles taped
Figure 26 Reciprocal age-of-air for 1-story house with exhaust ventilation from the laundry room at ASHRAE 622 level no central fan operation and doors closed In the
30 of 49
Research Report - 0602
first case the transfer grilles are untaped (Test A3) in the second they are taped closed (Test A10)
Minimum Test Duration
We were fortunate that DR Horton provided two full weeks of access to these homes to conduct this series of tests which allowed us to run some of the more important tracer gas decay tests as long as 12 hours to help ensure that we could accurately calculate reciprocal age-of-air In most cases test houses would not be available for such a long time period To evaluate the length of time needed to estimate the reciprocal age-of-air with reasonable accuracy we examined the results that we would have obtained for one of the exhaust ventilation tests had we halted the test period after less than 12 hours For the supply ventilation tests the rooms were sufficiently well-mixed that the test could have been stopped after 3 or 4 hours assuming weather effects were steady
The reciprocal age-of-air calculations for the exhaust ventilation decay curves (Test A3 see Figure 12) based on test durations of 3 6 9 and 12 hours are shown in Figure 27 These test durations range from 053 to 21 air changes based on the average air change rate of 018 ACH (56 hours per air change) calculated for this test The ratio of highest to lowest reciprocal ageshyof-air is shown above the data points for each case These results suggest that shorter tests tend to overestimate the range and that perhaps 1frac12-2 air changes (roughly 9 to 12 hours in this case) may be necessary to obtain accurate calculations of reciprocal age-of-air when there is significant divergence among rooms From a qualitative standpoint one air change may be sufficient to determine the basic trend Without knowing in advance what mixing pattern will occur it is difficult to recommend a minimum test duration But assuming this test is fairly representative of a worst-case scenario a minimum of 15 air changes would be necessary to have a high degree of confidence in the quantitative difference in reciprocal age-of-air among rooms
31 of 49
Research Report - 0602
000
005
010
015
020
025
030
035
Re
cip
roc
al
Ag
e-O
f-A
ir (
hr-1
)
Living
Entry
BR1
BR2
BR3
MBR HighLow = 297
HighLow = 168 HighLow = 184 HighLow = 161
3-hour Test 6-hour Test 9-hour Test 12-hour Test
(053 Air Changes) (11 Air Changes) (16 Air Changes) (21 Air Changes)
Test Duration
Figure 27 Reciprocal age-of-air based on alternate test durations for 1-story house with exhaust ventilation from the laundry room at ASHRAE 622 level no central fan operation
and doors closed (Test A3) Average air change rate was 018 ACH
TEST RESULTS FROM 2-STORY HOUSE (1117 MONTAGUE)
The 2-story house was tested from January 3-10 2006 Three zones were selected on the first floor and three more were selected on the second floor as indicated by the red stars in Figure 4 The initial mixing of air among the rooms at the start of each test in this 2-story house was not as thorough as it was in the 1-story house Evidently the combined effects of the air handler and the portable de-stratification fan were not sufficient to overcome upward transport of tracer gas driven by the stack effect from the first to the second floor The resulting difference in initial tracer gas concentration among the rooms was about 5-10 This outcome emphasizes the significant effect of stack-driven infiltration on ventilation non-uniformity in multi-story homes Because our test method and equipment did not achieve a well-mixed condition at the start of each test there were some errors introduced into the reciprocal age-of-air analysis For future tests we would recommend larger de-stratification fans to obtain more well-mixed conditions in multi-story houses
Typical errors introduced by incomplete mixing of the tracer gas at the start of such a test were analyzed by examining two hypothetical cases where either all of the air entering a room comes from the outside or all of the air comes from an adjacent room with a different starting concentration If all of the air entering a space comes from the outside then a change in the initial concentration would have no effect on the reciprocal age-of-air because the decay curve would be exponential from the start and the area under the curve would be normalized based on
32 of 49
Research Report - 0602
the starting concentration in that zone However if the air entering a room passes through another room with a lower initial concentration the room receiving the air will have a lower concentration of tracer gas throughout the test compared to what the concentration would have been if the starting points were the same in both rooms This case is illustrated in Figure 28 where assumptions are made that the rooms are the same size the air exchange rate is 01 ACH for both rooms and the initial tracer gas concentration is 10 lower in the first room (upstream) than it is in the second room
The effect on reciprocal age-of-air is shown in Figure 29 A 10 difference in starting concentration results in an error of about 75 in reciprocal age-of-air for a room downstream of a room with a lower starting concentration assuming 01 ACH for both rooms The error would be somewhat smaller (about 5) if the air change rate was higher for both rooms (02 ACH) There would be no error introduced for rooms where all of the air infiltration comes from the outside Although the amount of error in the reciprocal age-of-air calculations can be affected by additional variables not examined here we feel that these percentages are reasonable estimates of the errors in our results for the 2-story house due to incomplete initial mixing of air
In each case an engineering judgment must be made regarding the significance of the error introduced by incomplete initial mixing As a general rule the differences in concentration at the start of the test should be small compared to the differences that are being measured in order for the results to be considered valid
Figure 28 Theoretical decay curves for a well-mixed case with uniform tracer gas concentration compared to a case where the upstream room starts with a concentration
10 lower than the downstream room
33 of 49
Research Report - 0602
Figure 29 Theoretical reciprocal age-of-air for a well-mixed case with uniform tracer gas concentration compared to a case where the upstream room starts with a concentration
10 lower than the downstream room
Natural Infiltration and Duct Leakage
A natural infiltration test was performed over a two hour period on the evening of January 8 (Test B14) The tracer gas decay curves are shown in Figure 30 There was a slight divergence between the first floor and second floor once the air handler was turned off but the rooms on each floor appeared to remain fairly well-mixed The average air change rate during the test period was about 011 ACH which was somewhat higher than the 1-story house as might be expected with an increased stack height
An air handler bedroom door bump test was conducted just prior to the test period shown in Figure 30 allowing observation of the combined effect of duct leakage to the outside and increased infiltration caused by room pressurization The average air change rate during that bump test was 013 ACH suggesting that closing doors and operating the fan added approximately 002 ACH to the whole-house average air change rate The average wind speed was a bit higher while the air handler was running (17 mph compared to 05 mph) so the effect of air handler operation may actually be somewhat less than the average ACH numbers indicate
34 of 49
Research Report - 0602
0
1
2
3
4
SF
6 C
on
ce
ntr
ati
on
(m
gm
3)
BR1
Living
Kitchen
BR2
BR3
MBR
Mixing stopped
Mixing restarted
1814 1843 1912 1940 2009 2038 2107 2136
Hour
Figure 30 Tracer gas decay for 2-story house with no ventilation no central fan operation and bedroom doors open (Test B14)
Distributed Supply vs Point Exhaust Ventilation
A 14-hour test (Test B1) was performed with an exhaust ventilation rate of 63 cfm in the laundry room which was located near the stairwell in the middle of the first floor The ventilation rate was again consistent with the ASHRAE 622 recommendations The tracer gas decay curves are shown in Figure 31 It is interesting that all three second floor rooms showed a delay before entering an exponential decay suggesting that some amount of air was moving from the first floor to the second floor even though the mechanical exhaust point was on the first floor It appears that the further depressurization of the first floor was insufficient to overcome the stack effect and draw a significant amount of outside air in through the rooms on the second floor
35 of 49
Research Report - 0602
182
9
192
9
202
9
212
9
222
9
232
9
029
129
229
329
429
529
629
729
828
929
102
8
112
8
122
8
0
10
20
30
40
50
60
70
SF
6 C
on
ce
ntr
ati
on
(m
gm
3)
BR1
Living
Kitchen
BR2
BR3
MBR
Mixing stopped
Mixing restarted
Hour
Figure 31 Tracer gas decay for 2-story house with exhaust ventilation from the laundry room at ASHRAE 622 level no central fan operation and bedroom doors closed (Test B1)
A supply ventilation test was performed on the 2-story house for about 11 hours starting late on January 4 (Test B3) The duct blaster was unable to provide the ventilation rate necessary to meet the minimum specified in ASHRAE 622 supplying 180 cfm instead of 189 cfm (95) The decay curves are shown in Figure 32 Although the curves are much more tightly packed than they were with the exhaust system there is more divergence than we saw with the supply system in the 1-story house most notably in the master bedroom
The reciprocal age-of-air calculations for both the exhaust and supply ventilation systems are shown in Figure 33 Again the results indicate that much better room-to-room distribution of ventilation air was achieved by the central-fan integrated supply system compared to the single-point exhaust system However for the supply ventilation test the differences in the initial tracer gas concentration were of the same magnitude as the differences in decay rates among the rooms As a result no conclusions should be drawn about the relative ranking of the supply ventilation rate among rooms based on Figure 33
36 of 49
Research Report - 0602
0
10
20
30
40
50
60
SF
6 C
on
ce
ntr
ati
on
(m
gm
3)
BR1
Living
Kitchen
BR2
BR3
MBR
Mixing stopped
Mixing restarted
2136 000 224 448 712 936 1200
Hour
Figure 32 Tracer gas decay for 2-story house with supply ventilation just under ASHRAE 622 level central fan operation at 33 duty cycle (20 min off 10 min on) and bedroom
doors closed (Test B3)
Simple Exhaust vs Central Fan Integrated
Supply )
000
005
010
015
020
025
Recip
rocal A
ge o
f A
ir (
1h
r
BR1
Living
Kitchen
BR2
BR3
MBR
Exhaust in laundry room no Centralized supply mixing
mixing 100 ASHRAE 33 duty cycle 95
doors closed ASHRAE doors closed
Figure 33 Reciprocal age-of-air for 2-story house with continuous exhaust ventilation (Test B1) compared to central fan integrated supply ventilation (Test B3) (Note
Uncertainties introduced by non-uniform starting concentration are of the same order of magnitude as the differences in reciprocal age-of-air among rooms for the supply ventilation case The relative ranking of rooms is not meaningful for that case)
37 of 49
Research Report - 0602
Air Handler Operation
The effect of occasional air handler operation on the distribution of exhaust ventilation air was evaluated on the afternoon of January 6 (Test B6) The tracer gas decay curves are shown in Figure 34 and reciprocal age-of-air calculations are shown in Figure 35 It should again be noted that before the test started the house was mixed using both the air handler and a de-stratification fan with the doors open During the test the doors were closed the de-stratification fan was turned off and the air handler operated at a 33 duty cycle (20 minutes off 10 minutes on) As was the case in the 1-story house this occasional operation of the air handler substantially improved the distribution of ventilation air among rooms even in conjunction with the point exhaust ventilation system There was very little divergence noticeable even with the air handler cycling on and off every half hour However because the initial differences in tracer gas concentration among rooms were as large as the differences in reciprocal age-of-air for the case with air handler operation no conclusions should be drawn about the relative ranking of ventilation rates among the rooms for that case
SF
6 C
on
cen
trati
on
(m
gm
3)
80
70
60
50
40
30
20
10
0
BR1
Living
Kitchen
BR2
BR3
MBR
Mixing stopped
Mixing restarted
1048 1200 1312 1424 1536 1648 1800 1912 2024
Hour
Figure 34 Tracer gas decay for 2-story house with continuous exhaust ventilation at ASHRAE 622 level central fan operation at 33 duty cycle (20 min off 10 min on) and
bedroom doors closed (Test B6)
38 of 49
Research Report - 0602
020
015 R
ec
ipro
ca
l A
ge
of
Air
(1
hr)
Exhaust Ventilation
No Mixing vs 33 Air Handler Duty Cycle
Exhaust in laundry room
no mixing 100
ASHRAE doors closed
33 air handler
operation exhaust in
laundry room 100
ASHRAE doors closed
BR1
Living
Kitchen
BR2
BR3
MBR
010
005
000
Figure 35 Reciprocal age-of-air for 2-story house with continuous exhaust ventilation with and without air handler operation (Tests B1 and B6) (Note Uncertainties introduced by non-uniform starting concentration are of the same order of magnitude as the differences in reciprocal age-of-air among rooms for the case with air handler operation The relative
ranking of rooms is not meaningful for that case)
Exhaust Location
The duct blaster was moved to the master bathroom exhaust register to see if there was a resulting change in ventilation air distribution (Test B18) The master bathroom was in the back of the house on the second floor between the master bedroom and bedroom 3 The decay curves are shown in Figure 36 and the reciprocal age-of-air results are shown in Figure 37 The rooms on each floor were well mixed before the test began although the mixing between the two floors was not as good Very wide divergence among rooms can be seen during the test especially between the upstairs bedrooms and the rest of the house Once again all three upstairs rooms appear to receive some air from the first floor but the master bedroom experiences a much higher volume of circulated air than the other two second-floor bedrooms which appear to be relatively stagnant
39 of 49
Research Report - 0602
0
10
20
30
40
50
60
70
80
90
SF
6 C
on
ce
ntr
ati
on
(m
gm
3)
BR1
Living
Kitchen
BR2
BR3
MBR
Mixing stopped
Mixing restarted
1912 2136 000 224 448 712 936 1200
Hour
Figure 36 Tracer gas decay for 2-story house with exhaust ventilation from the master bathroom at ASHRAE 622 level no central fan operation and bedroom doors closed (Test
B18)
Exhaust Ventilation
Laundry Room vs Master Bathroom
000
005
010
015
020
025
030
Exhaust in laundry room no
mixing 100 ASHRAE
doors closed
Exhaust in master bathroom
no mixing 100 ASHRAE
doors closed
Re
cip
roc
al A
ge
of
Air
(1
hr)
BR1
Living
Kitchen
BR2
BR3
MBR
Figure 37 Reciprocal age-of-air for 2-story house with exhaust ventilation from the master bathroom compared to the laundry room at ASHRAE 622 level no central fan operation
and bedroom doors closed (Tests B1 and B18)
40 of 49
Research Report - 0602
Ventilation Rate
The supply ventilation tests were repeated using flow rates of 60 and 33 of ASHRAE 622 recommendations corresponding to 114 cfm and 63 cfm respectively (Tests B2 and B4) The decay curves are shown in Figures 38 and 39 Reciprocal age-of-air for all three supply ventilation rates are shown in Figure 40 In all cases the rooms remained fairly well mixed especially rooms on the same floor As we observed in the 1-story house the ventilation rate in the 2-story house appeared to have very little effect on the uniformity of outside air provided to each room as long as it was mixed using the air handler One again the initial differences in tracer gas concentration among rooms were as large as the divergence in the decay curves preventing any conclusions about the relative ranking of ventilation rates among rooms for all three cases The error in initial concentration uniformity was bigger for the cases with air handler mixing because the relative divergence in the decay curves was so small compared to that of no air handler mixing In other words the error in relative ranking of ventilation rates for the cases with air handler mixing were not very important anyway because the relative differences between rooms were so small
1536 1648 1800 1912 2024 2136 2248
Hour
Figure 38 Tracer gas decay for 2-story house with supply ventilation at 60 of ASHRAE 622 level 33 central fan operation (20 min off 10 min on) and bedroom doors closed
(Test B2)
0
5
10
15
20
25
30
SF
6 C
on
cen
trati
on
(m
gm
3)
BR1 Living Kitchen BR2 BR3 MBR
Mixing stopped
Mixing restarted
41 of 49
Research Report - 0602
0
5
10
15
20
25
30
35
40
SF
6 C
on
cen
trati
on
(m
gm
3)
BR1
Living
Kitchen
BR2
BR3
MBR
Mixing stopped
Mixing restarted
1200 1312 1424 1536 1648 1800 1912
Hour
Figure 39 Tracer gas decay for 2-story house with supply ventilation at 33 of ASHRAE 622 level 33 central fan operation (20 min off 10 min on) and bedroom doors closed
(Test B4)
Supply Ventilation Rate Comparison
000
005
010
015
020
025
Re
cip
roc
al
Ag
e o
f A
ir (
1h
r)
BR1
Living
Kitchen
BR2
BR3
MBR
Centralized supply Centralized supply Centralized supply
mixing 33 duty mixing 33 duty mixing 33 duty
cycle 95 ASHRAE cycle 60 ASHRAE cycle 33 ASHRAE
doors closed doors closed doors closed
Figure 40 Reciprocal age-of-air for 2-story house with three levels of supply ventilation central fan operation at 33 duty cycle (20 min off 10 min on) and bedroom doors closed (Tests B3 B2 B4) (Note Uncertainties introduced by non-uniform starting
concentration are of the same order of magnitude as the differences in reciprocal age-of-air among rooms for all three cases The relative ranking of rooms is not meaningful for these
cases)
42 of 49
Research Report - 0602
The average air change rates for the three supply ventilation rates compared to the two exhaust ventilation schemes are shown in Figure 41 The CFIS system at 33 of the 622 ventilation flow rate provided a uniformly higher air change rate (013 ach) than the least ventilated rooms using exhaust ventilation from either the laundry or the master bathroom (010 ach Figure 37) It is noteworthy that the combined net air change rate with exhaust ventilation from the laundry room was significantly less than the air change rates for both exhaust ventilation from the master bathroom and supply ventilation at the air handler This illustrates the unpredictability of interactions between mechanical ventilation and natural infiltration which depend strongly on the distribution and size of cracks through which the outside air must pass to enter the house There may have been a relatively large building enclosure leakage opening near the laundry room (perhaps the utility penetrations or the door to the garage) that allowed a significant amount of outside air to quickly enter and leave the house through the exhaust flow without circulating around the house
0
005
01
015
02
025
Ave
rag
e A
CH
Natural Exhaust Exhaust Supply 95 Supply 60 Supply 33
Laundry Mbath
Rm 100 100
Figure 41 Average air change rates for 2-story house with supply ventilation at 33 60 and 95 of ASHRAE 622 recommendations (Tests B4 B2 B3) compared to natural
infiltration (Test B14) and exhaust ventilation with no central fan operation (Test B1) Bedroom doors were closed except for the natural infiltration test
Bedroom Doors
The laundry room exhaust ventilation test with no air handler operation (see Figure 31) was repeated with the doors open to evaluate the change in room-to-room ventilation air distribution (Test B10) The decay curves are shown in Figure 42 and the reciprocal age-of air calculations are shown in Figure 43 It is evident from Figure 42 that the test began before the rooms were
43 of 49
Research Report - 0602
0
5
10
15
20
25
SF
6 C
on
ce
ntr
ati
on
(m
gm
3)
BR1 Living Kitchen BR2 BR3 MBR
Mixing stopped
Mixing restarted
completely well mixed resulting in decay curves that could be somewhat misleading Because the master bedroom was at a higher concentration than the other rooms at the start of the test any room that received air from the master bedroom would appear to have a slower decay rate than it would have if the rooms started out at the same concentration Despite the difference in starting concentration it is clear that outside air was well distributed when the doors were open even without operation of the air handler
1843 1912 1940 2009 2038 2107 2136 2204 2233 2302
Hour
Figure 42 Tracer gas decay for the 2-story house with exhaust ventilation from the laundry room at ASHRAE 622 level no central fan operation and bedroom doors open
(Test B10)
Reciprocal age-of-air analysis was not performed for this case because of the combined effect of a short test duration (~2 hours) and unequal starting tracer gas concentrations even though the house was relatively well-mixed The important conclusion (that opening doors greatly improves mixing) can be drawn by inspecting the decay curves alone
Transfer Grilles
A final exhaust ventilation test was run on the 2-story house with the doors closed and the transfer grilles taped over The decay curves are shown in Figure 43 and the reciprocal age-ofshyair calculations are shown in Figure 44 The curves were clearly very divergent even after 12 hours By examining the reciprocal age-of-air results it is apparent that the transfer grilles in the 2-story house caused a noticeable improvement in ventilation air distribution but the improvement was smaller than when the doors were opened (Figure 42)
44 of 49
Research Report - 0602
0
5
10
15
20
25
30
SF
6 C
on
cen
tra
tio
n (
mg
m3
) BR1 Living Kitchen BR2 BR3 MBR
Mixing stopped
Mixing restarted
1648 1912 2136 000 224 448 712 936
Hour
Figure 43 Tracer gas decay for 2-story house with exhaust ventilation from the laundry room at ASHRAE 622 level no central fan operation bedroom doors closed transfer
grilles taped closed (Test B7)
Exhaust Ventilation Transfer Grilles Untaped vs Taped
000
005
010
015
020
Re
cip
roc
al
Ag
e o
f A
ir (
1h
r)
BR1
Living
Kitchen
BR2
BR3
MBR
Exhaust in laundry room no Exhaust in laundry room no
mixing 100 ASHRAE mixing 100 ASHRAE
doors closed doors closed transfer
grilles taped
Figure 44 Reciprocal age-of-air for 2-story house with exhaust ventilation from the laundry room at ASHRAE 622 level no central fan operation and doors closed In the first case the transfer grilles are untaped (Test B3) in the second they are taped closed
(Test B7)
45 of 49
Research Report - 0602
CONCLUSIONS
bull Reciprocal age-of-air analysis was chosen as a quantitative method for characterizing distribution of ventilation air among rooms This method worked well in cases where rooms were well mixed to begin the test and weather conditions were sufficiently steady-state
bull A test period of at least 1frac12 air changes was necessary to obtain reasonably accurate ageshyof-air results when there was significant divergence in tracer gas concentration among the rooms
bull Although we did not achieve uniform initial concentration of tracer gas in the 2-story house using our test methodology and the equipment at hand we believe the reciprocal age-of-air calculations were meaningful in many of the cases as indicated in the discussion
bull Both houses were relatively tight with natural infiltration averaging 008 ACH for the 1shystory house and 011 ACH for the 2-story house
bull Both houses had relatively small (but not negligible) duct losses to the outside producing an increase in infiltration of less than 003 ACH for the 1-story house and 002 ACH for the 2-story house when the air handler runs
bull Age-of-air analysis indicated that ventilation supplied through the central air distribution system provided much more uniform distribution of ventilation air than the single-point exhaust system when the doors were closed and the air handler was not running For the 1-story house the central-fan-integrated supply ventilation case at 60 of ASHRAE 622 provided more outside air to all rooms than the least-ventilated room in the exhaust case at 100 of 622 For the 2-story house the central-fan-integrated supply system at 33 of the 622 flow rate provided more outside air to all rooms than the least ventilated rooms using exhaust ventilation at 100 of 622 from either the laundry or the master bathroom
bull Operation of the central fan at a 33 duty cycle maintained relatively well-mixed conditions regardless of ventilation rate type of ventilation system (supply or exhaust) or house configuration (1-story or 2-story)
bull Exhaust location affected both the relative amount of outside air received by different rooms and the overall uniformity among rooms but the effect was not predictable
bull For exhaust-only ventilation without central fan operation opening bedroom doors appeared to significantly improve the mixing of ventilation air among rooms
bull Transfer grilles improved the distribution of ventilation air slightly but much less than opening the bedroom doors
bull In the 2-story house the stack effect caused air movement from the first floor to the second floor even when exhaust ventilation was applied to the first floor resulting in consistently higher tracer gas concentrations on the second floor and more non-uniform ventilation air distribution in general
bull Interactions between natural infiltration and both exhaust and supply mechanical ventilation were very significant When the ventilation system was activated the combined air change rate did not increase commensurate with the measured ventilation rate but instead increased by only half that amount This result was consistent with combining ventilation and infiltration in quadrature to estimate whole-house air change rate in accordance with ASHRAE Standard 136 (ASHRAE 1993)
46 of 49
Research Report - 0602
FUTURE WORK
In future tests continuous monitoring of pressure differentials would enhance our understanding of the multi-zone combined infiltration and ventilation systems and our ability to model them That would help to explain differences between tests in more detail including the effects of multiple stories location of ventilation supply outlets and exhaust inlets interior door closure and use of passive return air transfer grilles Pressure differential measurement points should include
bull dP with respect to outside for each closed room and open space bull dP across closed interior doors bull dP between the floor cavity and outdoors and bull dP between the house and the attic
Measurement of wind direction along with wind speed could also be helpful for modeling these buildings and systems However because of micro-climate wind shielding it may be very difficult to relate a single-point wind direction measurement to actual wind vectors on the building surfaces
ACKNOWLEDGMENTS
The authors express their appreciation to Rich Coyle of DR Horton for providing the test houses and to Joseph Lstiburek of BSC Subrato Chandra and Neil Moyer of FSEC and Greg Barker of Mountain Energy Partnership for their assistance in the planning and execution of this ventilation study
47 of 49
Research Report - 0602
REFERENCES
ASHRAE (1993) ANSIASHRAE Standard 136-1993 A Method of Determining Air Change Rates in Detached Dwellings Atlanta GA American Society of Heating Refrigerating and Air-Conditioning Engineers Inc
ASHRAE (1997) ANSIASHRAE Standard 129-1997 Measuring Air-Change Effectiveness Atlanta GA American Society of Heating Refrigerating and Air-Conditioning Engineers Inc
ASHRAE (2004) ASHRAE Standard 622-2004 Ventilation and Acceptable Indoor Air Quality in Low-Rise Residential Buildings Atlanta GA American Society of Heating Refrigerating and Air-Conditioning Engineers Inc
CSA (2003) CANCSA F326-M91 Residential Mechanical Ventilation Systems Canadian Standards Association Ontario Canada httpwwwcsashyintlorgonlinestoreGetCatalogItemDetailsaspmat=2410793ampParent=102
NBC 2005 National Building Code of Canada httpircnrcshycnrcgccapubscodesnrcc47666_ehtml
Grieve PW (1991) Measuring Ventilation Using Tracer-Gases Denmark Bruumlel amp Kjaeligr
MN Chapter 7672 Minnesota Energy Code Chapter 7672 Detached Single-Family And Two-Family Dwellings httpwwwstatemnusmnexternalDocsCommerceChapter_7672_Residential_111302012428 _72rulepdf
Persily AK Martin SR (2000) A Modeling Study of Ventilation in Manufactured Houses Gaithersburg MD National Institute of Standards and Technology NISTIR 6455
Rudd A Lstiburek J (2000) ldquoMeasurement of Ventilation and Interzonal Distribution in Single-Family Homesrdquo ASHRAE Transactions 2000 MN-00-10-3 V 106 Pt2 American Society of Heating Refrigeration and Air-Conditioning Engineers Atlanta GA
WAC (2004) Washington State Title 51 WAC Community trade and economic development department of (building code council) Chapter 51-13 Ventilation and indoor air quality httpappslegwagovWACdefaultaspxcite=51-13
48 of 49
Research Report - 0602
Field test of room-to-room uniformity of ventilation air distribution in two new houses
About this Report
This report was prepared for the US Department of Energyrsquos Building America
Program The report is freely available to the public at wwwbuildingamericagov
The authors express their appreciation to Rich Coyle of DR Horton for providing the test houses and to Joseph Lstiburek of BSC Subrato Chandra and Neil Moyer of
FSEC and Greg Barker of Mountain Energy Partnership for their assistance in the planning and execution of this ventilation study
About the Authors
Robert Hendron Ren Anderson Dennis Barley are with National Renewable Energy Laboratory Armin Rudd and Aaron Townsend are with Building Science Corporation
Ed Hancock is with Mountain Energy Partnership
Direct all correspondence to Building Science Corporation 30 Forest Street Somerville MA 02143
Limits of Liability and Disclaimer of Warranty
Building Science documents are intended for professionals The author and the publisher of this article have used their best efforts to provide accurate and authoritative information in regard to the subject matter covered The author and publisher make no warranty of any kind expressed or implied with regard to the information contained in this article
The information presented in this article must be used with care by professionals who understand the implications of what they are doing If professional advice or other expert assistance is required the services of a competent professional shall be sought The author and publisher shall not be liable in the event of incidental or consequential damages in connection with or arising from the use of the information contained within this Building Science document
49 of 49
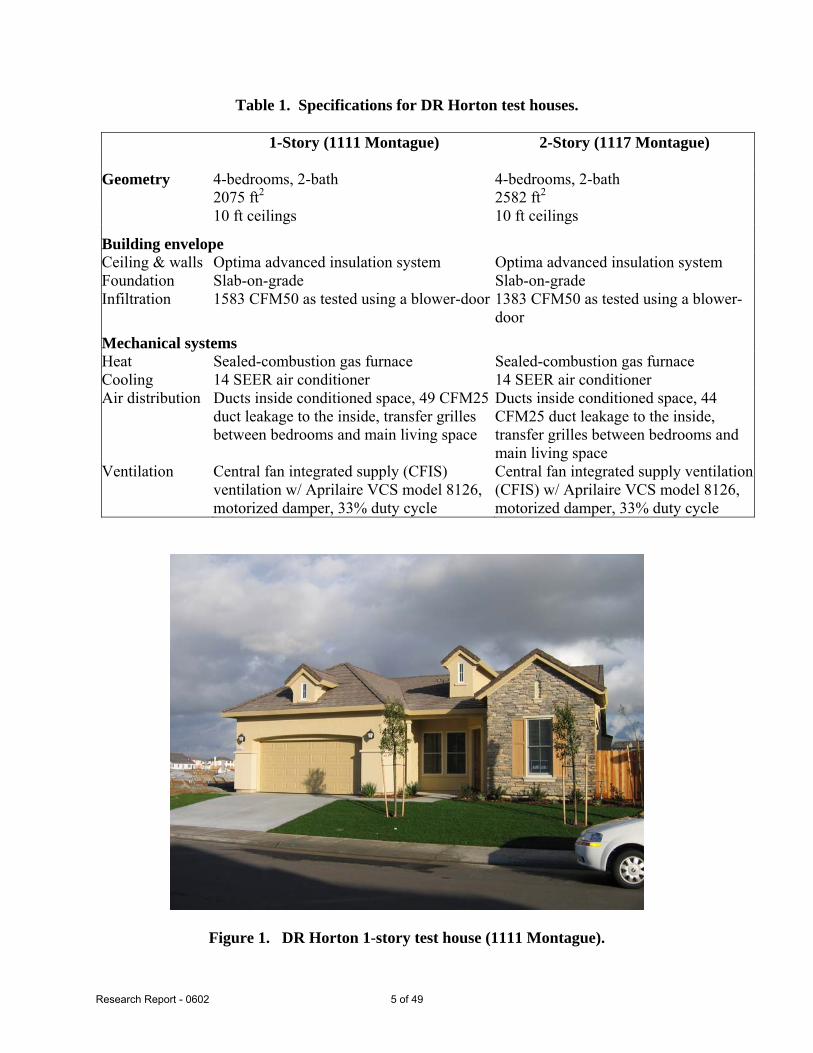
Research Report - 0602
Table 1 Specifications for DR Horton test houses
1-Story (1111 Montague) 2-Story (1117 Montague)
Geometry 4-bedrooms 2-bath 4-bedrooms 2-bath 2075 ft2 2582 ft2
10 ft ceilings 10 ft ceilings
Building envelope Ceiling amp wal Optima advanced insulation system ls Optima advanced insulation system Foundation Slab-on-grade Slab-on-grade Infiltration 1583 CFM50 as tested using a blower-door 1383 CFM50 as tested using a blower-
door Mechanical systems Heat Sealed-combustion gas furnace Sealed-combustion gas furnace Cooling 14 SEER air conditioner 14 SEER air conditioner Air distribution Ducts inside conditioned space 49 CFM25 Ducts inside conditioned space 44
duct leakage to the inside transfer grilles CFM25 duct leakage to the inside between bedrooms and main living space transfer grilles between bedrooms and
main living space Ventilation Central fan integrated supply (CFIS) Central fan integrated supply ventilation
ventilation w Aprilaire VCS model 8126 (CFIS) w Aprilaire VCS model 8126 motorized damper 33 duty cycle motorized damper 33 duty cycle
Figure 1 DR Horton 1-story test house (1111 Montague)
5 of 49
Research Report - 0602
Figure 2 DR Horton 2-story test house (1117 Montague)
6 of 49
Research Report - 0602
BR1
BR2
BR3
MBR Living Rm
Entry
copy buildingsciencecom
Figure 3 1-story test house floor plan (1111 Montague)
7 of 49
Research Report - 0602
MBR
BR1
BR3
BR2
Kitchen
Living
copy buildingsciencecom
Figure 4 2-story test house floor plan (mirror image of 1117 Montague)
TEST PLAN
Research Questions
The following series of research questions were identified by the researchers to quantify the ventilation distribution characteristics of the test houses under various operating conditions
1 What is the natural air change rate (ACH) for each house with bedroom doors open no air handler operation and no mechanical ventilation What is the room-to-room uniformity in outside air distribution
2 What is the change in whole-house ACH caused by air handler operation What is the change in room-to-room uniformity of outside air distribution
3 What is the change in whole-house ACH caused by closing the bedroom doors What is the change in room-to-room uniformity of outside air distribution
4 What is the change in whole-house ACH caused by taping over the transfer grilles What is the change in room-to-room uniformity of outside air distribution
5 What is the difference in whole-house ACH for a central-fan integrated supply ventilation system (CFIS) operating at 33 duty cycle compared to a continuous exhaust ventilation
8 of 49
Research Report - 0602
system with both systems meeting the ASHRAE 622 recommended minimum ventilation rate on average How does the resulting room-to-room uniformity of outside air distribution compare
6 How does the whole-house ACH and uniformity of outside air distribution change for a CFIS ventilation system when the ventilation rate is lowered from 100 of the ASHRAE 622 recommendation to 60 and to 33
7 How does the whole-house ACH and uniformity of outside air distribution change for the continuous exhaust ventilation system when the location of the exhaust port is changed from the utility room to the master bathroom
8 How uniform is the outside air distribution for the two-story house compared to the one-story house
Test Set-Up
Single-tracer gas decay with multi-zone sampling was used to evaluate the performance of each ventilation system based on how uniformly outside air was distributed to each room or zone within the house The decay curves demonstrate the rate at which the tracer gas (representing a pollutant) which is initially distributed uniformly throughout the house is diluted within each zone as a result of outside air that enters the zone directly as well as air that is exchanged among zones Air entering one zone from another may contain either a higher or lower concentration of the tracer than the air already in the zone This test method is designed as a practical method to evaluate the uniformity of ventilation air distribution within a home assuming that dangerous pollutants such as radon are controlled using appropriate source mitigation strategies Uniform distribution of outside air is required for dilution ventilation systems to provide predictable results independent of the geometry of individual homes
A multi-zone tracer gas sampling system was installed in each house for the test This equipment consisted of a Bruel and Kjaer model 1302 multi-gas monitor and a model 1303 multi-point sampler as shown in Figure 5 Sample tubes were placed in six locations in each house and attached to the multi-point sampler The six sampled locations are designated with red stars on the floor plans in Figures 3 and 4 The sampler was programmed to draw a sample from each sequential location at an interval of about 2 minutes thus all six locations were sampled at an interval of about 12 minutes
The air sample in each zone was taken near the center of the room at a height of four feet above the floor The zone air temperature was measured at the same location The local zone air temperature measurement was used to control the electric heater in each zone (see Test Procedure section below) to achieve a uniform and constant air temperature throughout the house Mixing fans were used to maintain uniform temperatures and concentrations within each room A photo of this set up is shown in Figure 6
9 of 49
Research Report - 0602
copy buildingsciencecom
Figure 5 Multi-zone tracer gas sampling and monitoring equipment
Mixing Fan
Heater
Temperature Sampling Location
Figure 6 Tracer gas sampling point temperature sensor room air mixing and co-heating set-up
The air flow rates for both supply and exhaust ventilation were carefully controlled during the test using a Duct Blaster fan and measurement system For exhaust ventilation the Duct Blaster fan was placed near the location of the ceiling exhaust fan and a length of flexible duct was used to connect the normal entrance for the exhaust fan to the Duct Blaster All of the air flowing through the exhaust fan during the test was first routed through the Duct Blaster The Duct Blaster speed control was adjusted to achieve the desired flow rate and the Duct Blaster flow ring and pressure tap were used to measure the air flow rate The exhaust fan itself was operated in
10 of 49
Research Report - 0602
conjunction with the duct blaster to reduce the resistance to air flow Figure 7 shows the Duct Blaster installed at the laundry room exhaust register
copy buildingsciencecom
Figure 7 Duct Blaster installed at the laundry room exhaust register
A similar application of the Duct Blaster was used to control and measure the supply air flow rate during the tests of the CFIS system The normal configuration of flexible duct connecting the air handler return to the outside was changed so that all outside air would flow through the Duct Blaster The flexible duct was disconnected from the air handler return and attached to the inlet to the Duct Blaster The Duct Blaster outlet duct was attached to the air handler return The Duct Blaster speed control was used to achieve the desired air flow rate and the Duct Blaster flow ring and pressure tap were used to measure the flow rate This installation is shown in Figure 8
Natural infiltration rates varied during the tests depending on weather conditions which were monitored using a portable weather station
It should be noted that the supply ventilation ducts in the test houses were not sized for the flow rates desired in the tests The ventilation flow rate measured during normal operation of the air handler in the 1-story house was about 10 cfm compared to 174 cfm required to meet the ASHRAE 622 recommendations This flow rate was also significantly less than the design flow rate of about 40-60 cfm It was necessary to operate the Duct Blaster fan at maximum power to achieve the required air flow rate during some tests It was unclear if the outside air duct was too long too small or too tortuous or if insufficient negative pressure was present at the return of the air handler because the central return grille was just a few inches away (see Figure 8)
11 of 49
Research Report - 0602
copy buildingsciencecom
Figure 8 Duct Blaster installed between the outside air duct and the return of the air handler to provide supply ventilation
Test Procedure
The tracer gas used was sulfur hexafluoride (SF6) a stable non-toxic gas that was injected into each house volume from a small compressed gas cylinder carried by hand around the house During the dosing period the furnace fan was used to achieve an initially well-mixed condition with a concentration of about 15 parts per million (PPM) During this period the doors were kept open and a portable de-stratification fan was used in the 2-story house to improve mixing between floors Then the mixing fans were stopped and the divergence in concentration from zone to zone was observed (with doors either open or closed depending on the test objective) Small portable fans in each zone continued running to maintain a well-mixed condition within each zone The interior air temperature in each zone was controlled during the test period using portable electric heaters instead of the furnace so that operation of the air handler could be controlled independently from the demand for heating At the conclusion of the test the whole house was again mixed by opening the doors and turning on the air handler This allowed the calculation of an average whole-house air change rate for each set of test conditions
The tests were planned for rather mild weather to minimize infiltration effects so as to isolate and test the performance of the mechanical ventilation systems The general design goal was to provide the minimum amount of mechanical ventilation recommended by ASHRAE Standard 622-2004 (ASHRAE 2004) (58 cfm for the 1-story house 63 cfm for the 2-story house) and observe the effects of providing central fan integrated supply versus single-point exhaust ventilation operating the central fan closing the bedroom doors and taping the transfer grilles above the doors
12 of 49
Research Report - 0602
The results of the multi-zone tracer gas decay tests are presented graphically as families of decay curves These graphs illustrate the uniformity or non-uniformity of the ventilation effect among the various rooms and allow ranking of the rooms from the least to the most ventilation effect
In addition if the ventilation rates were sufficiently steady for the duration of the test period we used local mean age-of-air analysis to evaluate the results more quantitatively Age-of-air analysis is a well-established approach to testing ventilation rates at various points or in various zones within a building (Grieve 1991) Age-of-air is defined as the average length of time that air molecules have resided within the building The formula for calculating local mean age-ofshyair in a tracer gas decay test is given in ASHRAE Standard 129-1997 (ASHRAE 1997) as follows
Ai = 1 intinfin
Ci (t)dt (1)C0 0
where
i = Index for measurement point representing a well-mixed zone Ai = Local mean age-of-air at point i (hr) C = Concentration of tracer gas (lbmft3) C0 = Initial value of C in well-mixed building (lbmft3) Ci = Time-varying concentration of tracer gas at point i (lbmft3) t = Time (hr)
In order to compare the ventilation rates among the rooms or zones in the home we use the metric Reciprocal Age-of-Air
Reciprocal Age-of-Air = 1Ai (2)
Reciprocal Age-of-Air has units of 1hr and is equivalent to the air change rate (ACH) in a single well-mixed zone (Persily 2000)
The definition of Ai in Equation (1) involves an integral of infinite duration This is handled in the test procedure through a two-step process
Step 1 The tracer gas decay test is continued until (a) the initial transient effects of interzonal airflow have subsided and all of the decay curves resemble simple exponential functions and (b) the tracer concentrations are rather small compared to their initial values so that any extrapolation errors will have a small effect on the result In this field test most of the multi-zone tests were continued for 12 hours These portions of the decay curves were integrated numerically using the trapezoid rule
13 of 49
Research Report - 0602
Step 2 The remaining portions (the tails) of the decay curves were extrapolated to infinity using a simple exponential decay function which was matched to the decay rate of the final portion of each measured decay curve These portions of the curves were integrated analytically
Once the conditions of Step 1 were satisfied the rooms were re-mixed by opening the bedroom doors and operating the air handler This allowed the calculation of an effective whole-house air change rate using the relationship in Equation 3
Average whole-house air change rate (ACH) = ln(C0Cf)∆t (3)
where
Cf = Concentration of tracer gas after rooms are re-mixed (lbmft3) ∆t = Elapsed time between initial and final well-mixed cases (hr)
Test Matrix
The series of test conditions for the 1-story and 2-story houses are described in Tables 2 and 3 Most of the important tests were conducted for a 12-hour period overnight to ensure sufficient accuracy when calculating reciprocal age-of-air
Table 2 Test sequence for 1-story test house
Central fan
cycling Duration Vent Vent flow (min off
Test Date Time (hrs) Config rate (cfm) min on) Doors Notes
A1 Dec 28 AM 3 Exhaust 58 none closed
A2 PM 3 Exhaust 58 2010 closed
A3 overnight 12 Exhaust 58 none closed A4 Dec 29 AM 4 Supply 104 33 2010 closed
duty cycle A5 PM 4 Supply 58 33 duty 2010 closed
cycle A6 overnight 12 Supply 174 33 2010 closed
duty cycle
A7 Dec 30 AM-PM 8 None 0 none open Natural infiltration
A8 PM 2 None 0 none open AH bump
A9 overnight 12 Exhaust 58 none open
A10 Dec 31 AM-PM 6 Exhaust 58 none closed Transfer grills taped
A11 PM 6 Exhaust 58 2010 closed Transfer grills taped
A12 Jan 1 overnight 12 Exhaust 58 2010 closed
A13 PM 6 Exhaust 58 2010 open
A14 overnight 12 Exhaust 58 54 none closed
A15 Jan 2 AM-PM 6 None 0 none closed Natural infiltration
A16 overnight 12 Exhaust 58 none closed Master bath exhaust
14 of 49
Research Report - 0602
Table 3 Test sequence for 2-story test house
Central fan
cycling Duration Vent Vent flow (min off
Test Date Time (hrs) Config rate (cfm) min on) Doors Notes B1 Jan 3 overnight 14 Exhaust 63 none closed
B2 Jan 4 PM 5 Supply 114 33 20 10 closed 60 ASHRAE 622 duty cycle
B3 overnight 11 Supply 180 33 20 10 closed 95 ASHRAE 622 duty cycle
B4 Jan 5 PM 4 Supply 63 33 duty 20 10 closed 33 ASHRAE 622 cycle
B5 overnight 13 Exhaust 63 5010 closed
B6 Jan 6 PM 6 Exhaust 63 2010 closed
B7 overnight 12 Exhaust 63 none closed Transfer grilles taped
B8 Jan 7 AM 4 Exhaust 63 50 10 closed Transfer grilles taped
B9 PM 4 Exhaust 63 none closed Transfer grilles taped extra injection in MBR
B10 PM 2 Exhaust 63 none open
B11 overnight 9 Supply 114 33 20 10 closed Transfer grilles taped duty cycle
B12 Jan 8 PM 3 None 0 100 closed Transfer grilles taped air handler bump test
B13 PM 2 None 0 100 closed Transfer grilles untaped
B14 PM 2 None 0 none open Natural infiltration
B15 overnight 9 Exhaust 63 none closed Master bath exhaust transfer grilles taped
B16 Jan 9 AM 4 Exhaust 63 50 10 closed Master bath exhaust
B17 PM 4 Supply 178 33 20 10 closed duty cycle
B18 overnight 12 Exhaust 63 none closed Master bath exhaust
TEST RESULTS FROM 1-STORY HOUSE (1111 MONTAGUE)
Natural Infiltration
A test of natural infiltration was conducted for an 8-hour period on December 30 to examine the magnitude and variability of outside air entering the house through leaks in the building envelope (Test A7) The tracer gas decay curves are shown in Figure 9 It is evident that the house was very well mixed during this test which allows a running instantaneous calculation of whole-house ACH over the same time period (see Figure 10) Although the air change rate indicated that the house is relatively tight (about 0085 ACH on average) the effect of natural infiltration was far from negligible especially when the wind was blowing This variability of natural infiltration must be kept in mind when interpreting the decay curves and reciprocal age-of-air calculations that follow
15 of 49
Research Report - 0602
An air handler bump test was performed between 1300 and 1500 hours to examine the effect of air handler operation on whole house air exchange rate including duct leakage to the outside and changes in room-to-room pressurization caused by moving air from the supply registers in each room to the central return in the main living area Figure 10 shows both the hourly average ACH and the wind speed during this period At first glance it appears that the air change rate increased by about 003 ACH when the fan was turned on but there was a coincident jump in wind speed that complicates this interpretation There was no corresponding decrease in ACH when the air handler was turned off at 1500 hours Ultimately we cannot conclusively quantify the change in ACH associated with operation of the air handler but it appears to have been no more than 003 ACH
3
Co
ncen
trati
on
(m
gm
)
70
60
50
40
30
20
10
0
Living
Entry
BR1
BR2
BR3
MBR
Air Handler On
Air Handler Off
8 9 10 11 12 13 14 15 16 17 18
Hour
Figure 9 Tracer gas decay for 1-story house with no ventilation and bedroom doors open with and without central fan operation (Test A7)
16 of 49
Research Report - 0602
40016
35014 Air Handler On Air Handler Off
ACH
Wind Speed
Air
Ch
an
ge
Ra
te (
AC
H) 30012
25010
20008
15006
10004
Win
d S
pe
ed
(m
ph
)
002 05
00
8 10 12 14 16 18
000
Hour
Figure 10 Average air change rate for 1-story house with no ventilation no central fan operation and bedroom doors open (Test A7)
The natural ventilation test was repeated on January 2 with the doors closed instead of open (Test A15) providing the decay curves shown in Figure 11 The average air change rate for this case was 0086 ACH calculated based on the two well-mixed cases at the beginning and end of the test It is difficult to compare this number with the doors-open case because it was windy (4-5 mph) for the first few hours of this test However it is very clear that the uniformity of room-toshyroom distribution of outside air was significantly less when the doors were closed even with transfer grilles We did not calculate age-of-air for this test because the test conditions were not sufficiently steady state This fact is very evident at about hour 15 where the BR2 and BR3 curves suddenly begin to diverge from the MBR curve
17 of 49
Research Report - 0602
0
10
20
30
40
50
60
70
80
90
Co
ncen
trati
on
(m
gm
3 )
Living
Entry
BR1
BR2
BR3
MBR
Mixing stopped
Mixing restarted
10 11 12 13 14 15 16 17 18 19
Hour
Figure 11 Tracer gas decay for 1-story house with no ventilation no central fan operation and bedroom doors closed (Test A15)
Distributed Supply vs Point Exhaust Ventilation
Two of the most common ventilation schemes in Building America homes are continuous single-point exhaust ventilation and intermittent central-fan integrated supply (CFIS) ventilation Exhaust ventilation is most commonly installed in a bathroom laundry room or utility room Make-up air enters through the cracks and holes in the building envelope upon depressurization of the house The distribution of outside air in a given room is fairly unpredictable because it depends on the amount of depressurization in the room the number and size of openings in exterior walls and the influence of adjacent rooms Supply ventilation provided by a central-fan integrated system tends to be distributed more uniformly throughout the house However the fan is usually operated on a duty cycle of about 33 to limit the electricity used by the central fan and one of the goals of this testing is to evaluate the effect of that duty cycle on the consistency of the air mixing
The decay curves for a 12-hour overnight test with exhaust ventilation (Test A3) are shown in Figure 12 The exhaust fan register in the laundry room was used as the exhaust point and the Duct Blaster was used to exhaust 58 cfm continuously corresponding to the minimum ventilation rate recommended by ASHRAE for a 2075 ft2 4-bedroom house It is evident from the decay curves that significantly more outside air reached the master bedroom and less reached Bedroom 2 compared to the other rooms in the house
18 of 49
Research Report - 0602
0
2
4
6
8
10
12
14
Co
nc
en
tra
tio
n
mg
m3
Living
Entry
BR1
BR2
BR3
MBR
Mixing stopped
Mixing restarted
17 18 19 20 21 22 23 0 1 2 3 4 5 6
Hour
Figure 12 Tracer gas decay for 1-story house with exhaust ventilation from the laundry room at ASHRAE 622 level no central fan operation and bedroom doors closed (Test A3)
The corresponding decay curves for the central fan integrated supply system (Test A6) are shown in Figure 13 The air handler operated at a 33 duty cycle (20 min off 10 min on) with a ventilation rate of 174 cfm resulting in an average ventilation rate of 58 cfm again meeting the minimum ASHRAE 622 recommendations The whole house appeared to be well-mixed in this case because the decay curves were clustered together throughout the test Even during the 20 minute periods when the air handler was off there was very little divergence A comparison of Figure 12 to Figure 13 indicates that much more uniform distribution of ventilation air was achieved by using the CFIS system
19 of 49
Research Report - 0602
0
2
4
6
8
10
12
14
16
Co
nc
en
trati
on
(m
gm
3 )
Living
Entry
BR1
BR2
BR3
MBR
Mixing stopped
Mixing restarted
185 195 205 215 225 235 05 15 25 35 45 55 65
Hour
Figure 13 Tracer gas decay for 1-story house with supply ventilation at ASHRAE 622 level 33 central fan operation (20 min off 10 min on) and bedroom doors closed (Test
A6)
Reciprocal age-of-air calculations were performed to provide a quantitative comparison of the two ventilation systems as shown in Figure 14 Values were in the range of 0169 hr-1 +0042shy0038 hr-1 for the exhaust ventilation system compared to 0173 hr-1 +0002-0003 hr-1 for the supply ventilation system expressed in terms of the range of differences between the reciprocal age-of-air in each room and the whole-house air change rate With the exhaust ventilation at the laundry room the master bedroom received the greatest amount of fresh air We suspect this may have been caused by the presence of the exhaust ducts used for spot ventilation of the master bathroom possibly providing greater leakage area near the master bathroom than is present in other areas of the house The supply system distributed the ventilation air more uniformly but it is not entirely clear whether this result was primarily caused by the introduction of ventilation air through the supply ducts or by the air handler mixing air throughout the house Since it is clear that the exhaust ventilation showed better uniformity of ventilation with central system mixing it follows that mixing is likely to be the primary factor in the room-to-room uniformity shown by CFIS ventilation
It is also noteworthy that the average net air change rates provided by both the supply and exhaust ventilation systems were only about 018 ACH compared to the 025 ACH that would be expected if the mechanical ventilation rate (017 ACH) and the natural infiltration rate (008 ACH) were additive as they might be with a balanced ventilation system Adding mechanical ventilation to natural infiltration in quadrature results in an estimated average air change rate of 019 ACH which is fairly consistent with the measured values
20 of 49
Research Report - 0602
Recip
rocal
Ag
e o
f A
ir (
1h
r) 025
020
015
010
005
000
Simple Exhaust vs Central Fan Integrated
Supply
Centralized supply mixing
33 duty cycle 100
ASHRAE doors closed
Living
Entry
BR1
BR2
BR3
MBR
Exhaust in utility room no
mixing 100 ASHRAE
doors closed
Figure 14 Reciprocal age-of-air for 1-story house with continuous exhaust ventilation (Test A3) compared to central fan integrated supply ventilation (Test A6)
Air Handler Operation
To determine how much room-to-room mixing was caused by the air handler the exhaust only test was re-run with the air handler operating at 33 duty cycle (20 min off 10 min on) (Test A12) The decay curves are shown in Figure 15 Compared to Test A3 (Figure 12) there was a noticeable increase in uniformity when the air handler was operating even though the entry points for the ventilation air were uncontrolled As shown in Figure 16 the range of reciprocal age of air was reduced from +0042-0038 hr-1 to +0019-0011 hr-1) It appears that operation of the air handler explains most of the difference between the supply and exhaust ventilation systems discussed earlier Although it also appears that the overall average air change rate was higher in the case where the air handler was operating (0216 ACH vs 0176) it should be noted that the average wind speed was also significantly higher It is likely that the wind speed was the primary cause of the difference in average ACH not a difference in the mechanical ventilation rate
21 of 49
Research Report - 0602
0
5
10
15
20
25
30
35
Co
nce
ntr
ati
on
(m
gm
3 )
Living
Entry
BR1
BR2
BR3
MBR
Mixing stopped
Mixing restarted
0 1 2 3 4 5 6 7 8 9 10 11 12 13 14
Hour
Figure 15 Tracer gas decay for 1-story house with continuous exhaust ventilation at ASHRAE 622 level 33 central fan operation (20 min off 10 min on) and bedroom
doors closed (Test A12)
Exhaust Ventilation No Mixing vs 33 Air Handler Duty Cycle
000
005
010
015
020
025
Recip
rocal A
ge o
f A
ir (
1h
r)
Living
Entry
BR1
BR2
BR3
MBR
Exhaust in utility room 33 air handler
no mixing 100 operation exhaust in
ASHRAE doors closed utility room 100
ASHRAE doors closed
Figure 16 Reciprocal age-of-air for 1-story house with continuous exhaust ventilation with and without air handler operation (Tests A3 and A12)
22 of 49
Research Report - 0602
Exhaust Location
The preceding analysis of exhaust ventilation was based on an exhaust point in the laundry room which was relatively centrally located in the 1-story house To examine the effect of moving the exhaust point the duct blaster was moved to the master bathroom which was located in a far corner of the house (Test A16) A continuous exhaust ventilation rate of 58 cfm was again applied to the house resulting in the tracer gas decay curve shown in Figure 17 It is difficult to visually identify a significant difference between this series of curves and those shown in Figure 12 for the laundry room exhaust location
Because the curves were steady it is again possible to compare the results based on reciprocal age-of-air as shown in Figure 18 There appeared to be very little change in the distribution of outside air to most rooms However the reciprocal age-of-air in the master bedroom dropped noticeably when the exhaust location was moved to the master bathroom probably because a greater fraction of the outside air now passed through other rooms before reaching the master bedroom With the exhaust point centrally located most of the ventilation air passing through the master bedroom probably entered from the outside In both cases however the master bedroom had the highest reciprocal age-of-air of all of the rooms in the house and the BR2 location had the lowest
Co
nc
en
tra
tio
n (
mg
m3)
40
35
30
25
20
15
10
5
0
Living
Entry
BR1
BR2
BR3
MBR
Mixing stopped
Mixing restarted
19 20 21 22 23 0 1 2 3 4 5 6 7 8
Hour
Figure 17 Tracer gas decay for 1-story house with exhaust ventilation from the master bathroom at ASHRAE 622 level no central fan operation and bedroom doors closed (Test
A16)
23 of 49
Research Report - 0602
Exhaust Ventilation
Laundry Room vs Master Bathroom
000
005
010
015
020
025
Exhaust in laundry
room no mixing 100
ASHRAE doors closed
Exhaust in master
bathroom no mixing
100 ASHRAE doors
closed
Re
cip
roc
al A
ge
of
Air
(1
hr)
Living
Entry
BR1
BR2
BR3
MBR
Figure 18 Reciprocal age-of-air for 1-story house with exhaust ventilation from the master bathroom compared to the laundry room at ASHRAE 622 level no central fan operation
and bedroom doors closed (Tests A3 and A16)
Ventilation Rate
The supply ventilation test was repeated using flow rates corresponding to 60 and 33 of the ASHRAE recommendations The intent of this series of tests was to evaluate the room-to-room ventilation uniformity for ventilation rates consistent with ASHRAE 622 compared to the uniformity for reduced mechanical ventilation rates Each test was conducted for only 4 hours because of time limitations The decay curves are shown in Figures 19 and 20 Because the rooms were well-mixed during the supply ventilation tests the average whole-house ACH can be compared directly to the reciprocal age-of-air for the exhaust ventilation tests Figure 21 shows the supply ventilation air change rate for each of the three ventilation levels (33 60 100) compared to room-by-room reciprocal age-of-air for the exhaust ventilation system based on the boundary conditions present during the tests It appears that in the supply ventilation case all rooms receive more outside air than the least-ventilated room in the exhaust case (BR2) even at 60 of ASHRAE 622 These results serve to illustrate the trade-off between whole-house ventilation rate and room-to-room ventilation uniformity in terms of their impact on the worst room(s)
24 of 49
Research Report - 0602
The ASHRAE 622 committee has not currently defined the level of mixing that is required when choosing the minimum ventilation rate Some might interpret the results of this test to suggest that a house without mixing can have individual rooms that do not receive sufficient outside air even though the ventilation system is operating at 622 specified rates Because the 622 committee has not specified the level of mixing that is required when choosing the minimum ventilation rate the ventilation rate required by different ventilation systems is open to interpretation For example if the exhaust system performance shown in Figure 21 is acceptable does this mean that a ventilation system that provides good distribution of outside air may be sufficiently well-ventilated at 60 of the ASHRAE 622 level or perhaps even less Alternatively it might be concluded that exhaust ventilation rates should be increased over current ASHRAE 622 recommendations because of the possibility that certain rooms may receive very little fresh air Unfortunately because the current 622 standard does not specify air mixing requirements and the committeersquos assumptions about ventilation air distribution are not well documented it is difficult to make any firm recommendations in this area However we can conclude that air mixing is required for dilution ventilation systems to provide predictable results independent of the geometry of individual homes
8 9 10 11 12 13 14
Hour
Figure 19 Tracer gas decay for 1-story house with supply ventilation at 60 of ASHRAE 622 level 33 central fan operation (20 min off 10 min on) and bedroom doors closed
(Test A4)
0
10
20
30
40
50
60
Co
nce
ntr
ati
on
m
gm
3
Living
Entry
BR1
BR2
BR3
MBR
Mixing stopped
Mixing restarted
25 of 49
Research Report - 0602
0
5
10
15
20
25
30
Co
nce
ntr
ati
on
(m
gm
3 )
Living
Entry
BR1
BR2
BR3
MBR
Mixing stopped
Mixing restarted
12 13 14 15 16 17 18 19 20
Hour
Figure 20 Tracer gas decay for 1-story house with supply ventilation at 33 of ASHRAE 622 level 33 central fan operation (20 min off 10 min on) and bedroom doors closed
(Test A5)
Simple Exhaust vs Central Fan Integrated
Supply with Lower Ventilation Rates
025
Re
cip
roc
al A
ge
of
Air
(1
hr)
Well Mixed
100
ASHRAE 60
ASHRAE 33
ASHRAE Living Entry 010 Natural
BR1 Infilt
BR2 BR3 005
MBR
Exhaust in laundry room no
000
Central supply Natural infil-
mixing 100 ASHRAE doors mixing 33 duty tration doors
closed cycle doors closed open
Figure 21 Reciprocal age-of-air for 1-story house with supply ventilation at 33 60 and 100 of ASHRAE 622 level (Tests A5 A4 A6) compared to exhaust ventilation with
no central fan operation (Test A3) Bedroom doors were closed
020
015
26 of 49
Research Report - 0602
Simulations by Walker (2006) have shown that all systems will not provide the same service in terms of annual average air change rate For the same air flow rate and duty cycle balanced ventilation will yield a higher average air exchange than supply ventilation and supply ventilation will yield a higher average air exchange than exhaust ventilation That can be explained in general terms by understanding that wind and stack effects act to depressurize a building most of the time Exhaust fans increase the building depressurization further but supply fans decrease the depressurization Balanced fans donrsquot change the enclosure differential pressure and air flow at all Because of the non-linear relationship between differential pressure and air flows across the building enclosure a supply fan changes the pressures across the enclosure less than an exhaust fan acting more like a balanced fan The result is that the effect on ventilation air change rate from a supply fan is somewhere between that of an exhaust fan and a true balanced system
Bedroom Doors
Except for the natural ventilation test the preceding tests were all conducted with the bedroom doors closed to simulate a worst-case situation for air circulation within the house The exhaust ventilation test was repeated with the bedroom doors open (Test A9) producing the tracer gas decay curve shown in Figure 22 It is evident that the decay curves were much more tightly bundled with the doors open than they were with the doors closed (compare Figure 12) A comparison based on reciprocal age-of-air is shown in Figure 23 A significant improvement in room-to-room mixing is evident during the open-door test
It is also evident that the average air change rate was higher when the doors were open (0202 vs 0176 ACH) but it must be remembered that the ventilation rate was controlled using a duct blaster and average wind speed was higher during the open-door test period compared to the closed-door test period (20 mph compared to 06 mph) Therefore this test alone does not necessarily indicate that closing doors reduces the average air change rate associated with an exhaust system In future tests continuous measurement of the depressurization of the house with respect to outside along with single-point pressure measurements across interior doors would provide more information about the effect of closing doors when exhaust ventilation systems are used It would also be valuable to conduct this test during steady weather conditions using the exhaust fan (with uncontrolled ventilation rate) instead of the duct blaster to observe the net effect of closed doors on whole-house air change rate
27 of 49
Research Report - 0602
0
5
10
15
20
25
30
Co
ncen
trati
on
(m
gm
3 )
Living
Entry
BR1
BR2
BR3
MBR
Mixing stopped
Mixing restarted
181 191 201 211 221 231 01 11 21 31 41 51 61 71
Hour
Figure 22 Tracer gas decay for 1-story house with exhaust ventilation from the laundry room at ASHRAE 622 level no central fan operation and bedroom doors open (Test A9)
Exhaust Ventilation
Doors Closed vs Doors Open
000
005
010
015
020
025
Re
cip
roc
al
Ag
e o
f A
ir (
1h
r)
Living
Entry
BR1
BR2
BR3
MBR
Exhaust in laundry room Doors open no mixing
no mixing 100 exhaust in laundry room
ASHRAE doors closed 100 ASHRAE
Figure 23 Reciprocal age-of-air for 1-story house with exhaust ventilation from the laundry room at ASHRAE 622 level no central fan operation In the first case the bedroom doors were closed (Test A3) in the second the doors were open (Test A9)
28 of 49
Research Report - 0602
Transfer Grilles
Because the test houses used central returns instead of hard ducted returns in the bedrooms transfer grilles were installed over the bedroom doors to provide a flow path for return air without excessive room pressurization when the doors were closed These transfer grilles also allowed ventilation air to pass more freely from the bedrooms to the main living space The effect of transfer grilles on ventilation air distribution was evaluated by taping over the grilles (see Figure 24) and re-running the exhaust ventilation test (Test A10) The corresponding tracer gas decay curve is shown in Figure 25 and the reciprocal age-of-air analysis is shown in Figure 26 Taping the transfer grilles did not appear to significantly affect the room-to-room variability in ventilation rate although there appeared to be some slight re-ranking of rooms from highest to lowest reciprocal age-of-air It should be noted that there was an increase in average wind speed from 26 mph to 41 mph starting at 1 pm including a half hour period where the average wind speed was 7 mph This weather effect produced noticeable kinks in the decay curves and therefore would be expected to introduce significant errors into the reciprocal age-of-air results
Itrsquos possible that the transfer grilles played a much smaller role in providing a path for ventilation air than the supply ducts Because the air handler was not operating the ducts were not pressurized and were thus available as passive airflow conduits The resistance to air flow was probably smaller for the air ducts than for the transfer grilles depending on their size and the number of supply registers in each bedroom The existing door undercuts are also thought to have played a role The effect of ducts and door undercuts can be tested in the future by running separate tests with ducts and door undercuts taped over
copy buildingsciencecom
Figure 24 Transfer grilles over bedroom doors taped closed
29 of 49
Research Report - 0602
0
10
20
30
40
50
60
70
Co
nc
en
tra
tio
n (
mg
m3 )
Living
Entry
BR1
BR2
BR3
MBR
Mixing stopped
Mixing restarted
8 9 10 11 12 13 14 15 16 17
Hour
Figure 25 Tracer gas decay for 1-story house with exhaust ventilation from the laundry room at ASHRAE 622 level no central fan operation bedroom doors closed and transfer
grilles taped (Test A10)
Exhaust Ventilation
000
005
010
015
020
025
Re
cip
roc
al
Ag
e o
f A
ir (
1h
r)
Living
Entry
BR1
BR2
BR3
MBR
Transfer Grilles Untaped vs Taped
Exhaust in laundry room no Exhaust in laundry room no
mixing 100 ASHRAE mixing 100 ASHRAE
doors closed doors closed transfer
grilles taped
Figure 26 Reciprocal age-of-air for 1-story house with exhaust ventilation from the laundry room at ASHRAE 622 level no central fan operation and doors closed In the
30 of 49
Research Report - 0602
first case the transfer grilles are untaped (Test A3) in the second they are taped closed (Test A10)
Minimum Test Duration
We were fortunate that DR Horton provided two full weeks of access to these homes to conduct this series of tests which allowed us to run some of the more important tracer gas decay tests as long as 12 hours to help ensure that we could accurately calculate reciprocal age-of-air In most cases test houses would not be available for such a long time period To evaluate the length of time needed to estimate the reciprocal age-of-air with reasonable accuracy we examined the results that we would have obtained for one of the exhaust ventilation tests had we halted the test period after less than 12 hours For the supply ventilation tests the rooms were sufficiently well-mixed that the test could have been stopped after 3 or 4 hours assuming weather effects were steady
The reciprocal age-of-air calculations for the exhaust ventilation decay curves (Test A3 see Figure 12) based on test durations of 3 6 9 and 12 hours are shown in Figure 27 These test durations range from 053 to 21 air changes based on the average air change rate of 018 ACH (56 hours per air change) calculated for this test The ratio of highest to lowest reciprocal ageshyof-air is shown above the data points for each case These results suggest that shorter tests tend to overestimate the range and that perhaps 1frac12-2 air changes (roughly 9 to 12 hours in this case) may be necessary to obtain accurate calculations of reciprocal age-of-air when there is significant divergence among rooms From a qualitative standpoint one air change may be sufficient to determine the basic trend Without knowing in advance what mixing pattern will occur it is difficult to recommend a minimum test duration But assuming this test is fairly representative of a worst-case scenario a minimum of 15 air changes would be necessary to have a high degree of confidence in the quantitative difference in reciprocal age-of-air among rooms
31 of 49
Research Report - 0602
000
005
010
015
020
025
030
035
Re
cip
roc
al
Ag
e-O
f-A
ir (
hr-1
)
Living
Entry
BR1
BR2
BR3
MBR HighLow = 297
HighLow = 168 HighLow = 184 HighLow = 161
3-hour Test 6-hour Test 9-hour Test 12-hour Test
(053 Air Changes) (11 Air Changes) (16 Air Changes) (21 Air Changes)
Test Duration
Figure 27 Reciprocal age-of-air based on alternate test durations for 1-story house with exhaust ventilation from the laundry room at ASHRAE 622 level no central fan operation
and doors closed (Test A3) Average air change rate was 018 ACH
TEST RESULTS FROM 2-STORY HOUSE (1117 MONTAGUE)
The 2-story house was tested from January 3-10 2006 Three zones were selected on the first floor and three more were selected on the second floor as indicated by the red stars in Figure 4 The initial mixing of air among the rooms at the start of each test in this 2-story house was not as thorough as it was in the 1-story house Evidently the combined effects of the air handler and the portable de-stratification fan were not sufficient to overcome upward transport of tracer gas driven by the stack effect from the first to the second floor The resulting difference in initial tracer gas concentration among the rooms was about 5-10 This outcome emphasizes the significant effect of stack-driven infiltration on ventilation non-uniformity in multi-story homes Because our test method and equipment did not achieve a well-mixed condition at the start of each test there were some errors introduced into the reciprocal age-of-air analysis For future tests we would recommend larger de-stratification fans to obtain more well-mixed conditions in multi-story houses
Typical errors introduced by incomplete mixing of the tracer gas at the start of such a test were analyzed by examining two hypothetical cases where either all of the air entering a room comes from the outside or all of the air comes from an adjacent room with a different starting concentration If all of the air entering a space comes from the outside then a change in the initial concentration would have no effect on the reciprocal age-of-air because the decay curve would be exponential from the start and the area under the curve would be normalized based on
32 of 49
Research Report - 0602
the starting concentration in that zone However if the air entering a room passes through another room with a lower initial concentration the room receiving the air will have a lower concentration of tracer gas throughout the test compared to what the concentration would have been if the starting points were the same in both rooms This case is illustrated in Figure 28 where assumptions are made that the rooms are the same size the air exchange rate is 01 ACH for both rooms and the initial tracer gas concentration is 10 lower in the first room (upstream) than it is in the second room
The effect on reciprocal age-of-air is shown in Figure 29 A 10 difference in starting concentration results in an error of about 75 in reciprocal age-of-air for a room downstream of a room with a lower starting concentration assuming 01 ACH for both rooms The error would be somewhat smaller (about 5) if the air change rate was higher for both rooms (02 ACH) There would be no error introduced for rooms where all of the air infiltration comes from the outside Although the amount of error in the reciprocal age-of-air calculations can be affected by additional variables not examined here we feel that these percentages are reasonable estimates of the errors in our results for the 2-story house due to incomplete initial mixing of air
In each case an engineering judgment must be made regarding the significance of the error introduced by incomplete initial mixing As a general rule the differences in concentration at the start of the test should be small compared to the differences that are being measured in order for the results to be considered valid
Figure 28 Theoretical decay curves for a well-mixed case with uniform tracer gas concentration compared to a case where the upstream room starts with a concentration
10 lower than the downstream room
33 of 49
Research Report - 0602
Figure 29 Theoretical reciprocal age-of-air for a well-mixed case with uniform tracer gas concentration compared to a case where the upstream room starts with a concentration
10 lower than the downstream room
Natural Infiltration and Duct Leakage
A natural infiltration test was performed over a two hour period on the evening of January 8 (Test B14) The tracer gas decay curves are shown in Figure 30 There was a slight divergence between the first floor and second floor once the air handler was turned off but the rooms on each floor appeared to remain fairly well-mixed The average air change rate during the test period was about 011 ACH which was somewhat higher than the 1-story house as might be expected with an increased stack height
An air handler bedroom door bump test was conducted just prior to the test period shown in Figure 30 allowing observation of the combined effect of duct leakage to the outside and increased infiltration caused by room pressurization The average air change rate during that bump test was 013 ACH suggesting that closing doors and operating the fan added approximately 002 ACH to the whole-house average air change rate The average wind speed was a bit higher while the air handler was running (17 mph compared to 05 mph) so the effect of air handler operation may actually be somewhat less than the average ACH numbers indicate
34 of 49
Research Report - 0602
0
1
2
3
4
SF
6 C
on
ce
ntr
ati
on
(m
gm
3)
BR1
Living
Kitchen
BR2
BR3
MBR
Mixing stopped
Mixing restarted
1814 1843 1912 1940 2009 2038 2107 2136
Hour
Figure 30 Tracer gas decay for 2-story house with no ventilation no central fan operation and bedroom doors open (Test B14)
Distributed Supply vs Point Exhaust Ventilation
A 14-hour test (Test B1) was performed with an exhaust ventilation rate of 63 cfm in the laundry room which was located near the stairwell in the middle of the first floor The ventilation rate was again consistent with the ASHRAE 622 recommendations The tracer gas decay curves are shown in Figure 31 It is interesting that all three second floor rooms showed a delay before entering an exponential decay suggesting that some amount of air was moving from the first floor to the second floor even though the mechanical exhaust point was on the first floor It appears that the further depressurization of the first floor was insufficient to overcome the stack effect and draw a significant amount of outside air in through the rooms on the second floor
35 of 49
Research Report - 0602
182
9
192
9
202
9
212
9
222
9
232
9
029
129
229
329
429
529
629
729
828
929
102
8
112
8
122
8
0
10
20
30
40
50
60
70
SF
6 C
on
ce
ntr
ati
on
(m
gm
3)
BR1
Living
Kitchen
BR2
BR3
MBR
Mixing stopped
Mixing restarted
Hour
Figure 31 Tracer gas decay for 2-story house with exhaust ventilation from the laundry room at ASHRAE 622 level no central fan operation and bedroom doors closed (Test B1)
A supply ventilation test was performed on the 2-story house for about 11 hours starting late on January 4 (Test B3) The duct blaster was unable to provide the ventilation rate necessary to meet the minimum specified in ASHRAE 622 supplying 180 cfm instead of 189 cfm (95) The decay curves are shown in Figure 32 Although the curves are much more tightly packed than they were with the exhaust system there is more divergence than we saw with the supply system in the 1-story house most notably in the master bedroom
The reciprocal age-of-air calculations for both the exhaust and supply ventilation systems are shown in Figure 33 Again the results indicate that much better room-to-room distribution of ventilation air was achieved by the central-fan integrated supply system compared to the single-point exhaust system However for the supply ventilation test the differences in the initial tracer gas concentration were of the same magnitude as the differences in decay rates among the rooms As a result no conclusions should be drawn about the relative ranking of the supply ventilation rate among rooms based on Figure 33
36 of 49
Research Report - 0602
0
10
20
30
40
50
60
SF
6 C
on
ce
ntr
ati
on
(m
gm
3)
BR1
Living
Kitchen
BR2
BR3
MBR
Mixing stopped
Mixing restarted
2136 000 224 448 712 936 1200
Hour
Figure 32 Tracer gas decay for 2-story house with supply ventilation just under ASHRAE 622 level central fan operation at 33 duty cycle (20 min off 10 min on) and bedroom
doors closed (Test B3)
Simple Exhaust vs Central Fan Integrated
Supply )
000
005
010
015
020
025
Recip
rocal A
ge o
f A
ir (
1h
r
BR1
Living
Kitchen
BR2
BR3
MBR
Exhaust in laundry room no Centralized supply mixing
mixing 100 ASHRAE 33 duty cycle 95
doors closed ASHRAE doors closed
Figure 33 Reciprocal age-of-air for 2-story house with continuous exhaust ventilation (Test B1) compared to central fan integrated supply ventilation (Test B3) (Note
Uncertainties introduced by non-uniform starting concentration are of the same order of magnitude as the differences in reciprocal age-of-air among rooms for the supply ventilation case The relative ranking of rooms is not meaningful for that case)
37 of 49
Research Report - 0602
Air Handler Operation
The effect of occasional air handler operation on the distribution of exhaust ventilation air was evaluated on the afternoon of January 6 (Test B6) The tracer gas decay curves are shown in Figure 34 and reciprocal age-of-air calculations are shown in Figure 35 It should again be noted that before the test started the house was mixed using both the air handler and a de-stratification fan with the doors open During the test the doors were closed the de-stratification fan was turned off and the air handler operated at a 33 duty cycle (20 minutes off 10 minutes on) As was the case in the 1-story house this occasional operation of the air handler substantially improved the distribution of ventilation air among rooms even in conjunction with the point exhaust ventilation system There was very little divergence noticeable even with the air handler cycling on and off every half hour However because the initial differences in tracer gas concentration among rooms were as large as the differences in reciprocal age-of-air for the case with air handler operation no conclusions should be drawn about the relative ranking of ventilation rates among the rooms for that case
SF
6 C
on
cen
trati
on
(m
gm
3)
80
70
60
50
40
30
20
10
0
BR1
Living
Kitchen
BR2
BR3
MBR
Mixing stopped
Mixing restarted
1048 1200 1312 1424 1536 1648 1800 1912 2024
Hour
Figure 34 Tracer gas decay for 2-story house with continuous exhaust ventilation at ASHRAE 622 level central fan operation at 33 duty cycle (20 min off 10 min on) and
bedroom doors closed (Test B6)
38 of 49
Research Report - 0602
020
015 R
ec
ipro
ca
l A
ge
of
Air
(1
hr)
Exhaust Ventilation
No Mixing vs 33 Air Handler Duty Cycle
Exhaust in laundry room
no mixing 100
ASHRAE doors closed
33 air handler
operation exhaust in
laundry room 100
ASHRAE doors closed
BR1
Living
Kitchen
BR2
BR3
MBR
010
005
000
Figure 35 Reciprocal age-of-air for 2-story house with continuous exhaust ventilation with and without air handler operation (Tests B1 and B6) (Note Uncertainties introduced by non-uniform starting concentration are of the same order of magnitude as the differences in reciprocal age-of-air among rooms for the case with air handler operation The relative
ranking of rooms is not meaningful for that case)
Exhaust Location
The duct blaster was moved to the master bathroom exhaust register to see if there was a resulting change in ventilation air distribution (Test B18) The master bathroom was in the back of the house on the second floor between the master bedroom and bedroom 3 The decay curves are shown in Figure 36 and the reciprocal age-of-air results are shown in Figure 37 The rooms on each floor were well mixed before the test began although the mixing between the two floors was not as good Very wide divergence among rooms can be seen during the test especially between the upstairs bedrooms and the rest of the house Once again all three upstairs rooms appear to receive some air from the first floor but the master bedroom experiences a much higher volume of circulated air than the other two second-floor bedrooms which appear to be relatively stagnant
39 of 49
Research Report - 0602
0
10
20
30
40
50
60
70
80
90
SF
6 C
on
ce
ntr
ati
on
(m
gm
3)
BR1
Living
Kitchen
BR2
BR3
MBR
Mixing stopped
Mixing restarted
1912 2136 000 224 448 712 936 1200
Hour
Figure 36 Tracer gas decay for 2-story house with exhaust ventilation from the master bathroom at ASHRAE 622 level no central fan operation and bedroom doors closed (Test
B18)
Exhaust Ventilation
Laundry Room vs Master Bathroom
000
005
010
015
020
025
030
Exhaust in laundry room no
mixing 100 ASHRAE
doors closed
Exhaust in master bathroom
no mixing 100 ASHRAE
doors closed
Re
cip
roc
al A
ge
of
Air
(1
hr)
BR1
Living
Kitchen
BR2
BR3
MBR
Figure 37 Reciprocal age-of-air for 2-story house with exhaust ventilation from the master bathroom compared to the laundry room at ASHRAE 622 level no central fan operation
and bedroom doors closed (Tests B1 and B18)
40 of 49
Research Report - 0602
Ventilation Rate
The supply ventilation tests were repeated using flow rates of 60 and 33 of ASHRAE 622 recommendations corresponding to 114 cfm and 63 cfm respectively (Tests B2 and B4) The decay curves are shown in Figures 38 and 39 Reciprocal age-of-air for all three supply ventilation rates are shown in Figure 40 In all cases the rooms remained fairly well mixed especially rooms on the same floor As we observed in the 1-story house the ventilation rate in the 2-story house appeared to have very little effect on the uniformity of outside air provided to each room as long as it was mixed using the air handler One again the initial differences in tracer gas concentration among rooms were as large as the divergence in the decay curves preventing any conclusions about the relative ranking of ventilation rates among rooms for all three cases The error in initial concentration uniformity was bigger for the cases with air handler mixing because the relative divergence in the decay curves was so small compared to that of no air handler mixing In other words the error in relative ranking of ventilation rates for the cases with air handler mixing were not very important anyway because the relative differences between rooms were so small
1536 1648 1800 1912 2024 2136 2248
Hour
Figure 38 Tracer gas decay for 2-story house with supply ventilation at 60 of ASHRAE 622 level 33 central fan operation (20 min off 10 min on) and bedroom doors closed
(Test B2)
0
5
10
15
20
25
30
SF
6 C
on
cen
trati
on
(m
gm
3)
BR1 Living Kitchen BR2 BR3 MBR
Mixing stopped
Mixing restarted
41 of 49
Research Report - 0602
0
5
10
15
20
25
30
35
40
SF
6 C
on
cen
trati
on
(m
gm
3)
BR1
Living
Kitchen
BR2
BR3
MBR
Mixing stopped
Mixing restarted
1200 1312 1424 1536 1648 1800 1912
Hour
Figure 39 Tracer gas decay for 2-story house with supply ventilation at 33 of ASHRAE 622 level 33 central fan operation (20 min off 10 min on) and bedroom doors closed
(Test B4)
Supply Ventilation Rate Comparison
000
005
010
015
020
025
Re
cip
roc
al
Ag
e o
f A
ir (
1h
r)
BR1
Living
Kitchen
BR2
BR3
MBR
Centralized supply Centralized supply Centralized supply
mixing 33 duty mixing 33 duty mixing 33 duty
cycle 95 ASHRAE cycle 60 ASHRAE cycle 33 ASHRAE
doors closed doors closed doors closed
Figure 40 Reciprocal age-of-air for 2-story house with three levels of supply ventilation central fan operation at 33 duty cycle (20 min off 10 min on) and bedroom doors closed (Tests B3 B2 B4) (Note Uncertainties introduced by non-uniform starting
concentration are of the same order of magnitude as the differences in reciprocal age-of-air among rooms for all three cases The relative ranking of rooms is not meaningful for these
cases)
42 of 49
Research Report - 0602
The average air change rates for the three supply ventilation rates compared to the two exhaust ventilation schemes are shown in Figure 41 The CFIS system at 33 of the 622 ventilation flow rate provided a uniformly higher air change rate (013 ach) than the least ventilated rooms using exhaust ventilation from either the laundry or the master bathroom (010 ach Figure 37) It is noteworthy that the combined net air change rate with exhaust ventilation from the laundry room was significantly less than the air change rates for both exhaust ventilation from the master bathroom and supply ventilation at the air handler This illustrates the unpredictability of interactions between mechanical ventilation and natural infiltration which depend strongly on the distribution and size of cracks through which the outside air must pass to enter the house There may have been a relatively large building enclosure leakage opening near the laundry room (perhaps the utility penetrations or the door to the garage) that allowed a significant amount of outside air to quickly enter and leave the house through the exhaust flow without circulating around the house
0
005
01
015
02
025
Ave
rag
e A
CH
Natural Exhaust Exhaust Supply 95 Supply 60 Supply 33
Laundry Mbath
Rm 100 100
Figure 41 Average air change rates for 2-story house with supply ventilation at 33 60 and 95 of ASHRAE 622 recommendations (Tests B4 B2 B3) compared to natural
infiltration (Test B14) and exhaust ventilation with no central fan operation (Test B1) Bedroom doors were closed except for the natural infiltration test
Bedroom Doors
The laundry room exhaust ventilation test with no air handler operation (see Figure 31) was repeated with the doors open to evaluate the change in room-to-room ventilation air distribution (Test B10) The decay curves are shown in Figure 42 and the reciprocal age-of air calculations are shown in Figure 43 It is evident from Figure 42 that the test began before the rooms were
43 of 49
Research Report - 0602
0
5
10
15
20
25
SF
6 C
on
ce
ntr
ati
on
(m
gm
3)
BR1 Living Kitchen BR2 BR3 MBR
Mixing stopped
Mixing restarted
completely well mixed resulting in decay curves that could be somewhat misleading Because the master bedroom was at a higher concentration than the other rooms at the start of the test any room that received air from the master bedroom would appear to have a slower decay rate than it would have if the rooms started out at the same concentration Despite the difference in starting concentration it is clear that outside air was well distributed when the doors were open even without operation of the air handler
1843 1912 1940 2009 2038 2107 2136 2204 2233 2302
Hour
Figure 42 Tracer gas decay for the 2-story house with exhaust ventilation from the laundry room at ASHRAE 622 level no central fan operation and bedroom doors open
(Test B10)
Reciprocal age-of-air analysis was not performed for this case because of the combined effect of a short test duration (~2 hours) and unequal starting tracer gas concentrations even though the house was relatively well-mixed The important conclusion (that opening doors greatly improves mixing) can be drawn by inspecting the decay curves alone
Transfer Grilles
A final exhaust ventilation test was run on the 2-story house with the doors closed and the transfer grilles taped over The decay curves are shown in Figure 43 and the reciprocal age-ofshyair calculations are shown in Figure 44 The curves were clearly very divergent even after 12 hours By examining the reciprocal age-of-air results it is apparent that the transfer grilles in the 2-story house caused a noticeable improvement in ventilation air distribution but the improvement was smaller than when the doors were opened (Figure 42)
44 of 49
Research Report - 0602
0
5
10
15
20
25
30
SF
6 C
on
cen
tra
tio
n (
mg
m3
) BR1 Living Kitchen BR2 BR3 MBR
Mixing stopped
Mixing restarted
1648 1912 2136 000 224 448 712 936
Hour
Figure 43 Tracer gas decay for 2-story house with exhaust ventilation from the laundry room at ASHRAE 622 level no central fan operation bedroom doors closed transfer
grilles taped closed (Test B7)
Exhaust Ventilation Transfer Grilles Untaped vs Taped
000
005
010
015
020
Re
cip
roc
al
Ag
e o
f A
ir (
1h
r)
BR1
Living
Kitchen
BR2
BR3
MBR
Exhaust in laundry room no Exhaust in laundry room no
mixing 100 ASHRAE mixing 100 ASHRAE
doors closed doors closed transfer
grilles taped
Figure 44 Reciprocal age-of-air for 2-story house with exhaust ventilation from the laundry room at ASHRAE 622 level no central fan operation and doors closed In the first case the transfer grilles are untaped (Test B3) in the second they are taped closed
(Test B7)
45 of 49
Research Report - 0602
CONCLUSIONS
bull Reciprocal age-of-air analysis was chosen as a quantitative method for characterizing distribution of ventilation air among rooms This method worked well in cases where rooms were well mixed to begin the test and weather conditions were sufficiently steady-state
bull A test period of at least 1frac12 air changes was necessary to obtain reasonably accurate ageshyof-air results when there was significant divergence in tracer gas concentration among the rooms
bull Although we did not achieve uniform initial concentration of tracer gas in the 2-story house using our test methodology and the equipment at hand we believe the reciprocal age-of-air calculations were meaningful in many of the cases as indicated in the discussion
bull Both houses were relatively tight with natural infiltration averaging 008 ACH for the 1shystory house and 011 ACH for the 2-story house
bull Both houses had relatively small (but not negligible) duct losses to the outside producing an increase in infiltration of less than 003 ACH for the 1-story house and 002 ACH for the 2-story house when the air handler runs
bull Age-of-air analysis indicated that ventilation supplied through the central air distribution system provided much more uniform distribution of ventilation air than the single-point exhaust system when the doors were closed and the air handler was not running For the 1-story house the central-fan-integrated supply ventilation case at 60 of ASHRAE 622 provided more outside air to all rooms than the least-ventilated room in the exhaust case at 100 of 622 For the 2-story house the central-fan-integrated supply system at 33 of the 622 flow rate provided more outside air to all rooms than the least ventilated rooms using exhaust ventilation at 100 of 622 from either the laundry or the master bathroom
bull Operation of the central fan at a 33 duty cycle maintained relatively well-mixed conditions regardless of ventilation rate type of ventilation system (supply or exhaust) or house configuration (1-story or 2-story)
bull Exhaust location affected both the relative amount of outside air received by different rooms and the overall uniformity among rooms but the effect was not predictable
bull For exhaust-only ventilation without central fan operation opening bedroom doors appeared to significantly improve the mixing of ventilation air among rooms
bull Transfer grilles improved the distribution of ventilation air slightly but much less than opening the bedroom doors
bull In the 2-story house the stack effect caused air movement from the first floor to the second floor even when exhaust ventilation was applied to the first floor resulting in consistently higher tracer gas concentrations on the second floor and more non-uniform ventilation air distribution in general
bull Interactions between natural infiltration and both exhaust and supply mechanical ventilation were very significant When the ventilation system was activated the combined air change rate did not increase commensurate with the measured ventilation rate but instead increased by only half that amount This result was consistent with combining ventilation and infiltration in quadrature to estimate whole-house air change rate in accordance with ASHRAE Standard 136 (ASHRAE 1993)
46 of 49
Research Report - 0602
FUTURE WORK
In future tests continuous monitoring of pressure differentials would enhance our understanding of the multi-zone combined infiltration and ventilation systems and our ability to model them That would help to explain differences between tests in more detail including the effects of multiple stories location of ventilation supply outlets and exhaust inlets interior door closure and use of passive return air transfer grilles Pressure differential measurement points should include
bull dP with respect to outside for each closed room and open space bull dP across closed interior doors bull dP between the floor cavity and outdoors and bull dP between the house and the attic
Measurement of wind direction along with wind speed could also be helpful for modeling these buildings and systems However because of micro-climate wind shielding it may be very difficult to relate a single-point wind direction measurement to actual wind vectors on the building surfaces
ACKNOWLEDGMENTS
The authors express their appreciation to Rich Coyle of DR Horton for providing the test houses and to Joseph Lstiburek of BSC Subrato Chandra and Neil Moyer of FSEC and Greg Barker of Mountain Energy Partnership for their assistance in the planning and execution of this ventilation study
47 of 49
Research Report - 0602
REFERENCES
ASHRAE (1993) ANSIASHRAE Standard 136-1993 A Method of Determining Air Change Rates in Detached Dwellings Atlanta GA American Society of Heating Refrigerating and Air-Conditioning Engineers Inc
ASHRAE (1997) ANSIASHRAE Standard 129-1997 Measuring Air-Change Effectiveness Atlanta GA American Society of Heating Refrigerating and Air-Conditioning Engineers Inc
ASHRAE (2004) ASHRAE Standard 622-2004 Ventilation and Acceptable Indoor Air Quality in Low-Rise Residential Buildings Atlanta GA American Society of Heating Refrigerating and Air-Conditioning Engineers Inc
CSA (2003) CANCSA F326-M91 Residential Mechanical Ventilation Systems Canadian Standards Association Ontario Canada httpwwwcsashyintlorgonlinestoreGetCatalogItemDetailsaspmat=2410793ampParent=102
NBC 2005 National Building Code of Canada httpircnrcshycnrcgccapubscodesnrcc47666_ehtml
Grieve PW (1991) Measuring Ventilation Using Tracer-Gases Denmark Bruumlel amp Kjaeligr
MN Chapter 7672 Minnesota Energy Code Chapter 7672 Detached Single-Family And Two-Family Dwellings httpwwwstatemnusmnexternalDocsCommerceChapter_7672_Residential_111302012428 _72rulepdf
Persily AK Martin SR (2000) A Modeling Study of Ventilation in Manufactured Houses Gaithersburg MD National Institute of Standards and Technology NISTIR 6455
Rudd A Lstiburek J (2000) ldquoMeasurement of Ventilation and Interzonal Distribution in Single-Family Homesrdquo ASHRAE Transactions 2000 MN-00-10-3 V 106 Pt2 American Society of Heating Refrigeration and Air-Conditioning Engineers Atlanta GA
WAC (2004) Washington State Title 51 WAC Community trade and economic development department of (building code council) Chapter 51-13 Ventilation and indoor air quality httpappslegwagovWACdefaultaspxcite=51-13
48 of 49
Research Report - 0602
Field test of room-to-room uniformity of ventilation air distribution in two new houses
About this Report
This report was prepared for the US Department of Energyrsquos Building America
Program The report is freely available to the public at wwwbuildingamericagov
The authors express their appreciation to Rich Coyle of DR Horton for providing the test houses and to Joseph Lstiburek of BSC Subrato Chandra and Neil Moyer of
FSEC and Greg Barker of Mountain Energy Partnership for their assistance in the planning and execution of this ventilation study
About the Authors
Robert Hendron Ren Anderson Dennis Barley are with National Renewable Energy Laboratory Armin Rudd and Aaron Townsend are with Building Science Corporation
Ed Hancock is with Mountain Energy Partnership
Direct all correspondence to Building Science Corporation 30 Forest Street Somerville MA 02143
Limits of Liability and Disclaimer of Warranty
Building Science documents are intended for professionals The author and the publisher of this article have used their best efforts to provide accurate and authoritative information in regard to the subject matter covered The author and publisher make no warranty of any kind expressed or implied with regard to the information contained in this article
The information presented in this article must be used with care by professionals who understand the implications of what they are doing If professional advice or other expert assistance is required the services of a competent professional shall be sought The author and publisher shall not be liable in the event of incidental or consequential damages in connection with or arising from the use of the information contained within this Building Science document
49 of 49
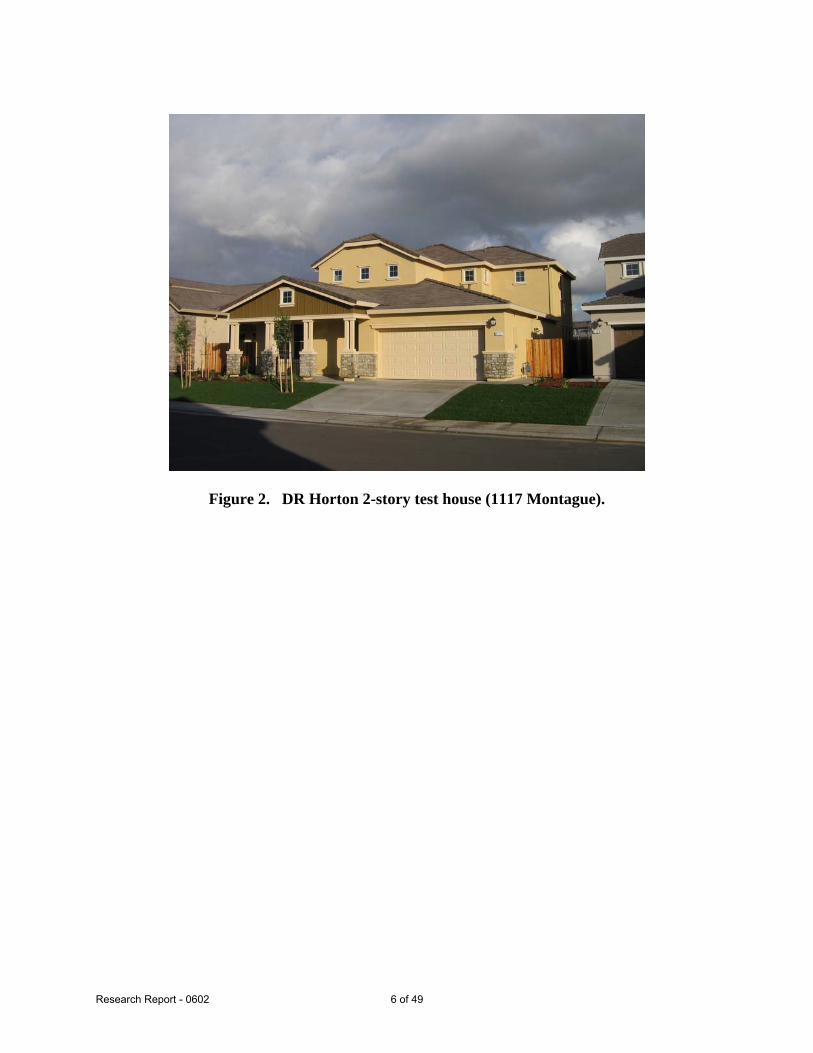
Research Report - 0602
BR1
BR2
BR3
MBR Living Rm
Entry
copy buildingsciencecom
Figure 3 1-story test house floor plan (1111 Montague)
7 of 49
Research Report - 0602
MBR
BR1
BR3
BR2
Kitchen
Living
copy buildingsciencecom
Figure 4 2-story test house floor plan (mirror image of 1117 Montague)
TEST PLAN
Research Questions
The following series of research questions were identified by the researchers to quantify the ventilation distribution characteristics of the test houses under various operating conditions
1 What is the natural air change rate (ACH) for each house with bedroom doors open no air handler operation and no mechanical ventilation What is the room-to-room uniformity in outside air distribution
2 What is the change in whole-house ACH caused by air handler operation What is the change in room-to-room uniformity of outside air distribution
3 What is the change in whole-house ACH caused by closing the bedroom doors What is the change in room-to-room uniformity of outside air distribution
4 What is the change in whole-house ACH caused by taping over the transfer grilles What is the change in room-to-room uniformity of outside air distribution
5 What is the difference in whole-house ACH for a central-fan integrated supply ventilation system (CFIS) operating at 33 duty cycle compared to a continuous exhaust ventilation
8 of 49
Research Report - 0602
system with both systems meeting the ASHRAE 622 recommended minimum ventilation rate on average How does the resulting room-to-room uniformity of outside air distribution compare
6 How does the whole-house ACH and uniformity of outside air distribution change for a CFIS ventilation system when the ventilation rate is lowered from 100 of the ASHRAE 622 recommendation to 60 and to 33
7 How does the whole-house ACH and uniformity of outside air distribution change for the continuous exhaust ventilation system when the location of the exhaust port is changed from the utility room to the master bathroom
8 How uniform is the outside air distribution for the two-story house compared to the one-story house
Test Set-Up
Single-tracer gas decay with multi-zone sampling was used to evaluate the performance of each ventilation system based on how uniformly outside air was distributed to each room or zone within the house The decay curves demonstrate the rate at which the tracer gas (representing a pollutant) which is initially distributed uniformly throughout the house is diluted within each zone as a result of outside air that enters the zone directly as well as air that is exchanged among zones Air entering one zone from another may contain either a higher or lower concentration of the tracer than the air already in the zone This test method is designed as a practical method to evaluate the uniformity of ventilation air distribution within a home assuming that dangerous pollutants such as radon are controlled using appropriate source mitigation strategies Uniform distribution of outside air is required for dilution ventilation systems to provide predictable results independent of the geometry of individual homes
A multi-zone tracer gas sampling system was installed in each house for the test This equipment consisted of a Bruel and Kjaer model 1302 multi-gas monitor and a model 1303 multi-point sampler as shown in Figure 5 Sample tubes were placed in six locations in each house and attached to the multi-point sampler The six sampled locations are designated with red stars on the floor plans in Figures 3 and 4 The sampler was programmed to draw a sample from each sequential location at an interval of about 2 minutes thus all six locations were sampled at an interval of about 12 minutes
The air sample in each zone was taken near the center of the room at a height of four feet above the floor The zone air temperature was measured at the same location The local zone air temperature measurement was used to control the electric heater in each zone (see Test Procedure section below) to achieve a uniform and constant air temperature throughout the house Mixing fans were used to maintain uniform temperatures and concentrations within each room A photo of this set up is shown in Figure 6
9 of 49
Research Report - 0602
copy buildingsciencecom
Figure 5 Multi-zone tracer gas sampling and monitoring equipment
Mixing Fan
Heater
Temperature Sampling Location
Figure 6 Tracer gas sampling point temperature sensor room air mixing and co-heating set-up
The air flow rates for both supply and exhaust ventilation were carefully controlled during the test using a Duct Blaster fan and measurement system For exhaust ventilation the Duct Blaster fan was placed near the location of the ceiling exhaust fan and a length of flexible duct was used to connect the normal entrance for the exhaust fan to the Duct Blaster All of the air flowing through the exhaust fan during the test was first routed through the Duct Blaster The Duct Blaster speed control was adjusted to achieve the desired flow rate and the Duct Blaster flow ring and pressure tap were used to measure the air flow rate The exhaust fan itself was operated in
10 of 49
Research Report - 0602
conjunction with the duct blaster to reduce the resistance to air flow Figure 7 shows the Duct Blaster installed at the laundry room exhaust register
copy buildingsciencecom
Figure 7 Duct Blaster installed at the laundry room exhaust register
A similar application of the Duct Blaster was used to control and measure the supply air flow rate during the tests of the CFIS system The normal configuration of flexible duct connecting the air handler return to the outside was changed so that all outside air would flow through the Duct Blaster The flexible duct was disconnected from the air handler return and attached to the inlet to the Duct Blaster The Duct Blaster outlet duct was attached to the air handler return The Duct Blaster speed control was used to achieve the desired air flow rate and the Duct Blaster flow ring and pressure tap were used to measure the flow rate This installation is shown in Figure 8
Natural infiltration rates varied during the tests depending on weather conditions which were monitored using a portable weather station
It should be noted that the supply ventilation ducts in the test houses were not sized for the flow rates desired in the tests The ventilation flow rate measured during normal operation of the air handler in the 1-story house was about 10 cfm compared to 174 cfm required to meet the ASHRAE 622 recommendations This flow rate was also significantly less than the design flow rate of about 40-60 cfm It was necessary to operate the Duct Blaster fan at maximum power to achieve the required air flow rate during some tests It was unclear if the outside air duct was too long too small or too tortuous or if insufficient negative pressure was present at the return of the air handler because the central return grille was just a few inches away (see Figure 8)
11 of 49
Research Report - 0602
copy buildingsciencecom
Figure 8 Duct Blaster installed between the outside air duct and the return of the air handler to provide supply ventilation
Test Procedure
The tracer gas used was sulfur hexafluoride (SF6) a stable non-toxic gas that was injected into each house volume from a small compressed gas cylinder carried by hand around the house During the dosing period the furnace fan was used to achieve an initially well-mixed condition with a concentration of about 15 parts per million (PPM) During this period the doors were kept open and a portable de-stratification fan was used in the 2-story house to improve mixing between floors Then the mixing fans were stopped and the divergence in concentration from zone to zone was observed (with doors either open or closed depending on the test objective) Small portable fans in each zone continued running to maintain a well-mixed condition within each zone The interior air temperature in each zone was controlled during the test period using portable electric heaters instead of the furnace so that operation of the air handler could be controlled independently from the demand for heating At the conclusion of the test the whole house was again mixed by opening the doors and turning on the air handler This allowed the calculation of an average whole-house air change rate for each set of test conditions
The tests were planned for rather mild weather to minimize infiltration effects so as to isolate and test the performance of the mechanical ventilation systems The general design goal was to provide the minimum amount of mechanical ventilation recommended by ASHRAE Standard 622-2004 (ASHRAE 2004) (58 cfm for the 1-story house 63 cfm for the 2-story house) and observe the effects of providing central fan integrated supply versus single-point exhaust ventilation operating the central fan closing the bedroom doors and taping the transfer grilles above the doors
12 of 49
Research Report - 0602
The results of the multi-zone tracer gas decay tests are presented graphically as families of decay curves These graphs illustrate the uniformity or non-uniformity of the ventilation effect among the various rooms and allow ranking of the rooms from the least to the most ventilation effect
In addition if the ventilation rates were sufficiently steady for the duration of the test period we used local mean age-of-air analysis to evaluate the results more quantitatively Age-of-air analysis is a well-established approach to testing ventilation rates at various points or in various zones within a building (Grieve 1991) Age-of-air is defined as the average length of time that air molecules have resided within the building The formula for calculating local mean age-ofshyair in a tracer gas decay test is given in ASHRAE Standard 129-1997 (ASHRAE 1997) as follows
Ai = 1 intinfin
Ci (t)dt (1)C0 0
where
i = Index for measurement point representing a well-mixed zone Ai = Local mean age-of-air at point i (hr) C = Concentration of tracer gas (lbmft3) C0 = Initial value of C in well-mixed building (lbmft3) Ci = Time-varying concentration of tracer gas at point i (lbmft3) t = Time (hr)
In order to compare the ventilation rates among the rooms or zones in the home we use the metric Reciprocal Age-of-Air
Reciprocal Age-of-Air = 1Ai (2)
Reciprocal Age-of-Air has units of 1hr and is equivalent to the air change rate (ACH) in a single well-mixed zone (Persily 2000)
The definition of Ai in Equation (1) involves an integral of infinite duration This is handled in the test procedure through a two-step process
Step 1 The tracer gas decay test is continued until (a) the initial transient effects of interzonal airflow have subsided and all of the decay curves resemble simple exponential functions and (b) the tracer concentrations are rather small compared to their initial values so that any extrapolation errors will have a small effect on the result In this field test most of the multi-zone tests were continued for 12 hours These portions of the decay curves were integrated numerically using the trapezoid rule
13 of 49
Research Report - 0602
Step 2 The remaining portions (the tails) of the decay curves were extrapolated to infinity using a simple exponential decay function which was matched to the decay rate of the final portion of each measured decay curve These portions of the curves were integrated analytically
Once the conditions of Step 1 were satisfied the rooms were re-mixed by opening the bedroom doors and operating the air handler This allowed the calculation of an effective whole-house air change rate using the relationship in Equation 3
Average whole-house air change rate (ACH) = ln(C0Cf)∆t (3)
where
Cf = Concentration of tracer gas after rooms are re-mixed (lbmft3) ∆t = Elapsed time between initial and final well-mixed cases (hr)
Test Matrix
The series of test conditions for the 1-story and 2-story houses are described in Tables 2 and 3 Most of the important tests were conducted for a 12-hour period overnight to ensure sufficient accuracy when calculating reciprocal age-of-air
Table 2 Test sequence for 1-story test house
Central fan
cycling Duration Vent Vent flow (min off
Test Date Time (hrs) Config rate (cfm) min on) Doors Notes
A1 Dec 28 AM 3 Exhaust 58 none closed
A2 PM 3 Exhaust 58 2010 closed
A3 overnight 12 Exhaust 58 none closed A4 Dec 29 AM 4 Supply 104 33 2010 closed
duty cycle A5 PM 4 Supply 58 33 duty 2010 closed
cycle A6 overnight 12 Supply 174 33 2010 closed
duty cycle
A7 Dec 30 AM-PM 8 None 0 none open Natural infiltration
A8 PM 2 None 0 none open AH bump
A9 overnight 12 Exhaust 58 none open
A10 Dec 31 AM-PM 6 Exhaust 58 none closed Transfer grills taped
A11 PM 6 Exhaust 58 2010 closed Transfer grills taped
A12 Jan 1 overnight 12 Exhaust 58 2010 closed
A13 PM 6 Exhaust 58 2010 open
A14 overnight 12 Exhaust 58 54 none closed
A15 Jan 2 AM-PM 6 None 0 none closed Natural infiltration
A16 overnight 12 Exhaust 58 none closed Master bath exhaust
14 of 49
Research Report - 0602
Table 3 Test sequence for 2-story test house
Central fan
cycling Duration Vent Vent flow (min off
Test Date Time (hrs) Config rate (cfm) min on) Doors Notes B1 Jan 3 overnight 14 Exhaust 63 none closed
B2 Jan 4 PM 5 Supply 114 33 20 10 closed 60 ASHRAE 622 duty cycle
B3 overnight 11 Supply 180 33 20 10 closed 95 ASHRAE 622 duty cycle
B4 Jan 5 PM 4 Supply 63 33 duty 20 10 closed 33 ASHRAE 622 cycle
B5 overnight 13 Exhaust 63 5010 closed
B6 Jan 6 PM 6 Exhaust 63 2010 closed
B7 overnight 12 Exhaust 63 none closed Transfer grilles taped
B8 Jan 7 AM 4 Exhaust 63 50 10 closed Transfer grilles taped
B9 PM 4 Exhaust 63 none closed Transfer grilles taped extra injection in MBR
B10 PM 2 Exhaust 63 none open
B11 overnight 9 Supply 114 33 20 10 closed Transfer grilles taped duty cycle
B12 Jan 8 PM 3 None 0 100 closed Transfer grilles taped air handler bump test
B13 PM 2 None 0 100 closed Transfer grilles untaped
B14 PM 2 None 0 none open Natural infiltration
B15 overnight 9 Exhaust 63 none closed Master bath exhaust transfer grilles taped
B16 Jan 9 AM 4 Exhaust 63 50 10 closed Master bath exhaust
B17 PM 4 Supply 178 33 20 10 closed duty cycle
B18 overnight 12 Exhaust 63 none closed Master bath exhaust
TEST RESULTS FROM 1-STORY HOUSE (1111 MONTAGUE)
Natural Infiltration
A test of natural infiltration was conducted for an 8-hour period on December 30 to examine the magnitude and variability of outside air entering the house through leaks in the building envelope (Test A7) The tracer gas decay curves are shown in Figure 9 It is evident that the house was very well mixed during this test which allows a running instantaneous calculation of whole-house ACH over the same time period (see Figure 10) Although the air change rate indicated that the house is relatively tight (about 0085 ACH on average) the effect of natural infiltration was far from negligible especially when the wind was blowing This variability of natural infiltration must be kept in mind when interpreting the decay curves and reciprocal age-of-air calculations that follow
15 of 49
Research Report - 0602
An air handler bump test was performed between 1300 and 1500 hours to examine the effect of air handler operation on whole house air exchange rate including duct leakage to the outside and changes in room-to-room pressurization caused by moving air from the supply registers in each room to the central return in the main living area Figure 10 shows both the hourly average ACH and the wind speed during this period At first glance it appears that the air change rate increased by about 003 ACH when the fan was turned on but there was a coincident jump in wind speed that complicates this interpretation There was no corresponding decrease in ACH when the air handler was turned off at 1500 hours Ultimately we cannot conclusively quantify the change in ACH associated with operation of the air handler but it appears to have been no more than 003 ACH
3
Co
ncen
trati
on
(m
gm
)
70
60
50
40
30
20
10
0
Living
Entry
BR1
BR2
BR3
MBR
Air Handler On
Air Handler Off
8 9 10 11 12 13 14 15 16 17 18
Hour
Figure 9 Tracer gas decay for 1-story house with no ventilation and bedroom doors open with and without central fan operation (Test A7)
16 of 49
Research Report - 0602
40016
35014 Air Handler On Air Handler Off
ACH
Wind Speed
Air
Ch
an
ge
Ra
te (
AC
H) 30012
25010
20008
15006
10004
Win
d S
pe
ed
(m
ph
)
002 05
00
8 10 12 14 16 18
000
Hour
Figure 10 Average air change rate for 1-story house with no ventilation no central fan operation and bedroom doors open (Test A7)
The natural ventilation test was repeated on January 2 with the doors closed instead of open (Test A15) providing the decay curves shown in Figure 11 The average air change rate for this case was 0086 ACH calculated based on the two well-mixed cases at the beginning and end of the test It is difficult to compare this number with the doors-open case because it was windy (4-5 mph) for the first few hours of this test However it is very clear that the uniformity of room-toshyroom distribution of outside air was significantly less when the doors were closed even with transfer grilles We did not calculate age-of-air for this test because the test conditions were not sufficiently steady state This fact is very evident at about hour 15 where the BR2 and BR3 curves suddenly begin to diverge from the MBR curve
17 of 49
Research Report - 0602
0
10
20
30
40
50
60
70
80
90
Co
ncen
trati
on
(m
gm
3 )
Living
Entry
BR1
BR2
BR3
MBR
Mixing stopped
Mixing restarted
10 11 12 13 14 15 16 17 18 19
Hour
Figure 11 Tracer gas decay for 1-story house with no ventilation no central fan operation and bedroom doors closed (Test A15)
Distributed Supply vs Point Exhaust Ventilation
Two of the most common ventilation schemes in Building America homes are continuous single-point exhaust ventilation and intermittent central-fan integrated supply (CFIS) ventilation Exhaust ventilation is most commonly installed in a bathroom laundry room or utility room Make-up air enters through the cracks and holes in the building envelope upon depressurization of the house The distribution of outside air in a given room is fairly unpredictable because it depends on the amount of depressurization in the room the number and size of openings in exterior walls and the influence of adjacent rooms Supply ventilation provided by a central-fan integrated system tends to be distributed more uniformly throughout the house However the fan is usually operated on a duty cycle of about 33 to limit the electricity used by the central fan and one of the goals of this testing is to evaluate the effect of that duty cycle on the consistency of the air mixing
The decay curves for a 12-hour overnight test with exhaust ventilation (Test A3) are shown in Figure 12 The exhaust fan register in the laundry room was used as the exhaust point and the Duct Blaster was used to exhaust 58 cfm continuously corresponding to the minimum ventilation rate recommended by ASHRAE for a 2075 ft2 4-bedroom house It is evident from the decay curves that significantly more outside air reached the master bedroom and less reached Bedroom 2 compared to the other rooms in the house
18 of 49
Research Report - 0602
0
2
4
6
8
10
12
14
Co
nc
en
tra
tio
n
mg
m3
Living
Entry
BR1
BR2
BR3
MBR
Mixing stopped
Mixing restarted
17 18 19 20 21 22 23 0 1 2 3 4 5 6
Hour
Figure 12 Tracer gas decay for 1-story house with exhaust ventilation from the laundry room at ASHRAE 622 level no central fan operation and bedroom doors closed (Test A3)
The corresponding decay curves for the central fan integrated supply system (Test A6) are shown in Figure 13 The air handler operated at a 33 duty cycle (20 min off 10 min on) with a ventilation rate of 174 cfm resulting in an average ventilation rate of 58 cfm again meeting the minimum ASHRAE 622 recommendations The whole house appeared to be well-mixed in this case because the decay curves were clustered together throughout the test Even during the 20 minute periods when the air handler was off there was very little divergence A comparison of Figure 12 to Figure 13 indicates that much more uniform distribution of ventilation air was achieved by using the CFIS system
19 of 49
Research Report - 0602
0
2
4
6
8
10
12
14
16
Co
nc
en
trati
on
(m
gm
3 )
Living
Entry
BR1
BR2
BR3
MBR
Mixing stopped
Mixing restarted
185 195 205 215 225 235 05 15 25 35 45 55 65
Hour
Figure 13 Tracer gas decay for 1-story house with supply ventilation at ASHRAE 622 level 33 central fan operation (20 min off 10 min on) and bedroom doors closed (Test
A6)
Reciprocal age-of-air calculations were performed to provide a quantitative comparison of the two ventilation systems as shown in Figure 14 Values were in the range of 0169 hr-1 +0042shy0038 hr-1 for the exhaust ventilation system compared to 0173 hr-1 +0002-0003 hr-1 for the supply ventilation system expressed in terms of the range of differences between the reciprocal age-of-air in each room and the whole-house air change rate With the exhaust ventilation at the laundry room the master bedroom received the greatest amount of fresh air We suspect this may have been caused by the presence of the exhaust ducts used for spot ventilation of the master bathroom possibly providing greater leakage area near the master bathroom than is present in other areas of the house The supply system distributed the ventilation air more uniformly but it is not entirely clear whether this result was primarily caused by the introduction of ventilation air through the supply ducts or by the air handler mixing air throughout the house Since it is clear that the exhaust ventilation showed better uniformity of ventilation with central system mixing it follows that mixing is likely to be the primary factor in the room-to-room uniformity shown by CFIS ventilation
It is also noteworthy that the average net air change rates provided by both the supply and exhaust ventilation systems were only about 018 ACH compared to the 025 ACH that would be expected if the mechanical ventilation rate (017 ACH) and the natural infiltration rate (008 ACH) were additive as they might be with a balanced ventilation system Adding mechanical ventilation to natural infiltration in quadrature results in an estimated average air change rate of 019 ACH which is fairly consistent with the measured values
20 of 49
Research Report - 0602
Recip
rocal
Ag
e o
f A
ir (
1h
r) 025
020
015
010
005
000
Simple Exhaust vs Central Fan Integrated
Supply
Centralized supply mixing
33 duty cycle 100
ASHRAE doors closed
Living
Entry
BR1
BR2
BR3
MBR
Exhaust in utility room no
mixing 100 ASHRAE
doors closed
Figure 14 Reciprocal age-of-air for 1-story house with continuous exhaust ventilation (Test A3) compared to central fan integrated supply ventilation (Test A6)
Air Handler Operation
To determine how much room-to-room mixing was caused by the air handler the exhaust only test was re-run with the air handler operating at 33 duty cycle (20 min off 10 min on) (Test A12) The decay curves are shown in Figure 15 Compared to Test A3 (Figure 12) there was a noticeable increase in uniformity when the air handler was operating even though the entry points for the ventilation air were uncontrolled As shown in Figure 16 the range of reciprocal age of air was reduced from +0042-0038 hr-1 to +0019-0011 hr-1) It appears that operation of the air handler explains most of the difference between the supply and exhaust ventilation systems discussed earlier Although it also appears that the overall average air change rate was higher in the case where the air handler was operating (0216 ACH vs 0176) it should be noted that the average wind speed was also significantly higher It is likely that the wind speed was the primary cause of the difference in average ACH not a difference in the mechanical ventilation rate
21 of 49
Research Report - 0602
0
5
10
15
20
25
30
35
Co
nce
ntr
ati
on
(m
gm
3 )
Living
Entry
BR1
BR2
BR3
MBR
Mixing stopped
Mixing restarted
0 1 2 3 4 5 6 7 8 9 10 11 12 13 14
Hour
Figure 15 Tracer gas decay for 1-story house with continuous exhaust ventilation at ASHRAE 622 level 33 central fan operation (20 min off 10 min on) and bedroom
doors closed (Test A12)
Exhaust Ventilation No Mixing vs 33 Air Handler Duty Cycle
000
005
010
015
020
025
Recip
rocal A
ge o
f A
ir (
1h
r)
Living
Entry
BR1
BR2
BR3
MBR
Exhaust in utility room 33 air handler
no mixing 100 operation exhaust in
ASHRAE doors closed utility room 100
ASHRAE doors closed
Figure 16 Reciprocal age-of-air for 1-story house with continuous exhaust ventilation with and without air handler operation (Tests A3 and A12)
22 of 49
Research Report - 0602
Exhaust Location
The preceding analysis of exhaust ventilation was based on an exhaust point in the laundry room which was relatively centrally located in the 1-story house To examine the effect of moving the exhaust point the duct blaster was moved to the master bathroom which was located in a far corner of the house (Test A16) A continuous exhaust ventilation rate of 58 cfm was again applied to the house resulting in the tracer gas decay curve shown in Figure 17 It is difficult to visually identify a significant difference between this series of curves and those shown in Figure 12 for the laundry room exhaust location
Because the curves were steady it is again possible to compare the results based on reciprocal age-of-air as shown in Figure 18 There appeared to be very little change in the distribution of outside air to most rooms However the reciprocal age-of-air in the master bedroom dropped noticeably when the exhaust location was moved to the master bathroom probably because a greater fraction of the outside air now passed through other rooms before reaching the master bedroom With the exhaust point centrally located most of the ventilation air passing through the master bedroom probably entered from the outside In both cases however the master bedroom had the highest reciprocal age-of-air of all of the rooms in the house and the BR2 location had the lowest
Co
nc
en
tra
tio
n (
mg
m3)
40
35
30
25
20
15
10
5
0
Living
Entry
BR1
BR2
BR3
MBR
Mixing stopped
Mixing restarted
19 20 21 22 23 0 1 2 3 4 5 6 7 8
Hour
Figure 17 Tracer gas decay for 1-story house with exhaust ventilation from the master bathroom at ASHRAE 622 level no central fan operation and bedroom doors closed (Test
A16)
23 of 49
Research Report - 0602
Exhaust Ventilation
Laundry Room vs Master Bathroom
000
005
010
015
020
025
Exhaust in laundry
room no mixing 100
ASHRAE doors closed
Exhaust in master
bathroom no mixing
100 ASHRAE doors
closed
Re
cip
roc
al A
ge
of
Air
(1
hr)
Living
Entry
BR1
BR2
BR3
MBR
Figure 18 Reciprocal age-of-air for 1-story house with exhaust ventilation from the master bathroom compared to the laundry room at ASHRAE 622 level no central fan operation
and bedroom doors closed (Tests A3 and A16)
Ventilation Rate
The supply ventilation test was repeated using flow rates corresponding to 60 and 33 of the ASHRAE recommendations The intent of this series of tests was to evaluate the room-to-room ventilation uniformity for ventilation rates consistent with ASHRAE 622 compared to the uniformity for reduced mechanical ventilation rates Each test was conducted for only 4 hours because of time limitations The decay curves are shown in Figures 19 and 20 Because the rooms were well-mixed during the supply ventilation tests the average whole-house ACH can be compared directly to the reciprocal age-of-air for the exhaust ventilation tests Figure 21 shows the supply ventilation air change rate for each of the three ventilation levels (33 60 100) compared to room-by-room reciprocal age-of-air for the exhaust ventilation system based on the boundary conditions present during the tests It appears that in the supply ventilation case all rooms receive more outside air than the least-ventilated room in the exhaust case (BR2) even at 60 of ASHRAE 622 These results serve to illustrate the trade-off between whole-house ventilation rate and room-to-room ventilation uniformity in terms of their impact on the worst room(s)
24 of 49
Research Report - 0602
The ASHRAE 622 committee has not currently defined the level of mixing that is required when choosing the minimum ventilation rate Some might interpret the results of this test to suggest that a house without mixing can have individual rooms that do not receive sufficient outside air even though the ventilation system is operating at 622 specified rates Because the 622 committee has not specified the level of mixing that is required when choosing the minimum ventilation rate the ventilation rate required by different ventilation systems is open to interpretation For example if the exhaust system performance shown in Figure 21 is acceptable does this mean that a ventilation system that provides good distribution of outside air may be sufficiently well-ventilated at 60 of the ASHRAE 622 level or perhaps even less Alternatively it might be concluded that exhaust ventilation rates should be increased over current ASHRAE 622 recommendations because of the possibility that certain rooms may receive very little fresh air Unfortunately because the current 622 standard does not specify air mixing requirements and the committeersquos assumptions about ventilation air distribution are not well documented it is difficult to make any firm recommendations in this area However we can conclude that air mixing is required for dilution ventilation systems to provide predictable results independent of the geometry of individual homes
8 9 10 11 12 13 14
Hour
Figure 19 Tracer gas decay for 1-story house with supply ventilation at 60 of ASHRAE 622 level 33 central fan operation (20 min off 10 min on) and bedroom doors closed
(Test A4)
0
10
20
30
40
50
60
Co
nce
ntr
ati
on
m
gm
3
Living
Entry
BR1
BR2
BR3
MBR
Mixing stopped
Mixing restarted
25 of 49
Research Report - 0602
0
5
10
15
20
25
30
Co
nce
ntr
ati
on
(m
gm
3 )
Living
Entry
BR1
BR2
BR3
MBR
Mixing stopped
Mixing restarted
12 13 14 15 16 17 18 19 20
Hour
Figure 20 Tracer gas decay for 1-story house with supply ventilation at 33 of ASHRAE 622 level 33 central fan operation (20 min off 10 min on) and bedroom doors closed
(Test A5)
Simple Exhaust vs Central Fan Integrated
Supply with Lower Ventilation Rates
025
Re
cip
roc
al A
ge
of
Air
(1
hr)
Well Mixed
100
ASHRAE 60
ASHRAE 33
ASHRAE Living Entry 010 Natural
BR1 Infilt
BR2 BR3 005
MBR
Exhaust in laundry room no
000
Central supply Natural infil-
mixing 100 ASHRAE doors mixing 33 duty tration doors
closed cycle doors closed open
Figure 21 Reciprocal age-of-air for 1-story house with supply ventilation at 33 60 and 100 of ASHRAE 622 level (Tests A5 A4 A6) compared to exhaust ventilation with
no central fan operation (Test A3) Bedroom doors were closed
020
015
26 of 49
Research Report - 0602
Simulations by Walker (2006) have shown that all systems will not provide the same service in terms of annual average air change rate For the same air flow rate and duty cycle balanced ventilation will yield a higher average air exchange than supply ventilation and supply ventilation will yield a higher average air exchange than exhaust ventilation That can be explained in general terms by understanding that wind and stack effects act to depressurize a building most of the time Exhaust fans increase the building depressurization further but supply fans decrease the depressurization Balanced fans donrsquot change the enclosure differential pressure and air flow at all Because of the non-linear relationship between differential pressure and air flows across the building enclosure a supply fan changes the pressures across the enclosure less than an exhaust fan acting more like a balanced fan The result is that the effect on ventilation air change rate from a supply fan is somewhere between that of an exhaust fan and a true balanced system
Bedroom Doors
Except for the natural ventilation test the preceding tests were all conducted with the bedroom doors closed to simulate a worst-case situation for air circulation within the house The exhaust ventilation test was repeated with the bedroom doors open (Test A9) producing the tracer gas decay curve shown in Figure 22 It is evident that the decay curves were much more tightly bundled with the doors open than they were with the doors closed (compare Figure 12) A comparison based on reciprocal age-of-air is shown in Figure 23 A significant improvement in room-to-room mixing is evident during the open-door test
It is also evident that the average air change rate was higher when the doors were open (0202 vs 0176 ACH) but it must be remembered that the ventilation rate was controlled using a duct blaster and average wind speed was higher during the open-door test period compared to the closed-door test period (20 mph compared to 06 mph) Therefore this test alone does not necessarily indicate that closing doors reduces the average air change rate associated with an exhaust system In future tests continuous measurement of the depressurization of the house with respect to outside along with single-point pressure measurements across interior doors would provide more information about the effect of closing doors when exhaust ventilation systems are used It would also be valuable to conduct this test during steady weather conditions using the exhaust fan (with uncontrolled ventilation rate) instead of the duct blaster to observe the net effect of closed doors on whole-house air change rate
27 of 49
Research Report - 0602
0
5
10
15
20
25
30
Co
ncen
trati
on
(m
gm
3 )
Living
Entry
BR1
BR2
BR3
MBR
Mixing stopped
Mixing restarted
181 191 201 211 221 231 01 11 21 31 41 51 61 71
Hour
Figure 22 Tracer gas decay for 1-story house with exhaust ventilation from the laundry room at ASHRAE 622 level no central fan operation and bedroom doors open (Test A9)
Exhaust Ventilation
Doors Closed vs Doors Open
000
005
010
015
020
025
Re
cip
roc
al
Ag
e o
f A
ir (
1h
r)
Living
Entry
BR1
BR2
BR3
MBR
Exhaust in laundry room Doors open no mixing
no mixing 100 exhaust in laundry room
ASHRAE doors closed 100 ASHRAE
Figure 23 Reciprocal age-of-air for 1-story house with exhaust ventilation from the laundry room at ASHRAE 622 level no central fan operation In the first case the bedroom doors were closed (Test A3) in the second the doors were open (Test A9)
28 of 49
Research Report - 0602
Transfer Grilles
Because the test houses used central returns instead of hard ducted returns in the bedrooms transfer grilles were installed over the bedroom doors to provide a flow path for return air without excessive room pressurization when the doors were closed These transfer grilles also allowed ventilation air to pass more freely from the bedrooms to the main living space The effect of transfer grilles on ventilation air distribution was evaluated by taping over the grilles (see Figure 24) and re-running the exhaust ventilation test (Test A10) The corresponding tracer gas decay curve is shown in Figure 25 and the reciprocal age-of-air analysis is shown in Figure 26 Taping the transfer grilles did not appear to significantly affect the room-to-room variability in ventilation rate although there appeared to be some slight re-ranking of rooms from highest to lowest reciprocal age-of-air It should be noted that there was an increase in average wind speed from 26 mph to 41 mph starting at 1 pm including a half hour period where the average wind speed was 7 mph This weather effect produced noticeable kinks in the decay curves and therefore would be expected to introduce significant errors into the reciprocal age-of-air results
Itrsquos possible that the transfer grilles played a much smaller role in providing a path for ventilation air than the supply ducts Because the air handler was not operating the ducts were not pressurized and were thus available as passive airflow conduits The resistance to air flow was probably smaller for the air ducts than for the transfer grilles depending on their size and the number of supply registers in each bedroom The existing door undercuts are also thought to have played a role The effect of ducts and door undercuts can be tested in the future by running separate tests with ducts and door undercuts taped over
copy buildingsciencecom
Figure 24 Transfer grilles over bedroom doors taped closed
29 of 49
Research Report - 0602
0
10
20
30
40
50
60
70
Co
nc
en
tra
tio
n (
mg
m3 )
Living
Entry
BR1
BR2
BR3
MBR
Mixing stopped
Mixing restarted
8 9 10 11 12 13 14 15 16 17
Hour
Figure 25 Tracer gas decay for 1-story house with exhaust ventilation from the laundry room at ASHRAE 622 level no central fan operation bedroom doors closed and transfer
grilles taped (Test A10)
Exhaust Ventilation
000
005
010
015
020
025
Re
cip
roc
al
Ag
e o
f A
ir (
1h
r)
Living
Entry
BR1
BR2
BR3
MBR
Transfer Grilles Untaped vs Taped
Exhaust in laundry room no Exhaust in laundry room no
mixing 100 ASHRAE mixing 100 ASHRAE
doors closed doors closed transfer
grilles taped
Figure 26 Reciprocal age-of-air for 1-story house with exhaust ventilation from the laundry room at ASHRAE 622 level no central fan operation and doors closed In the
30 of 49
Research Report - 0602
first case the transfer grilles are untaped (Test A3) in the second they are taped closed (Test A10)
Minimum Test Duration
We were fortunate that DR Horton provided two full weeks of access to these homes to conduct this series of tests which allowed us to run some of the more important tracer gas decay tests as long as 12 hours to help ensure that we could accurately calculate reciprocal age-of-air In most cases test houses would not be available for such a long time period To evaluate the length of time needed to estimate the reciprocal age-of-air with reasonable accuracy we examined the results that we would have obtained for one of the exhaust ventilation tests had we halted the test period after less than 12 hours For the supply ventilation tests the rooms were sufficiently well-mixed that the test could have been stopped after 3 or 4 hours assuming weather effects were steady
The reciprocal age-of-air calculations for the exhaust ventilation decay curves (Test A3 see Figure 12) based on test durations of 3 6 9 and 12 hours are shown in Figure 27 These test durations range from 053 to 21 air changes based on the average air change rate of 018 ACH (56 hours per air change) calculated for this test The ratio of highest to lowest reciprocal ageshyof-air is shown above the data points for each case These results suggest that shorter tests tend to overestimate the range and that perhaps 1frac12-2 air changes (roughly 9 to 12 hours in this case) may be necessary to obtain accurate calculations of reciprocal age-of-air when there is significant divergence among rooms From a qualitative standpoint one air change may be sufficient to determine the basic trend Without knowing in advance what mixing pattern will occur it is difficult to recommend a minimum test duration But assuming this test is fairly representative of a worst-case scenario a minimum of 15 air changes would be necessary to have a high degree of confidence in the quantitative difference in reciprocal age-of-air among rooms
31 of 49
Research Report - 0602
000
005
010
015
020
025
030
035
Re
cip
roc
al
Ag
e-O
f-A
ir (
hr-1
)
Living
Entry
BR1
BR2
BR3
MBR HighLow = 297
HighLow = 168 HighLow = 184 HighLow = 161
3-hour Test 6-hour Test 9-hour Test 12-hour Test
(053 Air Changes) (11 Air Changes) (16 Air Changes) (21 Air Changes)
Test Duration
Figure 27 Reciprocal age-of-air based on alternate test durations for 1-story house with exhaust ventilation from the laundry room at ASHRAE 622 level no central fan operation
and doors closed (Test A3) Average air change rate was 018 ACH
TEST RESULTS FROM 2-STORY HOUSE (1117 MONTAGUE)
The 2-story house was tested from January 3-10 2006 Three zones were selected on the first floor and three more were selected on the second floor as indicated by the red stars in Figure 4 The initial mixing of air among the rooms at the start of each test in this 2-story house was not as thorough as it was in the 1-story house Evidently the combined effects of the air handler and the portable de-stratification fan were not sufficient to overcome upward transport of tracer gas driven by the stack effect from the first to the second floor The resulting difference in initial tracer gas concentration among the rooms was about 5-10 This outcome emphasizes the significant effect of stack-driven infiltration on ventilation non-uniformity in multi-story homes Because our test method and equipment did not achieve a well-mixed condition at the start of each test there were some errors introduced into the reciprocal age-of-air analysis For future tests we would recommend larger de-stratification fans to obtain more well-mixed conditions in multi-story houses
Typical errors introduced by incomplete mixing of the tracer gas at the start of such a test were analyzed by examining two hypothetical cases where either all of the air entering a room comes from the outside or all of the air comes from an adjacent room with a different starting concentration If all of the air entering a space comes from the outside then a change in the initial concentration would have no effect on the reciprocal age-of-air because the decay curve would be exponential from the start and the area under the curve would be normalized based on
32 of 49
Research Report - 0602
the starting concentration in that zone However if the air entering a room passes through another room with a lower initial concentration the room receiving the air will have a lower concentration of tracer gas throughout the test compared to what the concentration would have been if the starting points were the same in both rooms This case is illustrated in Figure 28 where assumptions are made that the rooms are the same size the air exchange rate is 01 ACH for both rooms and the initial tracer gas concentration is 10 lower in the first room (upstream) than it is in the second room
The effect on reciprocal age-of-air is shown in Figure 29 A 10 difference in starting concentration results in an error of about 75 in reciprocal age-of-air for a room downstream of a room with a lower starting concentration assuming 01 ACH for both rooms The error would be somewhat smaller (about 5) if the air change rate was higher for both rooms (02 ACH) There would be no error introduced for rooms where all of the air infiltration comes from the outside Although the amount of error in the reciprocal age-of-air calculations can be affected by additional variables not examined here we feel that these percentages are reasonable estimates of the errors in our results for the 2-story house due to incomplete initial mixing of air
In each case an engineering judgment must be made regarding the significance of the error introduced by incomplete initial mixing As a general rule the differences in concentration at the start of the test should be small compared to the differences that are being measured in order for the results to be considered valid
Figure 28 Theoretical decay curves for a well-mixed case with uniform tracer gas concentration compared to a case where the upstream room starts with a concentration
10 lower than the downstream room
33 of 49
Research Report - 0602
Figure 29 Theoretical reciprocal age-of-air for a well-mixed case with uniform tracer gas concentration compared to a case where the upstream room starts with a concentration
10 lower than the downstream room
Natural Infiltration and Duct Leakage
A natural infiltration test was performed over a two hour period on the evening of January 8 (Test B14) The tracer gas decay curves are shown in Figure 30 There was a slight divergence between the first floor and second floor once the air handler was turned off but the rooms on each floor appeared to remain fairly well-mixed The average air change rate during the test period was about 011 ACH which was somewhat higher than the 1-story house as might be expected with an increased stack height
An air handler bedroom door bump test was conducted just prior to the test period shown in Figure 30 allowing observation of the combined effect of duct leakage to the outside and increased infiltration caused by room pressurization The average air change rate during that bump test was 013 ACH suggesting that closing doors and operating the fan added approximately 002 ACH to the whole-house average air change rate The average wind speed was a bit higher while the air handler was running (17 mph compared to 05 mph) so the effect of air handler operation may actually be somewhat less than the average ACH numbers indicate
34 of 49
Research Report - 0602
0
1
2
3
4
SF
6 C
on
ce
ntr
ati
on
(m
gm
3)
BR1
Living
Kitchen
BR2
BR3
MBR
Mixing stopped
Mixing restarted
1814 1843 1912 1940 2009 2038 2107 2136
Hour
Figure 30 Tracer gas decay for 2-story house with no ventilation no central fan operation and bedroom doors open (Test B14)
Distributed Supply vs Point Exhaust Ventilation
A 14-hour test (Test B1) was performed with an exhaust ventilation rate of 63 cfm in the laundry room which was located near the stairwell in the middle of the first floor The ventilation rate was again consistent with the ASHRAE 622 recommendations The tracer gas decay curves are shown in Figure 31 It is interesting that all three second floor rooms showed a delay before entering an exponential decay suggesting that some amount of air was moving from the first floor to the second floor even though the mechanical exhaust point was on the first floor It appears that the further depressurization of the first floor was insufficient to overcome the stack effect and draw a significant amount of outside air in through the rooms on the second floor
35 of 49
Research Report - 0602
182
9
192
9
202
9
212
9
222
9
232
9
029
129
229
329
429
529
629
729
828
929
102
8
112
8
122
8
0
10
20
30
40
50
60
70
SF
6 C
on
ce
ntr
ati
on
(m
gm
3)
BR1
Living
Kitchen
BR2
BR3
MBR
Mixing stopped
Mixing restarted
Hour
Figure 31 Tracer gas decay for 2-story house with exhaust ventilation from the laundry room at ASHRAE 622 level no central fan operation and bedroom doors closed (Test B1)
A supply ventilation test was performed on the 2-story house for about 11 hours starting late on January 4 (Test B3) The duct blaster was unable to provide the ventilation rate necessary to meet the minimum specified in ASHRAE 622 supplying 180 cfm instead of 189 cfm (95) The decay curves are shown in Figure 32 Although the curves are much more tightly packed than they were with the exhaust system there is more divergence than we saw with the supply system in the 1-story house most notably in the master bedroom
The reciprocal age-of-air calculations for both the exhaust and supply ventilation systems are shown in Figure 33 Again the results indicate that much better room-to-room distribution of ventilation air was achieved by the central-fan integrated supply system compared to the single-point exhaust system However for the supply ventilation test the differences in the initial tracer gas concentration were of the same magnitude as the differences in decay rates among the rooms As a result no conclusions should be drawn about the relative ranking of the supply ventilation rate among rooms based on Figure 33
36 of 49
Research Report - 0602
0
10
20
30
40
50
60
SF
6 C
on
ce
ntr
ati
on
(m
gm
3)
BR1
Living
Kitchen
BR2
BR3
MBR
Mixing stopped
Mixing restarted
2136 000 224 448 712 936 1200
Hour
Figure 32 Tracer gas decay for 2-story house with supply ventilation just under ASHRAE 622 level central fan operation at 33 duty cycle (20 min off 10 min on) and bedroom
doors closed (Test B3)
Simple Exhaust vs Central Fan Integrated
Supply )
000
005
010
015
020
025
Recip
rocal A
ge o
f A
ir (
1h
r
BR1
Living
Kitchen
BR2
BR3
MBR
Exhaust in laundry room no Centralized supply mixing
mixing 100 ASHRAE 33 duty cycle 95
doors closed ASHRAE doors closed
Figure 33 Reciprocal age-of-air for 2-story house with continuous exhaust ventilation (Test B1) compared to central fan integrated supply ventilation (Test B3) (Note
Uncertainties introduced by non-uniform starting concentration are of the same order of magnitude as the differences in reciprocal age-of-air among rooms for the supply ventilation case The relative ranking of rooms is not meaningful for that case)
37 of 49
Research Report - 0602
Air Handler Operation
The effect of occasional air handler operation on the distribution of exhaust ventilation air was evaluated on the afternoon of January 6 (Test B6) The tracer gas decay curves are shown in Figure 34 and reciprocal age-of-air calculations are shown in Figure 35 It should again be noted that before the test started the house was mixed using both the air handler and a de-stratification fan with the doors open During the test the doors were closed the de-stratification fan was turned off and the air handler operated at a 33 duty cycle (20 minutes off 10 minutes on) As was the case in the 1-story house this occasional operation of the air handler substantially improved the distribution of ventilation air among rooms even in conjunction with the point exhaust ventilation system There was very little divergence noticeable even with the air handler cycling on and off every half hour However because the initial differences in tracer gas concentration among rooms were as large as the differences in reciprocal age-of-air for the case with air handler operation no conclusions should be drawn about the relative ranking of ventilation rates among the rooms for that case
SF
6 C
on
cen
trati
on
(m
gm
3)
80
70
60
50
40
30
20
10
0
BR1
Living
Kitchen
BR2
BR3
MBR
Mixing stopped
Mixing restarted
1048 1200 1312 1424 1536 1648 1800 1912 2024
Hour
Figure 34 Tracer gas decay for 2-story house with continuous exhaust ventilation at ASHRAE 622 level central fan operation at 33 duty cycle (20 min off 10 min on) and
bedroom doors closed (Test B6)
38 of 49
Research Report - 0602
020
015 R
ec
ipro
ca
l A
ge
of
Air
(1
hr)
Exhaust Ventilation
No Mixing vs 33 Air Handler Duty Cycle
Exhaust in laundry room
no mixing 100
ASHRAE doors closed
33 air handler
operation exhaust in
laundry room 100
ASHRAE doors closed
BR1
Living
Kitchen
BR2
BR3
MBR
010
005
000
Figure 35 Reciprocal age-of-air for 2-story house with continuous exhaust ventilation with and without air handler operation (Tests B1 and B6) (Note Uncertainties introduced by non-uniform starting concentration are of the same order of magnitude as the differences in reciprocal age-of-air among rooms for the case with air handler operation The relative
ranking of rooms is not meaningful for that case)
Exhaust Location
The duct blaster was moved to the master bathroom exhaust register to see if there was a resulting change in ventilation air distribution (Test B18) The master bathroom was in the back of the house on the second floor between the master bedroom and bedroom 3 The decay curves are shown in Figure 36 and the reciprocal age-of-air results are shown in Figure 37 The rooms on each floor were well mixed before the test began although the mixing between the two floors was not as good Very wide divergence among rooms can be seen during the test especially between the upstairs bedrooms and the rest of the house Once again all three upstairs rooms appear to receive some air from the first floor but the master bedroom experiences a much higher volume of circulated air than the other two second-floor bedrooms which appear to be relatively stagnant
39 of 49
Research Report - 0602
0
10
20
30
40
50
60
70
80
90
SF
6 C
on
ce
ntr
ati
on
(m
gm
3)
BR1
Living
Kitchen
BR2
BR3
MBR
Mixing stopped
Mixing restarted
1912 2136 000 224 448 712 936 1200
Hour
Figure 36 Tracer gas decay for 2-story house with exhaust ventilation from the master bathroom at ASHRAE 622 level no central fan operation and bedroom doors closed (Test
B18)
Exhaust Ventilation
Laundry Room vs Master Bathroom
000
005
010
015
020
025
030
Exhaust in laundry room no
mixing 100 ASHRAE
doors closed
Exhaust in master bathroom
no mixing 100 ASHRAE
doors closed
Re
cip
roc
al A
ge
of
Air
(1
hr)
BR1
Living
Kitchen
BR2
BR3
MBR
Figure 37 Reciprocal age-of-air for 2-story house with exhaust ventilation from the master bathroom compared to the laundry room at ASHRAE 622 level no central fan operation
and bedroom doors closed (Tests B1 and B18)
40 of 49
Research Report - 0602
Ventilation Rate
The supply ventilation tests were repeated using flow rates of 60 and 33 of ASHRAE 622 recommendations corresponding to 114 cfm and 63 cfm respectively (Tests B2 and B4) The decay curves are shown in Figures 38 and 39 Reciprocal age-of-air for all three supply ventilation rates are shown in Figure 40 In all cases the rooms remained fairly well mixed especially rooms on the same floor As we observed in the 1-story house the ventilation rate in the 2-story house appeared to have very little effect on the uniformity of outside air provided to each room as long as it was mixed using the air handler One again the initial differences in tracer gas concentration among rooms were as large as the divergence in the decay curves preventing any conclusions about the relative ranking of ventilation rates among rooms for all three cases The error in initial concentration uniformity was bigger for the cases with air handler mixing because the relative divergence in the decay curves was so small compared to that of no air handler mixing In other words the error in relative ranking of ventilation rates for the cases with air handler mixing were not very important anyway because the relative differences between rooms were so small
1536 1648 1800 1912 2024 2136 2248
Hour
Figure 38 Tracer gas decay for 2-story house with supply ventilation at 60 of ASHRAE 622 level 33 central fan operation (20 min off 10 min on) and bedroom doors closed
(Test B2)
0
5
10
15
20
25
30
SF
6 C
on
cen
trati
on
(m
gm
3)
BR1 Living Kitchen BR2 BR3 MBR
Mixing stopped
Mixing restarted
41 of 49
Research Report - 0602
0
5
10
15
20
25
30
35
40
SF
6 C
on
cen
trati
on
(m
gm
3)
BR1
Living
Kitchen
BR2
BR3
MBR
Mixing stopped
Mixing restarted
1200 1312 1424 1536 1648 1800 1912
Hour
Figure 39 Tracer gas decay for 2-story house with supply ventilation at 33 of ASHRAE 622 level 33 central fan operation (20 min off 10 min on) and bedroom doors closed
(Test B4)
Supply Ventilation Rate Comparison
000
005
010
015
020
025
Re
cip
roc
al
Ag
e o
f A
ir (
1h
r)
BR1
Living
Kitchen
BR2
BR3
MBR
Centralized supply Centralized supply Centralized supply
mixing 33 duty mixing 33 duty mixing 33 duty
cycle 95 ASHRAE cycle 60 ASHRAE cycle 33 ASHRAE
doors closed doors closed doors closed
Figure 40 Reciprocal age-of-air for 2-story house with three levels of supply ventilation central fan operation at 33 duty cycle (20 min off 10 min on) and bedroom doors closed (Tests B3 B2 B4) (Note Uncertainties introduced by non-uniform starting
concentration are of the same order of magnitude as the differences in reciprocal age-of-air among rooms for all three cases The relative ranking of rooms is not meaningful for these
cases)
42 of 49
Research Report - 0602
The average air change rates for the three supply ventilation rates compared to the two exhaust ventilation schemes are shown in Figure 41 The CFIS system at 33 of the 622 ventilation flow rate provided a uniformly higher air change rate (013 ach) than the least ventilated rooms using exhaust ventilation from either the laundry or the master bathroom (010 ach Figure 37) It is noteworthy that the combined net air change rate with exhaust ventilation from the laundry room was significantly less than the air change rates for both exhaust ventilation from the master bathroom and supply ventilation at the air handler This illustrates the unpredictability of interactions between mechanical ventilation and natural infiltration which depend strongly on the distribution and size of cracks through which the outside air must pass to enter the house There may have been a relatively large building enclosure leakage opening near the laundry room (perhaps the utility penetrations or the door to the garage) that allowed a significant amount of outside air to quickly enter and leave the house through the exhaust flow without circulating around the house
0
005
01
015
02
025
Ave
rag
e A
CH
Natural Exhaust Exhaust Supply 95 Supply 60 Supply 33
Laundry Mbath
Rm 100 100
Figure 41 Average air change rates for 2-story house with supply ventilation at 33 60 and 95 of ASHRAE 622 recommendations (Tests B4 B2 B3) compared to natural
infiltration (Test B14) and exhaust ventilation with no central fan operation (Test B1) Bedroom doors were closed except for the natural infiltration test
Bedroom Doors
The laundry room exhaust ventilation test with no air handler operation (see Figure 31) was repeated with the doors open to evaluate the change in room-to-room ventilation air distribution (Test B10) The decay curves are shown in Figure 42 and the reciprocal age-of air calculations are shown in Figure 43 It is evident from Figure 42 that the test began before the rooms were
43 of 49
Research Report - 0602
0
5
10
15
20
25
SF
6 C
on
ce
ntr
ati
on
(m
gm
3)
BR1 Living Kitchen BR2 BR3 MBR
Mixing stopped
Mixing restarted
completely well mixed resulting in decay curves that could be somewhat misleading Because the master bedroom was at a higher concentration than the other rooms at the start of the test any room that received air from the master bedroom would appear to have a slower decay rate than it would have if the rooms started out at the same concentration Despite the difference in starting concentration it is clear that outside air was well distributed when the doors were open even without operation of the air handler
1843 1912 1940 2009 2038 2107 2136 2204 2233 2302
Hour
Figure 42 Tracer gas decay for the 2-story house with exhaust ventilation from the laundry room at ASHRAE 622 level no central fan operation and bedroom doors open
(Test B10)
Reciprocal age-of-air analysis was not performed for this case because of the combined effect of a short test duration (~2 hours) and unequal starting tracer gas concentrations even though the house was relatively well-mixed The important conclusion (that opening doors greatly improves mixing) can be drawn by inspecting the decay curves alone
Transfer Grilles
A final exhaust ventilation test was run on the 2-story house with the doors closed and the transfer grilles taped over The decay curves are shown in Figure 43 and the reciprocal age-ofshyair calculations are shown in Figure 44 The curves were clearly very divergent even after 12 hours By examining the reciprocal age-of-air results it is apparent that the transfer grilles in the 2-story house caused a noticeable improvement in ventilation air distribution but the improvement was smaller than when the doors were opened (Figure 42)
44 of 49
Research Report - 0602
0
5
10
15
20
25
30
SF
6 C
on
cen
tra
tio
n (
mg
m3
) BR1 Living Kitchen BR2 BR3 MBR
Mixing stopped
Mixing restarted
1648 1912 2136 000 224 448 712 936
Hour
Figure 43 Tracer gas decay for 2-story house with exhaust ventilation from the laundry room at ASHRAE 622 level no central fan operation bedroom doors closed transfer
grilles taped closed (Test B7)
Exhaust Ventilation Transfer Grilles Untaped vs Taped
000
005
010
015
020
Re
cip
roc
al
Ag
e o
f A
ir (
1h
r)
BR1
Living
Kitchen
BR2
BR3
MBR
Exhaust in laundry room no Exhaust in laundry room no
mixing 100 ASHRAE mixing 100 ASHRAE
doors closed doors closed transfer
grilles taped
Figure 44 Reciprocal age-of-air for 2-story house with exhaust ventilation from the laundry room at ASHRAE 622 level no central fan operation and doors closed In the first case the transfer grilles are untaped (Test B3) in the second they are taped closed
(Test B7)
45 of 49
Research Report - 0602
CONCLUSIONS
bull Reciprocal age-of-air analysis was chosen as a quantitative method for characterizing distribution of ventilation air among rooms This method worked well in cases where rooms were well mixed to begin the test and weather conditions were sufficiently steady-state
bull A test period of at least 1frac12 air changes was necessary to obtain reasonably accurate ageshyof-air results when there was significant divergence in tracer gas concentration among the rooms
bull Although we did not achieve uniform initial concentration of tracer gas in the 2-story house using our test methodology and the equipment at hand we believe the reciprocal age-of-air calculations were meaningful in many of the cases as indicated in the discussion
bull Both houses were relatively tight with natural infiltration averaging 008 ACH for the 1shystory house and 011 ACH for the 2-story house
bull Both houses had relatively small (but not negligible) duct losses to the outside producing an increase in infiltration of less than 003 ACH for the 1-story house and 002 ACH for the 2-story house when the air handler runs
bull Age-of-air analysis indicated that ventilation supplied through the central air distribution system provided much more uniform distribution of ventilation air than the single-point exhaust system when the doors were closed and the air handler was not running For the 1-story house the central-fan-integrated supply ventilation case at 60 of ASHRAE 622 provided more outside air to all rooms than the least-ventilated room in the exhaust case at 100 of 622 For the 2-story house the central-fan-integrated supply system at 33 of the 622 flow rate provided more outside air to all rooms than the least ventilated rooms using exhaust ventilation at 100 of 622 from either the laundry or the master bathroom
bull Operation of the central fan at a 33 duty cycle maintained relatively well-mixed conditions regardless of ventilation rate type of ventilation system (supply or exhaust) or house configuration (1-story or 2-story)
bull Exhaust location affected both the relative amount of outside air received by different rooms and the overall uniformity among rooms but the effect was not predictable
bull For exhaust-only ventilation without central fan operation opening bedroom doors appeared to significantly improve the mixing of ventilation air among rooms
bull Transfer grilles improved the distribution of ventilation air slightly but much less than opening the bedroom doors
bull In the 2-story house the stack effect caused air movement from the first floor to the second floor even when exhaust ventilation was applied to the first floor resulting in consistently higher tracer gas concentrations on the second floor and more non-uniform ventilation air distribution in general
bull Interactions between natural infiltration and both exhaust and supply mechanical ventilation were very significant When the ventilation system was activated the combined air change rate did not increase commensurate with the measured ventilation rate but instead increased by only half that amount This result was consistent with combining ventilation and infiltration in quadrature to estimate whole-house air change rate in accordance with ASHRAE Standard 136 (ASHRAE 1993)
46 of 49
Research Report - 0602
FUTURE WORK
In future tests continuous monitoring of pressure differentials would enhance our understanding of the multi-zone combined infiltration and ventilation systems and our ability to model them That would help to explain differences between tests in more detail including the effects of multiple stories location of ventilation supply outlets and exhaust inlets interior door closure and use of passive return air transfer grilles Pressure differential measurement points should include
bull dP with respect to outside for each closed room and open space bull dP across closed interior doors bull dP between the floor cavity and outdoors and bull dP between the house and the attic
Measurement of wind direction along with wind speed could also be helpful for modeling these buildings and systems However because of micro-climate wind shielding it may be very difficult to relate a single-point wind direction measurement to actual wind vectors on the building surfaces
ACKNOWLEDGMENTS
The authors express their appreciation to Rich Coyle of DR Horton for providing the test houses and to Joseph Lstiburek of BSC Subrato Chandra and Neil Moyer of FSEC and Greg Barker of Mountain Energy Partnership for their assistance in the planning and execution of this ventilation study
47 of 49
Research Report - 0602
REFERENCES
ASHRAE (1993) ANSIASHRAE Standard 136-1993 A Method of Determining Air Change Rates in Detached Dwellings Atlanta GA American Society of Heating Refrigerating and Air-Conditioning Engineers Inc
ASHRAE (1997) ANSIASHRAE Standard 129-1997 Measuring Air-Change Effectiveness Atlanta GA American Society of Heating Refrigerating and Air-Conditioning Engineers Inc
ASHRAE (2004) ASHRAE Standard 622-2004 Ventilation and Acceptable Indoor Air Quality in Low-Rise Residential Buildings Atlanta GA American Society of Heating Refrigerating and Air-Conditioning Engineers Inc
CSA (2003) CANCSA F326-M91 Residential Mechanical Ventilation Systems Canadian Standards Association Ontario Canada httpwwwcsashyintlorgonlinestoreGetCatalogItemDetailsaspmat=2410793ampParent=102
NBC 2005 National Building Code of Canada httpircnrcshycnrcgccapubscodesnrcc47666_ehtml
Grieve PW (1991) Measuring Ventilation Using Tracer-Gases Denmark Bruumlel amp Kjaeligr
MN Chapter 7672 Minnesota Energy Code Chapter 7672 Detached Single-Family And Two-Family Dwellings httpwwwstatemnusmnexternalDocsCommerceChapter_7672_Residential_111302012428 _72rulepdf
Persily AK Martin SR (2000) A Modeling Study of Ventilation in Manufactured Houses Gaithersburg MD National Institute of Standards and Technology NISTIR 6455
Rudd A Lstiburek J (2000) ldquoMeasurement of Ventilation and Interzonal Distribution in Single-Family Homesrdquo ASHRAE Transactions 2000 MN-00-10-3 V 106 Pt2 American Society of Heating Refrigeration and Air-Conditioning Engineers Atlanta GA
WAC (2004) Washington State Title 51 WAC Community trade and economic development department of (building code council) Chapter 51-13 Ventilation and indoor air quality httpappslegwagovWACdefaultaspxcite=51-13
48 of 49
Research Report - 0602
Field test of room-to-room uniformity of ventilation air distribution in two new houses
About this Report
This report was prepared for the US Department of Energyrsquos Building America
Program The report is freely available to the public at wwwbuildingamericagov
The authors express their appreciation to Rich Coyle of DR Horton for providing the test houses and to Joseph Lstiburek of BSC Subrato Chandra and Neil Moyer of
FSEC and Greg Barker of Mountain Energy Partnership for their assistance in the planning and execution of this ventilation study
About the Authors
Robert Hendron Ren Anderson Dennis Barley are with National Renewable Energy Laboratory Armin Rudd and Aaron Townsend are with Building Science Corporation
Ed Hancock is with Mountain Energy Partnership
Direct all correspondence to Building Science Corporation 30 Forest Street Somerville MA 02143
Limits of Liability and Disclaimer of Warranty
Building Science documents are intended for professionals The author and the publisher of this article have used their best efforts to provide accurate and authoritative information in regard to the subject matter covered The author and publisher make no warranty of any kind expressed or implied with regard to the information contained in this article
The information presented in this article must be used with care by professionals who understand the implications of what they are doing If professional advice or other expert assistance is required the services of a competent professional shall be sought The author and publisher shall not be liable in the event of incidental or consequential damages in connection with or arising from the use of the information contained within this Building Science document
49 of 49

Research Report - 0602
MBR
BR1
BR3
BR2
Kitchen
Living
copy buildingsciencecom
Figure 4 2-story test house floor plan (mirror image of 1117 Montague)
TEST PLAN
Research Questions
The following series of research questions were identified by the researchers to quantify the ventilation distribution characteristics of the test houses under various operating conditions
1 What is the natural air change rate (ACH) for each house with bedroom doors open no air handler operation and no mechanical ventilation What is the room-to-room uniformity in outside air distribution
2 What is the change in whole-house ACH caused by air handler operation What is the change in room-to-room uniformity of outside air distribution
3 What is the change in whole-house ACH caused by closing the bedroom doors What is the change in room-to-room uniformity of outside air distribution
4 What is the change in whole-house ACH caused by taping over the transfer grilles What is the change in room-to-room uniformity of outside air distribution
5 What is the difference in whole-house ACH for a central-fan integrated supply ventilation system (CFIS) operating at 33 duty cycle compared to a continuous exhaust ventilation
8 of 49
Research Report - 0602
system with both systems meeting the ASHRAE 622 recommended minimum ventilation rate on average How does the resulting room-to-room uniformity of outside air distribution compare
6 How does the whole-house ACH and uniformity of outside air distribution change for a CFIS ventilation system when the ventilation rate is lowered from 100 of the ASHRAE 622 recommendation to 60 and to 33
7 How does the whole-house ACH and uniformity of outside air distribution change for the continuous exhaust ventilation system when the location of the exhaust port is changed from the utility room to the master bathroom
8 How uniform is the outside air distribution for the two-story house compared to the one-story house
Test Set-Up
Single-tracer gas decay with multi-zone sampling was used to evaluate the performance of each ventilation system based on how uniformly outside air was distributed to each room or zone within the house The decay curves demonstrate the rate at which the tracer gas (representing a pollutant) which is initially distributed uniformly throughout the house is diluted within each zone as a result of outside air that enters the zone directly as well as air that is exchanged among zones Air entering one zone from another may contain either a higher or lower concentration of the tracer than the air already in the zone This test method is designed as a practical method to evaluate the uniformity of ventilation air distribution within a home assuming that dangerous pollutants such as radon are controlled using appropriate source mitigation strategies Uniform distribution of outside air is required for dilution ventilation systems to provide predictable results independent of the geometry of individual homes
A multi-zone tracer gas sampling system was installed in each house for the test This equipment consisted of a Bruel and Kjaer model 1302 multi-gas monitor and a model 1303 multi-point sampler as shown in Figure 5 Sample tubes were placed in six locations in each house and attached to the multi-point sampler The six sampled locations are designated with red stars on the floor plans in Figures 3 and 4 The sampler was programmed to draw a sample from each sequential location at an interval of about 2 minutes thus all six locations were sampled at an interval of about 12 minutes
The air sample in each zone was taken near the center of the room at a height of four feet above the floor The zone air temperature was measured at the same location The local zone air temperature measurement was used to control the electric heater in each zone (see Test Procedure section below) to achieve a uniform and constant air temperature throughout the house Mixing fans were used to maintain uniform temperatures and concentrations within each room A photo of this set up is shown in Figure 6
9 of 49
Research Report - 0602
copy buildingsciencecom
Figure 5 Multi-zone tracer gas sampling and monitoring equipment
Mixing Fan
Heater
Temperature Sampling Location
Figure 6 Tracer gas sampling point temperature sensor room air mixing and co-heating set-up
The air flow rates for both supply and exhaust ventilation were carefully controlled during the test using a Duct Blaster fan and measurement system For exhaust ventilation the Duct Blaster fan was placed near the location of the ceiling exhaust fan and a length of flexible duct was used to connect the normal entrance for the exhaust fan to the Duct Blaster All of the air flowing through the exhaust fan during the test was first routed through the Duct Blaster The Duct Blaster speed control was adjusted to achieve the desired flow rate and the Duct Blaster flow ring and pressure tap were used to measure the air flow rate The exhaust fan itself was operated in
10 of 49
Research Report - 0602
conjunction with the duct blaster to reduce the resistance to air flow Figure 7 shows the Duct Blaster installed at the laundry room exhaust register
copy buildingsciencecom
Figure 7 Duct Blaster installed at the laundry room exhaust register
A similar application of the Duct Blaster was used to control and measure the supply air flow rate during the tests of the CFIS system The normal configuration of flexible duct connecting the air handler return to the outside was changed so that all outside air would flow through the Duct Blaster The flexible duct was disconnected from the air handler return and attached to the inlet to the Duct Blaster The Duct Blaster outlet duct was attached to the air handler return The Duct Blaster speed control was used to achieve the desired air flow rate and the Duct Blaster flow ring and pressure tap were used to measure the flow rate This installation is shown in Figure 8
Natural infiltration rates varied during the tests depending on weather conditions which were monitored using a portable weather station
It should be noted that the supply ventilation ducts in the test houses were not sized for the flow rates desired in the tests The ventilation flow rate measured during normal operation of the air handler in the 1-story house was about 10 cfm compared to 174 cfm required to meet the ASHRAE 622 recommendations This flow rate was also significantly less than the design flow rate of about 40-60 cfm It was necessary to operate the Duct Blaster fan at maximum power to achieve the required air flow rate during some tests It was unclear if the outside air duct was too long too small or too tortuous or if insufficient negative pressure was present at the return of the air handler because the central return grille was just a few inches away (see Figure 8)
11 of 49
Research Report - 0602
copy buildingsciencecom
Figure 8 Duct Blaster installed between the outside air duct and the return of the air handler to provide supply ventilation
Test Procedure
The tracer gas used was sulfur hexafluoride (SF6) a stable non-toxic gas that was injected into each house volume from a small compressed gas cylinder carried by hand around the house During the dosing period the furnace fan was used to achieve an initially well-mixed condition with a concentration of about 15 parts per million (PPM) During this period the doors were kept open and a portable de-stratification fan was used in the 2-story house to improve mixing between floors Then the mixing fans were stopped and the divergence in concentration from zone to zone was observed (with doors either open or closed depending on the test objective) Small portable fans in each zone continued running to maintain a well-mixed condition within each zone The interior air temperature in each zone was controlled during the test period using portable electric heaters instead of the furnace so that operation of the air handler could be controlled independently from the demand for heating At the conclusion of the test the whole house was again mixed by opening the doors and turning on the air handler This allowed the calculation of an average whole-house air change rate for each set of test conditions
The tests were planned for rather mild weather to minimize infiltration effects so as to isolate and test the performance of the mechanical ventilation systems The general design goal was to provide the minimum amount of mechanical ventilation recommended by ASHRAE Standard 622-2004 (ASHRAE 2004) (58 cfm for the 1-story house 63 cfm for the 2-story house) and observe the effects of providing central fan integrated supply versus single-point exhaust ventilation operating the central fan closing the bedroom doors and taping the transfer grilles above the doors
12 of 49
Research Report - 0602
The results of the multi-zone tracer gas decay tests are presented graphically as families of decay curves These graphs illustrate the uniformity or non-uniformity of the ventilation effect among the various rooms and allow ranking of the rooms from the least to the most ventilation effect
In addition if the ventilation rates were sufficiently steady for the duration of the test period we used local mean age-of-air analysis to evaluate the results more quantitatively Age-of-air analysis is a well-established approach to testing ventilation rates at various points or in various zones within a building (Grieve 1991) Age-of-air is defined as the average length of time that air molecules have resided within the building The formula for calculating local mean age-ofshyair in a tracer gas decay test is given in ASHRAE Standard 129-1997 (ASHRAE 1997) as follows
Ai = 1 intinfin
Ci (t)dt (1)C0 0
where
i = Index for measurement point representing a well-mixed zone Ai = Local mean age-of-air at point i (hr) C = Concentration of tracer gas (lbmft3) C0 = Initial value of C in well-mixed building (lbmft3) Ci = Time-varying concentration of tracer gas at point i (lbmft3) t = Time (hr)
In order to compare the ventilation rates among the rooms or zones in the home we use the metric Reciprocal Age-of-Air
Reciprocal Age-of-Air = 1Ai (2)
Reciprocal Age-of-Air has units of 1hr and is equivalent to the air change rate (ACH) in a single well-mixed zone (Persily 2000)
The definition of Ai in Equation (1) involves an integral of infinite duration This is handled in the test procedure through a two-step process
Step 1 The tracer gas decay test is continued until (a) the initial transient effects of interzonal airflow have subsided and all of the decay curves resemble simple exponential functions and (b) the tracer concentrations are rather small compared to their initial values so that any extrapolation errors will have a small effect on the result In this field test most of the multi-zone tests were continued for 12 hours These portions of the decay curves were integrated numerically using the trapezoid rule
13 of 49
Research Report - 0602
Step 2 The remaining portions (the tails) of the decay curves were extrapolated to infinity using a simple exponential decay function which was matched to the decay rate of the final portion of each measured decay curve These portions of the curves were integrated analytically
Once the conditions of Step 1 were satisfied the rooms were re-mixed by opening the bedroom doors and operating the air handler This allowed the calculation of an effective whole-house air change rate using the relationship in Equation 3
Average whole-house air change rate (ACH) = ln(C0Cf)∆t (3)
where
Cf = Concentration of tracer gas after rooms are re-mixed (lbmft3) ∆t = Elapsed time between initial and final well-mixed cases (hr)
Test Matrix
The series of test conditions for the 1-story and 2-story houses are described in Tables 2 and 3 Most of the important tests were conducted for a 12-hour period overnight to ensure sufficient accuracy when calculating reciprocal age-of-air
Table 2 Test sequence for 1-story test house
Central fan
cycling Duration Vent Vent flow (min off
Test Date Time (hrs) Config rate (cfm) min on) Doors Notes
A1 Dec 28 AM 3 Exhaust 58 none closed
A2 PM 3 Exhaust 58 2010 closed
A3 overnight 12 Exhaust 58 none closed A4 Dec 29 AM 4 Supply 104 33 2010 closed
duty cycle A5 PM 4 Supply 58 33 duty 2010 closed
cycle A6 overnight 12 Supply 174 33 2010 closed
duty cycle
A7 Dec 30 AM-PM 8 None 0 none open Natural infiltration
A8 PM 2 None 0 none open AH bump
A9 overnight 12 Exhaust 58 none open
A10 Dec 31 AM-PM 6 Exhaust 58 none closed Transfer grills taped
A11 PM 6 Exhaust 58 2010 closed Transfer grills taped
A12 Jan 1 overnight 12 Exhaust 58 2010 closed
A13 PM 6 Exhaust 58 2010 open
A14 overnight 12 Exhaust 58 54 none closed
A15 Jan 2 AM-PM 6 None 0 none closed Natural infiltration
A16 overnight 12 Exhaust 58 none closed Master bath exhaust
14 of 49
Research Report - 0602
Table 3 Test sequence for 2-story test house
Central fan
cycling Duration Vent Vent flow (min off
Test Date Time (hrs) Config rate (cfm) min on) Doors Notes B1 Jan 3 overnight 14 Exhaust 63 none closed
B2 Jan 4 PM 5 Supply 114 33 20 10 closed 60 ASHRAE 622 duty cycle
B3 overnight 11 Supply 180 33 20 10 closed 95 ASHRAE 622 duty cycle
B4 Jan 5 PM 4 Supply 63 33 duty 20 10 closed 33 ASHRAE 622 cycle
B5 overnight 13 Exhaust 63 5010 closed
B6 Jan 6 PM 6 Exhaust 63 2010 closed
B7 overnight 12 Exhaust 63 none closed Transfer grilles taped
B8 Jan 7 AM 4 Exhaust 63 50 10 closed Transfer grilles taped
B9 PM 4 Exhaust 63 none closed Transfer grilles taped extra injection in MBR
B10 PM 2 Exhaust 63 none open
B11 overnight 9 Supply 114 33 20 10 closed Transfer grilles taped duty cycle
B12 Jan 8 PM 3 None 0 100 closed Transfer grilles taped air handler bump test
B13 PM 2 None 0 100 closed Transfer grilles untaped
B14 PM 2 None 0 none open Natural infiltration
B15 overnight 9 Exhaust 63 none closed Master bath exhaust transfer grilles taped
B16 Jan 9 AM 4 Exhaust 63 50 10 closed Master bath exhaust
B17 PM 4 Supply 178 33 20 10 closed duty cycle
B18 overnight 12 Exhaust 63 none closed Master bath exhaust
TEST RESULTS FROM 1-STORY HOUSE (1111 MONTAGUE)
Natural Infiltration
A test of natural infiltration was conducted for an 8-hour period on December 30 to examine the magnitude and variability of outside air entering the house through leaks in the building envelope (Test A7) The tracer gas decay curves are shown in Figure 9 It is evident that the house was very well mixed during this test which allows a running instantaneous calculation of whole-house ACH over the same time period (see Figure 10) Although the air change rate indicated that the house is relatively tight (about 0085 ACH on average) the effect of natural infiltration was far from negligible especially when the wind was blowing This variability of natural infiltration must be kept in mind when interpreting the decay curves and reciprocal age-of-air calculations that follow
15 of 49
Research Report - 0602
An air handler bump test was performed between 1300 and 1500 hours to examine the effect of air handler operation on whole house air exchange rate including duct leakage to the outside and changes in room-to-room pressurization caused by moving air from the supply registers in each room to the central return in the main living area Figure 10 shows both the hourly average ACH and the wind speed during this period At first glance it appears that the air change rate increased by about 003 ACH when the fan was turned on but there was a coincident jump in wind speed that complicates this interpretation There was no corresponding decrease in ACH when the air handler was turned off at 1500 hours Ultimately we cannot conclusively quantify the change in ACH associated with operation of the air handler but it appears to have been no more than 003 ACH
3
Co
ncen
trati
on
(m
gm
)
70
60
50
40
30
20
10
0
Living
Entry
BR1
BR2
BR3
MBR
Air Handler On
Air Handler Off
8 9 10 11 12 13 14 15 16 17 18
Hour
Figure 9 Tracer gas decay for 1-story house with no ventilation and bedroom doors open with and without central fan operation (Test A7)
16 of 49
Research Report - 0602
40016
35014 Air Handler On Air Handler Off
ACH
Wind Speed
Air
Ch
an
ge
Ra
te (
AC
H) 30012
25010
20008
15006
10004
Win
d S
pe
ed
(m
ph
)
002 05
00
8 10 12 14 16 18
000
Hour
Figure 10 Average air change rate for 1-story house with no ventilation no central fan operation and bedroom doors open (Test A7)
The natural ventilation test was repeated on January 2 with the doors closed instead of open (Test A15) providing the decay curves shown in Figure 11 The average air change rate for this case was 0086 ACH calculated based on the two well-mixed cases at the beginning and end of the test It is difficult to compare this number with the doors-open case because it was windy (4-5 mph) for the first few hours of this test However it is very clear that the uniformity of room-toshyroom distribution of outside air was significantly less when the doors were closed even with transfer grilles We did not calculate age-of-air for this test because the test conditions were not sufficiently steady state This fact is very evident at about hour 15 where the BR2 and BR3 curves suddenly begin to diverge from the MBR curve
17 of 49
Research Report - 0602
0
10
20
30
40
50
60
70
80
90
Co
ncen
trati
on
(m
gm
3 )
Living
Entry
BR1
BR2
BR3
MBR
Mixing stopped
Mixing restarted
10 11 12 13 14 15 16 17 18 19
Hour
Figure 11 Tracer gas decay for 1-story house with no ventilation no central fan operation and bedroom doors closed (Test A15)
Distributed Supply vs Point Exhaust Ventilation
Two of the most common ventilation schemes in Building America homes are continuous single-point exhaust ventilation and intermittent central-fan integrated supply (CFIS) ventilation Exhaust ventilation is most commonly installed in a bathroom laundry room or utility room Make-up air enters through the cracks and holes in the building envelope upon depressurization of the house The distribution of outside air in a given room is fairly unpredictable because it depends on the amount of depressurization in the room the number and size of openings in exterior walls and the influence of adjacent rooms Supply ventilation provided by a central-fan integrated system tends to be distributed more uniformly throughout the house However the fan is usually operated on a duty cycle of about 33 to limit the electricity used by the central fan and one of the goals of this testing is to evaluate the effect of that duty cycle on the consistency of the air mixing
The decay curves for a 12-hour overnight test with exhaust ventilation (Test A3) are shown in Figure 12 The exhaust fan register in the laundry room was used as the exhaust point and the Duct Blaster was used to exhaust 58 cfm continuously corresponding to the minimum ventilation rate recommended by ASHRAE for a 2075 ft2 4-bedroom house It is evident from the decay curves that significantly more outside air reached the master bedroom and less reached Bedroom 2 compared to the other rooms in the house
18 of 49
Research Report - 0602
0
2
4
6
8
10
12
14
Co
nc
en
tra
tio
n
mg
m3
Living
Entry
BR1
BR2
BR3
MBR
Mixing stopped
Mixing restarted
17 18 19 20 21 22 23 0 1 2 3 4 5 6
Hour
Figure 12 Tracer gas decay for 1-story house with exhaust ventilation from the laundry room at ASHRAE 622 level no central fan operation and bedroom doors closed (Test A3)
The corresponding decay curves for the central fan integrated supply system (Test A6) are shown in Figure 13 The air handler operated at a 33 duty cycle (20 min off 10 min on) with a ventilation rate of 174 cfm resulting in an average ventilation rate of 58 cfm again meeting the minimum ASHRAE 622 recommendations The whole house appeared to be well-mixed in this case because the decay curves were clustered together throughout the test Even during the 20 minute periods when the air handler was off there was very little divergence A comparison of Figure 12 to Figure 13 indicates that much more uniform distribution of ventilation air was achieved by using the CFIS system
19 of 49
Research Report - 0602
0
2
4
6
8
10
12
14
16
Co
nc
en
trati
on
(m
gm
3 )
Living
Entry
BR1
BR2
BR3
MBR
Mixing stopped
Mixing restarted
185 195 205 215 225 235 05 15 25 35 45 55 65
Hour
Figure 13 Tracer gas decay for 1-story house with supply ventilation at ASHRAE 622 level 33 central fan operation (20 min off 10 min on) and bedroom doors closed (Test
A6)
Reciprocal age-of-air calculations were performed to provide a quantitative comparison of the two ventilation systems as shown in Figure 14 Values were in the range of 0169 hr-1 +0042shy0038 hr-1 for the exhaust ventilation system compared to 0173 hr-1 +0002-0003 hr-1 for the supply ventilation system expressed in terms of the range of differences between the reciprocal age-of-air in each room and the whole-house air change rate With the exhaust ventilation at the laundry room the master bedroom received the greatest amount of fresh air We suspect this may have been caused by the presence of the exhaust ducts used for spot ventilation of the master bathroom possibly providing greater leakage area near the master bathroom than is present in other areas of the house The supply system distributed the ventilation air more uniformly but it is not entirely clear whether this result was primarily caused by the introduction of ventilation air through the supply ducts or by the air handler mixing air throughout the house Since it is clear that the exhaust ventilation showed better uniformity of ventilation with central system mixing it follows that mixing is likely to be the primary factor in the room-to-room uniformity shown by CFIS ventilation
It is also noteworthy that the average net air change rates provided by both the supply and exhaust ventilation systems were only about 018 ACH compared to the 025 ACH that would be expected if the mechanical ventilation rate (017 ACH) and the natural infiltration rate (008 ACH) were additive as they might be with a balanced ventilation system Adding mechanical ventilation to natural infiltration in quadrature results in an estimated average air change rate of 019 ACH which is fairly consistent with the measured values
20 of 49
Research Report - 0602
Recip
rocal
Ag
e o
f A
ir (
1h
r) 025
020
015
010
005
000
Simple Exhaust vs Central Fan Integrated
Supply
Centralized supply mixing
33 duty cycle 100
ASHRAE doors closed
Living
Entry
BR1
BR2
BR3
MBR
Exhaust in utility room no
mixing 100 ASHRAE
doors closed
Figure 14 Reciprocal age-of-air for 1-story house with continuous exhaust ventilation (Test A3) compared to central fan integrated supply ventilation (Test A6)
Air Handler Operation
To determine how much room-to-room mixing was caused by the air handler the exhaust only test was re-run with the air handler operating at 33 duty cycle (20 min off 10 min on) (Test A12) The decay curves are shown in Figure 15 Compared to Test A3 (Figure 12) there was a noticeable increase in uniformity when the air handler was operating even though the entry points for the ventilation air were uncontrolled As shown in Figure 16 the range of reciprocal age of air was reduced from +0042-0038 hr-1 to +0019-0011 hr-1) It appears that operation of the air handler explains most of the difference between the supply and exhaust ventilation systems discussed earlier Although it also appears that the overall average air change rate was higher in the case where the air handler was operating (0216 ACH vs 0176) it should be noted that the average wind speed was also significantly higher It is likely that the wind speed was the primary cause of the difference in average ACH not a difference in the mechanical ventilation rate
21 of 49
Research Report - 0602
0
5
10
15
20
25
30
35
Co
nce
ntr
ati
on
(m
gm
3 )
Living
Entry
BR1
BR2
BR3
MBR
Mixing stopped
Mixing restarted
0 1 2 3 4 5 6 7 8 9 10 11 12 13 14
Hour
Figure 15 Tracer gas decay for 1-story house with continuous exhaust ventilation at ASHRAE 622 level 33 central fan operation (20 min off 10 min on) and bedroom
doors closed (Test A12)
Exhaust Ventilation No Mixing vs 33 Air Handler Duty Cycle
000
005
010
015
020
025
Recip
rocal A
ge o
f A
ir (
1h
r)
Living
Entry
BR1
BR2
BR3
MBR
Exhaust in utility room 33 air handler
no mixing 100 operation exhaust in
ASHRAE doors closed utility room 100
ASHRAE doors closed
Figure 16 Reciprocal age-of-air for 1-story house with continuous exhaust ventilation with and without air handler operation (Tests A3 and A12)
22 of 49
Research Report - 0602
Exhaust Location
The preceding analysis of exhaust ventilation was based on an exhaust point in the laundry room which was relatively centrally located in the 1-story house To examine the effect of moving the exhaust point the duct blaster was moved to the master bathroom which was located in a far corner of the house (Test A16) A continuous exhaust ventilation rate of 58 cfm was again applied to the house resulting in the tracer gas decay curve shown in Figure 17 It is difficult to visually identify a significant difference between this series of curves and those shown in Figure 12 for the laundry room exhaust location
Because the curves were steady it is again possible to compare the results based on reciprocal age-of-air as shown in Figure 18 There appeared to be very little change in the distribution of outside air to most rooms However the reciprocal age-of-air in the master bedroom dropped noticeably when the exhaust location was moved to the master bathroom probably because a greater fraction of the outside air now passed through other rooms before reaching the master bedroom With the exhaust point centrally located most of the ventilation air passing through the master bedroom probably entered from the outside In both cases however the master bedroom had the highest reciprocal age-of-air of all of the rooms in the house and the BR2 location had the lowest
Co
nc
en
tra
tio
n (
mg
m3)
40
35
30
25
20
15
10
5
0
Living
Entry
BR1
BR2
BR3
MBR
Mixing stopped
Mixing restarted
19 20 21 22 23 0 1 2 3 4 5 6 7 8
Hour
Figure 17 Tracer gas decay for 1-story house with exhaust ventilation from the master bathroom at ASHRAE 622 level no central fan operation and bedroom doors closed (Test
A16)
23 of 49
Research Report - 0602
Exhaust Ventilation
Laundry Room vs Master Bathroom
000
005
010
015
020
025
Exhaust in laundry
room no mixing 100
ASHRAE doors closed
Exhaust in master
bathroom no mixing
100 ASHRAE doors
closed
Re
cip
roc
al A
ge
of
Air
(1
hr)
Living
Entry
BR1
BR2
BR3
MBR
Figure 18 Reciprocal age-of-air for 1-story house with exhaust ventilation from the master bathroom compared to the laundry room at ASHRAE 622 level no central fan operation
and bedroom doors closed (Tests A3 and A16)
Ventilation Rate
The supply ventilation test was repeated using flow rates corresponding to 60 and 33 of the ASHRAE recommendations The intent of this series of tests was to evaluate the room-to-room ventilation uniformity for ventilation rates consistent with ASHRAE 622 compared to the uniformity for reduced mechanical ventilation rates Each test was conducted for only 4 hours because of time limitations The decay curves are shown in Figures 19 and 20 Because the rooms were well-mixed during the supply ventilation tests the average whole-house ACH can be compared directly to the reciprocal age-of-air for the exhaust ventilation tests Figure 21 shows the supply ventilation air change rate for each of the three ventilation levels (33 60 100) compared to room-by-room reciprocal age-of-air for the exhaust ventilation system based on the boundary conditions present during the tests It appears that in the supply ventilation case all rooms receive more outside air than the least-ventilated room in the exhaust case (BR2) even at 60 of ASHRAE 622 These results serve to illustrate the trade-off between whole-house ventilation rate and room-to-room ventilation uniformity in terms of their impact on the worst room(s)
24 of 49
Research Report - 0602
The ASHRAE 622 committee has not currently defined the level of mixing that is required when choosing the minimum ventilation rate Some might interpret the results of this test to suggest that a house without mixing can have individual rooms that do not receive sufficient outside air even though the ventilation system is operating at 622 specified rates Because the 622 committee has not specified the level of mixing that is required when choosing the minimum ventilation rate the ventilation rate required by different ventilation systems is open to interpretation For example if the exhaust system performance shown in Figure 21 is acceptable does this mean that a ventilation system that provides good distribution of outside air may be sufficiently well-ventilated at 60 of the ASHRAE 622 level or perhaps even less Alternatively it might be concluded that exhaust ventilation rates should be increased over current ASHRAE 622 recommendations because of the possibility that certain rooms may receive very little fresh air Unfortunately because the current 622 standard does not specify air mixing requirements and the committeersquos assumptions about ventilation air distribution are not well documented it is difficult to make any firm recommendations in this area However we can conclude that air mixing is required for dilution ventilation systems to provide predictable results independent of the geometry of individual homes
8 9 10 11 12 13 14
Hour
Figure 19 Tracer gas decay for 1-story house with supply ventilation at 60 of ASHRAE 622 level 33 central fan operation (20 min off 10 min on) and bedroom doors closed
(Test A4)
0
10
20
30
40
50
60
Co
nce
ntr
ati
on
m
gm
3
Living
Entry
BR1
BR2
BR3
MBR
Mixing stopped
Mixing restarted
25 of 49
Research Report - 0602
0
5
10
15
20
25
30
Co
nce
ntr
ati
on
(m
gm
3 )
Living
Entry
BR1
BR2
BR3
MBR
Mixing stopped
Mixing restarted
12 13 14 15 16 17 18 19 20
Hour
Figure 20 Tracer gas decay for 1-story house with supply ventilation at 33 of ASHRAE 622 level 33 central fan operation (20 min off 10 min on) and bedroom doors closed
(Test A5)
Simple Exhaust vs Central Fan Integrated
Supply with Lower Ventilation Rates
025
Re
cip
roc
al A
ge
of
Air
(1
hr)
Well Mixed
100
ASHRAE 60
ASHRAE 33
ASHRAE Living Entry 010 Natural
BR1 Infilt
BR2 BR3 005
MBR
Exhaust in laundry room no
000
Central supply Natural infil-
mixing 100 ASHRAE doors mixing 33 duty tration doors
closed cycle doors closed open
Figure 21 Reciprocal age-of-air for 1-story house with supply ventilation at 33 60 and 100 of ASHRAE 622 level (Tests A5 A4 A6) compared to exhaust ventilation with
no central fan operation (Test A3) Bedroom doors were closed
020
015
26 of 49
Research Report - 0602
Simulations by Walker (2006) have shown that all systems will not provide the same service in terms of annual average air change rate For the same air flow rate and duty cycle balanced ventilation will yield a higher average air exchange than supply ventilation and supply ventilation will yield a higher average air exchange than exhaust ventilation That can be explained in general terms by understanding that wind and stack effects act to depressurize a building most of the time Exhaust fans increase the building depressurization further but supply fans decrease the depressurization Balanced fans donrsquot change the enclosure differential pressure and air flow at all Because of the non-linear relationship between differential pressure and air flows across the building enclosure a supply fan changes the pressures across the enclosure less than an exhaust fan acting more like a balanced fan The result is that the effect on ventilation air change rate from a supply fan is somewhere between that of an exhaust fan and a true balanced system
Bedroom Doors
Except for the natural ventilation test the preceding tests were all conducted with the bedroom doors closed to simulate a worst-case situation for air circulation within the house The exhaust ventilation test was repeated with the bedroom doors open (Test A9) producing the tracer gas decay curve shown in Figure 22 It is evident that the decay curves were much more tightly bundled with the doors open than they were with the doors closed (compare Figure 12) A comparison based on reciprocal age-of-air is shown in Figure 23 A significant improvement in room-to-room mixing is evident during the open-door test
It is also evident that the average air change rate was higher when the doors were open (0202 vs 0176 ACH) but it must be remembered that the ventilation rate was controlled using a duct blaster and average wind speed was higher during the open-door test period compared to the closed-door test period (20 mph compared to 06 mph) Therefore this test alone does not necessarily indicate that closing doors reduces the average air change rate associated with an exhaust system In future tests continuous measurement of the depressurization of the house with respect to outside along with single-point pressure measurements across interior doors would provide more information about the effect of closing doors when exhaust ventilation systems are used It would also be valuable to conduct this test during steady weather conditions using the exhaust fan (with uncontrolled ventilation rate) instead of the duct blaster to observe the net effect of closed doors on whole-house air change rate
27 of 49
Research Report - 0602
0
5
10
15
20
25
30
Co
ncen
trati
on
(m
gm
3 )
Living
Entry
BR1
BR2
BR3
MBR
Mixing stopped
Mixing restarted
181 191 201 211 221 231 01 11 21 31 41 51 61 71
Hour
Figure 22 Tracer gas decay for 1-story house with exhaust ventilation from the laundry room at ASHRAE 622 level no central fan operation and bedroom doors open (Test A9)
Exhaust Ventilation
Doors Closed vs Doors Open
000
005
010
015
020
025
Re
cip
roc
al
Ag
e o
f A
ir (
1h
r)
Living
Entry
BR1
BR2
BR3
MBR
Exhaust in laundry room Doors open no mixing
no mixing 100 exhaust in laundry room
ASHRAE doors closed 100 ASHRAE
Figure 23 Reciprocal age-of-air for 1-story house with exhaust ventilation from the laundry room at ASHRAE 622 level no central fan operation In the first case the bedroom doors were closed (Test A3) in the second the doors were open (Test A9)
28 of 49
Research Report - 0602
Transfer Grilles
Because the test houses used central returns instead of hard ducted returns in the bedrooms transfer grilles were installed over the bedroom doors to provide a flow path for return air without excessive room pressurization when the doors were closed These transfer grilles also allowed ventilation air to pass more freely from the bedrooms to the main living space The effect of transfer grilles on ventilation air distribution was evaluated by taping over the grilles (see Figure 24) and re-running the exhaust ventilation test (Test A10) The corresponding tracer gas decay curve is shown in Figure 25 and the reciprocal age-of-air analysis is shown in Figure 26 Taping the transfer grilles did not appear to significantly affect the room-to-room variability in ventilation rate although there appeared to be some slight re-ranking of rooms from highest to lowest reciprocal age-of-air It should be noted that there was an increase in average wind speed from 26 mph to 41 mph starting at 1 pm including a half hour period where the average wind speed was 7 mph This weather effect produced noticeable kinks in the decay curves and therefore would be expected to introduce significant errors into the reciprocal age-of-air results
Itrsquos possible that the transfer grilles played a much smaller role in providing a path for ventilation air than the supply ducts Because the air handler was not operating the ducts were not pressurized and were thus available as passive airflow conduits The resistance to air flow was probably smaller for the air ducts than for the transfer grilles depending on their size and the number of supply registers in each bedroom The existing door undercuts are also thought to have played a role The effect of ducts and door undercuts can be tested in the future by running separate tests with ducts and door undercuts taped over
copy buildingsciencecom
Figure 24 Transfer grilles over bedroom doors taped closed
29 of 49
Research Report - 0602
0
10
20
30
40
50
60
70
Co
nc
en
tra
tio
n (
mg
m3 )
Living
Entry
BR1
BR2
BR3
MBR
Mixing stopped
Mixing restarted
8 9 10 11 12 13 14 15 16 17
Hour
Figure 25 Tracer gas decay for 1-story house with exhaust ventilation from the laundry room at ASHRAE 622 level no central fan operation bedroom doors closed and transfer
grilles taped (Test A10)
Exhaust Ventilation
000
005
010
015
020
025
Re
cip
roc
al
Ag
e o
f A
ir (
1h
r)
Living
Entry
BR1
BR2
BR3
MBR
Transfer Grilles Untaped vs Taped
Exhaust in laundry room no Exhaust in laundry room no
mixing 100 ASHRAE mixing 100 ASHRAE
doors closed doors closed transfer
grilles taped
Figure 26 Reciprocal age-of-air for 1-story house with exhaust ventilation from the laundry room at ASHRAE 622 level no central fan operation and doors closed In the
30 of 49
Research Report - 0602
first case the transfer grilles are untaped (Test A3) in the second they are taped closed (Test A10)
Minimum Test Duration
We were fortunate that DR Horton provided two full weeks of access to these homes to conduct this series of tests which allowed us to run some of the more important tracer gas decay tests as long as 12 hours to help ensure that we could accurately calculate reciprocal age-of-air In most cases test houses would not be available for such a long time period To evaluate the length of time needed to estimate the reciprocal age-of-air with reasonable accuracy we examined the results that we would have obtained for one of the exhaust ventilation tests had we halted the test period after less than 12 hours For the supply ventilation tests the rooms were sufficiently well-mixed that the test could have been stopped after 3 or 4 hours assuming weather effects were steady
The reciprocal age-of-air calculations for the exhaust ventilation decay curves (Test A3 see Figure 12) based on test durations of 3 6 9 and 12 hours are shown in Figure 27 These test durations range from 053 to 21 air changes based on the average air change rate of 018 ACH (56 hours per air change) calculated for this test The ratio of highest to lowest reciprocal ageshyof-air is shown above the data points for each case These results suggest that shorter tests tend to overestimate the range and that perhaps 1frac12-2 air changes (roughly 9 to 12 hours in this case) may be necessary to obtain accurate calculations of reciprocal age-of-air when there is significant divergence among rooms From a qualitative standpoint one air change may be sufficient to determine the basic trend Without knowing in advance what mixing pattern will occur it is difficult to recommend a minimum test duration But assuming this test is fairly representative of a worst-case scenario a minimum of 15 air changes would be necessary to have a high degree of confidence in the quantitative difference in reciprocal age-of-air among rooms
31 of 49
Research Report - 0602
000
005
010
015
020
025
030
035
Re
cip
roc
al
Ag
e-O
f-A
ir (
hr-1
)
Living
Entry
BR1
BR2
BR3
MBR HighLow = 297
HighLow = 168 HighLow = 184 HighLow = 161
3-hour Test 6-hour Test 9-hour Test 12-hour Test
(053 Air Changes) (11 Air Changes) (16 Air Changes) (21 Air Changes)
Test Duration
Figure 27 Reciprocal age-of-air based on alternate test durations for 1-story house with exhaust ventilation from the laundry room at ASHRAE 622 level no central fan operation
and doors closed (Test A3) Average air change rate was 018 ACH
TEST RESULTS FROM 2-STORY HOUSE (1117 MONTAGUE)
The 2-story house was tested from January 3-10 2006 Three zones were selected on the first floor and three more were selected on the second floor as indicated by the red stars in Figure 4 The initial mixing of air among the rooms at the start of each test in this 2-story house was not as thorough as it was in the 1-story house Evidently the combined effects of the air handler and the portable de-stratification fan were not sufficient to overcome upward transport of tracer gas driven by the stack effect from the first to the second floor The resulting difference in initial tracer gas concentration among the rooms was about 5-10 This outcome emphasizes the significant effect of stack-driven infiltration on ventilation non-uniformity in multi-story homes Because our test method and equipment did not achieve a well-mixed condition at the start of each test there were some errors introduced into the reciprocal age-of-air analysis For future tests we would recommend larger de-stratification fans to obtain more well-mixed conditions in multi-story houses
Typical errors introduced by incomplete mixing of the tracer gas at the start of such a test were analyzed by examining two hypothetical cases where either all of the air entering a room comes from the outside or all of the air comes from an adjacent room with a different starting concentration If all of the air entering a space comes from the outside then a change in the initial concentration would have no effect on the reciprocal age-of-air because the decay curve would be exponential from the start and the area under the curve would be normalized based on
32 of 49
Research Report - 0602
the starting concentration in that zone However if the air entering a room passes through another room with a lower initial concentration the room receiving the air will have a lower concentration of tracer gas throughout the test compared to what the concentration would have been if the starting points were the same in both rooms This case is illustrated in Figure 28 where assumptions are made that the rooms are the same size the air exchange rate is 01 ACH for both rooms and the initial tracer gas concentration is 10 lower in the first room (upstream) than it is in the second room
The effect on reciprocal age-of-air is shown in Figure 29 A 10 difference in starting concentration results in an error of about 75 in reciprocal age-of-air for a room downstream of a room with a lower starting concentration assuming 01 ACH for both rooms The error would be somewhat smaller (about 5) if the air change rate was higher for both rooms (02 ACH) There would be no error introduced for rooms where all of the air infiltration comes from the outside Although the amount of error in the reciprocal age-of-air calculations can be affected by additional variables not examined here we feel that these percentages are reasonable estimates of the errors in our results for the 2-story house due to incomplete initial mixing of air
In each case an engineering judgment must be made regarding the significance of the error introduced by incomplete initial mixing As a general rule the differences in concentration at the start of the test should be small compared to the differences that are being measured in order for the results to be considered valid
Figure 28 Theoretical decay curves for a well-mixed case with uniform tracer gas concentration compared to a case where the upstream room starts with a concentration
10 lower than the downstream room
33 of 49
Research Report - 0602
Figure 29 Theoretical reciprocal age-of-air for a well-mixed case with uniform tracer gas concentration compared to a case where the upstream room starts with a concentration
10 lower than the downstream room
Natural Infiltration and Duct Leakage
A natural infiltration test was performed over a two hour period on the evening of January 8 (Test B14) The tracer gas decay curves are shown in Figure 30 There was a slight divergence between the first floor and second floor once the air handler was turned off but the rooms on each floor appeared to remain fairly well-mixed The average air change rate during the test period was about 011 ACH which was somewhat higher than the 1-story house as might be expected with an increased stack height
An air handler bedroom door bump test was conducted just prior to the test period shown in Figure 30 allowing observation of the combined effect of duct leakage to the outside and increased infiltration caused by room pressurization The average air change rate during that bump test was 013 ACH suggesting that closing doors and operating the fan added approximately 002 ACH to the whole-house average air change rate The average wind speed was a bit higher while the air handler was running (17 mph compared to 05 mph) so the effect of air handler operation may actually be somewhat less than the average ACH numbers indicate
34 of 49
Research Report - 0602
0
1
2
3
4
SF
6 C
on
ce
ntr
ati
on
(m
gm
3)
BR1
Living
Kitchen
BR2
BR3
MBR
Mixing stopped
Mixing restarted
1814 1843 1912 1940 2009 2038 2107 2136
Hour
Figure 30 Tracer gas decay for 2-story house with no ventilation no central fan operation and bedroom doors open (Test B14)
Distributed Supply vs Point Exhaust Ventilation
A 14-hour test (Test B1) was performed with an exhaust ventilation rate of 63 cfm in the laundry room which was located near the stairwell in the middle of the first floor The ventilation rate was again consistent with the ASHRAE 622 recommendations The tracer gas decay curves are shown in Figure 31 It is interesting that all three second floor rooms showed a delay before entering an exponential decay suggesting that some amount of air was moving from the first floor to the second floor even though the mechanical exhaust point was on the first floor It appears that the further depressurization of the first floor was insufficient to overcome the stack effect and draw a significant amount of outside air in through the rooms on the second floor
35 of 49
Research Report - 0602
182
9
192
9
202
9
212
9
222
9
232
9
029
129
229
329
429
529
629
729
828
929
102
8
112
8
122
8
0
10
20
30
40
50
60
70
SF
6 C
on
ce
ntr
ati
on
(m
gm
3)
BR1
Living
Kitchen
BR2
BR3
MBR
Mixing stopped
Mixing restarted
Hour
Figure 31 Tracer gas decay for 2-story house with exhaust ventilation from the laundry room at ASHRAE 622 level no central fan operation and bedroom doors closed (Test B1)
A supply ventilation test was performed on the 2-story house for about 11 hours starting late on January 4 (Test B3) The duct blaster was unable to provide the ventilation rate necessary to meet the minimum specified in ASHRAE 622 supplying 180 cfm instead of 189 cfm (95) The decay curves are shown in Figure 32 Although the curves are much more tightly packed than they were with the exhaust system there is more divergence than we saw with the supply system in the 1-story house most notably in the master bedroom
The reciprocal age-of-air calculations for both the exhaust and supply ventilation systems are shown in Figure 33 Again the results indicate that much better room-to-room distribution of ventilation air was achieved by the central-fan integrated supply system compared to the single-point exhaust system However for the supply ventilation test the differences in the initial tracer gas concentration were of the same magnitude as the differences in decay rates among the rooms As a result no conclusions should be drawn about the relative ranking of the supply ventilation rate among rooms based on Figure 33
36 of 49
Research Report - 0602
0
10
20
30
40
50
60
SF
6 C
on
ce
ntr
ati
on
(m
gm
3)
BR1
Living
Kitchen
BR2
BR3
MBR
Mixing stopped
Mixing restarted
2136 000 224 448 712 936 1200
Hour
Figure 32 Tracer gas decay for 2-story house with supply ventilation just under ASHRAE 622 level central fan operation at 33 duty cycle (20 min off 10 min on) and bedroom
doors closed (Test B3)
Simple Exhaust vs Central Fan Integrated
Supply )
000
005
010
015
020
025
Recip
rocal A
ge o
f A
ir (
1h
r
BR1
Living
Kitchen
BR2
BR3
MBR
Exhaust in laundry room no Centralized supply mixing
mixing 100 ASHRAE 33 duty cycle 95
doors closed ASHRAE doors closed
Figure 33 Reciprocal age-of-air for 2-story house with continuous exhaust ventilation (Test B1) compared to central fan integrated supply ventilation (Test B3) (Note
Uncertainties introduced by non-uniform starting concentration are of the same order of magnitude as the differences in reciprocal age-of-air among rooms for the supply ventilation case The relative ranking of rooms is not meaningful for that case)
37 of 49
Research Report - 0602
Air Handler Operation
The effect of occasional air handler operation on the distribution of exhaust ventilation air was evaluated on the afternoon of January 6 (Test B6) The tracer gas decay curves are shown in Figure 34 and reciprocal age-of-air calculations are shown in Figure 35 It should again be noted that before the test started the house was mixed using both the air handler and a de-stratification fan with the doors open During the test the doors were closed the de-stratification fan was turned off and the air handler operated at a 33 duty cycle (20 minutes off 10 minutes on) As was the case in the 1-story house this occasional operation of the air handler substantially improved the distribution of ventilation air among rooms even in conjunction with the point exhaust ventilation system There was very little divergence noticeable even with the air handler cycling on and off every half hour However because the initial differences in tracer gas concentration among rooms were as large as the differences in reciprocal age-of-air for the case with air handler operation no conclusions should be drawn about the relative ranking of ventilation rates among the rooms for that case
SF
6 C
on
cen
trati
on
(m
gm
3)
80
70
60
50
40
30
20
10
0
BR1
Living
Kitchen
BR2
BR3
MBR
Mixing stopped
Mixing restarted
1048 1200 1312 1424 1536 1648 1800 1912 2024
Hour
Figure 34 Tracer gas decay for 2-story house with continuous exhaust ventilation at ASHRAE 622 level central fan operation at 33 duty cycle (20 min off 10 min on) and
bedroom doors closed (Test B6)
38 of 49
Research Report - 0602
020
015 R
ec
ipro
ca
l A
ge
of
Air
(1
hr)
Exhaust Ventilation
No Mixing vs 33 Air Handler Duty Cycle
Exhaust in laundry room
no mixing 100
ASHRAE doors closed
33 air handler
operation exhaust in
laundry room 100
ASHRAE doors closed
BR1
Living
Kitchen
BR2
BR3
MBR
010
005
000
Figure 35 Reciprocal age-of-air for 2-story house with continuous exhaust ventilation with and without air handler operation (Tests B1 and B6) (Note Uncertainties introduced by non-uniform starting concentration are of the same order of magnitude as the differences in reciprocal age-of-air among rooms for the case with air handler operation The relative
ranking of rooms is not meaningful for that case)
Exhaust Location
The duct blaster was moved to the master bathroom exhaust register to see if there was a resulting change in ventilation air distribution (Test B18) The master bathroom was in the back of the house on the second floor between the master bedroom and bedroom 3 The decay curves are shown in Figure 36 and the reciprocal age-of-air results are shown in Figure 37 The rooms on each floor were well mixed before the test began although the mixing between the two floors was not as good Very wide divergence among rooms can be seen during the test especially between the upstairs bedrooms and the rest of the house Once again all three upstairs rooms appear to receive some air from the first floor but the master bedroom experiences a much higher volume of circulated air than the other two second-floor bedrooms which appear to be relatively stagnant
39 of 49
Research Report - 0602
0
10
20
30
40
50
60
70
80
90
SF
6 C
on
ce
ntr
ati
on
(m
gm
3)
BR1
Living
Kitchen
BR2
BR3
MBR
Mixing stopped
Mixing restarted
1912 2136 000 224 448 712 936 1200
Hour
Figure 36 Tracer gas decay for 2-story house with exhaust ventilation from the master bathroom at ASHRAE 622 level no central fan operation and bedroom doors closed (Test
B18)
Exhaust Ventilation
Laundry Room vs Master Bathroom
000
005
010
015
020
025
030
Exhaust in laundry room no
mixing 100 ASHRAE
doors closed
Exhaust in master bathroom
no mixing 100 ASHRAE
doors closed
Re
cip
roc
al A
ge
of
Air
(1
hr)
BR1
Living
Kitchen
BR2
BR3
MBR
Figure 37 Reciprocal age-of-air for 2-story house with exhaust ventilation from the master bathroom compared to the laundry room at ASHRAE 622 level no central fan operation
and bedroom doors closed (Tests B1 and B18)
40 of 49
Research Report - 0602
Ventilation Rate
The supply ventilation tests were repeated using flow rates of 60 and 33 of ASHRAE 622 recommendations corresponding to 114 cfm and 63 cfm respectively (Tests B2 and B4) The decay curves are shown in Figures 38 and 39 Reciprocal age-of-air for all three supply ventilation rates are shown in Figure 40 In all cases the rooms remained fairly well mixed especially rooms on the same floor As we observed in the 1-story house the ventilation rate in the 2-story house appeared to have very little effect on the uniformity of outside air provided to each room as long as it was mixed using the air handler One again the initial differences in tracer gas concentration among rooms were as large as the divergence in the decay curves preventing any conclusions about the relative ranking of ventilation rates among rooms for all three cases The error in initial concentration uniformity was bigger for the cases with air handler mixing because the relative divergence in the decay curves was so small compared to that of no air handler mixing In other words the error in relative ranking of ventilation rates for the cases with air handler mixing were not very important anyway because the relative differences between rooms were so small
1536 1648 1800 1912 2024 2136 2248
Hour
Figure 38 Tracer gas decay for 2-story house with supply ventilation at 60 of ASHRAE 622 level 33 central fan operation (20 min off 10 min on) and bedroom doors closed
(Test B2)
0
5
10
15
20
25
30
SF
6 C
on
cen
trati
on
(m
gm
3)
BR1 Living Kitchen BR2 BR3 MBR
Mixing stopped
Mixing restarted
41 of 49
Research Report - 0602
0
5
10
15
20
25
30
35
40
SF
6 C
on
cen
trati
on
(m
gm
3)
BR1
Living
Kitchen
BR2
BR3
MBR
Mixing stopped
Mixing restarted
1200 1312 1424 1536 1648 1800 1912
Hour
Figure 39 Tracer gas decay for 2-story house with supply ventilation at 33 of ASHRAE 622 level 33 central fan operation (20 min off 10 min on) and bedroom doors closed
(Test B4)
Supply Ventilation Rate Comparison
000
005
010
015
020
025
Re
cip
roc
al
Ag
e o
f A
ir (
1h
r)
BR1
Living
Kitchen
BR2
BR3
MBR
Centralized supply Centralized supply Centralized supply
mixing 33 duty mixing 33 duty mixing 33 duty
cycle 95 ASHRAE cycle 60 ASHRAE cycle 33 ASHRAE
doors closed doors closed doors closed
Figure 40 Reciprocal age-of-air for 2-story house with three levels of supply ventilation central fan operation at 33 duty cycle (20 min off 10 min on) and bedroom doors closed (Tests B3 B2 B4) (Note Uncertainties introduced by non-uniform starting
concentration are of the same order of magnitude as the differences in reciprocal age-of-air among rooms for all three cases The relative ranking of rooms is not meaningful for these
cases)
42 of 49
Research Report - 0602
The average air change rates for the three supply ventilation rates compared to the two exhaust ventilation schemes are shown in Figure 41 The CFIS system at 33 of the 622 ventilation flow rate provided a uniformly higher air change rate (013 ach) than the least ventilated rooms using exhaust ventilation from either the laundry or the master bathroom (010 ach Figure 37) It is noteworthy that the combined net air change rate with exhaust ventilation from the laundry room was significantly less than the air change rates for both exhaust ventilation from the master bathroom and supply ventilation at the air handler This illustrates the unpredictability of interactions between mechanical ventilation and natural infiltration which depend strongly on the distribution and size of cracks through which the outside air must pass to enter the house There may have been a relatively large building enclosure leakage opening near the laundry room (perhaps the utility penetrations or the door to the garage) that allowed a significant amount of outside air to quickly enter and leave the house through the exhaust flow without circulating around the house
0
005
01
015
02
025
Ave
rag
e A
CH
Natural Exhaust Exhaust Supply 95 Supply 60 Supply 33
Laundry Mbath
Rm 100 100
Figure 41 Average air change rates for 2-story house with supply ventilation at 33 60 and 95 of ASHRAE 622 recommendations (Tests B4 B2 B3) compared to natural
infiltration (Test B14) and exhaust ventilation with no central fan operation (Test B1) Bedroom doors were closed except for the natural infiltration test
Bedroom Doors
The laundry room exhaust ventilation test with no air handler operation (see Figure 31) was repeated with the doors open to evaluate the change in room-to-room ventilation air distribution (Test B10) The decay curves are shown in Figure 42 and the reciprocal age-of air calculations are shown in Figure 43 It is evident from Figure 42 that the test began before the rooms were
43 of 49
Research Report - 0602
0
5
10
15
20
25
SF
6 C
on
ce
ntr
ati
on
(m
gm
3)
BR1 Living Kitchen BR2 BR3 MBR
Mixing stopped
Mixing restarted
completely well mixed resulting in decay curves that could be somewhat misleading Because the master bedroom was at a higher concentration than the other rooms at the start of the test any room that received air from the master bedroom would appear to have a slower decay rate than it would have if the rooms started out at the same concentration Despite the difference in starting concentration it is clear that outside air was well distributed when the doors were open even without operation of the air handler
1843 1912 1940 2009 2038 2107 2136 2204 2233 2302
Hour
Figure 42 Tracer gas decay for the 2-story house with exhaust ventilation from the laundry room at ASHRAE 622 level no central fan operation and bedroom doors open
(Test B10)
Reciprocal age-of-air analysis was not performed for this case because of the combined effect of a short test duration (~2 hours) and unequal starting tracer gas concentrations even though the house was relatively well-mixed The important conclusion (that opening doors greatly improves mixing) can be drawn by inspecting the decay curves alone
Transfer Grilles
A final exhaust ventilation test was run on the 2-story house with the doors closed and the transfer grilles taped over The decay curves are shown in Figure 43 and the reciprocal age-ofshyair calculations are shown in Figure 44 The curves were clearly very divergent even after 12 hours By examining the reciprocal age-of-air results it is apparent that the transfer grilles in the 2-story house caused a noticeable improvement in ventilation air distribution but the improvement was smaller than when the doors were opened (Figure 42)
44 of 49
Research Report - 0602
0
5
10
15
20
25
30
SF
6 C
on
cen
tra
tio
n (
mg
m3
) BR1 Living Kitchen BR2 BR3 MBR
Mixing stopped
Mixing restarted
1648 1912 2136 000 224 448 712 936
Hour
Figure 43 Tracer gas decay for 2-story house with exhaust ventilation from the laundry room at ASHRAE 622 level no central fan operation bedroom doors closed transfer
grilles taped closed (Test B7)
Exhaust Ventilation Transfer Grilles Untaped vs Taped
000
005
010
015
020
Re
cip
roc
al
Ag
e o
f A
ir (
1h
r)
BR1
Living
Kitchen
BR2
BR3
MBR
Exhaust in laundry room no Exhaust in laundry room no
mixing 100 ASHRAE mixing 100 ASHRAE
doors closed doors closed transfer
grilles taped
Figure 44 Reciprocal age-of-air for 2-story house with exhaust ventilation from the laundry room at ASHRAE 622 level no central fan operation and doors closed In the first case the transfer grilles are untaped (Test B3) in the second they are taped closed
(Test B7)
45 of 49
Research Report - 0602
CONCLUSIONS
bull Reciprocal age-of-air analysis was chosen as a quantitative method for characterizing distribution of ventilation air among rooms This method worked well in cases where rooms were well mixed to begin the test and weather conditions were sufficiently steady-state
bull A test period of at least 1frac12 air changes was necessary to obtain reasonably accurate ageshyof-air results when there was significant divergence in tracer gas concentration among the rooms
bull Although we did not achieve uniform initial concentration of tracer gas in the 2-story house using our test methodology and the equipment at hand we believe the reciprocal age-of-air calculations were meaningful in many of the cases as indicated in the discussion
bull Both houses were relatively tight with natural infiltration averaging 008 ACH for the 1shystory house and 011 ACH for the 2-story house
bull Both houses had relatively small (but not negligible) duct losses to the outside producing an increase in infiltration of less than 003 ACH for the 1-story house and 002 ACH for the 2-story house when the air handler runs
bull Age-of-air analysis indicated that ventilation supplied through the central air distribution system provided much more uniform distribution of ventilation air than the single-point exhaust system when the doors were closed and the air handler was not running For the 1-story house the central-fan-integrated supply ventilation case at 60 of ASHRAE 622 provided more outside air to all rooms than the least-ventilated room in the exhaust case at 100 of 622 For the 2-story house the central-fan-integrated supply system at 33 of the 622 flow rate provided more outside air to all rooms than the least ventilated rooms using exhaust ventilation at 100 of 622 from either the laundry or the master bathroom
bull Operation of the central fan at a 33 duty cycle maintained relatively well-mixed conditions regardless of ventilation rate type of ventilation system (supply or exhaust) or house configuration (1-story or 2-story)
bull Exhaust location affected both the relative amount of outside air received by different rooms and the overall uniformity among rooms but the effect was not predictable
bull For exhaust-only ventilation without central fan operation opening bedroom doors appeared to significantly improve the mixing of ventilation air among rooms
bull Transfer grilles improved the distribution of ventilation air slightly but much less than opening the bedroom doors
bull In the 2-story house the stack effect caused air movement from the first floor to the second floor even when exhaust ventilation was applied to the first floor resulting in consistently higher tracer gas concentrations on the second floor and more non-uniform ventilation air distribution in general
bull Interactions between natural infiltration and both exhaust and supply mechanical ventilation were very significant When the ventilation system was activated the combined air change rate did not increase commensurate with the measured ventilation rate but instead increased by only half that amount This result was consistent with combining ventilation and infiltration in quadrature to estimate whole-house air change rate in accordance with ASHRAE Standard 136 (ASHRAE 1993)
46 of 49
Research Report - 0602
FUTURE WORK
In future tests continuous monitoring of pressure differentials would enhance our understanding of the multi-zone combined infiltration and ventilation systems and our ability to model them That would help to explain differences between tests in more detail including the effects of multiple stories location of ventilation supply outlets and exhaust inlets interior door closure and use of passive return air transfer grilles Pressure differential measurement points should include
bull dP with respect to outside for each closed room and open space bull dP across closed interior doors bull dP between the floor cavity and outdoors and bull dP between the house and the attic
Measurement of wind direction along with wind speed could also be helpful for modeling these buildings and systems However because of micro-climate wind shielding it may be very difficult to relate a single-point wind direction measurement to actual wind vectors on the building surfaces
ACKNOWLEDGMENTS
The authors express their appreciation to Rich Coyle of DR Horton for providing the test houses and to Joseph Lstiburek of BSC Subrato Chandra and Neil Moyer of FSEC and Greg Barker of Mountain Energy Partnership for their assistance in the planning and execution of this ventilation study
47 of 49
Research Report - 0602
REFERENCES
ASHRAE (1993) ANSIASHRAE Standard 136-1993 A Method of Determining Air Change Rates in Detached Dwellings Atlanta GA American Society of Heating Refrigerating and Air-Conditioning Engineers Inc
ASHRAE (1997) ANSIASHRAE Standard 129-1997 Measuring Air-Change Effectiveness Atlanta GA American Society of Heating Refrigerating and Air-Conditioning Engineers Inc
ASHRAE (2004) ASHRAE Standard 622-2004 Ventilation and Acceptable Indoor Air Quality in Low-Rise Residential Buildings Atlanta GA American Society of Heating Refrigerating and Air-Conditioning Engineers Inc
CSA (2003) CANCSA F326-M91 Residential Mechanical Ventilation Systems Canadian Standards Association Ontario Canada httpwwwcsashyintlorgonlinestoreGetCatalogItemDetailsaspmat=2410793ampParent=102
NBC 2005 National Building Code of Canada httpircnrcshycnrcgccapubscodesnrcc47666_ehtml
Grieve PW (1991) Measuring Ventilation Using Tracer-Gases Denmark Bruumlel amp Kjaeligr
MN Chapter 7672 Minnesota Energy Code Chapter 7672 Detached Single-Family And Two-Family Dwellings httpwwwstatemnusmnexternalDocsCommerceChapter_7672_Residential_111302012428 _72rulepdf
Persily AK Martin SR (2000) A Modeling Study of Ventilation in Manufactured Houses Gaithersburg MD National Institute of Standards and Technology NISTIR 6455
Rudd A Lstiburek J (2000) ldquoMeasurement of Ventilation and Interzonal Distribution in Single-Family Homesrdquo ASHRAE Transactions 2000 MN-00-10-3 V 106 Pt2 American Society of Heating Refrigeration and Air-Conditioning Engineers Atlanta GA
WAC (2004) Washington State Title 51 WAC Community trade and economic development department of (building code council) Chapter 51-13 Ventilation and indoor air quality httpappslegwagovWACdefaultaspxcite=51-13
48 of 49
Research Report - 0602
Field test of room-to-room uniformity of ventilation air distribution in two new houses
About this Report
This report was prepared for the US Department of Energyrsquos Building America
Program The report is freely available to the public at wwwbuildingamericagov
The authors express their appreciation to Rich Coyle of DR Horton for providing the test houses and to Joseph Lstiburek of BSC Subrato Chandra and Neil Moyer of
FSEC and Greg Barker of Mountain Energy Partnership for their assistance in the planning and execution of this ventilation study
About the Authors
Robert Hendron Ren Anderson Dennis Barley are with National Renewable Energy Laboratory Armin Rudd and Aaron Townsend are with Building Science Corporation
Ed Hancock is with Mountain Energy Partnership
Direct all correspondence to Building Science Corporation 30 Forest Street Somerville MA 02143
Limits of Liability and Disclaimer of Warranty
Building Science documents are intended for professionals The author and the publisher of this article have used their best efforts to provide accurate and authoritative information in regard to the subject matter covered The author and publisher make no warranty of any kind expressed or implied with regard to the information contained in this article
The information presented in this article must be used with care by professionals who understand the implications of what they are doing If professional advice or other expert assistance is required the services of a competent professional shall be sought The author and publisher shall not be liable in the event of incidental or consequential damages in connection with or arising from the use of the information contained within this Building Science document
49 of 49
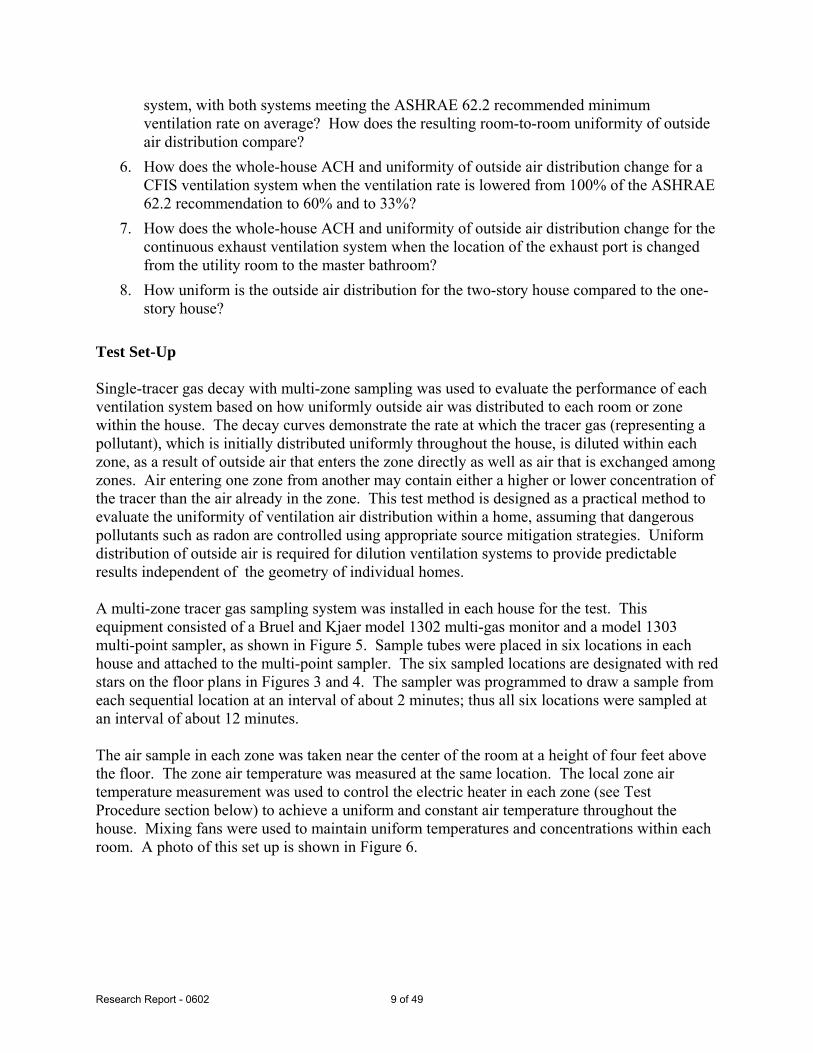
Research Report - 0602
system with both systems meeting the ASHRAE 622 recommended minimum ventilation rate on average How does the resulting room-to-room uniformity of outside air distribution compare
6 How does the whole-house ACH and uniformity of outside air distribution change for a CFIS ventilation system when the ventilation rate is lowered from 100 of the ASHRAE 622 recommendation to 60 and to 33
7 How does the whole-house ACH and uniformity of outside air distribution change for the continuous exhaust ventilation system when the location of the exhaust port is changed from the utility room to the master bathroom
8 How uniform is the outside air distribution for the two-story house compared to the one-story house
Test Set-Up
Single-tracer gas decay with multi-zone sampling was used to evaluate the performance of each ventilation system based on how uniformly outside air was distributed to each room or zone within the house The decay curves demonstrate the rate at which the tracer gas (representing a pollutant) which is initially distributed uniformly throughout the house is diluted within each zone as a result of outside air that enters the zone directly as well as air that is exchanged among zones Air entering one zone from another may contain either a higher or lower concentration of the tracer than the air already in the zone This test method is designed as a practical method to evaluate the uniformity of ventilation air distribution within a home assuming that dangerous pollutants such as radon are controlled using appropriate source mitigation strategies Uniform distribution of outside air is required for dilution ventilation systems to provide predictable results independent of the geometry of individual homes
A multi-zone tracer gas sampling system was installed in each house for the test This equipment consisted of a Bruel and Kjaer model 1302 multi-gas monitor and a model 1303 multi-point sampler as shown in Figure 5 Sample tubes were placed in six locations in each house and attached to the multi-point sampler The six sampled locations are designated with red stars on the floor plans in Figures 3 and 4 The sampler was programmed to draw a sample from each sequential location at an interval of about 2 minutes thus all six locations were sampled at an interval of about 12 minutes
The air sample in each zone was taken near the center of the room at a height of four feet above the floor The zone air temperature was measured at the same location The local zone air temperature measurement was used to control the electric heater in each zone (see Test Procedure section below) to achieve a uniform and constant air temperature throughout the house Mixing fans were used to maintain uniform temperatures and concentrations within each room A photo of this set up is shown in Figure 6
9 of 49
Research Report - 0602
copy buildingsciencecom
Figure 5 Multi-zone tracer gas sampling and monitoring equipment
Mixing Fan
Heater
Temperature Sampling Location
Figure 6 Tracer gas sampling point temperature sensor room air mixing and co-heating set-up
The air flow rates for both supply and exhaust ventilation were carefully controlled during the test using a Duct Blaster fan and measurement system For exhaust ventilation the Duct Blaster fan was placed near the location of the ceiling exhaust fan and a length of flexible duct was used to connect the normal entrance for the exhaust fan to the Duct Blaster All of the air flowing through the exhaust fan during the test was first routed through the Duct Blaster The Duct Blaster speed control was adjusted to achieve the desired flow rate and the Duct Blaster flow ring and pressure tap were used to measure the air flow rate The exhaust fan itself was operated in
10 of 49
Research Report - 0602
conjunction with the duct blaster to reduce the resistance to air flow Figure 7 shows the Duct Blaster installed at the laundry room exhaust register
copy buildingsciencecom
Figure 7 Duct Blaster installed at the laundry room exhaust register
A similar application of the Duct Blaster was used to control and measure the supply air flow rate during the tests of the CFIS system The normal configuration of flexible duct connecting the air handler return to the outside was changed so that all outside air would flow through the Duct Blaster The flexible duct was disconnected from the air handler return and attached to the inlet to the Duct Blaster The Duct Blaster outlet duct was attached to the air handler return The Duct Blaster speed control was used to achieve the desired air flow rate and the Duct Blaster flow ring and pressure tap were used to measure the flow rate This installation is shown in Figure 8
Natural infiltration rates varied during the tests depending on weather conditions which were monitored using a portable weather station
It should be noted that the supply ventilation ducts in the test houses were not sized for the flow rates desired in the tests The ventilation flow rate measured during normal operation of the air handler in the 1-story house was about 10 cfm compared to 174 cfm required to meet the ASHRAE 622 recommendations This flow rate was also significantly less than the design flow rate of about 40-60 cfm It was necessary to operate the Duct Blaster fan at maximum power to achieve the required air flow rate during some tests It was unclear if the outside air duct was too long too small or too tortuous or if insufficient negative pressure was present at the return of the air handler because the central return grille was just a few inches away (see Figure 8)
11 of 49
Research Report - 0602
copy buildingsciencecom
Figure 8 Duct Blaster installed between the outside air duct and the return of the air handler to provide supply ventilation
Test Procedure
The tracer gas used was sulfur hexafluoride (SF6) a stable non-toxic gas that was injected into each house volume from a small compressed gas cylinder carried by hand around the house During the dosing period the furnace fan was used to achieve an initially well-mixed condition with a concentration of about 15 parts per million (PPM) During this period the doors were kept open and a portable de-stratification fan was used in the 2-story house to improve mixing between floors Then the mixing fans were stopped and the divergence in concentration from zone to zone was observed (with doors either open or closed depending on the test objective) Small portable fans in each zone continued running to maintain a well-mixed condition within each zone The interior air temperature in each zone was controlled during the test period using portable electric heaters instead of the furnace so that operation of the air handler could be controlled independently from the demand for heating At the conclusion of the test the whole house was again mixed by opening the doors and turning on the air handler This allowed the calculation of an average whole-house air change rate for each set of test conditions
The tests were planned for rather mild weather to minimize infiltration effects so as to isolate and test the performance of the mechanical ventilation systems The general design goal was to provide the minimum amount of mechanical ventilation recommended by ASHRAE Standard 622-2004 (ASHRAE 2004) (58 cfm for the 1-story house 63 cfm for the 2-story house) and observe the effects of providing central fan integrated supply versus single-point exhaust ventilation operating the central fan closing the bedroom doors and taping the transfer grilles above the doors
12 of 49
Research Report - 0602
The results of the multi-zone tracer gas decay tests are presented graphically as families of decay curves These graphs illustrate the uniformity or non-uniformity of the ventilation effect among the various rooms and allow ranking of the rooms from the least to the most ventilation effect
In addition if the ventilation rates were sufficiently steady for the duration of the test period we used local mean age-of-air analysis to evaluate the results more quantitatively Age-of-air analysis is a well-established approach to testing ventilation rates at various points or in various zones within a building (Grieve 1991) Age-of-air is defined as the average length of time that air molecules have resided within the building The formula for calculating local mean age-ofshyair in a tracer gas decay test is given in ASHRAE Standard 129-1997 (ASHRAE 1997) as follows
Ai = 1 intinfin
Ci (t)dt (1)C0 0
where
i = Index for measurement point representing a well-mixed zone Ai = Local mean age-of-air at point i (hr) C = Concentration of tracer gas (lbmft3) C0 = Initial value of C in well-mixed building (lbmft3) Ci = Time-varying concentration of tracer gas at point i (lbmft3) t = Time (hr)
In order to compare the ventilation rates among the rooms or zones in the home we use the metric Reciprocal Age-of-Air
Reciprocal Age-of-Air = 1Ai (2)
Reciprocal Age-of-Air has units of 1hr and is equivalent to the air change rate (ACH) in a single well-mixed zone (Persily 2000)
The definition of Ai in Equation (1) involves an integral of infinite duration This is handled in the test procedure through a two-step process
Step 1 The tracer gas decay test is continued until (a) the initial transient effects of interzonal airflow have subsided and all of the decay curves resemble simple exponential functions and (b) the tracer concentrations are rather small compared to their initial values so that any extrapolation errors will have a small effect on the result In this field test most of the multi-zone tests were continued for 12 hours These portions of the decay curves were integrated numerically using the trapezoid rule
13 of 49
Research Report - 0602
Step 2 The remaining portions (the tails) of the decay curves were extrapolated to infinity using a simple exponential decay function which was matched to the decay rate of the final portion of each measured decay curve These portions of the curves were integrated analytically
Once the conditions of Step 1 were satisfied the rooms were re-mixed by opening the bedroom doors and operating the air handler This allowed the calculation of an effective whole-house air change rate using the relationship in Equation 3
Average whole-house air change rate (ACH) = ln(C0Cf)∆t (3)
where
Cf = Concentration of tracer gas after rooms are re-mixed (lbmft3) ∆t = Elapsed time between initial and final well-mixed cases (hr)
Test Matrix
The series of test conditions for the 1-story and 2-story houses are described in Tables 2 and 3 Most of the important tests were conducted for a 12-hour period overnight to ensure sufficient accuracy when calculating reciprocal age-of-air
Table 2 Test sequence for 1-story test house
Central fan
cycling Duration Vent Vent flow (min off
Test Date Time (hrs) Config rate (cfm) min on) Doors Notes
A1 Dec 28 AM 3 Exhaust 58 none closed
A2 PM 3 Exhaust 58 2010 closed
A3 overnight 12 Exhaust 58 none closed A4 Dec 29 AM 4 Supply 104 33 2010 closed
duty cycle A5 PM 4 Supply 58 33 duty 2010 closed
cycle A6 overnight 12 Supply 174 33 2010 closed
duty cycle
A7 Dec 30 AM-PM 8 None 0 none open Natural infiltration
A8 PM 2 None 0 none open AH bump
A9 overnight 12 Exhaust 58 none open
A10 Dec 31 AM-PM 6 Exhaust 58 none closed Transfer grills taped
A11 PM 6 Exhaust 58 2010 closed Transfer grills taped
A12 Jan 1 overnight 12 Exhaust 58 2010 closed
A13 PM 6 Exhaust 58 2010 open
A14 overnight 12 Exhaust 58 54 none closed
A15 Jan 2 AM-PM 6 None 0 none closed Natural infiltration
A16 overnight 12 Exhaust 58 none closed Master bath exhaust
14 of 49
Research Report - 0602
Table 3 Test sequence for 2-story test house
Central fan
cycling Duration Vent Vent flow (min off
Test Date Time (hrs) Config rate (cfm) min on) Doors Notes B1 Jan 3 overnight 14 Exhaust 63 none closed
B2 Jan 4 PM 5 Supply 114 33 20 10 closed 60 ASHRAE 622 duty cycle
B3 overnight 11 Supply 180 33 20 10 closed 95 ASHRAE 622 duty cycle
B4 Jan 5 PM 4 Supply 63 33 duty 20 10 closed 33 ASHRAE 622 cycle
B5 overnight 13 Exhaust 63 5010 closed
B6 Jan 6 PM 6 Exhaust 63 2010 closed
B7 overnight 12 Exhaust 63 none closed Transfer grilles taped
B8 Jan 7 AM 4 Exhaust 63 50 10 closed Transfer grilles taped
B9 PM 4 Exhaust 63 none closed Transfer grilles taped extra injection in MBR
B10 PM 2 Exhaust 63 none open
B11 overnight 9 Supply 114 33 20 10 closed Transfer grilles taped duty cycle
B12 Jan 8 PM 3 None 0 100 closed Transfer grilles taped air handler bump test
B13 PM 2 None 0 100 closed Transfer grilles untaped
B14 PM 2 None 0 none open Natural infiltration
B15 overnight 9 Exhaust 63 none closed Master bath exhaust transfer grilles taped
B16 Jan 9 AM 4 Exhaust 63 50 10 closed Master bath exhaust
B17 PM 4 Supply 178 33 20 10 closed duty cycle
B18 overnight 12 Exhaust 63 none closed Master bath exhaust
TEST RESULTS FROM 1-STORY HOUSE (1111 MONTAGUE)
Natural Infiltration
A test of natural infiltration was conducted for an 8-hour period on December 30 to examine the magnitude and variability of outside air entering the house through leaks in the building envelope (Test A7) The tracer gas decay curves are shown in Figure 9 It is evident that the house was very well mixed during this test which allows a running instantaneous calculation of whole-house ACH over the same time period (see Figure 10) Although the air change rate indicated that the house is relatively tight (about 0085 ACH on average) the effect of natural infiltration was far from negligible especially when the wind was blowing This variability of natural infiltration must be kept in mind when interpreting the decay curves and reciprocal age-of-air calculations that follow
15 of 49
Research Report - 0602
An air handler bump test was performed between 1300 and 1500 hours to examine the effect of air handler operation on whole house air exchange rate including duct leakage to the outside and changes in room-to-room pressurization caused by moving air from the supply registers in each room to the central return in the main living area Figure 10 shows both the hourly average ACH and the wind speed during this period At first glance it appears that the air change rate increased by about 003 ACH when the fan was turned on but there was a coincident jump in wind speed that complicates this interpretation There was no corresponding decrease in ACH when the air handler was turned off at 1500 hours Ultimately we cannot conclusively quantify the change in ACH associated with operation of the air handler but it appears to have been no more than 003 ACH
3
Co
ncen
trati
on
(m
gm
)
70
60
50
40
30
20
10
0
Living
Entry
BR1
BR2
BR3
MBR
Air Handler On
Air Handler Off
8 9 10 11 12 13 14 15 16 17 18
Hour
Figure 9 Tracer gas decay for 1-story house with no ventilation and bedroom doors open with and without central fan operation (Test A7)
16 of 49
Research Report - 0602
40016
35014 Air Handler On Air Handler Off
ACH
Wind Speed
Air
Ch
an
ge
Ra
te (
AC
H) 30012
25010
20008
15006
10004
Win
d S
pe
ed
(m
ph
)
002 05
00
8 10 12 14 16 18
000
Hour
Figure 10 Average air change rate for 1-story house with no ventilation no central fan operation and bedroom doors open (Test A7)
The natural ventilation test was repeated on January 2 with the doors closed instead of open (Test A15) providing the decay curves shown in Figure 11 The average air change rate for this case was 0086 ACH calculated based on the two well-mixed cases at the beginning and end of the test It is difficult to compare this number with the doors-open case because it was windy (4-5 mph) for the first few hours of this test However it is very clear that the uniformity of room-toshyroom distribution of outside air was significantly less when the doors were closed even with transfer grilles We did not calculate age-of-air for this test because the test conditions were not sufficiently steady state This fact is very evident at about hour 15 where the BR2 and BR3 curves suddenly begin to diverge from the MBR curve
17 of 49
Research Report - 0602
0
10
20
30
40
50
60
70
80
90
Co
ncen
trati
on
(m
gm
3 )
Living
Entry
BR1
BR2
BR3
MBR
Mixing stopped
Mixing restarted
10 11 12 13 14 15 16 17 18 19
Hour
Figure 11 Tracer gas decay for 1-story house with no ventilation no central fan operation and bedroom doors closed (Test A15)
Distributed Supply vs Point Exhaust Ventilation
Two of the most common ventilation schemes in Building America homes are continuous single-point exhaust ventilation and intermittent central-fan integrated supply (CFIS) ventilation Exhaust ventilation is most commonly installed in a bathroom laundry room or utility room Make-up air enters through the cracks and holes in the building envelope upon depressurization of the house The distribution of outside air in a given room is fairly unpredictable because it depends on the amount of depressurization in the room the number and size of openings in exterior walls and the influence of adjacent rooms Supply ventilation provided by a central-fan integrated system tends to be distributed more uniformly throughout the house However the fan is usually operated on a duty cycle of about 33 to limit the electricity used by the central fan and one of the goals of this testing is to evaluate the effect of that duty cycle on the consistency of the air mixing
The decay curves for a 12-hour overnight test with exhaust ventilation (Test A3) are shown in Figure 12 The exhaust fan register in the laundry room was used as the exhaust point and the Duct Blaster was used to exhaust 58 cfm continuously corresponding to the minimum ventilation rate recommended by ASHRAE for a 2075 ft2 4-bedroom house It is evident from the decay curves that significantly more outside air reached the master bedroom and less reached Bedroom 2 compared to the other rooms in the house
18 of 49
Research Report - 0602
0
2
4
6
8
10
12
14
Co
nc
en
tra
tio
n
mg
m3
Living
Entry
BR1
BR2
BR3
MBR
Mixing stopped
Mixing restarted
17 18 19 20 21 22 23 0 1 2 3 4 5 6
Hour
Figure 12 Tracer gas decay for 1-story house with exhaust ventilation from the laundry room at ASHRAE 622 level no central fan operation and bedroom doors closed (Test A3)
The corresponding decay curves for the central fan integrated supply system (Test A6) are shown in Figure 13 The air handler operated at a 33 duty cycle (20 min off 10 min on) with a ventilation rate of 174 cfm resulting in an average ventilation rate of 58 cfm again meeting the minimum ASHRAE 622 recommendations The whole house appeared to be well-mixed in this case because the decay curves were clustered together throughout the test Even during the 20 minute periods when the air handler was off there was very little divergence A comparison of Figure 12 to Figure 13 indicates that much more uniform distribution of ventilation air was achieved by using the CFIS system
19 of 49
Research Report - 0602
0
2
4
6
8
10
12
14
16
Co
nc
en
trati
on
(m
gm
3 )
Living
Entry
BR1
BR2
BR3
MBR
Mixing stopped
Mixing restarted
185 195 205 215 225 235 05 15 25 35 45 55 65
Hour
Figure 13 Tracer gas decay for 1-story house with supply ventilation at ASHRAE 622 level 33 central fan operation (20 min off 10 min on) and bedroom doors closed (Test
A6)
Reciprocal age-of-air calculations were performed to provide a quantitative comparison of the two ventilation systems as shown in Figure 14 Values were in the range of 0169 hr-1 +0042shy0038 hr-1 for the exhaust ventilation system compared to 0173 hr-1 +0002-0003 hr-1 for the supply ventilation system expressed in terms of the range of differences between the reciprocal age-of-air in each room and the whole-house air change rate With the exhaust ventilation at the laundry room the master bedroom received the greatest amount of fresh air We suspect this may have been caused by the presence of the exhaust ducts used for spot ventilation of the master bathroom possibly providing greater leakage area near the master bathroom than is present in other areas of the house The supply system distributed the ventilation air more uniformly but it is not entirely clear whether this result was primarily caused by the introduction of ventilation air through the supply ducts or by the air handler mixing air throughout the house Since it is clear that the exhaust ventilation showed better uniformity of ventilation with central system mixing it follows that mixing is likely to be the primary factor in the room-to-room uniformity shown by CFIS ventilation
It is also noteworthy that the average net air change rates provided by both the supply and exhaust ventilation systems were only about 018 ACH compared to the 025 ACH that would be expected if the mechanical ventilation rate (017 ACH) and the natural infiltration rate (008 ACH) were additive as they might be with a balanced ventilation system Adding mechanical ventilation to natural infiltration in quadrature results in an estimated average air change rate of 019 ACH which is fairly consistent with the measured values
20 of 49
Research Report - 0602
Recip
rocal
Ag
e o
f A
ir (
1h
r) 025
020
015
010
005
000
Simple Exhaust vs Central Fan Integrated
Supply
Centralized supply mixing
33 duty cycle 100
ASHRAE doors closed
Living
Entry
BR1
BR2
BR3
MBR
Exhaust in utility room no
mixing 100 ASHRAE
doors closed
Figure 14 Reciprocal age-of-air for 1-story house with continuous exhaust ventilation (Test A3) compared to central fan integrated supply ventilation (Test A6)
Air Handler Operation
To determine how much room-to-room mixing was caused by the air handler the exhaust only test was re-run with the air handler operating at 33 duty cycle (20 min off 10 min on) (Test A12) The decay curves are shown in Figure 15 Compared to Test A3 (Figure 12) there was a noticeable increase in uniformity when the air handler was operating even though the entry points for the ventilation air were uncontrolled As shown in Figure 16 the range of reciprocal age of air was reduced from +0042-0038 hr-1 to +0019-0011 hr-1) It appears that operation of the air handler explains most of the difference between the supply and exhaust ventilation systems discussed earlier Although it also appears that the overall average air change rate was higher in the case where the air handler was operating (0216 ACH vs 0176) it should be noted that the average wind speed was also significantly higher It is likely that the wind speed was the primary cause of the difference in average ACH not a difference in the mechanical ventilation rate
21 of 49
Research Report - 0602
0
5
10
15
20
25
30
35
Co
nce
ntr
ati
on
(m
gm
3 )
Living
Entry
BR1
BR2
BR3
MBR
Mixing stopped
Mixing restarted
0 1 2 3 4 5 6 7 8 9 10 11 12 13 14
Hour
Figure 15 Tracer gas decay for 1-story house with continuous exhaust ventilation at ASHRAE 622 level 33 central fan operation (20 min off 10 min on) and bedroom
doors closed (Test A12)
Exhaust Ventilation No Mixing vs 33 Air Handler Duty Cycle
000
005
010
015
020
025
Recip
rocal A
ge o
f A
ir (
1h
r)
Living
Entry
BR1
BR2
BR3
MBR
Exhaust in utility room 33 air handler
no mixing 100 operation exhaust in
ASHRAE doors closed utility room 100
ASHRAE doors closed
Figure 16 Reciprocal age-of-air for 1-story house with continuous exhaust ventilation with and without air handler operation (Tests A3 and A12)
22 of 49
Research Report - 0602
Exhaust Location
The preceding analysis of exhaust ventilation was based on an exhaust point in the laundry room which was relatively centrally located in the 1-story house To examine the effect of moving the exhaust point the duct blaster was moved to the master bathroom which was located in a far corner of the house (Test A16) A continuous exhaust ventilation rate of 58 cfm was again applied to the house resulting in the tracer gas decay curve shown in Figure 17 It is difficult to visually identify a significant difference between this series of curves and those shown in Figure 12 for the laundry room exhaust location
Because the curves were steady it is again possible to compare the results based on reciprocal age-of-air as shown in Figure 18 There appeared to be very little change in the distribution of outside air to most rooms However the reciprocal age-of-air in the master bedroom dropped noticeably when the exhaust location was moved to the master bathroom probably because a greater fraction of the outside air now passed through other rooms before reaching the master bedroom With the exhaust point centrally located most of the ventilation air passing through the master bedroom probably entered from the outside In both cases however the master bedroom had the highest reciprocal age-of-air of all of the rooms in the house and the BR2 location had the lowest
Co
nc
en
tra
tio
n (
mg
m3)
40
35
30
25
20
15
10
5
0
Living
Entry
BR1
BR2
BR3
MBR
Mixing stopped
Mixing restarted
19 20 21 22 23 0 1 2 3 4 5 6 7 8
Hour
Figure 17 Tracer gas decay for 1-story house with exhaust ventilation from the master bathroom at ASHRAE 622 level no central fan operation and bedroom doors closed (Test
A16)
23 of 49
Research Report - 0602
Exhaust Ventilation
Laundry Room vs Master Bathroom
000
005
010
015
020
025
Exhaust in laundry
room no mixing 100
ASHRAE doors closed
Exhaust in master
bathroom no mixing
100 ASHRAE doors
closed
Re
cip
roc
al A
ge
of
Air
(1
hr)
Living
Entry
BR1
BR2
BR3
MBR
Figure 18 Reciprocal age-of-air for 1-story house with exhaust ventilation from the master bathroom compared to the laundry room at ASHRAE 622 level no central fan operation
and bedroom doors closed (Tests A3 and A16)
Ventilation Rate
The supply ventilation test was repeated using flow rates corresponding to 60 and 33 of the ASHRAE recommendations The intent of this series of tests was to evaluate the room-to-room ventilation uniformity for ventilation rates consistent with ASHRAE 622 compared to the uniformity for reduced mechanical ventilation rates Each test was conducted for only 4 hours because of time limitations The decay curves are shown in Figures 19 and 20 Because the rooms were well-mixed during the supply ventilation tests the average whole-house ACH can be compared directly to the reciprocal age-of-air for the exhaust ventilation tests Figure 21 shows the supply ventilation air change rate for each of the three ventilation levels (33 60 100) compared to room-by-room reciprocal age-of-air for the exhaust ventilation system based on the boundary conditions present during the tests It appears that in the supply ventilation case all rooms receive more outside air than the least-ventilated room in the exhaust case (BR2) even at 60 of ASHRAE 622 These results serve to illustrate the trade-off between whole-house ventilation rate and room-to-room ventilation uniformity in terms of their impact on the worst room(s)
24 of 49
Research Report - 0602
The ASHRAE 622 committee has not currently defined the level of mixing that is required when choosing the minimum ventilation rate Some might interpret the results of this test to suggest that a house without mixing can have individual rooms that do not receive sufficient outside air even though the ventilation system is operating at 622 specified rates Because the 622 committee has not specified the level of mixing that is required when choosing the minimum ventilation rate the ventilation rate required by different ventilation systems is open to interpretation For example if the exhaust system performance shown in Figure 21 is acceptable does this mean that a ventilation system that provides good distribution of outside air may be sufficiently well-ventilated at 60 of the ASHRAE 622 level or perhaps even less Alternatively it might be concluded that exhaust ventilation rates should be increased over current ASHRAE 622 recommendations because of the possibility that certain rooms may receive very little fresh air Unfortunately because the current 622 standard does not specify air mixing requirements and the committeersquos assumptions about ventilation air distribution are not well documented it is difficult to make any firm recommendations in this area However we can conclude that air mixing is required for dilution ventilation systems to provide predictable results independent of the geometry of individual homes
8 9 10 11 12 13 14
Hour
Figure 19 Tracer gas decay for 1-story house with supply ventilation at 60 of ASHRAE 622 level 33 central fan operation (20 min off 10 min on) and bedroom doors closed
(Test A4)
0
10
20
30
40
50
60
Co
nce
ntr
ati
on
m
gm
3
Living
Entry
BR1
BR2
BR3
MBR
Mixing stopped
Mixing restarted
25 of 49
Research Report - 0602
0
5
10
15
20
25
30
Co
nce
ntr
ati
on
(m
gm
3 )
Living
Entry
BR1
BR2
BR3
MBR
Mixing stopped
Mixing restarted
12 13 14 15 16 17 18 19 20
Hour
Figure 20 Tracer gas decay for 1-story house with supply ventilation at 33 of ASHRAE 622 level 33 central fan operation (20 min off 10 min on) and bedroom doors closed
(Test A5)
Simple Exhaust vs Central Fan Integrated
Supply with Lower Ventilation Rates
025
Re
cip
roc
al A
ge
of
Air
(1
hr)
Well Mixed
100
ASHRAE 60
ASHRAE 33
ASHRAE Living Entry 010 Natural
BR1 Infilt
BR2 BR3 005
MBR
Exhaust in laundry room no
000
Central supply Natural infil-
mixing 100 ASHRAE doors mixing 33 duty tration doors
closed cycle doors closed open
Figure 21 Reciprocal age-of-air for 1-story house with supply ventilation at 33 60 and 100 of ASHRAE 622 level (Tests A5 A4 A6) compared to exhaust ventilation with
no central fan operation (Test A3) Bedroom doors were closed
020
015
26 of 49
Research Report - 0602
Simulations by Walker (2006) have shown that all systems will not provide the same service in terms of annual average air change rate For the same air flow rate and duty cycle balanced ventilation will yield a higher average air exchange than supply ventilation and supply ventilation will yield a higher average air exchange than exhaust ventilation That can be explained in general terms by understanding that wind and stack effects act to depressurize a building most of the time Exhaust fans increase the building depressurization further but supply fans decrease the depressurization Balanced fans donrsquot change the enclosure differential pressure and air flow at all Because of the non-linear relationship between differential pressure and air flows across the building enclosure a supply fan changes the pressures across the enclosure less than an exhaust fan acting more like a balanced fan The result is that the effect on ventilation air change rate from a supply fan is somewhere between that of an exhaust fan and a true balanced system
Bedroom Doors
Except for the natural ventilation test the preceding tests were all conducted with the bedroom doors closed to simulate a worst-case situation for air circulation within the house The exhaust ventilation test was repeated with the bedroom doors open (Test A9) producing the tracer gas decay curve shown in Figure 22 It is evident that the decay curves were much more tightly bundled with the doors open than they were with the doors closed (compare Figure 12) A comparison based on reciprocal age-of-air is shown in Figure 23 A significant improvement in room-to-room mixing is evident during the open-door test
It is also evident that the average air change rate was higher when the doors were open (0202 vs 0176 ACH) but it must be remembered that the ventilation rate was controlled using a duct blaster and average wind speed was higher during the open-door test period compared to the closed-door test period (20 mph compared to 06 mph) Therefore this test alone does not necessarily indicate that closing doors reduces the average air change rate associated with an exhaust system In future tests continuous measurement of the depressurization of the house with respect to outside along with single-point pressure measurements across interior doors would provide more information about the effect of closing doors when exhaust ventilation systems are used It would also be valuable to conduct this test during steady weather conditions using the exhaust fan (with uncontrolled ventilation rate) instead of the duct blaster to observe the net effect of closed doors on whole-house air change rate
27 of 49
Research Report - 0602
0
5
10
15
20
25
30
Co
ncen
trati
on
(m
gm
3 )
Living
Entry
BR1
BR2
BR3
MBR
Mixing stopped
Mixing restarted
181 191 201 211 221 231 01 11 21 31 41 51 61 71
Hour
Figure 22 Tracer gas decay for 1-story house with exhaust ventilation from the laundry room at ASHRAE 622 level no central fan operation and bedroom doors open (Test A9)
Exhaust Ventilation
Doors Closed vs Doors Open
000
005
010
015
020
025
Re
cip
roc
al
Ag
e o
f A
ir (
1h
r)
Living
Entry
BR1
BR2
BR3
MBR
Exhaust in laundry room Doors open no mixing
no mixing 100 exhaust in laundry room
ASHRAE doors closed 100 ASHRAE
Figure 23 Reciprocal age-of-air for 1-story house with exhaust ventilation from the laundry room at ASHRAE 622 level no central fan operation In the first case the bedroom doors were closed (Test A3) in the second the doors were open (Test A9)
28 of 49
Research Report - 0602
Transfer Grilles
Because the test houses used central returns instead of hard ducted returns in the bedrooms transfer grilles were installed over the bedroom doors to provide a flow path for return air without excessive room pressurization when the doors were closed These transfer grilles also allowed ventilation air to pass more freely from the bedrooms to the main living space The effect of transfer grilles on ventilation air distribution was evaluated by taping over the grilles (see Figure 24) and re-running the exhaust ventilation test (Test A10) The corresponding tracer gas decay curve is shown in Figure 25 and the reciprocal age-of-air analysis is shown in Figure 26 Taping the transfer grilles did not appear to significantly affect the room-to-room variability in ventilation rate although there appeared to be some slight re-ranking of rooms from highest to lowest reciprocal age-of-air It should be noted that there was an increase in average wind speed from 26 mph to 41 mph starting at 1 pm including a half hour period where the average wind speed was 7 mph This weather effect produced noticeable kinks in the decay curves and therefore would be expected to introduce significant errors into the reciprocal age-of-air results
Itrsquos possible that the transfer grilles played a much smaller role in providing a path for ventilation air than the supply ducts Because the air handler was not operating the ducts were not pressurized and were thus available as passive airflow conduits The resistance to air flow was probably smaller for the air ducts than for the transfer grilles depending on their size and the number of supply registers in each bedroom The existing door undercuts are also thought to have played a role The effect of ducts and door undercuts can be tested in the future by running separate tests with ducts and door undercuts taped over
copy buildingsciencecom
Figure 24 Transfer grilles over bedroom doors taped closed
29 of 49
Research Report - 0602
0
10
20
30
40
50
60
70
Co
nc
en
tra
tio
n (
mg
m3 )
Living
Entry
BR1
BR2
BR3
MBR
Mixing stopped
Mixing restarted
8 9 10 11 12 13 14 15 16 17
Hour
Figure 25 Tracer gas decay for 1-story house with exhaust ventilation from the laundry room at ASHRAE 622 level no central fan operation bedroom doors closed and transfer
grilles taped (Test A10)
Exhaust Ventilation
000
005
010
015
020
025
Re
cip
roc
al
Ag
e o
f A
ir (
1h
r)
Living
Entry
BR1
BR2
BR3
MBR
Transfer Grilles Untaped vs Taped
Exhaust in laundry room no Exhaust in laundry room no
mixing 100 ASHRAE mixing 100 ASHRAE
doors closed doors closed transfer
grilles taped
Figure 26 Reciprocal age-of-air for 1-story house with exhaust ventilation from the laundry room at ASHRAE 622 level no central fan operation and doors closed In the
30 of 49
Research Report - 0602
first case the transfer grilles are untaped (Test A3) in the second they are taped closed (Test A10)
Minimum Test Duration
We were fortunate that DR Horton provided two full weeks of access to these homes to conduct this series of tests which allowed us to run some of the more important tracer gas decay tests as long as 12 hours to help ensure that we could accurately calculate reciprocal age-of-air In most cases test houses would not be available for such a long time period To evaluate the length of time needed to estimate the reciprocal age-of-air with reasonable accuracy we examined the results that we would have obtained for one of the exhaust ventilation tests had we halted the test period after less than 12 hours For the supply ventilation tests the rooms were sufficiently well-mixed that the test could have been stopped after 3 or 4 hours assuming weather effects were steady
The reciprocal age-of-air calculations for the exhaust ventilation decay curves (Test A3 see Figure 12) based on test durations of 3 6 9 and 12 hours are shown in Figure 27 These test durations range from 053 to 21 air changes based on the average air change rate of 018 ACH (56 hours per air change) calculated for this test The ratio of highest to lowest reciprocal ageshyof-air is shown above the data points for each case These results suggest that shorter tests tend to overestimate the range and that perhaps 1frac12-2 air changes (roughly 9 to 12 hours in this case) may be necessary to obtain accurate calculations of reciprocal age-of-air when there is significant divergence among rooms From a qualitative standpoint one air change may be sufficient to determine the basic trend Without knowing in advance what mixing pattern will occur it is difficult to recommend a minimum test duration But assuming this test is fairly representative of a worst-case scenario a minimum of 15 air changes would be necessary to have a high degree of confidence in the quantitative difference in reciprocal age-of-air among rooms
31 of 49
Research Report - 0602
000
005
010
015
020
025
030
035
Re
cip
roc
al
Ag
e-O
f-A
ir (
hr-1
)
Living
Entry
BR1
BR2
BR3
MBR HighLow = 297
HighLow = 168 HighLow = 184 HighLow = 161
3-hour Test 6-hour Test 9-hour Test 12-hour Test
(053 Air Changes) (11 Air Changes) (16 Air Changes) (21 Air Changes)
Test Duration
Figure 27 Reciprocal age-of-air based on alternate test durations for 1-story house with exhaust ventilation from the laundry room at ASHRAE 622 level no central fan operation
and doors closed (Test A3) Average air change rate was 018 ACH
TEST RESULTS FROM 2-STORY HOUSE (1117 MONTAGUE)
The 2-story house was tested from January 3-10 2006 Three zones were selected on the first floor and three more were selected on the second floor as indicated by the red stars in Figure 4 The initial mixing of air among the rooms at the start of each test in this 2-story house was not as thorough as it was in the 1-story house Evidently the combined effects of the air handler and the portable de-stratification fan were not sufficient to overcome upward transport of tracer gas driven by the stack effect from the first to the second floor The resulting difference in initial tracer gas concentration among the rooms was about 5-10 This outcome emphasizes the significant effect of stack-driven infiltration on ventilation non-uniformity in multi-story homes Because our test method and equipment did not achieve a well-mixed condition at the start of each test there were some errors introduced into the reciprocal age-of-air analysis For future tests we would recommend larger de-stratification fans to obtain more well-mixed conditions in multi-story houses
Typical errors introduced by incomplete mixing of the tracer gas at the start of such a test were analyzed by examining two hypothetical cases where either all of the air entering a room comes from the outside or all of the air comes from an adjacent room with a different starting concentration If all of the air entering a space comes from the outside then a change in the initial concentration would have no effect on the reciprocal age-of-air because the decay curve would be exponential from the start and the area under the curve would be normalized based on
32 of 49
Research Report - 0602
the starting concentration in that zone However if the air entering a room passes through another room with a lower initial concentration the room receiving the air will have a lower concentration of tracer gas throughout the test compared to what the concentration would have been if the starting points were the same in both rooms This case is illustrated in Figure 28 where assumptions are made that the rooms are the same size the air exchange rate is 01 ACH for both rooms and the initial tracer gas concentration is 10 lower in the first room (upstream) than it is in the second room
The effect on reciprocal age-of-air is shown in Figure 29 A 10 difference in starting concentration results in an error of about 75 in reciprocal age-of-air for a room downstream of a room with a lower starting concentration assuming 01 ACH for both rooms The error would be somewhat smaller (about 5) if the air change rate was higher for both rooms (02 ACH) There would be no error introduced for rooms where all of the air infiltration comes from the outside Although the amount of error in the reciprocal age-of-air calculations can be affected by additional variables not examined here we feel that these percentages are reasonable estimates of the errors in our results for the 2-story house due to incomplete initial mixing of air
In each case an engineering judgment must be made regarding the significance of the error introduced by incomplete initial mixing As a general rule the differences in concentration at the start of the test should be small compared to the differences that are being measured in order for the results to be considered valid
Figure 28 Theoretical decay curves for a well-mixed case with uniform tracer gas concentration compared to a case where the upstream room starts with a concentration
10 lower than the downstream room
33 of 49
Research Report - 0602
Figure 29 Theoretical reciprocal age-of-air for a well-mixed case with uniform tracer gas concentration compared to a case where the upstream room starts with a concentration
10 lower than the downstream room
Natural Infiltration and Duct Leakage
A natural infiltration test was performed over a two hour period on the evening of January 8 (Test B14) The tracer gas decay curves are shown in Figure 30 There was a slight divergence between the first floor and second floor once the air handler was turned off but the rooms on each floor appeared to remain fairly well-mixed The average air change rate during the test period was about 011 ACH which was somewhat higher than the 1-story house as might be expected with an increased stack height
An air handler bedroom door bump test was conducted just prior to the test period shown in Figure 30 allowing observation of the combined effect of duct leakage to the outside and increased infiltration caused by room pressurization The average air change rate during that bump test was 013 ACH suggesting that closing doors and operating the fan added approximately 002 ACH to the whole-house average air change rate The average wind speed was a bit higher while the air handler was running (17 mph compared to 05 mph) so the effect of air handler operation may actually be somewhat less than the average ACH numbers indicate
34 of 49
Research Report - 0602
0
1
2
3
4
SF
6 C
on
ce
ntr
ati
on
(m
gm
3)
BR1
Living
Kitchen
BR2
BR3
MBR
Mixing stopped
Mixing restarted
1814 1843 1912 1940 2009 2038 2107 2136
Hour
Figure 30 Tracer gas decay for 2-story house with no ventilation no central fan operation and bedroom doors open (Test B14)
Distributed Supply vs Point Exhaust Ventilation
A 14-hour test (Test B1) was performed with an exhaust ventilation rate of 63 cfm in the laundry room which was located near the stairwell in the middle of the first floor The ventilation rate was again consistent with the ASHRAE 622 recommendations The tracer gas decay curves are shown in Figure 31 It is interesting that all three second floor rooms showed a delay before entering an exponential decay suggesting that some amount of air was moving from the first floor to the second floor even though the mechanical exhaust point was on the first floor It appears that the further depressurization of the first floor was insufficient to overcome the stack effect and draw a significant amount of outside air in through the rooms on the second floor
35 of 49
Research Report - 0602
182
9
192
9
202
9
212
9
222
9
232
9
029
129
229
329
429
529
629
729
828
929
102
8
112
8
122
8
0
10
20
30
40
50
60
70
SF
6 C
on
ce
ntr
ati
on
(m
gm
3)
BR1
Living
Kitchen
BR2
BR3
MBR
Mixing stopped
Mixing restarted
Hour
Figure 31 Tracer gas decay for 2-story house with exhaust ventilation from the laundry room at ASHRAE 622 level no central fan operation and bedroom doors closed (Test B1)
A supply ventilation test was performed on the 2-story house for about 11 hours starting late on January 4 (Test B3) The duct blaster was unable to provide the ventilation rate necessary to meet the minimum specified in ASHRAE 622 supplying 180 cfm instead of 189 cfm (95) The decay curves are shown in Figure 32 Although the curves are much more tightly packed than they were with the exhaust system there is more divergence than we saw with the supply system in the 1-story house most notably in the master bedroom
The reciprocal age-of-air calculations for both the exhaust and supply ventilation systems are shown in Figure 33 Again the results indicate that much better room-to-room distribution of ventilation air was achieved by the central-fan integrated supply system compared to the single-point exhaust system However for the supply ventilation test the differences in the initial tracer gas concentration were of the same magnitude as the differences in decay rates among the rooms As a result no conclusions should be drawn about the relative ranking of the supply ventilation rate among rooms based on Figure 33
36 of 49
Research Report - 0602
0
10
20
30
40
50
60
SF
6 C
on
ce
ntr
ati
on
(m
gm
3)
BR1
Living
Kitchen
BR2
BR3
MBR
Mixing stopped
Mixing restarted
2136 000 224 448 712 936 1200
Hour
Figure 32 Tracer gas decay for 2-story house with supply ventilation just under ASHRAE 622 level central fan operation at 33 duty cycle (20 min off 10 min on) and bedroom
doors closed (Test B3)
Simple Exhaust vs Central Fan Integrated
Supply )
000
005
010
015
020
025
Recip
rocal A
ge o
f A
ir (
1h
r
BR1
Living
Kitchen
BR2
BR3
MBR
Exhaust in laundry room no Centralized supply mixing
mixing 100 ASHRAE 33 duty cycle 95
doors closed ASHRAE doors closed
Figure 33 Reciprocal age-of-air for 2-story house with continuous exhaust ventilation (Test B1) compared to central fan integrated supply ventilation (Test B3) (Note
Uncertainties introduced by non-uniform starting concentration are of the same order of magnitude as the differences in reciprocal age-of-air among rooms for the supply ventilation case The relative ranking of rooms is not meaningful for that case)
37 of 49
Research Report - 0602
Air Handler Operation
The effect of occasional air handler operation on the distribution of exhaust ventilation air was evaluated on the afternoon of January 6 (Test B6) The tracer gas decay curves are shown in Figure 34 and reciprocal age-of-air calculations are shown in Figure 35 It should again be noted that before the test started the house was mixed using both the air handler and a de-stratification fan with the doors open During the test the doors were closed the de-stratification fan was turned off and the air handler operated at a 33 duty cycle (20 minutes off 10 minutes on) As was the case in the 1-story house this occasional operation of the air handler substantially improved the distribution of ventilation air among rooms even in conjunction with the point exhaust ventilation system There was very little divergence noticeable even with the air handler cycling on and off every half hour However because the initial differences in tracer gas concentration among rooms were as large as the differences in reciprocal age-of-air for the case with air handler operation no conclusions should be drawn about the relative ranking of ventilation rates among the rooms for that case
SF
6 C
on
cen
trati
on
(m
gm
3)
80
70
60
50
40
30
20
10
0
BR1
Living
Kitchen
BR2
BR3
MBR
Mixing stopped
Mixing restarted
1048 1200 1312 1424 1536 1648 1800 1912 2024
Hour
Figure 34 Tracer gas decay for 2-story house with continuous exhaust ventilation at ASHRAE 622 level central fan operation at 33 duty cycle (20 min off 10 min on) and
bedroom doors closed (Test B6)
38 of 49
Research Report - 0602
020
015 R
ec
ipro
ca
l A
ge
of
Air
(1
hr)
Exhaust Ventilation
No Mixing vs 33 Air Handler Duty Cycle
Exhaust in laundry room
no mixing 100
ASHRAE doors closed
33 air handler
operation exhaust in
laundry room 100
ASHRAE doors closed
BR1
Living
Kitchen
BR2
BR3
MBR
010
005
000
Figure 35 Reciprocal age-of-air for 2-story house with continuous exhaust ventilation with and without air handler operation (Tests B1 and B6) (Note Uncertainties introduced by non-uniform starting concentration are of the same order of magnitude as the differences in reciprocal age-of-air among rooms for the case with air handler operation The relative
ranking of rooms is not meaningful for that case)
Exhaust Location
The duct blaster was moved to the master bathroom exhaust register to see if there was a resulting change in ventilation air distribution (Test B18) The master bathroom was in the back of the house on the second floor between the master bedroom and bedroom 3 The decay curves are shown in Figure 36 and the reciprocal age-of-air results are shown in Figure 37 The rooms on each floor were well mixed before the test began although the mixing between the two floors was not as good Very wide divergence among rooms can be seen during the test especially between the upstairs bedrooms and the rest of the house Once again all three upstairs rooms appear to receive some air from the first floor but the master bedroom experiences a much higher volume of circulated air than the other two second-floor bedrooms which appear to be relatively stagnant
39 of 49
Research Report - 0602
0
10
20
30
40
50
60
70
80
90
SF
6 C
on
ce
ntr
ati
on
(m
gm
3)
BR1
Living
Kitchen
BR2
BR3
MBR
Mixing stopped
Mixing restarted
1912 2136 000 224 448 712 936 1200
Hour
Figure 36 Tracer gas decay for 2-story house with exhaust ventilation from the master bathroom at ASHRAE 622 level no central fan operation and bedroom doors closed (Test
B18)
Exhaust Ventilation
Laundry Room vs Master Bathroom
000
005
010
015
020
025
030
Exhaust in laundry room no
mixing 100 ASHRAE
doors closed
Exhaust in master bathroom
no mixing 100 ASHRAE
doors closed
Re
cip
roc
al A
ge
of
Air
(1
hr)
BR1
Living
Kitchen
BR2
BR3
MBR
Figure 37 Reciprocal age-of-air for 2-story house with exhaust ventilation from the master bathroom compared to the laundry room at ASHRAE 622 level no central fan operation
and bedroom doors closed (Tests B1 and B18)
40 of 49
Research Report - 0602
Ventilation Rate
The supply ventilation tests were repeated using flow rates of 60 and 33 of ASHRAE 622 recommendations corresponding to 114 cfm and 63 cfm respectively (Tests B2 and B4) The decay curves are shown in Figures 38 and 39 Reciprocal age-of-air for all three supply ventilation rates are shown in Figure 40 In all cases the rooms remained fairly well mixed especially rooms on the same floor As we observed in the 1-story house the ventilation rate in the 2-story house appeared to have very little effect on the uniformity of outside air provided to each room as long as it was mixed using the air handler One again the initial differences in tracer gas concentration among rooms were as large as the divergence in the decay curves preventing any conclusions about the relative ranking of ventilation rates among rooms for all three cases The error in initial concentration uniformity was bigger for the cases with air handler mixing because the relative divergence in the decay curves was so small compared to that of no air handler mixing In other words the error in relative ranking of ventilation rates for the cases with air handler mixing were not very important anyway because the relative differences between rooms were so small
1536 1648 1800 1912 2024 2136 2248
Hour
Figure 38 Tracer gas decay for 2-story house with supply ventilation at 60 of ASHRAE 622 level 33 central fan operation (20 min off 10 min on) and bedroom doors closed
(Test B2)
0
5
10
15
20
25
30
SF
6 C
on
cen
trati
on
(m
gm
3)
BR1 Living Kitchen BR2 BR3 MBR
Mixing stopped
Mixing restarted
41 of 49
Research Report - 0602
0
5
10
15
20
25
30
35
40
SF
6 C
on
cen
trati
on
(m
gm
3)
BR1
Living
Kitchen
BR2
BR3
MBR
Mixing stopped
Mixing restarted
1200 1312 1424 1536 1648 1800 1912
Hour
Figure 39 Tracer gas decay for 2-story house with supply ventilation at 33 of ASHRAE 622 level 33 central fan operation (20 min off 10 min on) and bedroom doors closed
(Test B4)
Supply Ventilation Rate Comparison
000
005
010
015
020
025
Re
cip
roc
al
Ag
e o
f A
ir (
1h
r)
BR1
Living
Kitchen
BR2
BR3
MBR
Centralized supply Centralized supply Centralized supply
mixing 33 duty mixing 33 duty mixing 33 duty
cycle 95 ASHRAE cycle 60 ASHRAE cycle 33 ASHRAE
doors closed doors closed doors closed
Figure 40 Reciprocal age-of-air for 2-story house with three levels of supply ventilation central fan operation at 33 duty cycle (20 min off 10 min on) and bedroom doors closed (Tests B3 B2 B4) (Note Uncertainties introduced by non-uniform starting
concentration are of the same order of magnitude as the differences in reciprocal age-of-air among rooms for all three cases The relative ranking of rooms is not meaningful for these
cases)
42 of 49
Research Report - 0602
The average air change rates for the three supply ventilation rates compared to the two exhaust ventilation schemes are shown in Figure 41 The CFIS system at 33 of the 622 ventilation flow rate provided a uniformly higher air change rate (013 ach) than the least ventilated rooms using exhaust ventilation from either the laundry or the master bathroom (010 ach Figure 37) It is noteworthy that the combined net air change rate with exhaust ventilation from the laundry room was significantly less than the air change rates for both exhaust ventilation from the master bathroom and supply ventilation at the air handler This illustrates the unpredictability of interactions between mechanical ventilation and natural infiltration which depend strongly on the distribution and size of cracks through which the outside air must pass to enter the house There may have been a relatively large building enclosure leakage opening near the laundry room (perhaps the utility penetrations or the door to the garage) that allowed a significant amount of outside air to quickly enter and leave the house through the exhaust flow without circulating around the house
0
005
01
015
02
025
Ave
rag
e A
CH
Natural Exhaust Exhaust Supply 95 Supply 60 Supply 33
Laundry Mbath
Rm 100 100
Figure 41 Average air change rates for 2-story house with supply ventilation at 33 60 and 95 of ASHRAE 622 recommendations (Tests B4 B2 B3) compared to natural
infiltration (Test B14) and exhaust ventilation with no central fan operation (Test B1) Bedroom doors were closed except for the natural infiltration test
Bedroom Doors
The laundry room exhaust ventilation test with no air handler operation (see Figure 31) was repeated with the doors open to evaluate the change in room-to-room ventilation air distribution (Test B10) The decay curves are shown in Figure 42 and the reciprocal age-of air calculations are shown in Figure 43 It is evident from Figure 42 that the test began before the rooms were
43 of 49
Research Report - 0602
0
5
10
15
20
25
SF
6 C
on
ce
ntr
ati
on
(m
gm
3)
BR1 Living Kitchen BR2 BR3 MBR
Mixing stopped
Mixing restarted
completely well mixed resulting in decay curves that could be somewhat misleading Because the master bedroom was at a higher concentration than the other rooms at the start of the test any room that received air from the master bedroom would appear to have a slower decay rate than it would have if the rooms started out at the same concentration Despite the difference in starting concentration it is clear that outside air was well distributed when the doors were open even without operation of the air handler
1843 1912 1940 2009 2038 2107 2136 2204 2233 2302
Hour
Figure 42 Tracer gas decay for the 2-story house with exhaust ventilation from the laundry room at ASHRAE 622 level no central fan operation and bedroom doors open
(Test B10)
Reciprocal age-of-air analysis was not performed for this case because of the combined effect of a short test duration (~2 hours) and unequal starting tracer gas concentrations even though the house was relatively well-mixed The important conclusion (that opening doors greatly improves mixing) can be drawn by inspecting the decay curves alone
Transfer Grilles
A final exhaust ventilation test was run on the 2-story house with the doors closed and the transfer grilles taped over The decay curves are shown in Figure 43 and the reciprocal age-ofshyair calculations are shown in Figure 44 The curves were clearly very divergent even after 12 hours By examining the reciprocal age-of-air results it is apparent that the transfer grilles in the 2-story house caused a noticeable improvement in ventilation air distribution but the improvement was smaller than when the doors were opened (Figure 42)
44 of 49
Research Report - 0602
0
5
10
15
20
25
30
SF
6 C
on
cen
tra
tio
n (
mg
m3
) BR1 Living Kitchen BR2 BR3 MBR
Mixing stopped
Mixing restarted
1648 1912 2136 000 224 448 712 936
Hour
Figure 43 Tracer gas decay for 2-story house with exhaust ventilation from the laundry room at ASHRAE 622 level no central fan operation bedroom doors closed transfer
grilles taped closed (Test B7)
Exhaust Ventilation Transfer Grilles Untaped vs Taped
000
005
010
015
020
Re
cip
roc
al
Ag
e o
f A
ir (
1h
r)
BR1
Living
Kitchen
BR2
BR3
MBR
Exhaust in laundry room no Exhaust in laundry room no
mixing 100 ASHRAE mixing 100 ASHRAE
doors closed doors closed transfer
grilles taped
Figure 44 Reciprocal age-of-air for 2-story house with exhaust ventilation from the laundry room at ASHRAE 622 level no central fan operation and doors closed In the first case the transfer grilles are untaped (Test B3) in the second they are taped closed
(Test B7)
45 of 49
Research Report - 0602
CONCLUSIONS
bull Reciprocal age-of-air analysis was chosen as a quantitative method for characterizing distribution of ventilation air among rooms This method worked well in cases where rooms were well mixed to begin the test and weather conditions were sufficiently steady-state
bull A test period of at least 1frac12 air changes was necessary to obtain reasonably accurate ageshyof-air results when there was significant divergence in tracer gas concentration among the rooms
bull Although we did not achieve uniform initial concentration of tracer gas in the 2-story house using our test methodology and the equipment at hand we believe the reciprocal age-of-air calculations were meaningful in many of the cases as indicated in the discussion
bull Both houses were relatively tight with natural infiltration averaging 008 ACH for the 1shystory house and 011 ACH for the 2-story house
bull Both houses had relatively small (but not negligible) duct losses to the outside producing an increase in infiltration of less than 003 ACH for the 1-story house and 002 ACH for the 2-story house when the air handler runs
bull Age-of-air analysis indicated that ventilation supplied through the central air distribution system provided much more uniform distribution of ventilation air than the single-point exhaust system when the doors were closed and the air handler was not running For the 1-story house the central-fan-integrated supply ventilation case at 60 of ASHRAE 622 provided more outside air to all rooms than the least-ventilated room in the exhaust case at 100 of 622 For the 2-story house the central-fan-integrated supply system at 33 of the 622 flow rate provided more outside air to all rooms than the least ventilated rooms using exhaust ventilation at 100 of 622 from either the laundry or the master bathroom
bull Operation of the central fan at a 33 duty cycle maintained relatively well-mixed conditions regardless of ventilation rate type of ventilation system (supply or exhaust) or house configuration (1-story or 2-story)
bull Exhaust location affected both the relative amount of outside air received by different rooms and the overall uniformity among rooms but the effect was not predictable
bull For exhaust-only ventilation without central fan operation opening bedroom doors appeared to significantly improve the mixing of ventilation air among rooms
bull Transfer grilles improved the distribution of ventilation air slightly but much less than opening the bedroom doors
bull In the 2-story house the stack effect caused air movement from the first floor to the second floor even when exhaust ventilation was applied to the first floor resulting in consistently higher tracer gas concentrations on the second floor and more non-uniform ventilation air distribution in general
bull Interactions between natural infiltration and both exhaust and supply mechanical ventilation were very significant When the ventilation system was activated the combined air change rate did not increase commensurate with the measured ventilation rate but instead increased by only half that amount This result was consistent with combining ventilation and infiltration in quadrature to estimate whole-house air change rate in accordance with ASHRAE Standard 136 (ASHRAE 1993)
46 of 49
Research Report - 0602
FUTURE WORK
In future tests continuous monitoring of pressure differentials would enhance our understanding of the multi-zone combined infiltration and ventilation systems and our ability to model them That would help to explain differences between tests in more detail including the effects of multiple stories location of ventilation supply outlets and exhaust inlets interior door closure and use of passive return air transfer grilles Pressure differential measurement points should include
bull dP with respect to outside for each closed room and open space bull dP across closed interior doors bull dP between the floor cavity and outdoors and bull dP between the house and the attic
Measurement of wind direction along with wind speed could also be helpful for modeling these buildings and systems However because of micro-climate wind shielding it may be very difficult to relate a single-point wind direction measurement to actual wind vectors on the building surfaces
ACKNOWLEDGMENTS
The authors express their appreciation to Rich Coyle of DR Horton for providing the test houses and to Joseph Lstiburek of BSC Subrato Chandra and Neil Moyer of FSEC and Greg Barker of Mountain Energy Partnership for their assistance in the planning and execution of this ventilation study
47 of 49
Research Report - 0602
REFERENCES
ASHRAE (1993) ANSIASHRAE Standard 136-1993 A Method of Determining Air Change Rates in Detached Dwellings Atlanta GA American Society of Heating Refrigerating and Air-Conditioning Engineers Inc
ASHRAE (1997) ANSIASHRAE Standard 129-1997 Measuring Air-Change Effectiveness Atlanta GA American Society of Heating Refrigerating and Air-Conditioning Engineers Inc
ASHRAE (2004) ASHRAE Standard 622-2004 Ventilation and Acceptable Indoor Air Quality in Low-Rise Residential Buildings Atlanta GA American Society of Heating Refrigerating and Air-Conditioning Engineers Inc
CSA (2003) CANCSA F326-M91 Residential Mechanical Ventilation Systems Canadian Standards Association Ontario Canada httpwwwcsashyintlorgonlinestoreGetCatalogItemDetailsaspmat=2410793ampParent=102
NBC 2005 National Building Code of Canada httpircnrcshycnrcgccapubscodesnrcc47666_ehtml
Grieve PW (1991) Measuring Ventilation Using Tracer-Gases Denmark Bruumlel amp Kjaeligr
MN Chapter 7672 Minnesota Energy Code Chapter 7672 Detached Single-Family And Two-Family Dwellings httpwwwstatemnusmnexternalDocsCommerceChapter_7672_Residential_111302012428 _72rulepdf
Persily AK Martin SR (2000) A Modeling Study of Ventilation in Manufactured Houses Gaithersburg MD National Institute of Standards and Technology NISTIR 6455
Rudd A Lstiburek J (2000) ldquoMeasurement of Ventilation and Interzonal Distribution in Single-Family Homesrdquo ASHRAE Transactions 2000 MN-00-10-3 V 106 Pt2 American Society of Heating Refrigeration and Air-Conditioning Engineers Atlanta GA
WAC (2004) Washington State Title 51 WAC Community trade and economic development department of (building code council) Chapter 51-13 Ventilation and indoor air quality httpappslegwagovWACdefaultaspxcite=51-13
48 of 49
Research Report - 0602
Field test of room-to-room uniformity of ventilation air distribution in two new houses
About this Report
This report was prepared for the US Department of Energyrsquos Building America
Program The report is freely available to the public at wwwbuildingamericagov
The authors express their appreciation to Rich Coyle of DR Horton for providing the test houses and to Joseph Lstiburek of BSC Subrato Chandra and Neil Moyer of
FSEC and Greg Barker of Mountain Energy Partnership for their assistance in the planning and execution of this ventilation study
About the Authors
Robert Hendron Ren Anderson Dennis Barley are with National Renewable Energy Laboratory Armin Rudd and Aaron Townsend are with Building Science Corporation
Ed Hancock is with Mountain Energy Partnership
Direct all correspondence to Building Science Corporation 30 Forest Street Somerville MA 02143
Limits of Liability and Disclaimer of Warranty
Building Science documents are intended for professionals The author and the publisher of this article have used their best efforts to provide accurate and authoritative information in regard to the subject matter covered The author and publisher make no warranty of any kind expressed or implied with regard to the information contained in this article
The information presented in this article must be used with care by professionals who understand the implications of what they are doing If professional advice or other expert assistance is required the services of a competent professional shall be sought The author and publisher shall not be liable in the event of incidental or consequential damages in connection with or arising from the use of the information contained within this Building Science document
49 of 49
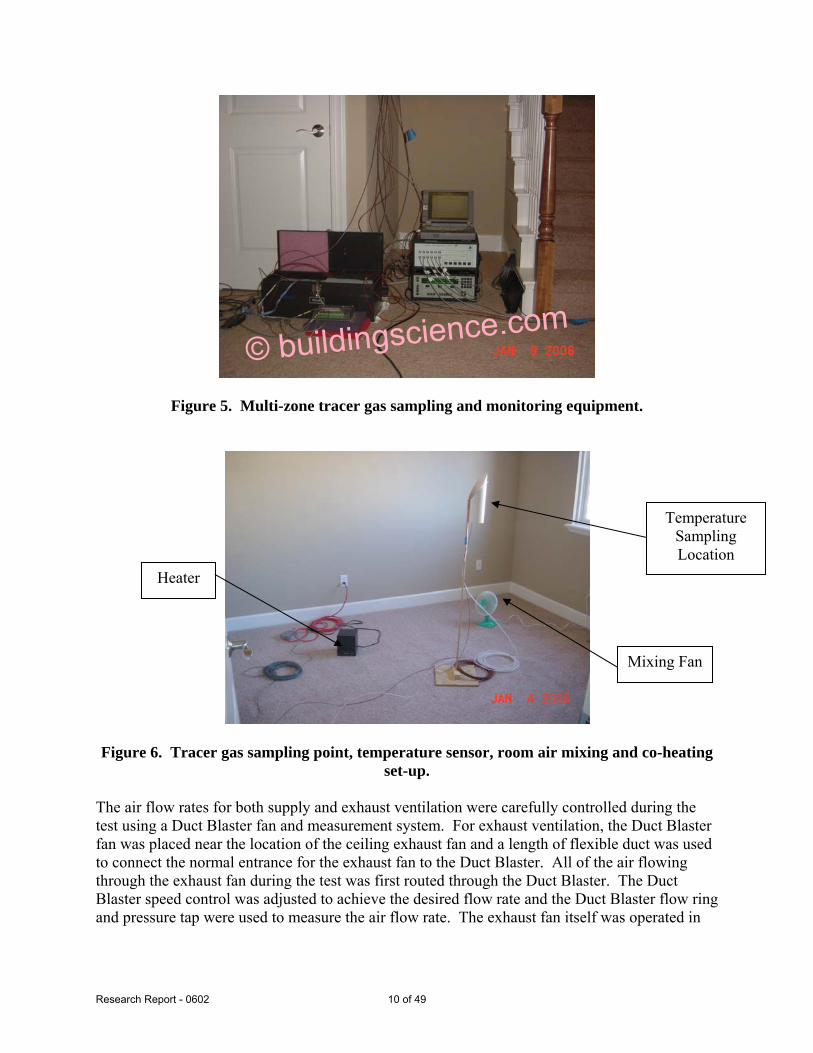
Research Report - 0602
copy buildingsciencecom
Figure 5 Multi-zone tracer gas sampling and monitoring equipment
Mixing Fan
Heater
Temperature Sampling Location
Figure 6 Tracer gas sampling point temperature sensor room air mixing and co-heating set-up
The air flow rates for both supply and exhaust ventilation were carefully controlled during the test using a Duct Blaster fan and measurement system For exhaust ventilation the Duct Blaster fan was placed near the location of the ceiling exhaust fan and a length of flexible duct was used to connect the normal entrance for the exhaust fan to the Duct Blaster All of the air flowing through the exhaust fan during the test was first routed through the Duct Blaster The Duct Blaster speed control was adjusted to achieve the desired flow rate and the Duct Blaster flow ring and pressure tap were used to measure the air flow rate The exhaust fan itself was operated in
10 of 49
Research Report - 0602
conjunction with the duct blaster to reduce the resistance to air flow Figure 7 shows the Duct Blaster installed at the laundry room exhaust register
copy buildingsciencecom
Figure 7 Duct Blaster installed at the laundry room exhaust register
A similar application of the Duct Blaster was used to control and measure the supply air flow rate during the tests of the CFIS system The normal configuration of flexible duct connecting the air handler return to the outside was changed so that all outside air would flow through the Duct Blaster The flexible duct was disconnected from the air handler return and attached to the inlet to the Duct Blaster The Duct Blaster outlet duct was attached to the air handler return The Duct Blaster speed control was used to achieve the desired air flow rate and the Duct Blaster flow ring and pressure tap were used to measure the flow rate This installation is shown in Figure 8
Natural infiltration rates varied during the tests depending on weather conditions which were monitored using a portable weather station
It should be noted that the supply ventilation ducts in the test houses were not sized for the flow rates desired in the tests The ventilation flow rate measured during normal operation of the air handler in the 1-story house was about 10 cfm compared to 174 cfm required to meet the ASHRAE 622 recommendations This flow rate was also significantly less than the design flow rate of about 40-60 cfm It was necessary to operate the Duct Blaster fan at maximum power to achieve the required air flow rate during some tests It was unclear if the outside air duct was too long too small or too tortuous or if insufficient negative pressure was present at the return of the air handler because the central return grille was just a few inches away (see Figure 8)
11 of 49
Research Report - 0602
copy buildingsciencecom
Figure 8 Duct Blaster installed between the outside air duct and the return of the air handler to provide supply ventilation
Test Procedure
The tracer gas used was sulfur hexafluoride (SF6) a stable non-toxic gas that was injected into each house volume from a small compressed gas cylinder carried by hand around the house During the dosing period the furnace fan was used to achieve an initially well-mixed condition with a concentration of about 15 parts per million (PPM) During this period the doors were kept open and a portable de-stratification fan was used in the 2-story house to improve mixing between floors Then the mixing fans were stopped and the divergence in concentration from zone to zone was observed (with doors either open or closed depending on the test objective) Small portable fans in each zone continued running to maintain a well-mixed condition within each zone The interior air temperature in each zone was controlled during the test period using portable electric heaters instead of the furnace so that operation of the air handler could be controlled independently from the demand for heating At the conclusion of the test the whole house was again mixed by opening the doors and turning on the air handler This allowed the calculation of an average whole-house air change rate for each set of test conditions
The tests were planned for rather mild weather to minimize infiltration effects so as to isolate and test the performance of the mechanical ventilation systems The general design goal was to provide the minimum amount of mechanical ventilation recommended by ASHRAE Standard 622-2004 (ASHRAE 2004) (58 cfm for the 1-story house 63 cfm for the 2-story house) and observe the effects of providing central fan integrated supply versus single-point exhaust ventilation operating the central fan closing the bedroom doors and taping the transfer grilles above the doors
12 of 49
Research Report - 0602
The results of the multi-zone tracer gas decay tests are presented graphically as families of decay curves These graphs illustrate the uniformity or non-uniformity of the ventilation effect among the various rooms and allow ranking of the rooms from the least to the most ventilation effect
In addition if the ventilation rates were sufficiently steady for the duration of the test period we used local mean age-of-air analysis to evaluate the results more quantitatively Age-of-air analysis is a well-established approach to testing ventilation rates at various points or in various zones within a building (Grieve 1991) Age-of-air is defined as the average length of time that air molecules have resided within the building The formula for calculating local mean age-ofshyair in a tracer gas decay test is given in ASHRAE Standard 129-1997 (ASHRAE 1997) as follows
Ai = 1 intinfin
Ci (t)dt (1)C0 0
where
i = Index for measurement point representing a well-mixed zone Ai = Local mean age-of-air at point i (hr) C = Concentration of tracer gas (lbmft3) C0 = Initial value of C in well-mixed building (lbmft3) Ci = Time-varying concentration of tracer gas at point i (lbmft3) t = Time (hr)
In order to compare the ventilation rates among the rooms or zones in the home we use the metric Reciprocal Age-of-Air
Reciprocal Age-of-Air = 1Ai (2)
Reciprocal Age-of-Air has units of 1hr and is equivalent to the air change rate (ACH) in a single well-mixed zone (Persily 2000)
The definition of Ai in Equation (1) involves an integral of infinite duration This is handled in the test procedure through a two-step process
Step 1 The tracer gas decay test is continued until (a) the initial transient effects of interzonal airflow have subsided and all of the decay curves resemble simple exponential functions and (b) the tracer concentrations are rather small compared to their initial values so that any extrapolation errors will have a small effect on the result In this field test most of the multi-zone tests were continued for 12 hours These portions of the decay curves were integrated numerically using the trapezoid rule
13 of 49
Research Report - 0602
Step 2 The remaining portions (the tails) of the decay curves were extrapolated to infinity using a simple exponential decay function which was matched to the decay rate of the final portion of each measured decay curve These portions of the curves were integrated analytically
Once the conditions of Step 1 were satisfied the rooms were re-mixed by opening the bedroom doors and operating the air handler This allowed the calculation of an effective whole-house air change rate using the relationship in Equation 3
Average whole-house air change rate (ACH) = ln(C0Cf)∆t (3)
where
Cf = Concentration of tracer gas after rooms are re-mixed (lbmft3) ∆t = Elapsed time between initial and final well-mixed cases (hr)
Test Matrix
The series of test conditions for the 1-story and 2-story houses are described in Tables 2 and 3 Most of the important tests were conducted for a 12-hour period overnight to ensure sufficient accuracy when calculating reciprocal age-of-air
Table 2 Test sequence for 1-story test house
Central fan
cycling Duration Vent Vent flow (min off
Test Date Time (hrs) Config rate (cfm) min on) Doors Notes
A1 Dec 28 AM 3 Exhaust 58 none closed
A2 PM 3 Exhaust 58 2010 closed
A3 overnight 12 Exhaust 58 none closed A4 Dec 29 AM 4 Supply 104 33 2010 closed
duty cycle A5 PM 4 Supply 58 33 duty 2010 closed
cycle A6 overnight 12 Supply 174 33 2010 closed
duty cycle
A7 Dec 30 AM-PM 8 None 0 none open Natural infiltration
A8 PM 2 None 0 none open AH bump
A9 overnight 12 Exhaust 58 none open
A10 Dec 31 AM-PM 6 Exhaust 58 none closed Transfer grills taped
A11 PM 6 Exhaust 58 2010 closed Transfer grills taped
A12 Jan 1 overnight 12 Exhaust 58 2010 closed
A13 PM 6 Exhaust 58 2010 open
A14 overnight 12 Exhaust 58 54 none closed
A15 Jan 2 AM-PM 6 None 0 none closed Natural infiltration
A16 overnight 12 Exhaust 58 none closed Master bath exhaust
14 of 49
Research Report - 0602
Table 3 Test sequence for 2-story test house
Central fan
cycling Duration Vent Vent flow (min off
Test Date Time (hrs) Config rate (cfm) min on) Doors Notes B1 Jan 3 overnight 14 Exhaust 63 none closed
B2 Jan 4 PM 5 Supply 114 33 20 10 closed 60 ASHRAE 622 duty cycle
B3 overnight 11 Supply 180 33 20 10 closed 95 ASHRAE 622 duty cycle
B4 Jan 5 PM 4 Supply 63 33 duty 20 10 closed 33 ASHRAE 622 cycle
B5 overnight 13 Exhaust 63 5010 closed
B6 Jan 6 PM 6 Exhaust 63 2010 closed
B7 overnight 12 Exhaust 63 none closed Transfer grilles taped
B8 Jan 7 AM 4 Exhaust 63 50 10 closed Transfer grilles taped
B9 PM 4 Exhaust 63 none closed Transfer grilles taped extra injection in MBR
B10 PM 2 Exhaust 63 none open
B11 overnight 9 Supply 114 33 20 10 closed Transfer grilles taped duty cycle
B12 Jan 8 PM 3 None 0 100 closed Transfer grilles taped air handler bump test
B13 PM 2 None 0 100 closed Transfer grilles untaped
B14 PM 2 None 0 none open Natural infiltration
B15 overnight 9 Exhaust 63 none closed Master bath exhaust transfer grilles taped
B16 Jan 9 AM 4 Exhaust 63 50 10 closed Master bath exhaust
B17 PM 4 Supply 178 33 20 10 closed duty cycle
B18 overnight 12 Exhaust 63 none closed Master bath exhaust
TEST RESULTS FROM 1-STORY HOUSE (1111 MONTAGUE)
Natural Infiltration
A test of natural infiltration was conducted for an 8-hour period on December 30 to examine the magnitude and variability of outside air entering the house through leaks in the building envelope (Test A7) The tracer gas decay curves are shown in Figure 9 It is evident that the house was very well mixed during this test which allows a running instantaneous calculation of whole-house ACH over the same time period (see Figure 10) Although the air change rate indicated that the house is relatively tight (about 0085 ACH on average) the effect of natural infiltration was far from negligible especially when the wind was blowing This variability of natural infiltration must be kept in mind when interpreting the decay curves and reciprocal age-of-air calculations that follow
15 of 49
Research Report - 0602
An air handler bump test was performed between 1300 and 1500 hours to examine the effect of air handler operation on whole house air exchange rate including duct leakage to the outside and changes in room-to-room pressurization caused by moving air from the supply registers in each room to the central return in the main living area Figure 10 shows both the hourly average ACH and the wind speed during this period At first glance it appears that the air change rate increased by about 003 ACH when the fan was turned on but there was a coincident jump in wind speed that complicates this interpretation There was no corresponding decrease in ACH when the air handler was turned off at 1500 hours Ultimately we cannot conclusively quantify the change in ACH associated with operation of the air handler but it appears to have been no more than 003 ACH
3
Co
ncen
trati
on
(m
gm
)
70
60
50
40
30
20
10
0
Living
Entry
BR1
BR2
BR3
MBR
Air Handler On
Air Handler Off
8 9 10 11 12 13 14 15 16 17 18
Hour
Figure 9 Tracer gas decay for 1-story house with no ventilation and bedroom doors open with and without central fan operation (Test A7)
16 of 49
Research Report - 0602
40016
35014 Air Handler On Air Handler Off
ACH
Wind Speed
Air
Ch
an
ge
Ra
te (
AC
H) 30012
25010
20008
15006
10004
Win
d S
pe
ed
(m
ph
)
002 05
00
8 10 12 14 16 18
000
Hour
Figure 10 Average air change rate for 1-story house with no ventilation no central fan operation and bedroom doors open (Test A7)
The natural ventilation test was repeated on January 2 with the doors closed instead of open (Test A15) providing the decay curves shown in Figure 11 The average air change rate for this case was 0086 ACH calculated based on the two well-mixed cases at the beginning and end of the test It is difficult to compare this number with the doors-open case because it was windy (4-5 mph) for the first few hours of this test However it is very clear that the uniformity of room-toshyroom distribution of outside air was significantly less when the doors were closed even with transfer grilles We did not calculate age-of-air for this test because the test conditions were not sufficiently steady state This fact is very evident at about hour 15 where the BR2 and BR3 curves suddenly begin to diverge from the MBR curve
17 of 49
Research Report - 0602
0
10
20
30
40
50
60
70
80
90
Co
ncen
trati
on
(m
gm
3 )
Living
Entry
BR1
BR2
BR3
MBR
Mixing stopped
Mixing restarted
10 11 12 13 14 15 16 17 18 19
Hour
Figure 11 Tracer gas decay for 1-story house with no ventilation no central fan operation and bedroom doors closed (Test A15)
Distributed Supply vs Point Exhaust Ventilation
Two of the most common ventilation schemes in Building America homes are continuous single-point exhaust ventilation and intermittent central-fan integrated supply (CFIS) ventilation Exhaust ventilation is most commonly installed in a bathroom laundry room or utility room Make-up air enters through the cracks and holes in the building envelope upon depressurization of the house The distribution of outside air in a given room is fairly unpredictable because it depends on the amount of depressurization in the room the number and size of openings in exterior walls and the influence of adjacent rooms Supply ventilation provided by a central-fan integrated system tends to be distributed more uniformly throughout the house However the fan is usually operated on a duty cycle of about 33 to limit the electricity used by the central fan and one of the goals of this testing is to evaluate the effect of that duty cycle on the consistency of the air mixing
The decay curves for a 12-hour overnight test with exhaust ventilation (Test A3) are shown in Figure 12 The exhaust fan register in the laundry room was used as the exhaust point and the Duct Blaster was used to exhaust 58 cfm continuously corresponding to the minimum ventilation rate recommended by ASHRAE for a 2075 ft2 4-bedroom house It is evident from the decay curves that significantly more outside air reached the master bedroom and less reached Bedroom 2 compared to the other rooms in the house
18 of 49
Research Report - 0602
0
2
4
6
8
10
12
14
Co
nc
en
tra
tio
n
mg
m3
Living
Entry
BR1
BR2
BR3
MBR
Mixing stopped
Mixing restarted
17 18 19 20 21 22 23 0 1 2 3 4 5 6
Hour
Figure 12 Tracer gas decay for 1-story house with exhaust ventilation from the laundry room at ASHRAE 622 level no central fan operation and bedroom doors closed (Test A3)
The corresponding decay curves for the central fan integrated supply system (Test A6) are shown in Figure 13 The air handler operated at a 33 duty cycle (20 min off 10 min on) with a ventilation rate of 174 cfm resulting in an average ventilation rate of 58 cfm again meeting the minimum ASHRAE 622 recommendations The whole house appeared to be well-mixed in this case because the decay curves were clustered together throughout the test Even during the 20 minute periods when the air handler was off there was very little divergence A comparison of Figure 12 to Figure 13 indicates that much more uniform distribution of ventilation air was achieved by using the CFIS system
19 of 49
Research Report - 0602
0
2
4
6
8
10
12
14
16
Co
nc
en
trati
on
(m
gm
3 )
Living
Entry
BR1
BR2
BR3
MBR
Mixing stopped
Mixing restarted
185 195 205 215 225 235 05 15 25 35 45 55 65
Hour
Figure 13 Tracer gas decay for 1-story house with supply ventilation at ASHRAE 622 level 33 central fan operation (20 min off 10 min on) and bedroom doors closed (Test
A6)
Reciprocal age-of-air calculations were performed to provide a quantitative comparison of the two ventilation systems as shown in Figure 14 Values were in the range of 0169 hr-1 +0042shy0038 hr-1 for the exhaust ventilation system compared to 0173 hr-1 +0002-0003 hr-1 for the supply ventilation system expressed in terms of the range of differences between the reciprocal age-of-air in each room and the whole-house air change rate With the exhaust ventilation at the laundry room the master bedroom received the greatest amount of fresh air We suspect this may have been caused by the presence of the exhaust ducts used for spot ventilation of the master bathroom possibly providing greater leakage area near the master bathroom than is present in other areas of the house The supply system distributed the ventilation air more uniformly but it is not entirely clear whether this result was primarily caused by the introduction of ventilation air through the supply ducts or by the air handler mixing air throughout the house Since it is clear that the exhaust ventilation showed better uniformity of ventilation with central system mixing it follows that mixing is likely to be the primary factor in the room-to-room uniformity shown by CFIS ventilation
It is also noteworthy that the average net air change rates provided by both the supply and exhaust ventilation systems were only about 018 ACH compared to the 025 ACH that would be expected if the mechanical ventilation rate (017 ACH) and the natural infiltration rate (008 ACH) were additive as they might be with a balanced ventilation system Adding mechanical ventilation to natural infiltration in quadrature results in an estimated average air change rate of 019 ACH which is fairly consistent with the measured values
20 of 49
Research Report - 0602
Recip
rocal
Ag
e o
f A
ir (
1h
r) 025
020
015
010
005
000
Simple Exhaust vs Central Fan Integrated
Supply
Centralized supply mixing
33 duty cycle 100
ASHRAE doors closed
Living
Entry
BR1
BR2
BR3
MBR
Exhaust in utility room no
mixing 100 ASHRAE
doors closed
Figure 14 Reciprocal age-of-air for 1-story house with continuous exhaust ventilation (Test A3) compared to central fan integrated supply ventilation (Test A6)
Air Handler Operation
To determine how much room-to-room mixing was caused by the air handler the exhaust only test was re-run with the air handler operating at 33 duty cycle (20 min off 10 min on) (Test A12) The decay curves are shown in Figure 15 Compared to Test A3 (Figure 12) there was a noticeable increase in uniformity when the air handler was operating even though the entry points for the ventilation air were uncontrolled As shown in Figure 16 the range of reciprocal age of air was reduced from +0042-0038 hr-1 to +0019-0011 hr-1) It appears that operation of the air handler explains most of the difference between the supply and exhaust ventilation systems discussed earlier Although it also appears that the overall average air change rate was higher in the case where the air handler was operating (0216 ACH vs 0176) it should be noted that the average wind speed was also significantly higher It is likely that the wind speed was the primary cause of the difference in average ACH not a difference in the mechanical ventilation rate
21 of 49
Research Report - 0602
0
5
10
15
20
25
30
35
Co
nce
ntr
ati
on
(m
gm
3 )
Living
Entry
BR1
BR2
BR3
MBR
Mixing stopped
Mixing restarted
0 1 2 3 4 5 6 7 8 9 10 11 12 13 14
Hour
Figure 15 Tracer gas decay for 1-story house with continuous exhaust ventilation at ASHRAE 622 level 33 central fan operation (20 min off 10 min on) and bedroom
doors closed (Test A12)
Exhaust Ventilation No Mixing vs 33 Air Handler Duty Cycle
000
005
010
015
020
025
Recip
rocal A
ge o
f A
ir (
1h
r)
Living
Entry
BR1
BR2
BR3
MBR
Exhaust in utility room 33 air handler
no mixing 100 operation exhaust in
ASHRAE doors closed utility room 100
ASHRAE doors closed
Figure 16 Reciprocal age-of-air for 1-story house with continuous exhaust ventilation with and without air handler operation (Tests A3 and A12)
22 of 49
Research Report - 0602
Exhaust Location
The preceding analysis of exhaust ventilation was based on an exhaust point in the laundry room which was relatively centrally located in the 1-story house To examine the effect of moving the exhaust point the duct blaster was moved to the master bathroom which was located in a far corner of the house (Test A16) A continuous exhaust ventilation rate of 58 cfm was again applied to the house resulting in the tracer gas decay curve shown in Figure 17 It is difficult to visually identify a significant difference between this series of curves and those shown in Figure 12 for the laundry room exhaust location
Because the curves were steady it is again possible to compare the results based on reciprocal age-of-air as shown in Figure 18 There appeared to be very little change in the distribution of outside air to most rooms However the reciprocal age-of-air in the master bedroom dropped noticeably when the exhaust location was moved to the master bathroom probably because a greater fraction of the outside air now passed through other rooms before reaching the master bedroom With the exhaust point centrally located most of the ventilation air passing through the master bedroom probably entered from the outside In both cases however the master bedroom had the highest reciprocal age-of-air of all of the rooms in the house and the BR2 location had the lowest
Co
nc
en
tra
tio
n (
mg
m3)
40
35
30
25
20
15
10
5
0
Living
Entry
BR1
BR2
BR3
MBR
Mixing stopped
Mixing restarted
19 20 21 22 23 0 1 2 3 4 5 6 7 8
Hour
Figure 17 Tracer gas decay for 1-story house with exhaust ventilation from the master bathroom at ASHRAE 622 level no central fan operation and bedroom doors closed (Test
A16)
23 of 49
Research Report - 0602
Exhaust Ventilation
Laundry Room vs Master Bathroom
000
005
010
015
020
025
Exhaust in laundry
room no mixing 100
ASHRAE doors closed
Exhaust in master
bathroom no mixing
100 ASHRAE doors
closed
Re
cip
roc
al A
ge
of
Air
(1
hr)
Living
Entry
BR1
BR2
BR3
MBR
Figure 18 Reciprocal age-of-air for 1-story house with exhaust ventilation from the master bathroom compared to the laundry room at ASHRAE 622 level no central fan operation
and bedroom doors closed (Tests A3 and A16)
Ventilation Rate
The supply ventilation test was repeated using flow rates corresponding to 60 and 33 of the ASHRAE recommendations The intent of this series of tests was to evaluate the room-to-room ventilation uniformity for ventilation rates consistent with ASHRAE 622 compared to the uniformity for reduced mechanical ventilation rates Each test was conducted for only 4 hours because of time limitations The decay curves are shown in Figures 19 and 20 Because the rooms were well-mixed during the supply ventilation tests the average whole-house ACH can be compared directly to the reciprocal age-of-air for the exhaust ventilation tests Figure 21 shows the supply ventilation air change rate for each of the three ventilation levels (33 60 100) compared to room-by-room reciprocal age-of-air for the exhaust ventilation system based on the boundary conditions present during the tests It appears that in the supply ventilation case all rooms receive more outside air than the least-ventilated room in the exhaust case (BR2) even at 60 of ASHRAE 622 These results serve to illustrate the trade-off between whole-house ventilation rate and room-to-room ventilation uniformity in terms of their impact on the worst room(s)
24 of 49
Research Report - 0602
The ASHRAE 622 committee has not currently defined the level of mixing that is required when choosing the minimum ventilation rate Some might interpret the results of this test to suggest that a house without mixing can have individual rooms that do not receive sufficient outside air even though the ventilation system is operating at 622 specified rates Because the 622 committee has not specified the level of mixing that is required when choosing the minimum ventilation rate the ventilation rate required by different ventilation systems is open to interpretation For example if the exhaust system performance shown in Figure 21 is acceptable does this mean that a ventilation system that provides good distribution of outside air may be sufficiently well-ventilated at 60 of the ASHRAE 622 level or perhaps even less Alternatively it might be concluded that exhaust ventilation rates should be increased over current ASHRAE 622 recommendations because of the possibility that certain rooms may receive very little fresh air Unfortunately because the current 622 standard does not specify air mixing requirements and the committeersquos assumptions about ventilation air distribution are not well documented it is difficult to make any firm recommendations in this area However we can conclude that air mixing is required for dilution ventilation systems to provide predictable results independent of the geometry of individual homes
8 9 10 11 12 13 14
Hour
Figure 19 Tracer gas decay for 1-story house with supply ventilation at 60 of ASHRAE 622 level 33 central fan operation (20 min off 10 min on) and bedroom doors closed
(Test A4)
0
10
20
30
40
50
60
Co
nce
ntr
ati
on
m
gm
3
Living
Entry
BR1
BR2
BR3
MBR
Mixing stopped
Mixing restarted
25 of 49
Research Report - 0602
0
5
10
15
20
25
30
Co
nce
ntr
ati
on
(m
gm
3 )
Living
Entry
BR1
BR2
BR3
MBR
Mixing stopped
Mixing restarted
12 13 14 15 16 17 18 19 20
Hour
Figure 20 Tracer gas decay for 1-story house with supply ventilation at 33 of ASHRAE 622 level 33 central fan operation (20 min off 10 min on) and bedroom doors closed
(Test A5)
Simple Exhaust vs Central Fan Integrated
Supply with Lower Ventilation Rates
025
Re
cip
roc
al A
ge
of
Air
(1
hr)
Well Mixed
100
ASHRAE 60
ASHRAE 33
ASHRAE Living Entry 010 Natural
BR1 Infilt
BR2 BR3 005
MBR
Exhaust in laundry room no
000
Central supply Natural infil-
mixing 100 ASHRAE doors mixing 33 duty tration doors
closed cycle doors closed open
Figure 21 Reciprocal age-of-air for 1-story house with supply ventilation at 33 60 and 100 of ASHRAE 622 level (Tests A5 A4 A6) compared to exhaust ventilation with
no central fan operation (Test A3) Bedroom doors were closed
020
015
26 of 49
Research Report - 0602
Simulations by Walker (2006) have shown that all systems will not provide the same service in terms of annual average air change rate For the same air flow rate and duty cycle balanced ventilation will yield a higher average air exchange than supply ventilation and supply ventilation will yield a higher average air exchange than exhaust ventilation That can be explained in general terms by understanding that wind and stack effects act to depressurize a building most of the time Exhaust fans increase the building depressurization further but supply fans decrease the depressurization Balanced fans donrsquot change the enclosure differential pressure and air flow at all Because of the non-linear relationship between differential pressure and air flows across the building enclosure a supply fan changes the pressures across the enclosure less than an exhaust fan acting more like a balanced fan The result is that the effect on ventilation air change rate from a supply fan is somewhere between that of an exhaust fan and a true balanced system
Bedroom Doors
Except for the natural ventilation test the preceding tests were all conducted with the bedroom doors closed to simulate a worst-case situation for air circulation within the house The exhaust ventilation test was repeated with the bedroom doors open (Test A9) producing the tracer gas decay curve shown in Figure 22 It is evident that the decay curves were much more tightly bundled with the doors open than they were with the doors closed (compare Figure 12) A comparison based on reciprocal age-of-air is shown in Figure 23 A significant improvement in room-to-room mixing is evident during the open-door test
It is also evident that the average air change rate was higher when the doors were open (0202 vs 0176 ACH) but it must be remembered that the ventilation rate was controlled using a duct blaster and average wind speed was higher during the open-door test period compared to the closed-door test period (20 mph compared to 06 mph) Therefore this test alone does not necessarily indicate that closing doors reduces the average air change rate associated with an exhaust system In future tests continuous measurement of the depressurization of the house with respect to outside along with single-point pressure measurements across interior doors would provide more information about the effect of closing doors when exhaust ventilation systems are used It would also be valuable to conduct this test during steady weather conditions using the exhaust fan (with uncontrolled ventilation rate) instead of the duct blaster to observe the net effect of closed doors on whole-house air change rate
27 of 49
Research Report - 0602
0
5
10
15
20
25
30
Co
ncen
trati
on
(m
gm
3 )
Living
Entry
BR1
BR2
BR3
MBR
Mixing stopped
Mixing restarted
181 191 201 211 221 231 01 11 21 31 41 51 61 71
Hour
Figure 22 Tracer gas decay for 1-story house with exhaust ventilation from the laundry room at ASHRAE 622 level no central fan operation and bedroom doors open (Test A9)
Exhaust Ventilation
Doors Closed vs Doors Open
000
005
010
015
020
025
Re
cip
roc
al
Ag
e o
f A
ir (
1h
r)
Living
Entry
BR1
BR2
BR3
MBR
Exhaust in laundry room Doors open no mixing
no mixing 100 exhaust in laundry room
ASHRAE doors closed 100 ASHRAE
Figure 23 Reciprocal age-of-air for 1-story house with exhaust ventilation from the laundry room at ASHRAE 622 level no central fan operation In the first case the bedroom doors were closed (Test A3) in the second the doors were open (Test A9)
28 of 49
Research Report - 0602
Transfer Grilles
Because the test houses used central returns instead of hard ducted returns in the bedrooms transfer grilles were installed over the bedroom doors to provide a flow path for return air without excessive room pressurization when the doors were closed These transfer grilles also allowed ventilation air to pass more freely from the bedrooms to the main living space The effect of transfer grilles on ventilation air distribution was evaluated by taping over the grilles (see Figure 24) and re-running the exhaust ventilation test (Test A10) The corresponding tracer gas decay curve is shown in Figure 25 and the reciprocal age-of-air analysis is shown in Figure 26 Taping the transfer grilles did not appear to significantly affect the room-to-room variability in ventilation rate although there appeared to be some slight re-ranking of rooms from highest to lowest reciprocal age-of-air It should be noted that there was an increase in average wind speed from 26 mph to 41 mph starting at 1 pm including a half hour period where the average wind speed was 7 mph This weather effect produced noticeable kinks in the decay curves and therefore would be expected to introduce significant errors into the reciprocal age-of-air results
Itrsquos possible that the transfer grilles played a much smaller role in providing a path for ventilation air than the supply ducts Because the air handler was not operating the ducts were not pressurized and were thus available as passive airflow conduits The resistance to air flow was probably smaller for the air ducts than for the transfer grilles depending on their size and the number of supply registers in each bedroom The existing door undercuts are also thought to have played a role The effect of ducts and door undercuts can be tested in the future by running separate tests with ducts and door undercuts taped over
copy buildingsciencecom
Figure 24 Transfer grilles over bedroom doors taped closed
29 of 49
Research Report - 0602
0
10
20
30
40
50
60
70
Co
nc
en
tra
tio
n (
mg
m3 )
Living
Entry
BR1
BR2
BR3
MBR
Mixing stopped
Mixing restarted
8 9 10 11 12 13 14 15 16 17
Hour
Figure 25 Tracer gas decay for 1-story house with exhaust ventilation from the laundry room at ASHRAE 622 level no central fan operation bedroom doors closed and transfer
grilles taped (Test A10)
Exhaust Ventilation
000
005
010
015
020
025
Re
cip
roc
al
Ag
e o
f A
ir (
1h
r)
Living
Entry
BR1
BR2
BR3
MBR
Transfer Grilles Untaped vs Taped
Exhaust in laundry room no Exhaust in laundry room no
mixing 100 ASHRAE mixing 100 ASHRAE
doors closed doors closed transfer
grilles taped
Figure 26 Reciprocal age-of-air for 1-story house with exhaust ventilation from the laundry room at ASHRAE 622 level no central fan operation and doors closed In the
30 of 49
Research Report - 0602
first case the transfer grilles are untaped (Test A3) in the second they are taped closed (Test A10)
Minimum Test Duration
We were fortunate that DR Horton provided two full weeks of access to these homes to conduct this series of tests which allowed us to run some of the more important tracer gas decay tests as long as 12 hours to help ensure that we could accurately calculate reciprocal age-of-air In most cases test houses would not be available for such a long time period To evaluate the length of time needed to estimate the reciprocal age-of-air with reasonable accuracy we examined the results that we would have obtained for one of the exhaust ventilation tests had we halted the test period after less than 12 hours For the supply ventilation tests the rooms were sufficiently well-mixed that the test could have been stopped after 3 or 4 hours assuming weather effects were steady
The reciprocal age-of-air calculations for the exhaust ventilation decay curves (Test A3 see Figure 12) based on test durations of 3 6 9 and 12 hours are shown in Figure 27 These test durations range from 053 to 21 air changes based on the average air change rate of 018 ACH (56 hours per air change) calculated for this test The ratio of highest to lowest reciprocal ageshyof-air is shown above the data points for each case These results suggest that shorter tests tend to overestimate the range and that perhaps 1frac12-2 air changes (roughly 9 to 12 hours in this case) may be necessary to obtain accurate calculations of reciprocal age-of-air when there is significant divergence among rooms From a qualitative standpoint one air change may be sufficient to determine the basic trend Without knowing in advance what mixing pattern will occur it is difficult to recommend a minimum test duration But assuming this test is fairly representative of a worst-case scenario a minimum of 15 air changes would be necessary to have a high degree of confidence in the quantitative difference in reciprocal age-of-air among rooms
31 of 49
Research Report - 0602
000
005
010
015
020
025
030
035
Re
cip
roc
al
Ag
e-O
f-A
ir (
hr-1
)
Living
Entry
BR1
BR2
BR3
MBR HighLow = 297
HighLow = 168 HighLow = 184 HighLow = 161
3-hour Test 6-hour Test 9-hour Test 12-hour Test
(053 Air Changes) (11 Air Changes) (16 Air Changes) (21 Air Changes)
Test Duration
Figure 27 Reciprocal age-of-air based on alternate test durations for 1-story house with exhaust ventilation from the laundry room at ASHRAE 622 level no central fan operation
and doors closed (Test A3) Average air change rate was 018 ACH
TEST RESULTS FROM 2-STORY HOUSE (1117 MONTAGUE)
The 2-story house was tested from January 3-10 2006 Three zones were selected on the first floor and three more were selected on the second floor as indicated by the red stars in Figure 4 The initial mixing of air among the rooms at the start of each test in this 2-story house was not as thorough as it was in the 1-story house Evidently the combined effects of the air handler and the portable de-stratification fan were not sufficient to overcome upward transport of tracer gas driven by the stack effect from the first to the second floor The resulting difference in initial tracer gas concentration among the rooms was about 5-10 This outcome emphasizes the significant effect of stack-driven infiltration on ventilation non-uniformity in multi-story homes Because our test method and equipment did not achieve a well-mixed condition at the start of each test there were some errors introduced into the reciprocal age-of-air analysis For future tests we would recommend larger de-stratification fans to obtain more well-mixed conditions in multi-story houses
Typical errors introduced by incomplete mixing of the tracer gas at the start of such a test were analyzed by examining two hypothetical cases where either all of the air entering a room comes from the outside or all of the air comes from an adjacent room with a different starting concentration If all of the air entering a space comes from the outside then a change in the initial concentration would have no effect on the reciprocal age-of-air because the decay curve would be exponential from the start and the area under the curve would be normalized based on
32 of 49
Research Report - 0602
the starting concentration in that zone However if the air entering a room passes through another room with a lower initial concentration the room receiving the air will have a lower concentration of tracer gas throughout the test compared to what the concentration would have been if the starting points were the same in both rooms This case is illustrated in Figure 28 where assumptions are made that the rooms are the same size the air exchange rate is 01 ACH for both rooms and the initial tracer gas concentration is 10 lower in the first room (upstream) than it is in the second room
The effect on reciprocal age-of-air is shown in Figure 29 A 10 difference in starting concentration results in an error of about 75 in reciprocal age-of-air for a room downstream of a room with a lower starting concentration assuming 01 ACH for both rooms The error would be somewhat smaller (about 5) if the air change rate was higher for both rooms (02 ACH) There would be no error introduced for rooms where all of the air infiltration comes from the outside Although the amount of error in the reciprocal age-of-air calculations can be affected by additional variables not examined here we feel that these percentages are reasonable estimates of the errors in our results for the 2-story house due to incomplete initial mixing of air
In each case an engineering judgment must be made regarding the significance of the error introduced by incomplete initial mixing As a general rule the differences in concentration at the start of the test should be small compared to the differences that are being measured in order for the results to be considered valid
Figure 28 Theoretical decay curves for a well-mixed case with uniform tracer gas concentration compared to a case where the upstream room starts with a concentration
10 lower than the downstream room
33 of 49
Research Report - 0602
Figure 29 Theoretical reciprocal age-of-air for a well-mixed case with uniform tracer gas concentration compared to a case where the upstream room starts with a concentration
10 lower than the downstream room
Natural Infiltration and Duct Leakage
A natural infiltration test was performed over a two hour period on the evening of January 8 (Test B14) The tracer gas decay curves are shown in Figure 30 There was a slight divergence between the first floor and second floor once the air handler was turned off but the rooms on each floor appeared to remain fairly well-mixed The average air change rate during the test period was about 011 ACH which was somewhat higher than the 1-story house as might be expected with an increased stack height
An air handler bedroom door bump test was conducted just prior to the test period shown in Figure 30 allowing observation of the combined effect of duct leakage to the outside and increased infiltration caused by room pressurization The average air change rate during that bump test was 013 ACH suggesting that closing doors and operating the fan added approximately 002 ACH to the whole-house average air change rate The average wind speed was a bit higher while the air handler was running (17 mph compared to 05 mph) so the effect of air handler operation may actually be somewhat less than the average ACH numbers indicate
34 of 49
Research Report - 0602
0
1
2
3
4
SF
6 C
on
ce
ntr
ati
on
(m
gm
3)
BR1
Living
Kitchen
BR2
BR3
MBR
Mixing stopped
Mixing restarted
1814 1843 1912 1940 2009 2038 2107 2136
Hour
Figure 30 Tracer gas decay for 2-story house with no ventilation no central fan operation and bedroom doors open (Test B14)
Distributed Supply vs Point Exhaust Ventilation
A 14-hour test (Test B1) was performed with an exhaust ventilation rate of 63 cfm in the laundry room which was located near the stairwell in the middle of the first floor The ventilation rate was again consistent with the ASHRAE 622 recommendations The tracer gas decay curves are shown in Figure 31 It is interesting that all three second floor rooms showed a delay before entering an exponential decay suggesting that some amount of air was moving from the first floor to the second floor even though the mechanical exhaust point was on the first floor It appears that the further depressurization of the first floor was insufficient to overcome the stack effect and draw a significant amount of outside air in through the rooms on the second floor
35 of 49
Research Report - 0602
182
9
192
9
202
9
212
9
222
9
232
9
029
129
229
329
429
529
629
729
828
929
102
8
112
8
122
8
0
10
20
30
40
50
60
70
SF
6 C
on
ce
ntr
ati
on
(m
gm
3)
BR1
Living
Kitchen
BR2
BR3
MBR
Mixing stopped
Mixing restarted
Hour
Figure 31 Tracer gas decay for 2-story house with exhaust ventilation from the laundry room at ASHRAE 622 level no central fan operation and bedroom doors closed (Test B1)
A supply ventilation test was performed on the 2-story house for about 11 hours starting late on January 4 (Test B3) The duct blaster was unable to provide the ventilation rate necessary to meet the minimum specified in ASHRAE 622 supplying 180 cfm instead of 189 cfm (95) The decay curves are shown in Figure 32 Although the curves are much more tightly packed than they were with the exhaust system there is more divergence than we saw with the supply system in the 1-story house most notably in the master bedroom
The reciprocal age-of-air calculations for both the exhaust and supply ventilation systems are shown in Figure 33 Again the results indicate that much better room-to-room distribution of ventilation air was achieved by the central-fan integrated supply system compared to the single-point exhaust system However for the supply ventilation test the differences in the initial tracer gas concentration were of the same magnitude as the differences in decay rates among the rooms As a result no conclusions should be drawn about the relative ranking of the supply ventilation rate among rooms based on Figure 33
36 of 49
Research Report - 0602
0
10
20
30
40
50
60
SF
6 C
on
ce
ntr
ati
on
(m
gm
3)
BR1
Living
Kitchen
BR2
BR3
MBR
Mixing stopped
Mixing restarted
2136 000 224 448 712 936 1200
Hour
Figure 32 Tracer gas decay for 2-story house with supply ventilation just under ASHRAE 622 level central fan operation at 33 duty cycle (20 min off 10 min on) and bedroom
doors closed (Test B3)
Simple Exhaust vs Central Fan Integrated
Supply )
000
005
010
015
020
025
Recip
rocal A
ge o
f A
ir (
1h
r
BR1
Living
Kitchen
BR2
BR3
MBR
Exhaust in laundry room no Centralized supply mixing
mixing 100 ASHRAE 33 duty cycle 95
doors closed ASHRAE doors closed
Figure 33 Reciprocal age-of-air for 2-story house with continuous exhaust ventilation (Test B1) compared to central fan integrated supply ventilation (Test B3) (Note
Uncertainties introduced by non-uniform starting concentration are of the same order of magnitude as the differences in reciprocal age-of-air among rooms for the supply ventilation case The relative ranking of rooms is not meaningful for that case)
37 of 49
Research Report - 0602
Air Handler Operation
The effect of occasional air handler operation on the distribution of exhaust ventilation air was evaluated on the afternoon of January 6 (Test B6) The tracer gas decay curves are shown in Figure 34 and reciprocal age-of-air calculations are shown in Figure 35 It should again be noted that before the test started the house was mixed using both the air handler and a de-stratification fan with the doors open During the test the doors were closed the de-stratification fan was turned off and the air handler operated at a 33 duty cycle (20 minutes off 10 minutes on) As was the case in the 1-story house this occasional operation of the air handler substantially improved the distribution of ventilation air among rooms even in conjunction with the point exhaust ventilation system There was very little divergence noticeable even with the air handler cycling on and off every half hour However because the initial differences in tracer gas concentration among rooms were as large as the differences in reciprocal age-of-air for the case with air handler operation no conclusions should be drawn about the relative ranking of ventilation rates among the rooms for that case
SF
6 C
on
cen
trati
on
(m
gm
3)
80
70
60
50
40
30
20
10
0
BR1
Living
Kitchen
BR2
BR3
MBR
Mixing stopped
Mixing restarted
1048 1200 1312 1424 1536 1648 1800 1912 2024
Hour
Figure 34 Tracer gas decay for 2-story house with continuous exhaust ventilation at ASHRAE 622 level central fan operation at 33 duty cycle (20 min off 10 min on) and
bedroom doors closed (Test B6)
38 of 49
Research Report - 0602
020
015 R
ec
ipro
ca
l A
ge
of
Air
(1
hr)
Exhaust Ventilation
No Mixing vs 33 Air Handler Duty Cycle
Exhaust in laundry room
no mixing 100
ASHRAE doors closed
33 air handler
operation exhaust in
laundry room 100
ASHRAE doors closed
BR1
Living
Kitchen
BR2
BR3
MBR
010
005
000
Figure 35 Reciprocal age-of-air for 2-story house with continuous exhaust ventilation with and without air handler operation (Tests B1 and B6) (Note Uncertainties introduced by non-uniform starting concentration are of the same order of magnitude as the differences in reciprocal age-of-air among rooms for the case with air handler operation The relative
ranking of rooms is not meaningful for that case)
Exhaust Location
The duct blaster was moved to the master bathroom exhaust register to see if there was a resulting change in ventilation air distribution (Test B18) The master bathroom was in the back of the house on the second floor between the master bedroom and bedroom 3 The decay curves are shown in Figure 36 and the reciprocal age-of-air results are shown in Figure 37 The rooms on each floor were well mixed before the test began although the mixing between the two floors was not as good Very wide divergence among rooms can be seen during the test especially between the upstairs bedrooms and the rest of the house Once again all three upstairs rooms appear to receive some air from the first floor but the master bedroom experiences a much higher volume of circulated air than the other two second-floor bedrooms which appear to be relatively stagnant
39 of 49
Research Report - 0602
0
10
20
30
40
50
60
70
80
90
SF
6 C
on
ce
ntr
ati
on
(m
gm
3)
BR1
Living
Kitchen
BR2
BR3
MBR
Mixing stopped
Mixing restarted
1912 2136 000 224 448 712 936 1200
Hour
Figure 36 Tracer gas decay for 2-story house with exhaust ventilation from the master bathroom at ASHRAE 622 level no central fan operation and bedroom doors closed (Test
B18)
Exhaust Ventilation
Laundry Room vs Master Bathroom
000
005
010
015
020
025
030
Exhaust in laundry room no
mixing 100 ASHRAE
doors closed
Exhaust in master bathroom
no mixing 100 ASHRAE
doors closed
Re
cip
roc
al A
ge
of
Air
(1
hr)
BR1
Living
Kitchen
BR2
BR3
MBR
Figure 37 Reciprocal age-of-air for 2-story house with exhaust ventilation from the master bathroom compared to the laundry room at ASHRAE 622 level no central fan operation
and bedroom doors closed (Tests B1 and B18)
40 of 49
Research Report - 0602
Ventilation Rate
The supply ventilation tests were repeated using flow rates of 60 and 33 of ASHRAE 622 recommendations corresponding to 114 cfm and 63 cfm respectively (Tests B2 and B4) The decay curves are shown in Figures 38 and 39 Reciprocal age-of-air for all three supply ventilation rates are shown in Figure 40 In all cases the rooms remained fairly well mixed especially rooms on the same floor As we observed in the 1-story house the ventilation rate in the 2-story house appeared to have very little effect on the uniformity of outside air provided to each room as long as it was mixed using the air handler One again the initial differences in tracer gas concentration among rooms were as large as the divergence in the decay curves preventing any conclusions about the relative ranking of ventilation rates among rooms for all three cases The error in initial concentration uniformity was bigger for the cases with air handler mixing because the relative divergence in the decay curves was so small compared to that of no air handler mixing In other words the error in relative ranking of ventilation rates for the cases with air handler mixing were not very important anyway because the relative differences between rooms were so small
1536 1648 1800 1912 2024 2136 2248
Hour
Figure 38 Tracer gas decay for 2-story house with supply ventilation at 60 of ASHRAE 622 level 33 central fan operation (20 min off 10 min on) and bedroom doors closed
(Test B2)
0
5
10
15
20
25
30
SF
6 C
on
cen
trati
on
(m
gm
3)
BR1 Living Kitchen BR2 BR3 MBR
Mixing stopped
Mixing restarted
41 of 49
Research Report - 0602
0
5
10
15
20
25
30
35
40
SF
6 C
on
cen
trati
on
(m
gm
3)
BR1
Living
Kitchen
BR2
BR3
MBR
Mixing stopped
Mixing restarted
1200 1312 1424 1536 1648 1800 1912
Hour
Figure 39 Tracer gas decay for 2-story house with supply ventilation at 33 of ASHRAE 622 level 33 central fan operation (20 min off 10 min on) and bedroom doors closed
(Test B4)
Supply Ventilation Rate Comparison
000
005
010
015
020
025
Re
cip
roc
al
Ag
e o
f A
ir (
1h
r)
BR1
Living
Kitchen
BR2
BR3
MBR
Centralized supply Centralized supply Centralized supply
mixing 33 duty mixing 33 duty mixing 33 duty
cycle 95 ASHRAE cycle 60 ASHRAE cycle 33 ASHRAE
doors closed doors closed doors closed
Figure 40 Reciprocal age-of-air for 2-story house with three levels of supply ventilation central fan operation at 33 duty cycle (20 min off 10 min on) and bedroom doors closed (Tests B3 B2 B4) (Note Uncertainties introduced by non-uniform starting
concentration are of the same order of magnitude as the differences in reciprocal age-of-air among rooms for all three cases The relative ranking of rooms is not meaningful for these
cases)
42 of 49
Research Report - 0602
The average air change rates for the three supply ventilation rates compared to the two exhaust ventilation schemes are shown in Figure 41 The CFIS system at 33 of the 622 ventilation flow rate provided a uniformly higher air change rate (013 ach) than the least ventilated rooms using exhaust ventilation from either the laundry or the master bathroom (010 ach Figure 37) It is noteworthy that the combined net air change rate with exhaust ventilation from the laundry room was significantly less than the air change rates for both exhaust ventilation from the master bathroom and supply ventilation at the air handler This illustrates the unpredictability of interactions between mechanical ventilation and natural infiltration which depend strongly on the distribution and size of cracks through which the outside air must pass to enter the house There may have been a relatively large building enclosure leakage opening near the laundry room (perhaps the utility penetrations or the door to the garage) that allowed a significant amount of outside air to quickly enter and leave the house through the exhaust flow without circulating around the house
0
005
01
015
02
025
Ave
rag
e A
CH
Natural Exhaust Exhaust Supply 95 Supply 60 Supply 33
Laundry Mbath
Rm 100 100
Figure 41 Average air change rates for 2-story house with supply ventilation at 33 60 and 95 of ASHRAE 622 recommendations (Tests B4 B2 B3) compared to natural
infiltration (Test B14) and exhaust ventilation with no central fan operation (Test B1) Bedroom doors were closed except for the natural infiltration test
Bedroom Doors
The laundry room exhaust ventilation test with no air handler operation (see Figure 31) was repeated with the doors open to evaluate the change in room-to-room ventilation air distribution (Test B10) The decay curves are shown in Figure 42 and the reciprocal age-of air calculations are shown in Figure 43 It is evident from Figure 42 that the test began before the rooms were
43 of 49
Research Report - 0602
0
5
10
15
20
25
SF
6 C
on
ce
ntr
ati
on
(m
gm
3)
BR1 Living Kitchen BR2 BR3 MBR
Mixing stopped
Mixing restarted
completely well mixed resulting in decay curves that could be somewhat misleading Because the master bedroom was at a higher concentration than the other rooms at the start of the test any room that received air from the master bedroom would appear to have a slower decay rate than it would have if the rooms started out at the same concentration Despite the difference in starting concentration it is clear that outside air was well distributed when the doors were open even without operation of the air handler
1843 1912 1940 2009 2038 2107 2136 2204 2233 2302
Hour
Figure 42 Tracer gas decay for the 2-story house with exhaust ventilation from the laundry room at ASHRAE 622 level no central fan operation and bedroom doors open
(Test B10)
Reciprocal age-of-air analysis was not performed for this case because of the combined effect of a short test duration (~2 hours) and unequal starting tracer gas concentrations even though the house was relatively well-mixed The important conclusion (that opening doors greatly improves mixing) can be drawn by inspecting the decay curves alone
Transfer Grilles
A final exhaust ventilation test was run on the 2-story house with the doors closed and the transfer grilles taped over The decay curves are shown in Figure 43 and the reciprocal age-ofshyair calculations are shown in Figure 44 The curves were clearly very divergent even after 12 hours By examining the reciprocal age-of-air results it is apparent that the transfer grilles in the 2-story house caused a noticeable improvement in ventilation air distribution but the improvement was smaller than when the doors were opened (Figure 42)
44 of 49
Research Report - 0602
0
5
10
15
20
25
30
SF
6 C
on
cen
tra
tio
n (
mg
m3
) BR1 Living Kitchen BR2 BR3 MBR
Mixing stopped
Mixing restarted
1648 1912 2136 000 224 448 712 936
Hour
Figure 43 Tracer gas decay for 2-story house with exhaust ventilation from the laundry room at ASHRAE 622 level no central fan operation bedroom doors closed transfer
grilles taped closed (Test B7)
Exhaust Ventilation Transfer Grilles Untaped vs Taped
000
005
010
015
020
Re
cip
roc
al
Ag
e o
f A
ir (
1h
r)
BR1
Living
Kitchen
BR2
BR3
MBR
Exhaust in laundry room no Exhaust in laundry room no
mixing 100 ASHRAE mixing 100 ASHRAE
doors closed doors closed transfer
grilles taped
Figure 44 Reciprocal age-of-air for 2-story house with exhaust ventilation from the laundry room at ASHRAE 622 level no central fan operation and doors closed In the first case the transfer grilles are untaped (Test B3) in the second they are taped closed
(Test B7)
45 of 49
Research Report - 0602
CONCLUSIONS
bull Reciprocal age-of-air analysis was chosen as a quantitative method for characterizing distribution of ventilation air among rooms This method worked well in cases where rooms were well mixed to begin the test and weather conditions were sufficiently steady-state
bull A test period of at least 1frac12 air changes was necessary to obtain reasonably accurate ageshyof-air results when there was significant divergence in tracer gas concentration among the rooms
bull Although we did not achieve uniform initial concentration of tracer gas in the 2-story house using our test methodology and the equipment at hand we believe the reciprocal age-of-air calculations were meaningful in many of the cases as indicated in the discussion
bull Both houses were relatively tight with natural infiltration averaging 008 ACH for the 1shystory house and 011 ACH for the 2-story house
bull Both houses had relatively small (but not negligible) duct losses to the outside producing an increase in infiltration of less than 003 ACH for the 1-story house and 002 ACH for the 2-story house when the air handler runs
bull Age-of-air analysis indicated that ventilation supplied through the central air distribution system provided much more uniform distribution of ventilation air than the single-point exhaust system when the doors were closed and the air handler was not running For the 1-story house the central-fan-integrated supply ventilation case at 60 of ASHRAE 622 provided more outside air to all rooms than the least-ventilated room in the exhaust case at 100 of 622 For the 2-story house the central-fan-integrated supply system at 33 of the 622 flow rate provided more outside air to all rooms than the least ventilated rooms using exhaust ventilation at 100 of 622 from either the laundry or the master bathroom
bull Operation of the central fan at a 33 duty cycle maintained relatively well-mixed conditions regardless of ventilation rate type of ventilation system (supply or exhaust) or house configuration (1-story or 2-story)
bull Exhaust location affected both the relative amount of outside air received by different rooms and the overall uniformity among rooms but the effect was not predictable
bull For exhaust-only ventilation without central fan operation opening bedroom doors appeared to significantly improve the mixing of ventilation air among rooms
bull Transfer grilles improved the distribution of ventilation air slightly but much less than opening the bedroom doors
bull In the 2-story house the stack effect caused air movement from the first floor to the second floor even when exhaust ventilation was applied to the first floor resulting in consistently higher tracer gas concentrations on the second floor and more non-uniform ventilation air distribution in general
bull Interactions between natural infiltration and both exhaust and supply mechanical ventilation were very significant When the ventilation system was activated the combined air change rate did not increase commensurate with the measured ventilation rate but instead increased by only half that amount This result was consistent with combining ventilation and infiltration in quadrature to estimate whole-house air change rate in accordance with ASHRAE Standard 136 (ASHRAE 1993)
46 of 49
Research Report - 0602
FUTURE WORK
In future tests continuous monitoring of pressure differentials would enhance our understanding of the multi-zone combined infiltration and ventilation systems and our ability to model them That would help to explain differences between tests in more detail including the effects of multiple stories location of ventilation supply outlets and exhaust inlets interior door closure and use of passive return air transfer grilles Pressure differential measurement points should include
bull dP with respect to outside for each closed room and open space bull dP across closed interior doors bull dP between the floor cavity and outdoors and bull dP between the house and the attic
Measurement of wind direction along with wind speed could also be helpful for modeling these buildings and systems However because of micro-climate wind shielding it may be very difficult to relate a single-point wind direction measurement to actual wind vectors on the building surfaces
ACKNOWLEDGMENTS
The authors express their appreciation to Rich Coyle of DR Horton for providing the test houses and to Joseph Lstiburek of BSC Subrato Chandra and Neil Moyer of FSEC and Greg Barker of Mountain Energy Partnership for their assistance in the planning and execution of this ventilation study
47 of 49
Research Report - 0602
REFERENCES
ASHRAE (1993) ANSIASHRAE Standard 136-1993 A Method of Determining Air Change Rates in Detached Dwellings Atlanta GA American Society of Heating Refrigerating and Air-Conditioning Engineers Inc
ASHRAE (1997) ANSIASHRAE Standard 129-1997 Measuring Air-Change Effectiveness Atlanta GA American Society of Heating Refrigerating and Air-Conditioning Engineers Inc
ASHRAE (2004) ASHRAE Standard 622-2004 Ventilation and Acceptable Indoor Air Quality in Low-Rise Residential Buildings Atlanta GA American Society of Heating Refrigerating and Air-Conditioning Engineers Inc
CSA (2003) CANCSA F326-M91 Residential Mechanical Ventilation Systems Canadian Standards Association Ontario Canada httpwwwcsashyintlorgonlinestoreGetCatalogItemDetailsaspmat=2410793ampParent=102
NBC 2005 National Building Code of Canada httpircnrcshycnrcgccapubscodesnrcc47666_ehtml
Grieve PW (1991) Measuring Ventilation Using Tracer-Gases Denmark Bruumlel amp Kjaeligr
MN Chapter 7672 Minnesota Energy Code Chapter 7672 Detached Single-Family And Two-Family Dwellings httpwwwstatemnusmnexternalDocsCommerceChapter_7672_Residential_111302012428 _72rulepdf
Persily AK Martin SR (2000) A Modeling Study of Ventilation in Manufactured Houses Gaithersburg MD National Institute of Standards and Technology NISTIR 6455
Rudd A Lstiburek J (2000) ldquoMeasurement of Ventilation and Interzonal Distribution in Single-Family Homesrdquo ASHRAE Transactions 2000 MN-00-10-3 V 106 Pt2 American Society of Heating Refrigeration and Air-Conditioning Engineers Atlanta GA
WAC (2004) Washington State Title 51 WAC Community trade and economic development department of (building code council) Chapter 51-13 Ventilation and indoor air quality httpappslegwagovWACdefaultaspxcite=51-13
48 of 49
Research Report - 0602
Field test of room-to-room uniformity of ventilation air distribution in two new houses
About this Report
This report was prepared for the US Department of Energyrsquos Building America
Program The report is freely available to the public at wwwbuildingamericagov
The authors express their appreciation to Rich Coyle of DR Horton for providing the test houses and to Joseph Lstiburek of BSC Subrato Chandra and Neil Moyer of
FSEC and Greg Barker of Mountain Energy Partnership for their assistance in the planning and execution of this ventilation study
About the Authors
Robert Hendron Ren Anderson Dennis Barley are with National Renewable Energy Laboratory Armin Rudd and Aaron Townsend are with Building Science Corporation
Ed Hancock is with Mountain Energy Partnership
Direct all correspondence to Building Science Corporation 30 Forest Street Somerville MA 02143
Limits of Liability and Disclaimer of Warranty
Building Science documents are intended for professionals The author and the publisher of this article have used their best efforts to provide accurate and authoritative information in regard to the subject matter covered The author and publisher make no warranty of any kind expressed or implied with regard to the information contained in this article
The information presented in this article must be used with care by professionals who understand the implications of what they are doing If professional advice or other expert assistance is required the services of a competent professional shall be sought The author and publisher shall not be liable in the event of incidental or consequential damages in connection with or arising from the use of the information contained within this Building Science document
49 of 49
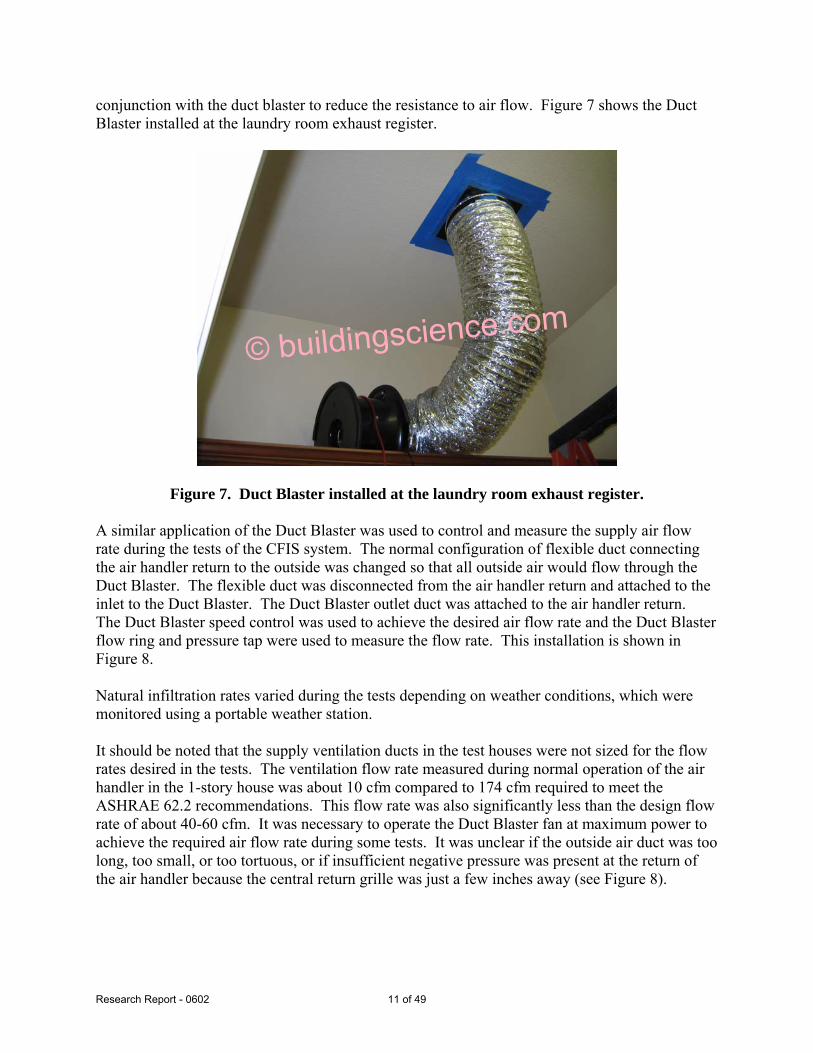
Research Report - 0602
conjunction with the duct blaster to reduce the resistance to air flow Figure 7 shows the Duct Blaster installed at the laundry room exhaust register
copy buildingsciencecom
Figure 7 Duct Blaster installed at the laundry room exhaust register
A similar application of the Duct Blaster was used to control and measure the supply air flow rate during the tests of the CFIS system The normal configuration of flexible duct connecting the air handler return to the outside was changed so that all outside air would flow through the Duct Blaster The flexible duct was disconnected from the air handler return and attached to the inlet to the Duct Blaster The Duct Blaster outlet duct was attached to the air handler return The Duct Blaster speed control was used to achieve the desired air flow rate and the Duct Blaster flow ring and pressure tap were used to measure the flow rate This installation is shown in Figure 8
Natural infiltration rates varied during the tests depending on weather conditions which were monitored using a portable weather station
It should be noted that the supply ventilation ducts in the test houses were not sized for the flow rates desired in the tests The ventilation flow rate measured during normal operation of the air handler in the 1-story house was about 10 cfm compared to 174 cfm required to meet the ASHRAE 622 recommendations This flow rate was also significantly less than the design flow rate of about 40-60 cfm It was necessary to operate the Duct Blaster fan at maximum power to achieve the required air flow rate during some tests It was unclear if the outside air duct was too long too small or too tortuous or if insufficient negative pressure was present at the return of the air handler because the central return grille was just a few inches away (see Figure 8)
11 of 49
Research Report - 0602
copy buildingsciencecom
Figure 8 Duct Blaster installed between the outside air duct and the return of the air handler to provide supply ventilation
Test Procedure
The tracer gas used was sulfur hexafluoride (SF6) a stable non-toxic gas that was injected into each house volume from a small compressed gas cylinder carried by hand around the house During the dosing period the furnace fan was used to achieve an initially well-mixed condition with a concentration of about 15 parts per million (PPM) During this period the doors were kept open and a portable de-stratification fan was used in the 2-story house to improve mixing between floors Then the mixing fans were stopped and the divergence in concentration from zone to zone was observed (with doors either open or closed depending on the test objective) Small portable fans in each zone continued running to maintain a well-mixed condition within each zone The interior air temperature in each zone was controlled during the test period using portable electric heaters instead of the furnace so that operation of the air handler could be controlled independently from the demand for heating At the conclusion of the test the whole house was again mixed by opening the doors and turning on the air handler This allowed the calculation of an average whole-house air change rate for each set of test conditions
The tests were planned for rather mild weather to minimize infiltration effects so as to isolate and test the performance of the mechanical ventilation systems The general design goal was to provide the minimum amount of mechanical ventilation recommended by ASHRAE Standard 622-2004 (ASHRAE 2004) (58 cfm for the 1-story house 63 cfm for the 2-story house) and observe the effects of providing central fan integrated supply versus single-point exhaust ventilation operating the central fan closing the bedroom doors and taping the transfer grilles above the doors
12 of 49
Research Report - 0602
The results of the multi-zone tracer gas decay tests are presented graphically as families of decay curves These graphs illustrate the uniformity or non-uniformity of the ventilation effect among the various rooms and allow ranking of the rooms from the least to the most ventilation effect
In addition if the ventilation rates were sufficiently steady for the duration of the test period we used local mean age-of-air analysis to evaluate the results more quantitatively Age-of-air analysis is a well-established approach to testing ventilation rates at various points or in various zones within a building (Grieve 1991) Age-of-air is defined as the average length of time that air molecules have resided within the building The formula for calculating local mean age-ofshyair in a tracer gas decay test is given in ASHRAE Standard 129-1997 (ASHRAE 1997) as follows
Ai = 1 intinfin
Ci (t)dt (1)C0 0
where
i = Index for measurement point representing a well-mixed zone Ai = Local mean age-of-air at point i (hr) C = Concentration of tracer gas (lbmft3) C0 = Initial value of C in well-mixed building (lbmft3) Ci = Time-varying concentration of tracer gas at point i (lbmft3) t = Time (hr)
In order to compare the ventilation rates among the rooms or zones in the home we use the metric Reciprocal Age-of-Air
Reciprocal Age-of-Air = 1Ai (2)
Reciprocal Age-of-Air has units of 1hr and is equivalent to the air change rate (ACH) in a single well-mixed zone (Persily 2000)
The definition of Ai in Equation (1) involves an integral of infinite duration This is handled in the test procedure through a two-step process
Step 1 The tracer gas decay test is continued until (a) the initial transient effects of interzonal airflow have subsided and all of the decay curves resemble simple exponential functions and (b) the tracer concentrations are rather small compared to their initial values so that any extrapolation errors will have a small effect on the result In this field test most of the multi-zone tests were continued for 12 hours These portions of the decay curves were integrated numerically using the trapezoid rule
13 of 49
Research Report - 0602
Step 2 The remaining portions (the tails) of the decay curves were extrapolated to infinity using a simple exponential decay function which was matched to the decay rate of the final portion of each measured decay curve These portions of the curves were integrated analytically
Once the conditions of Step 1 were satisfied the rooms were re-mixed by opening the bedroom doors and operating the air handler This allowed the calculation of an effective whole-house air change rate using the relationship in Equation 3
Average whole-house air change rate (ACH) = ln(C0Cf)∆t (3)
where
Cf = Concentration of tracer gas after rooms are re-mixed (lbmft3) ∆t = Elapsed time between initial and final well-mixed cases (hr)
Test Matrix
The series of test conditions for the 1-story and 2-story houses are described in Tables 2 and 3 Most of the important tests were conducted for a 12-hour period overnight to ensure sufficient accuracy when calculating reciprocal age-of-air
Table 2 Test sequence for 1-story test house
Central fan
cycling Duration Vent Vent flow (min off
Test Date Time (hrs) Config rate (cfm) min on) Doors Notes
A1 Dec 28 AM 3 Exhaust 58 none closed
A2 PM 3 Exhaust 58 2010 closed
A3 overnight 12 Exhaust 58 none closed A4 Dec 29 AM 4 Supply 104 33 2010 closed
duty cycle A5 PM 4 Supply 58 33 duty 2010 closed
cycle A6 overnight 12 Supply 174 33 2010 closed
duty cycle
A7 Dec 30 AM-PM 8 None 0 none open Natural infiltration
A8 PM 2 None 0 none open AH bump
A9 overnight 12 Exhaust 58 none open
A10 Dec 31 AM-PM 6 Exhaust 58 none closed Transfer grills taped
A11 PM 6 Exhaust 58 2010 closed Transfer grills taped
A12 Jan 1 overnight 12 Exhaust 58 2010 closed
A13 PM 6 Exhaust 58 2010 open
A14 overnight 12 Exhaust 58 54 none closed
A15 Jan 2 AM-PM 6 None 0 none closed Natural infiltration
A16 overnight 12 Exhaust 58 none closed Master bath exhaust
14 of 49
Research Report - 0602
Table 3 Test sequence for 2-story test house
Central fan
cycling Duration Vent Vent flow (min off
Test Date Time (hrs) Config rate (cfm) min on) Doors Notes B1 Jan 3 overnight 14 Exhaust 63 none closed
B2 Jan 4 PM 5 Supply 114 33 20 10 closed 60 ASHRAE 622 duty cycle
B3 overnight 11 Supply 180 33 20 10 closed 95 ASHRAE 622 duty cycle
B4 Jan 5 PM 4 Supply 63 33 duty 20 10 closed 33 ASHRAE 622 cycle
B5 overnight 13 Exhaust 63 5010 closed
B6 Jan 6 PM 6 Exhaust 63 2010 closed
B7 overnight 12 Exhaust 63 none closed Transfer grilles taped
B8 Jan 7 AM 4 Exhaust 63 50 10 closed Transfer grilles taped
B9 PM 4 Exhaust 63 none closed Transfer grilles taped extra injection in MBR
B10 PM 2 Exhaust 63 none open
B11 overnight 9 Supply 114 33 20 10 closed Transfer grilles taped duty cycle
B12 Jan 8 PM 3 None 0 100 closed Transfer grilles taped air handler bump test
B13 PM 2 None 0 100 closed Transfer grilles untaped
B14 PM 2 None 0 none open Natural infiltration
B15 overnight 9 Exhaust 63 none closed Master bath exhaust transfer grilles taped
B16 Jan 9 AM 4 Exhaust 63 50 10 closed Master bath exhaust
B17 PM 4 Supply 178 33 20 10 closed duty cycle
B18 overnight 12 Exhaust 63 none closed Master bath exhaust
TEST RESULTS FROM 1-STORY HOUSE (1111 MONTAGUE)
Natural Infiltration
A test of natural infiltration was conducted for an 8-hour period on December 30 to examine the magnitude and variability of outside air entering the house through leaks in the building envelope (Test A7) The tracer gas decay curves are shown in Figure 9 It is evident that the house was very well mixed during this test which allows a running instantaneous calculation of whole-house ACH over the same time period (see Figure 10) Although the air change rate indicated that the house is relatively tight (about 0085 ACH on average) the effect of natural infiltration was far from negligible especially when the wind was blowing This variability of natural infiltration must be kept in mind when interpreting the decay curves and reciprocal age-of-air calculations that follow
15 of 49
Research Report - 0602
An air handler bump test was performed between 1300 and 1500 hours to examine the effect of air handler operation on whole house air exchange rate including duct leakage to the outside and changes in room-to-room pressurization caused by moving air from the supply registers in each room to the central return in the main living area Figure 10 shows both the hourly average ACH and the wind speed during this period At first glance it appears that the air change rate increased by about 003 ACH when the fan was turned on but there was a coincident jump in wind speed that complicates this interpretation There was no corresponding decrease in ACH when the air handler was turned off at 1500 hours Ultimately we cannot conclusively quantify the change in ACH associated with operation of the air handler but it appears to have been no more than 003 ACH
3
Co
ncen
trati
on
(m
gm
)
70
60
50
40
30
20
10
0
Living
Entry
BR1
BR2
BR3
MBR
Air Handler On
Air Handler Off
8 9 10 11 12 13 14 15 16 17 18
Hour
Figure 9 Tracer gas decay for 1-story house with no ventilation and bedroom doors open with and without central fan operation (Test A7)
16 of 49
Research Report - 0602
40016
35014 Air Handler On Air Handler Off
ACH
Wind Speed
Air
Ch
an
ge
Ra
te (
AC
H) 30012
25010
20008
15006
10004
Win
d S
pe
ed
(m
ph
)
002 05
00
8 10 12 14 16 18
000
Hour
Figure 10 Average air change rate for 1-story house with no ventilation no central fan operation and bedroom doors open (Test A7)
The natural ventilation test was repeated on January 2 with the doors closed instead of open (Test A15) providing the decay curves shown in Figure 11 The average air change rate for this case was 0086 ACH calculated based on the two well-mixed cases at the beginning and end of the test It is difficult to compare this number with the doors-open case because it was windy (4-5 mph) for the first few hours of this test However it is very clear that the uniformity of room-toshyroom distribution of outside air was significantly less when the doors were closed even with transfer grilles We did not calculate age-of-air for this test because the test conditions were not sufficiently steady state This fact is very evident at about hour 15 where the BR2 and BR3 curves suddenly begin to diverge from the MBR curve
17 of 49
Research Report - 0602
0
10
20
30
40
50
60
70
80
90
Co
ncen
trati
on
(m
gm
3 )
Living
Entry
BR1
BR2
BR3
MBR
Mixing stopped
Mixing restarted
10 11 12 13 14 15 16 17 18 19
Hour
Figure 11 Tracer gas decay for 1-story house with no ventilation no central fan operation and bedroom doors closed (Test A15)
Distributed Supply vs Point Exhaust Ventilation
Two of the most common ventilation schemes in Building America homes are continuous single-point exhaust ventilation and intermittent central-fan integrated supply (CFIS) ventilation Exhaust ventilation is most commonly installed in a bathroom laundry room or utility room Make-up air enters through the cracks and holes in the building envelope upon depressurization of the house The distribution of outside air in a given room is fairly unpredictable because it depends on the amount of depressurization in the room the number and size of openings in exterior walls and the influence of adjacent rooms Supply ventilation provided by a central-fan integrated system tends to be distributed more uniformly throughout the house However the fan is usually operated on a duty cycle of about 33 to limit the electricity used by the central fan and one of the goals of this testing is to evaluate the effect of that duty cycle on the consistency of the air mixing
The decay curves for a 12-hour overnight test with exhaust ventilation (Test A3) are shown in Figure 12 The exhaust fan register in the laundry room was used as the exhaust point and the Duct Blaster was used to exhaust 58 cfm continuously corresponding to the minimum ventilation rate recommended by ASHRAE for a 2075 ft2 4-bedroom house It is evident from the decay curves that significantly more outside air reached the master bedroom and less reached Bedroom 2 compared to the other rooms in the house
18 of 49
Research Report - 0602
0
2
4
6
8
10
12
14
Co
nc
en
tra
tio
n
mg
m3
Living
Entry
BR1
BR2
BR3
MBR
Mixing stopped
Mixing restarted
17 18 19 20 21 22 23 0 1 2 3 4 5 6
Hour
Figure 12 Tracer gas decay for 1-story house with exhaust ventilation from the laundry room at ASHRAE 622 level no central fan operation and bedroom doors closed (Test A3)
The corresponding decay curves for the central fan integrated supply system (Test A6) are shown in Figure 13 The air handler operated at a 33 duty cycle (20 min off 10 min on) with a ventilation rate of 174 cfm resulting in an average ventilation rate of 58 cfm again meeting the minimum ASHRAE 622 recommendations The whole house appeared to be well-mixed in this case because the decay curves were clustered together throughout the test Even during the 20 minute periods when the air handler was off there was very little divergence A comparison of Figure 12 to Figure 13 indicates that much more uniform distribution of ventilation air was achieved by using the CFIS system
19 of 49
Research Report - 0602
0
2
4
6
8
10
12
14
16
Co
nc
en
trati
on
(m
gm
3 )
Living
Entry
BR1
BR2
BR3
MBR
Mixing stopped
Mixing restarted
185 195 205 215 225 235 05 15 25 35 45 55 65
Hour
Figure 13 Tracer gas decay for 1-story house with supply ventilation at ASHRAE 622 level 33 central fan operation (20 min off 10 min on) and bedroom doors closed (Test
A6)
Reciprocal age-of-air calculations were performed to provide a quantitative comparison of the two ventilation systems as shown in Figure 14 Values were in the range of 0169 hr-1 +0042shy0038 hr-1 for the exhaust ventilation system compared to 0173 hr-1 +0002-0003 hr-1 for the supply ventilation system expressed in terms of the range of differences between the reciprocal age-of-air in each room and the whole-house air change rate With the exhaust ventilation at the laundry room the master bedroom received the greatest amount of fresh air We suspect this may have been caused by the presence of the exhaust ducts used for spot ventilation of the master bathroom possibly providing greater leakage area near the master bathroom than is present in other areas of the house The supply system distributed the ventilation air more uniformly but it is not entirely clear whether this result was primarily caused by the introduction of ventilation air through the supply ducts or by the air handler mixing air throughout the house Since it is clear that the exhaust ventilation showed better uniformity of ventilation with central system mixing it follows that mixing is likely to be the primary factor in the room-to-room uniformity shown by CFIS ventilation
It is also noteworthy that the average net air change rates provided by both the supply and exhaust ventilation systems were only about 018 ACH compared to the 025 ACH that would be expected if the mechanical ventilation rate (017 ACH) and the natural infiltration rate (008 ACH) were additive as they might be with a balanced ventilation system Adding mechanical ventilation to natural infiltration in quadrature results in an estimated average air change rate of 019 ACH which is fairly consistent with the measured values
20 of 49
Research Report - 0602
Recip
rocal
Ag
e o
f A
ir (
1h
r) 025
020
015
010
005
000
Simple Exhaust vs Central Fan Integrated
Supply
Centralized supply mixing
33 duty cycle 100
ASHRAE doors closed
Living
Entry
BR1
BR2
BR3
MBR
Exhaust in utility room no
mixing 100 ASHRAE
doors closed
Figure 14 Reciprocal age-of-air for 1-story house with continuous exhaust ventilation (Test A3) compared to central fan integrated supply ventilation (Test A6)
Air Handler Operation
To determine how much room-to-room mixing was caused by the air handler the exhaust only test was re-run with the air handler operating at 33 duty cycle (20 min off 10 min on) (Test A12) The decay curves are shown in Figure 15 Compared to Test A3 (Figure 12) there was a noticeable increase in uniformity when the air handler was operating even though the entry points for the ventilation air were uncontrolled As shown in Figure 16 the range of reciprocal age of air was reduced from +0042-0038 hr-1 to +0019-0011 hr-1) It appears that operation of the air handler explains most of the difference between the supply and exhaust ventilation systems discussed earlier Although it also appears that the overall average air change rate was higher in the case where the air handler was operating (0216 ACH vs 0176) it should be noted that the average wind speed was also significantly higher It is likely that the wind speed was the primary cause of the difference in average ACH not a difference in the mechanical ventilation rate
21 of 49
Research Report - 0602
0
5
10
15
20
25
30
35
Co
nce
ntr
ati
on
(m
gm
3 )
Living
Entry
BR1
BR2
BR3
MBR
Mixing stopped
Mixing restarted
0 1 2 3 4 5 6 7 8 9 10 11 12 13 14
Hour
Figure 15 Tracer gas decay for 1-story house with continuous exhaust ventilation at ASHRAE 622 level 33 central fan operation (20 min off 10 min on) and bedroom
doors closed (Test A12)
Exhaust Ventilation No Mixing vs 33 Air Handler Duty Cycle
000
005
010
015
020
025
Recip
rocal A
ge o
f A
ir (
1h
r)
Living
Entry
BR1
BR2
BR3
MBR
Exhaust in utility room 33 air handler
no mixing 100 operation exhaust in
ASHRAE doors closed utility room 100
ASHRAE doors closed
Figure 16 Reciprocal age-of-air for 1-story house with continuous exhaust ventilation with and without air handler operation (Tests A3 and A12)
22 of 49
Research Report - 0602
Exhaust Location
The preceding analysis of exhaust ventilation was based on an exhaust point in the laundry room which was relatively centrally located in the 1-story house To examine the effect of moving the exhaust point the duct blaster was moved to the master bathroom which was located in a far corner of the house (Test A16) A continuous exhaust ventilation rate of 58 cfm was again applied to the house resulting in the tracer gas decay curve shown in Figure 17 It is difficult to visually identify a significant difference between this series of curves and those shown in Figure 12 for the laundry room exhaust location
Because the curves were steady it is again possible to compare the results based on reciprocal age-of-air as shown in Figure 18 There appeared to be very little change in the distribution of outside air to most rooms However the reciprocal age-of-air in the master bedroom dropped noticeably when the exhaust location was moved to the master bathroom probably because a greater fraction of the outside air now passed through other rooms before reaching the master bedroom With the exhaust point centrally located most of the ventilation air passing through the master bedroom probably entered from the outside In both cases however the master bedroom had the highest reciprocal age-of-air of all of the rooms in the house and the BR2 location had the lowest
Co
nc
en
tra
tio
n (
mg
m3)
40
35
30
25
20
15
10
5
0
Living
Entry
BR1
BR2
BR3
MBR
Mixing stopped
Mixing restarted
19 20 21 22 23 0 1 2 3 4 5 6 7 8
Hour
Figure 17 Tracer gas decay for 1-story house with exhaust ventilation from the master bathroom at ASHRAE 622 level no central fan operation and bedroom doors closed (Test
A16)
23 of 49
Research Report - 0602
Exhaust Ventilation
Laundry Room vs Master Bathroom
000
005
010
015
020
025
Exhaust in laundry
room no mixing 100
ASHRAE doors closed
Exhaust in master
bathroom no mixing
100 ASHRAE doors
closed
Re
cip
roc
al A
ge
of
Air
(1
hr)
Living
Entry
BR1
BR2
BR3
MBR
Figure 18 Reciprocal age-of-air for 1-story house with exhaust ventilation from the master bathroom compared to the laundry room at ASHRAE 622 level no central fan operation
and bedroom doors closed (Tests A3 and A16)
Ventilation Rate
The supply ventilation test was repeated using flow rates corresponding to 60 and 33 of the ASHRAE recommendations The intent of this series of tests was to evaluate the room-to-room ventilation uniformity for ventilation rates consistent with ASHRAE 622 compared to the uniformity for reduced mechanical ventilation rates Each test was conducted for only 4 hours because of time limitations The decay curves are shown in Figures 19 and 20 Because the rooms were well-mixed during the supply ventilation tests the average whole-house ACH can be compared directly to the reciprocal age-of-air for the exhaust ventilation tests Figure 21 shows the supply ventilation air change rate for each of the three ventilation levels (33 60 100) compared to room-by-room reciprocal age-of-air for the exhaust ventilation system based on the boundary conditions present during the tests It appears that in the supply ventilation case all rooms receive more outside air than the least-ventilated room in the exhaust case (BR2) even at 60 of ASHRAE 622 These results serve to illustrate the trade-off between whole-house ventilation rate and room-to-room ventilation uniformity in terms of their impact on the worst room(s)
24 of 49
Research Report - 0602
The ASHRAE 622 committee has not currently defined the level of mixing that is required when choosing the minimum ventilation rate Some might interpret the results of this test to suggest that a house without mixing can have individual rooms that do not receive sufficient outside air even though the ventilation system is operating at 622 specified rates Because the 622 committee has not specified the level of mixing that is required when choosing the minimum ventilation rate the ventilation rate required by different ventilation systems is open to interpretation For example if the exhaust system performance shown in Figure 21 is acceptable does this mean that a ventilation system that provides good distribution of outside air may be sufficiently well-ventilated at 60 of the ASHRAE 622 level or perhaps even less Alternatively it might be concluded that exhaust ventilation rates should be increased over current ASHRAE 622 recommendations because of the possibility that certain rooms may receive very little fresh air Unfortunately because the current 622 standard does not specify air mixing requirements and the committeersquos assumptions about ventilation air distribution are not well documented it is difficult to make any firm recommendations in this area However we can conclude that air mixing is required for dilution ventilation systems to provide predictable results independent of the geometry of individual homes
8 9 10 11 12 13 14
Hour
Figure 19 Tracer gas decay for 1-story house with supply ventilation at 60 of ASHRAE 622 level 33 central fan operation (20 min off 10 min on) and bedroom doors closed
(Test A4)
0
10
20
30
40
50
60
Co
nce
ntr
ati
on
m
gm
3
Living
Entry
BR1
BR2
BR3
MBR
Mixing stopped
Mixing restarted
25 of 49
Research Report - 0602
0
5
10
15
20
25
30
Co
nce
ntr
ati
on
(m
gm
3 )
Living
Entry
BR1
BR2
BR3
MBR
Mixing stopped
Mixing restarted
12 13 14 15 16 17 18 19 20
Hour
Figure 20 Tracer gas decay for 1-story house with supply ventilation at 33 of ASHRAE 622 level 33 central fan operation (20 min off 10 min on) and bedroom doors closed
(Test A5)
Simple Exhaust vs Central Fan Integrated
Supply with Lower Ventilation Rates
025
Re
cip
roc
al A
ge
of
Air
(1
hr)
Well Mixed
100
ASHRAE 60
ASHRAE 33
ASHRAE Living Entry 010 Natural
BR1 Infilt
BR2 BR3 005
MBR
Exhaust in laundry room no
000
Central supply Natural infil-
mixing 100 ASHRAE doors mixing 33 duty tration doors
closed cycle doors closed open
Figure 21 Reciprocal age-of-air for 1-story house with supply ventilation at 33 60 and 100 of ASHRAE 622 level (Tests A5 A4 A6) compared to exhaust ventilation with
no central fan operation (Test A3) Bedroom doors were closed
020
015
26 of 49
Research Report - 0602
Simulations by Walker (2006) have shown that all systems will not provide the same service in terms of annual average air change rate For the same air flow rate and duty cycle balanced ventilation will yield a higher average air exchange than supply ventilation and supply ventilation will yield a higher average air exchange than exhaust ventilation That can be explained in general terms by understanding that wind and stack effects act to depressurize a building most of the time Exhaust fans increase the building depressurization further but supply fans decrease the depressurization Balanced fans donrsquot change the enclosure differential pressure and air flow at all Because of the non-linear relationship between differential pressure and air flows across the building enclosure a supply fan changes the pressures across the enclosure less than an exhaust fan acting more like a balanced fan The result is that the effect on ventilation air change rate from a supply fan is somewhere between that of an exhaust fan and a true balanced system
Bedroom Doors
Except for the natural ventilation test the preceding tests were all conducted with the bedroom doors closed to simulate a worst-case situation for air circulation within the house The exhaust ventilation test was repeated with the bedroom doors open (Test A9) producing the tracer gas decay curve shown in Figure 22 It is evident that the decay curves were much more tightly bundled with the doors open than they were with the doors closed (compare Figure 12) A comparison based on reciprocal age-of-air is shown in Figure 23 A significant improvement in room-to-room mixing is evident during the open-door test
It is also evident that the average air change rate was higher when the doors were open (0202 vs 0176 ACH) but it must be remembered that the ventilation rate was controlled using a duct blaster and average wind speed was higher during the open-door test period compared to the closed-door test period (20 mph compared to 06 mph) Therefore this test alone does not necessarily indicate that closing doors reduces the average air change rate associated with an exhaust system In future tests continuous measurement of the depressurization of the house with respect to outside along with single-point pressure measurements across interior doors would provide more information about the effect of closing doors when exhaust ventilation systems are used It would also be valuable to conduct this test during steady weather conditions using the exhaust fan (with uncontrolled ventilation rate) instead of the duct blaster to observe the net effect of closed doors on whole-house air change rate
27 of 49
Research Report - 0602
0
5
10
15
20
25
30
Co
ncen
trati
on
(m
gm
3 )
Living
Entry
BR1
BR2
BR3
MBR
Mixing stopped
Mixing restarted
181 191 201 211 221 231 01 11 21 31 41 51 61 71
Hour
Figure 22 Tracer gas decay for 1-story house with exhaust ventilation from the laundry room at ASHRAE 622 level no central fan operation and bedroom doors open (Test A9)
Exhaust Ventilation
Doors Closed vs Doors Open
000
005
010
015
020
025
Re
cip
roc
al
Ag
e o
f A
ir (
1h
r)
Living
Entry
BR1
BR2
BR3
MBR
Exhaust in laundry room Doors open no mixing
no mixing 100 exhaust in laundry room
ASHRAE doors closed 100 ASHRAE
Figure 23 Reciprocal age-of-air for 1-story house with exhaust ventilation from the laundry room at ASHRAE 622 level no central fan operation In the first case the bedroom doors were closed (Test A3) in the second the doors were open (Test A9)
28 of 49
Research Report - 0602
Transfer Grilles
Because the test houses used central returns instead of hard ducted returns in the bedrooms transfer grilles were installed over the bedroom doors to provide a flow path for return air without excessive room pressurization when the doors were closed These transfer grilles also allowed ventilation air to pass more freely from the bedrooms to the main living space The effect of transfer grilles on ventilation air distribution was evaluated by taping over the grilles (see Figure 24) and re-running the exhaust ventilation test (Test A10) The corresponding tracer gas decay curve is shown in Figure 25 and the reciprocal age-of-air analysis is shown in Figure 26 Taping the transfer grilles did not appear to significantly affect the room-to-room variability in ventilation rate although there appeared to be some slight re-ranking of rooms from highest to lowest reciprocal age-of-air It should be noted that there was an increase in average wind speed from 26 mph to 41 mph starting at 1 pm including a half hour period where the average wind speed was 7 mph This weather effect produced noticeable kinks in the decay curves and therefore would be expected to introduce significant errors into the reciprocal age-of-air results
Itrsquos possible that the transfer grilles played a much smaller role in providing a path for ventilation air than the supply ducts Because the air handler was not operating the ducts were not pressurized and were thus available as passive airflow conduits The resistance to air flow was probably smaller for the air ducts than for the transfer grilles depending on their size and the number of supply registers in each bedroom The existing door undercuts are also thought to have played a role The effect of ducts and door undercuts can be tested in the future by running separate tests with ducts and door undercuts taped over
copy buildingsciencecom
Figure 24 Transfer grilles over bedroom doors taped closed
29 of 49
Research Report - 0602
0
10
20
30
40
50
60
70
Co
nc
en
tra
tio
n (
mg
m3 )
Living
Entry
BR1
BR2
BR3
MBR
Mixing stopped
Mixing restarted
8 9 10 11 12 13 14 15 16 17
Hour
Figure 25 Tracer gas decay for 1-story house with exhaust ventilation from the laundry room at ASHRAE 622 level no central fan operation bedroom doors closed and transfer
grilles taped (Test A10)
Exhaust Ventilation
000
005
010
015
020
025
Re
cip
roc
al
Ag
e o
f A
ir (
1h
r)
Living
Entry
BR1
BR2
BR3
MBR
Transfer Grilles Untaped vs Taped
Exhaust in laundry room no Exhaust in laundry room no
mixing 100 ASHRAE mixing 100 ASHRAE
doors closed doors closed transfer
grilles taped
Figure 26 Reciprocal age-of-air for 1-story house with exhaust ventilation from the laundry room at ASHRAE 622 level no central fan operation and doors closed In the
30 of 49
Research Report - 0602
first case the transfer grilles are untaped (Test A3) in the second they are taped closed (Test A10)
Minimum Test Duration
We were fortunate that DR Horton provided two full weeks of access to these homes to conduct this series of tests which allowed us to run some of the more important tracer gas decay tests as long as 12 hours to help ensure that we could accurately calculate reciprocal age-of-air In most cases test houses would not be available for such a long time period To evaluate the length of time needed to estimate the reciprocal age-of-air with reasonable accuracy we examined the results that we would have obtained for one of the exhaust ventilation tests had we halted the test period after less than 12 hours For the supply ventilation tests the rooms were sufficiently well-mixed that the test could have been stopped after 3 or 4 hours assuming weather effects were steady
The reciprocal age-of-air calculations for the exhaust ventilation decay curves (Test A3 see Figure 12) based on test durations of 3 6 9 and 12 hours are shown in Figure 27 These test durations range from 053 to 21 air changes based on the average air change rate of 018 ACH (56 hours per air change) calculated for this test The ratio of highest to lowest reciprocal ageshyof-air is shown above the data points for each case These results suggest that shorter tests tend to overestimate the range and that perhaps 1frac12-2 air changes (roughly 9 to 12 hours in this case) may be necessary to obtain accurate calculations of reciprocal age-of-air when there is significant divergence among rooms From a qualitative standpoint one air change may be sufficient to determine the basic trend Without knowing in advance what mixing pattern will occur it is difficult to recommend a minimum test duration But assuming this test is fairly representative of a worst-case scenario a minimum of 15 air changes would be necessary to have a high degree of confidence in the quantitative difference in reciprocal age-of-air among rooms
31 of 49
Research Report - 0602
000
005
010
015
020
025
030
035
Re
cip
roc
al
Ag
e-O
f-A
ir (
hr-1
)
Living
Entry
BR1
BR2
BR3
MBR HighLow = 297
HighLow = 168 HighLow = 184 HighLow = 161
3-hour Test 6-hour Test 9-hour Test 12-hour Test
(053 Air Changes) (11 Air Changes) (16 Air Changes) (21 Air Changes)
Test Duration
Figure 27 Reciprocal age-of-air based on alternate test durations for 1-story house with exhaust ventilation from the laundry room at ASHRAE 622 level no central fan operation
and doors closed (Test A3) Average air change rate was 018 ACH
TEST RESULTS FROM 2-STORY HOUSE (1117 MONTAGUE)
The 2-story house was tested from January 3-10 2006 Three zones were selected on the first floor and three more were selected on the second floor as indicated by the red stars in Figure 4 The initial mixing of air among the rooms at the start of each test in this 2-story house was not as thorough as it was in the 1-story house Evidently the combined effects of the air handler and the portable de-stratification fan were not sufficient to overcome upward transport of tracer gas driven by the stack effect from the first to the second floor The resulting difference in initial tracer gas concentration among the rooms was about 5-10 This outcome emphasizes the significant effect of stack-driven infiltration on ventilation non-uniformity in multi-story homes Because our test method and equipment did not achieve a well-mixed condition at the start of each test there were some errors introduced into the reciprocal age-of-air analysis For future tests we would recommend larger de-stratification fans to obtain more well-mixed conditions in multi-story houses
Typical errors introduced by incomplete mixing of the tracer gas at the start of such a test were analyzed by examining two hypothetical cases where either all of the air entering a room comes from the outside or all of the air comes from an adjacent room with a different starting concentration If all of the air entering a space comes from the outside then a change in the initial concentration would have no effect on the reciprocal age-of-air because the decay curve would be exponential from the start and the area under the curve would be normalized based on
32 of 49
Research Report - 0602
the starting concentration in that zone However if the air entering a room passes through another room with a lower initial concentration the room receiving the air will have a lower concentration of tracer gas throughout the test compared to what the concentration would have been if the starting points were the same in both rooms This case is illustrated in Figure 28 where assumptions are made that the rooms are the same size the air exchange rate is 01 ACH for both rooms and the initial tracer gas concentration is 10 lower in the first room (upstream) than it is in the second room
The effect on reciprocal age-of-air is shown in Figure 29 A 10 difference in starting concentration results in an error of about 75 in reciprocal age-of-air for a room downstream of a room with a lower starting concentration assuming 01 ACH for both rooms The error would be somewhat smaller (about 5) if the air change rate was higher for both rooms (02 ACH) There would be no error introduced for rooms where all of the air infiltration comes from the outside Although the amount of error in the reciprocal age-of-air calculations can be affected by additional variables not examined here we feel that these percentages are reasonable estimates of the errors in our results for the 2-story house due to incomplete initial mixing of air
In each case an engineering judgment must be made regarding the significance of the error introduced by incomplete initial mixing As a general rule the differences in concentration at the start of the test should be small compared to the differences that are being measured in order for the results to be considered valid
Figure 28 Theoretical decay curves for a well-mixed case with uniform tracer gas concentration compared to a case where the upstream room starts with a concentration
10 lower than the downstream room
33 of 49
Research Report - 0602
Figure 29 Theoretical reciprocal age-of-air for a well-mixed case with uniform tracer gas concentration compared to a case where the upstream room starts with a concentration
10 lower than the downstream room
Natural Infiltration and Duct Leakage
A natural infiltration test was performed over a two hour period on the evening of January 8 (Test B14) The tracer gas decay curves are shown in Figure 30 There was a slight divergence between the first floor and second floor once the air handler was turned off but the rooms on each floor appeared to remain fairly well-mixed The average air change rate during the test period was about 011 ACH which was somewhat higher than the 1-story house as might be expected with an increased stack height
An air handler bedroom door bump test was conducted just prior to the test period shown in Figure 30 allowing observation of the combined effect of duct leakage to the outside and increased infiltration caused by room pressurization The average air change rate during that bump test was 013 ACH suggesting that closing doors and operating the fan added approximately 002 ACH to the whole-house average air change rate The average wind speed was a bit higher while the air handler was running (17 mph compared to 05 mph) so the effect of air handler operation may actually be somewhat less than the average ACH numbers indicate
34 of 49
Research Report - 0602
0
1
2
3
4
SF
6 C
on
ce
ntr
ati
on
(m
gm
3)
BR1
Living
Kitchen
BR2
BR3
MBR
Mixing stopped
Mixing restarted
1814 1843 1912 1940 2009 2038 2107 2136
Hour
Figure 30 Tracer gas decay for 2-story house with no ventilation no central fan operation and bedroom doors open (Test B14)
Distributed Supply vs Point Exhaust Ventilation
A 14-hour test (Test B1) was performed with an exhaust ventilation rate of 63 cfm in the laundry room which was located near the stairwell in the middle of the first floor The ventilation rate was again consistent with the ASHRAE 622 recommendations The tracer gas decay curves are shown in Figure 31 It is interesting that all three second floor rooms showed a delay before entering an exponential decay suggesting that some amount of air was moving from the first floor to the second floor even though the mechanical exhaust point was on the first floor It appears that the further depressurization of the first floor was insufficient to overcome the stack effect and draw a significant amount of outside air in through the rooms on the second floor
35 of 49
Research Report - 0602
182
9
192
9
202
9
212
9
222
9
232
9
029
129
229
329
429
529
629
729
828
929
102
8
112
8
122
8
0
10
20
30
40
50
60
70
SF
6 C
on
ce
ntr
ati
on
(m
gm
3)
BR1
Living
Kitchen
BR2
BR3
MBR
Mixing stopped
Mixing restarted
Hour
Figure 31 Tracer gas decay for 2-story house with exhaust ventilation from the laundry room at ASHRAE 622 level no central fan operation and bedroom doors closed (Test B1)
A supply ventilation test was performed on the 2-story house for about 11 hours starting late on January 4 (Test B3) The duct blaster was unable to provide the ventilation rate necessary to meet the minimum specified in ASHRAE 622 supplying 180 cfm instead of 189 cfm (95) The decay curves are shown in Figure 32 Although the curves are much more tightly packed than they were with the exhaust system there is more divergence than we saw with the supply system in the 1-story house most notably in the master bedroom
The reciprocal age-of-air calculations for both the exhaust and supply ventilation systems are shown in Figure 33 Again the results indicate that much better room-to-room distribution of ventilation air was achieved by the central-fan integrated supply system compared to the single-point exhaust system However for the supply ventilation test the differences in the initial tracer gas concentration were of the same magnitude as the differences in decay rates among the rooms As a result no conclusions should be drawn about the relative ranking of the supply ventilation rate among rooms based on Figure 33
36 of 49
Research Report - 0602
0
10
20
30
40
50
60
SF
6 C
on
ce
ntr
ati
on
(m
gm
3)
BR1
Living
Kitchen
BR2
BR3
MBR
Mixing stopped
Mixing restarted
2136 000 224 448 712 936 1200
Hour
Figure 32 Tracer gas decay for 2-story house with supply ventilation just under ASHRAE 622 level central fan operation at 33 duty cycle (20 min off 10 min on) and bedroom
doors closed (Test B3)
Simple Exhaust vs Central Fan Integrated
Supply )
000
005
010
015
020
025
Recip
rocal A
ge o
f A
ir (
1h
r
BR1
Living
Kitchen
BR2
BR3
MBR
Exhaust in laundry room no Centralized supply mixing
mixing 100 ASHRAE 33 duty cycle 95
doors closed ASHRAE doors closed
Figure 33 Reciprocal age-of-air for 2-story house with continuous exhaust ventilation (Test B1) compared to central fan integrated supply ventilation (Test B3) (Note
Uncertainties introduced by non-uniform starting concentration are of the same order of magnitude as the differences in reciprocal age-of-air among rooms for the supply ventilation case The relative ranking of rooms is not meaningful for that case)
37 of 49
Research Report - 0602
Air Handler Operation
The effect of occasional air handler operation on the distribution of exhaust ventilation air was evaluated on the afternoon of January 6 (Test B6) The tracer gas decay curves are shown in Figure 34 and reciprocal age-of-air calculations are shown in Figure 35 It should again be noted that before the test started the house was mixed using both the air handler and a de-stratification fan with the doors open During the test the doors were closed the de-stratification fan was turned off and the air handler operated at a 33 duty cycle (20 minutes off 10 minutes on) As was the case in the 1-story house this occasional operation of the air handler substantially improved the distribution of ventilation air among rooms even in conjunction with the point exhaust ventilation system There was very little divergence noticeable even with the air handler cycling on and off every half hour However because the initial differences in tracer gas concentration among rooms were as large as the differences in reciprocal age-of-air for the case with air handler operation no conclusions should be drawn about the relative ranking of ventilation rates among the rooms for that case
SF
6 C
on
cen
trati
on
(m
gm
3)
80
70
60
50
40
30
20
10
0
BR1
Living
Kitchen
BR2
BR3
MBR
Mixing stopped
Mixing restarted
1048 1200 1312 1424 1536 1648 1800 1912 2024
Hour
Figure 34 Tracer gas decay for 2-story house with continuous exhaust ventilation at ASHRAE 622 level central fan operation at 33 duty cycle (20 min off 10 min on) and
bedroom doors closed (Test B6)
38 of 49
Research Report - 0602
020
015 R
ec
ipro
ca
l A
ge
of
Air
(1
hr)
Exhaust Ventilation
No Mixing vs 33 Air Handler Duty Cycle
Exhaust in laundry room
no mixing 100
ASHRAE doors closed
33 air handler
operation exhaust in
laundry room 100
ASHRAE doors closed
BR1
Living
Kitchen
BR2
BR3
MBR
010
005
000
Figure 35 Reciprocal age-of-air for 2-story house with continuous exhaust ventilation with and without air handler operation (Tests B1 and B6) (Note Uncertainties introduced by non-uniform starting concentration are of the same order of magnitude as the differences in reciprocal age-of-air among rooms for the case with air handler operation The relative
ranking of rooms is not meaningful for that case)
Exhaust Location
The duct blaster was moved to the master bathroom exhaust register to see if there was a resulting change in ventilation air distribution (Test B18) The master bathroom was in the back of the house on the second floor between the master bedroom and bedroom 3 The decay curves are shown in Figure 36 and the reciprocal age-of-air results are shown in Figure 37 The rooms on each floor were well mixed before the test began although the mixing between the two floors was not as good Very wide divergence among rooms can be seen during the test especially between the upstairs bedrooms and the rest of the house Once again all three upstairs rooms appear to receive some air from the first floor but the master bedroom experiences a much higher volume of circulated air than the other two second-floor bedrooms which appear to be relatively stagnant
39 of 49
Research Report - 0602
0
10
20
30
40
50
60
70
80
90
SF
6 C
on
ce
ntr
ati
on
(m
gm
3)
BR1
Living
Kitchen
BR2
BR3
MBR
Mixing stopped
Mixing restarted
1912 2136 000 224 448 712 936 1200
Hour
Figure 36 Tracer gas decay for 2-story house with exhaust ventilation from the master bathroom at ASHRAE 622 level no central fan operation and bedroom doors closed (Test
B18)
Exhaust Ventilation
Laundry Room vs Master Bathroom
000
005
010
015
020
025
030
Exhaust in laundry room no
mixing 100 ASHRAE
doors closed
Exhaust in master bathroom
no mixing 100 ASHRAE
doors closed
Re
cip
roc
al A
ge
of
Air
(1
hr)
BR1
Living
Kitchen
BR2
BR3
MBR
Figure 37 Reciprocal age-of-air for 2-story house with exhaust ventilation from the master bathroom compared to the laundry room at ASHRAE 622 level no central fan operation
and bedroom doors closed (Tests B1 and B18)
40 of 49
Research Report - 0602
Ventilation Rate
The supply ventilation tests were repeated using flow rates of 60 and 33 of ASHRAE 622 recommendations corresponding to 114 cfm and 63 cfm respectively (Tests B2 and B4) The decay curves are shown in Figures 38 and 39 Reciprocal age-of-air for all three supply ventilation rates are shown in Figure 40 In all cases the rooms remained fairly well mixed especially rooms on the same floor As we observed in the 1-story house the ventilation rate in the 2-story house appeared to have very little effect on the uniformity of outside air provided to each room as long as it was mixed using the air handler One again the initial differences in tracer gas concentration among rooms were as large as the divergence in the decay curves preventing any conclusions about the relative ranking of ventilation rates among rooms for all three cases The error in initial concentration uniformity was bigger for the cases with air handler mixing because the relative divergence in the decay curves was so small compared to that of no air handler mixing In other words the error in relative ranking of ventilation rates for the cases with air handler mixing were not very important anyway because the relative differences between rooms were so small
1536 1648 1800 1912 2024 2136 2248
Hour
Figure 38 Tracer gas decay for 2-story house with supply ventilation at 60 of ASHRAE 622 level 33 central fan operation (20 min off 10 min on) and bedroom doors closed
(Test B2)
0
5
10
15
20
25
30
SF
6 C
on
cen
trati
on
(m
gm
3)
BR1 Living Kitchen BR2 BR3 MBR
Mixing stopped
Mixing restarted
41 of 49
Research Report - 0602
0
5
10
15
20
25
30
35
40
SF
6 C
on
cen
trati
on
(m
gm
3)
BR1
Living
Kitchen
BR2
BR3
MBR
Mixing stopped
Mixing restarted
1200 1312 1424 1536 1648 1800 1912
Hour
Figure 39 Tracer gas decay for 2-story house with supply ventilation at 33 of ASHRAE 622 level 33 central fan operation (20 min off 10 min on) and bedroom doors closed
(Test B4)
Supply Ventilation Rate Comparison
000
005
010
015
020
025
Re
cip
roc
al
Ag
e o
f A
ir (
1h
r)
BR1
Living
Kitchen
BR2
BR3
MBR
Centralized supply Centralized supply Centralized supply
mixing 33 duty mixing 33 duty mixing 33 duty
cycle 95 ASHRAE cycle 60 ASHRAE cycle 33 ASHRAE
doors closed doors closed doors closed
Figure 40 Reciprocal age-of-air for 2-story house with three levels of supply ventilation central fan operation at 33 duty cycle (20 min off 10 min on) and bedroom doors closed (Tests B3 B2 B4) (Note Uncertainties introduced by non-uniform starting
concentration are of the same order of magnitude as the differences in reciprocal age-of-air among rooms for all three cases The relative ranking of rooms is not meaningful for these
cases)
42 of 49
Research Report - 0602
The average air change rates for the three supply ventilation rates compared to the two exhaust ventilation schemes are shown in Figure 41 The CFIS system at 33 of the 622 ventilation flow rate provided a uniformly higher air change rate (013 ach) than the least ventilated rooms using exhaust ventilation from either the laundry or the master bathroom (010 ach Figure 37) It is noteworthy that the combined net air change rate with exhaust ventilation from the laundry room was significantly less than the air change rates for both exhaust ventilation from the master bathroom and supply ventilation at the air handler This illustrates the unpredictability of interactions between mechanical ventilation and natural infiltration which depend strongly on the distribution and size of cracks through which the outside air must pass to enter the house There may have been a relatively large building enclosure leakage opening near the laundry room (perhaps the utility penetrations or the door to the garage) that allowed a significant amount of outside air to quickly enter and leave the house through the exhaust flow without circulating around the house
0
005
01
015
02
025
Ave
rag
e A
CH
Natural Exhaust Exhaust Supply 95 Supply 60 Supply 33
Laundry Mbath
Rm 100 100
Figure 41 Average air change rates for 2-story house with supply ventilation at 33 60 and 95 of ASHRAE 622 recommendations (Tests B4 B2 B3) compared to natural
infiltration (Test B14) and exhaust ventilation with no central fan operation (Test B1) Bedroom doors were closed except for the natural infiltration test
Bedroom Doors
The laundry room exhaust ventilation test with no air handler operation (see Figure 31) was repeated with the doors open to evaluate the change in room-to-room ventilation air distribution (Test B10) The decay curves are shown in Figure 42 and the reciprocal age-of air calculations are shown in Figure 43 It is evident from Figure 42 that the test began before the rooms were
43 of 49
Research Report - 0602
0
5
10
15
20
25
SF
6 C
on
ce
ntr
ati
on
(m
gm
3)
BR1 Living Kitchen BR2 BR3 MBR
Mixing stopped
Mixing restarted
completely well mixed resulting in decay curves that could be somewhat misleading Because the master bedroom was at a higher concentration than the other rooms at the start of the test any room that received air from the master bedroom would appear to have a slower decay rate than it would have if the rooms started out at the same concentration Despite the difference in starting concentration it is clear that outside air was well distributed when the doors were open even without operation of the air handler
1843 1912 1940 2009 2038 2107 2136 2204 2233 2302
Hour
Figure 42 Tracer gas decay for the 2-story house with exhaust ventilation from the laundry room at ASHRAE 622 level no central fan operation and bedroom doors open
(Test B10)
Reciprocal age-of-air analysis was not performed for this case because of the combined effect of a short test duration (~2 hours) and unequal starting tracer gas concentrations even though the house was relatively well-mixed The important conclusion (that opening doors greatly improves mixing) can be drawn by inspecting the decay curves alone
Transfer Grilles
A final exhaust ventilation test was run on the 2-story house with the doors closed and the transfer grilles taped over The decay curves are shown in Figure 43 and the reciprocal age-ofshyair calculations are shown in Figure 44 The curves were clearly very divergent even after 12 hours By examining the reciprocal age-of-air results it is apparent that the transfer grilles in the 2-story house caused a noticeable improvement in ventilation air distribution but the improvement was smaller than when the doors were opened (Figure 42)
44 of 49
Research Report - 0602
0
5
10
15
20
25
30
SF
6 C
on
cen
tra
tio
n (
mg
m3
) BR1 Living Kitchen BR2 BR3 MBR
Mixing stopped
Mixing restarted
1648 1912 2136 000 224 448 712 936
Hour
Figure 43 Tracer gas decay for 2-story house with exhaust ventilation from the laundry room at ASHRAE 622 level no central fan operation bedroom doors closed transfer
grilles taped closed (Test B7)
Exhaust Ventilation Transfer Grilles Untaped vs Taped
000
005
010
015
020
Re
cip
roc
al
Ag
e o
f A
ir (
1h
r)
BR1
Living
Kitchen
BR2
BR3
MBR
Exhaust in laundry room no Exhaust in laundry room no
mixing 100 ASHRAE mixing 100 ASHRAE
doors closed doors closed transfer
grilles taped
Figure 44 Reciprocal age-of-air for 2-story house with exhaust ventilation from the laundry room at ASHRAE 622 level no central fan operation and doors closed In the first case the transfer grilles are untaped (Test B3) in the second they are taped closed
(Test B7)
45 of 49
Research Report - 0602
CONCLUSIONS
bull Reciprocal age-of-air analysis was chosen as a quantitative method for characterizing distribution of ventilation air among rooms This method worked well in cases where rooms were well mixed to begin the test and weather conditions were sufficiently steady-state
bull A test period of at least 1frac12 air changes was necessary to obtain reasonably accurate ageshyof-air results when there was significant divergence in tracer gas concentration among the rooms
bull Although we did not achieve uniform initial concentration of tracer gas in the 2-story house using our test methodology and the equipment at hand we believe the reciprocal age-of-air calculations were meaningful in many of the cases as indicated in the discussion
bull Both houses were relatively tight with natural infiltration averaging 008 ACH for the 1shystory house and 011 ACH for the 2-story house
bull Both houses had relatively small (but not negligible) duct losses to the outside producing an increase in infiltration of less than 003 ACH for the 1-story house and 002 ACH for the 2-story house when the air handler runs
bull Age-of-air analysis indicated that ventilation supplied through the central air distribution system provided much more uniform distribution of ventilation air than the single-point exhaust system when the doors were closed and the air handler was not running For the 1-story house the central-fan-integrated supply ventilation case at 60 of ASHRAE 622 provided more outside air to all rooms than the least-ventilated room in the exhaust case at 100 of 622 For the 2-story house the central-fan-integrated supply system at 33 of the 622 flow rate provided more outside air to all rooms than the least ventilated rooms using exhaust ventilation at 100 of 622 from either the laundry or the master bathroom
bull Operation of the central fan at a 33 duty cycle maintained relatively well-mixed conditions regardless of ventilation rate type of ventilation system (supply or exhaust) or house configuration (1-story or 2-story)
bull Exhaust location affected both the relative amount of outside air received by different rooms and the overall uniformity among rooms but the effect was not predictable
bull For exhaust-only ventilation without central fan operation opening bedroom doors appeared to significantly improve the mixing of ventilation air among rooms
bull Transfer grilles improved the distribution of ventilation air slightly but much less than opening the bedroom doors
bull In the 2-story house the stack effect caused air movement from the first floor to the second floor even when exhaust ventilation was applied to the first floor resulting in consistently higher tracer gas concentrations on the second floor and more non-uniform ventilation air distribution in general
bull Interactions between natural infiltration and both exhaust and supply mechanical ventilation were very significant When the ventilation system was activated the combined air change rate did not increase commensurate with the measured ventilation rate but instead increased by only half that amount This result was consistent with combining ventilation and infiltration in quadrature to estimate whole-house air change rate in accordance with ASHRAE Standard 136 (ASHRAE 1993)
46 of 49
Research Report - 0602
FUTURE WORK
In future tests continuous monitoring of pressure differentials would enhance our understanding of the multi-zone combined infiltration and ventilation systems and our ability to model them That would help to explain differences between tests in more detail including the effects of multiple stories location of ventilation supply outlets and exhaust inlets interior door closure and use of passive return air transfer grilles Pressure differential measurement points should include
bull dP with respect to outside for each closed room and open space bull dP across closed interior doors bull dP between the floor cavity and outdoors and bull dP between the house and the attic
Measurement of wind direction along with wind speed could also be helpful for modeling these buildings and systems However because of micro-climate wind shielding it may be very difficult to relate a single-point wind direction measurement to actual wind vectors on the building surfaces
ACKNOWLEDGMENTS
The authors express their appreciation to Rich Coyle of DR Horton for providing the test houses and to Joseph Lstiburek of BSC Subrato Chandra and Neil Moyer of FSEC and Greg Barker of Mountain Energy Partnership for their assistance in the planning and execution of this ventilation study
47 of 49
Research Report - 0602
REFERENCES
ASHRAE (1993) ANSIASHRAE Standard 136-1993 A Method of Determining Air Change Rates in Detached Dwellings Atlanta GA American Society of Heating Refrigerating and Air-Conditioning Engineers Inc
ASHRAE (1997) ANSIASHRAE Standard 129-1997 Measuring Air-Change Effectiveness Atlanta GA American Society of Heating Refrigerating and Air-Conditioning Engineers Inc
ASHRAE (2004) ASHRAE Standard 622-2004 Ventilation and Acceptable Indoor Air Quality in Low-Rise Residential Buildings Atlanta GA American Society of Heating Refrigerating and Air-Conditioning Engineers Inc
CSA (2003) CANCSA F326-M91 Residential Mechanical Ventilation Systems Canadian Standards Association Ontario Canada httpwwwcsashyintlorgonlinestoreGetCatalogItemDetailsaspmat=2410793ampParent=102
NBC 2005 National Building Code of Canada httpircnrcshycnrcgccapubscodesnrcc47666_ehtml
Grieve PW (1991) Measuring Ventilation Using Tracer-Gases Denmark Bruumlel amp Kjaeligr
MN Chapter 7672 Minnesota Energy Code Chapter 7672 Detached Single-Family And Two-Family Dwellings httpwwwstatemnusmnexternalDocsCommerceChapter_7672_Residential_111302012428 _72rulepdf
Persily AK Martin SR (2000) A Modeling Study of Ventilation in Manufactured Houses Gaithersburg MD National Institute of Standards and Technology NISTIR 6455
Rudd A Lstiburek J (2000) ldquoMeasurement of Ventilation and Interzonal Distribution in Single-Family Homesrdquo ASHRAE Transactions 2000 MN-00-10-3 V 106 Pt2 American Society of Heating Refrigeration and Air-Conditioning Engineers Atlanta GA
WAC (2004) Washington State Title 51 WAC Community trade and economic development department of (building code council) Chapter 51-13 Ventilation and indoor air quality httpappslegwagovWACdefaultaspxcite=51-13
48 of 49
Research Report - 0602
Field test of room-to-room uniformity of ventilation air distribution in two new houses
About this Report
This report was prepared for the US Department of Energyrsquos Building America
Program The report is freely available to the public at wwwbuildingamericagov
The authors express their appreciation to Rich Coyle of DR Horton for providing the test houses and to Joseph Lstiburek of BSC Subrato Chandra and Neil Moyer of
FSEC and Greg Barker of Mountain Energy Partnership for their assistance in the planning and execution of this ventilation study
About the Authors
Robert Hendron Ren Anderson Dennis Barley are with National Renewable Energy Laboratory Armin Rudd and Aaron Townsend are with Building Science Corporation
Ed Hancock is with Mountain Energy Partnership
Direct all correspondence to Building Science Corporation 30 Forest Street Somerville MA 02143
Limits of Liability and Disclaimer of Warranty
Building Science documents are intended for professionals The author and the publisher of this article have used their best efforts to provide accurate and authoritative information in regard to the subject matter covered The author and publisher make no warranty of any kind expressed or implied with regard to the information contained in this article
The information presented in this article must be used with care by professionals who understand the implications of what they are doing If professional advice or other expert assistance is required the services of a competent professional shall be sought The author and publisher shall not be liable in the event of incidental or consequential damages in connection with or arising from the use of the information contained within this Building Science document
49 of 49
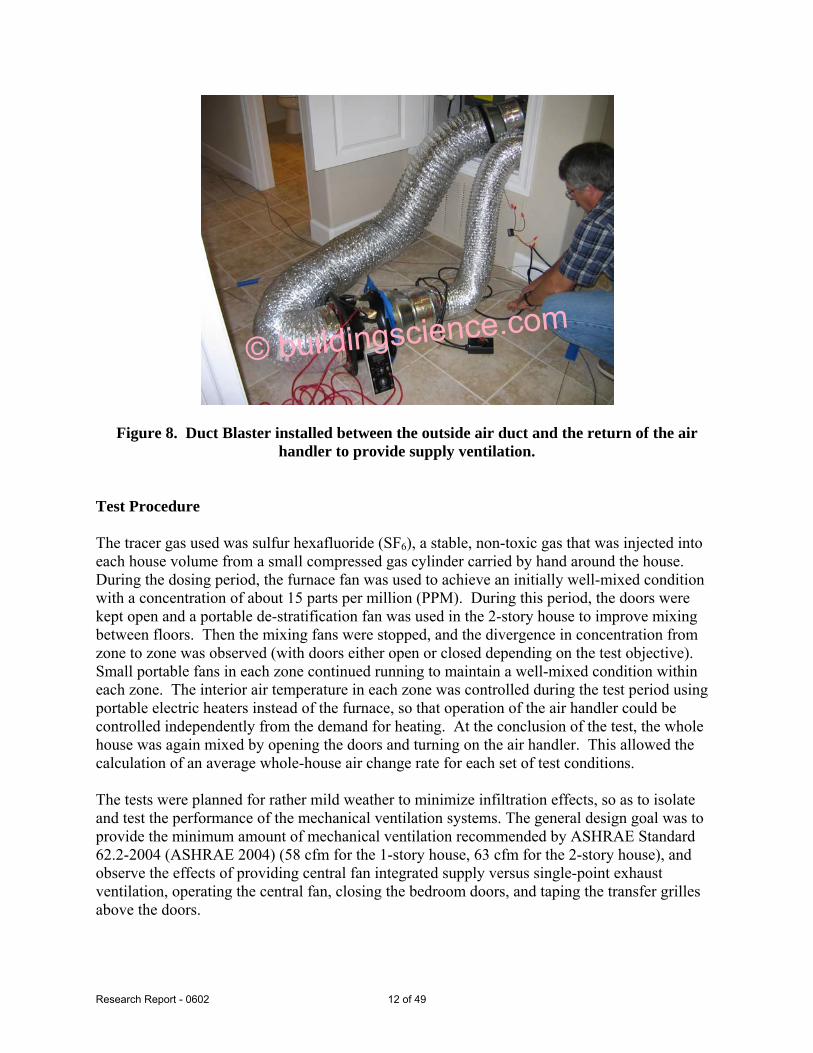
Research Report - 0602
copy buildingsciencecom
Figure 8 Duct Blaster installed between the outside air duct and the return of the air handler to provide supply ventilation
Test Procedure
The tracer gas used was sulfur hexafluoride (SF6) a stable non-toxic gas that was injected into each house volume from a small compressed gas cylinder carried by hand around the house During the dosing period the furnace fan was used to achieve an initially well-mixed condition with a concentration of about 15 parts per million (PPM) During this period the doors were kept open and a portable de-stratification fan was used in the 2-story house to improve mixing between floors Then the mixing fans were stopped and the divergence in concentration from zone to zone was observed (with doors either open or closed depending on the test objective) Small portable fans in each zone continued running to maintain a well-mixed condition within each zone The interior air temperature in each zone was controlled during the test period using portable electric heaters instead of the furnace so that operation of the air handler could be controlled independently from the demand for heating At the conclusion of the test the whole house was again mixed by opening the doors and turning on the air handler This allowed the calculation of an average whole-house air change rate for each set of test conditions
The tests were planned for rather mild weather to minimize infiltration effects so as to isolate and test the performance of the mechanical ventilation systems The general design goal was to provide the minimum amount of mechanical ventilation recommended by ASHRAE Standard 622-2004 (ASHRAE 2004) (58 cfm for the 1-story house 63 cfm for the 2-story house) and observe the effects of providing central fan integrated supply versus single-point exhaust ventilation operating the central fan closing the bedroom doors and taping the transfer grilles above the doors
12 of 49
Research Report - 0602
The results of the multi-zone tracer gas decay tests are presented graphically as families of decay curves These graphs illustrate the uniformity or non-uniformity of the ventilation effect among the various rooms and allow ranking of the rooms from the least to the most ventilation effect
In addition if the ventilation rates were sufficiently steady for the duration of the test period we used local mean age-of-air analysis to evaluate the results more quantitatively Age-of-air analysis is a well-established approach to testing ventilation rates at various points or in various zones within a building (Grieve 1991) Age-of-air is defined as the average length of time that air molecules have resided within the building The formula for calculating local mean age-ofshyair in a tracer gas decay test is given in ASHRAE Standard 129-1997 (ASHRAE 1997) as follows
Ai = 1 intinfin
Ci (t)dt (1)C0 0
where
i = Index for measurement point representing a well-mixed zone Ai = Local mean age-of-air at point i (hr) C = Concentration of tracer gas (lbmft3) C0 = Initial value of C in well-mixed building (lbmft3) Ci = Time-varying concentration of tracer gas at point i (lbmft3) t = Time (hr)
In order to compare the ventilation rates among the rooms or zones in the home we use the metric Reciprocal Age-of-Air
Reciprocal Age-of-Air = 1Ai (2)
Reciprocal Age-of-Air has units of 1hr and is equivalent to the air change rate (ACH) in a single well-mixed zone (Persily 2000)
The definition of Ai in Equation (1) involves an integral of infinite duration This is handled in the test procedure through a two-step process
Step 1 The tracer gas decay test is continued until (a) the initial transient effects of interzonal airflow have subsided and all of the decay curves resemble simple exponential functions and (b) the tracer concentrations are rather small compared to their initial values so that any extrapolation errors will have a small effect on the result In this field test most of the multi-zone tests were continued for 12 hours These portions of the decay curves were integrated numerically using the trapezoid rule
13 of 49
Research Report - 0602
Step 2 The remaining portions (the tails) of the decay curves were extrapolated to infinity using a simple exponential decay function which was matched to the decay rate of the final portion of each measured decay curve These portions of the curves were integrated analytically
Once the conditions of Step 1 were satisfied the rooms were re-mixed by opening the bedroom doors and operating the air handler This allowed the calculation of an effective whole-house air change rate using the relationship in Equation 3
Average whole-house air change rate (ACH) = ln(C0Cf)∆t (3)
where
Cf = Concentration of tracer gas after rooms are re-mixed (lbmft3) ∆t = Elapsed time between initial and final well-mixed cases (hr)
Test Matrix
The series of test conditions for the 1-story and 2-story houses are described in Tables 2 and 3 Most of the important tests were conducted for a 12-hour period overnight to ensure sufficient accuracy when calculating reciprocal age-of-air
Table 2 Test sequence for 1-story test house
Central fan
cycling Duration Vent Vent flow (min off
Test Date Time (hrs) Config rate (cfm) min on) Doors Notes
A1 Dec 28 AM 3 Exhaust 58 none closed
A2 PM 3 Exhaust 58 2010 closed
A3 overnight 12 Exhaust 58 none closed A4 Dec 29 AM 4 Supply 104 33 2010 closed
duty cycle A5 PM 4 Supply 58 33 duty 2010 closed
cycle A6 overnight 12 Supply 174 33 2010 closed
duty cycle
A7 Dec 30 AM-PM 8 None 0 none open Natural infiltration
A8 PM 2 None 0 none open AH bump
A9 overnight 12 Exhaust 58 none open
A10 Dec 31 AM-PM 6 Exhaust 58 none closed Transfer grills taped
A11 PM 6 Exhaust 58 2010 closed Transfer grills taped
A12 Jan 1 overnight 12 Exhaust 58 2010 closed
A13 PM 6 Exhaust 58 2010 open
A14 overnight 12 Exhaust 58 54 none closed
A15 Jan 2 AM-PM 6 None 0 none closed Natural infiltration
A16 overnight 12 Exhaust 58 none closed Master bath exhaust
14 of 49
Research Report - 0602
Table 3 Test sequence for 2-story test house
Central fan
cycling Duration Vent Vent flow (min off
Test Date Time (hrs) Config rate (cfm) min on) Doors Notes B1 Jan 3 overnight 14 Exhaust 63 none closed
B2 Jan 4 PM 5 Supply 114 33 20 10 closed 60 ASHRAE 622 duty cycle
B3 overnight 11 Supply 180 33 20 10 closed 95 ASHRAE 622 duty cycle
B4 Jan 5 PM 4 Supply 63 33 duty 20 10 closed 33 ASHRAE 622 cycle
B5 overnight 13 Exhaust 63 5010 closed
B6 Jan 6 PM 6 Exhaust 63 2010 closed
B7 overnight 12 Exhaust 63 none closed Transfer grilles taped
B8 Jan 7 AM 4 Exhaust 63 50 10 closed Transfer grilles taped
B9 PM 4 Exhaust 63 none closed Transfer grilles taped extra injection in MBR
B10 PM 2 Exhaust 63 none open
B11 overnight 9 Supply 114 33 20 10 closed Transfer grilles taped duty cycle
B12 Jan 8 PM 3 None 0 100 closed Transfer grilles taped air handler bump test
B13 PM 2 None 0 100 closed Transfer grilles untaped
B14 PM 2 None 0 none open Natural infiltration
B15 overnight 9 Exhaust 63 none closed Master bath exhaust transfer grilles taped
B16 Jan 9 AM 4 Exhaust 63 50 10 closed Master bath exhaust
B17 PM 4 Supply 178 33 20 10 closed duty cycle
B18 overnight 12 Exhaust 63 none closed Master bath exhaust
TEST RESULTS FROM 1-STORY HOUSE (1111 MONTAGUE)
Natural Infiltration
A test of natural infiltration was conducted for an 8-hour period on December 30 to examine the magnitude and variability of outside air entering the house through leaks in the building envelope (Test A7) The tracer gas decay curves are shown in Figure 9 It is evident that the house was very well mixed during this test which allows a running instantaneous calculation of whole-house ACH over the same time period (see Figure 10) Although the air change rate indicated that the house is relatively tight (about 0085 ACH on average) the effect of natural infiltration was far from negligible especially when the wind was blowing This variability of natural infiltration must be kept in mind when interpreting the decay curves and reciprocal age-of-air calculations that follow
15 of 49
Research Report - 0602
An air handler bump test was performed between 1300 and 1500 hours to examine the effect of air handler operation on whole house air exchange rate including duct leakage to the outside and changes in room-to-room pressurization caused by moving air from the supply registers in each room to the central return in the main living area Figure 10 shows both the hourly average ACH and the wind speed during this period At first glance it appears that the air change rate increased by about 003 ACH when the fan was turned on but there was a coincident jump in wind speed that complicates this interpretation There was no corresponding decrease in ACH when the air handler was turned off at 1500 hours Ultimately we cannot conclusively quantify the change in ACH associated with operation of the air handler but it appears to have been no more than 003 ACH
3
Co
ncen
trati
on
(m
gm
)
70
60
50
40
30
20
10
0
Living
Entry
BR1
BR2
BR3
MBR
Air Handler On
Air Handler Off
8 9 10 11 12 13 14 15 16 17 18
Hour
Figure 9 Tracer gas decay for 1-story house with no ventilation and bedroom doors open with and without central fan operation (Test A7)
16 of 49
Research Report - 0602
40016
35014 Air Handler On Air Handler Off
ACH
Wind Speed
Air
Ch
an
ge
Ra
te (
AC
H) 30012
25010
20008
15006
10004
Win
d S
pe
ed
(m
ph
)
002 05
00
8 10 12 14 16 18
000
Hour
Figure 10 Average air change rate for 1-story house with no ventilation no central fan operation and bedroom doors open (Test A7)
The natural ventilation test was repeated on January 2 with the doors closed instead of open (Test A15) providing the decay curves shown in Figure 11 The average air change rate for this case was 0086 ACH calculated based on the two well-mixed cases at the beginning and end of the test It is difficult to compare this number with the doors-open case because it was windy (4-5 mph) for the first few hours of this test However it is very clear that the uniformity of room-toshyroom distribution of outside air was significantly less when the doors were closed even with transfer grilles We did not calculate age-of-air for this test because the test conditions were not sufficiently steady state This fact is very evident at about hour 15 where the BR2 and BR3 curves suddenly begin to diverge from the MBR curve
17 of 49
Research Report - 0602
0
10
20
30
40
50
60
70
80
90
Co
ncen
trati
on
(m
gm
3 )
Living
Entry
BR1
BR2
BR3
MBR
Mixing stopped
Mixing restarted
10 11 12 13 14 15 16 17 18 19
Hour
Figure 11 Tracer gas decay for 1-story house with no ventilation no central fan operation and bedroom doors closed (Test A15)
Distributed Supply vs Point Exhaust Ventilation
Two of the most common ventilation schemes in Building America homes are continuous single-point exhaust ventilation and intermittent central-fan integrated supply (CFIS) ventilation Exhaust ventilation is most commonly installed in a bathroom laundry room or utility room Make-up air enters through the cracks and holes in the building envelope upon depressurization of the house The distribution of outside air in a given room is fairly unpredictable because it depends on the amount of depressurization in the room the number and size of openings in exterior walls and the influence of adjacent rooms Supply ventilation provided by a central-fan integrated system tends to be distributed more uniformly throughout the house However the fan is usually operated on a duty cycle of about 33 to limit the electricity used by the central fan and one of the goals of this testing is to evaluate the effect of that duty cycle on the consistency of the air mixing
The decay curves for a 12-hour overnight test with exhaust ventilation (Test A3) are shown in Figure 12 The exhaust fan register in the laundry room was used as the exhaust point and the Duct Blaster was used to exhaust 58 cfm continuously corresponding to the minimum ventilation rate recommended by ASHRAE for a 2075 ft2 4-bedroom house It is evident from the decay curves that significantly more outside air reached the master bedroom and less reached Bedroom 2 compared to the other rooms in the house
18 of 49
Research Report - 0602
0
2
4
6
8
10
12
14
Co
nc
en
tra
tio
n
mg
m3
Living
Entry
BR1
BR2
BR3
MBR
Mixing stopped
Mixing restarted
17 18 19 20 21 22 23 0 1 2 3 4 5 6
Hour
Figure 12 Tracer gas decay for 1-story house with exhaust ventilation from the laundry room at ASHRAE 622 level no central fan operation and bedroom doors closed (Test A3)
The corresponding decay curves for the central fan integrated supply system (Test A6) are shown in Figure 13 The air handler operated at a 33 duty cycle (20 min off 10 min on) with a ventilation rate of 174 cfm resulting in an average ventilation rate of 58 cfm again meeting the minimum ASHRAE 622 recommendations The whole house appeared to be well-mixed in this case because the decay curves were clustered together throughout the test Even during the 20 minute periods when the air handler was off there was very little divergence A comparison of Figure 12 to Figure 13 indicates that much more uniform distribution of ventilation air was achieved by using the CFIS system
19 of 49
Research Report - 0602
0
2
4
6
8
10
12
14
16
Co
nc
en
trati
on
(m
gm
3 )
Living
Entry
BR1
BR2
BR3
MBR
Mixing stopped
Mixing restarted
185 195 205 215 225 235 05 15 25 35 45 55 65
Hour
Figure 13 Tracer gas decay for 1-story house with supply ventilation at ASHRAE 622 level 33 central fan operation (20 min off 10 min on) and bedroom doors closed (Test
A6)
Reciprocal age-of-air calculations were performed to provide a quantitative comparison of the two ventilation systems as shown in Figure 14 Values were in the range of 0169 hr-1 +0042shy0038 hr-1 for the exhaust ventilation system compared to 0173 hr-1 +0002-0003 hr-1 for the supply ventilation system expressed in terms of the range of differences between the reciprocal age-of-air in each room and the whole-house air change rate With the exhaust ventilation at the laundry room the master bedroom received the greatest amount of fresh air We suspect this may have been caused by the presence of the exhaust ducts used for spot ventilation of the master bathroom possibly providing greater leakage area near the master bathroom than is present in other areas of the house The supply system distributed the ventilation air more uniformly but it is not entirely clear whether this result was primarily caused by the introduction of ventilation air through the supply ducts or by the air handler mixing air throughout the house Since it is clear that the exhaust ventilation showed better uniformity of ventilation with central system mixing it follows that mixing is likely to be the primary factor in the room-to-room uniformity shown by CFIS ventilation
It is also noteworthy that the average net air change rates provided by both the supply and exhaust ventilation systems were only about 018 ACH compared to the 025 ACH that would be expected if the mechanical ventilation rate (017 ACH) and the natural infiltration rate (008 ACH) were additive as they might be with a balanced ventilation system Adding mechanical ventilation to natural infiltration in quadrature results in an estimated average air change rate of 019 ACH which is fairly consistent with the measured values
20 of 49
Research Report - 0602
Recip
rocal
Ag
e o
f A
ir (
1h
r) 025
020
015
010
005
000
Simple Exhaust vs Central Fan Integrated
Supply
Centralized supply mixing
33 duty cycle 100
ASHRAE doors closed
Living
Entry
BR1
BR2
BR3
MBR
Exhaust in utility room no
mixing 100 ASHRAE
doors closed
Figure 14 Reciprocal age-of-air for 1-story house with continuous exhaust ventilation (Test A3) compared to central fan integrated supply ventilation (Test A6)
Air Handler Operation
To determine how much room-to-room mixing was caused by the air handler the exhaust only test was re-run with the air handler operating at 33 duty cycle (20 min off 10 min on) (Test A12) The decay curves are shown in Figure 15 Compared to Test A3 (Figure 12) there was a noticeable increase in uniformity when the air handler was operating even though the entry points for the ventilation air were uncontrolled As shown in Figure 16 the range of reciprocal age of air was reduced from +0042-0038 hr-1 to +0019-0011 hr-1) It appears that operation of the air handler explains most of the difference between the supply and exhaust ventilation systems discussed earlier Although it also appears that the overall average air change rate was higher in the case where the air handler was operating (0216 ACH vs 0176) it should be noted that the average wind speed was also significantly higher It is likely that the wind speed was the primary cause of the difference in average ACH not a difference in the mechanical ventilation rate
21 of 49
Research Report - 0602
0
5
10
15
20
25
30
35
Co
nce
ntr
ati
on
(m
gm
3 )
Living
Entry
BR1
BR2
BR3
MBR
Mixing stopped
Mixing restarted
0 1 2 3 4 5 6 7 8 9 10 11 12 13 14
Hour
Figure 15 Tracer gas decay for 1-story house with continuous exhaust ventilation at ASHRAE 622 level 33 central fan operation (20 min off 10 min on) and bedroom
doors closed (Test A12)
Exhaust Ventilation No Mixing vs 33 Air Handler Duty Cycle
000
005
010
015
020
025
Recip
rocal A
ge o
f A
ir (
1h
r)
Living
Entry
BR1
BR2
BR3
MBR
Exhaust in utility room 33 air handler
no mixing 100 operation exhaust in
ASHRAE doors closed utility room 100
ASHRAE doors closed
Figure 16 Reciprocal age-of-air for 1-story house with continuous exhaust ventilation with and without air handler operation (Tests A3 and A12)
22 of 49
Research Report - 0602
Exhaust Location
The preceding analysis of exhaust ventilation was based on an exhaust point in the laundry room which was relatively centrally located in the 1-story house To examine the effect of moving the exhaust point the duct blaster was moved to the master bathroom which was located in a far corner of the house (Test A16) A continuous exhaust ventilation rate of 58 cfm was again applied to the house resulting in the tracer gas decay curve shown in Figure 17 It is difficult to visually identify a significant difference between this series of curves and those shown in Figure 12 for the laundry room exhaust location
Because the curves were steady it is again possible to compare the results based on reciprocal age-of-air as shown in Figure 18 There appeared to be very little change in the distribution of outside air to most rooms However the reciprocal age-of-air in the master bedroom dropped noticeably when the exhaust location was moved to the master bathroom probably because a greater fraction of the outside air now passed through other rooms before reaching the master bedroom With the exhaust point centrally located most of the ventilation air passing through the master bedroom probably entered from the outside In both cases however the master bedroom had the highest reciprocal age-of-air of all of the rooms in the house and the BR2 location had the lowest
Co
nc
en
tra
tio
n (
mg
m3)
40
35
30
25
20
15
10
5
0
Living
Entry
BR1
BR2
BR3
MBR
Mixing stopped
Mixing restarted
19 20 21 22 23 0 1 2 3 4 5 6 7 8
Hour
Figure 17 Tracer gas decay for 1-story house with exhaust ventilation from the master bathroom at ASHRAE 622 level no central fan operation and bedroom doors closed (Test
A16)
23 of 49
Research Report - 0602
Exhaust Ventilation
Laundry Room vs Master Bathroom
000
005
010
015
020
025
Exhaust in laundry
room no mixing 100
ASHRAE doors closed
Exhaust in master
bathroom no mixing
100 ASHRAE doors
closed
Re
cip
roc
al A
ge
of
Air
(1
hr)
Living
Entry
BR1
BR2
BR3
MBR
Figure 18 Reciprocal age-of-air for 1-story house with exhaust ventilation from the master bathroom compared to the laundry room at ASHRAE 622 level no central fan operation
and bedroom doors closed (Tests A3 and A16)
Ventilation Rate
The supply ventilation test was repeated using flow rates corresponding to 60 and 33 of the ASHRAE recommendations The intent of this series of tests was to evaluate the room-to-room ventilation uniformity for ventilation rates consistent with ASHRAE 622 compared to the uniformity for reduced mechanical ventilation rates Each test was conducted for only 4 hours because of time limitations The decay curves are shown in Figures 19 and 20 Because the rooms were well-mixed during the supply ventilation tests the average whole-house ACH can be compared directly to the reciprocal age-of-air for the exhaust ventilation tests Figure 21 shows the supply ventilation air change rate for each of the three ventilation levels (33 60 100) compared to room-by-room reciprocal age-of-air for the exhaust ventilation system based on the boundary conditions present during the tests It appears that in the supply ventilation case all rooms receive more outside air than the least-ventilated room in the exhaust case (BR2) even at 60 of ASHRAE 622 These results serve to illustrate the trade-off between whole-house ventilation rate and room-to-room ventilation uniformity in terms of their impact on the worst room(s)
24 of 49
Research Report - 0602
The ASHRAE 622 committee has not currently defined the level of mixing that is required when choosing the minimum ventilation rate Some might interpret the results of this test to suggest that a house without mixing can have individual rooms that do not receive sufficient outside air even though the ventilation system is operating at 622 specified rates Because the 622 committee has not specified the level of mixing that is required when choosing the minimum ventilation rate the ventilation rate required by different ventilation systems is open to interpretation For example if the exhaust system performance shown in Figure 21 is acceptable does this mean that a ventilation system that provides good distribution of outside air may be sufficiently well-ventilated at 60 of the ASHRAE 622 level or perhaps even less Alternatively it might be concluded that exhaust ventilation rates should be increased over current ASHRAE 622 recommendations because of the possibility that certain rooms may receive very little fresh air Unfortunately because the current 622 standard does not specify air mixing requirements and the committeersquos assumptions about ventilation air distribution are not well documented it is difficult to make any firm recommendations in this area However we can conclude that air mixing is required for dilution ventilation systems to provide predictable results independent of the geometry of individual homes
8 9 10 11 12 13 14
Hour
Figure 19 Tracer gas decay for 1-story house with supply ventilation at 60 of ASHRAE 622 level 33 central fan operation (20 min off 10 min on) and bedroom doors closed
(Test A4)
0
10
20
30
40
50
60
Co
nce
ntr
ati
on
m
gm
3
Living
Entry
BR1
BR2
BR3
MBR
Mixing stopped
Mixing restarted
25 of 49
Research Report - 0602
0
5
10
15
20
25
30
Co
nce
ntr
ati
on
(m
gm
3 )
Living
Entry
BR1
BR2
BR3
MBR
Mixing stopped
Mixing restarted
12 13 14 15 16 17 18 19 20
Hour
Figure 20 Tracer gas decay for 1-story house with supply ventilation at 33 of ASHRAE 622 level 33 central fan operation (20 min off 10 min on) and bedroom doors closed
(Test A5)
Simple Exhaust vs Central Fan Integrated
Supply with Lower Ventilation Rates
025
Re
cip
roc
al A
ge
of
Air
(1
hr)
Well Mixed
100
ASHRAE 60
ASHRAE 33
ASHRAE Living Entry 010 Natural
BR1 Infilt
BR2 BR3 005
MBR
Exhaust in laundry room no
000
Central supply Natural infil-
mixing 100 ASHRAE doors mixing 33 duty tration doors
closed cycle doors closed open
Figure 21 Reciprocal age-of-air for 1-story house with supply ventilation at 33 60 and 100 of ASHRAE 622 level (Tests A5 A4 A6) compared to exhaust ventilation with
no central fan operation (Test A3) Bedroom doors were closed
020
015
26 of 49
Research Report - 0602
Simulations by Walker (2006) have shown that all systems will not provide the same service in terms of annual average air change rate For the same air flow rate and duty cycle balanced ventilation will yield a higher average air exchange than supply ventilation and supply ventilation will yield a higher average air exchange than exhaust ventilation That can be explained in general terms by understanding that wind and stack effects act to depressurize a building most of the time Exhaust fans increase the building depressurization further but supply fans decrease the depressurization Balanced fans donrsquot change the enclosure differential pressure and air flow at all Because of the non-linear relationship between differential pressure and air flows across the building enclosure a supply fan changes the pressures across the enclosure less than an exhaust fan acting more like a balanced fan The result is that the effect on ventilation air change rate from a supply fan is somewhere between that of an exhaust fan and a true balanced system
Bedroom Doors
Except for the natural ventilation test the preceding tests were all conducted with the bedroom doors closed to simulate a worst-case situation for air circulation within the house The exhaust ventilation test was repeated with the bedroom doors open (Test A9) producing the tracer gas decay curve shown in Figure 22 It is evident that the decay curves were much more tightly bundled with the doors open than they were with the doors closed (compare Figure 12) A comparison based on reciprocal age-of-air is shown in Figure 23 A significant improvement in room-to-room mixing is evident during the open-door test
It is also evident that the average air change rate was higher when the doors were open (0202 vs 0176 ACH) but it must be remembered that the ventilation rate was controlled using a duct blaster and average wind speed was higher during the open-door test period compared to the closed-door test period (20 mph compared to 06 mph) Therefore this test alone does not necessarily indicate that closing doors reduces the average air change rate associated with an exhaust system In future tests continuous measurement of the depressurization of the house with respect to outside along with single-point pressure measurements across interior doors would provide more information about the effect of closing doors when exhaust ventilation systems are used It would also be valuable to conduct this test during steady weather conditions using the exhaust fan (with uncontrolled ventilation rate) instead of the duct blaster to observe the net effect of closed doors on whole-house air change rate
27 of 49
Research Report - 0602
0
5
10
15
20
25
30
Co
ncen
trati
on
(m
gm
3 )
Living
Entry
BR1
BR2
BR3
MBR
Mixing stopped
Mixing restarted
181 191 201 211 221 231 01 11 21 31 41 51 61 71
Hour
Figure 22 Tracer gas decay for 1-story house with exhaust ventilation from the laundry room at ASHRAE 622 level no central fan operation and bedroom doors open (Test A9)
Exhaust Ventilation
Doors Closed vs Doors Open
000
005
010
015
020
025
Re
cip
roc
al
Ag
e o
f A
ir (
1h
r)
Living
Entry
BR1
BR2
BR3
MBR
Exhaust in laundry room Doors open no mixing
no mixing 100 exhaust in laundry room
ASHRAE doors closed 100 ASHRAE
Figure 23 Reciprocal age-of-air for 1-story house with exhaust ventilation from the laundry room at ASHRAE 622 level no central fan operation In the first case the bedroom doors were closed (Test A3) in the second the doors were open (Test A9)
28 of 49
Research Report - 0602
Transfer Grilles
Because the test houses used central returns instead of hard ducted returns in the bedrooms transfer grilles were installed over the bedroom doors to provide a flow path for return air without excessive room pressurization when the doors were closed These transfer grilles also allowed ventilation air to pass more freely from the bedrooms to the main living space The effect of transfer grilles on ventilation air distribution was evaluated by taping over the grilles (see Figure 24) and re-running the exhaust ventilation test (Test A10) The corresponding tracer gas decay curve is shown in Figure 25 and the reciprocal age-of-air analysis is shown in Figure 26 Taping the transfer grilles did not appear to significantly affect the room-to-room variability in ventilation rate although there appeared to be some slight re-ranking of rooms from highest to lowest reciprocal age-of-air It should be noted that there was an increase in average wind speed from 26 mph to 41 mph starting at 1 pm including a half hour period where the average wind speed was 7 mph This weather effect produced noticeable kinks in the decay curves and therefore would be expected to introduce significant errors into the reciprocal age-of-air results
Itrsquos possible that the transfer grilles played a much smaller role in providing a path for ventilation air than the supply ducts Because the air handler was not operating the ducts were not pressurized and were thus available as passive airflow conduits The resistance to air flow was probably smaller for the air ducts than for the transfer grilles depending on their size and the number of supply registers in each bedroom The existing door undercuts are also thought to have played a role The effect of ducts and door undercuts can be tested in the future by running separate tests with ducts and door undercuts taped over
copy buildingsciencecom
Figure 24 Transfer grilles over bedroom doors taped closed
29 of 49
Research Report - 0602
0
10
20
30
40
50
60
70
Co
nc
en
tra
tio
n (
mg
m3 )
Living
Entry
BR1
BR2
BR3
MBR
Mixing stopped
Mixing restarted
8 9 10 11 12 13 14 15 16 17
Hour
Figure 25 Tracer gas decay for 1-story house with exhaust ventilation from the laundry room at ASHRAE 622 level no central fan operation bedroom doors closed and transfer
grilles taped (Test A10)
Exhaust Ventilation
000
005
010
015
020
025
Re
cip
roc
al
Ag
e o
f A
ir (
1h
r)
Living
Entry
BR1
BR2
BR3
MBR
Transfer Grilles Untaped vs Taped
Exhaust in laundry room no Exhaust in laundry room no
mixing 100 ASHRAE mixing 100 ASHRAE
doors closed doors closed transfer
grilles taped
Figure 26 Reciprocal age-of-air for 1-story house with exhaust ventilation from the laundry room at ASHRAE 622 level no central fan operation and doors closed In the
30 of 49
Research Report - 0602
first case the transfer grilles are untaped (Test A3) in the second they are taped closed (Test A10)
Minimum Test Duration
We were fortunate that DR Horton provided two full weeks of access to these homes to conduct this series of tests which allowed us to run some of the more important tracer gas decay tests as long as 12 hours to help ensure that we could accurately calculate reciprocal age-of-air In most cases test houses would not be available for such a long time period To evaluate the length of time needed to estimate the reciprocal age-of-air with reasonable accuracy we examined the results that we would have obtained for one of the exhaust ventilation tests had we halted the test period after less than 12 hours For the supply ventilation tests the rooms were sufficiently well-mixed that the test could have been stopped after 3 or 4 hours assuming weather effects were steady
The reciprocal age-of-air calculations for the exhaust ventilation decay curves (Test A3 see Figure 12) based on test durations of 3 6 9 and 12 hours are shown in Figure 27 These test durations range from 053 to 21 air changes based on the average air change rate of 018 ACH (56 hours per air change) calculated for this test The ratio of highest to lowest reciprocal ageshyof-air is shown above the data points for each case These results suggest that shorter tests tend to overestimate the range and that perhaps 1frac12-2 air changes (roughly 9 to 12 hours in this case) may be necessary to obtain accurate calculations of reciprocal age-of-air when there is significant divergence among rooms From a qualitative standpoint one air change may be sufficient to determine the basic trend Without knowing in advance what mixing pattern will occur it is difficult to recommend a minimum test duration But assuming this test is fairly representative of a worst-case scenario a minimum of 15 air changes would be necessary to have a high degree of confidence in the quantitative difference in reciprocal age-of-air among rooms
31 of 49
Research Report - 0602
000
005
010
015
020
025
030
035
Re
cip
roc
al
Ag
e-O
f-A
ir (
hr-1
)
Living
Entry
BR1
BR2
BR3
MBR HighLow = 297
HighLow = 168 HighLow = 184 HighLow = 161
3-hour Test 6-hour Test 9-hour Test 12-hour Test
(053 Air Changes) (11 Air Changes) (16 Air Changes) (21 Air Changes)
Test Duration
Figure 27 Reciprocal age-of-air based on alternate test durations for 1-story house with exhaust ventilation from the laundry room at ASHRAE 622 level no central fan operation
and doors closed (Test A3) Average air change rate was 018 ACH
TEST RESULTS FROM 2-STORY HOUSE (1117 MONTAGUE)
The 2-story house was tested from January 3-10 2006 Three zones were selected on the first floor and three more were selected on the second floor as indicated by the red stars in Figure 4 The initial mixing of air among the rooms at the start of each test in this 2-story house was not as thorough as it was in the 1-story house Evidently the combined effects of the air handler and the portable de-stratification fan were not sufficient to overcome upward transport of tracer gas driven by the stack effect from the first to the second floor The resulting difference in initial tracer gas concentration among the rooms was about 5-10 This outcome emphasizes the significant effect of stack-driven infiltration on ventilation non-uniformity in multi-story homes Because our test method and equipment did not achieve a well-mixed condition at the start of each test there were some errors introduced into the reciprocal age-of-air analysis For future tests we would recommend larger de-stratification fans to obtain more well-mixed conditions in multi-story houses
Typical errors introduced by incomplete mixing of the tracer gas at the start of such a test were analyzed by examining two hypothetical cases where either all of the air entering a room comes from the outside or all of the air comes from an adjacent room with a different starting concentration If all of the air entering a space comes from the outside then a change in the initial concentration would have no effect on the reciprocal age-of-air because the decay curve would be exponential from the start and the area under the curve would be normalized based on
32 of 49
Research Report - 0602
the starting concentration in that zone However if the air entering a room passes through another room with a lower initial concentration the room receiving the air will have a lower concentration of tracer gas throughout the test compared to what the concentration would have been if the starting points were the same in both rooms This case is illustrated in Figure 28 where assumptions are made that the rooms are the same size the air exchange rate is 01 ACH for both rooms and the initial tracer gas concentration is 10 lower in the first room (upstream) than it is in the second room
The effect on reciprocal age-of-air is shown in Figure 29 A 10 difference in starting concentration results in an error of about 75 in reciprocal age-of-air for a room downstream of a room with a lower starting concentration assuming 01 ACH for both rooms The error would be somewhat smaller (about 5) if the air change rate was higher for both rooms (02 ACH) There would be no error introduced for rooms where all of the air infiltration comes from the outside Although the amount of error in the reciprocal age-of-air calculations can be affected by additional variables not examined here we feel that these percentages are reasonable estimates of the errors in our results for the 2-story house due to incomplete initial mixing of air
In each case an engineering judgment must be made regarding the significance of the error introduced by incomplete initial mixing As a general rule the differences in concentration at the start of the test should be small compared to the differences that are being measured in order for the results to be considered valid
Figure 28 Theoretical decay curves for a well-mixed case with uniform tracer gas concentration compared to a case where the upstream room starts with a concentration
10 lower than the downstream room
33 of 49
Research Report - 0602
Figure 29 Theoretical reciprocal age-of-air for a well-mixed case with uniform tracer gas concentration compared to a case where the upstream room starts with a concentration
10 lower than the downstream room
Natural Infiltration and Duct Leakage
A natural infiltration test was performed over a two hour period on the evening of January 8 (Test B14) The tracer gas decay curves are shown in Figure 30 There was a slight divergence between the first floor and second floor once the air handler was turned off but the rooms on each floor appeared to remain fairly well-mixed The average air change rate during the test period was about 011 ACH which was somewhat higher than the 1-story house as might be expected with an increased stack height
An air handler bedroom door bump test was conducted just prior to the test period shown in Figure 30 allowing observation of the combined effect of duct leakage to the outside and increased infiltration caused by room pressurization The average air change rate during that bump test was 013 ACH suggesting that closing doors and operating the fan added approximately 002 ACH to the whole-house average air change rate The average wind speed was a bit higher while the air handler was running (17 mph compared to 05 mph) so the effect of air handler operation may actually be somewhat less than the average ACH numbers indicate
34 of 49
Research Report - 0602
0
1
2
3
4
SF
6 C
on
ce
ntr
ati
on
(m
gm
3)
BR1
Living
Kitchen
BR2
BR3
MBR
Mixing stopped
Mixing restarted
1814 1843 1912 1940 2009 2038 2107 2136
Hour
Figure 30 Tracer gas decay for 2-story house with no ventilation no central fan operation and bedroom doors open (Test B14)
Distributed Supply vs Point Exhaust Ventilation
A 14-hour test (Test B1) was performed with an exhaust ventilation rate of 63 cfm in the laundry room which was located near the stairwell in the middle of the first floor The ventilation rate was again consistent with the ASHRAE 622 recommendations The tracer gas decay curves are shown in Figure 31 It is interesting that all three second floor rooms showed a delay before entering an exponential decay suggesting that some amount of air was moving from the first floor to the second floor even though the mechanical exhaust point was on the first floor It appears that the further depressurization of the first floor was insufficient to overcome the stack effect and draw a significant amount of outside air in through the rooms on the second floor
35 of 49
Research Report - 0602
182
9
192
9
202
9
212
9
222
9
232
9
029
129
229
329
429
529
629
729
828
929
102
8
112
8
122
8
0
10
20
30
40
50
60
70
SF
6 C
on
ce
ntr
ati
on
(m
gm
3)
BR1
Living
Kitchen
BR2
BR3
MBR
Mixing stopped
Mixing restarted
Hour
Figure 31 Tracer gas decay for 2-story house with exhaust ventilation from the laundry room at ASHRAE 622 level no central fan operation and bedroom doors closed (Test B1)
A supply ventilation test was performed on the 2-story house for about 11 hours starting late on January 4 (Test B3) The duct blaster was unable to provide the ventilation rate necessary to meet the minimum specified in ASHRAE 622 supplying 180 cfm instead of 189 cfm (95) The decay curves are shown in Figure 32 Although the curves are much more tightly packed than they were with the exhaust system there is more divergence than we saw with the supply system in the 1-story house most notably in the master bedroom
The reciprocal age-of-air calculations for both the exhaust and supply ventilation systems are shown in Figure 33 Again the results indicate that much better room-to-room distribution of ventilation air was achieved by the central-fan integrated supply system compared to the single-point exhaust system However for the supply ventilation test the differences in the initial tracer gas concentration were of the same magnitude as the differences in decay rates among the rooms As a result no conclusions should be drawn about the relative ranking of the supply ventilation rate among rooms based on Figure 33
36 of 49
Research Report - 0602
0
10
20
30
40
50
60
SF
6 C
on
ce
ntr
ati
on
(m
gm
3)
BR1
Living
Kitchen
BR2
BR3
MBR
Mixing stopped
Mixing restarted
2136 000 224 448 712 936 1200
Hour
Figure 32 Tracer gas decay for 2-story house with supply ventilation just under ASHRAE 622 level central fan operation at 33 duty cycle (20 min off 10 min on) and bedroom
doors closed (Test B3)
Simple Exhaust vs Central Fan Integrated
Supply )
000
005
010
015
020
025
Recip
rocal A
ge o
f A
ir (
1h
r
BR1
Living
Kitchen
BR2
BR3
MBR
Exhaust in laundry room no Centralized supply mixing
mixing 100 ASHRAE 33 duty cycle 95
doors closed ASHRAE doors closed
Figure 33 Reciprocal age-of-air for 2-story house with continuous exhaust ventilation (Test B1) compared to central fan integrated supply ventilation (Test B3) (Note
Uncertainties introduced by non-uniform starting concentration are of the same order of magnitude as the differences in reciprocal age-of-air among rooms for the supply ventilation case The relative ranking of rooms is not meaningful for that case)
37 of 49
Research Report - 0602
Air Handler Operation
The effect of occasional air handler operation on the distribution of exhaust ventilation air was evaluated on the afternoon of January 6 (Test B6) The tracer gas decay curves are shown in Figure 34 and reciprocal age-of-air calculations are shown in Figure 35 It should again be noted that before the test started the house was mixed using both the air handler and a de-stratification fan with the doors open During the test the doors were closed the de-stratification fan was turned off and the air handler operated at a 33 duty cycle (20 minutes off 10 minutes on) As was the case in the 1-story house this occasional operation of the air handler substantially improved the distribution of ventilation air among rooms even in conjunction with the point exhaust ventilation system There was very little divergence noticeable even with the air handler cycling on and off every half hour However because the initial differences in tracer gas concentration among rooms were as large as the differences in reciprocal age-of-air for the case with air handler operation no conclusions should be drawn about the relative ranking of ventilation rates among the rooms for that case
SF
6 C
on
cen
trati
on
(m
gm
3)
80
70
60
50
40
30
20
10
0
BR1
Living
Kitchen
BR2
BR3
MBR
Mixing stopped
Mixing restarted
1048 1200 1312 1424 1536 1648 1800 1912 2024
Hour
Figure 34 Tracer gas decay for 2-story house with continuous exhaust ventilation at ASHRAE 622 level central fan operation at 33 duty cycle (20 min off 10 min on) and
bedroom doors closed (Test B6)
38 of 49
Research Report - 0602
020
015 R
ec
ipro
ca
l A
ge
of
Air
(1
hr)
Exhaust Ventilation
No Mixing vs 33 Air Handler Duty Cycle
Exhaust in laundry room
no mixing 100
ASHRAE doors closed
33 air handler
operation exhaust in
laundry room 100
ASHRAE doors closed
BR1
Living
Kitchen
BR2
BR3
MBR
010
005
000
Figure 35 Reciprocal age-of-air for 2-story house with continuous exhaust ventilation with and without air handler operation (Tests B1 and B6) (Note Uncertainties introduced by non-uniform starting concentration are of the same order of magnitude as the differences in reciprocal age-of-air among rooms for the case with air handler operation The relative
ranking of rooms is not meaningful for that case)
Exhaust Location
The duct blaster was moved to the master bathroom exhaust register to see if there was a resulting change in ventilation air distribution (Test B18) The master bathroom was in the back of the house on the second floor between the master bedroom and bedroom 3 The decay curves are shown in Figure 36 and the reciprocal age-of-air results are shown in Figure 37 The rooms on each floor were well mixed before the test began although the mixing between the two floors was not as good Very wide divergence among rooms can be seen during the test especially between the upstairs bedrooms and the rest of the house Once again all three upstairs rooms appear to receive some air from the first floor but the master bedroom experiences a much higher volume of circulated air than the other two second-floor bedrooms which appear to be relatively stagnant
39 of 49
Research Report - 0602
0
10
20
30
40
50
60
70
80
90
SF
6 C
on
ce
ntr
ati
on
(m
gm
3)
BR1
Living
Kitchen
BR2
BR3
MBR
Mixing stopped
Mixing restarted
1912 2136 000 224 448 712 936 1200
Hour
Figure 36 Tracer gas decay for 2-story house with exhaust ventilation from the master bathroom at ASHRAE 622 level no central fan operation and bedroom doors closed (Test
B18)
Exhaust Ventilation
Laundry Room vs Master Bathroom
000
005
010
015
020
025
030
Exhaust in laundry room no
mixing 100 ASHRAE
doors closed
Exhaust in master bathroom
no mixing 100 ASHRAE
doors closed
Re
cip
roc
al A
ge
of
Air
(1
hr)
BR1
Living
Kitchen
BR2
BR3
MBR
Figure 37 Reciprocal age-of-air for 2-story house with exhaust ventilation from the master bathroom compared to the laundry room at ASHRAE 622 level no central fan operation
and bedroom doors closed (Tests B1 and B18)
40 of 49
Research Report - 0602
Ventilation Rate
The supply ventilation tests were repeated using flow rates of 60 and 33 of ASHRAE 622 recommendations corresponding to 114 cfm and 63 cfm respectively (Tests B2 and B4) The decay curves are shown in Figures 38 and 39 Reciprocal age-of-air for all three supply ventilation rates are shown in Figure 40 In all cases the rooms remained fairly well mixed especially rooms on the same floor As we observed in the 1-story house the ventilation rate in the 2-story house appeared to have very little effect on the uniformity of outside air provided to each room as long as it was mixed using the air handler One again the initial differences in tracer gas concentration among rooms were as large as the divergence in the decay curves preventing any conclusions about the relative ranking of ventilation rates among rooms for all three cases The error in initial concentration uniformity was bigger for the cases with air handler mixing because the relative divergence in the decay curves was so small compared to that of no air handler mixing In other words the error in relative ranking of ventilation rates for the cases with air handler mixing were not very important anyway because the relative differences between rooms were so small
1536 1648 1800 1912 2024 2136 2248
Hour
Figure 38 Tracer gas decay for 2-story house with supply ventilation at 60 of ASHRAE 622 level 33 central fan operation (20 min off 10 min on) and bedroom doors closed
(Test B2)
0
5
10
15
20
25
30
SF
6 C
on
cen
trati
on
(m
gm
3)
BR1 Living Kitchen BR2 BR3 MBR
Mixing stopped
Mixing restarted
41 of 49
Research Report - 0602
0
5
10
15
20
25
30
35
40
SF
6 C
on
cen
trati
on
(m
gm
3)
BR1
Living
Kitchen
BR2
BR3
MBR
Mixing stopped
Mixing restarted
1200 1312 1424 1536 1648 1800 1912
Hour
Figure 39 Tracer gas decay for 2-story house with supply ventilation at 33 of ASHRAE 622 level 33 central fan operation (20 min off 10 min on) and bedroom doors closed
(Test B4)
Supply Ventilation Rate Comparison
000
005
010
015
020
025
Re
cip
roc
al
Ag
e o
f A
ir (
1h
r)
BR1
Living
Kitchen
BR2
BR3
MBR
Centralized supply Centralized supply Centralized supply
mixing 33 duty mixing 33 duty mixing 33 duty
cycle 95 ASHRAE cycle 60 ASHRAE cycle 33 ASHRAE
doors closed doors closed doors closed
Figure 40 Reciprocal age-of-air for 2-story house with three levels of supply ventilation central fan operation at 33 duty cycle (20 min off 10 min on) and bedroom doors closed (Tests B3 B2 B4) (Note Uncertainties introduced by non-uniform starting
concentration are of the same order of magnitude as the differences in reciprocal age-of-air among rooms for all three cases The relative ranking of rooms is not meaningful for these
cases)
42 of 49
Research Report - 0602
The average air change rates for the three supply ventilation rates compared to the two exhaust ventilation schemes are shown in Figure 41 The CFIS system at 33 of the 622 ventilation flow rate provided a uniformly higher air change rate (013 ach) than the least ventilated rooms using exhaust ventilation from either the laundry or the master bathroom (010 ach Figure 37) It is noteworthy that the combined net air change rate with exhaust ventilation from the laundry room was significantly less than the air change rates for both exhaust ventilation from the master bathroom and supply ventilation at the air handler This illustrates the unpredictability of interactions between mechanical ventilation and natural infiltration which depend strongly on the distribution and size of cracks through which the outside air must pass to enter the house There may have been a relatively large building enclosure leakage opening near the laundry room (perhaps the utility penetrations or the door to the garage) that allowed a significant amount of outside air to quickly enter and leave the house through the exhaust flow without circulating around the house
0
005
01
015
02
025
Ave
rag
e A
CH
Natural Exhaust Exhaust Supply 95 Supply 60 Supply 33
Laundry Mbath
Rm 100 100
Figure 41 Average air change rates for 2-story house with supply ventilation at 33 60 and 95 of ASHRAE 622 recommendations (Tests B4 B2 B3) compared to natural
infiltration (Test B14) and exhaust ventilation with no central fan operation (Test B1) Bedroom doors were closed except for the natural infiltration test
Bedroom Doors
The laundry room exhaust ventilation test with no air handler operation (see Figure 31) was repeated with the doors open to evaluate the change in room-to-room ventilation air distribution (Test B10) The decay curves are shown in Figure 42 and the reciprocal age-of air calculations are shown in Figure 43 It is evident from Figure 42 that the test began before the rooms were
43 of 49
Research Report - 0602
0
5
10
15
20
25
SF
6 C
on
ce
ntr
ati
on
(m
gm
3)
BR1 Living Kitchen BR2 BR3 MBR
Mixing stopped
Mixing restarted
completely well mixed resulting in decay curves that could be somewhat misleading Because the master bedroom was at a higher concentration than the other rooms at the start of the test any room that received air from the master bedroom would appear to have a slower decay rate than it would have if the rooms started out at the same concentration Despite the difference in starting concentration it is clear that outside air was well distributed when the doors were open even without operation of the air handler
1843 1912 1940 2009 2038 2107 2136 2204 2233 2302
Hour
Figure 42 Tracer gas decay for the 2-story house with exhaust ventilation from the laundry room at ASHRAE 622 level no central fan operation and bedroom doors open
(Test B10)
Reciprocal age-of-air analysis was not performed for this case because of the combined effect of a short test duration (~2 hours) and unequal starting tracer gas concentrations even though the house was relatively well-mixed The important conclusion (that opening doors greatly improves mixing) can be drawn by inspecting the decay curves alone
Transfer Grilles
A final exhaust ventilation test was run on the 2-story house with the doors closed and the transfer grilles taped over The decay curves are shown in Figure 43 and the reciprocal age-ofshyair calculations are shown in Figure 44 The curves were clearly very divergent even after 12 hours By examining the reciprocal age-of-air results it is apparent that the transfer grilles in the 2-story house caused a noticeable improvement in ventilation air distribution but the improvement was smaller than when the doors were opened (Figure 42)
44 of 49
Research Report - 0602
0
5
10
15
20
25
30
SF
6 C
on
cen
tra
tio
n (
mg
m3
) BR1 Living Kitchen BR2 BR3 MBR
Mixing stopped
Mixing restarted
1648 1912 2136 000 224 448 712 936
Hour
Figure 43 Tracer gas decay for 2-story house with exhaust ventilation from the laundry room at ASHRAE 622 level no central fan operation bedroom doors closed transfer
grilles taped closed (Test B7)
Exhaust Ventilation Transfer Grilles Untaped vs Taped
000
005
010
015
020
Re
cip
roc
al
Ag
e o
f A
ir (
1h
r)
BR1
Living
Kitchen
BR2
BR3
MBR
Exhaust in laundry room no Exhaust in laundry room no
mixing 100 ASHRAE mixing 100 ASHRAE
doors closed doors closed transfer
grilles taped
Figure 44 Reciprocal age-of-air for 2-story house with exhaust ventilation from the laundry room at ASHRAE 622 level no central fan operation and doors closed In the first case the transfer grilles are untaped (Test B3) in the second they are taped closed
(Test B7)
45 of 49
Research Report - 0602
CONCLUSIONS
bull Reciprocal age-of-air analysis was chosen as a quantitative method for characterizing distribution of ventilation air among rooms This method worked well in cases where rooms were well mixed to begin the test and weather conditions were sufficiently steady-state
bull A test period of at least 1frac12 air changes was necessary to obtain reasonably accurate ageshyof-air results when there was significant divergence in tracer gas concentration among the rooms
bull Although we did not achieve uniform initial concentration of tracer gas in the 2-story house using our test methodology and the equipment at hand we believe the reciprocal age-of-air calculations were meaningful in many of the cases as indicated in the discussion
bull Both houses were relatively tight with natural infiltration averaging 008 ACH for the 1shystory house and 011 ACH for the 2-story house
bull Both houses had relatively small (but not negligible) duct losses to the outside producing an increase in infiltration of less than 003 ACH for the 1-story house and 002 ACH for the 2-story house when the air handler runs
bull Age-of-air analysis indicated that ventilation supplied through the central air distribution system provided much more uniform distribution of ventilation air than the single-point exhaust system when the doors were closed and the air handler was not running For the 1-story house the central-fan-integrated supply ventilation case at 60 of ASHRAE 622 provided more outside air to all rooms than the least-ventilated room in the exhaust case at 100 of 622 For the 2-story house the central-fan-integrated supply system at 33 of the 622 flow rate provided more outside air to all rooms than the least ventilated rooms using exhaust ventilation at 100 of 622 from either the laundry or the master bathroom
bull Operation of the central fan at a 33 duty cycle maintained relatively well-mixed conditions regardless of ventilation rate type of ventilation system (supply or exhaust) or house configuration (1-story or 2-story)
bull Exhaust location affected both the relative amount of outside air received by different rooms and the overall uniformity among rooms but the effect was not predictable
bull For exhaust-only ventilation without central fan operation opening bedroom doors appeared to significantly improve the mixing of ventilation air among rooms
bull Transfer grilles improved the distribution of ventilation air slightly but much less than opening the bedroom doors
bull In the 2-story house the stack effect caused air movement from the first floor to the second floor even when exhaust ventilation was applied to the first floor resulting in consistently higher tracer gas concentrations on the second floor and more non-uniform ventilation air distribution in general
bull Interactions between natural infiltration and both exhaust and supply mechanical ventilation were very significant When the ventilation system was activated the combined air change rate did not increase commensurate with the measured ventilation rate but instead increased by only half that amount This result was consistent with combining ventilation and infiltration in quadrature to estimate whole-house air change rate in accordance with ASHRAE Standard 136 (ASHRAE 1993)
46 of 49
Research Report - 0602
FUTURE WORK
In future tests continuous monitoring of pressure differentials would enhance our understanding of the multi-zone combined infiltration and ventilation systems and our ability to model them That would help to explain differences between tests in more detail including the effects of multiple stories location of ventilation supply outlets and exhaust inlets interior door closure and use of passive return air transfer grilles Pressure differential measurement points should include
bull dP with respect to outside for each closed room and open space bull dP across closed interior doors bull dP between the floor cavity and outdoors and bull dP between the house and the attic
Measurement of wind direction along with wind speed could also be helpful for modeling these buildings and systems However because of micro-climate wind shielding it may be very difficult to relate a single-point wind direction measurement to actual wind vectors on the building surfaces
ACKNOWLEDGMENTS
The authors express their appreciation to Rich Coyle of DR Horton for providing the test houses and to Joseph Lstiburek of BSC Subrato Chandra and Neil Moyer of FSEC and Greg Barker of Mountain Energy Partnership for their assistance in the planning and execution of this ventilation study
47 of 49
Research Report - 0602
REFERENCES
ASHRAE (1993) ANSIASHRAE Standard 136-1993 A Method of Determining Air Change Rates in Detached Dwellings Atlanta GA American Society of Heating Refrigerating and Air-Conditioning Engineers Inc
ASHRAE (1997) ANSIASHRAE Standard 129-1997 Measuring Air-Change Effectiveness Atlanta GA American Society of Heating Refrigerating and Air-Conditioning Engineers Inc
ASHRAE (2004) ASHRAE Standard 622-2004 Ventilation and Acceptable Indoor Air Quality in Low-Rise Residential Buildings Atlanta GA American Society of Heating Refrigerating and Air-Conditioning Engineers Inc
CSA (2003) CANCSA F326-M91 Residential Mechanical Ventilation Systems Canadian Standards Association Ontario Canada httpwwwcsashyintlorgonlinestoreGetCatalogItemDetailsaspmat=2410793ampParent=102
NBC 2005 National Building Code of Canada httpircnrcshycnrcgccapubscodesnrcc47666_ehtml
Grieve PW (1991) Measuring Ventilation Using Tracer-Gases Denmark Bruumlel amp Kjaeligr
MN Chapter 7672 Minnesota Energy Code Chapter 7672 Detached Single-Family And Two-Family Dwellings httpwwwstatemnusmnexternalDocsCommerceChapter_7672_Residential_111302012428 _72rulepdf
Persily AK Martin SR (2000) A Modeling Study of Ventilation in Manufactured Houses Gaithersburg MD National Institute of Standards and Technology NISTIR 6455
Rudd A Lstiburek J (2000) ldquoMeasurement of Ventilation and Interzonal Distribution in Single-Family Homesrdquo ASHRAE Transactions 2000 MN-00-10-3 V 106 Pt2 American Society of Heating Refrigeration and Air-Conditioning Engineers Atlanta GA
WAC (2004) Washington State Title 51 WAC Community trade and economic development department of (building code council) Chapter 51-13 Ventilation and indoor air quality httpappslegwagovWACdefaultaspxcite=51-13
48 of 49
Research Report - 0602
Field test of room-to-room uniformity of ventilation air distribution in two new houses
About this Report
This report was prepared for the US Department of Energyrsquos Building America
Program The report is freely available to the public at wwwbuildingamericagov
The authors express their appreciation to Rich Coyle of DR Horton for providing the test houses and to Joseph Lstiburek of BSC Subrato Chandra and Neil Moyer of
FSEC and Greg Barker of Mountain Energy Partnership for their assistance in the planning and execution of this ventilation study
About the Authors
Robert Hendron Ren Anderson Dennis Barley are with National Renewable Energy Laboratory Armin Rudd and Aaron Townsend are with Building Science Corporation
Ed Hancock is with Mountain Energy Partnership
Direct all correspondence to Building Science Corporation 30 Forest Street Somerville MA 02143
Limits of Liability and Disclaimer of Warranty
Building Science documents are intended for professionals The author and the publisher of this article have used their best efforts to provide accurate and authoritative information in regard to the subject matter covered The author and publisher make no warranty of any kind expressed or implied with regard to the information contained in this article
The information presented in this article must be used with care by professionals who understand the implications of what they are doing If professional advice or other expert assistance is required the services of a competent professional shall be sought The author and publisher shall not be liable in the event of incidental or consequential damages in connection with or arising from the use of the information contained within this Building Science document
49 of 49

Research Report - 0602
The results of the multi-zone tracer gas decay tests are presented graphically as families of decay curves These graphs illustrate the uniformity or non-uniformity of the ventilation effect among the various rooms and allow ranking of the rooms from the least to the most ventilation effect
In addition if the ventilation rates were sufficiently steady for the duration of the test period we used local mean age-of-air analysis to evaluate the results more quantitatively Age-of-air analysis is a well-established approach to testing ventilation rates at various points or in various zones within a building (Grieve 1991) Age-of-air is defined as the average length of time that air molecules have resided within the building The formula for calculating local mean age-ofshyair in a tracer gas decay test is given in ASHRAE Standard 129-1997 (ASHRAE 1997) as follows
Ai = 1 intinfin
Ci (t)dt (1)C0 0
where
i = Index for measurement point representing a well-mixed zone Ai = Local mean age-of-air at point i (hr) C = Concentration of tracer gas (lbmft3) C0 = Initial value of C in well-mixed building (lbmft3) Ci = Time-varying concentration of tracer gas at point i (lbmft3) t = Time (hr)
In order to compare the ventilation rates among the rooms or zones in the home we use the metric Reciprocal Age-of-Air
Reciprocal Age-of-Air = 1Ai (2)
Reciprocal Age-of-Air has units of 1hr and is equivalent to the air change rate (ACH) in a single well-mixed zone (Persily 2000)
The definition of Ai in Equation (1) involves an integral of infinite duration This is handled in the test procedure through a two-step process
Step 1 The tracer gas decay test is continued until (a) the initial transient effects of interzonal airflow have subsided and all of the decay curves resemble simple exponential functions and (b) the tracer concentrations are rather small compared to their initial values so that any extrapolation errors will have a small effect on the result In this field test most of the multi-zone tests were continued for 12 hours These portions of the decay curves were integrated numerically using the trapezoid rule
13 of 49
Research Report - 0602
Step 2 The remaining portions (the tails) of the decay curves were extrapolated to infinity using a simple exponential decay function which was matched to the decay rate of the final portion of each measured decay curve These portions of the curves were integrated analytically
Once the conditions of Step 1 were satisfied the rooms were re-mixed by opening the bedroom doors and operating the air handler This allowed the calculation of an effective whole-house air change rate using the relationship in Equation 3
Average whole-house air change rate (ACH) = ln(C0Cf)∆t (3)
where
Cf = Concentration of tracer gas after rooms are re-mixed (lbmft3) ∆t = Elapsed time between initial and final well-mixed cases (hr)
Test Matrix
The series of test conditions for the 1-story and 2-story houses are described in Tables 2 and 3 Most of the important tests were conducted for a 12-hour period overnight to ensure sufficient accuracy when calculating reciprocal age-of-air
Table 2 Test sequence for 1-story test house
Central fan
cycling Duration Vent Vent flow (min off
Test Date Time (hrs) Config rate (cfm) min on) Doors Notes
A1 Dec 28 AM 3 Exhaust 58 none closed
A2 PM 3 Exhaust 58 2010 closed
A3 overnight 12 Exhaust 58 none closed A4 Dec 29 AM 4 Supply 104 33 2010 closed
duty cycle A5 PM 4 Supply 58 33 duty 2010 closed
cycle A6 overnight 12 Supply 174 33 2010 closed
duty cycle
A7 Dec 30 AM-PM 8 None 0 none open Natural infiltration
A8 PM 2 None 0 none open AH bump
A9 overnight 12 Exhaust 58 none open
A10 Dec 31 AM-PM 6 Exhaust 58 none closed Transfer grills taped
A11 PM 6 Exhaust 58 2010 closed Transfer grills taped
A12 Jan 1 overnight 12 Exhaust 58 2010 closed
A13 PM 6 Exhaust 58 2010 open
A14 overnight 12 Exhaust 58 54 none closed
A15 Jan 2 AM-PM 6 None 0 none closed Natural infiltration
A16 overnight 12 Exhaust 58 none closed Master bath exhaust
14 of 49
Research Report - 0602
Table 3 Test sequence for 2-story test house
Central fan
cycling Duration Vent Vent flow (min off
Test Date Time (hrs) Config rate (cfm) min on) Doors Notes B1 Jan 3 overnight 14 Exhaust 63 none closed
B2 Jan 4 PM 5 Supply 114 33 20 10 closed 60 ASHRAE 622 duty cycle
B3 overnight 11 Supply 180 33 20 10 closed 95 ASHRAE 622 duty cycle
B4 Jan 5 PM 4 Supply 63 33 duty 20 10 closed 33 ASHRAE 622 cycle
B5 overnight 13 Exhaust 63 5010 closed
B6 Jan 6 PM 6 Exhaust 63 2010 closed
B7 overnight 12 Exhaust 63 none closed Transfer grilles taped
B8 Jan 7 AM 4 Exhaust 63 50 10 closed Transfer grilles taped
B9 PM 4 Exhaust 63 none closed Transfer grilles taped extra injection in MBR
B10 PM 2 Exhaust 63 none open
B11 overnight 9 Supply 114 33 20 10 closed Transfer grilles taped duty cycle
B12 Jan 8 PM 3 None 0 100 closed Transfer grilles taped air handler bump test
B13 PM 2 None 0 100 closed Transfer grilles untaped
B14 PM 2 None 0 none open Natural infiltration
B15 overnight 9 Exhaust 63 none closed Master bath exhaust transfer grilles taped
B16 Jan 9 AM 4 Exhaust 63 50 10 closed Master bath exhaust
B17 PM 4 Supply 178 33 20 10 closed duty cycle
B18 overnight 12 Exhaust 63 none closed Master bath exhaust
TEST RESULTS FROM 1-STORY HOUSE (1111 MONTAGUE)
Natural Infiltration
A test of natural infiltration was conducted for an 8-hour period on December 30 to examine the magnitude and variability of outside air entering the house through leaks in the building envelope (Test A7) The tracer gas decay curves are shown in Figure 9 It is evident that the house was very well mixed during this test which allows a running instantaneous calculation of whole-house ACH over the same time period (see Figure 10) Although the air change rate indicated that the house is relatively tight (about 0085 ACH on average) the effect of natural infiltration was far from negligible especially when the wind was blowing This variability of natural infiltration must be kept in mind when interpreting the decay curves and reciprocal age-of-air calculations that follow
15 of 49
Research Report - 0602
An air handler bump test was performed between 1300 and 1500 hours to examine the effect of air handler operation on whole house air exchange rate including duct leakage to the outside and changes in room-to-room pressurization caused by moving air from the supply registers in each room to the central return in the main living area Figure 10 shows both the hourly average ACH and the wind speed during this period At first glance it appears that the air change rate increased by about 003 ACH when the fan was turned on but there was a coincident jump in wind speed that complicates this interpretation There was no corresponding decrease in ACH when the air handler was turned off at 1500 hours Ultimately we cannot conclusively quantify the change in ACH associated with operation of the air handler but it appears to have been no more than 003 ACH
3
Co
ncen
trati
on
(m
gm
)
70
60
50
40
30
20
10
0
Living
Entry
BR1
BR2
BR3
MBR
Air Handler On
Air Handler Off
8 9 10 11 12 13 14 15 16 17 18
Hour
Figure 9 Tracer gas decay for 1-story house with no ventilation and bedroom doors open with and without central fan operation (Test A7)
16 of 49
Research Report - 0602
40016
35014 Air Handler On Air Handler Off
ACH
Wind Speed
Air
Ch
an
ge
Ra
te (
AC
H) 30012
25010
20008
15006
10004
Win
d S
pe
ed
(m
ph
)
002 05
00
8 10 12 14 16 18
000
Hour
Figure 10 Average air change rate for 1-story house with no ventilation no central fan operation and bedroom doors open (Test A7)
The natural ventilation test was repeated on January 2 with the doors closed instead of open (Test A15) providing the decay curves shown in Figure 11 The average air change rate for this case was 0086 ACH calculated based on the two well-mixed cases at the beginning and end of the test It is difficult to compare this number with the doors-open case because it was windy (4-5 mph) for the first few hours of this test However it is very clear that the uniformity of room-toshyroom distribution of outside air was significantly less when the doors were closed even with transfer grilles We did not calculate age-of-air for this test because the test conditions were not sufficiently steady state This fact is very evident at about hour 15 where the BR2 and BR3 curves suddenly begin to diverge from the MBR curve
17 of 49
Research Report - 0602
0
10
20
30
40
50
60
70
80
90
Co
ncen
trati
on
(m
gm
3 )
Living
Entry
BR1
BR2
BR3
MBR
Mixing stopped
Mixing restarted
10 11 12 13 14 15 16 17 18 19
Hour
Figure 11 Tracer gas decay for 1-story house with no ventilation no central fan operation and bedroom doors closed (Test A15)
Distributed Supply vs Point Exhaust Ventilation
Two of the most common ventilation schemes in Building America homes are continuous single-point exhaust ventilation and intermittent central-fan integrated supply (CFIS) ventilation Exhaust ventilation is most commonly installed in a bathroom laundry room or utility room Make-up air enters through the cracks and holes in the building envelope upon depressurization of the house The distribution of outside air in a given room is fairly unpredictable because it depends on the amount of depressurization in the room the number and size of openings in exterior walls and the influence of adjacent rooms Supply ventilation provided by a central-fan integrated system tends to be distributed more uniformly throughout the house However the fan is usually operated on a duty cycle of about 33 to limit the electricity used by the central fan and one of the goals of this testing is to evaluate the effect of that duty cycle on the consistency of the air mixing
The decay curves for a 12-hour overnight test with exhaust ventilation (Test A3) are shown in Figure 12 The exhaust fan register in the laundry room was used as the exhaust point and the Duct Blaster was used to exhaust 58 cfm continuously corresponding to the minimum ventilation rate recommended by ASHRAE for a 2075 ft2 4-bedroom house It is evident from the decay curves that significantly more outside air reached the master bedroom and less reached Bedroom 2 compared to the other rooms in the house
18 of 49
Research Report - 0602
0
2
4
6
8
10
12
14
Co
nc
en
tra
tio
n
mg
m3
Living
Entry
BR1
BR2
BR3
MBR
Mixing stopped
Mixing restarted
17 18 19 20 21 22 23 0 1 2 3 4 5 6
Hour
Figure 12 Tracer gas decay for 1-story house with exhaust ventilation from the laundry room at ASHRAE 622 level no central fan operation and bedroom doors closed (Test A3)
The corresponding decay curves for the central fan integrated supply system (Test A6) are shown in Figure 13 The air handler operated at a 33 duty cycle (20 min off 10 min on) with a ventilation rate of 174 cfm resulting in an average ventilation rate of 58 cfm again meeting the minimum ASHRAE 622 recommendations The whole house appeared to be well-mixed in this case because the decay curves were clustered together throughout the test Even during the 20 minute periods when the air handler was off there was very little divergence A comparison of Figure 12 to Figure 13 indicates that much more uniform distribution of ventilation air was achieved by using the CFIS system
19 of 49
Research Report - 0602
0
2
4
6
8
10
12
14
16
Co
nc
en
trati
on
(m
gm
3 )
Living
Entry
BR1
BR2
BR3
MBR
Mixing stopped
Mixing restarted
185 195 205 215 225 235 05 15 25 35 45 55 65
Hour
Figure 13 Tracer gas decay for 1-story house with supply ventilation at ASHRAE 622 level 33 central fan operation (20 min off 10 min on) and bedroom doors closed (Test
A6)
Reciprocal age-of-air calculations were performed to provide a quantitative comparison of the two ventilation systems as shown in Figure 14 Values were in the range of 0169 hr-1 +0042shy0038 hr-1 for the exhaust ventilation system compared to 0173 hr-1 +0002-0003 hr-1 for the supply ventilation system expressed in terms of the range of differences between the reciprocal age-of-air in each room and the whole-house air change rate With the exhaust ventilation at the laundry room the master bedroom received the greatest amount of fresh air We suspect this may have been caused by the presence of the exhaust ducts used for spot ventilation of the master bathroom possibly providing greater leakage area near the master bathroom than is present in other areas of the house The supply system distributed the ventilation air more uniformly but it is not entirely clear whether this result was primarily caused by the introduction of ventilation air through the supply ducts or by the air handler mixing air throughout the house Since it is clear that the exhaust ventilation showed better uniformity of ventilation with central system mixing it follows that mixing is likely to be the primary factor in the room-to-room uniformity shown by CFIS ventilation
It is also noteworthy that the average net air change rates provided by both the supply and exhaust ventilation systems were only about 018 ACH compared to the 025 ACH that would be expected if the mechanical ventilation rate (017 ACH) and the natural infiltration rate (008 ACH) were additive as they might be with a balanced ventilation system Adding mechanical ventilation to natural infiltration in quadrature results in an estimated average air change rate of 019 ACH which is fairly consistent with the measured values
20 of 49
Research Report - 0602
Recip
rocal
Ag
e o
f A
ir (
1h
r) 025
020
015
010
005
000
Simple Exhaust vs Central Fan Integrated
Supply
Centralized supply mixing
33 duty cycle 100
ASHRAE doors closed
Living
Entry
BR1
BR2
BR3
MBR
Exhaust in utility room no
mixing 100 ASHRAE
doors closed
Figure 14 Reciprocal age-of-air for 1-story house with continuous exhaust ventilation (Test A3) compared to central fan integrated supply ventilation (Test A6)
Air Handler Operation
To determine how much room-to-room mixing was caused by the air handler the exhaust only test was re-run with the air handler operating at 33 duty cycle (20 min off 10 min on) (Test A12) The decay curves are shown in Figure 15 Compared to Test A3 (Figure 12) there was a noticeable increase in uniformity when the air handler was operating even though the entry points for the ventilation air were uncontrolled As shown in Figure 16 the range of reciprocal age of air was reduced from +0042-0038 hr-1 to +0019-0011 hr-1) It appears that operation of the air handler explains most of the difference between the supply and exhaust ventilation systems discussed earlier Although it also appears that the overall average air change rate was higher in the case where the air handler was operating (0216 ACH vs 0176) it should be noted that the average wind speed was also significantly higher It is likely that the wind speed was the primary cause of the difference in average ACH not a difference in the mechanical ventilation rate
21 of 49
Research Report - 0602
0
5
10
15
20
25
30
35
Co
nce
ntr
ati
on
(m
gm
3 )
Living
Entry
BR1
BR2
BR3
MBR
Mixing stopped
Mixing restarted
0 1 2 3 4 5 6 7 8 9 10 11 12 13 14
Hour
Figure 15 Tracer gas decay for 1-story house with continuous exhaust ventilation at ASHRAE 622 level 33 central fan operation (20 min off 10 min on) and bedroom
doors closed (Test A12)
Exhaust Ventilation No Mixing vs 33 Air Handler Duty Cycle
000
005
010
015
020
025
Recip
rocal A
ge o
f A
ir (
1h
r)
Living
Entry
BR1
BR2
BR3
MBR
Exhaust in utility room 33 air handler
no mixing 100 operation exhaust in
ASHRAE doors closed utility room 100
ASHRAE doors closed
Figure 16 Reciprocal age-of-air for 1-story house with continuous exhaust ventilation with and without air handler operation (Tests A3 and A12)
22 of 49
Research Report - 0602
Exhaust Location
The preceding analysis of exhaust ventilation was based on an exhaust point in the laundry room which was relatively centrally located in the 1-story house To examine the effect of moving the exhaust point the duct blaster was moved to the master bathroom which was located in a far corner of the house (Test A16) A continuous exhaust ventilation rate of 58 cfm was again applied to the house resulting in the tracer gas decay curve shown in Figure 17 It is difficult to visually identify a significant difference between this series of curves and those shown in Figure 12 for the laundry room exhaust location
Because the curves were steady it is again possible to compare the results based on reciprocal age-of-air as shown in Figure 18 There appeared to be very little change in the distribution of outside air to most rooms However the reciprocal age-of-air in the master bedroom dropped noticeably when the exhaust location was moved to the master bathroom probably because a greater fraction of the outside air now passed through other rooms before reaching the master bedroom With the exhaust point centrally located most of the ventilation air passing through the master bedroom probably entered from the outside In both cases however the master bedroom had the highest reciprocal age-of-air of all of the rooms in the house and the BR2 location had the lowest
Co
nc
en
tra
tio
n (
mg
m3)
40
35
30
25
20
15
10
5
0
Living
Entry
BR1
BR2
BR3
MBR
Mixing stopped
Mixing restarted
19 20 21 22 23 0 1 2 3 4 5 6 7 8
Hour
Figure 17 Tracer gas decay for 1-story house with exhaust ventilation from the master bathroom at ASHRAE 622 level no central fan operation and bedroom doors closed (Test
A16)
23 of 49
Research Report - 0602
Exhaust Ventilation
Laundry Room vs Master Bathroom
000
005
010
015
020
025
Exhaust in laundry
room no mixing 100
ASHRAE doors closed
Exhaust in master
bathroom no mixing
100 ASHRAE doors
closed
Re
cip
roc
al A
ge
of
Air
(1
hr)
Living
Entry
BR1
BR2
BR3
MBR
Figure 18 Reciprocal age-of-air for 1-story house with exhaust ventilation from the master bathroom compared to the laundry room at ASHRAE 622 level no central fan operation
and bedroom doors closed (Tests A3 and A16)
Ventilation Rate
The supply ventilation test was repeated using flow rates corresponding to 60 and 33 of the ASHRAE recommendations The intent of this series of tests was to evaluate the room-to-room ventilation uniformity for ventilation rates consistent with ASHRAE 622 compared to the uniformity for reduced mechanical ventilation rates Each test was conducted for only 4 hours because of time limitations The decay curves are shown in Figures 19 and 20 Because the rooms were well-mixed during the supply ventilation tests the average whole-house ACH can be compared directly to the reciprocal age-of-air for the exhaust ventilation tests Figure 21 shows the supply ventilation air change rate for each of the three ventilation levels (33 60 100) compared to room-by-room reciprocal age-of-air for the exhaust ventilation system based on the boundary conditions present during the tests It appears that in the supply ventilation case all rooms receive more outside air than the least-ventilated room in the exhaust case (BR2) even at 60 of ASHRAE 622 These results serve to illustrate the trade-off between whole-house ventilation rate and room-to-room ventilation uniformity in terms of their impact on the worst room(s)
24 of 49
Research Report - 0602
The ASHRAE 622 committee has not currently defined the level of mixing that is required when choosing the minimum ventilation rate Some might interpret the results of this test to suggest that a house without mixing can have individual rooms that do not receive sufficient outside air even though the ventilation system is operating at 622 specified rates Because the 622 committee has not specified the level of mixing that is required when choosing the minimum ventilation rate the ventilation rate required by different ventilation systems is open to interpretation For example if the exhaust system performance shown in Figure 21 is acceptable does this mean that a ventilation system that provides good distribution of outside air may be sufficiently well-ventilated at 60 of the ASHRAE 622 level or perhaps even less Alternatively it might be concluded that exhaust ventilation rates should be increased over current ASHRAE 622 recommendations because of the possibility that certain rooms may receive very little fresh air Unfortunately because the current 622 standard does not specify air mixing requirements and the committeersquos assumptions about ventilation air distribution are not well documented it is difficult to make any firm recommendations in this area However we can conclude that air mixing is required for dilution ventilation systems to provide predictable results independent of the geometry of individual homes
8 9 10 11 12 13 14
Hour
Figure 19 Tracer gas decay for 1-story house with supply ventilation at 60 of ASHRAE 622 level 33 central fan operation (20 min off 10 min on) and bedroom doors closed
(Test A4)
0
10
20
30
40
50
60
Co
nce
ntr
ati
on
m
gm
3
Living
Entry
BR1
BR2
BR3
MBR
Mixing stopped
Mixing restarted
25 of 49
Research Report - 0602
0
5
10
15
20
25
30
Co
nce
ntr
ati
on
(m
gm
3 )
Living
Entry
BR1
BR2
BR3
MBR
Mixing stopped
Mixing restarted
12 13 14 15 16 17 18 19 20
Hour
Figure 20 Tracer gas decay for 1-story house with supply ventilation at 33 of ASHRAE 622 level 33 central fan operation (20 min off 10 min on) and bedroom doors closed
(Test A5)
Simple Exhaust vs Central Fan Integrated
Supply with Lower Ventilation Rates
025
Re
cip
roc
al A
ge
of
Air
(1
hr)
Well Mixed
100
ASHRAE 60
ASHRAE 33
ASHRAE Living Entry 010 Natural
BR1 Infilt
BR2 BR3 005
MBR
Exhaust in laundry room no
000
Central supply Natural infil-
mixing 100 ASHRAE doors mixing 33 duty tration doors
closed cycle doors closed open
Figure 21 Reciprocal age-of-air for 1-story house with supply ventilation at 33 60 and 100 of ASHRAE 622 level (Tests A5 A4 A6) compared to exhaust ventilation with
no central fan operation (Test A3) Bedroom doors were closed
020
015
26 of 49
Research Report - 0602
Simulations by Walker (2006) have shown that all systems will not provide the same service in terms of annual average air change rate For the same air flow rate and duty cycle balanced ventilation will yield a higher average air exchange than supply ventilation and supply ventilation will yield a higher average air exchange than exhaust ventilation That can be explained in general terms by understanding that wind and stack effects act to depressurize a building most of the time Exhaust fans increase the building depressurization further but supply fans decrease the depressurization Balanced fans donrsquot change the enclosure differential pressure and air flow at all Because of the non-linear relationship between differential pressure and air flows across the building enclosure a supply fan changes the pressures across the enclosure less than an exhaust fan acting more like a balanced fan The result is that the effect on ventilation air change rate from a supply fan is somewhere between that of an exhaust fan and a true balanced system
Bedroom Doors
Except for the natural ventilation test the preceding tests were all conducted with the bedroom doors closed to simulate a worst-case situation for air circulation within the house The exhaust ventilation test was repeated with the bedroom doors open (Test A9) producing the tracer gas decay curve shown in Figure 22 It is evident that the decay curves were much more tightly bundled with the doors open than they were with the doors closed (compare Figure 12) A comparison based on reciprocal age-of-air is shown in Figure 23 A significant improvement in room-to-room mixing is evident during the open-door test
It is also evident that the average air change rate was higher when the doors were open (0202 vs 0176 ACH) but it must be remembered that the ventilation rate was controlled using a duct blaster and average wind speed was higher during the open-door test period compared to the closed-door test period (20 mph compared to 06 mph) Therefore this test alone does not necessarily indicate that closing doors reduces the average air change rate associated with an exhaust system In future tests continuous measurement of the depressurization of the house with respect to outside along with single-point pressure measurements across interior doors would provide more information about the effect of closing doors when exhaust ventilation systems are used It would also be valuable to conduct this test during steady weather conditions using the exhaust fan (with uncontrolled ventilation rate) instead of the duct blaster to observe the net effect of closed doors on whole-house air change rate
27 of 49
Research Report - 0602
0
5
10
15
20
25
30
Co
ncen
trati
on
(m
gm
3 )
Living
Entry
BR1
BR2
BR3
MBR
Mixing stopped
Mixing restarted
181 191 201 211 221 231 01 11 21 31 41 51 61 71
Hour
Figure 22 Tracer gas decay for 1-story house with exhaust ventilation from the laundry room at ASHRAE 622 level no central fan operation and bedroom doors open (Test A9)
Exhaust Ventilation
Doors Closed vs Doors Open
000
005
010
015
020
025
Re
cip
roc
al
Ag
e o
f A
ir (
1h
r)
Living
Entry
BR1
BR2
BR3
MBR
Exhaust in laundry room Doors open no mixing
no mixing 100 exhaust in laundry room
ASHRAE doors closed 100 ASHRAE
Figure 23 Reciprocal age-of-air for 1-story house with exhaust ventilation from the laundry room at ASHRAE 622 level no central fan operation In the first case the bedroom doors were closed (Test A3) in the second the doors were open (Test A9)
28 of 49
Research Report - 0602
Transfer Grilles
Because the test houses used central returns instead of hard ducted returns in the bedrooms transfer grilles were installed over the bedroom doors to provide a flow path for return air without excessive room pressurization when the doors were closed These transfer grilles also allowed ventilation air to pass more freely from the bedrooms to the main living space The effect of transfer grilles on ventilation air distribution was evaluated by taping over the grilles (see Figure 24) and re-running the exhaust ventilation test (Test A10) The corresponding tracer gas decay curve is shown in Figure 25 and the reciprocal age-of-air analysis is shown in Figure 26 Taping the transfer grilles did not appear to significantly affect the room-to-room variability in ventilation rate although there appeared to be some slight re-ranking of rooms from highest to lowest reciprocal age-of-air It should be noted that there was an increase in average wind speed from 26 mph to 41 mph starting at 1 pm including a half hour period where the average wind speed was 7 mph This weather effect produced noticeable kinks in the decay curves and therefore would be expected to introduce significant errors into the reciprocal age-of-air results
Itrsquos possible that the transfer grilles played a much smaller role in providing a path for ventilation air than the supply ducts Because the air handler was not operating the ducts were not pressurized and were thus available as passive airflow conduits The resistance to air flow was probably smaller for the air ducts than for the transfer grilles depending on their size and the number of supply registers in each bedroom The existing door undercuts are also thought to have played a role The effect of ducts and door undercuts can be tested in the future by running separate tests with ducts and door undercuts taped over
copy buildingsciencecom
Figure 24 Transfer grilles over bedroom doors taped closed
29 of 49
Research Report - 0602
0
10
20
30
40
50
60
70
Co
nc
en
tra
tio
n (
mg
m3 )
Living
Entry
BR1
BR2
BR3
MBR
Mixing stopped
Mixing restarted
8 9 10 11 12 13 14 15 16 17
Hour
Figure 25 Tracer gas decay for 1-story house with exhaust ventilation from the laundry room at ASHRAE 622 level no central fan operation bedroom doors closed and transfer
grilles taped (Test A10)
Exhaust Ventilation
000
005
010
015
020
025
Re
cip
roc
al
Ag
e o
f A
ir (
1h
r)
Living
Entry
BR1
BR2
BR3
MBR
Transfer Grilles Untaped vs Taped
Exhaust in laundry room no Exhaust in laundry room no
mixing 100 ASHRAE mixing 100 ASHRAE
doors closed doors closed transfer
grilles taped
Figure 26 Reciprocal age-of-air for 1-story house with exhaust ventilation from the laundry room at ASHRAE 622 level no central fan operation and doors closed In the
30 of 49
Research Report - 0602
first case the transfer grilles are untaped (Test A3) in the second they are taped closed (Test A10)
Minimum Test Duration
We were fortunate that DR Horton provided two full weeks of access to these homes to conduct this series of tests which allowed us to run some of the more important tracer gas decay tests as long as 12 hours to help ensure that we could accurately calculate reciprocal age-of-air In most cases test houses would not be available for such a long time period To evaluate the length of time needed to estimate the reciprocal age-of-air with reasonable accuracy we examined the results that we would have obtained for one of the exhaust ventilation tests had we halted the test period after less than 12 hours For the supply ventilation tests the rooms were sufficiently well-mixed that the test could have been stopped after 3 or 4 hours assuming weather effects were steady
The reciprocal age-of-air calculations for the exhaust ventilation decay curves (Test A3 see Figure 12) based on test durations of 3 6 9 and 12 hours are shown in Figure 27 These test durations range from 053 to 21 air changes based on the average air change rate of 018 ACH (56 hours per air change) calculated for this test The ratio of highest to lowest reciprocal ageshyof-air is shown above the data points for each case These results suggest that shorter tests tend to overestimate the range and that perhaps 1frac12-2 air changes (roughly 9 to 12 hours in this case) may be necessary to obtain accurate calculations of reciprocal age-of-air when there is significant divergence among rooms From a qualitative standpoint one air change may be sufficient to determine the basic trend Without knowing in advance what mixing pattern will occur it is difficult to recommend a minimum test duration But assuming this test is fairly representative of a worst-case scenario a minimum of 15 air changes would be necessary to have a high degree of confidence in the quantitative difference in reciprocal age-of-air among rooms
31 of 49
Research Report - 0602
000
005
010
015
020
025
030
035
Re
cip
roc
al
Ag
e-O
f-A
ir (
hr-1
)
Living
Entry
BR1
BR2
BR3
MBR HighLow = 297
HighLow = 168 HighLow = 184 HighLow = 161
3-hour Test 6-hour Test 9-hour Test 12-hour Test
(053 Air Changes) (11 Air Changes) (16 Air Changes) (21 Air Changes)
Test Duration
Figure 27 Reciprocal age-of-air based on alternate test durations for 1-story house with exhaust ventilation from the laundry room at ASHRAE 622 level no central fan operation
and doors closed (Test A3) Average air change rate was 018 ACH
TEST RESULTS FROM 2-STORY HOUSE (1117 MONTAGUE)
The 2-story house was tested from January 3-10 2006 Three zones were selected on the first floor and three more were selected on the second floor as indicated by the red stars in Figure 4 The initial mixing of air among the rooms at the start of each test in this 2-story house was not as thorough as it was in the 1-story house Evidently the combined effects of the air handler and the portable de-stratification fan were not sufficient to overcome upward transport of tracer gas driven by the stack effect from the first to the second floor The resulting difference in initial tracer gas concentration among the rooms was about 5-10 This outcome emphasizes the significant effect of stack-driven infiltration on ventilation non-uniformity in multi-story homes Because our test method and equipment did not achieve a well-mixed condition at the start of each test there were some errors introduced into the reciprocal age-of-air analysis For future tests we would recommend larger de-stratification fans to obtain more well-mixed conditions in multi-story houses
Typical errors introduced by incomplete mixing of the tracer gas at the start of such a test were analyzed by examining two hypothetical cases where either all of the air entering a room comes from the outside or all of the air comes from an adjacent room with a different starting concentration If all of the air entering a space comes from the outside then a change in the initial concentration would have no effect on the reciprocal age-of-air because the decay curve would be exponential from the start and the area under the curve would be normalized based on
32 of 49
Research Report - 0602
the starting concentration in that zone However if the air entering a room passes through another room with a lower initial concentration the room receiving the air will have a lower concentration of tracer gas throughout the test compared to what the concentration would have been if the starting points were the same in both rooms This case is illustrated in Figure 28 where assumptions are made that the rooms are the same size the air exchange rate is 01 ACH for both rooms and the initial tracer gas concentration is 10 lower in the first room (upstream) than it is in the second room
The effect on reciprocal age-of-air is shown in Figure 29 A 10 difference in starting concentration results in an error of about 75 in reciprocal age-of-air for a room downstream of a room with a lower starting concentration assuming 01 ACH for both rooms The error would be somewhat smaller (about 5) if the air change rate was higher for both rooms (02 ACH) There would be no error introduced for rooms where all of the air infiltration comes from the outside Although the amount of error in the reciprocal age-of-air calculations can be affected by additional variables not examined here we feel that these percentages are reasonable estimates of the errors in our results for the 2-story house due to incomplete initial mixing of air
In each case an engineering judgment must be made regarding the significance of the error introduced by incomplete initial mixing As a general rule the differences in concentration at the start of the test should be small compared to the differences that are being measured in order for the results to be considered valid
Figure 28 Theoretical decay curves for a well-mixed case with uniform tracer gas concentration compared to a case where the upstream room starts with a concentration
10 lower than the downstream room
33 of 49
Research Report - 0602
Figure 29 Theoretical reciprocal age-of-air for a well-mixed case with uniform tracer gas concentration compared to a case where the upstream room starts with a concentration
10 lower than the downstream room
Natural Infiltration and Duct Leakage
A natural infiltration test was performed over a two hour period on the evening of January 8 (Test B14) The tracer gas decay curves are shown in Figure 30 There was a slight divergence between the first floor and second floor once the air handler was turned off but the rooms on each floor appeared to remain fairly well-mixed The average air change rate during the test period was about 011 ACH which was somewhat higher than the 1-story house as might be expected with an increased stack height
An air handler bedroom door bump test was conducted just prior to the test period shown in Figure 30 allowing observation of the combined effect of duct leakage to the outside and increased infiltration caused by room pressurization The average air change rate during that bump test was 013 ACH suggesting that closing doors and operating the fan added approximately 002 ACH to the whole-house average air change rate The average wind speed was a bit higher while the air handler was running (17 mph compared to 05 mph) so the effect of air handler operation may actually be somewhat less than the average ACH numbers indicate
34 of 49
Research Report - 0602
0
1
2
3
4
SF
6 C
on
ce
ntr
ati
on
(m
gm
3)
BR1
Living
Kitchen
BR2
BR3
MBR
Mixing stopped
Mixing restarted
1814 1843 1912 1940 2009 2038 2107 2136
Hour
Figure 30 Tracer gas decay for 2-story house with no ventilation no central fan operation and bedroom doors open (Test B14)
Distributed Supply vs Point Exhaust Ventilation
A 14-hour test (Test B1) was performed with an exhaust ventilation rate of 63 cfm in the laundry room which was located near the stairwell in the middle of the first floor The ventilation rate was again consistent with the ASHRAE 622 recommendations The tracer gas decay curves are shown in Figure 31 It is interesting that all three second floor rooms showed a delay before entering an exponential decay suggesting that some amount of air was moving from the first floor to the second floor even though the mechanical exhaust point was on the first floor It appears that the further depressurization of the first floor was insufficient to overcome the stack effect and draw a significant amount of outside air in through the rooms on the second floor
35 of 49
Research Report - 0602
182
9
192
9
202
9
212
9
222
9
232
9
029
129
229
329
429
529
629
729
828
929
102
8
112
8
122
8
0
10
20
30
40
50
60
70
SF
6 C
on
ce
ntr
ati
on
(m
gm
3)
BR1
Living
Kitchen
BR2
BR3
MBR
Mixing stopped
Mixing restarted
Hour
Figure 31 Tracer gas decay for 2-story house with exhaust ventilation from the laundry room at ASHRAE 622 level no central fan operation and bedroom doors closed (Test B1)
A supply ventilation test was performed on the 2-story house for about 11 hours starting late on January 4 (Test B3) The duct blaster was unable to provide the ventilation rate necessary to meet the minimum specified in ASHRAE 622 supplying 180 cfm instead of 189 cfm (95) The decay curves are shown in Figure 32 Although the curves are much more tightly packed than they were with the exhaust system there is more divergence than we saw with the supply system in the 1-story house most notably in the master bedroom
The reciprocal age-of-air calculations for both the exhaust and supply ventilation systems are shown in Figure 33 Again the results indicate that much better room-to-room distribution of ventilation air was achieved by the central-fan integrated supply system compared to the single-point exhaust system However for the supply ventilation test the differences in the initial tracer gas concentration were of the same magnitude as the differences in decay rates among the rooms As a result no conclusions should be drawn about the relative ranking of the supply ventilation rate among rooms based on Figure 33
36 of 49
Research Report - 0602
0
10
20
30
40
50
60
SF
6 C
on
ce
ntr
ati
on
(m
gm
3)
BR1
Living
Kitchen
BR2
BR3
MBR
Mixing stopped
Mixing restarted
2136 000 224 448 712 936 1200
Hour
Figure 32 Tracer gas decay for 2-story house with supply ventilation just under ASHRAE 622 level central fan operation at 33 duty cycle (20 min off 10 min on) and bedroom
doors closed (Test B3)
Simple Exhaust vs Central Fan Integrated
Supply )
000
005
010
015
020
025
Recip
rocal A
ge o
f A
ir (
1h
r
BR1
Living
Kitchen
BR2
BR3
MBR
Exhaust in laundry room no Centralized supply mixing
mixing 100 ASHRAE 33 duty cycle 95
doors closed ASHRAE doors closed
Figure 33 Reciprocal age-of-air for 2-story house with continuous exhaust ventilation (Test B1) compared to central fan integrated supply ventilation (Test B3) (Note
Uncertainties introduced by non-uniform starting concentration are of the same order of magnitude as the differences in reciprocal age-of-air among rooms for the supply ventilation case The relative ranking of rooms is not meaningful for that case)
37 of 49
Research Report - 0602
Air Handler Operation
The effect of occasional air handler operation on the distribution of exhaust ventilation air was evaluated on the afternoon of January 6 (Test B6) The tracer gas decay curves are shown in Figure 34 and reciprocal age-of-air calculations are shown in Figure 35 It should again be noted that before the test started the house was mixed using both the air handler and a de-stratification fan with the doors open During the test the doors were closed the de-stratification fan was turned off and the air handler operated at a 33 duty cycle (20 minutes off 10 minutes on) As was the case in the 1-story house this occasional operation of the air handler substantially improved the distribution of ventilation air among rooms even in conjunction with the point exhaust ventilation system There was very little divergence noticeable even with the air handler cycling on and off every half hour However because the initial differences in tracer gas concentration among rooms were as large as the differences in reciprocal age-of-air for the case with air handler operation no conclusions should be drawn about the relative ranking of ventilation rates among the rooms for that case
SF
6 C
on
cen
trati
on
(m
gm
3)
80
70
60
50
40
30
20
10
0
BR1
Living
Kitchen
BR2
BR3
MBR
Mixing stopped
Mixing restarted
1048 1200 1312 1424 1536 1648 1800 1912 2024
Hour
Figure 34 Tracer gas decay for 2-story house with continuous exhaust ventilation at ASHRAE 622 level central fan operation at 33 duty cycle (20 min off 10 min on) and
bedroom doors closed (Test B6)
38 of 49
Research Report - 0602
020
015 R
ec
ipro
ca
l A
ge
of
Air
(1
hr)
Exhaust Ventilation
No Mixing vs 33 Air Handler Duty Cycle
Exhaust in laundry room
no mixing 100
ASHRAE doors closed
33 air handler
operation exhaust in
laundry room 100
ASHRAE doors closed
BR1
Living
Kitchen
BR2
BR3
MBR
010
005
000
Figure 35 Reciprocal age-of-air for 2-story house with continuous exhaust ventilation with and without air handler operation (Tests B1 and B6) (Note Uncertainties introduced by non-uniform starting concentration are of the same order of magnitude as the differences in reciprocal age-of-air among rooms for the case with air handler operation The relative
ranking of rooms is not meaningful for that case)
Exhaust Location
The duct blaster was moved to the master bathroom exhaust register to see if there was a resulting change in ventilation air distribution (Test B18) The master bathroom was in the back of the house on the second floor between the master bedroom and bedroom 3 The decay curves are shown in Figure 36 and the reciprocal age-of-air results are shown in Figure 37 The rooms on each floor were well mixed before the test began although the mixing between the two floors was not as good Very wide divergence among rooms can be seen during the test especially between the upstairs bedrooms and the rest of the house Once again all three upstairs rooms appear to receive some air from the first floor but the master bedroom experiences a much higher volume of circulated air than the other two second-floor bedrooms which appear to be relatively stagnant
39 of 49
Research Report - 0602
0
10
20
30
40
50
60
70
80
90
SF
6 C
on
ce
ntr
ati
on
(m
gm
3)
BR1
Living
Kitchen
BR2
BR3
MBR
Mixing stopped
Mixing restarted
1912 2136 000 224 448 712 936 1200
Hour
Figure 36 Tracer gas decay for 2-story house with exhaust ventilation from the master bathroom at ASHRAE 622 level no central fan operation and bedroom doors closed (Test
B18)
Exhaust Ventilation
Laundry Room vs Master Bathroom
000
005
010
015
020
025
030
Exhaust in laundry room no
mixing 100 ASHRAE
doors closed
Exhaust in master bathroom
no mixing 100 ASHRAE
doors closed
Re
cip
roc
al A
ge
of
Air
(1
hr)
BR1
Living
Kitchen
BR2
BR3
MBR
Figure 37 Reciprocal age-of-air for 2-story house with exhaust ventilation from the master bathroom compared to the laundry room at ASHRAE 622 level no central fan operation
and bedroom doors closed (Tests B1 and B18)
40 of 49
Research Report - 0602
Ventilation Rate
The supply ventilation tests were repeated using flow rates of 60 and 33 of ASHRAE 622 recommendations corresponding to 114 cfm and 63 cfm respectively (Tests B2 and B4) The decay curves are shown in Figures 38 and 39 Reciprocal age-of-air for all three supply ventilation rates are shown in Figure 40 In all cases the rooms remained fairly well mixed especially rooms on the same floor As we observed in the 1-story house the ventilation rate in the 2-story house appeared to have very little effect on the uniformity of outside air provided to each room as long as it was mixed using the air handler One again the initial differences in tracer gas concentration among rooms were as large as the divergence in the decay curves preventing any conclusions about the relative ranking of ventilation rates among rooms for all three cases The error in initial concentration uniformity was bigger for the cases with air handler mixing because the relative divergence in the decay curves was so small compared to that of no air handler mixing In other words the error in relative ranking of ventilation rates for the cases with air handler mixing were not very important anyway because the relative differences between rooms were so small
1536 1648 1800 1912 2024 2136 2248
Hour
Figure 38 Tracer gas decay for 2-story house with supply ventilation at 60 of ASHRAE 622 level 33 central fan operation (20 min off 10 min on) and bedroom doors closed
(Test B2)
0
5
10
15
20
25
30
SF
6 C
on
cen
trati
on
(m
gm
3)
BR1 Living Kitchen BR2 BR3 MBR
Mixing stopped
Mixing restarted
41 of 49
Research Report - 0602
0
5
10
15
20
25
30
35
40
SF
6 C
on
cen
trati
on
(m
gm
3)
BR1
Living
Kitchen
BR2
BR3
MBR
Mixing stopped
Mixing restarted
1200 1312 1424 1536 1648 1800 1912
Hour
Figure 39 Tracer gas decay for 2-story house with supply ventilation at 33 of ASHRAE 622 level 33 central fan operation (20 min off 10 min on) and bedroom doors closed
(Test B4)
Supply Ventilation Rate Comparison
000
005
010
015
020
025
Re
cip
roc
al
Ag
e o
f A
ir (
1h
r)
BR1
Living
Kitchen
BR2
BR3
MBR
Centralized supply Centralized supply Centralized supply
mixing 33 duty mixing 33 duty mixing 33 duty
cycle 95 ASHRAE cycle 60 ASHRAE cycle 33 ASHRAE
doors closed doors closed doors closed
Figure 40 Reciprocal age-of-air for 2-story house with three levels of supply ventilation central fan operation at 33 duty cycle (20 min off 10 min on) and bedroom doors closed (Tests B3 B2 B4) (Note Uncertainties introduced by non-uniform starting
concentration are of the same order of magnitude as the differences in reciprocal age-of-air among rooms for all three cases The relative ranking of rooms is not meaningful for these
cases)
42 of 49
Research Report - 0602
The average air change rates for the three supply ventilation rates compared to the two exhaust ventilation schemes are shown in Figure 41 The CFIS system at 33 of the 622 ventilation flow rate provided a uniformly higher air change rate (013 ach) than the least ventilated rooms using exhaust ventilation from either the laundry or the master bathroom (010 ach Figure 37) It is noteworthy that the combined net air change rate with exhaust ventilation from the laundry room was significantly less than the air change rates for both exhaust ventilation from the master bathroom and supply ventilation at the air handler This illustrates the unpredictability of interactions between mechanical ventilation and natural infiltration which depend strongly on the distribution and size of cracks through which the outside air must pass to enter the house There may have been a relatively large building enclosure leakage opening near the laundry room (perhaps the utility penetrations or the door to the garage) that allowed a significant amount of outside air to quickly enter and leave the house through the exhaust flow without circulating around the house
0
005
01
015
02
025
Ave
rag
e A
CH
Natural Exhaust Exhaust Supply 95 Supply 60 Supply 33
Laundry Mbath
Rm 100 100
Figure 41 Average air change rates for 2-story house with supply ventilation at 33 60 and 95 of ASHRAE 622 recommendations (Tests B4 B2 B3) compared to natural
infiltration (Test B14) and exhaust ventilation with no central fan operation (Test B1) Bedroom doors were closed except for the natural infiltration test
Bedroom Doors
The laundry room exhaust ventilation test with no air handler operation (see Figure 31) was repeated with the doors open to evaluate the change in room-to-room ventilation air distribution (Test B10) The decay curves are shown in Figure 42 and the reciprocal age-of air calculations are shown in Figure 43 It is evident from Figure 42 that the test began before the rooms were
43 of 49
Research Report - 0602
0
5
10
15
20
25
SF
6 C
on
ce
ntr
ati
on
(m
gm
3)
BR1 Living Kitchen BR2 BR3 MBR
Mixing stopped
Mixing restarted
completely well mixed resulting in decay curves that could be somewhat misleading Because the master bedroom was at a higher concentration than the other rooms at the start of the test any room that received air from the master bedroom would appear to have a slower decay rate than it would have if the rooms started out at the same concentration Despite the difference in starting concentration it is clear that outside air was well distributed when the doors were open even without operation of the air handler
1843 1912 1940 2009 2038 2107 2136 2204 2233 2302
Hour
Figure 42 Tracer gas decay for the 2-story house with exhaust ventilation from the laundry room at ASHRAE 622 level no central fan operation and bedroom doors open
(Test B10)
Reciprocal age-of-air analysis was not performed for this case because of the combined effect of a short test duration (~2 hours) and unequal starting tracer gas concentrations even though the house was relatively well-mixed The important conclusion (that opening doors greatly improves mixing) can be drawn by inspecting the decay curves alone
Transfer Grilles
A final exhaust ventilation test was run on the 2-story house with the doors closed and the transfer grilles taped over The decay curves are shown in Figure 43 and the reciprocal age-ofshyair calculations are shown in Figure 44 The curves were clearly very divergent even after 12 hours By examining the reciprocal age-of-air results it is apparent that the transfer grilles in the 2-story house caused a noticeable improvement in ventilation air distribution but the improvement was smaller than when the doors were opened (Figure 42)
44 of 49
Research Report - 0602
0
5
10
15
20
25
30
SF
6 C
on
cen
tra
tio
n (
mg
m3
) BR1 Living Kitchen BR2 BR3 MBR
Mixing stopped
Mixing restarted
1648 1912 2136 000 224 448 712 936
Hour
Figure 43 Tracer gas decay for 2-story house with exhaust ventilation from the laundry room at ASHRAE 622 level no central fan operation bedroom doors closed transfer
grilles taped closed (Test B7)
Exhaust Ventilation Transfer Grilles Untaped vs Taped
000
005
010
015
020
Re
cip
roc
al
Ag
e o
f A
ir (
1h
r)
BR1
Living
Kitchen
BR2
BR3
MBR
Exhaust in laundry room no Exhaust in laundry room no
mixing 100 ASHRAE mixing 100 ASHRAE
doors closed doors closed transfer
grilles taped
Figure 44 Reciprocal age-of-air for 2-story house with exhaust ventilation from the laundry room at ASHRAE 622 level no central fan operation and doors closed In the first case the transfer grilles are untaped (Test B3) in the second they are taped closed
(Test B7)
45 of 49
Research Report - 0602
CONCLUSIONS
bull Reciprocal age-of-air analysis was chosen as a quantitative method for characterizing distribution of ventilation air among rooms This method worked well in cases where rooms were well mixed to begin the test and weather conditions were sufficiently steady-state
bull A test period of at least 1frac12 air changes was necessary to obtain reasonably accurate ageshyof-air results when there was significant divergence in tracer gas concentration among the rooms
bull Although we did not achieve uniform initial concentration of tracer gas in the 2-story house using our test methodology and the equipment at hand we believe the reciprocal age-of-air calculations were meaningful in many of the cases as indicated in the discussion
bull Both houses were relatively tight with natural infiltration averaging 008 ACH for the 1shystory house and 011 ACH for the 2-story house
bull Both houses had relatively small (but not negligible) duct losses to the outside producing an increase in infiltration of less than 003 ACH for the 1-story house and 002 ACH for the 2-story house when the air handler runs
bull Age-of-air analysis indicated that ventilation supplied through the central air distribution system provided much more uniform distribution of ventilation air than the single-point exhaust system when the doors were closed and the air handler was not running For the 1-story house the central-fan-integrated supply ventilation case at 60 of ASHRAE 622 provided more outside air to all rooms than the least-ventilated room in the exhaust case at 100 of 622 For the 2-story house the central-fan-integrated supply system at 33 of the 622 flow rate provided more outside air to all rooms than the least ventilated rooms using exhaust ventilation at 100 of 622 from either the laundry or the master bathroom
bull Operation of the central fan at a 33 duty cycle maintained relatively well-mixed conditions regardless of ventilation rate type of ventilation system (supply or exhaust) or house configuration (1-story or 2-story)
bull Exhaust location affected both the relative amount of outside air received by different rooms and the overall uniformity among rooms but the effect was not predictable
bull For exhaust-only ventilation without central fan operation opening bedroom doors appeared to significantly improve the mixing of ventilation air among rooms
bull Transfer grilles improved the distribution of ventilation air slightly but much less than opening the bedroom doors
bull In the 2-story house the stack effect caused air movement from the first floor to the second floor even when exhaust ventilation was applied to the first floor resulting in consistently higher tracer gas concentrations on the second floor and more non-uniform ventilation air distribution in general
bull Interactions between natural infiltration and both exhaust and supply mechanical ventilation were very significant When the ventilation system was activated the combined air change rate did not increase commensurate with the measured ventilation rate but instead increased by only half that amount This result was consistent with combining ventilation and infiltration in quadrature to estimate whole-house air change rate in accordance with ASHRAE Standard 136 (ASHRAE 1993)
46 of 49
Research Report - 0602
FUTURE WORK
In future tests continuous monitoring of pressure differentials would enhance our understanding of the multi-zone combined infiltration and ventilation systems and our ability to model them That would help to explain differences between tests in more detail including the effects of multiple stories location of ventilation supply outlets and exhaust inlets interior door closure and use of passive return air transfer grilles Pressure differential measurement points should include
bull dP with respect to outside for each closed room and open space bull dP across closed interior doors bull dP between the floor cavity and outdoors and bull dP between the house and the attic
Measurement of wind direction along with wind speed could also be helpful for modeling these buildings and systems However because of micro-climate wind shielding it may be very difficult to relate a single-point wind direction measurement to actual wind vectors on the building surfaces
ACKNOWLEDGMENTS
The authors express their appreciation to Rich Coyle of DR Horton for providing the test houses and to Joseph Lstiburek of BSC Subrato Chandra and Neil Moyer of FSEC and Greg Barker of Mountain Energy Partnership for their assistance in the planning and execution of this ventilation study
47 of 49
Research Report - 0602
REFERENCES
ASHRAE (1993) ANSIASHRAE Standard 136-1993 A Method of Determining Air Change Rates in Detached Dwellings Atlanta GA American Society of Heating Refrigerating and Air-Conditioning Engineers Inc
ASHRAE (1997) ANSIASHRAE Standard 129-1997 Measuring Air-Change Effectiveness Atlanta GA American Society of Heating Refrigerating and Air-Conditioning Engineers Inc
ASHRAE (2004) ASHRAE Standard 622-2004 Ventilation and Acceptable Indoor Air Quality in Low-Rise Residential Buildings Atlanta GA American Society of Heating Refrigerating and Air-Conditioning Engineers Inc
CSA (2003) CANCSA F326-M91 Residential Mechanical Ventilation Systems Canadian Standards Association Ontario Canada httpwwwcsashyintlorgonlinestoreGetCatalogItemDetailsaspmat=2410793ampParent=102
NBC 2005 National Building Code of Canada httpircnrcshycnrcgccapubscodesnrcc47666_ehtml
Grieve PW (1991) Measuring Ventilation Using Tracer-Gases Denmark Bruumlel amp Kjaeligr
MN Chapter 7672 Minnesota Energy Code Chapter 7672 Detached Single-Family And Two-Family Dwellings httpwwwstatemnusmnexternalDocsCommerceChapter_7672_Residential_111302012428 _72rulepdf
Persily AK Martin SR (2000) A Modeling Study of Ventilation in Manufactured Houses Gaithersburg MD National Institute of Standards and Technology NISTIR 6455
Rudd A Lstiburek J (2000) ldquoMeasurement of Ventilation and Interzonal Distribution in Single-Family Homesrdquo ASHRAE Transactions 2000 MN-00-10-3 V 106 Pt2 American Society of Heating Refrigeration and Air-Conditioning Engineers Atlanta GA
WAC (2004) Washington State Title 51 WAC Community trade and economic development department of (building code council) Chapter 51-13 Ventilation and indoor air quality httpappslegwagovWACdefaultaspxcite=51-13
48 of 49
Research Report - 0602
Field test of room-to-room uniformity of ventilation air distribution in two new houses
About this Report
This report was prepared for the US Department of Energyrsquos Building America
Program The report is freely available to the public at wwwbuildingamericagov
The authors express their appreciation to Rich Coyle of DR Horton for providing the test houses and to Joseph Lstiburek of BSC Subrato Chandra and Neil Moyer of
FSEC and Greg Barker of Mountain Energy Partnership for their assistance in the planning and execution of this ventilation study
About the Authors
Robert Hendron Ren Anderson Dennis Barley are with National Renewable Energy Laboratory Armin Rudd and Aaron Townsend are with Building Science Corporation
Ed Hancock is with Mountain Energy Partnership
Direct all correspondence to Building Science Corporation 30 Forest Street Somerville MA 02143
Limits of Liability and Disclaimer of Warranty
Building Science documents are intended for professionals The author and the publisher of this article have used their best efforts to provide accurate and authoritative information in regard to the subject matter covered The author and publisher make no warranty of any kind expressed or implied with regard to the information contained in this article
The information presented in this article must be used with care by professionals who understand the implications of what they are doing If professional advice or other expert assistance is required the services of a competent professional shall be sought The author and publisher shall not be liable in the event of incidental or consequential damages in connection with or arising from the use of the information contained within this Building Science document
49 of 49
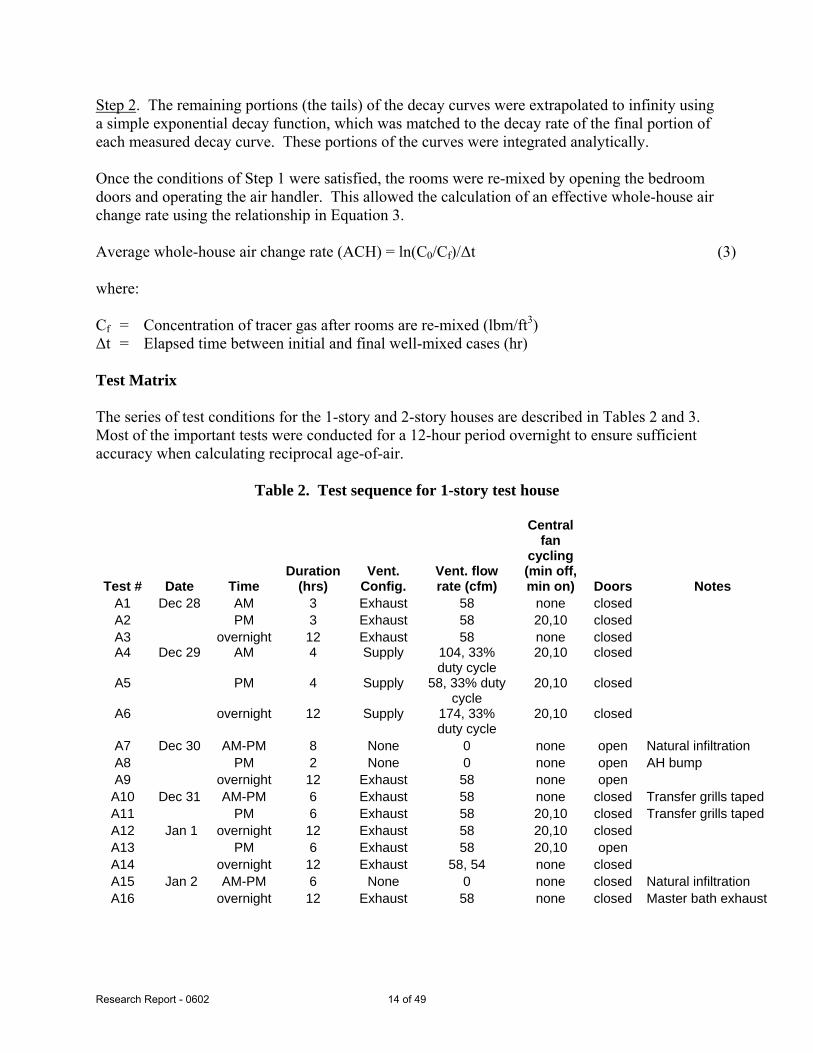
Research Report - 0602
40016
35014 Air Handler On Air Handler Off
ACH
Wind Speed
Air
Ch
an
ge
Ra
te (
AC
H) 30012
25010
20008
15006
10004
Win
d S
pe
ed
(m
ph
)
002 05
00
8 10 12 14 16 18
000
Hour
Figure 10 Average air change rate for 1-story house with no ventilation no central fan operation and bedroom doors open (Test A7)
The natural ventilation test was repeated on January 2 with the doors closed instead of open (Test A15) providing the decay curves shown in Figure 11 The average air change rate for this case was 0086 ACH calculated based on the two well-mixed cases at the beginning and end of the test It is difficult to compare this number with the doors-open case because it was windy (4-5 mph) for the first few hours of this test However it is very clear that the uniformity of room-toshyroom distribution of outside air was significantly less when the doors were closed even with transfer grilles We did not calculate age-of-air for this test because the test conditions were not sufficiently steady state This fact is very evident at about hour 15 where the BR2 and BR3 curves suddenly begin to diverge from the MBR curve
17 of 49
Research Report - 0602
0
10
20
30
40
50
60
70
80
90
Co
ncen
trati
on
(m
gm
3 )
Living
Entry
BR1
BR2
BR3
MBR
Mixing stopped
Mixing restarted
10 11 12 13 14 15 16 17 18 19
Hour
Figure 11 Tracer gas decay for 1-story house with no ventilation no central fan operation and bedroom doors closed (Test A15)
Distributed Supply vs Point Exhaust Ventilation
Two of the most common ventilation schemes in Building America homes are continuous single-point exhaust ventilation and intermittent central-fan integrated supply (CFIS) ventilation Exhaust ventilation is most commonly installed in a bathroom laundry room or utility room Make-up air enters through the cracks and holes in the building envelope upon depressurization of the house The distribution of outside air in a given room is fairly unpredictable because it depends on the amount of depressurization in the room the number and size of openings in exterior walls and the influence of adjacent rooms Supply ventilation provided by a central-fan integrated system tends to be distributed more uniformly throughout the house However the fan is usually operated on a duty cycle of about 33 to limit the electricity used by the central fan and one of the goals of this testing is to evaluate the effect of that duty cycle on the consistency of the air mixing
The decay curves for a 12-hour overnight test with exhaust ventilation (Test A3) are shown in Figure 12 The exhaust fan register in the laundry room was used as the exhaust point and the Duct Blaster was used to exhaust 58 cfm continuously corresponding to the minimum ventilation rate recommended by ASHRAE for a 2075 ft2 4-bedroom house It is evident from the decay curves that significantly more outside air reached the master bedroom and less reached Bedroom 2 compared to the other rooms in the house
18 of 49
Research Report - 0602
0
2
4
6
8
10
12
14
Co
nc
en
tra
tio
n
mg
m3
Living
Entry
BR1
BR2
BR3
MBR
Mixing stopped
Mixing restarted
17 18 19 20 21 22 23 0 1 2 3 4 5 6
Hour
Figure 12 Tracer gas decay for 1-story house with exhaust ventilation from the laundry room at ASHRAE 622 level no central fan operation and bedroom doors closed (Test A3)
The corresponding decay curves for the central fan integrated supply system (Test A6) are shown in Figure 13 The air handler operated at a 33 duty cycle (20 min off 10 min on) with a ventilation rate of 174 cfm resulting in an average ventilation rate of 58 cfm again meeting the minimum ASHRAE 622 recommendations The whole house appeared to be well-mixed in this case because the decay curves were clustered together throughout the test Even during the 20 minute periods when the air handler was off there was very little divergence A comparison of Figure 12 to Figure 13 indicates that much more uniform distribution of ventilation air was achieved by using the CFIS system
19 of 49
Research Report - 0602
0
2
4
6
8
10
12
14
16
Co
nc
en
trati
on
(m
gm
3 )
Living
Entry
BR1
BR2
BR3
MBR
Mixing stopped
Mixing restarted
185 195 205 215 225 235 05 15 25 35 45 55 65
Hour
Figure 13 Tracer gas decay for 1-story house with supply ventilation at ASHRAE 622 level 33 central fan operation (20 min off 10 min on) and bedroom doors closed (Test
A6)
Reciprocal age-of-air calculations were performed to provide a quantitative comparison of the two ventilation systems as shown in Figure 14 Values were in the range of 0169 hr-1 +0042shy0038 hr-1 for the exhaust ventilation system compared to 0173 hr-1 +0002-0003 hr-1 for the supply ventilation system expressed in terms of the range of differences between the reciprocal age-of-air in each room and the whole-house air change rate With the exhaust ventilation at the laundry room the master bedroom received the greatest amount of fresh air We suspect this may have been caused by the presence of the exhaust ducts used for spot ventilation of the master bathroom possibly providing greater leakage area near the master bathroom than is present in other areas of the house The supply system distributed the ventilation air more uniformly but it is not entirely clear whether this result was primarily caused by the introduction of ventilation air through the supply ducts or by the air handler mixing air throughout the house Since it is clear that the exhaust ventilation showed better uniformity of ventilation with central system mixing it follows that mixing is likely to be the primary factor in the room-to-room uniformity shown by CFIS ventilation
It is also noteworthy that the average net air change rates provided by both the supply and exhaust ventilation systems were only about 018 ACH compared to the 025 ACH that would be expected if the mechanical ventilation rate (017 ACH) and the natural infiltration rate (008 ACH) were additive as they might be with a balanced ventilation system Adding mechanical ventilation to natural infiltration in quadrature results in an estimated average air change rate of 019 ACH which is fairly consistent with the measured values
20 of 49
Research Report - 0602
Recip
rocal
Ag
e o
f A
ir (
1h
r) 025
020
015
010
005
000
Simple Exhaust vs Central Fan Integrated
Supply
Centralized supply mixing
33 duty cycle 100
ASHRAE doors closed
Living
Entry
BR1
BR2
BR3
MBR
Exhaust in utility room no
mixing 100 ASHRAE
doors closed
Figure 14 Reciprocal age-of-air for 1-story house with continuous exhaust ventilation (Test A3) compared to central fan integrated supply ventilation (Test A6)
Air Handler Operation
To determine how much room-to-room mixing was caused by the air handler the exhaust only test was re-run with the air handler operating at 33 duty cycle (20 min off 10 min on) (Test A12) The decay curves are shown in Figure 15 Compared to Test A3 (Figure 12) there was a noticeable increase in uniformity when the air handler was operating even though the entry points for the ventilation air were uncontrolled As shown in Figure 16 the range of reciprocal age of air was reduced from +0042-0038 hr-1 to +0019-0011 hr-1) It appears that operation of the air handler explains most of the difference between the supply and exhaust ventilation systems discussed earlier Although it also appears that the overall average air change rate was higher in the case where the air handler was operating (0216 ACH vs 0176) it should be noted that the average wind speed was also significantly higher It is likely that the wind speed was the primary cause of the difference in average ACH not a difference in the mechanical ventilation rate
21 of 49
Research Report - 0602
0
5
10
15
20
25
30
35
Co
nce
ntr
ati
on
(m
gm
3 )
Living
Entry
BR1
BR2
BR3
MBR
Mixing stopped
Mixing restarted
0 1 2 3 4 5 6 7 8 9 10 11 12 13 14
Hour
Figure 15 Tracer gas decay for 1-story house with continuous exhaust ventilation at ASHRAE 622 level 33 central fan operation (20 min off 10 min on) and bedroom
doors closed (Test A12)
Exhaust Ventilation No Mixing vs 33 Air Handler Duty Cycle
000
005
010
015
020
025
Recip
rocal A
ge o
f A
ir (
1h
r)
Living
Entry
BR1
BR2
BR3
MBR
Exhaust in utility room 33 air handler
no mixing 100 operation exhaust in
ASHRAE doors closed utility room 100
ASHRAE doors closed
Figure 16 Reciprocal age-of-air for 1-story house with continuous exhaust ventilation with and without air handler operation (Tests A3 and A12)
22 of 49
Research Report - 0602
Exhaust Location
The preceding analysis of exhaust ventilation was based on an exhaust point in the laundry room which was relatively centrally located in the 1-story house To examine the effect of moving the exhaust point the duct blaster was moved to the master bathroom which was located in a far corner of the house (Test A16) A continuous exhaust ventilation rate of 58 cfm was again applied to the house resulting in the tracer gas decay curve shown in Figure 17 It is difficult to visually identify a significant difference between this series of curves and those shown in Figure 12 for the laundry room exhaust location
Because the curves were steady it is again possible to compare the results based on reciprocal age-of-air as shown in Figure 18 There appeared to be very little change in the distribution of outside air to most rooms However the reciprocal age-of-air in the master bedroom dropped noticeably when the exhaust location was moved to the master bathroom probably because a greater fraction of the outside air now passed through other rooms before reaching the master bedroom With the exhaust point centrally located most of the ventilation air passing through the master bedroom probably entered from the outside In both cases however the master bedroom had the highest reciprocal age-of-air of all of the rooms in the house and the BR2 location had the lowest
Co
nc
en
tra
tio
n (
mg
m3)
40
35
30
25
20
15
10
5
0
Living
Entry
BR1
BR2
BR3
MBR
Mixing stopped
Mixing restarted
19 20 21 22 23 0 1 2 3 4 5 6 7 8
Hour
Figure 17 Tracer gas decay for 1-story house with exhaust ventilation from the master bathroom at ASHRAE 622 level no central fan operation and bedroom doors closed (Test
A16)
23 of 49
Research Report - 0602
Exhaust Ventilation
Laundry Room vs Master Bathroom
000
005
010
015
020
025
Exhaust in laundry
room no mixing 100
ASHRAE doors closed
Exhaust in master
bathroom no mixing
100 ASHRAE doors
closed
Re
cip
roc
al A
ge
of
Air
(1
hr)
Living
Entry
BR1
BR2
BR3
MBR
Figure 18 Reciprocal age-of-air for 1-story house with exhaust ventilation from the master bathroom compared to the laundry room at ASHRAE 622 level no central fan operation
and bedroom doors closed (Tests A3 and A16)
Ventilation Rate
The supply ventilation test was repeated using flow rates corresponding to 60 and 33 of the ASHRAE recommendations The intent of this series of tests was to evaluate the room-to-room ventilation uniformity for ventilation rates consistent with ASHRAE 622 compared to the uniformity for reduced mechanical ventilation rates Each test was conducted for only 4 hours because of time limitations The decay curves are shown in Figures 19 and 20 Because the rooms were well-mixed during the supply ventilation tests the average whole-house ACH can be compared directly to the reciprocal age-of-air for the exhaust ventilation tests Figure 21 shows the supply ventilation air change rate for each of the three ventilation levels (33 60 100) compared to room-by-room reciprocal age-of-air for the exhaust ventilation system based on the boundary conditions present during the tests It appears that in the supply ventilation case all rooms receive more outside air than the least-ventilated room in the exhaust case (BR2) even at 60 of ASHRAE 622 These results serve to illustrate the trade-off between whole-house ventilation rate and room-to-room ventilation uniformity in terms of their impact on the worst room(s)
24 of 49
Research Report - 0602
The ASHRAE 622 committee has not currently defined the level of mixing that is required when choosing the minimum ventilation rate Some might interpret the results of this test to suggest that a house without mixing can have individual rooms that do not receive sufficient outside air even though the ventilation system is operating at 622 specified rates Because the 622 committee has not specified the level of mixing that is required when choosing the minimum ventilation rate the ventilation rate required by different ventilation systems is open to interpretation For example if the exhaust system performance shown in Figure 21 is acceptable does this mean that a ventilation system that provides good distribution of outside air may be sufficiently well-ventilated at 60 of the ASHRAE 622 level or perhaps even less Alternatively it might be concluded that exhaust ventilation rates should be increased over current ASHRAE 622 recommendations because of the possibility that certain rooms may receive very little fresh air Unfortunately because the current 622 standard does not specify air mixing requirements and the committeersquos assumptions about ventilation air distribution are not well documented it is difficult to make any firm recommendations in this area However we can conclude that air mixing is required for dilution ventilation systems to provide predictable results independent of the geometry of individual homes
8 9 10 11 12 13 14
Hour
Figure 19 Tracer gas decay for 1-story house with supply ventilation at 60 of ASHRAE 622 level 33 central fan operation (20 min off 10 min on) and bedroom doors closed
(Test A4)
0
10
20
30
40
50
60
Co
nce
ntr
ati
on
m
gm
3
Living
Entry
BR1
BR2
BR3
MBR
Mixing stopped
Mixing restarted
25 of 49
Research Report - 0602
0
5
10
15
20
25
30
Co
nce
ntr
ati
on
(m
gm
3 )
Living
Entry
BR1
BR2
BR3
MBR
Mixing stopped
Mixing restarted
12 13 14 15 16 17 18 19 20
Hour
Figure 20 Tracer gas decay for 1-story house with supply ventilation at 33 of ASHRAE 622 level 33 central fan operation (20 min off 10 min on) and bedroom doors closed
(Test A5)
Simple Exhaust vs Central Fan Integrated
Supply with Lower Ventilation Rates
025
Re
cip
roc
al A
ge
of
Air
(1
hr)
Well Mixed
100
ASHRAE 60
ASHRAE 33
ASHRAE Living Entry 010 Natural
BR1 Infilt
BR2 BR3 005
MBR
Exhaust in laundry room no
000
Central supply Natural infil-
mixing 100 ASHRAE doors mixing 33 duty tration doors
closed cycle doors closed open
Figure 21 Reciprocal age-of-air for 1-story house with supply ventilation at 33 60 and 100 of ASHRAE 622 level (Tests A5 A4 A6) compared to exhaust ventilation with
no central fan operation (Test A3) Bedroom doors were closed
020
015
26 of 49
Research Report - 0602
Simulations by Walker (2006) have shown that all systems will not provide the same service in terms of annual average air change rate For the same air flow rate and duty cycle balanced ventilation will yield a higher average air exchange than supply ventilation and supply ventilation will yield a higher average air exchange than exhaust ventilation That can be explained in general terms by understanding that wind and stack effects act to depressurize a building most of the time Exhaust fans increase the building depressurization further but supply fans decrease the depressurization Balanced fans donrsquot change the enclosure differential pressure and air flow at all Because of the non-linear relationship between differential pressure and air flows across the building enclosure a supply fan changes the pressures across the enclosure less than an exhaust fan acting more like a balanced fan The result is that the effect on ventilation air change rate from a supply fan is somewhere between that of an exhaust fan and a true balanced system
Bedroom Doors
Except for the natural ventilation test the preceding tests were all conducted with the bedroom doors closed to simulate a worst-case situation for air circulation within the house The exhaust ventilation test was repeated with the bedroom doors open (Test A9) producing the tracer gas decay curve shown in Figure 22 It is evident that the decay curves were much more tightly bundled with the doors open than they were with the doors closed (compare Figure 12) A comparison based on reciprocal age-of-air is shown in Figure 23 A significant improvement in room-to-room mixing is evident during the open-door test
It is also evident that the average air change rate was higher when the doors were open (0202 vs 0176 ACH) but it must be remembered that the ventilation rate was controlled using a duct blaster and average wind speed was higher during the open-door test period compared to the closed-door test period (20 mph compared to 06 mph) Therefore this test alone does not necessarily indicate that closing doors reduces the average air change rate associated with an exhaust system In future tests continuous measurement of the depressurization of the house with respect to outside along with single-point pressure measurements across interior doors would provide more information about the effect of closing doors when exhaust ventilation systems are used It would also be valuable to conduct this test during steady weather conditions using the exhaust fan (with uncontrolled ventilation rate) instead of the duct blaster to observe the net effect of closed doors on whole-house air change rate
27 of 49
Research Report - 0602
0
5
10
15
20
25
30
Co
ncen
trati
on
(m
gm
3 )
Living
Entry
BR1
BR2
BR3
MBR
Mixing stopped
Mixing restarted
181 191 201 211 221 231 01 11 21 31 41 51 61 71
Hour
Figure 22 Tracer gas decay for 1-story house with exhaust ventilation from the laundry room at ASHRAE 622 level no central fan operation and bedroom doors open (Test A9)
Exhaust Ventilation
Doors Closed vs Doors Open
000
005
010
015
020
025
Re
cip
roc
al
Ag
e o
f A
ir (
1h
r)
Living
Entry
BR1
BR2
BR3
MBR
Exhaust in laundry room Doors open no mixing
no mixing 100 exhaust in laundry room
ASHRAE doors closed 100 ASHRAE
Figure 23 Reciprocal age-of-air for 1-story house with exhaust ventilation from the laundry room at ASHRAE 622 level no central fan operation In the first case the bedroom doors were closed (Test A3) in the second the doors were open (Test A9)
28 of 49
Research Report - 0602
Transfer Grilles
Because the test houses used central returns instead of hard ducted returns in the bedrooms transfer grilles were installed over the bedroom doors to provide a flow path for return air without excessive room pressurization when the doors were closed These transfer grilles also allowed ventilation air to pass more freely from the bedrooms to the main living space The effect of transfer grilles on ventilation air distribution was evaluated by taping over the grilles (see Figure 24) and re-running the exhaust ventilation test (Test A10) The corresponding tracer gas decay curve is shown in Figure 25 and the reciprocal age-of-air analysis is shown in Figure 26 Taping the transfer grilles did not appear to significantly affect the room-to-room variability in ventilation rate although there appeared to be some slight re-ranking of rooms from highest to lowest reciprocal age-of-air It should be noted that there was an increase in average wind speed from 26 mph to 41 mph starting at 1 pm including a half hour period where the average wind speed was 7 mph This weather effect produced noticeable kinks in the decay curves and therefore would be expected to introduce significant errors into the reciprocal age-of-air results
Itrsquos possible that the transfer grilles played a much smaller role in providing a path for ventilation air than the supply ducts Because the air handler was not operating the ducts were not pressurized and were thus available as passive airflow conduits The resistance to air flow was probably smaller for the air ducts than for the transfer grilles depending on their size and the number of supply registers in each bedroom The existing door undercuts are also thought to have played a role The effect of ducts and door undercuts can be tested in the future by running separate tests with ducts and door undercuts taped over
copy buildingsciencecom
Figure 24 Transfer grilles over bedroom doors taped closed
29 of 49
Research Report - 0602
0
10
20
30
40
50
60
70
Co
nc
en
tra
tio
n (
mg
m3 )
Living
Entry
BR1
BR2
BR3
MBR
Mixing stopped
Mixing restarted
8 9 10 11 12 13 14 15 16 17
Hour
Figure 25 Tracer gas decay for 1-story house with exhaust ventilation from the laundry room at ASHRAE 622 level no central fan operation bedroom doors closed and transfer
grilles taped (Test A10)
Exhaust Ventilation
000
005
010
015
020
025
Re
cip
roc
al
Ag
e o
f A
ir (
1h
r)
Living
Entry
BR1
BR2
BR3
MBR
Transfer Grilles Untaped vs Taped
Exhaust in laundry room no Exhaust in laundry room no
mixing 100 ASHRAE mixing 100 ASHRAE
doors closed doors closed transfer
grilles taped
Figure 26 Reciprocal age-of-air for 1-story house with exhaust ventilation from the laundry room at ASHRAE 622 level no central fan operation and doors closed In the
30 of 49
Research Report - 0602
first case the transfer grilles are untaped (Test A3) in the second they are taped closed (Test A10)
Minimum Test Duration
We were fortunate that DR Horton provided two full weeks of access to these homes to conduct this series of tests which allowed us to run some of the more important tracer gas decay tests as long as 12 hours to help ensure that we could accurately calculate reciprocal age-of-air In most cases test houses would not be available for such a long time period To evaluate the length of time needed to estimate the reciprocal age-of-air with reasonable accuracy we examined the results that we would have obtained for one of the exhaust ventilation tests had we halted the test period after less than 12 hours For the supply ventilation tests the rooms were sufficiently well-mixed that the test could have been stopped after 3 or 4 hours assuming weather effects were steady
The reciprocal age-of-air calculations for the exhaust ventilation decay curves (Test A3 see Figure 12) based on test durations of 3 6 9 and 12 hours are shown in Figure 27 These test durations range from 053 to 21 air changes based on the average air change rate of 018 ACH (56 hours per air change) calculated for this test The ratio of highest to lowest reciprocal ageshyof-air is shown above the data points for each case These results suggest that shorter tests tend to overestimate the range and that perhaps 1frac12-2 air changes (roughly 9 to 12 hours in this case) may be necessary to obtain accurate calculations of reciprocal age-of-air when there is significant divergence among rooms From a qualitative standpoint one air change may be sufficient to determine the basic trend Without knowing in advance what mixing pattern will occur it is difficult to recommend a minimum test duration But assuming this test is fairly representative of a worst-case scenario a minimum of 15 air changes would be necessary to have a high degree of confidence in the quantitative difference in reciprocal age-of-air among rooms
31 of 49
Research Report - 0602
000
005
010
015
020
025
030
035
Re
cip
roc
al
Ag
e-O
f-A
ir (
hr-1
)
Living
Entry
BR1
BR2
BR3
MBR HighLow = 297
HighLow = 168 HighLow = 184 HighLow = 161
3-hour Test 6-hour Test 9-hour Test 12-hour Test
(053 Air Changes) (11 Air Changes) (16 Air Changes) (21 Air Changes)
Test Duration
Figure 27 Reciprocal age-of-air based on alternate test durations for 1-story house with exhaust ventilation from the laundry room at ASHRAE 622 level no central fan operation
and doors closed (Test A3) Average air change rate was 018 ACH
TEST RESULTS FROM 2-STORY HOUSE (1117 MONTAGUE)
The 2-story house was tested from January 3-10 2006 Three zones were selected on the first floor and three more were selected on the second floor as indicated by the red stars in Figure 4 The initial mixing of air among the rooms at the start of each test in this 2-story house was not as thorough as it was in the 1-story house Evidently the combined effects of the air handler and the portable de-stratification fan were not sufficient to overcome upward transport of tracer gas driven by the stack effect from the first to the second floor The resulting difference in initial tracer gas concentration among the rooms was about 5-10 This outcome emphasizes the significant effect of stack-driven infiltration on ventilation non-uniformity in multi-story homes Because our test method and equipment did not achieve a well-mixed condition at the start of each test there were some errors introduced into the reciprocal age-of-air analysis For future tests we would recommend larger de-stratification fans to obtain more well-mixed conditions in multi-story houses
Typical errors introduced by incomplete mixing of the tracer gas at the start of such a test were analyzed by examining two hypothetical cases where either all of the air entering a room comes from the outside or all of the air comes from an adjacent room with a different starting concentration If all of the air entering a space comes from the outside then a change in the initial concentration would have no effect on the reciprocal age-of-air because the decay curve would be exponential from the start and the area under the curve would be normalized based on
32 of 49
Research Report - 0602
the starting concentration in that zone However if the air entering a room passes through another room with a lower initial concentration the room receiving the air will have a lower concentration of tracer gas throughout the test compared to what the concentration would have been if the starting points were the same in both rooms This case is illustrated in Figure 28 where assumptions are made that the rooms are the same size the air exchange rate is 01 ACH for both rooms and the initial tracer gas concentration is 10 lower in the first room (upstream) than it is in the second room
The effect on reciprocal age-of-air is shown in Figure 29 A 10 difference in starting concentration results in an error of about 75 in reciprocal age-of-air for a room downstream of a room with a lower starting concentration assuming 01 ACH for both rooms The error would be somewhat smaller (about 5) if the air change rate was higher for both rooms (02 ACH) There would be no error introduced for rooms where all of the air infiltration comes from the outside Although the amount of error in the reciprocal age-of-air calculations can be affected by additional variables not examined here we feel that these percentages are reasonable estimates of the errors in our results for the 2-story house due to incomplete initial mixing of air
In each case an engineering judgment must be made regarding the significance of the error introduced by incomplete initial mixing As a general rule the differences in concentration at the start of the test should be small compared to the differences that are being measured in order for the results to be considered valid
Figure 28 Theoretical decay curves for a well-mixed case with uniform tracer gas concentration compared to a case where the upstream room starts with a concentration
10 lower than the downstream room
33 of 49
Research Report - 0602
Figure 29 Theoretical reciprocal age-of-air for a well-mixed case with uniform tracer gas concentration compared to a case where the upstream room starts with a concentration
10 lower than the downstream room
Natural Infiltration and Duct Leakage
A natural infiltration test was performed over a two hour period on the evening of January 8 (Test B14) The tracer gas decay curves are shown in Figure 30 There was a slight divergence between the first floor and second floor once the air handler was turned off but the rooms on each floor appeared to remain fairly well-mixed The average air change rate during the test period was about 011 ACH which was somewhat higher than the 1-story house as might be expected with an increased stack height
An air handler bedroom door bump test was conducted just prior to the test period shown in Figure 30 allowing observation of the combined effect of duct leakage to the outside and increased infiltration caused by room pressurization The average air change rate during that bump test was 013 ACH suggesting that closing doors and operating the fan added approximately 002 ACH to the whole-house average air change rate The average wind speed was a bit higher while the air handler was running (17 mph compared to 05 mph) so the effect of air handler operation may actually be somewhat less than the average ACH numbers indicate
34 of 49
Research Report - 0602
0
1
2
3
4
SF
6 C
on
ce
ntr
ati
on
(m
gm
3)
BR1
Living
Kitchen
BR2
BR3
MBR
Mixing stopped
Mixing restarted
1814 1843 1912 1940 2009 2038 2107 2136
Hour
Figure 30 Tracer gas decay for 2-story house with no ventilation no central fan operation and bedroom doors open (Test B14)
Distributed Supply vs Point Exhaust Ventilation
A 14-hour test (Test B1) was performed with an exhaust ventilation rate of 63 cfm in the laundry room which was located near the stairwell in the middle of the first floor The ventilation rate was again consistent with the ASHRAE 622 recommendations The tracer gas decay curves are shown in Figure 31 It is interesting that all three second floor rooms showed a delay before entering an exponential decay suggesting that some amount of air was moving from the first floor to the second floor even though the mechanical exhaust point was on the first floor It appears that the further depressurization of the first floor was insufficient to overcome the stack effect and draw a significant amount of outside air in through the rooms on the second floor
35 of 49
Research Report - 0602
182
9
192
9
202
9
212
9
222
9
232
9
029
129
229
329
429
529
629
729
828
929
102
8
112
8
122
8
0
10
20
30
40
50
60
70
SF
6 C
on
ce
ntr
ati
on
(m
gm
3)
BR1
Living
Kitchen
BR2
BR3
MBR
Mixing stopped
Mixing restarted
Hour
Figure 31 Tracer gas decay for 2-story house with exhaust ventilation from the laundry room at ASHRAE 622 level no central fan operation and bedroom doors closed (Test B1)
A supply ventilation test was performed on the 2-story house for about 11 hours starting late on January 4 (Test B3) The duct blaster was unable to provide the ventilation rate necessary to meet the minimum specified in ASHRAE 622 supplying 180 cfm instead of 189 cfm (95) The decay curves are shown in Figure 32 Although the curves are much more tightly packed than they were with the exhaust system there is more divergence than we saw with the supply system in the 1-story house most notably in the master bedroom
The reciprocal age-of-air calculations for both the exhaust and supply ventilation systems are shown in Figure 33 Again the results indicate that much better room-to-room distribution of ventilation air was achieved by the central-fan integrated supply system compared to the single-point exhaust system However for the supply ventilation test the differences in the initial tracer gas concentration were of the same magnitude as the differences in decay rates among the rooms As a result no conclusions should be drawn about the relative ranking of the supply ventilation rate among rooms based on Figure 33
36 of 49
Research Report - 0602
0
10
20
30
40
50
60
SF
6 C
on
ce
ntr
ati
on
(m
gm
3)
BR1
Living
Kitchen
BR2
BR3
MBR
Mixing stopped
Mixing restarted
2136 000 224 448 712 936 1200
Hour
Figure 32 Tracer gas decay for 2-story house with supply ventilation just under ASHRAE 622 level central fan operation at 33 duty cycle (20 min off 10 min on) and bedroom
doors closed (Test B3)
Simple Exhaust vs Central Fan Integrated
Supply )
000
005
010
015
020
025
Recip
rocal A
ge o
f A
ir (
1h
r
BR1
Living
Kitchen
BR2
BR3
MBR
Exhaust in laundry room no Centralized supply mixing
mixing 100 ASHRAE 33 duty cycle 95
doors closed ASHRAE doors closed
Figure 33 Reciprocal age-of-air for 2-story house with continuous exhaust ventilation (Test B1) compared to central fan integrated supply ventilation (Test B3) (Note
Uncertainties introduced by non-uniform starting concentration are of the same order of magnitude as the differences in reciprocal age-of-air among rooms for the supply ventilation case The relative ranking of rooms is not meaningful for that case)
37 of 49
Research Report - 0602
Air Handler Operation
The effect of occasional air handler operation on the distribution of exhaust ventilation air was evaluated on the afternoon of January 6 (Test B6) The tracer gas decay curves are shown in Figure 34 and reciprocal age-of-air calculations are shown in Figure 35 It should again be noted that before the test started the house was mixed using both the air handler and a de-stratification fan with the doors open During the test the doors were closed the de-stratification fan was turned off and the air handler operated at a 33 duty cycle (20 minutes off 10 minutes on) As was the case in the 1-story house this occasional operation of the air handler substantially improved the distribution of ventilation air among rooms even in conjunction with the point exhaust ventilation system There was very little divergence noticeable even with the air handler cycling on and off every half hour However because the initial differences in tracer gas concentration among rooms were as large as the differences in reciprocal age-of-air for the case with air handler operation no conclusions should be drawn about the relative ranking of ventilation rates among the rooms for that case
SF
6 C
on
cen
trati
on
(m
gm
3)
80
70
60
50
40
30
20
10
0
BR1
Living
Kitchen
BR2
BR3
MBR
Mixing stopped
Mixing restarted
1048 1200 1312 1424 1536 1648 1800 1912 2024
Hour
Figure 34 Tracer gas decay for 2-story house with continuous exhaust ventilation at ASHRAE 622 level central fan operation at 33 duty cycle (20 min off 10 min on) and
bedroom doors closed (Test B6)
38 of 49
Research Report - 0602
020
015 R
ec
ipro
ca
l A
ge
of
Air
(1
hr)
Exhaust Ventilation
No Mixing vs 33 Air Handler Duty Cycle
Exhaust in laundry room
no mixing 100
ASHRAE doors closed
33 air handler
operation exhaust in
laundry room 100
ASHRAE doors closed
BR1
Living
Kitchen
BR2
BR3
MBR
010
005
000
Figure 35 Reciprocal age-of-air for 2-story house with continuous exhaust ventilation with and without air handler operation (Tests B1 and B6) (Note Uncertainties introduced by non-uniform starting concentration are of the same order of magnitude as the differences in reciprocal age-of-air among rooms for the case with air handler operation The relative
ranking of rooms is not meaningful for that case)
Exhaust Location
The duct blaster was moved to the master bathroom exhaust register to see if there was a resulting change in ventilation air distribution (Test B18) The master bathroom was in the back of the house on the second floor between the master bedroom and bedroom 3 The decay curves are shown in Figure 36 and the reciprocal age-of-air results are shown in Figure 37 The rooms on each floor were well mixed before the test began although the mixing between the two floors was not as good Very wide divergence among rooms can be seen during the test especially between the upstairs bedrooms and the rest of the house Once again all three upstairs rooms appear to receive some air from the first floor but the master bedroom experiences a much higher volume of circulated air than the other two second-floor bedrooms which appear to be relatively stagnant
39 of 49
Research Report - 0602
0
10
20
30
40
50
60
70
80
90
SF
6 C
on
ce
ntr
ati
on
(m
gm
3)
BR1
Living
Kitchen
BR2
BR3
MBR
Mixing stopped
Mixing restarted
1912 2136 000 224 448 712 936 1200
Hour
Figure 36 Tracer gas decay for 2-story house with exhaust ventilation from the master bathroom at ASHRAE 622 level no central fan operation and bedroom doors closed (Test
B18)
Exhaust Ventilation
Laundry Room vs Master Bathroom
000
005
010
015
020
025
030
Exhaust in laundry room no
mixing 100 ASHRAE
doors closed
Exhaust in master bathroom
no mixing 100 ASHRAE
doors closed
Re
cip
roc
al A
ge
of
Air
(1
hr)
BR1
Living
Kitchen
BR2
BR3
MBR
Figure 37 Reciprocal age-of-air for 2-story house with exhaust ventilation from the master bathroom compared to the laundry room at ASHRAE 622 level no central fan operation
and bedroom doors closed (Tests B1 and B18)
40 of 49
Research Report - 0602
Ventilation Rate
The supply ventilation tests were repeated using flow rates of 60 and 33 of ASHRAE 622 recommendations corresponding to 114 cfm and 63 cfm respectively (Tests B2 and B4) The decay curves are shown in Figures 38 and 39 Reciprocal age-of-air for all three supply ventilation rates are shown in Figure 40 In all cases the rooms remained fairly well mixed especially rooms on the same floor As we observed in the 1-story house the ventilation rate in the 2-story house appeared to have very little effect on the uniformity of outside air provided to each room as long as it was mixed using the air handler One again the initial differences in tracer gas concentration among rooms were as large as the divergence in the decay curves preventing any conclusions about the relative ranking of ventilation rates among rooms for all three cases The error in initial concentration uniformity was bigger for the cases with air handler mixing because the relative divergence in the decay curves was so small compared to that of no air handler mixing In other words the error in relative ranking of ventilation rates for the cases with air handler mixing were not very important anyway because the relative differences between rooms were so small
1536 1648 1800 1912 2024 2136 2248
Hour
Figure 38 Tracer gas decay for 2-story house with supply ventilation at 60 of ASHRAE 622 level 33 central fan operation (20 min off 10 min on) and bedroom doors closed
(Test B2)
0
5
10
15
20
25
30
SF
6 C
on
cen
trati
on
(m
gm
3)
BR1 Living Kitchen BR2 BR3 MBR
Mixing stopped
Mixing restarted
41 of 49
Research Report - 0602
0
5
10
15
20
25
30
35
40
SF
6 C
on
cen
trati
on
(m
gm
3)
BR1
Living
Kitchen
BR2
BR3
MBR
Mixing stopped
Mixing restarted
1200 1312 1424 1536 1648 1800 1912
Hour
Figure 39 Tracer gas decay for 2-story house with supply ventilation at 33 of ASHRAE 622 level 33 central fan operation (20 min off 10 min on) and bedroom doors closed
(Test B4)
Supply Ventilation Rate Comparison
000
005
010
015
020
025
Re
cip
roc
al
Ag
e o
f A
ir (
1h
r)
BR1
Living
Kitchen
BR2
BR3
MBR
Centralized supply Centralized supply Centralized supply
mixing 33 duty mixing 33 duty mixing 33 duty
cycle 95 ASHRAE cycle 60 ASHRAE cycle 33 ASHRAE
doors closed doors closed doors closed
Figure 40 Reciprocal age-of-air for 2-story house with three levels of supply ventilation central fan operation at 33 duty cycle (20 min off 10 min on) and bedroom doors closed (Tests B3 B2 B4) (Note Uncertainties introduced by non-uniform starting
concentration are of the same order of magnitude as the differences in reciprocal age-of-air among rooms for all three cases The relative ranking of rooms is not meaningful for these
cases)
42 of 49
Research Report - 0602
The average air change rates for the three supply ventilation rates compared to the two exhaust ventilation schemes are shown in Figure 41 The CFIS system at 33 of the 622 ventilation flow rate provided a uniformly higher air change rate (013 ach) than the least ventilated rooms using exhaust ventilation from either the laundry or the master bathroom (010 ach Figure 37) It is noteworthy that the combined net air change rate with exhaust ventilation from the laundry room was significantly less than the air change rates for both exhaust ventilation from the master bathroom and supply ventilation at the air handler This illustrates the unpredictability of interactions between mechanical ventilation and natural infiltration which depend strongly on the distribution and size of cracks through which the outside air must pass to enter the house There may have been a relatively large building enclosure leakage opening near the laundry room (perhaps the utility penetrations or the door to the garage) that allowed a significant amount of outside air to quickly enter and leave the house through the exhaust flow without circulating around the house
0
005
01
015
02
025
Ave
rag
e A
CH
Natural Exhaust Exhaust Supply 95 Supply 60 Supply 33
Laundry Mbath
Rm 100 100
Figure 41 Average air change rates for 2-story house with supply ventilation at 33 60 and 95 of ASHRAE 622 recommendations (Tests B4 B2 B3) compared to natural
infiltration (Test B14) and exhaust ventilation with no central fan operation (Test B1) Bedroom doors were closed except for the natural infiltration test
Bedroom Doors
The laundry room exhaust ventilation test with no air handler operation (see Figure 31) was repeated with the doors open to evaluate the change in room-to-room ventilation air distribution (Test B10) The decay curves are shown in Figure 42 and the reciprocal age-of air calculations are shown in Figure 43 It is evident from Figure 42 that the test began before the rooms were
43 of 49
Research Report - 0602
0
5
10
15
20
25
SF
6 C
on
ce
ntr
ati
on
(m
gm
3)
BR1 Living Kitchen BR2 BR3 MBR
Mixing stopped
Mixing restarted
completely well mixed resulting in decay curves that could be somewhat misleading Because the master bedroom was at a higher concentration than the other rooms at the start of the test any room that received air from the master bedroom would appear to have a slower decay rate than it would have if the rooms started out at the same concentration Despite the difference in starting concentration it is clear that outside air was well distributed when the doors were open even without operation of the air handler
1843 1912 1940 2009 2038 2107 2136 2204 2233 2302
Hour
Figure 42 Tracer gas decay for the 2-story house with exhaust ventilation from the laundry room at ASHRAE 622 level no central fan operation and bedroom doors open
(Test B10)
Reciprocal age-of-air analysis was not performed for this case because of the combined effect of a short test duration (~2 hours) and unequal starting tracer gas concentrations even though the house was relatively well-mixed The important conclusion (that opening doors greatly improves mixing) can be drawn by inspecting the decay curves alone
Transfer Grilles
A final exhaust ventilation test was run on the 2-story house with the doors closed and the transfer grilles taped over The decay curves are shown in Figure 43 and the reciprocal age-ofshyair calculations are shown in Figure 44 The curves were clearly very divergent even after 12 hours By examining the reciprocal age-of-air results it is apparent that the transfer grilles in the 2-story house caused a noticeable improvement in ventilation air distribution but the improvement was smaller than when the doors were opened (Figure 42)
44 of 49
Research Report - 0602
0
5
10
15
20
25
30
SF
6 C
on
cen
tra
tio
n (
mg
m3
) BR1 Living Kitchen BR2 BR3 MBR
Mixing stopped
Mixing restarted
1648 1912 2136 000 224 448 712 936
Hour
Figure 43 Tracer gas decay for 2-story house with exhaust ventilation from the laundry room at ASHRAE 622 level no central fan operation bedroom doors closed transfer
grilles taped closed (Test B7)
Exhaust Ventilation Transfer Grilles Untaped vs Taped
000
005
010
015
020
Re
cip
roc
al
Ag
e o
f A
ir (
1h
r)
BR1
Living
Kitchen
BR2
BR3
MBR
Exhaust in laundry room no Exhaust in laundry room no
mixing 100 ASHRAE mixing 100 ASHRAE
doors closed doors closed transfer
grilles taped
Figure 44 Reciprocal age-of-air for 2-story house with exhaust ventilation from the laundry room at ASHRAE 622 level no central fan operation and doors closed In the first case the transfer grilles are untaped (Test B3) in the second they are taped closed
(Test B7)
45 of 49
Research Report - 0602
CONCLUSIONS
bull Reciprocal age-of-air analysis was chosen as a quantitative method for characterizing distribution of ventilation air among rooms This method worked well in cases where rooms were well mixed to begin the test and weather conditions were sufficiently steady-state
bull A test period of at least 1frac12 air changes was necessary to obtain reasonably accurate ageshyof-air results when there was significant divergence in tracer gas concentration among the rooms
bull Although we did not achieve uniform initial concentration of tracer gas in the 2-story house using our test methodology and the equipment at hand we believe the reciprocal age-of-air calculations were meaningful in many of the cases as indicated in the discussion
bull Both houses were relatively tight with natural infiltration averaging 008 ACH for the 1shystory house and 011 ACH for the 2-story house
bull Both houses had relatively small (but not negligible) duct losses to the outside producing an increase in infiltration of less than 003 ACH for the 1-story house and 002 ACH for the 2-story house when the air handler runs
bull Age-of-air analysis indicated that ventilation supplied through the central air distribution system provided much more uniform distribution of ventilation air than the single-point exhaust system when the doors were closed and the air handler was not running For the 1-story house the central-fan-integrated supply ventilation case at 60 of ASHRAE 622 provided more outside air to all rooms than the least-ventilated room in the exhaust case at 100 of 622 For the 2-story house the central-fan-integrated supply system at 33 of the 622 flow rate provided more outside air to all rooms than the least ventilated rooms using exhaust ventilation at 100 of 622 from either the laundry or the master bathroom
bull Operation of the central fan at a 33 duty cycle maintained relatively well-mixed conditions regardless of ventilation rate type of ventilation system (supply or exhaust) or house configuration (1-story or 2-story)
bull Exhaust location affected both the relative amount of outside air received by different rooms and the overall uniformity among rooms but the effect was not predictable
bull For exhaust-only ventilation without central fan operation opening bedroom doors appeared to significantly improve the mixing of ventilation air among rooms
bull Transfer grilles improved the distribution of ventilation air slightly but much less than opening the bedroom doors
bull In the 2-story house the stack effect caused air movement from the first floor to the second floor even when exhaust ventilation was applied to the first floor resulting in consistently higher tracer gas concentrations on the second floor and more non-uniform ventilation air distribution in general
bull Interactions between natural infiltration and both exhaust and supply mechanical ventilation were very significant When the ventilation system was activated the combined air change rate did not increase commensurate with the measured ventilation rate but instead increased by only half that amount This result was consistent with combining ventilation and infiltration in quadrature to estimate whole-house air change rate in accordance with ASHRAE Standard 136 (ASHRAE 1993)
46 of 49
Research Report - 0602
FUTURE WORK
In future tests continuous monitoring of pressure differentials would enhance our understanding of the multi-zone combined infiltration and ventilation systems and our ability to model them That would help to explain differences between tests in more detail including the effects of multiple stories location of ventilation supply outlets and exhaust inlets interior door closure and use of passive return air transfer grilles Pressure differential measurement points should include
bull dP with respect to outside for each closed room and open space bull dP across closed interior doors bull dP between the floor cavity and outdoors and bull dP between the house and the attic
Measurement of wind direction along with wind speed could also be helpful for modeling these buildings and systems However because of micro-climate wind shielding it may be very difficult to relate a single-point wind direction measurement to actual wind vectors on the building surfaces
ACKNOWLEDGMENTS
The authors express their appreciation to Rich Coyle of DR Horton for providing the test houses and to Joseph Lstiburek of BSC Subrato Chandra and Neil Moyer of FSEC and Greg Barker of Mountain Energy Partnership for their assistance in the planning and execution of this ventilation study
47 of 49
Research Report - 0602
REFERENCES
ASHRAE (1993) ANSIASHRAE Standard 136-1993 A Method of Determining Air Change Rates in Detached Dwellings Atlanta GA American Society of Heating Refrigerating and Air-Conditioning Engineers Inc
ASHRAE (1997) ANSIASHRAE Standard 129-1997 Measuring Air-Change Effectiveness Atlanta GA American Society of Heating Refrigerating and Air-Conditioning Engineers Inc
ASHRAE (2004) ASHRAE Standard 622-2004 Ventilation and Acceptable Indoor Air Quality in Low-Rise Residential Buildings Atlanta GA American Society of Heating Refrigerating and Air-Conditioning Engineers Inc
CSA (2003) CANCSA F326-M91 Residential Mechanical Ventilation Systems Canadian Standards Association Ontario Canada httpwwwcsashyintlorgonlinestoreGetCatalogItemDetailsaspmat=2410793ampParent=102
NBC 2005 National Building Code of Canada httpircnrcshycnrcgccapubscodesnrcc47666_ehtml
Grieve PW (1991) Measuring Ventilation Using Tracer-Gases Denmark Bruumlel amp Kjaeligr
MN Chapter 7672 Minnesota Energy Code Chapter 7672 Detached Single-Family And Two-Family Dwellings httpwwwstatemnusmnexternalDocsCommerceChapter_7672_Residential_111302012428 _72rulepdf
Persily AK Martin SR (2000) A Modeling Study of Ventilation in Manufactured Houses Gaithersburg MD National Institute of Standards and Technology NISTIR 6455
Rudd A Lstiburek J (2000) ldquoMeasurement of Ventilation and Interzonal Distribution in Single-Family Homesrdquo ASHRAE Transactions 2000 MN-00-10-3 V 106 Pt2 American Society of Heating Refrigeration and Air-Conditioning Engineers Atlanta GA
WAC (2004) Washington State Title 51 WAC Community trade and economic development department of (building code council) Chapter 51-13 Ventilation and indoor air quality httpappslegwagovWACdefaultaspxcite=51-13
48 of 49
Research Report - 0602
Field test of room-to-room uniformity of ventilation air distribution in two new houses
About this Report
This report was prepared for the US Department of Energyrsquos Building America
Program The report is freely available to the public at wwwbuildingamericagov
The authors express their appreciation to Rich Coyle of DR Horton for providing the test houses and to Joseph Lstiburek of BSC Subrato Chandra and Neil Moyer of
FSEC and Greg Barker of Mountain Energy Partnership for their assistance in the planning and execution of this ventilation study
About the Authors
Robert Hendron Ren Anderson Dennis Barley are with National Renewable Energy Laboratory Armin Rudd and Aaron Townsend are with Building Science Corporation
Ed Hancock is with Mountain Energy Partnership
Direct all correspondence to Building Science Corporation 30 Forest Street Somerville MA 02143
Limits of Liability and Disclaimer of Warranty
Building Science documents are intended for professionals The author and the publisher of this article have used their best efforts to provide accurate and authoritative information in regard to the subject matter covered The author and publisher make no warranty of any kind expressed or implied with regard to the information contained in this article
The information presented in this article must be used with care by professionals who understand the implications of what they are doing If professional advice or other expert assistance is required the services of a competent professional shall be sought The author and publisher shall not be liable in the event of incidental or consequential damages in connection with or arising from the use of the information contained within this Building Science document
49 of 49
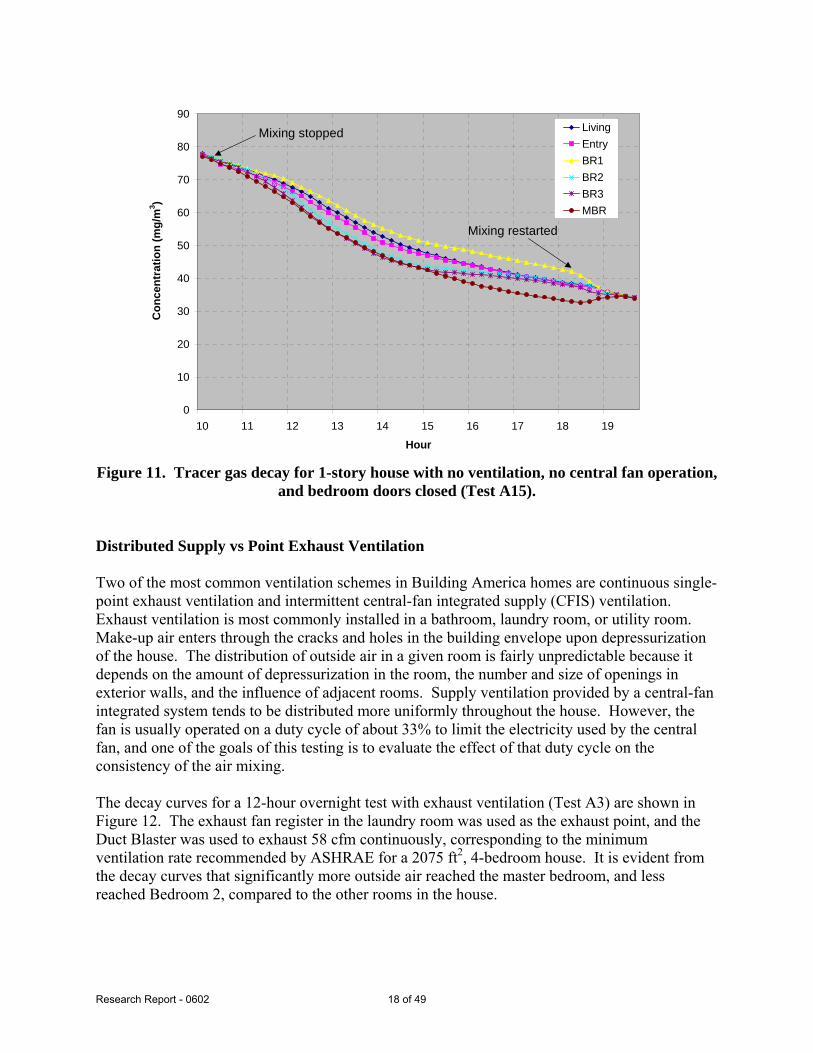
Research Report - 0602
0
10
20
30
40
50
60
70
80
90
Co
ncen
trati
on
(m
gm
3 )
Living
Entry
BR1
BR2
BR3
MBR
Mixing stopped
Mixing restarted
10 11 12 13 14 15 16 17 18 19
Hour
Figure 11 Tracer gas decay for 1-story house with no ventilation no central fan operation and bedroom doors closed (Test A15)
Distributed Supply vs Point Exhaust Ventilation
Two of the most common ventilation schemes in Building America homes are continuous single-point exhaust ventilation and intermittent central-fan integrated supply (CFIS) ventilation Exhaust ventilation is most commonly installed in a bathroom laundry room or utility room Make-up air enters through the cracks and holes in the building envelope upon depressurization of the house The distribution of outside air in a given room is fairly unpredictable because it depends on the amount of depressurization in the room the number and size of openings in exterior walls and the influence of adjacent rooms Supply ventilation provided by a central-fan integrated system tends to be distributed more uniformly throughout the house However the fan is usually operated on a duty cycle of about 33 to limit the electricity used by the central fan and one of the goals of this testing is to evaluate the effect of that duty cycle on the consistency of the air mixing
The decay curves for a 12-hour overnight test with exhaust ventilation (Test A3) are shown in Figure 12 The exhaust fan register in the laundry room was used as the exhaust point and the Duct Blaster was used to exhaust 58 cfm continuously corresponding to the minimum ventilation rate recommended by ASHRAE for a 2075 ft2 4-bedroom house It is evident from the decay curves that significantly more outside air reached the master bedroom and less reached Bedroom 2 compared to the other rooms in the house
18 of 49
Research Report - 0602
0
2
4
6
8
10
12
14
Co
nc
en
tra
tio
n
mg
m3
Living
Entry
BR1
BR2
BR3
MBR
Mixing stopped
Mixing restarted
17 18 19 20 21 22 23 0 1 2 3 4 5 6
Hour
Figure 12 Tracer gas decay for 1-story house with exhaust ventilation from the laundry room at ASHRAE 622 level no central fan operation and bedroom doors closed (Test A3)
The corresponding decay curves for the central fan integrated supply system (Test A6) are shown in Figure 13 The air handler operated at a 33 duty cycle (20 min off 10 min on) with a ventilation rate of 174 cfm resulting in an average ventilation rate of 58 cfm again meeting the minimum ASHRAE 622 recommendations The whole house appeared to be well-mixed in this case because the decay curves were clustered together throughout the test Even during the 20 minute periods when the air handler was off there was very little divergence A comparison of Figure 12 to Figure 13 indicates that much more uniform distribution of ventilation air was achieved by using the CFIS system
19 of 49
Research Report - 0602
0
2
4
6
8
10
12
14
16
Co
nc
en
trati
on
(m
gm
3 )
Living
Entry
BR1
BR2
BR3
MBR
Mixing stopped
Mixing restarted
185 195 205 215 225 235 05 15 25 35 45 55 65
Hour
Figure 13 Tracer gas decay for 1-story house with supply ventilation at ASHRAE 622 level 33 central fan operation (20 min off 10 min on) and bedroom doors closed (Test
A6)
Reciprocal age-of-air calculations were performed to provide a quantitative comparison of the two ventilation systems as shown in Figure 14 Values were in the range of 0169 hr-1 +0042shy0038 hr-1 for the exhaust ventilation system compared to 0173 hr-1 +0002-0003 hr-1 for the supply ventilation system expressed in terms of the range of differences between the reciprocal age-of-air in each room and the whole-house air change rate With the exhaust ventilation at the laundry room the master bedroom received the greatest amount of fresh air We suspect this may have been caused by the presence of the exhaust ducts used for spot ventilation of the master bathroom possibly providing greater leakage area near the master bathroom than is present in other areas of the house The supply system distributed the ventilation air more uniformly but it is not entirely clear whether this result was primarily caused by the introduction of ventilation air through the supply ducts or by the air handler mixing air throughout the house Since it is clear that the exhaust ventilation showed better uniformity of ventilation with central system mixing it follows that mixing is likely to be the primary factor in the room-to-room uniformity shown by CFIS ventilation
It is also noteworthy that the average net air change rates provided by both the supply and exhaust ventilation systems were only about 018 ACH compared to the 025 ACH that would be expected if the mechanical ventilation rate (017 ACH) and the natural infiltration rate (008 ACH) were additive as they might be with a balanced ventilation system Adding mechanical ventilation to natural infiltration in quadrature results in an estimated average air change rate of 019 ACH which is fairly consistent with the measured values
20 of 49
Research Report - 0602
Recip
rocal
Ag
e o
f A
ir (
1h
r) 025
020
015
010
005
000
Simple Exhaust vs Central Fan Integrated
Supply
Centralized supply mixing
33 duty cycle 100
ASHRAE doors closed
Living
Entry
BR1
BR2
BR3
MBR
Exhaust in utility room no
mixing 100 ASHRAE
doors closed
Figure 14 Reciprocal age-of-air for 1-story house with continuous exhaust ventilation (Test A3) compared to central fan integrated supply ventilation (Test A6)
Air Handler Operation
To determine how much room-to-room mixing was caused by the air handler the exhaust only test was re-run with the air handler operating at 33 duty cycle (20 min off 10 min on) (Test A12) The decay curves are shown in Figure 15 Compared to Test A3 (Figure 12) there was a noticeable increase in uniformity when the air handler was operating even though the entry points for the ventilation air were uncontrolled As shown in Figure 16 the range of reciprocal age of air was reduced from +0042-0038 hr-1 to +0019-0011 hr-1) It appears that operation of the air handler explains most of the difference between the supply and exhaust ventilation systems discussed earlier Although it also appears that the overall average air change rate was higher in the case where the air handler was operating (0216 ACH vs 0176) it should be noted that the average wind speed was also significantly higher It is likely that the wind speed was the primary cause of the difference in average ACH not a difference in the mechanical ventilation rate
21 of 49
Research Report - 0602
0
5
10
15
20
25
30
35
Co
nce
ntr
ati
on
(m
gm
3 )
Living
Entry
BR1
BR2
BR3
MBR
Mixing stopped
Mixing restarted
0 1 2 3 4 5 6 7 8 9 10 11 12 13 14
Hour
Figure 15 Tracer gas decay for 1-story house with continuous exhaust ventilation at ASHRAE 622 level 33 central fan operation (20 min off 10 min on) and bedroom
doors closed (Test A12)
Exhaust Ventilation No Mixing vs 33 Air Handler Duty Cycle
000
005
010
015
020
025
Recip
rocal A
ge o
f A
ir (
1h
r)
Living
Entry
BR1
BR2
BR3
MBR
Exhaust in utility room 33 air handler
no mixing 100 operation exhaust in
ASHRAE doors closed utility room 100
ASHRAE doors closed
Figure 16 Reciprocal age-of-air for 1-story house with continuous exhaust ventilation with and without air handler operation (Tests A3 and A12)
22 of 49
Research Report - 0602
Exhaust Location
The preceding analysis of exhaust ventilation was based on an exhaust point in the laundry room which was relatively centrally located in the 1-story house To examine the effect of moving the exhaust point the duct blaster was moved to the master bathroom which was located in a far corner of the house (Test A16) A continuous exhaust ventilation rate of 58 cfm was again applied to the house resulting in the tracer gas decay curve shown in Figure 17 It is difficult to visually identify a significant difference between this series of curves and those shown in Figure 12 for the laundry room exhaust location
Because the curves were steady it is again possible to compare the results based on reciprocal age-of-air as shown in Figure 18 There appeared to be very little change in the distribution of outside air to most rooms However the reciprocal age-of-air in the master bedroom dropped noticeably when the exhaust location was moved to the master bathroom probably because a greater fraction of the outside air now passed through other rooms before reaching the master bedroom With the exhaust point centrally located most of the ventilation air passing through the master bedroom probably entered from the outside In both cases however the master bedroom had the highest reciprocal age-of-air of all of the rooms in the house and the BR2 location had the lowest
Co
nc
en
tra
tio
n (
mg
m3)
40
35
30
25
20
15
10
5
0
Living
Entry
BR1
BR2
BR3
MBR
Mixing stopped
Mixing restarted
19 20 21 22 23 0 1 2 3 4 5 6 7 8
Hour
Figure 17 Tracer gas decay for 1-story house with exhaust ventilation from the master bathroom at ASHRAE 622 level no central fan operation and bedroom doors closed (Test
A16)
23 of 49
Research Report - 0602
Exhaust Ventilation
Laundry Room vs Master Bathroom
000
005
010
015
020
025
Exhaust in laundry
room no mixing 100
ASHRAE doors closed
Exhaust in master
bathroom no mixing
100 ASHRAE doors
closed
Re
cip
roc
al A
ge
of
Air
(1
hr)
Living
Entry
BR1
BR2
BR3
MBR
Figure 18 Reciprocal age-of-air for 1-story house with exhaust ventilation from the master bathroom compared to the laundry room at ASHRAE 622 level no central fan operation
and bedroom doors closed (Tests A3 and A16)
Ventilation Rate
The supply ventilation test was repeated using flow rates corresponding to 60 and 33 of the ASHRAE recommendations The intent of this series of tests was to evaluate the room-to-room ventilation uniformity for ventilation rates consistent with ASHRAE 622 compared to the uniformity for reduced mechanical ventilation rates Each test was conducted for only 4 hours because of time limitations The decay curves are shown in Figures 19 and 20 Because the rooms were well-mixed during the supply ventilation tests the average whole-house ACH can be compared directly to the reciprocal age-of-air for the exhaust ventilation tests Figure 21 shows the supply ventilation air change rate for each of the three ventilation levels (33 60 100) compared to room-by-room reciprocal age-of-air for the exhaust ventilation system based on the boundary conditions present during the tests It appears that in the supply ventilation case all rooms receive more outside air than the least-ventilated room in the exhaust case (BR2) even at 60 of ASHRAE 622 These results serve to illustrate the trade-off between whole-house ventilation rate and room-to-room ventilation uniformity in terms of their impact on the worst room(s)
24 of 49
Research Report - 0602
The ASHRAE 622 committee has not currently defined the level of mixing that is required when choosing the minimum ventilation rate Some might interpret the results of this test to suggest that a house without mixing can have individual rooms that do not receive sufficient outside air even though the ventilation system is operating at 622 specified rates Because the 622 committee has not specified the level of mixing that is required when choosing the minimum ventilation rate the ventilation rate required by different ventilation systems is open to interpretation For example if the exhaust system performance shown in Figure 21 is acceptable does this mean that a ventilation system that provides good distribution of outside air may be sufficiently well-ventilated at 60 of the ASHRAE 622 level or perhaps even less Alternatively it might be concluded that exhaust ventilation rates should be increased over current ASHRAE 622 recommendations because of the possibility that certain rooms may receive very little fresh air Unfortunately because the current 622 standard does not specify air mixing requirements and the committeersquos assumptions about ventilation air distribution are not well documented it is difficult to make any firm recommendations in this area However we can conclude that air mixing is required for dilution ventilation systems to provide predictable results independent of the geometry of individual homes
8 9 10 11 12 13 14
Hour
Figure 19 Tracer gas decay for 1-story house with supply ventilation at 60 of ASHRAE 622 level 33 central fan operation (20 min off 10 min on) and bedroom doors closed
(Test A4)
0
10
20
30
40
50
60
Co
nce
ntr
ati
on
m
gm
3
Living
Entry
BR1
BR2
BR3
MBR
Mixing stopped
Mixing restarted
25 of 49
Research Report - 0602
0
5
10
15
20
25
30
Co
nce
ntr
ati
on
(m
gm
3 )
Living
Entry
BR1
BR2
BR3
MBR
Mixing stopped
Mixing restarted
12 13 14 15 16 17 18 19 20
Hour
Figure 20 Tracer gas decay for 1-story house with supply ventilation at 33 of ASHRAE 622 level 33 central fan operation (20 min off 10 min on) and bedroom doors closed
(Test A5)
Simple Exhaust vs Central Fan Integrated
Supply with Lower Ventilation Rates
025
Re
cip
roc
al A
ge
of
Air
(1
hr)
Well Mixed
100
ASHRAE 60
ASHRAE 33
ASHRAE Living Entry 010 Natural
BR1 Infilt
BR2 BR3 005
MBR
Exhaust in laundry room no
000
Central supply Natural infil-
mixing 100 ASHRAE doors mixing 33 duty tration doors
closed cycle doors closed open
Figure 21 Reciprocal age-of-air for 1-story house with supply ventilation at 33 60 and 100 of ASHRAE 622 level (Tests A5 A4 A6) compared to exhaust ventilation with
no central fan operation (Test A3) Bedroom doors were closed
020
015
26 of 49
Research Report - 0602
Simulations by Walker (2006) have shown that all systems will not provide the same service in terms of annual average air change rate For the same air flow rate and duty cycle balanced ventilation will yield a higher average air exchange than supply ventilation and supply ventilation will yield a higher average air exchange than exhaust ventilation That can be explained in general terms by understanding that wind and stack effects act to depressurize a building most of the time Exhaust fans increase the building depressurization further but supply fans decrease the depressurization Balanced fans donrsquot change the enclosure differential pressure and air flow at all Because of the non-linear relationship between differential pressure and air flows across the building enclosure a supply fan changes the pressures across the enclosure less than an exhaust fan acting more like a balanced fan The result is that the effect on ventilation air change rate from a supply fan is somewhere between that of an exhaust fan and a true balanced system
Bedroom Doors
Except for the natural ventilation test the preceding tests were all conducted with the bedroom doors closed to simulate a worst-case situation for air circulation within the house The exhaust ventilation test was repeated with the bedroom doors open (Test A9) producing the tracer gas decay curve shown in Figure 22 It is evident that the decay curves were much more tightly bundled with the doors open than they were with the doors closed (compare Figure 12) A comparison based on reciprocal age-of-air is shown in Figure 23 A significant improvement in room-to-room mixing is evident during the open-door test
It is also evident that the average air change rate was higher when the doors were open (0202 vs 0176 ACH) but it must be remembered that the ventilation rate was controlled using a duct blaster and average wind speed was higher during the open-door test period compared to the closed-door test period (20 mph compared to 06 mph) Therefore this test alone does not necessarily indicate that closing doors reduces the average air change rate associated with an exhaust system In future tests continuous measurement of the depressurization of the house with respect to outside along with single-point pressure measurements across interior doors would provide more information about the effect of closing doors when exhaust ventilation systems are used It would also be valuable to conduct this test during steady weather conditions using the exhaust fan (with uncontrolled ventilation rate) instead of the duct blaster to observe the net effect of closed doors on whole-house air change rate
27 of 49
Research Report - 0602
0
5
10
15
20
25
30
Co
ncen
trati
on
(m
gm
3 )
Living
Entry
BR1
BR2
BR3
MBR
Mixing stopped
Mixing restarted
181 191 201 211 221 231 01 11 21 31 41 51 61 71
Hour
Figure 22 Tracer gas decay for 1-story house with exhaust ventilation from the laundry room at ASHRAE 622 level no central fan operation and bedroom doors open (Test A9)
Exhaust Ventilation
Doors Closed vs Doors Open
000
005
010
015
020
025
Re
cip
roc
al
Ag
e o
f A
ir (
1h
r)
Living
Entry
BR1
BR2
BR3
MBR
Exhaust in laundry room Doors open no mixing
no mixing 100 exhaust in laundry room
ASHRAE doors closed 100 ASHRAE
Figure 23 Reciprocal age-of-air for 1-story house with exhaust ventilation from the laundry room at ASHRAE 622 level no central fan operation In the first case the bedroom doors were closed (Test A3) in the second the doors were open (Test A9)
28 of 49
Research Report - 0602
Transfer Grilles
Because the test houses used central returns instead of hard ducted returns in the bedrooms transfer grilles were installed over the bedroom doors to provide a flow path for return air without excessive room pressurization when the doors were closed These transfer grilles also allowed ventilation air to pass more freely from the bedrooms to the main living space The effect of transfer grilles on ventilation air distribution was evaluated by taping over the grilles (see Figure 24) and re-running the exhaust ventilation test (Test A10) The corresponding tracer gas decay curve is shown in Figure 25 and the reciprocal age-of-air analysis is shown in Figure 26 Taping the transfer grilles did not appear to significantly affect the room-to-room variability in ventilation rate although there appeared to be some slight re-ranking of rooms from highest to lowest reciprocal age-of-air It should be noted that there was an increase in average wind speed from 26 mph to 41 mph starting at 1 pm including a half hour period where the average wind speed was 7 mph This weather effect produced noticeable kinks in the decay curves and therefore would be expected to introduce significant errors into the reciprocal age-of-air results
Itrsquos possible that the transfer grilles played a much smaller role in providing a path for ventilation air than the supply ducts Because the air handler was not operating the ducts were not pressurized and were thus available as passive airflow conduits The resistance to air flow was probably smaller for the air ducts than for the transfer grilles depending on their size and the number of supply registers in each bedroom The existing door undercuts are also thought to have played a role The effect of ducts and door undercuts can be tested in the future by running separate tests with ducts and door undercuts taped over
copy buildingsciencecom
Figure 24 Transfer grilles over bedroom doors taped closed
29 of 49
Research Report - 0602
0
10
20
30
40
50
60
70
Co
nc
en
tra
tio
n (
mg
m3 )
Living
Entry
BR1
BR2
BR3
MBR
Mixing stopped
Mixing restarted
8 9 10 11 12 13 14 15 16 17
Hour
Figure 25 Tracer gas decay for 1-story house with exhaust ventilation from the laundry room at ASHRAE 622 level no central fan operation bedroom doors closed and transfer
grilles taped (Test A10)
Exhaust Ventilation
000
005
010
015
020
025
Re
cip
roc
al
Ag
e o
f A
ir (
1h
r)
Living
Entry
BR1
BR2
BR3
MBR
Transfer Grilles Untaped vs Taped
Exhaust in laundry room no Exhaust in laundry room no
mixing 100 ASHRAE mixing 100 ASHRAE
doors closed doors closed transfer
grilles taped
Figure 26 Reciprocal age-of-air for 1-story house with exhaust ventilation from the laundry room at ASHRAE 622 level no central fan operation and doors closed In the
30 of 49
Research Report - 0602
first case the transfer grilles are untaped (Test A3) in the second they are taped closed (Test A10)
Minimum Test Duration
We were fortunate that DR Horton provided two full weeks of access to these homes to conduct this series of tests which allowed us to run some of the more important tracer gas decay tests as long as 12 hours to help ensure that we could accurately calculate reciprocal age-of-air In most cases test houses would not be available for such a long time period To evaluate the length of time needed to estimate the reciprocal age-of-air with reasonable accuracy we examined the results that we would have obtained for one of the exhaust ventilation tests had we halted the test period after less than 12 hours For the supply ventilation tests the rooms were sufficiently well-mixed that the test could have been stopped after 3 or 4 hours assuming weather effects were steady
The reciprocal age-of-air calculations for the exhaust ventilation decay curves (Test A3 see Figure 12) based on test durations of 3 6 9 and 12 hours are shown in Figure 27 These test durations range from 053 to 21 air changes based on the average air change rate of 018 ACH (56 hours per air change) calculated for this test The ratio of highest to lowest reciprocal ageshyof-air is shown above the data points for each case These results suggest that shorter tests tend to overestimate the range and that perhaps 1frac12-2 air changes (roughly 9 to 12 hours in this case) may be necessary to obtain accurate calculations of reciprocal age-of-air when there is significant divergence among rooms From a qualitative standpoint one air change may be sufficient to determine the basic trend Without knowing in advance what mixing pattern will occur it is difficult to recommend a minimum test duration But assuming this test is fairly representative of a worst-case scenario a minimum of 15 air changes would be necessary to have a high degree of confidence in the quantitative difference in reciprocal age-of-air among rooms
31 of 49
Research Report - 0602
000
005
010
015
020
025
030
035
Re
cip
roc
al
Ag
e-O
f-A
ir (
hr-1
)
Living
Entry
BR1
BR2
BR3
MBR HighLow = 297
HighLow = 168 HighLow = 184 HighLow = 161
3-hour Test 6-hour Test 9-hour Test 12-hour Test
(053 Air Changes) (11 Air Changes) (16 Air Changes) (21 Air Changes)
Test Duration
Figure 27 Reciprocal age-of-air based on alternate test durations for 1-story house with exhaust ventilation from the laundry room at ASHRAE 622 level no central fan operation
and doors closed (Test A3) Average air change rate was 018 ACH
TEST RESULTS FROM 2-STORY HOUSE (1117 MONTAGUE)
The 2-story house was tested from January 3-10 2006 Three zones were selected on the first floor and three more were selected on the second floor as indicated by the red stars in Figure 4 The initial mixing of air among the rooms at the start of each test in this 2-story house was not as thorough as it was in the 1-story house Evidently the combined effects of the air handler and the portable de-stratification fan were not sufficient to overcome upward transport of tracer gas driven by the stack effect from the first to the second floor The resulting difference in initial tracer gas concentration among the rooms was about 5-10 This outcome emphasizes the significant effect of stack-driven infiltration on ventilation non-uniformity in multi-story homes Because our test method and equipment did not achieve a well-mixed condition at the start of each test there were some errors introduced into the reciprocal age-of-air analysis For future tests we would recommend larger de-stratification fans to obtain more well-mixed conditions in multi-story houses
Typical errors introduced by incomplete mixing of the tracer gas at the start of such a test were analyzed by examining two hypothetical cases where either all of the air entering a room comes from the outside or all of the air comes from an adjacent room with a different starting concentration If all of the air entering a space comes from the outside then a change in the initial concentration would have no effect on the reciprocal age-of-air because the decay curve would be exponential from the start and the area under the curve would be normalized based on
32 of 49
Research Report - 0602
the starting concentration in that zone However if the air entering a room passes through another room with a lower initial concentration the room receiving the air will have a lower concentration of tracer gas throughout the test compared to what the concentration would have been if the starting points were the same in both rooms This case is illustrated in Figure 28 where assumptions are made that the rooms are the same size the air exchange rate is 01 ACH for both rooms and the initial tracer gas concentration is 10 lower in the first room (upstream) than it is in the second room
The effect on reciprocal age-of-air is shown in Figure 29 A 10 difference in starting concentration results in an error of about 75 in reciprocal age-of-air for a room downstream of a room with a lower starting concentration assuming 01 ACH for both rooms The error would be somewhat smaller (about 5) if the air change rate was higher for both rooms (02 ACH) There would be no error introduced for rooms where all of the air infiltration comes from the outside Although the amount of error in the reciprocal age-of-air calculations can be affected by additional variables not examined here we feel that these percentages are reasonable estimates of the errors in our results for the 2-story house due to incomplete initial mixing of air
In each case an engineering judgment must be made regarding the significance of the error introduced by incomplete initial mixing As a general rule the differences in concentration at the start of the test should be small compared to the differences that are being measured in order for the results to be considered valid
Figure 28 Theoretical decay curves for a well-mixed case with uniform tracer gas concentration compared to a case where the upstream room starts with a concentration
10 lower than the downstream room
33 of 49
Research Report - 0602
Figure 29 Theoretical reciprocal age-of-air for a well-mixed case with uniform tracer gas concentration compared to a case where the upstream room starts with a concentration
10 lower than the downstream room
Natural Infiltration and Duct Leakage
A natural infiltration test was performed over a two hour period on the evening of January 8 (Test B14) The tracer gas decay curves are shown in Figure 30 There was a slight divergence between the first floor and second floor once the air handler was turned off but the rooms on each floor appeared to remain fairly well-mixed The average air change rate during the test period was about 011 ACH which was somewhat higher than the 1-story house as might be expected with an increased stack height
An air handler bedroom door bump test was conducted just prior to the test period shown in Figure 30 allowing observation of the combined effect of duct leakage to the outside and increased infiltration caused by room pressurization The average air change rate during that bump test was 013 ACH suggesting that closing doors and operating the fan added approximately 002 ACH to the whole-house average air change rate The average wind speed was a bit higher while the air handler was running (17 mph compared to 05 mph) so the effect of air handler operation may actually be somewhat less than the average ACH numbers indicate
34 of 49
Research Report - 0602
0
1
2
3
4
SF
6 C
on
ce
ntr
ati
on
(m
gm
3)
BR1
Living
Kitchen
BR2
BR3
MBR
Mixing stopped
Mixing restarted
1814 1843 1912 1940 2009 2038 2107 2136
Hour
Figure 30 Tracer gas decay for 2-story house with no ventilation no central fan operation and bedroom doors open (Test B14)
Distributed Supply vs Point Exhaust Ventilation
A 14-hour test (Test B1) was performed with an exhaust ventilation rate of 63 cfm in the laundry room which was located near the stairwell in the middle of the first floor The ventilation rate was again consistent with the ASHRAE 622 recommendations The tracer gas decay curves are shown in Figure 31 It is interesting that all three second floor rooms showed a delay before entering an exponential decay suggesting that some amount of air was moving from the first floor to the second floor even though the mechanical exhaust point was on the first floor It appears that the further depressurization of the first floor was insufficient to overcome the stack effect and draw a significant amount of outside air in through the rooms on the second floor
35 of 49
Research Report - 0602
182
9
192
9
202
9
212
9
222
9
232
9
029
129
229
329
429
529
629
729
828
929
102
8
112
8
122
8
0
10
20
30
40
50
60
70
SF
6 C
on
ce
ntr
ati
on
(m
gm
3)
BR1
Living
Kitchen
BR2
BR3
MBR
Mixing stopped
Mixing restarted
Hour
Figure 31 Tracer gas decay for 2-story house with exhaust ventilation from the laundry room at ASHRAE 622 level no central fan operation and bedroom doors closed (Test B1)
A supply ventilation test was performed on the 2-story house for about 11 hours starting late on January 4 (Test B3) The duct blaster was unable to provide the ventilation rate necessary to meet the minimum specified in ASHRAE 622 supplying 180 cfm instead of 189 cfm (95) The decay curves are shown in Figure 32 Although the curves are much more tightly packed than they were with the exhaust system there is more divergence than we saw with the supply system in the 1-story house most notably in the master bedroom
The reciprocal age-of-air calculations for both the exhaust and supply ventilation systems are shown in Figure 33 Again the results indicate that much better room-to-room distribution of ventilation air was achieved by the central-fan integrated supply system compared to the single-point exhaust system However for the supply ventilation test the differences in the initial tracer gas concentration were of the same magnitude as the differences in decay rates among the rooms As a result no conclusions should be drawn about the relative ranking of the supply ventilation rate among rooms based on Figure 33
36 of 49
Research Report - 0602
0
10
20
30
40
50
60
SF
6 C
on
ce
ntr
ati
on
(m
gm
3)
BR1
Living
Kitchen
BR2
BR3
MBR
Mixing stopped
Mixing restarted
2136 000 224 448 712 936 1200
Hour
Figure 32 Tracer gas decay for 2-story house with supply ventilation just under ASHRAE 622 level central fan operation at 33 duty cycle (20 min off 10 min on) and bedroom
doors closed (Test B3)
Simple Exhaust vs Central Fan Integrated
Supply )
000
005
010
015
020
025
Recip
rocal A
ge o
f A
ir (
1h
r
BR1
Living
Kitchen
BR2
BR3
MBR
Exhaust in laundry room no Centralized supply mixing
mixing 100 ASHRAE 33 duty cycle 95
doors closed ASHRAE doors closed
Figure 33 Reciprocal age-of-air for 2-story house with continuous exhaust ventilation (Test B1) compared to central fan integrated supply ventilation (Test B3) (Note
Uncertainties introduced by non-uniform starting concentration are of the same order of magnitude as the differences in reciprocal age-of-air among rooms for the supply ventilation case The relative ranking of rooms is not meaningful for that case)
37 of 49
Research Report - 0602
Air Handler Operation
The effect of occasional air handler operation on the distribution of exhaust ventilation air was evaluated on the afternoon of January 6 (Test B6) The tracer gas decay curves are shown in Figure 34 and reciprocal age-of-air calculations are shown in Figure 35 It should again be noted that before the test started the house was mixed using both the air handler and a de-stratification fan with the doors open During the test the doors were closed the de-stratification fan was turned off and the air handler operated at a 33 duty cycle (20 minutes off 10 minutes on) As was the case in the 1-story house this occasional operation of the air handler substantially improved the distribution of ventilation air among rooms even in conjunction with the point exhaust ventilation system There was very little divergence noticeable even with the air handler cycling on and off every half hour However because the initial differences in tracer gas concentration among rooms were as large as the differences in reciprocal age-of-air for the case with air handler operation no conclusions should be drawn about the relative ranking of ventilation rates among the rooms for that case
SF
6 C
on
cen
trati
on
(m
gm
3)
80
70
60
50
40
30
20
10
0
BR1
Living
Kitchen
BR2
BR3
MBR
Mixing stopped
Mixing restarted
1048 1200 1312 1424 1536 1648 1800 1912 2024
Hour
Figure 34 Tracer gas decay for 2-story house with continuous exhaust ventilation at ASHRAE 622 level central fan operation at 33 duty cycle (20 min off 10 min on) and
bedroom doors closed (Test B6)
38 of 49
Research Report - 0602
020
015 R
ec
ipro
ca
l A
ge
of
Air
(1
hr)
Exhaust Ventilation
No Mixing vs 33 Air Handler Duty Cycle
Exhaust in laundry room
no mixing 100
ASHRAE doors closed
33 air handler
operation exhaust in
laundry room 100
ASHRAE doors closed
BR1
Living
Kitchen
BR2
BR3
MBR
010
005
000
Figure 35 Reciprocal age-of-air for 2-story house with continuous exhaust ventilation with and without air handler operation (Tests B1 and B6) (Note Uncertainties introduced by non-uniform starting concentration are of the same order of magnitude as the differences in reciprocal age-of-air among rooms for the case with air handler operation The relative
ranking of rooms is not meaningful for that case)
Exhaust Location
The duct blaster was moved to the master bathroom exhaust register to see if there was a resulting change in ventilation air distribution (Test B18) The master bathroom was in the back of the house on the second floor between the master bedroom and bedroom 3 The decay curves are shown in Figure 36 and the reciprocal age-of-air results are shown in Figure 37 The rooms on each floor were well mixed before the test began although the mixing between the two floors was not as good Very wide divergence among rooms can be seen during the test especially between the upstairs bedrooms and the rest of the house Once again all three upstairs rooms appear to receive some air from the first floor but the master bedroom experiences a much higher volume of circulated air than the other two second-floor bedrooms which appear to be relatively stagnant
39 of 49
Research Report - 0602
0
10
20
30
40
50
60
70
80
90
SF
6 C
on
ce
ntr
ati
on
(m
gm
3)
BR1
Living
Kitchen
BR2
BR3
MBR
Mixing stopped
Mixing restarted
1912 2136 000 224 448 712 936 1200
Hour
Figure 36 Tracer gas decay for 2-story house with exhaust ventilation from the master bathroom at ASHRAE 622 level no central fan operation and bedroom doors closed (Test
B18)
Exhaust Ventilation
Laundry Room vs Master Bathroom
000
005
010
015
020
025
030
Exhaust in laundry room no
mixing 100 ASHRAE
doors closed
Exhaust in master bathroom
no mixing 100 ASHRAE
doors closed
Re
cip
roc
al A
ge
of
Air
(1
hr)
BR1
Living
Kitchen
BR2
BR3
MBR
Figure 37 Reciprocal age-of-air for 2-story house with exhaust ventilation from the master bathroom compared to the laundry room at ASHRAE 622 level no central fan operation
and bedroom doors closed (Tests B1 and B18)
40 of 49
Research Report - 0602
Ventilation Rate
The supply ventilation tests were repeated using flow rates of 60 and 33 of ASHRAE 622 recommendations corresponding to 114 cfm and 63 cfm respectively (Tests B2 and B4) The decay curves are shown in Figures 38 and 39 Reciprocal age-of-air for all three supply ventilation rates are shown in Figure 40 In all cases the rooms remained fairly well mixed especially rooms on the same floor As we observed in the 1-story house the ventilation rate in the 2-story house appeared to have very little effect on the uniformity of outside air provided to each room as long as it was mixed using the air handler One again the initial differences in tracer gas concentration among rooms were as large as the divergence in the decay curves preventing any conclusions about the relative ranking of ventilation rates among rooms for all three cases The error in initial concentration uniformity was bigger for the cases with air handler mixing because the relative divergence in the decay curves was so small compared to that of no air handler mixing In other words the error in relative ranking of ventilation rates for the cases with air handler mixing were not very important anyway because the relative differences between rooms were so small
1536 1648 1800 1912 2024 2136 2248
Hour
Figure 38 Tracer gas decay for 2-story house with supply ventilation at 60 of ASHRAE 622 level 33 central fan operation (20 min off 10 min on) and bedroom doors closed
(Test B2)
0
5
10
15
20
25
30
SF
6 C
on
cen
trati
on
(m
gm
3)
BR1 Living Kitchen BR2 BR3 MBR
Mixing stopped
Mixing restarted
41 of 49
Research Report - 0602
0
5
10
15
20
25
30
35
40
SF
6 C
on
cen
trati
on
(m
gm
3)
BR1
Living
Kitchen
BR2
BR3
MBR
Mixing stopped
Mixing restarted
1200 1312 1424 1536 1648 1800 1912
Hour
Figure 39 Tracer gas decay for 2-story house with supply ventilation at 33 of ASHRAE 622 level 33 central fan operation (20 min off 10 min on) and bedroom doors closed
(Test B4)
Supply Ventilation Rate Comparison
000
005
010
015
020
025
Re
cip
roc
al
Ag
e o
f A
ir (
1h
r)
BR1
Living
Kitchen
BR2
BR3
MBR
Centralized supply Centralized supply Centralized supply
mixing 33 duty mixing 33 duty mixing 33 duty
cycle 95 ASHRAE cycle 60 ASHRAE cycle 33 ASHRAE
doors closed doors closed doors closed
Figure 40 Reciprocal age-of-air for 2-story house with three levels of supply ventilation central fan operation at 33 duty cycle (20 min off 10 min on) and bedroom doors closed (Tests B3 B2 B4) (Note Uncertainties introduced by non-uniform starting
concentration are of the same order of magnitude as the differences in reciprocal age-of-air among rooms for all three cases The relative ranking of rooms is not meaningful for these
cases)
42 of 49
Research Report - 0602
The average air change rates for the three supply ventilation rates compared to the two exhaust ventilation schemes are shown in Figure 41 The CFIS system at 33 of the 622 ventilation flow rate provided a uniformly higher air change rate (013 ach) than the least ventilated rooms using exhaust ventilation from either the laundry or the master bathroom (010 ach Figure 37) It is noteworthy that the combined net air change rate with exhaust ventilation from the laundry room was significantly less than the air change rates for both exhaust ventilation from the master bathroom and supply ventilation at the air handler This illustrates the unpredictability of interactions between mechanical ventilation and natural infiltration which depend strongly on the distribution and size of cracks through which the outside air must pass to enter the house There may have been a relatively large building enclosure leakage opening near the laundry room (perhaps the utility penetrations or the door to the garage) that allowed a significant amount of outside air to quickly enter and leave the house through the exhaust flow without circulating around the house
0
005
01
015
02
025
Ave
rag
e A
CH
Natural Exhaust Exhaust Supply 95 Supply 60 Supply 33
Laundry Mbath
Rm 100 100
Figure 41 Average air change rates for 2-story house with supply ventilation at 33 60 and 95 of ASHRAE 622 recommendations (Tests B4 B2 B3) compared to natural
infiltration (Test B14) and exhaust ventilation with no central fan operation (Test B1) Bedroom doors were closed except for the natural infiltration test
Bedroom Doors
The laundry room exhaust ventilation test with no air handler operation (see Figure 31) was repeated with the doors open to evaluate the change in room-to-room ventilation air distribution (Test B10) The decay curves are shown in Figure 42 and the reciprocal age-of air calculations are shown in Figure 43 It is evident from Figure 42 that the test began before the rooms were
43 of 49
Research Report - 0602
0
5
10
15
20
25
SF
6 C
on
ce
ntr
ati
on
(m
gm
3)
BR1 Living Kitchen BR2 BR3 MBR
Mixing stopped
Mixing restarted
completely well mixed resulting in decay curves that could be somewhat misleading Because the master bedroom was at a higher concentration than the other rooms at the start of the test any room that received air from the master bedroom would appear to have a slower decay rate than it would have if the rooms started out at the same concentration Despite the difference in starting concentration it is clear that outside air was well distributed when the doors were open even without operation of the air handler
1843 1912 1940 2009 2038 2107 2136 2204 2233 2302
Hour
Figure 42 Tracer gas decay for the 2-story house with exhaust ventilation from the laundry room at ASHRAE 622 level no central fan operation and bedroom doors open
(Test B10)
Reciprocal age-of-air analysis was not performed for this case because of the combined effect of a short test duration (~2 hours) and unequal starting tracer gas concentrations even though the house was relatively well-mixed The important conclusion (that opening doors greatly improves mixing) can be drawn by inspecting the decay curves alone
Transfer Grilles
A final exhaust ventilation test was run on the 2-story house with the doors closed and the transfer grilles taped over The decay curves are shown in Figure 43 and the reciprocal age-ofshyair calculations are shown in Figure 44 The curves were clearly very divergent even after 12 hours By examining the reciprocal age-of-air results it is apparent that the transfer grilles in the 2-story house caused a noticeable improvement in ventilation air distribution but the improvement was smaller than when the doors were opened (Figure 42)
44 of 49
Research Report - 0602
0
5
10
15
20
25
30
SF
6 C
on
cen
tra
tio
n (
mg
m3
) BR1 Living Kitchen BR2 BR3 MBR
Mixing stopped
Mixing restarted
1648 1912 2136 000 224 448 712 936
Hour
Figure 43 Tracer gas decay for 2-story house with exhaust ventilation from the laundry room at ASHRAE 622 level no central fan operation bedroom doors closed transfer
grilles taped closed (Test B7)
Exhaust Ventilation Transfer Grilles Untaped vs Taped
000
005
010
015
020
Re
cip
roc
al
Ag
e o
f A
ir (
1h
r)
BR1
Living
Kitchen
BR2
BR3
MBR
Exhaust in laundry room no Exhaust in laundry room no
mixing 100 ASHRAE mixing 100 ASHRAE
doors closed doors closed transfer
grilles taped
Figure 44 Reciprocal age-of-air for 2-story house with exhaust ventilation from the laundry room at ASHRAE 622 level no central fan operation and doors closed In the first case the transfer grilles are untaped (Test B3) in the second they are taped closed
(Test B7)
45 of 49
Research Report - 0602
CONCLUSIONS
bull Reciprocal age-of-air analysis was chosen as a quantitative method for characterizing distribution of ventilation air among rooms This method worked well in cases where rooms were well mixed to begin the test and weather conditions were sufficiently steady-state
bull A test period of at least 1frac12 air changes was necessary to obtain reasonably accurate ageshyof-air results when there was significant divergence in tracer gas concentration among the rooms
bull Although we did not achieve uniform initial concentration of tracer gas in the 2-story house using our test methodology and the equipment at hand we believe the reciprocal age-of-air calculations were meaningful in many of the cases as indicated in the discussion
bull Both houses were relatively tight with natural infiltration averaging 008 ACH for the 1shystory house and 011 ACH for the 2-story house
bull Both houses had relatively small (but not negligible) duct losses to the outside producing an increase in infiltration of less than 003 ACH for the 1-story house and 002 ACH for the 2-story house when the air handler runs
bull Age-of-air analysis indicated that ventilation supplied through the central air distribution system provided much more uniform distribution of ventilation air than the single-point exhaust system when the doors were closed and the air handler was not running For the 1-story house the central-fan-integrated supply ventilation case at 60 of ASHRAE 622 provided more outside air to all rooms than the least-ventilated room in the exhaust case at 100 of 622 For the 2-story house the central-fan-integrated supply system at 33 of the 622 flow rate provided more outside air to all rooms than the least ventilated rooms using exhaust ventilation at 100 of 622 from either the laundry or the master bathroom
bull Operation of the central fan at a 33 duty cycle maintained relatively well-mixed conditions regardless of ventilation rate type of ventilation system (supply or exhaust) or house configuration (1-story or 2-story)
bull Exhaust location affected both the relative amount of outside air received by different rooms and the overall uniformity among rooms but the effect was not predictable
bull For exhaust-only ventilation without central fan operation opening bedroom doors appeared to significantly improve the mixing of ventilation air among rooms
bull Transfer grilles improved the distribution of ventilation air slightly but much less than opening the bedroom doors
bull In the 2-story house the stack effect caused air movement from the first floor to the second floor even when exhaust ventilation was applied to the first floor resulting in consistently higher tracer gas concentrations on the second floor and more non-uniform ventilation air distribution in general
bull Interactions between natural infiltration and both exhaust and supply mechanical ventilation were very significant When the ventilation system was activated the combined air change rate did not increase commensurate with the measured ventilation rate but instead increased by only half that amount This result was consistent with combining ventilation and infiltration in quadrature to estimate whole-house air change rate in accordance with ASHRAE Standard 136 (ASHRAE 1993)
46 of 49
Research Report - 0602
FUTURE WORK
In future tests continuous monitoring of pressure differentials would enhance our understanding of the multi-zone combined infiltration and ventilation systems and our ability to model them That would help to explain differences between tests in more detail including the effects of multiple stories location of ventilation supply outlets and exhaust inlets interior door closure and use of passive return air transfer grilles Pressure differential measurement points should include
bull dP with respect to outside for each closed room and open space bull dP across closed interior doors bull dP between the floor cavity and outdoors and bull dP between the house and the attic
Measurement of wind direction along with wind speed could also be helpful for modeling these buildings and systems However because of micro-climate wind shielding it may be very difficult to relate a single-point wind direction measurement to actual wind vectors on the building surfaces
ACKNOWLEDGMENTS
The authors express their appreciation to Rich Coyle of DR Horton for providing the test houses and to Joseph Lstiburek of BSC Subrato Chandra and Neil Moyer of FSEC and Greg Barker of Mountain Energy Partnership for their assistance in the planning and execution of this ventilation study
47 of 49
Research Report - 0602
REFERENCES
ASHRAE (1993) ANSIASHRAE Standard 136-1993 A Method of Determining Air Change Rates in Detached Dwellings Atlanta GA American Society of Heating Refrigerating and Air-Conditioning Engineers Inc
ASHRAE (1997) ANSIASHRAE Standard 129-1997 Measuring Air-Change Effectiveness Atlanta GA American Society of Heating Refrigerating and Air-Conditioning Engineers Inc
ASHRAE (2004) ASHRAE Standard 622-2004 Ventilation and Acceptable Indoor Air Quality in Low-Rise Residential Buildings Atlanta GA American Society of Heating Refrigerating and Air-Conditioning Engineers Inc
CSA (2003) CANCSA F326-M91 Residential Mechanical Ventilation Systems Canadian Standards Association Ontario Canada httpwwwcsashyintlorgonlinestoreGetCatalogItemDetailsaspmat=2410793ampParent=102
NBC 2005 National Building Code of Canada httpircnrcshycnrcgccapubscodesnrcc47666_ehtml
Grieve PW (1991) Measuring Ventilation Using Tracer-Gases Denmark Bruumlel amp Kjaeligr
MN Chapter 7672 Minnesota Energy Code Chapter 7672 Detached Single-Family And Two-Family Dwellings httpwwwstatemnusmnexternalDocsCommerceChapter_7672_Residential_111302012428 _72rulepdf
Persily AK Martin SR (2000) A Modeling Study of Ventilation in Manufactured Houses Gaithersburg MD National Institute of Standards and Technology NISTIR 6455
Rudd A Lstiburek J (2000) ldquoMeasurement of Ventilation and Interzonal Distribution in Single-Family Homesrdquo ASHRAE Transactions 2000 MN-00-10-3 V 106 Pt2 American Society of Heating Refrigeration and Air-Conditioning Engineers Atlanta GA
WAC (2004) Washington State Title 51 WAC Community trade and economic development department of (building code council) Chapter 51-13 Ventilation and indoor air quality httpappslegwagovWACdefaultaspxcite=51-13
48 of 49
Research Report - 0602
Field test of room-to-room uniformity of ventilation air distribution in two new houses
About this Report
This report was prepared for the US Department of Energyrsquos Building America
Program The report is freely available to the public at wwwbuildingamericagov
The authors express their appreciation to Rich Coyle of DR Horton for providing the test houses and to Joseph Lstiburek of BSC Subrato Chandra and Neil Moyer of
FSEC and Greg Barker of Mountain Energy Partnership for their assistance in the planning and execution of this ventilation study
About the Authors
Robert Hendron Ren Anderson Dennis Barley are with National Renewable Energy Laboratory Armin Rudd and Aaron Townsend are with Building Science Corporation
Ed Hancock is with Mountain Energy Partnership
Direct all correspondence to Building Science Corporation 30 Forest Street Somerville MA 02143
Limits of Liability and Disclaimer of Warranty
Building Science documents are intended for professionals The author and the publisher of this article have used their best efforts to provide accurate and authoritative information in regard to the subject matter covered The author and publisher make no warranty of any kind expressed or implied with regard to the information contained in this article
The information presented in this article must be used with care by professionals who understand the implications of what they are doing If professional advice or other expert assistance is required the services of a competent professional shall be sought The author and publisher shall not be liable in the event of incidental or consequential damages in connection with or arising from the use of the information contained within this Building Science document
49 of 49

Research Report - 0602
0
2
4
6
8
10
12
14
Co
nc
en
tra
tio
n
mg
m3
Living
Entry
BR1
BR2
BR3
MBR
Mixing stopped
Mixing restarted
17 18 19 20 21 22 23 0 1 2 3 4 5 6
Hour
Figure 12 Tracer gas decay for 1-story house with exhaust ventilation from the laundry room at ASHRAE 622 level no central fan operation and bedroom doors closed (Test A3)
The corresponding decay curves for the central fan integrated supply system (Test A6) are shown in Figure 13 The air handler operated at a 33 duty cycle (20 min off 10 min on) with a ventilation rate of 174 cfm resulting in an average ventilation rate of 58 cfm again meeting the minimum ASHRAE 622 recommendations The whole house appeared to be well-mixed in this case because the decay curves were clustered together throughout the test Even during the 20 minute periods when the air handler was off there was very little divergence A comparison of Figure 12 to Figure 13 indicates that much more uniform distribution of ventilation air was achieved by using the CFIS system
19 of 49
Research Report - 0602
0
2
4
6
8
10
12
14
16
Co
nc
en
trati
on
(m
gm
3 )
Living
Entry
BR1
BR2
BR3
MBR
Mixing stopped
Mixing restarted
185 195 205 215 225 235 05 15 25 35 45 55 65
Hour
Figure 13 Tracer gas decay for 1-story house with supply ventilation at ASHRAE 622 level 33 central fan operation (20 min off 10 min on) and bedroom doors closed (Test
A6)
Reciprocal age-of-air calculations were performed to provide a quantitative comparison of the two ventilation systems as shown in Figure 14 Values were in the range of 0169 hr-1 +0042shy0038 hr-1 for the exhaust ventilation system compared to 0173 hr-1 +0002-0003 hr-1 for the supply ventilation system expressed in terms of the range of differences between the reciprocal age-of-air in each room and the whole-house air change rate With the exhaust ventilation at the laundry room the master bedroom received the greatest amount of fresh air We suspect this may have been caused by the presence of the exhaust ducts used for spot ventilation of the master bathroom possibly providing greater leakage area near the master bathroom than is present in other areas of the house The supply system distributed the ventilation air more uniformly but it is not entirely clear whether this result was primarily caused by the introduction of ventilation air through the supply ducts or by the air handler mixing air throughout the house Since it is clear that the exhaust ventilation showed better uniformity of ventilation with central system mixing it follows that mixing is likely to be the primary factor in the room-to-room uniformity shown by CFIS ventilation
It is also noteworthy that the average net air change rates provided by both the supply and exhaust ventilation systems were only about 018 ACH compared to the 025 ACH that would be expected if the mechanical ventilation rate (017 ACH) and the natural infiltration rate (008 ACH) were additive as they might be with a balanced ventilation system Adding mechanical ventilation to natural infiltration in quadrature results in an estimated average air change rate of 019 ACH which is fairly consistent with the measured values
20 of 49
Research Report - 0602
Recip
rocal
Ag
e o
f A
ir (
1h
r) 025
020
015
010
005
000
Simple Exhaust vs Central Fan Integrated
Supply
Centralized supply mixing
33 duty cycle 100
ASHRAE doors closed
Living
Entry
BR1
BR2
BR3
MBR
Exhaust in utility room no
mixing 100 ASHRAE
doors closed
Figure 14 Reciprocal age-of-air for 1-story house with continuous exhaust ventilation (Test A3) compared to central fan integrated supply ventilation (Test A6)
Air Handler Operation
To determine how much room-to-room mixing was caused by the air handler the exhaust only test was re-run with the air handler operating at 33 duty cycle (20 min off 10 min on) (Test A12) The decay curves are shown in Figure 15 Compared to Test A3 (Figure 12) there was a noticeable increase in uniformity when the air handler was operating even though the entry points for the ventilation air were uncontrolled As shown in Figure 16 the range of reciprocal age of air was reduced from +0042-0038 hr-1 to +0019-0011 hr-1) It appears that operation of the air handler explains most of the difference between the supply and exhaust ventilation systems discussed earlier Although it also appears that the overall average air change rate was higher in the case where the air handler was operating (0216 ACH vs 0176) it should be noted that the average wind speed was also significantly higher It is likely that the wind speed was the primary cause of the difference in average ACH not a difference in the mechanical ventilation rate
21 of 49
Research Report - 0602
0
5
10
15
20
25
30
35
Co
nce
ntr
ati
on
(m
gm
3 )
Living
Entry
BR1
BR2
BR3
MBR
Mixing stopped
Mixing restarted
0 1 2 3 4 5 6 7 8 9 10 11 12 13 14
Hour
Figure 15 Tracer gas decay for 1-story house with continuous exhaust ventilation at ASHRAE 622 level 33 central fan operation (20 min off 10 min on) and bedroom
doors closed (Test A12)
Exhaust Ventilation No Mixing vs 33 Air Handler Duty Cycle
000
005
010
015
020
025
Recip
rocal A
ge o
f A
ir (
1h
r)
Living
Entry
BR1
BR2
BR3
MBR
Exhaust in utility room 33 air handler
no mixing 100 operation exhaust in
ASHRAE doors closed utility room 100
ASHRAE doors closed
Figure 16 Reciprocal age-of-air for 1-story house with continuous exhaust ventilation with and without air handler operation (Tests A3 and A12)
22 of 49
Research Report - 0602
Exhaust Location
The preceding analysis of exhaust ventilation was based on an exhaust point in the laundry room which was relatively centrally located in the 1-story house To examine the effect of moving the exhaust point the duct blaster was moved to the master bathroom which was located in a far corner of the house (Test A16) A continuous exhaust ventilation rate of 58 cfm was again applied to the house resulting in the tracer gas decay curve shown in Figure 17 It is difficult to visually identify a significant difference between this series of curves and those shown in Figure 12 for the laundry room exhaust location
Because the curves were steady it is again possible to compare the results based on reciprocal age-of-air as shown in Figure 18 There appeared to be very little change in the distribution of outside air to most rooms However the reciprocal age-of-air in the master bedroom dropped noticeably when the exhaust location was moved to the master bathroom probably because a greater fraction of the outside air now passed through other rooms before reaching the master bedroom With the exhaust point centrally located most of the ventilation air passing through the master bedroom probably entered from the outside In both cases however the master bedroom had the highest reciprocal age-of-air of all of the rooms in the house and the BR2 location had the lowest
Co
nc
en
tra
tio
n (
mg
m3)
40
35
30
25
20
15
10
5
0
Living
Entry
BR1
BR2
BR3
MBR
Mixing stopped
Mixing restarted
19 20 21 22 23 0 1 2 3 4 5 6 7 8
Hour
Figure 17 Tracer gas decay for 1-story house with exhaust ventilation from the master bathroom at ASHRAE 622 level no central fan operation and bedroom doors closed (Test
A16)
23 of 49
Research Report - 0602
Exhaust Ventilation
Laundry Room vs Master Bathroom
000
005
010
015
020
025
Exhaust in laundry
room no mixing 100
ASHRAE doors closed
Exhaust in master
bathroom no mixing
100 ASHRAE doors
closed
Re
cip
roc
al A
ge
of
Air
(1
hr)
Living
Entry
BR1
BR2
BR3
MBR
Figure 18 Reciprocal age-of-air for 1-story house with exhaust ventilation from the master bathroom compared to the laundry room at ASHRAE 622 level no central fan operation
and bedroom doors closed (Tests A3 and A16)
Ventilation Rate
The supply ventilation test was repeated using flow rates corresponding to 60 and 33 of the ASHRAE recommendations The intent of this series of tests was to evaluate the room-to-room ventilation uniformity for ventilation rates consistent with ASHRAE 622 compared to the uniformity for reduced mechanical ventilation rates Each test was conducted for only 4 hours because of time limitations The decay curves are shown in Figures 19 and 20 Because the rooms were well-mixed during the supply ventilation tests the average whole-house ACH can be compared directly to the reciprocal age-of-air for the exhaust ventilation tests Figure 21 shows the supply ventilation air change rate for each of the three ventilation levels (33 60 100) compared to room-by-room reciprocal age-of-air for the exhaust ventilation system based on the boundary conditions present during the tests It appears that in the supply ventilation case all rooms receive more outside air than the least-ventilated room in the exhaust case (BR2) even at 60 of ASHRAE 622 These results serve to illustrate the trade-off between whole-house ventilation rate and room-to-room ventilation uniformity in terms of their impact on the worst room(s)
24 of 49
Research Report - 0602
The ASHRAE 622 committee has not currently defined the level of mixing that is required when choosing the minimum ventilation rate Some might interpret the results of this test to suggest that a house without mixing can have individual rooms that do not receive sufficient outside air even though the ventilation system is operating at 622 specified rates Because the 622 committee has not specified the level of mixing that is required when choosing the minimum ventilation rate the ventilation rate required by different ventilation systems is open to interpretation For example if the exhaust system performance shown in Figure 21 is acceptable does this mean that a ventilation system that provides good distribution of outside air may be sufficiently well-ventilated at 60 of the ASHRAE 622 level or perhaps even less Alternatively it might be concluded that exhaust ventilation rates should be increased over current ASHRAE 622 recommendations because of the possibility that certain rooms may receive very little fresh air Unfortunately because the current 622 standard does not specify air mixing requirements and the committeersquos assumptions about ventilation air distribution are not well documented it is difficult to make any firm recommendations in this area However we can conclude that air mixing is required for dilution ventilation systems to provide predictable results independent of the geometry of individual homes
8 9 10 11 12 13 14
Hour
Figure 19 Tracer gas decay for 1-story house with supply ventilation at 60 of ASHRAE 622 level 33 central fan operation (20 min off 10 min on) and bedroom doors closed
(Test A4)
0
10
20
30
40
50
60
Co
nce
ntr
ati
on
m
gm
3
Living
Entry
BR1
BR2
BR3
MBR
Mixing stopped
Mixing restarted
25 of 49
Research Report - 0602
0
5
10
15
20
25
30
Co
nce
ntr
ati
on
(m
gm
3 )
Living
Entry
BR1
BR2
BR3
MBR
Mixing stopped
Mixing restarted
12 13 14 15 16 17 18 19 20
Hour
Figure 20 Tracer gas decay for 1-story house with supply ventilation at 33 of ASHRAE 622 level 33 central fan operation (20 min off 10 min on) and bedroom doors closed
(Test A5)
Simple Exhaust vs Central Fan Integrated
Supply with Lower Ventilation Rates
025
Re
cip
roc
al A
ge
of
Air
(1
hr)
Well Mixed
100
ASHRAE 60
ASHRAE 33
ASHRAE Living Entry 010 Natural
BR1 Infilt
BR2 BR3 005
MBR
Exhaust in laundry room no
000
Central supply Natural infil-
mixing 100 ASHRAE doors mixing 33 duty tration doors
closed cycle doors closed open
Figure 21 Reciprocal age-of-air for 1-story house with supply ventilation at 33 60 and 100 of ASHRAE 622 level (Tests A5 A4 A6) compared to exhaust ventilation with
no central fan operation (Test A3) Bedroom doors were closed
020
015
26 of 49
Research Report - 0602
Simulations by Walker (2006) have shown that all systems will not provide the same service in terms of annual average air change rate For the same air flow rate and duty cycle balanced ventilation will yield a higher average air exchange than supply ventilation and supply ventilation will yield a higher average air exchange than exhaust ventilation That can be explained in general terms by understanding that wind and stack effects act to depressurize a building most of the time Exhaust fans increase the building depressurization further but supply fans decrease the depressurization Balanced fans donrsquot change the enclosure differential pressure and air flow at all Because of the non-linear relationship between differential pressure and air flows across the building enclosure a supply fan changes the pressures across the enclosure less than an exhaust fan acting more like a balanced fan The result is that the effect on ventilation air change rate from a supply fan is somewhere between that of an exhaust fan and a true balanced system
Bedroom Doors
Except for the natural ventilation test the preceding tests were all conducted with the bedroom doors closed to simulate a worst-case situation for air circulation within the house The exhaust ventilation test was repeated with the bedroom doors open (Test A9) producing the tracer gas decay curve shown in Figure 22 It is evident that the decay curves were much more tightly bundled with the doors open than they were with the doors closed (compare Figure 12) A comparison based on reciprocal age-of-air is shown in Figure 23 A significant improvement in room-to-room mixing is evident during the open-door test
It is also evident that the average air change rate was higher when the doors were open (0202 vs 0176 ACH) but it must be remembered that the ventilation rate was controlled using a duct blaster and average wind speed was higher during the open-door test period compared to the closed-door test period (20 mph compared to 06 mph) Therefore this test alone does not necessarily indicate that closing doors reduces the average air change rate associated with an exhaust system In future tests continuous measurement of the depressurization of the house with respect to outside along with single-point pressure measurements across interior doors would provide more information about the effect of closing doors when exhaust ventilation systems are used It would also be valuable to conduct this test during steady weather conditions using the exhaust fan (with uncontrolled ventilation rate) instead of the duct blaster to observe the net effect of closed doors on whole-house air change rate
27 of 49
Research Report - 0602
0
5
10
15
20
25
30
Co
ncen
trati
on
(m
gm
3 )
Living
Entry
BR1
BR2
BR3
MBR
Mixing stopped
Mixing restarted
181 191 201 211 221 231 01 11 21 31 41 51 61 71
Hour
Figure 22 Tracer gas decay for 1-story house with exhaust ventilation from the laundry room at ASHRAE 622 level no central fan operation and bedroom doors open (Test A9)
Exhaust Ventilation
Doors Closed vs Doors Open
000
005
010
015
020
025
Re
cip
roc
al
Ag
e o
f A
ir (
1h
r)
Living
Entry
BR1
BR2
BR3
MBR
Exhaust in laundry room Doors open no mixing
no mixing 100 exhaust in laundry room
ASHRAE doors closed 100 ASHRAE
Figure 23 Reciprocal age-of-air for 1-story house with exhaust ventilation from the laundry room at ASHRAE 622 level no central fan operation In the first case the bedroom doors were closed (Test A3) in the second the doors were open (Test A9)
28 of 49
Research Report - 0602
Transfer Grilles
Because the test houses used central returns instead of hard ducted returns in the bedrooms transfer grilles were installed over the bedroom doors to provide a flow path for return air without excessive room pressurization when the doors were closed These transfer grilles also allowed ventilation air to pass more freely from the bedrooms to the main living space The effect of transfer grilles on ventilation air distribution was evaluated by taping over the grilles (see Figure 24) and re-running the exhaust ventilation test (Test A10) The corresponding tracer gas decay curve is shown in Figure 25 and the reciprocal age-of-air analysis is shown in Figure 26 Taping the transfer grilles did not appear to significantly affect the room-to-room variability in ventilation rate although there appeared to be some slight re-ranking of rooms from highest to lowest reciprocal age-of-air It should be noted that there was an increase in average wind speed from 26 mph to 41 mph starting at 1 pm including a half hour period where the average wind speed was 7 mph This weather effect produced noticeable kinks in the decay curves and therefore would be expected to introduce significant errors into the reciprocal age-of-air results
Itrsquos possible that the transfer grilles played a much smaller role in providing a path for ventilation air than the supply ducts Because the air handler was not operating the ducts were not pressurized and were thus available as passive airflow conduits The resistance to air flow was probably smaller for the air ducts than for the transfer grilles depending on their size and the number of supply registers in each bedroom The existing door undercuts are also thought to have played a role The effect of ducts and door undercuts can be tested in the future by running separate tests with ducts and door undercuts taped over
copy buildingsciencecom
Figure 24 Transfer grilles over bedroom doors taped closed
29 of 49
Research Report - 0602
0
10
20
30
40
50
60
70
Co
nc
en
tra
tio
n (
mg
m3 )
Living
Entry
BR1
BR2
BR3
MBR
Mixing stopped
Mixing restarted
8 9 10 11 12 13 14 15 16 17
Hour
Figure 25 Tracer gas decay for 1-story house with exhaust ventilation from the laundry room at ASHRAE 622 level no central fan operation bedroom doors closed and transfer
grilles taped (Test A10)
Exhaust Ventilation
000
005
010
015
020
025
Re
cip
roc
al
Ag
e o
f A
ir (
1h
r)
Living
Entry
BR1
BR2
BR3
MBR
Transfer Grilles Untaped vs Taped
Exhaust in laundry room no Exhaust in laundry room no
mixing 100 ASHRAE mixing 100 ASHRAE
doors closed doors closed transfer
grilles taped
Figure 26 Reciprocal age-of-air for 1-story house with exhaust ventilation from the laundry room at ASHRAE 622 level no central fan operation and doors closed In the
30 of 49
Research Report - 0602
first case the transfer grilles are untaped (Test A3) in the second they are taped closed (Test A10)
Minimum Test Duration
We were fortunate that DR Horton provided two full weeks of access to these homes to conduct this series of tests which allowed us to run some of the more important tracer gas decay tests as long as 12 hours to help ensure that we could accurately calculate reciprocal age-of-air In most cases test houses would not be available for such a long time period To evaluate the length of time needed to estimate the reciprocal age-of-air with reasonable accuracy we examined the results that we would have obtained for one of the exhaust ventilation tests had we halted the test period after less than 12 hours For the supply ventilation tests the rooms were sufficiently well-mixed that the test could have been stopped after 3 or 4 hours assuming weather effects were steady
The reciprocal age-of-air calculations for the exhaust ventilation decay curves (Test A3 see Figure 12) based on test durations of 3 6 9 and 12 hours are shown in Figure 27 These test durations range from 053 to 21 air changes based on the average air change rate of 018 ACH (56 hours per air change) calculated for this test The ratio of highest to lowest reciprocal ageshyof-air is shown above the data points for each case These results suggest that shorter tests tend to overestimate the range and that perhaps 1frac12-2 air changes (roughly 9 to 12 hours in this case) may be necessary to obtain accurate calculations of reciprocal age-of-air when there is significant divergence among rooms From a qualitative standpoint one air change may be sufficient to determine the basic trend Without knowing in advance what mixing pattern will occur it is difficult to recommend a minimum test duration But assuming this test is fairly representative of a worst-case scenario a minimum of 15 air changes would be necessary to have a high degree of confidence in the quantitative difference in reciprocal age-of-air among rooms
31 of 49
Research Report - 0602
000
005
010
015
020
025
030
035
Re
cip
roc
al
Ag
e-O
f-A
ir (
hr-1
)
Living
Entry
BR1
BR2
BR3
MBR HighLow = 297
HighLow = 168 HighLow = 184 HighLow = 161
3-hour Test 6-hour Test 9-hour Test 12-hour Test
(053 Air Changes) (11 Air Changes) (16 Air Changes) (21 Air Changes)
Test Duration
Figure 27 Reciprocal age-of-air based on alternate test durations for 1-story house with exhaust ventilation from the laundry room at ASHRAE 622 level no central fan operation
and doors closed (Test A3) Average air change rate was 018 ACH
TEST RESULTS FROM 2-STORY HOUSE (1117 MONTAGUE)
The 2-story house was tested from January 3-10 2006 Three zones were selected on the first floor and three more were selected on the second floor as indicated by the red stars in Figure 4 The initial mixing of air among the rooms at the start of each test in this 2-story house was not as thorough as it was in the 1-story house Evidently the combined effects of the air handler and the portable de-stratification fan were not sufficient to overcome upward transport of tracer gas driven by the stack effect from the first to the second floor The resulting difference in initial tracer gas concentration among the rooms was about 5-10 This outcome emphasizes the significant effect of stack-driven infiltration on ventilation non-uniformity in multi-story homes Because our test method and equipment did not achieve a well-mixed condition at the start of each test there were some errors introduced into the reciprocal age-of-air analysis For future tests we would recommend larger de-stratification fans to obtain more well-mixed conditions in multi-story houses
Typical errors introduced by incomplete mixing of the tracer gas at the start of such a test were analyzed by examining two hypothetical cases where either all of the air entering a room comes from the outside or all of the air comes from an adjacent room with a different starting concentration If all of the air entering a space comes from the outside then a change in the initial concentration would have no effect on the reciprocal age-of-air because the decay curve would be exponential from the start and the area under the curve would be normalized based on
32 of 49
Research Report - 0602
the starting concentration in that zone However if the air entering a room passes through another room with a lower initial concentration the room receiving the air will have a lower concentration of tracer gas throughout the test compared to what the concentration would have been if the starting points were the same in both rooms This case is illustrated in Figure 28 where assumptions are made that the rooms are the same size the air exchange rate is 01 ACH for both rooms and the initial tracer gas concentration is 10 lower in the first room (upstream) than it is in the second room
The effect on reciprocal age-of-air is shown in Figure 29 A 10 difference in starting concentration results in an error of about 75 in reciprocal age-of-air for a room downstream of a room with a lower starting concentration assuming 01 ACH for both rooms The error would be somewhat smaller (about 5) if the air change rate was higher for both rooms (02 ACH) There would be no error introduced for rooms where all of the air infiltration comes from the outside Although the amount of error in the reciprocal age-of-air calculations can be affected by additional variables not examined here we feel that these percentages are reasonable estimates of the errors in our results for the 2-story house due to incomplete initial mixing of air
In each case an engineering judgment must be made regarding the significance of the error introduced by incomplete initial mixing As a general rule the differences in concentration at the start of the test should be small compared to the differences that are being measured in order for the results to be considered valid
Figure 28 Theoretical decay curves for a well-mixed case with uniform tracer gas concentration compared to a case where the upstream room starts with a concentration
10 lower than the downstream room
33 of 49
Research Report - 0602
Figure 29 Theoretical reciprocal age-of-air for a well-mixed case with uniform tracer gas concentration compared to a case where the upstream room starts with a concentration
10 lower than the downstream room
Natural Infiltration and Duct Leakage
A natural infiltration test was performed over a two hour period on the evening of January 8 (Test B14) The tracer gas decay curves are shown in Figure 30 There was a slight divergence between the first floor and second floor once the air handler was turned off but the rooms on each floor appeared to remain fairly well-mixed The average air change rate during the test period was about 011 ACH which was somewhat higher than the 1-story house as might be expected with an increased stack height
An air handler bedroom door bump test was conducted just prior to the test period shown in Figure 30 allowing observation of the combined effect of duct leakage to the outside and increased infiltration caused by room pressurization The average air change rate during that bump test was 013 ACH suggesting that closing doors and operating the fan added approximately 002 ACH to the whole-house average air change rate The average wind speed was a bit higher while the air handler was running (17 mph compared to 05 mph) so the effect of air handler operation may actually be somewhat less than the average ACH numbers indicate
34 of 49
Research Report - 0602
0
1
2
3
4
SF
6 C
on
ce
ntr
ati
on
(m
gm
3)
BR1
Living
Kitchen
BR2
BR3
MBR
Mixing stopped
Mixing restarted
1814 1843 1912 1940 2009 2038 2107 2136
Hour
Figure 30 Tracer gas decay for 2-story house with no ventilation no central fan operation and bedroom doors open (Test B14)
Distributed Supply vs Point Exhaust Ventilation
A 14-hour test (Test B1) was performed with an exhaust ventilation rate of 63 cfm in the laundry room which was located near the stairwell in the middle of the first floor The ventilation rate was again consistent with the ASHRAE 622 recommendations The tracer gas decay curves are shown in Figure 31 It is interesting that all three second floor rooms showed a delay before entering an exponential decay suggesting that some amount of air was moving from the first floor to the second floor even though the mechanical exhaust point was on the first floor It appears that the further depressurization of the first floor was insufficient to overcome the stack effect and draw a significant amount of outside air in through the rooms on the second floor
35 of 49
Research Report - 0602
182
9
192
9
202
9
212
9
222
9
232
9
029
129
229
329
429
529
629
729
828
929
102
8
112
8
122
8
0
10
20
30
40
50
60
70
SF
6 C
on
ce
ntr
ati
on
(m
gm
3)
BR1
Living
Kitchen
BR2
BR3
MBR
Mixing stopped
Mixing restarted
Hour
Figure 31 Tracer gas decay for 2-story house with exhaust ventilation from the laundry room at ASHRAE 622 level no central fan operation and bedroom doors closed (Test B1)
A supply ventilation test was performed on the 2-story house for about 11 hours starting late on January 4 (Test B3) The duct blaster was unable to provide the ventilation rate necessary to meet the minimum specified in ASHRAE 622 supplying 180 cfm instead of 189 cfm (95) The decay curves are shown in Figure 32 Although the curves are much more tightly packed than they were with the exhaust system there is more divergence than we saw with the supply system in the 1-story house most notably in the master bedroom
The reciprocal age-of-air calculations for both the exhaust and supply ventilation systems are shown in Figure 33 Again the results indicate that much better room-to-room distribution of ventilation air was achieved by the central-fan integrated supply system compared to the single-point exhaust system However for the supply ventilation test the differences in the initial tracer gas concentration were of the same magnitude as the differences in decay rates among the rooms As a result no conclusions should be drawn about the relative ranking of the supply ventilation rate among rooms based on Figure 33
36 of 49
Research Report - 0602
0
10
20
30
40
50
60
SF
6 C
on
ce
ntr
ati
on
(m
gm
3)
BR1
Living
Kitchen
BR2
BR3
MBR
Mixing stopped
Mixing restarted
2136 000 224 448 712 936 1200
Hour
Figure 32 Tracer gas decay for 2-story house with supply ventilation just under ASHRAE 622 level central fan operation at 33 duty cycle (20 min off 10 min on) and bedroom
doors closed (Test B3)
Simple Exhaust vs Central Fan Integrated
Supply )
000
005
010
015
020
025
Recip
rocal A
ge o
f A
ir (
1h
r
BR1
Living
Kitchen
BR2
BR3
MBR
Exhaust in laundry room no Centralized supply mixing
mixing 100 ASHRAE 33 duty cycle 95
doors closed ASHRAE doors closed
Figure 33 Reciprocal age-of-air for 2-story house with continuous exhaust ventilation (Test B1) compared to central fan integrated supply ventilation (Test B3) (Note
Uncertainties introduced by non-uniform starting concentration are of the same order of magnitude as the differences in reciprocal age-of-air among rooms for the supply ventilation case The relative ranking of rooms is not meaningful for that case)
37 of 49
Research Report - 0602
Air Handler Operation
The effect of occasional air handler operation on the distribution of exhaust ventilation air was evaluated on the afternoon of January 6 (Test B6) The tracer gas decay curves are shown in Figure 34 and reciprocal age-of-air calculations are shown in Figure 35 It should again be noted that before the test started the house was mixed using both the air handler and a de-stratification fan with the doors open During the test the doors were closed the de-stratification fan was turned off and the air handler operated at a 33 duty cycle (20 minutes off 10 minutes on) As was the case in the 1-story house this occasional operation of the air handler substantially improved the distribution of ventilation air among rooms even in conjunction with the point exhaust ventilation system There was very little divergence noticeable even with the air handler cycling on and off every half hour However because the initial differences in tracer gas concentration among rooms were as large as the differences in reciprocal age-of-air for the case with air handler operation no conclusions should be drawn about the relative ranking of ventilation rates among the rooms for that case
SF
6 C
on
cen
trati
on
(m
gm
3)
80
70
60
50
40
30
20
10
0
BR1
Living
Kitchen
BR2
BR3
MBR
Mixing stopped
Mixing restarted
1048 1200 1312 1424 1536 1648 1800 1912 2024
Hour
Figure 34 Tracer gas decay for 2-story house with continuous exhaust ventilation at ASHRAE 622 level central fan operation at 33 duty cycle (20 min off 10 min on) and
bedroom doors closed (Test B6)
38 of 49
Research Report - 0602
020
015 R
ec
ipro
ca
l A
ge
of
Air
(1
hr)
Exhaust Ventilation
No Mixing vs 33 Air Handler Duty Cycle
Exhaust in laundry room
no mixing 100
ASHRAE doors closed
33 air handler
operation exhaust in
laundry room 100
ASHRAE doors closed
BR1
Living
Kitchen
BR2
BR3
MBR
010
005
000
Figure 35 Reciprocal age-of-air for 2-story house with continuous exhaust ventilation with and without air handler operation (Tests B1 and B6) (Note Uncertainties introduced by non-uniform starting concentration are of the same order of magnitude as the differences in reciprocal age-of-air among rooms for the case with air handler operation The relative
ranking of rooms is not meaningful for that case)
Exhaust Location
The duct blaster was moved to the master bathroom exhaust register to see if there was a resulting change in ventilation air distribution (Test B18) The master bathroom was in the back of the house on the second floor between the master bedroom and bedroom 3 The decay curves are shown in Figure 36 and the reciprocal age-of-air results are shown in Figure 37 The rooms on each floor were well mixed before the test began although the mixing between the two floors was not as good Very wide divergence among rooms can be seen during the test especially between the upstairs bedrooms and the rest of the house Once again all three upstairs rooms appear to receive some air from the first floor but the master bedroom experiences a much higher volume of circulated air than the other two second-floor bedrooms which appear to be relatively stagnant
39 of 49
Research Report - 0602
0
10
20
30
40
50
60
70
80
90
SF
6 C
on
ce
ntr
ati
on
(m
gm
3)
BR1
Living
Kitchen
BR2
BR3
MBR
Mixing stopped
Mixing restarted
1912 2136 000 224 448 712 936 1200
Hour
Figure 36 Tracer gas decay for 2-story house with exhaust ventilation from the master bathroom at ASHRAE 622 level no central fan operation and bedroom doors closed (Test
B18)
Exhaust Ventilation
Laundry Room vs Master Bathroom
000
005
010
015
020
025
030
Exhaust in laundry room no
mixing 100 ASHRAE
doors closed
Exhaust in master bathroom
no mixing 100 ASHRAE
doors closed
Re
cip
roc
al A
ge
of
Air
(1
hr)
BR1
Living
Kitchen
BR2
BR3
MBR
Figure 37 Reciprocal age-of-air for 2-story house with exhaust ventilation from the master bathroom compared to the laundry room at ASHRAE 622 level no central fan operation
and bedroom doors closed (Tests B1 and B18)
40 of 49
Research Report - 0602
Ventilation Rate
The supply ventilation tests were repeated using flow rates of 60 and 33 of ASHRAE 622 recommendations corresponding to 114 cfm and 63 cfm respectively (Tests B2 and B4) The decay curves are shown in Figures 38 and 39 Reciprocal age-of-air for all three supply ventilation rates are shown in Figure 40 In all cases the rooms remained fairly well mixed especially rooms on the same floor As we observed in the 1-story house the ventilation rate in the 2-story house appeared to have very little effect on the uniformity of outside air provided to each room as long as it was mixed using the air handler One again the initial differences in tracer gas concentration among rooms were as large as the divergence in the decay curves preventing any conclusions about the relative ranking of ventilation rates among rooms for all three cases The error in initial concentration uniformity was bigger for the cases with air handler mixing because the relative divergence in the decay curves was so small compared to that of no air handler mixing In other words the error in relative ranking of ventilation rates for the cases with air handler mixing were not very important anyway because the relative differences between rooms were so small
1536 1648 1800 1912 2024 2136 2248
Hour
Figure 38 Tracer gas decay for 2-story house with supply ventilation at 60 of ASHRAE 622 level 33 central fan operation (20 min off 10 min on) and bedroom doors closed
(Test B2)
0
5
10
15
20
25
30
SF
6 C
on
cen
trati
on
(m
gm
3)
BR1 Living Kitchen BR2 BR3 MBR
Mixing stopped
Mixing restarted
41 of 49
Research Report - 0602
0
5
10
15
20
25
30
35
40
SF
6 C
on
cen
trati
on
(m
gm
3)
BR1
Living
Kitchen
BR2
BR3
MBR
Mixing stopped
Mixing restarted
1200 1312 1424 1536 1648 1800 1912
Hour
Figure 39 Tracer gas decay for 2-story house with supply ventilation at 33 of ASHRAE 622 level 33 central fan operation (20 min off 10 min on) and bedroom doors closed
(Test B4)
Supply Ventilation Rate Comparison
000
005
010
015
020
025
Re
cip
roc
al
Ag
e o
f A
ir (
1h
r)
BR1
Living
Kitchen
BR2
BR3
MBR
Centralized supply Centralized supply Centralized supply
mixing 33 duty mixing 33 duty mixing 33 duty
cycle 95 ASHRAE cycle 60 ASHRAE cycle 33 ASHRAE
doors closed doors closed doors closed
Figure 40 Reciprocal age-of-air for 2-story house with three levels of supply ventilation central fan operation at 33 duty cycle (20 min off 10 min on) and bedroom doors closed (Tests B3 B2 B4) (Note Uncertainties introduced by non-uniform starting
concentration are of the same order of magnitude as the differences in reciprocal age-of-air among rooms for all three cases The relative ranking of rooms is not meaningful for these
cases)
42 of 49
Research Report - 0602
The average air change rates for the three supply ventilation rates compared to the two exhaust ventilation schemes are shown in Figure 41 The CFIS system at 33 of the 622 ventilation flow rate provided a uniformly higher air change rate (013 ach) than the least ventilated rooms using exhaust ventilation from either the laundry or the master bathroom (010 ach Figure 37) It is noteworthy that the combined net air change rate with exhaust ventilation from the laundry room was significantly less than the air change rates for both exhaust ventilation from the master bathroom and supply ventilation at the air handler This illustrates the unpredictability of interactions between mechanical ventilation and natural infiltration which depend strongly on the distribution and size of cracks through which the outside air must pass to enter the house There may have been a relatively large building enclosure leakage opening near the laundry room (perhaps the utility penetrations or the door to the garage) that allowed a significant amount of outside air to quickly enter and leave the house through the exhaust flow without circulating around the house
0
005
01
015
02
025
Ave
rag
e A
CH
Natural Exhaust Exhaust Supply 95 Supply 60 Supply 33
Laundry Mbath
Rm 100 100
Figure 41 Average air change rates for 2-story house with supply ventilation at 33 60 and 95 of ASHRAE 622 recommendations (Tests B4 B2 B3) compared to natural
infiltration (Test B14) and exhaust ventilation with no central fan operation (Test B1) Bedroom doors were closed except for the natural infiltration test
Bedroom Doors
The laundry room exhaust ventilation test with no air handler operation (see Figure 31) was repeated with the doors open to evaluate the change in room-to-room ventilation air distribution (Test B10) The decay curves are shown in Figure 42 and the reciprocal age-of air calculations are shown in Figure 43 It is evident from Figure 42 that the test began before the rooms were
43 of 49
Research Report - 0602
0
5
10
15
20
25
SF
6 C
on
ce
ntr
ati
on
(m
gm
3)
BR1 Living Kitchen BR2 BR3 MBR
Mixing stopped
Mixing restarted
completely well mixed resulting in decay curves that could be somewhat misleading Because the master bedroom was at a higher concentration than the other rooms at the start of the test any room that received air from the master bedroom would appear to have a slower decay rate than it would have if the rooms started out at the same concentration Despite the difference in starting concentration it is clear that outside air was well distributed when the doors were open even without operation of the air handler
1843 1912 1940 2009 2038 2107 2136 2204 2233 2302
Hour
Figure 42 Tracer gas decay for the 2-story house with exhaust ventilation from the laundry room at ASHRAE 622 level no central fan operation and bedroom doors open
(Test B10)
Reciprocal age-of-air analysis was not performed for this case because of the combined effect of a short test duration (~2 hours) and unequal starting tracer gas concentrations even though the house was relatively well-mixed The important conclusion (that opening doors greatly improves mixing) can be drawn by inspecting the decay curves alone
Transfer Grilles
A final exhaust ventilation test was run on the 2-story house with the doors closed and the transfer grilles taped over The decay curves are shown in Figure 43 and the reciprocal age-ofshyair calculations are shown in Figure 44 The curves were clearly very divergent even after 12 hours By examining the reciprocal age-of-air results it is apparent that the transfer grilles in the 2-story house caused a noticeable improvement in ventilation air distribution but the improvement was smaller than when the doors were opened (Figure 42)
44 of 49
Research Report - 0602
0
5
10
15
20
25
30
SF
6 C
on
cen
tra
tio
n (
mg
m3
) BR1 Living Kitchen BR2 BR3 MBR
Mixing stopped
Mixing restarted
1648 1912 2136 000 224 448 712 936
Hour
Figure 43 Tracer gas decay for 2-story house with exhaust ventilation from the laundry room at ASHRAE 622 level no central fan operation bedroom doors closed transfer
grilles taped closed (Test B7)
Exhaust Ventilation Transfer Grilles Untaped vs Taped
000
005
010
015
020
Re
cip
roc
al
Ag
e o
f A
ir (
1h
r)
BR1
Living
Kitchen
BR2
BR3
MBR
Exhaust in laundry room no Exhaust in laundry room no
mixing 100 ASHRAE mixing 100 ASHRAE
doors closed doors closed transfer
grilles taped
Figure 44 Reciprocal age-of-air for 2-story house with exhaust ventilation from the laundry room at ASHRAE 622 level no central fan operation and doors closed In the first case the transfer grilles are untaped (Test B3) in the second they are taped closed
(Test B7)
45 of 49
Research Report - 0602
CONCLUSIONS
bull Reciprocal age-of-air analysis was chosen as a quantitative method for characterizing distribution of ventilation air among rooms This method worked well in cases where rooms were well mixed to begin the test and weather conditions were sufficiently steady-state
bull A test period of at least 1frac12 air changes was necessary to obtain reasonably accurate ageshyof-air results when there was significant divergence in tracer gas concentration among the rooms
bull Although we did not achieve uniform initial concentration of tracer gas in the 2-story house using our test methodology and the equipment at hand we believe the reciprocal age-of-air calculations were meaningful in many of the cases as indicated in the discussion
bull Both houses were relatively tight with natural infiltration averaging 008 ACH for the 1shystory house and 011 ACH for the 2-story house
bull Both houses had relatively small (but not negligible) duct losses to the outside producing an increase in infiltration of less than 003 ACH for the 1-story house and 002 ACH for the 2-story house when the air handler runs
bull Age-of-air analysis indicated that ventilation supplied through the central air distribution system provided much more uniform distribution of ventilation air than the single-point exhaust system when the doors were closed and the air handler was not running For the 1-story house the central-fan-integrated supply ventilation case at 60 of ASHRAE 622 provided more outside air to all rooms than the least-ventilated room in the exhaust case at 100 of 622 For the 2-story house the central-fan-integrated supply system at 33 of the 622 flow rate provided more outside air to all rooms than the least ventilated rooms using exhaust ventilation at 100 of 622 from either the laundry or the master bathroom
bull Operation of the central fan at a 33 duty cycle maintained relatively well-mixed conditions regardless of ventilation rate type of ventilation system (supply or exhaust) or house configuration (1-story or 2-story)
bull Exhaust location affected both the relative amount of outside air received by different rooms and the overall uniformity among rooms but the effect was not predictable
bull For exhaust-only ventilation without central fan operation opening bedroom doors appeared to significantly improve the mixing of ventilation air among rooms
bull Transfer grilles improved the distribution of ventilation air slightly but much less than opening the bedroom doors
bull In the 2-story house the stack effect caused air movement from the first floor to the second floor even when exhaust ventilation was applied to the first floor resulting in consistently higher tracer gas concentrations on the second floor and more non-uniform ventilation air distribution in general
bull Interactions between natural infiltration and both exhaust and supply mechanical ventilation were very significant When the ventilation system was activated the combined air change rate did not increase commensurate with the measured ventilation rate but instead increased by only half that amount This result was consistent with combining ventilation and infiltration in quadrature to estimate whole-house air change rate in accordance with ASHRAE Standard 136 (ASHRAE 1993)
46 of 49
Research Report - 0602
FUTURE WORK
In future tests continuous monitoring of pressure differentials would enhance our understanding of the multi-zone combined infiltration and ventilation systems and our ability to model them That would help to explain differences between tests in more detail including the effects of multiple stories location of ventilation supply outlets and exhaust inlets interior door closure and use of passive return air transfer grilles Pressure differential measurement points should include
bull dP with respect to outside for each closed room and open space bull dP across closed interior doors bull dP between the floor cavity and outdoors and bull dP between the house and the attic
Measurement of wind direction along with wind speed could also be helpful for modeling these buildings and systems However because of micro-climate wind shielding it may be very difficult to relate a single-point wind direction measurement to actual wind vectors on the building surfaces
ACKNOWLEDGMENTS
The authors express their appreciation to Rich Coyle of DR Horton for providing the test houses and to Joseph Lstiburek of BSC Subrato Chandra and Neil Moyer of FSEC and Greg Barker of Mountain Energy Partnership for their assistance in the planning and execution of this ventilation study
47 of 49
Research Report - 0602
REFERENCES
ASHRAE (1993) ANSIASHRAE Standard 136-1993 A Method of Determining Air Change Rates in Detached Dwellings Atlanta GA American Society of Heating Refrigerating and Air-Conditioning Engineers Inc
ASHRAE (1997) ANSIASHRAE Standard 129-1997 Measuring Air-Change Effectiveness Atlanta GA American Society of Heating Refrigerating and Air-Conditioning Engineers Inc
ASHRAE (2004) ASHRAE Standard 622-2004 Ventilation and Acceptable Indoor Air Quality in Low-Rise Residential Buildings Atlanta GA American Society of Heating Refrigerating and Air-Conditioning Engineers Inc
CSA (2003) CANCSA F326-M91 Residential Mechanical Ventilation Systems Canadian Standards Association Ontario Canada httpwwwcsashyintlorgonlinestoreGetCatalogItemDetailsaspmat=2410793ampParent=102
NBC 2005 National Building Code of Canada httpircnrcshycnrcgccapubscodesnrcc47666_ehtml
Grieve PW (1991) Measuring Ventilation Using Tracer-Gases Denmark Bruumlel amp Kjaeligr
MN Chapter 7672 Minnesota Energy Code Chapter 7672 Detached Single-Family And Two-Family Dwellings httpwwwstatemnusmnexternalDocsCommerceChapter_7672_Residential_111302012428 _72rulepdf
Persily AK Martin SR (2000) A Modeling Study of Ventilation in Manufactured Houses Gaithersburg MD National Institute of Standards and Technology NISTIR 6455
Rudd A Lstiburek J (2000) ldquoMeasurement of Ventilation and Interzonal Distribution in Single-Family Homesrdquo ASHRAE Transactions 2000 MN-00-10-3 V 106 Pt2 American Society of Heating Refrigeration and Air-Conditioning Engineers Atlanta GA
WAC (2004) Washington State Title 51 WAC Community trade and economic development department of (building code council) Chapter 51-13 Ventilation and indoor air quality httpappslegwagovWACdefaultaspxcite=51-13
48 of 49
Research Report - 0602
Field test of room-to-room uniformity of ventilation air distribution in two new houses
About this Report
This report was prepared for the US Department of Energyrsquos Building America
Program The report is freely available to the public at wwwbuildingamericagov
The authors express their appreciation to Rich Coyle of DR Horton for providing the test houses and to Joseph Lstiburek of BSC Subrato Chandra and Neil Moyer of
FSEC and Greg Barker of Mountain Energy Partnership for their assistance in the planning and execution of this ventilation study
About the Authors
Robert Hendron Ren Anderson Dennis Barley are with National Renewable Energy Laboratory Armin Rudd and Aaron Townsend are with Building Science Corporation
Ed Hancock is with Mountain Energy Partnership
Direct all correspondence to Building Science Corporation 30 Forest Street Somerville MA 02143
Limits of Liability and Disclaimer of Warranty
Building Science documents are intended for professionals The author and the publisher of this article have used their best efforts to provide accurate and authoritative information in regard to the subject matter covered The author and publisher make no warranty of any kind expressed or implied with regard to the information contained in this article
The information presented in this article must be used with care by professionals who understand the implications of what they are doing If professional advice or other expert assistance is required the services of a competent professional shall be sought The author and publisher shall not be liable in the event of incidental or consequential damages in connection with or arising from the use of the information contained within this Building Science document
49 of 49

Research Report - 0602
0
2
4
6
8
10
12
14
16
Co
nc
en
trati
on
(m
gm
3 )
Living
Entry
BR1
BR2
BR3
MBR
Mixing stopped
Mixing restarted
185 195 205 215 225 235 05 15 25 35 45 55 65
Hour
Figure 13 Tracer gas decay for 1-story house with supply ventilation at ASHRAE 622 level 33 central fan operation (20 min off 10 min on) and bedroom doors closed (Test
A6)
Reciprocal age-of-air calculations were performed to provide a quantitative comparison of the two ventilation systems as shown in Figure 14 Values were in the range of 0169 hr-1 +0042shy0038 hr-1 for the exhaust ventilation system compared to 0173 hr-1 +0002-0003 hr-1 for the supply ventilation system expressed in terms of the range of differences between the reciprocal age-of-air in each room and the whole-house air change rate With the exhaust ventilation at the laundry room the master bedroom received the greatest amount of fresh air We suspect this may have been caused by the presence of the exhaust ducts used for spot ventilation of the master bathroom possibly providing greater leakage area near the master bathroom than is present in other areas of the house The supply system distributed the ventilation air more uniformly but it is not entirely clear whether this result was primarily caused by the introduction of ventilation air through the supply ducts or by the air handler mixing air throughout the house Since it is clear that the exhaust ventilation showed better uniformity of ventilation with central system mixing it follows that mixing is likely to be the primary factor in the room-to-room uniformity shown by CFIS ventilation
It is also noteworthy that the average net air change rates provided by both the supply and exhaust ventilation systems were only about 018 ACH compared to the 025 ACH that would be expected if the mechanical ventilation rate (017 ACH) and the natural infiltration rate (008 ACH) were additive as they might be with a balanced ventilation system Adding mechanical ventilation to natural infiltration in quadrature results in an estimated average air change rate of 019 ACH which is fairly consistent with the measured values
20 of 49
Research Report - 0602
Recip
rocal
Ag
e o
f A
ir (
1h
r) 025
020
015
010
005
000
Simple Exhaust vs Central Fan Integrated
Supply
Centralized supply mixing
33 duty cycle 100
ASHRAE doors closed
Living
Entry
BR1
BR2
BR3
MBR
Exhaust in utility room no
mixing 100 ASHRAE
doors closed
Figure 14 Reciprocal age-of-air for 1-story house with continuous exhaust ventilation (Test A3) compared to central fan integrated supply ventilation (Test A6)
Air Handler Operation
To determine how much room-to-room mixing was caused by the air handler the exhaust only test was re-run with the air handler operating at 33 duty cycle (20 min off 10 min on) (Test A12) The decay curves are shown in Figure 15 Compared to Test A3 (Figure 12) there was a noticeable increase in uniformity when the air handler was operating even though the entry points for the ventilation air were uncontrolled As shown in Figure 16 the range of reciprocal age of air was reduced from +0042-0038 hr-1 to +0019-0011 hr-1) It appears that operation of the air handler explains most of the difference between the supply and exhaust ventilation systems discussed earlier Although it also appears that the overall average air change rate was higher in the case where the air handler was operating (0216 ACH vs 0176) it should be noted that the average wind speed was also significantly higher It is likely that the wind speed was the primary cause of the difference in average ACH not a difference in the mechanical ventilation rate
21 of 49
Research Report - 0602
0
5
10
15
20
25
30
35
Co
nce
ntr
ati
on
(m
gm
3 )
Living
Entry
BR1
BR2
BR3
MBR
Mixing stopped
Mixing restarted
0 1 2 3 4 5 6 7 8 9 10 11 12 13 14
Hour
Figure 15 Tracer gas decay for 1-story house with continuous exhaust ventilation at ASHRAE 622 level 33 central fan operation (20 min off 10 min on) and bedroom
doors closed (Test A12)
Exhaust Ventilation No Mixing vs 33 Air Handler Duty Cycle
000
005
010
015
020
025
Recip
rocal A
ge o
f A
ir (
1h
r)
Living
Entry
BR1
BR2
BR3
MBR
Exhaust in utility room 33 air handler
no mixing 100 operation exhaust in
ASHRAE doors closed utility room 100
ASHRAE doors closed
Figure 16 Reciprocal age-of-air for 1-story house with continuous exhaust ventilation with and without air handler operation (Tests A3 and A12)
22 of 49
Research Report - 0602
Exhaust Location
The preceding analysis of exhaust ventilation was based on an exhaust point in the laundry room which was relatively centrally located in the 1-story house To examine the effect of moving the exhaust point the duct blaster was moved to the master bathroom which was located in a far corner of the house (Test A16) A continuous exhaust ventilation rate of 58 cfm was again applied to the house resulting in the tracer gas decay curve shown in Figure 17 It is difficult to visually identify a significant difference between this series of curves and those shown in Figure 12 for the laundry room exhaust location
Because the curves were steady it is again possible to compare the results based on reciprocal age-of-air as shown in Figure 18 There appeared to be very little change in the distribution of outside air to most rooms However the reciprocal age-of-air in the master bedroom dropped noticeably when the exhaust location was moved to the master bathroom probably because a greater fraction of the outside air now passed through other rooms before reaching the master bedroom With the exhaust point centrally located most of the ventilation air passing through the master bedroom probably entered from the outside In both cases however the master bedroom had the highest reciprocal age-of-air of all of the rooms in the house and the BR2 location had the lowest
Co
nc
en
tra
tio
n (
mg
m3)
40
35
30
25
20
15
10
5
0
Living
Entry
BR1
BR2
BR3
MBR
Mixing stopped
Mixing restarted
19 20 21 22 23 0 1 2 3 4 5 6 7 8
Hour
Figure 17 Tracer gas decay for 1-story house with exhaust ventilation from the master bathroom at ASHRAE 622 level no central fan operation and bedroom doors closed (Test
A16)
23 of 49
Research Report - 0602
Exhaust Ventilation
Laundry Room vs Master Bathroom
000
005
010
015
020
025
Exhaust in laundry
room no mixing 100
ASHRAE doors closed
Exhaust in master
bathroom no mixing
100 ASHRAE doors
closed
Re
cip
roc
al A
ge
of
Air
(1
hr)
Living
Entry
BR1
BR2
BR3
MBR
Figure 18 Reciprocal age-of-air for 1-story house with exhaust ventilation from the master bathroom compared to the laundry room at ASHRAE 622 level no central fan operation
and bedroom doors closed (Tests A3 and A16)
Ventilation Rate
The supply ventilation test was repeated using flow rates corresponding to 60 and 33 of the ASHRAE recommendations The intent of this series of tests was to evaluate the room-to-room ventilation uniformity for ventilation rates consistent with ASHRAE 622 compared to the uniformity for reduced mechanical ventilation rates Each test was conducted for only 4 hours because of time limitations The decay curves are shown in Figures 19 and 20 Because the rooms were well-mixed during the supply ventilation tests the average whole-house ACH can be compared directly to the reciprocal age-of-air for the exhaust ventilation tests Figure 21 shows the supply ventilation air change rate for each of the three ventilation levels (33 60 100) compared to room-by-room reciprocal age-of-air for the exhaust ventilation system based on the boundary conditions present during the tests It appears that in the supply ventilation case all rooms receive more outside air than the least-ventilated room in the exhaust case (BR2) even at 60 of ASHRAE 622 These results serve to illustrate the trade-off between whole-house ventilation rate and room-to-room ventilation uniformity in terms of their impact on the worst room(s)
24 of 49
Research Report - 0602
The ASHRAE 622 committee has not currently defined the level of mixing that is required when choosing the minimum ventilation rate Some might interpret the results of this test to suggest that a house without mixing can have individual rooms that do not receive sufficient outside air even though the ventilation system is operating at 622 specified rates Because the 622 committee has not specified the level of mixing that is required when choosing the minimum ventilation rate the ventilation rate required by different ventilation systems is open to interpretation For example if the exhaust system performance shown in Figure 21 is acceptable does this mean that a ventilation system that provides good distribution of outside air may be sufficiently well-ventilated at 60 of the ASHRAE 622 level or perhaps even less Alternatively it might be concluded that exhaust ventilation rates should be increased over current ASHRAE 622 recommendations because of the possibility that certain rooms may receive very little fresh air Unfortunately because the current 622 standard does not specify air mixing requirements and the committeersquos assumptions about ventilation air distribution are not well documented it is difficult to make any firm recommendations in this area However we can conclude that air mixing is required for dilution ventilation systems to provide predictable results independent of the geometry of individual homes
8 9 10 11 12 13 14
Hour
Figure 19 Tracer gas decay for 1-story house with supply ventilation at 60 of ASHRAE 622 level 33 central fan operation (20 min off 10 min on) and bedroom doors closed
(Test A4)
0
10
20
30
40
50
60
Co
nce
ntr
ati
on
m
gm
3
Living
Entry
BR1
BR2
BR3
MBR
Mixing stopped
Mixing restarted
25 of 49
Research Report - 0602
0
5
10
15
20
25
30
Co
nce
ntr
ati
on
(m
gm
3 )
Living
Entry
BR1
BR2
BR3
MBR
Mixing stopped
Mixing restarted
12 13 14 15 16 17 18 19 20
Hour
Figure 20 Tracer gas decay for 1-story house with supply ventilation at 33 of ASHRAE 622 level 33 central fan operation (20 min off 10 min on) and bedroom doors closed
(Test A5)
Simple Exhaust vs Central Fan Integrated
Supply with Lower Ventilation Rates
025
Re
cip
roc
al A
ge
of
Air
(1
hr)
Well Mixed
100
ASHRAE 60
ASHRAE 33
ASHRAE Living Entry 010 Natural
BR1 Infilt
BR2 BR3 005
MBR
Exhaust in laundry room no
000
Central supply Natural infil-
mixing 100 ASHRAE doors mixing 33 duty tration doors
closed cycle doors closed open
Figure 21 Reciprocal age-of-air for 1-story house with supply ventilation at 33 60 and 100 of ASHRAE 622 level (Tests A5 A4 A6) compared to exhaust ventilation with
no central fan operation (Test A3) Bedroom doors were closed
020
015
26 of 49
Research Report - 0602
Simulations by Walker (2006) have shown that all systems will not provide the same service in terms of annual average air change rate For the same air flow rate and duty cycle balanced ventilation will yield a higher average air exchange than supply ventilation and supply ventilation will yield a higher average air exchange than exhaust ventilation That can be explained in general terms by understanding that wind and stack effects act to depressurize a building most of the time Exhaust fans increase the building depressurization further but supply fans decrease the depressurization Balanced fans donrsquot change the enclosure differential pressure and air flow at all Because of the non-linear relationship between differential pressure and air flows across the building enclosure a supply fan changes the pressures across the enclosure less than an exhaust fan acting more like a balanced fan The result is that the effect on ventilation air change rate from a supply fan is somewhere between that of an exhaust fan and a true balanced system
Bedroom Doors
Except for the natural ventilation test the preceding tests were all conducted with the bedroom doors closed to simulate a worst-case situation for air circulation within the house The exhaust ventilation test was repeated with the bedroom doors open (Test A9) producing the tracer gas decay curve shown in Figure 22 It is evident that the decay curves were much more tightly bundled with the doors open than they were with the doors closed (compare Figure 12) A comparison based on reciprocal age-of-air is shown in Figure 23 A significant improvement in room-to-room mixing is evident during the open-door test
It is also evident that the average air change rate was higher when the doors were open (0202 vs 0176 ACH) but it must be remembered that the ventilation rate was controlled using a duct blaster and average wind speed was higher during the open-door test period compared to the closed-door test period (20 mph compared to 06 mph) Therefore this test alone does not necessarily indicate that closing doors reduces the average air change rate associated with an exhaust system In future tests continuous measurement of the depressurization of the house with respect to outside along with single-point pressure measurements across interior doors would provide more information about the effect of closing doors when exhaust ventilation systems are used It would also be valuable to conduct this test during steady weather conditions using the exhaust fan (with uncontrolled ventilation rate) instead of the duct blaster to observe the net effect of closed doors on whole-house air change rate
27 of 49
Research Report - 0602
0
5
10
15
20
25
30
Co
ncen
trati
on
(m
gm
3 )
Living
Entry
BR1
BR2
BR3
MBR
Mixing stopped
Mixing restarted
181 191 201 211 221 231 01 11 21 31 41 51 61 71
Hour
Figure 22 Tracer gas decay for 1-story house with exhaust ventilation from the laundry room at ASHRAE 622 level no central fan operation and bedroom doors open (Test A9)
Exhaust Ventilation
Doors Closed vs Doors Open
000
005
010
015
020
025
Re
cip
roc
al
Ag
e o
f A
ir (
1h
r)
Living
Entry
BR1
BR2
BR3
MBR
Exhaust in laundry room Doors open no mixing
no mixing 100 exhaust in laundry room
ASHRAE doors closed 100 ASHRAE
Figure 23 Reciprocal age-of-air for 1-story house with exhaust ventilation from the laundry room at ASHRAE 622 level no central fan operation In the first case the bedroom doors were closed (Test A3) in the second the doors were open (Test A9)
28 of 49
Research Report - 0602
Transfer Grilles
Because the test houses used central returns instead of hard ducted returns in the bedrooms transfer grilles were installed over the bedroom doors to provide a flow path for return air without excessive room pressurization when the doors were closed These transfer grilles also allowed ventilation air to pass more freely from the bedrooms to the main living space The effect of transfer grilles on ventilation air distribution was evaluated by taping over the grilles (see Figure 24) and re-running the exhaust ventilation test (Test A10) The corresponding tracer gas decay curve is shown in Figure 25 and the reciprocal age-of-air analysis is shown in Figure 26 Taping the transfer grilles did not appear to significantly affect the room-to-room variability in ventilation rate although there appeared to be some slight re-ranking of rooms from highest to lowest reciprocal age-of-air It should be noted that there was an increase in average wind speed from 26 mph to 41 mph starting at 1 pm including a half hour period where the average wind speed was 7 mph This weather effect produced noticeable kinks in the decay curves and therefore would be expected to introduce significant errors into the reciprocal age-of-air results
Itrsquos possible that the transfer grilles played a much smaller role in providing a path for ventilation air than the supply ducts Because the air handler was not operating the ducts were not pressurized and were thus available as passive airflow conduits The resistance to air flow was probably smaller for the air ducts than for the transfer grilles depending on their size and the number of supply registers in each bedroom The existing door undercuts are also thought to have played a role The effect of ducts and door undercuts can be tested in the future by running separate tests with ducts and door undercuts taped over
copy buildingsciencecom
Figure 24 Transfer grilles over bedroom doors taped closed
29 of 49
Research Report - 0602
0
10
20
30
40
50
60
70
Co
nc
en
tra
tio
n (
mg
m3 )
Living
Entry
BR1
BR2
BR3
MBR
Mixing stopped
Mixing restarted
8 9 10 11 12 13 14 15 16 17
Hour
Figure 25 Tracer gas decay for 1-story house with exhaust ventilation from the laundry room at ASHRAE 622 level no central fan operation bedroom doors closed and transfer
grilles taped (Test A10)
Exhaust Ventilation
000
005
010
015
020
025
Re
cip
roc
al
Ag
e o
f A
ir (
1h
r)
Living
Entry
BR1
BR2
BR3
MBR
Transfer Grilles Untaped vs Taped
Exhaust in laundry room no Exhaust in laundry room no
mixing 100 ASHRAE mixing 100 ASHRAE
doors closed doors closed transfer
grilles taped
Figure 26 Reciprocal age-of-air for 1-story house with exhaust ventilation from the laundry room at ASHRAE 622 level no central fan operation and doors closed In the
30 of 49
Research Report - 0602
first case the transfer grilles are untaped (Test A3) in the second they are taped closed (Test A10)
Minimum Test Duration
We were fortunate that DR Horton provided two full weeks of access to these homes to conduct this series of tests which allowed us to run some of the more important tracer gas decay tests as long as 12 hours to help ensure that we could accurately calculate reciprocal age-of-air In most cases test houses would not be available for such a long time period To evaluate the length of time needed to estimate the reciprocal age-of-air with reasonable accuracy we examined the results that we would have obtained for one of the exhaust ventilation tests had we halted the test period after less than 12 hours For the supply ventilation tests the rooms were sufficiently well-mixed that the test could have been stopped after 3 or 4 hours assuming weather effects were steady
The reciprocal age-of-air calculations for the exhaust ventilation decay curves (Test A3 see Figure 12) based on test durations of 3 6 9 and 12 hours are shown in Figure 27 These test durations range from 053 to 21 air changes based on the average air change rate of 018 ACH (56 hours per air change) calculated for this test The ratio of highest to lowest reciprocal ageshyof-air is shown above the data points for each case These results suggest that shorter tests tend to overestimate the range and that perhaps 1frac12-2 air changes (roughly 9 to 12 hours in this case) may be necessary to obtain accurate calculations of reciprocal age-of-air when there is significant divergence among rooms From a qualitative standpoint one air change may be sufficient to determine the basic trend Without knowing in advance what mixing pattern will occur it is difficult to recommend a minimum test duration But assuming this test is fairly representative of a worst-case scenario a minimum of 15 air changes would be necessary to have a high degree of confidence in the quantitative difference in reciprocal age-of-air among rooms
31 of 49
Research Report - 0602
000
005
010
015
020
025
030
035
Re
cip
roc
al
Ag
e-O
f-A
ir (
hr-1
)
Living
Entry
BR1
BR2
BR3
MBR HighLow = 297
HighLow = 168 HighLow = 184 HighLow = 161
3-hour Test 6-hour Test 9-hour Test 12-hour Test
(053 Air Changes) (11 Air Changes) (16 Air Changes) (21 Air Changes)
Test Duration
Figure 27 Reciprocal age-of-air based on alternate test durations for 1-story house with exhaust ventilation from the laundry room at ASHRAE 622 level no central fan operation
and doors closed (Test A3) Average air change rate was 018 ACH
TEST RESULTS FROM 2-STORY HOUSE (1117 MONTAGUE)
The 2-story house was tested from January 3-10 2006 Three zones were selected on the first floor and three more were selected on the second floor as indicated by the red stars in Figure 4 The initial mixing of air among the rooms at the start of each test in this 2-story house was not as thorough as it was in the 1-story house Evidently the combined effects of the air handler and the portable de-stratification fan were not sufficient to overcome upward transport of tracer gas driven by the stack effect from the first to the second floor The resulting difference in initial tracer gas concentration among the rooms was about 5-10 This outcome emphasizes the significant effect of stack-driven infiltration on ventilation non-uniformity in multi-story homes Because our test method and equipment did not achieve a well-mixed condition at the start of each test there were some errors introduced into the reciprocal age-of-air analysis For future tests we would recommend larger de-stratification fans to obtain more well-mixed conditions in multi-story houses
Typical errors introduced by incomplete mixing of the tracer gas at the start of such a test were analyzed by examining two hypothetical cases where either all of the air entering a room comes from the outside or all of the air comes from an adjacent room with a different starting concentration If all of the air entering a space comes from the outside then a change in the initial concentration would have no effect on the reciprocal age-of-air because the decay curve would be exponential from the start and the area under the curve would be normalized based on
32 of 49
Research Report - 0602
the starting concentration in that zone However if the air entering a room passes through another room with a lower initial concentration the room receiving the air will have a lower concentration of tracer gas throughout the test compared to what the concentration would have been if the starting points were the same in both rooms This case is illustrated in Figure 28 where assumptions are made that the rooms are the same size the air exchange rate is 01 ACH for both rooms and the initial tracer gas concentration is 10 lower in the first room (upstream) than it is in the second room
The effect on reciprocal age-of-air is shown in Figure 29 A 10 difference in starting concentration results in an error of about 75 in reciprocal age-of-air for a room downstream of a room with a lower starting concentration assuming 01 ACH for both rooms The error would be somewhat smaller (about 5) if the air change rate was higher for both rooms (02 ACH) There would be no error introduced for rooms where all of the air infiltration comes from the outside Although the amount of error in the reciprocal age-of-air calculations can be affected by additional variables not examined here we feel that these percentages are reasonable estimates of the errors in our results for the 2-story house due to incomplete initial mixing of air
In each case an engineering judgment must be made regarding the significance of the error introduced by incomplete initial mixing As a general rule the differences in concentration at the start of the test should be small compared to the differences that are being measured in order for the results to be considered valid
Figure 28 Theoretical decay curves for a well-mixed case with uniform tracer gas concentration compared to a case where the upstream room starts with a concentration
10 lower than the downstream room
33 of 49
Research Report - 0602
Figure 29 Theoretical reciprocal age-of-air for a well-mixed case with uniform tracer gas concentration compared to a case where the upstream room starts with a concentration
10 lower than the downstream room
Natural Infiltration and Duct Leakage
A natural infiltration test was performed over a two hour period on the evening of January 8 (Test B14) The tracer gas decay curves are shown in Figure 30 There was a slight divergence between the first floor and second floor once the air handler was turned off but the rooms on each floor appeared to remain fairly well-mixed The average air change rate during the test period was about 011 ACH which was somewhat higher than the 1-story house as might be expected with an increased stack height
An air handler bedroom door bump test was conducted just prior to the test period shown in Figure 30 allowing observation of the combined effect of duct leakage to the outside and increased infiltration caused by room pressurization The average air change rate during that bump test was 013 ACH suggesting that closing doors and operating the fan added approximately 002 ACH to the whole-house average air change rate The average wind speed was a bit higher while the air handler was running (17 mph compared to 05 mph) so the effect of air handler operation may actually be somewhat less than the average ACH numbers indicate
34 of 49
Research Report - 0602
0
1
2
3
4
SF
6 C
on
ce
ntr
ati
on
(m
gm
3)
BR1
Living
Kitchen
BR2
BR3
MBR
Mixing stopped
Mixing restarted
1814 1843 1912 1940 2009 2038 2107 2136
Hour
Figure 30 Tracer gas decay for 2-story house with no ventilation no central fan operation and bedroom doors open (Test B14)
Distributed Supply vs Point Exhaust Ventilation
A 14-hour test (Test B1) was performed with an exhaust ventilation rate of 63 cfm in the laundry room which was located near the stairwell in the middle of the first floor The ventilation rate was again consistent with the ASHRAE 622 recommendations The tracer gas decay curves are shown in Figure 31 It is interesting that all three second floor rooms showed a delay before entering an exponential decay suggesting that some amount of air was moving from the first floor to the second floor even though the mechanical exhaust point was on the first floor It appears that the further depressurization of the first floor was insufficient to overcome the stack effect and draw a significant amount of outside air in through the rooms on the second floor
35 of 49
Research Report - 0602
182
9
192
9
202
9
212
9
222
9
232
9
029
129
229
329
429
529
629
729
828
929
102
8
112
8
122
8
0
10
20
30
40
50
60
70
SF
6 C
on
ce
ntr
ati
on
(m
gm
3)
BR1
Living
Kitchen
BR2
BR3
MBR
Mixing stopped
Mixing restarted
Hour
Figure 31 Tracer gas decay for 2-story house with exhaust ventilation from the laundry room at ASHRAE 622 level no central fan operation and bedroom doors closed (Test B1)
A supply ventilation test was performed on the 2-story house for about 11 hours starting late on January 4 (Test B3) The duct blaster was unable to provide the ventilation rate necessary to meet the minimum specified in ASHRAE 622 supplying 180 cfm instead of 189 cfm (95) The decay curves are shown in Figure 32 Although the curves are much more tightly packed than they were with the exhaust system there is more divergence than we saw with the supply system in the 1-story house most notably in the master bedroom
The reciprocal age-of-air calculations for both the exhaust and supply ventilation systems are shown in Figure 33 Again the results indicate that much better room-to-room distribution of ventilation air was achieved by the central-fan integrated supply system compared to the single-point exhaust system However for the supply ventilation test the differences in the initial tracer gas concentration were of the same magnitude as the differences in decay rates among the rooms As a result no conclusions should be drawn about the relative ranking of the supply ventilation rate among rooms based on Figure 33
36 of 49
Research Report - 0602
0
10
20
30
40
50
60
SF
6 C
on
ce
ntr
ati
on
(m
gm
3)
BR1
Living
Kitchen
BR2
BR3
MBR
Mixing stopped
Mixing restarted
2136 000 224 448 712 936 1200
Hour
Figure 32 Tracer gas decay for 2-story house with supply ventilation just under ASHRAE 622 level central fan operation at 33 duty cycle (20 min off 10 min on) and bedroom
doors closed (Test B3)
Simple Exhaust vs Central Fan Integrated
Supply )
000
005
010
015
020
025
Recip
rocal A
ge o
f A
ir (
1h
r
BR1
Living
Kitchen
BR2
BR3
MBR
Exhaust in laundry room no Centralized supply mixing
mixing 100 ASHRAE 33 duty cycle 95
doors closed ASHRAE doors closed
Figure 33 Reciprocal age-of-air for 2-story house with continuous exhaust ventilation (Test B1) compared to central fan integrated supply ventilation (Test B3) (Note
Uncertainties introduced by non-uniform starting concentration are of the same order of magnitude as the differences in reciprocal age-of-air among rooms for the supply ventilation case The relative ranking of rooms is not meaningful for that case)
37 of 49
Research Report - 0602
Air Handler Operation
The effect of occasional air handler operation on the distribution of exhaust ventilation air was evaluated on the afternoon of January 6 (Test B6) The tracer gas decay curves are shown in Figure 34 and reciprocal age-of-air calculations are shown in Figure 35 It should again be noted that before the test started the house was mixed using both the air handler and a de-stratification fan with the doors open During the test the doors were closed the de-stratification fan was turned off and the air handler operated at a 33 duty cycle (20 minutes off 10 minutes on) As was the case in the 1-story house this occasional operation of the air handler substantially improved the distribution of ventilation air among rooms even in conjunction with the point exhaust ventilation system There was very little divergence noticeable even with the air handler cycling on and off every half hour However because the initial differences in tracer gas concentration among rooms were as large as the differences in reciprocal age-of-air for the case with air handler operation no conclusions should be drawn about the relative ranking of ventilation rates among the rooms for that case
SF
6 C
on
cen
trati
on
(m
gm
3)
80
70
60
50
40
30
20
10
0
BR1
Living
Kitchen
BR2
BR3
MBR
Mixing stopped
Mixing restarted
1048 1200 1312 1424 1536 1648 1800 1912 2024
Hour
Figure 34 Tracer gas decay for 2-story house with continuous exhaust ventilation at ASHRAE 622 level central fan operation at 33 duty cycle (20 min off 10 min on) and
bedroom doors closed (Test B6)
38 of 49
Research Report - 0602
020
015 R
ec
ipro
ca
l A
ge
of
Air
(1
hr)
Exhaust Ventilation
No Mixing vs 33 Air Handler Duty Cycle
Exhaust in laundry room
no mixing 100
ASHRAE doors closed
33 air handler
operation exhaust in
laundry room 100
ASHRAE doors closed
BR1
Living
Kitchen
BR2
BR3
MBR
010
005
000
Figure 35 Reciprocal age-of-air for 2-story house with continuous exhaust ventilation with and without air handler operation (Tests B1 and B6) (Note Uncertainties introduced by non-uniform starting concentration are of the same order of magnitude as the differences in reciprocal age-of-air among rooms for the case with air handler operation The relative
ranking of rooms is not meaningful for that case)
Exhaust Location
The duct blaster was moved to the master bathroom exhaust register to see if there was a resulting change in ventilation air distribution (Test B18) The master bathroom was in the back of the house on the second floor between the master bedroom and bedroom 3 The decay curves are shown in Figure 36 and the reciprocal age-of-air results are shown in Figure 37 The rooms on each floor were well mixed before the test began although the mixing between the two floors was not as good Very wide divergence among rooms can be seen during the test especially between the upstairs bedrooms and the rest of the house Once again all three upstairs rooms appear to receive some air from the first floor but the master bedroom experiences a much higher volume of circulated air than the other two second-floor bedrooms which appear to be relatively stagnant
39 of 49
Research Report - 0602
0
10
20
30
40
50
60
70
80
90
SF
6 C
on
ce
ntr
ati
on
(m
gm
3)
BR1
Living
Kitchen
BR2
BR3
MBR
Mixing stopped
Mixing restarted
1912 2136 000 224 448 712 936 1200
Hour
Figure 36 Tracer gas decay for 2-story house with exhaust ventilation from the master bathroom at ASHRAE 622 level no central fan operation and bedroom doors closed (Test
B18)
Exhaust Ventilation
Laundry Room vs Master Bathroom
000
005
010
015
020
025
030
Exhaust in laundry room no
mixing 100 ASHRAE
doors closed
Exhaust in master bathroom
no mixing 100 ASHRAE
doors closed
Re
cip
roc
al A
ge
of
Air
(1
hr)
BR1
Living
Kitchen
BR2
BR3
MBR
Figure 37 Reciprocal age-of-air for 2-story house with exhaust ventilation from the master bathroom compared to the laundry room at ASHRAE 622 level no central fan operation
and bedroom doors closed (Tests B1 and B18)
40 of 49
Research Report - 0602
Ventilation Rate
The supply ventilation tests were repeated using flow rates of 60 and 33 of ASHRAE 622 recommendations corresponding to 114 cfm and 63 cfm respectively (Tests B2 and B4) The decay curves are shown in Figures 38 and 39 Reciprocal age-of-air for all three supply ventilation rates are shown in Figure 40 In all cases the rooms remained fairly well mixed especially rooms on the same floor As we observed in the 1-story house the ventilation rate in the 2-story house appeared to have very little effect on the uniformity of outside air provided to each room as long as it was mixed using the air handler One again the initial differences in tracer gas concentration among rooms were as large as the divergence in the decay curves preventing any conclusions about the relative ranking of ventilation rates among rooms for all three cases The error in initial concentration uniformity was bigger for the cases with air handler mixing because the relative divergence in the decay curves was so small compared to that of no air handler mixing In other words the error in relative ranking of ventilation rates for the cases with air handler mixing were not very important anyway because the relative differences between rooms were so small
1536 1648 1800 1912 2024 2136 2248
Hour
Figure 38 Tracer gas decay for 2-story house with supply ventilation at 60 of ASHRAE 622 level 33 central fan operation (20 min off 10 min on) and bedroom doors closed
(Test B2)
0
5
10
15
20
25
30
SF
6 C
on
cen
trati
on
(m
gm
3)
BR1 Living Kitchen BR2 BR3 MBR
Mixing stopped
Mixing restarted
41 of 49
Research Report - 0602
0
5
10
15
20
25
30
35
40
SF
6 C
on
cen
trati
on
(m
gm
3)
BR1
Living
Kitchen
BR2
BR3
MBR
Mixing stopped
Mixing restarted
1200 1312 1424 1536 1648 1800 1912
Hour
Figure 39 Tracer gas decay for 2-story house with supply ventilation at 33 of ASHRAE 622 level 33 central fan operation (20 min off 10 min on) and bedroom doors closed
(Test B4)
Supply Ventilation Rate Comparison
000
005
010
015
020
025
Re
cip
roc
al
Ag
e o
f A
ir (
1h
r)
BR1
Living
Kitchen
BR2
BR3
MBR
Centralized supply Centralized supply Centralized supply
mixing 33 duty mixing 33 duty mixing 33 duty
cycle 95 ASHRAE cycle 60 ASHRAE cycle 33 ASHRAE
doors closed doors closed doors closed
Figure 40 Reciprocal age-of-air for 2-story house with three levels of supply ventilation central fan operation at 33 duty cycle (20 min off 10 min on) and bedroom doors closed (Tests B3 B2 B4) (Note Uncertainties introduced by non-uniform starting
concentration are of the same order of magnitude as the differences in reciprocal age-of-air among rooms for all three cases The relative ranking of rooms is not meaningful for these
cases)
42 of 49
Research Report - 0602
The average air change rates for the three supply ventilation rates compared to the two exhaust ventilation schemes are shown in Figure 41 The CFIS system at 33 of the 622 ventilation flow rate provided a uniformly higher air change rate (013 ach) than the least ventilated rooms using exhaust ventilation from either the laundry or the master bathroom (010 ach Figure 37) It is noteworthy that the combined net air change rate with exhaust ventilation from the laundry room was significantly less than the air change rates for both exhaust ventilation from the master bathroom and supply ventilation at the air handler This illustrates the unpredictability of interactions between mechanical ventilation and natural infiltration which depend strongly on the distribution and size of cracks through which the outside air must pass to enter the house There may have been a relatively large building enclosure leakage opening near the laundry room (perhaps the utility penetrations or the door to the garage) that allowed a significant amount of outside air to quickly enter and leave the house through the exhaust flow without circulating around the house
0
005
01
015
02
025
Ave
rag
e A
CH
Natural Exhaust Exhaust Supply 95 Supply 60 Supply 33
Laundry Mbath
Rm 100 100
Figure 41 Average air change rates for 2-story house with supply ventilation at 33 60 and 95 of ASHRAE 622 recommendations (Tests B4 B2 B3) compared to natural
infiltration (Test B14) and exhaust ventilation with no central fan operation (Test B1) Bedroom doors were closed except for the natural infiltration test
Bedroom Doors
The laundry room exhaust ventilation test with no air handler operation (see Figure 31) was repeated with the doors open to evaluate the change in room-to-room ventilation air distribution (Test B10) The decay curves are shown in Figure 42 and the reciprocal age-of air calculations are shown in Figure 43 It is evident from Figure 42 that the test began before the rooms were
43 of 49
Research Report - 0602
0
5
10
15
20
25
SF
6 C
on
ce
ntr
ati
on
(m
gm
3)
BR1 Living Kitchen BR2 BR3 MBR
Mixing stopped
Mixing restarted
completely well mixed resulting in decay curves that could be somewhat misleading Because the master bedroom was at a higher concentration than the other rooms at the start of the test any room that received air from the master bedroom would appear to have a slower decay rate than it would have if the rooms started out at the same concentration Despite the difference in starting concentration it is clear that outside air was well distributed when the doors were open even without operation of the air handler
1843 1912 1940 2009 2038 2107 2136 2204 2233 2302
Hour
Figure 42 Tracer gas decay for the 2-story house with exhaust ventilation from the laundry room at ASHRAE 622 level no central fan operation and bedroom doors open
(Test B10)
Reciprocal age-of-air analysis was not performed for this case because of the combined effect of a short test duration (~2 hours) and unequal starting tracer gas concentrations even though the house was relatively well-mixed The important conclusion (that opening doors greatly improves mixing) can be drawn by inspecting the decay curves alone
Transfer Grilles
A final exhaust ventilation test was run on the 2-story house with the doors closed and the transfer grilles taped over The decay curves are shown in Figure 43 and the reciprocal age-ofshyair calculations are shown in Figure 44 The curves were clearly very divergent even after 12 hours By examining the reciprocal age-of-air results it is apparent that the transfer grilles in the 2-story house caused a noticeable improvement in ventilation air distribution but the improvement was smaller than when the doors were opened (Figure 42)
44 of 49
Research Report - 0602
0
5
10
15
20
25
30
SF
6 C
on
cen
tra
tio
n (
mg
m3
) BR1 Living Kitchen BR2 BR3 MBR
Mixing stopped
Mixing restarted
1648 1912 2136 000 224 448 712 936
Hour
Figure 43 Tracer gas decay for 2-story house with exhaust ventilation from the laundry room at ASHRAE 622 level no central fan operation bedroom doors closed transfer
grilles taped closed (Test B7)
Exhaust Ventilation Transfer Grilles Untaped vs Taped
000
005
010
015
020
Re
cip
roc
al
Ag
e o
f A
ir (
1h
r)
BR1
Living
Kitchen
BR2
BR3
MBR
Exhaust in laundry room no Exhaust in laundry room no
mixing 100 ASHRAE mixing 100 ASHRAE
doors closed doors closed transfer
grilles taped
Figure 44 Reciprocal age-of-air for 2-story house with exhaust ventilation from the laundry room at ASHRAE 622 level no central fan operation and doors closed In the first case the transfer grilles are untaped (Test B3) in the second they are taped closed
(Test B7)
45 of 49
Research Report - 0602
CONCLUSIONS
bull Reciprocal age-of-air analysis was chosen as a quantitative method for characterizing distribution of ventilation air among rooms This method worked well in cases where rooms were well mixed to begin the test and weather conditions were sufficiently steady-state
bull A test period of at least 1frac12 air changes was necessary to obtain reasonably accurate ageshyof-air results when there was significant divergence in tracer gas concentration among the rooms
bull Although we did not achieve uniform initial concentration of tracer gas in the 2-story house using our test methodology and the equipment at hand we believe the reciprocal age-of-air calculations were meaningful in many of the cases as indicated in the discussion
bull Both houses were relatively tight with natural infiltration averaging 008 ACH for the 1shystory house and 011 ACH for the 2-story house
bull Both houses had relatively small (but not negligible) duct losses to the outside producing an increase in infiltration of less than 003 ACH for the 1-story house and 002 ACH for the 2-story house when the air handler runs
bull Age-of-air analysis indicated that ventilation supplied through the central air distribution system provided much more uniform distribution of ventilation air than the single-point exhaust system when the doors were closed and the air handler was not running For the 1-story house the central-fan-integrated supply ventilation case at 60 of ASHRAE 622 provided more outside air to all rooms than the least-ventilated room in the exhaust case at 100 of 622 For the 2-story house the central-fan-integrated supply system at 33 of the 622 flow rate provided more outside air to all rooms than the least ventilated rooms using exhaust ventilation at 100 of 622 from either the laundry or the master bathroom
bull Operation of the central fan at a 33 duty cycle maintained relatively well-mixed conditions regardless of ventilation rate type of ventilation system (supply or exhaust) or house configuration (1-story or 2-story)
bull Exhaust location affected both the relative amount of outside air received by different rooms and the overall uniformity among rooms but the effect was not predictable
bull For exhaust-only ventilation without central fan operation opening bedroom doors appeared to significantly improve the mixing of ventilation air among rooms
bull Transfer grilles improved the distribution of ventilation air slightly but much less than opening the bedroom doors
bull In the 2-story house the stack effect caused air movement from the first floor to the second floor even when exhaust ventilation was applied to the first floor resulting in consistently higher tracer gas concentrations on the second floor and more non-uniform ventilation air distribution in general
bull Interactions between natural infiltration and both exhaust and supply mechanical ventilation were very significant When the ventilation system was activated the combined air change rate did not increase commensurate with the measured ventilation rate but instead increased by only half that amount This result was consistent with combining ventilation and infiltration in quadrature to estimate whole-house air change rate in accordance with ASHRAE Standard 136 (ASHRAE 1993)
46 of 49
Research Report - 0602
FUTURE WORK
In future tests continuous monitoring of pressure differentials would enhance our understanding of the multi-zone combined infiltration and ventilation systems and our ability to model them That would help to explain differences between tests in more detail including the effects of multiple stories location of ventilation supply outlets and exhaust inlets interior door closure and use of passive return air transfer grilles Pressure differential measurement points should include
bull dP with respect to outside for each closed room and open space bull dP across closed interior doors bull dP between the floor cavity and outdoors and bull dP between the house and the attic
Measurement of wind direction along with wind speed could also be helpful for modeling these buildings and systems However because of micro-climate wind shielding it may be very difficult to relate a single-point wind direction measurement to actual wind vectors on the building surfaces
ACKNOWLEDGMENTS
The authors express their appreciation to Rich Coyle of DR Horton for providing the test houses and to Joseph Lstiburek of BSC Subrato Chandra and Neil Moyer of FSEC and Greg Barker of Mountain Energy Partnership for their assistance in the planning and execution of this ventilation study
47 of 49
Research Report - 0602
REFERENCES
ASHRAE (1993) ANSIASHRAE Standard 136-1993 A Method of Determining Air Change Rates in Detached Dwellings Atlanta GA American Society of Heating Refrigerating and Air-Conditioning Engineers Inc
ASHRAE (1997) ANSIASHRAE Standard 129-1997 Measuring Air-Change Effectiveness Atlanta GA American Society of Heating Refrigerating and Air-Conditioning Engineers Inc
ASHRAE (2004) ASHRAE Standard 622-2004 Ventilation and Acceptable Indoor Air Quality in Low-Rise Residential Buildings Atlanta GA American Society of Heating Refrigerating and Air-Conditioning Engineers Inc
CSA (2003) CANCSA F326-M91 Residential Mechanical Ventilation Systems Canadian Standards Association Ontario Canada httpwwwcsashyintlorgonlinestoreGetCatalogItemDetailsaspmat=2410793ampParent=102
NBC 2005 National Building Code of Canada httpircnrcshycnrcgccapubscodesnrcc47666_ehtml
Grieve PW (1991) Measuring Ventilation Using Tracer-Gases Denmark Bruumlel amp Kjaeligr
MN Chapter 7672 Minnesota Energy Code Chapter 7672 Detached Single-Family And Two-Family Dwellings httpwwwstatemnusmnexternalDocsCommerceChapter_7672_Residential_111302012428 _72rulepdf
Persily AK Martin SR (2000) A Modeling Study of Ventilation in Manufactured Houses Gaithersburg MD National Institute of Standards and Technology NISTIR 6455
Rudd A Lstiburek J (2000) ldquoMeasurement of Ventilation and Interzonal Distribution in Single-Family Homesrdquo ASHRAE Transactions 2000 MN-00-10-3 V 106 Pt2 American Society of Heating Refrigeration and Air-Conditioning Engineers Atlanta GA
WAC (2004) Washington State Title 51 WAC Community trade and economic development department of (building code council) Chapter 51-13 Ventilation and indoor air quality httpappslegwagovWACdefaultaspxcite=51-13
48 of 49
Research Report - 0602
Field test of room-to-room uniformity of ventilation air distribution in two new houses
About this Report
This report was prepared for the US Department of Energyrsquos Building America
Program The report is freely available to the public at wwwbuildingamericagov
The authors express their appreciation to Rich Coyle of DR Horton for providing the test houses and to Joseph Lstiburek of BSC Subrato Chandra and Neil Moyer of
FSEC and Greg Barker of Mountain Energy Partnership for their assistance in the planning and execution of this ventilation study
About the Authors
Robert Hendron Ren Anderson Dennis Barley are with National Renewable Energy Laboratory Armin Rudd and Aaron Townsend are with Building Science Corporation
Ed Hancock is with Mountain Energy Partnership
Direct all correspondence to Building Science Corporation 30 Forest Street Somerville MA 02143
Limits of Liability and Disclaimer of Warranty
Building Science documents are intended for professionals The author and the publisher of this article have used their best efforts to provide accurate and authoritative information in regard to the subject matter covered The author and publisher make no warranty of any kind expressed or implied with regard to the information contained in this article
The information presented in this article must be used with care by professionals who understand the implications of what they are doing If professional advice or other expert assistance is required the services of a competent professional shall be sought The author and publisher shall not be liable in the event of incidental or consequential damages in connection with or arising from the use of the information contained within this Building Science document
49 of 49

Research Report - 0602
Recip
rocal
Ag
e o
f A
ir (
1h
r) 025
020
015
010
005
000
Simple Exhaust vs Central Fan Integrated
Supply
Centralized supply mixing
33 duty cycle 100
ASHRAE doors closed
Living
Entry
BR1
BR2
BR3
MBR
Exhaust in utility room no
mixing 100 ASHRAE
doors closed
Figure 14 Reciprocal age-of-air for 1-story house with continuous exhaust ventilation (Test A3) compared to central fan integrated supply ventilation (Test A6)
Air Handler Operation
To determine how much room-to-room mixing was caused by the air handler the exhaust only test was re-run with the air handler operating at 33 duty cycle (20 min off 10 min on) (Test A12) The decay curves are shown in Figure 15 Compared to Test A3 (Figure 12) there was a noticeable increase in uniformity when the air handler was operating even though the entry points for the ventilation air were uncontrolled As shown in Figure 16 the range of reciprocal age of air was reduced from +0042-0038 hr-1 to +0019-0011 hr-1) It appears that operation of the air handler explains most of the difference between the supply and exhaust ventilation systems discussed earlier Although it also appears that the overall average air change rate was higher in the case where the air handler was operating (0216 ACH vs 0176) it should be noted that the average wind speed was also significantly higher It is likely that the wind speed was the primary cause of the difference in average ACH not a difference in the mechanical ventilation rate
21 of 49
Research Report - 0602
0
5
10
15
20
25
30
35
Co
nce
ntr
ati
on
(m
gm
3 )
Living
Entry
BR1
BR2
BR3
MBR
Mixing stopped
Mixing restarted
0 1 2 3 4 5 6 7 8 9 10 11 12 13 14
Hour
Figure 15 Tracer gas decay for 1-story house with continuous exhaust ventilation at ASHRAE 622 level 33 central fan operation (20 min off 10 min on) and bedroom
doors closed (Test A12)
Exhaust Ventilation No Mixing vs 33 Air Handler Duty Cycle
000
005
010
015
020
025
Recip
rocal A
ge o
f A
ir (
1h
r)
Living
Entry
BR1
BR2
BR3
MBR
Exhaust in utility room 33 air handler
no mixing 100 operation exhaust in
ASHRAE doors closed utility room 100
ASHRAE doors closed
Figure 16 Reciprocal age-of-air for 1-story house with continuous exhaust ventilation with and without air handler operation (Tests A3 and A12)
22 of 49
Research Report - 0602
Exhaust Location
The preceding analysis of exhaust ventilation was based on an exhaust point in the laundry room which was relatively centrally located in the 1-story house To examine the effect of moving the exhaust point the duct blaster was moved to the master bathroom which was located in a far corner of the house (Test A16) A continuous exhaust ventilation rate of 58 cfm was again applied to the house resulting in the tracer gas decay curve shown in Figure 17 It is difficult to visually identify a significant difference between this series of curves and those shown in Figure 12 for the laundry room exhaust location
Because the curves were steady it is again possible to compare the results based on reciprocal age-of-air as shown in Figure 18 There appeared to be very little change in the distribution of outside air to most rooms However the reciprocal age-of-air in the master bedroom dropped noticeably when the exhaust location was moved to the master bathroom probably because a greater fraction of the outside air now passed through other rooms before reaching the master bedroom With the exhaust point centrally located most of the ventilation air passing through the master bedroom probably entered from the outside In both cases however the master bedroom had the highest reciprocal age-of-air of all of the rooms in the house and the BR2 location had the lowest
Co
nc
en
tra
tio
n (
mg
m3)
40
35
30
25
20
15
10
5
0
Living
Entry
BR1
BR2
BR3
MBR
Mixing stopped
Mixing restarted
19 20 21 22 23 0 1 2 3 4 5 6 7 8
Hour
Figure 17 Tracer gas decay for 1-story house with exhaust ventilation from the master bathroom at ASHRAE 622 level no central fan operation and bedroom doors closed (Test
A16)
23 of 49
Research Report - 0602
Exhaust Ventilation
Laundry Room vs Master Bathroom
000
005
010
015
020
025
Exhaust in laundry
room no mixing 100
ASHRAE doors closed
Exhaust in master
bathroom no mixing
100 ASHRAE doors
closed
Re
cip
roc
al A
ge
of
Air
(1
hr)
Living
Entry
BR1
BR2
BR3
MBR
Figure 18 Reciprocal age-of-air for 1-story house with exhaust ventilation from the master bathroom compared to the laundry room at ASHRAE 622 level no central fan operation
and bedroom doors closed (Tests A3 and A16)
Ventilation Rate
The supply ventilation test was repeated using flow rates corresponding to 60 and 33 of the ASHRAE recommendations The intent of this series of tests was to evaluate the room-to-room ventilation uniformity for ventilation rates consistent with ASHRAE 622 compared to the uniformity for reduced mechanical ventilation rates Each test was conducted for only 4 hours because of time limitations The decay curves are shown in Figures 19 and 20 Because the rooms were well-mixed during the supply ventilation tests the average whole-house ACH can be compared directly to the reciprocal age-of-air for the exhaust ventilation tests Figure 21 shows the supply ventilation air change rate for each of the three ventilation levels (33 60 100) compared to room-by-room reciprocal age-of-air for the exhaust ventilation system based on the boundary conditions present during the tests It appears that in the supply ventilation case all rooms receive more outside air than the least-ventilated room in the exhaust case (BR2) even at 60 of ASHRAE 622 These results serve to illustrate the trade-off between whole-house ventilation rate and room-to-room ventilation uniformity in terms of their impact on the worst room(s)
24 of 49
Research Report - 0602
The ASHRAE 622 committee has not currently defined the level of mixing that is required when choosing the minimum ventilation rate Some might interpret the results of this test to suggest that a house without mixing can have individual rooms that do not receive sufficient outside air even though the ventilation system is operating at 622 specified rates Because the 622 committee has not specified the level of mixing that is required when choosing the minimum ventilation rate the ventilation rate required by different ventilation systems is open to interpretation For example if the exhaust system performance shown in Figure 21 is acceptable does this mean that a ventilation system that provides good distribution of outside air may be sufficiently well-ventilated at 60 of the ASHRAE 622 level or perhaps even less Alternatively it might be concluded that exhaust ventilation rates should be increased over current ASHRAE 622 recommendations because of the possibility that certain rooms may receive very little fresh air Unfortunately because the current 622 standard does not specify air mixing requirements and the committeersquos assumptions about ventilation air distribution are not well documented it is difficult to make any firm recommendations in this area However we can conclude that air mixing is required for dilution ventilation systems to provide predictable results independent of the geometry of individual homes
8 9 10 11 12 13 14
Hour
Figure 19 Tracer gas decay for 1-story house with supply ventilation at 60 of ASHRAE 622 level 33 central fan operation (20 min off 10 min on) and bedroom doors closed
(Test A4)
0
10
20
30
40
50
60
Co
nce
ntr
ati
on
m
gm
3
Living
Entry
BR1
BR2
BR3
MBR
Mixing stopped
Mixing restarted
25 of 49
Research Report - 0602
0
5
10
15
20
25
30
Co
nce
ntr
ati
on
(m
gm
3 )
Living
Entry
BR1
BR2
BR3
MBR
Mixing stopped
Mixing restarted
12 13 14 15 16 17 18 19 20
Hour
Figure 20 Tracer gas decay for 1-story house with supply ventilation at 33 of ASHRAE 622 level 33 central fan operation (20 min off 10 min on) and bedroom doors closed
(Test A5)
Simple Exhaust vs Central Fan Integrated
Supply with Lower Ventilation Rates
025
Re
cip
roc
al A
ge
of
Air
(1
hr)
Well Mixed
100
ASHRAE 60
ASHRAE 33
ASHRAE Living Entry 010 Natural
BR1 Infilt
BR2 BR3 005
MBR
Exhaust in laundry room no
000
Central supply Natural infil-
mixing 100 ASHRAE doors mixing 33 duty tration doors
closed cycle doors closed open
Figure 21 Reciprocal age-of-air for 1-story house with supply ventilation at 33 60 and 100 of ASHRAE 622 level (Tests A5 A4 A6) compared to exhaust ventilation with
no central fan operation (Test A3) Bedroom doors were closed
020
015
26 of 49
Research Report - 0602
Simulations by Walker (2006) have shown that all systems will not provide the same service in terms of annual average air change rate For the same air flow rate and duty cycle balanced ventilation will yield a higher average air exchange than supply ventilation and supply ventilation will yield a higher average air exchange than exhaust ventilation That can be explained in general terms by understanding that wind and stack effects act to depressurize a building most of the time Exhaust fans increase the building depressurization further but supply fans decrease the depressurization Balanced fans donrsquot change the enclosure differential pressure and air flow at all Because of the non-linear relationship between differential pressure and air flows across the building enclosure a supply fan changes the pressures across the enclosure less than an exhaust fan acting more like a balanced fan The result is that the effect on ventilation air change rate from a supply fan is somewhere between that of an exhaust fan and a true balanced system
Bedroom Doors
Except for the natural ventilation test the preceding tests were all conducted with the bedroom doors closed to simulate a worst-case situation for air circulation within the house The exhaust ventilation test was repeated with the bedroom doors open (Test A9) producing the tracer gas decay curve shown in Figure 22 It is evident that the decay curves were much more tightly bundled with the doors open than they were with the doors closed (compare Figure 12) A comparison based on reciprocal age-of-air is shown in Figure 23 A significant improvement in room-to-room mixing is evident during the open-door test
It is also evident that the average air change rate was higher when the doors were open (0202 vs 0176 ACH) but it must be remembered that the ventilation rate was controlled using a duct blaster and average wind speed was higher during the open-door test period compared to the closed-door test period (20 mph compared to 06 mph) Therefore this test alone does not necessarily indicate that closing doors reduces the average air change rate associated with an exhaust system In future tests continuous measurement of the depressurization of the house with respect to outside along with single-point pressure measurements across interior doors would provide more information about the effect of closing doors when exhaust ventilation systems are used It would also be valuable to conduct this test during steady weather conditions using the exhaust fan (with uncontrolled ventilation rate) instead of the duct blaster to observe the net effect of closed doors on whole-house air change rate
27 of 49
Research Report - 0602
0
5
10
15
20
25
30
Co
ncen
trati
on
(m
gm
3 )
Living
Entry
BR1
BR2
BR3
MBR
Mixing stopped
Mixing restarted
181 191 201 211 221 231 01 11 21 31 41 51 61 71
Hour
Figure 22 Tracer gas decay for 1-story house with exhaust ventilation from the laundry room at ASHRAE 622 level no central fan operation and bedroom doors open (Test A9)
Exhaust Ventilation
Doors Closed vs Doors Open
000
005
010
015
020
025
Re
cip
roc
al
Ag
e o
f A
ir (
1h
r)
Living
Entry
BR1
BR2
BR3
MBR
Exhaust in laundry room Doors open no mixing
no mixing 100 exhaust in laundry room
ASHRAE doors closed 100 ASHRAE
Figure 23 Reciprocal age-of-air for 1-story house with exhaust ventilation from the laundry room at ASHRAE 622 level no central fan operation In the first case the bedroom doors were closed (Test A3) in the second the doors were open (Test A9)
28 of 49
Research Report - 0602
Transfer Grilles
Because the test houses used central returns instead of hard ducted returns in the bedrooms transfer grilles were installed over the bedroom doors to provide a flow path for return air without excessive room pressurization when the doors were closed These transfer grilles also allowed ventilation air to pass more freely from the bedrooms to the main living space The effect of transfer grilles on ventilation air distribution was evaluated by taping over the grilles (see Figure 24) and re-running the exhaust ventilation test (Test A10) The corresponding tracer gas decay curve is shown in Figure 25 and the reciprocal age-of-air analysis is shown in Figure 26 Taping the transfer grilles did not appear to significantly affect the room-to-room variability in ventilation rate although there appeared to be some slight re-ranking of rooms from highest to lowest reciprocal age-of-air It should be noted that there was an increase in average wind speed from 26 mph to 41 mph starting at 1 pm including a half hour period where the average wind speed was 7 mph This weather effect produced noticeable kinks in the decay curves and therefore would be expected to introduce significant errors into the reciprocal age-of-air results
Itrsquos possible that the transfer grilles played a much smaller role in providing a path for ventilation air than the supply ducts Because the air handler was not operating the ducts were not pressurized and were thus available as passive airflow conduits The resistance to air flow was probably smaller for the air ducts than for the transfer grilles depending on their size and the number of supply registers in each bedroom The existing door undercuts are also thought to have played a role The effect of ducts and door undercuts can be tested in the future by running separate tests with ducts and door undercuts taped over
copy buildingsciencecom
Figure 24 Transfer grilles over bedroom doors taped closed
29 of 49
Research Report - 0602
0
10
20
30
40
50
60
70
Co
nc
en
tra
tio
n (
mg
m3 )
Living
Entry
BR1
BR2
BR3
MBR
Mixing stopped
Mixing restarted
8 9 10 11 12 13 14 15 16 17
Hour
Figure 25 Tracer gas decay for 1-story house with exhaust ventilation from the laundry room at ASHRAE 622 level no central fan operation bedroom doors closed and transfer
grilles taped (Test A10)
Exhaust Ventilation
000
005
010
015
020
025
Re
cip
roc
al
Ag
e o
f A
ir (
1h
r)
Living
Entry
BR1
BR2
BR3
MBR
Transfer Grilles Untaped vs Taped
Exhaust in laundry room no Exhaust in laundry room no
mixing 100 ASHRAE mixing 100 ASHRAE
doors closed doors closed transfer
grilles taped
Figure 26 Reciprocal age-of-air for 1-story house with exhaust ventilation from the laundry room at ASHRAE 622 level no central fan operation and doors closed In the
30 of 49
Research Report - 0602
first case the transfer grilles are untaped (Test A3) in the second they are taped closed (Test A10)
Minimum Test Duration
We were fortunate that DR Horton provided two full weeks of access to these homes to conduct this series of tests which allowed us to run some of the more important tracer gas decay tests as long as 12 hours to help ensure that we could accurately calculate reciprocal age-of-air In most cases test houses would not be available for such a long time period To evaluate the length of time needed to estimate the reciprocal age-of-air with reasonable accuracy we examined the results that we would have obtained for one of the exhaust ventilation tests had we halted the test period after less than 12 hours For the supply ventilation tests the rooms were sufficiently well-mixed that the test could have been stopped after 3 or 4 hours assuming weather effects were steady
The reciprocal age-of-air calculations for the exhaust ventilation decay curves (Test A3 see Figure 12) based on test durations of 3 6 9 and 12 hours are shown in Figure 27 These test durations range from 053 to 21 air changes based on the average air change rate of 018 ACH (56 hours per air change) calculated for this test The ratio of highest to lowest reciprocal ageshyof-air is shown above the data points for each case These results suggest that shorter tests tend to overestimate the range and that perhaps 1frac12-2 air changes (roughly 9 to 12 hours in this case) may be necessary to obtain accurate calculations of reciprocal age-of-air when there is significant divergence among rooms From a qualitative standpoint one air change may be sufficient to determine the basic trend Without knowing in advance what mixing pattern will occur it is difficult to recommend a minimum test duration But assuming this test is fairly representative of a worst-case scenario a minimum of 15 air changes would be necessary to have a high degree of confidence in the quantitative difference in reciprocal age-of-air among rooms
31 of 49
Research Report - 0602
000
005
010
015
020
025
030
035
Re
cip
roc
al
Ag
e-O
f-A
ir (
hr-1
)
Living
Entry
BR1
BR2
BR3
MBR HighLow = 297
HighLow = 168 HighLow = 184 HighLow = 161
3-hour Test 6-hour Test 9-hour Test 12-hour Test
(053 Air Changes) (11 Air Changes) (16 Air Changes) (21 Air Changes)
Test Duration
Figure 27 Reciprocal age-of-air based on alternate test durations for 1-story house with exhaust ventilation from the laundry room at ASHRAE 622 level no central fan operation
and doors closed (Test A3) Average air change rate was 018 ACH
TEST RESULTS FROM 2-STORY HOUSE (1117 MONTAGUE)
The 2-story house was tested from January 3-10 2006 Three zones were selected on the first floor and three more were selected on the second floor as indicated by the red stars in Figure 4 The initial mixing of air among the rooms at the start of each test in this 2-story house was not as thorough as it was in the 1-story house Evidently the combined effects of the air handler and the portable de-stratification fan were not sufficient to overcome upward transport of tracer gas driven by the stack effect from the first to the second floor The resulting difference in initial tracer gas concentration among the rooms was about 5-10 This outcome emphasizes the significant effect of stack-driven infiltration on ventilation non-uniformity in multi-story homes Because our test method and equipment did not achieve a well-mixed condition at the start of each test there were some errors introduced into the reciprocal age-of-air analysis For future tests we would recommend larger de-stratification fans to obtain more well-mixed conditions in multi-story houses
Typical errors introduced by incomplete mixing of the tracer gas at the start of such a test were analyzed by examining two hypothetical cases where either all of the air entering a room comes from the outside or all of the air comes from an adjacent room with a different starting concentration If all of the air entering a space comes from the outside then a change in the initial concentration would have no effect on the reciprocal age-of-air because the decay curve would be exponential from the start and the area under the curve would be normalized based on
32 of 49
Research Report - 0602
the starting concentration in that zone However if the air entering a room passes through another room with a lower initial concentration the room receiving the air will have a lower concentration of tracer gas throughout the test compared to what the concentration would have been if the starting points were the same in both rooms This case is illustrated in Figure 28 where assumptions are made that the rooms are the same size the air exchange rate is 01 ACH for both rooms and the initial tracer gas concentration is 10 lower in the first room (upstream) than it is in the second room
The effect on reciprocal age-of-air is shown in Figure 29 A 10 difference in starting concentration results in an error of about 75 in reciprocal age-of-air for a room downstream of a room with a lower starting concentration assuming 01 ACH for both rooms The error would be somewhat smaller (about 5) if the air change rate was higher for both rooms (02 ACH) There would be no error introduced for rooms where all of the air infiltration comes from the outside Although the amount of error in the reciprocal age-of-air calculations can be affected by additional variables not examined here we feel that these percentages are reasonable estimates of the errors in our results for the 2-story house due to incomplete initial mixing of air
In each case an engineering judgment must be made regarding the significance of the error introduced by incomplete initial mixing As a general rule the differences in concentration at the start of the test should be small compared to the differences that are being measured in order for the results to be considered valid
Figure 28 Theoretical decay curves for a well-mixed case with uniform tracer gas concentration compared to a case where the upstream room starts with a concentration
10 lower than the downstream room
33 of 49
Research Report - 0602
Figure 29 Theoretical reciprocal age-of-air for a well-mixed case with uniform tracer gas concentration compared to a case where the upstream room starts with a concentration
10 lower than the downstream room
Natural Infiltration and Duct Leakage
A natural infiltration test was performed over a two hour period on the evening of January 8 (Test B14) The tracer gas decay curves are shown in Figure 30 There was a slight divergence between the first floor and second floor once the air handler was turned off but the rooms on each floor appeared to remain fairly well-mixed The average air change rate during the test period was about 011 ACH which was somewhat higher than the 1-story house as might be expected with an increased stack height
An air handler bedroom door bump test was conducted just prior to the test period shown in Figure 30 allowing observation of the combined effect of duct leakage to the outside and increased infiltration caused by room pressurization The average air change rate during that bump test was 013 ACH suggesting that closing doors and operating the fan added approximately 002 ACH to the whole-house average air change rate The average wind speed was a bit higher while the air handler was running (17 mph compared to 05 mph) so the effect of air handler operation may actually be somewhat less than the average ACH numbers indicate
34 of 49
Research Report - 0602
0
1
2
3
4
SF
6 C
on
ce
ntr
ati
on
(m
gm
3)
BR1
Living
Kitchen
BR2
BR3
MBR
Mixing stopped
Mixing restarted
1814 1843 1912 1940 2009 2038 2107 2136
Hour
Figure 30 Tracer gas decay for 2-story house with no ventilation no central fan operation and bedroom doors open (Test B14)
Distributed Supply vs Point Exhaust Ventilation
A 14-hour test (Test B1) was performed with an exhaust ventilation rate of 63 cfm in the laundry room which was located near the stairwell in the middle of the first floor The ventilation rate was again consistent with the ASHRAE 622 recommendations The tracer gas decay curves are shown in Figure 31 It is interesting that all three second floor rooms showed a delay before entering an exponential decay suggesting that some amount of air was moving from the first floor to the second floor even though the mechanical exhaust point was on the first floor It appears that the further depressurization of the first floor was insufficient to overcome the stack effect and draw a significant amount of outside air in through the rooms on the second floor
35 of 49
Research Report - 0602
182
9
192
9
202
9
212
9
222
9
232
9
029
129
229
329
429
529
629
729
828
929
102
8
112
8
122
8
0
10
20
30
40
50
60
70
SF
6 C
on
ce
ntr
ati
on
(m
gm
3)
BR1
Living
Kitchen
BR2
BR3
MBR
Mixing stopped
Mixing restarted
Hour
Figure 31 Tracer gas decay for 2-story house with exhaust ventilation from the laundry room at ASHRAE 622 level no central fan operation and bedroom doors closed (Test B1)
A supply ventilation test was performed on the 2-story house for about 11 hours starting late on January 4 (Test B3) The duct blaster was unable to provide the ventilation rate necessary to meet the minimum specified in ASHRAE 622 supplying 180 cfm instead of 189 cfm (95) The decay curves are shown in Figure 32 Although the curves are much more tightly packed than they were with the exhaust system there is more divergence than we saw with the supply system in the 1-story house most notably in the master bedroom
The reciprocal age-of-air calculations for both the exhaust and supply ventilation systems are shown in Figure 33 Again the results indicate that much better room-to-room distribution of ventilation air was achieved by the central-fan integrated supply system compared to the single-point exhaust system However for the supply ventilation test the differences in the initial tracer gas concentration were of the same magnitude as the differences in decay rates among the rooms As a result no conclusions should be drawn about the relative ranking of the supply ventilation rate among rooms based on Figure 33
36 of 49
Research Report - 0602
0
10
20
30
40
50
60
SF
6 C
on
ce
ntr
ati
on
(m
gm
3)
BR1
Living
Kitchen
BR2
BR3
MBR
Mixing stopped
Mixing restarted
2136 000 224 448 712 936 1200
Hour
Figure 32 Tracer gas decay for 2-story house with supply ventilation just under ASHRAE 622 level central fan operation at 33 duty cycle (20 min off 10 min on) and bedroom
doors closed (Test B3)
Simple Exhaust vs Central Fan Integrated
Supply )
000
005
010
015
020
025
Recip
rocal A
ge o
f A
ir (
1h
r
BR1
Living
Kitchen
BR2
BR3
MBR
Exhaust in laundry room no Centralized supply mixing
mixing 100 ASHRAE 33 duty cycle 95
doors closed ASHRAE doors closed
Figure 33 Reciprocal age-of-air for 2-story house with continuous exhaust ventilation (Test B1) compared to central fan integrated supply ventilation (Test B3) (Note
Uncertainties introduced by non-uniform starting concentration are of the same order of magnitude as the differences in reciprocal age-of-air among rooms for the supply ventilation case The relative ranking of rooms is not meaningful for that case)
37 of 49
Research Report - 0602
Air Handler Operation
The effect of occasional air handler operation on the distribution of exhaust ventilation air was evaluated on the afternoon of January 6 (Test B6) The tracer gas decay curves are shown in Figure 34 and reciprocal age-of-air calculations are shown in Figure 35 It should again be noted that before the test started the house was mixed using both the air handler and a de-stratification fan with the doors open During the test the doors were closed the de-stratification fan was turned off and the air handler operated at a 33 duty cycle (20 minutes off 10 minutes on) As was the case in the 1-story house this occasional operation of the air handler substantially improved the distribution of ventilation air among rooms even in conjunction with the point exhaust ventilation system There was very little divergence noticeable even with the air handler cycling on and off every half hour However because the initial differences in tracer gas concentration among rooms were as large as the differences in reciprocal age-of-air for the case with air handler operation no conclusions should be drawn about the relative ranking of ventilation rates among the rooms for that case
SF
6 C
on
cen
trati
on
(m
gm
3)
80
70
60
50
40
30
20
10
0
BR1
Living
Kitchen
BR2
BR3
MBR
Mixing stopped
Mixing restarted
1048 1200 1312 1424 1536 1648 1800 1912 2024
Hour
Figure 34 Tracer gas decay for 2-story house with continuous exhaust ventilation at ASHRAE 622 level central fan operation at 33 duty cycle (20 min off 10 min on) and
bedroom doors closed (Test B6)
38 of 49
Research Report - 0602
020
015 R
ec
ipro
ca
l A
ge
of
Air
(1
hr)
Exhaust Ventilation
No Mixing vs 33 Air Handler Duty Cycle
Exhaust in laundry room
no mixing 100
ASHRAE doors closed
33 air handler
operation exhaust in
laundry room 100
ASHRAE doors closed
BR1
Living
Kitchen
BR2
BR3
MBR
010
005
000
Figure 35 Reciprocal age-of-air for 2-story house with continuous exhaust ventilation with and without air handler operation (Tests B1 and B6) (Note Uncertainties introduced by non-uniform starting concentration are of the same order of magnitude as the differences in reciprocal age-of-air among rooms for the case with air handler operation The relative
ranking of rooms is not meaningful for that case)
Exhaust Location
The duct blaster was moved to the master bathroom exhaust register to see if there was a resulting change in ventilation air distribution (Test B18) The master bathroom was in the back of the house on the second floor between the master bedroom and bedroom 3 The decay curves are shown in Figure 36 and the reciprocal age-of-air results are shown in Figure 37 The rooms on each floor were well mixed before the test began although the mixing between the two floors was not as good Very wide divergence among rooms can be seen during the test especially between the upstairs bedrooms and the rest of the house Once again all three upstairs rooms appear to receive some air from the first floor but the master bedroom experiences a much higher volume of circulated air than the other two second-floor bedrooms which appear to be relatively stagnant
39 of 49
Research Report - 0602
0
10
20
30
40
50
60
70
80
90
SF
6 C
on
ce
ntr
ati
on
(m
gm
3)
BR1
Living
Kitchen
BR2
BR3
MBR
Mixing stopped
Mixing restarted
1912 2136 000 224 448 712 936 1200
Hour
Figure 36 Tracer gas decay for 2-story house with exhaust ventilation from the master bathroom at ASHRAE 622 level no central fan operation and bedroom doors closed (Test
B18)
Exhaust Ventilation
Laundry Room vs Master Bathroom
000
005
010
015
020
025
030
Exhaust in laundry room no
mixing 100 ASHRAE
doors closed
Exhaust in master bathroom
no mixing 100 ASHRAE
doors closed
Re
cip
roc
al A
ge
of
Air
(1
hr)
BR1
Living
Kitchen
BR2
BR3
MBR
Figure 37 Reciprocal age-of-air for 2-story house with exhaust ventilation from the master bathroom compared to the laundry room at ASHRAE 622 level no central fan operation
and bedroom doors closed (Tests B1 and B18)
40 of 49
Research Report - 0602
Ventilation Rate
The supply ventilation tests were repeated using flow rates of 60 and 33 of ASHRAE 622 recommendations corresponding to 114 cfm and 63 cfm respectively (Tests B2 and B4) The decay curves are shown in Figures 38 and 39 Reciprocal age-of-air for all three supply ventilation rates are shown in Figure 40 In all cases the rooms remained fairly well mixed especially rooms on the same floor As we observed in the 1-story house the ventilation rate in the 2-story house appeared to have very little effect on the uniformity of outside air provided to each room as long as it was mixed using the air handler One again the initial differences in tracer gas concentration among rooms were as large as the divergence in the decay curves preventing any conclusions about the relative ranking of ventilation rates among rooms for all three cases The error in initial concentration uniformity was bigger for the cases with air handler mixing because the relative divergence in the decay curves was so small compared to that of no air handler mixing In other words the error in relative ranking of ventilation rates for the cases with air handler mixing were not very important anyway because the relative differences between rooms were so small
1536 1648 1800 1912 2024 2136 2248
Hour
Figure 38 Tracer gas decay for 2-story house with supply ventilation at 60 of ASHRAE 622 level 33 central fan operation (20 min off 10 min on) and bedroom doors closed
(Test B2)
0
5
10
15
20
25
30
SF
6 C
on
cen
trati
on
(m
gm
3)
BR1 Living Kitchen BR2 BR3 MBR
Mixing stopped
Mixing restarted
41 of 49
Research Report - 0602
0
5
10
15
20
25
30
35
40
SF
6 C
on
cen
trati
on
(m
gm
3)
BR1
Living
Kitchen
BR2
BR3
MBR
Mixing stopped
Mixing restarted
1200 1312 1424 1536 1648 1800 1912
Hour
Figure 39 Tracer gas decay for 2-story house with supply ventilation at 33 of ASHRAE 622 level 33 central fan operation (20 min off 10 min on) and bedroom doors closed
(Test B4)
Supply Ventilation Rate Comparison
000
005
010
015
020
025
Re
cip
roc
al
Ag
e o
f A
ir (
1h
r)
BR1
Living
Kitchen
BR2
BR3
MBR
Centralized supply Centralized supply Centralized supply
mixing 33 duty mixing 33 duty mixing 33 duty
cycle 95 ASHRAE cycle 60 ASHRAE cycle 33 ASHRAE
doors closed doors closed doors closed
Figure 40 Reciprocal age-of-air for 2-story house with three levels of supply ventilation central fan operation at 33 duty cycle (20 min off 10 min on) and bedroom doors closed (Tests B3 B2 B4) (Note Uncertainties introduced by non-uniform starting
concentration are of the same order of magnitude as the differences in reciprocal age-of-air among rooms for all three cases The relative ranking of rooms is not meaningful for these
cases)
42 of 49
Research Report - 0602
The average air change rates for the three supply ventilation rates compared to the two exhaust ventilation schemes are shown in Figure 41 The CFIS system at 33 of the 622 ventilation flow rate provided a uniformly higher air change rate (013 ach) than the least ventilated rooms using exhaust ventilation from either the laundry or the master bathroom (010 ach Figure 37) It is noteworthy that the combined net air change rate with exhaust ventilation from the laundry room was significantly less than the air change rates for both exhaust ventilation from the master bathroom and supply ventilation at the air handler This illustrates the unpredictability of interactions between mechanical ventilation and natural infiltration which depend strongly on the distribution and size of cracks through which the outside air must pass to enter the house There may have been a relatively large building enclosure leakage opening near the laundry room (perhaps the utility penetrations or the door to the garage) that allowed a significant amount of outside air to quickly enter and leave the house through the exhaust flow without circulating around the house
0
005
01
015
02
025
Ave
rag
e A
CH
Natural Exhaust Exhaust Supply 95 Supply 60 Supply 33
Laundry Mbath
Rm 100 100
Figure 41 Average air change rates for 2-story house with supply ventilation at 33 60 and 95 of ASHRAE 622 recommendations (Tests B4 B2 B3) compared to natural
infiltration (Test B14) and exhaust ventilation with no central fan operation (Test B1) Bedroom doors were closed except for the natural infiltration test
Bedroom Doors
The laundry room exhaust ventilation test with no air handler operation (see Figure 31) was repeated with the doors open to evaluate the change in room-to-room ventilation air distribution (Test B10) The decay curves are shown in Figure 42 and the reciprocal age-of air calculations are shown in Figure 43 It is evident from Figure 42 that the test began before the rooms were
43 of 49
Research Report - 0602
0
5
10
15
20
25
SF
6 C
on
ce
ntr
ati
on
(m
gm
3)
BR1 Living Kitchen BR2 BR3 MBR
Mixing stopped
Mixing restarted
completely well mixed resulting in decay curves that could be somewhat misleading Because the master bedroom was at a higher concentration than the other rooms at the start of the test any room that received air from the master bedroom would appear to have a slower decay rate than it would have if the rooms started out at the same concentration Despite the difference in starting concentration it is clear that outside air was well distributed when the doors were open even without operation of the air handler
1843 1912 1940 2009 2038 2107 2136 2204 2233 2302
Hour
Figure 42 Tracer gas decay for the 2-story house with exhaust ventilation from the laundry room at ASHRAE 622 level no central fan operation and bedroom doors open
(Test B10)
Reciprocal age-of-air analysis was not performed for this case because of the combined effect of a short test duration (~2 hours) and unequal starting tracer gas concentrations even though the house was relatively well-mixed The important conclusion (that opening doors greatly improves mixing) can be drawn by inspecting the decay curves alone
Transfer Grilles
A final exhaust ventilation test was run on the 2-story house with the doors closed and the transfer grilles taped over The decay curves are shown in Figure 43 and the reciprocal age-ofshyair calculations are shown in Figure 44 The curves were clearly very divergent even after 12 hours By examining the reciprocal age-of-air results it is apparent that the transfer grilles in the 2-story house caused a noticeable improvement in ventilation air distribution but the improvement was smaller than when the doors were opened (Figure 42)
44 of 49
Research Report - 0602
0
5
10
15
20
25
30
SF
6 C
on
cen
tra
tio
n (
mg
m3
) BR1 Living Kitchen BR2 BR3 MBR
Mixing stopped
Mixing restarted
1648 1912 2136 000 224 448 712 936
Hour
Figure 43 Tracer gas decay for 2-story house with exhaust ventilation from the laundry room at ASHRAE 622 level no central fan operation bedroom doors closed transfer
grilles taped closed (Test B7)
Exhaust Ventilation Transfer Grilles Untaped vs Taped
000
005
010
015
020
Re
cip
roc
al
Ag
e o
f A
ir (
1h
r)
BR1
Living
Kitchen
BR2
BR3
MBR
Exhaust in laundry room no Exhaust in laundry room no
mixing 100 ASHRAE mixing 100 ASHRAE
doors closed doors closed transfer
grilles taped
Figure 44 Reciprocal age-of-air for 2-story house with exhaust ventilation from the laundry room at ASHRAE 622 level no central fan operation and doors closed In the first case the transfer grilles are untaped (Test B3) in the second they are taped closed
(Test B7)
45 of 49
Research Report - 0602
CONCLUSIONS
bull Reciprocal age-of-air analysis was chosen as a quantitative method for characterizing distribution of ventilation air among rooms This method worked well in cases where rooms were well mixed to begin the test and weather conditions were sufficiently steady-state
bull A test period of at least 1frac12 air changes was necessary to obtain reasonably accurate ageshyof-air results when there was significant divergence in tracer gas concentration among the rooms
bull Although we did not achieve uniform initial concentration of tracer gas in the 2-story house using our test methodology and the equipment at hand we believe the reciprocal age-of-air calculations were meaningful in many of the cases as indicated in the discussion
bull Both houses were relatively tight with natural infiltration averaging 008 ACH for the 1shystory house and 011 ACH for the 2-story house
bull Both houses had relatively small (but not negligible) duct losses to the outside producing an increase in infiltration of less than 003 ACH for the 1-story house and 002 ACH for the 2-story house when the air handler runs
bull Age-of-air analysis indicated that ventilation supplied through the central air distribution system provided much more uniform distribution of ventilation air than the single-point exhaust system when the doors were closed and the air handler was not running For the 1-story house the central-fan-integrated supply ventilation case at 60 of ASHRAE 622 provided more outside air to all rooms than the least-ventilated room in the exhaust case at 100 of 622 For the 2-story house the central-fan-integrated supply system at 33 of the 622 flow rate provided more outside air to all rooms than the least ventilated rooms using exhaust ventilation at 100 of 622 from either the laundry or the master bathroom
bull Operation of the central fan at a 33 duty cycle maintained relatively well-mixed conditions regardless of ventilation rate type of ventilation system (supply or exhaust) or house configuration (1-story or 2-story)
bull Exhaust location affected both the relative amount of outside air received by different rooms and the overall uniformity among rooms but the effect was not predictable
bull For exhaust-only ventilation without central fan operation opening bedroom doors appeared to significantly improve the mixing of ventilation air among rooms
bull Transfer grilles improved the distribution of ventilation air slightly but much less than opening the bedroom doors
bull In the 2-story house the stack effect caused air movement from the first floor to the second floor even when exhaust ventilation was applied to the first floor resulting in consistently higher tracer gas concentrations on the second floor and more non-uniform ventilation air distribution in general
bull Interactions between natural infiltration and both exhaust and supply mechanical ventilation were very significant When the ventilation system was activated the combined air change rate did not increase commensurate with the measured ventilation rate but instead increased by only half that amount This result was consistent with combining ventilation and infiltration in quadrature to estimate whole-house air change rate in accordance with ASHRAE Standard 136 (ASHRAE 1993)
46 of 49
Research Report - 0602
FUTURE WORK
In future tests continuous monitoring of pressure differentials would enhance our understanding of the multi-zone combined infiltration and ventilation systems and our ability to model them That would help to explain differences between tests in more detail including the effects of multiple stories location of ventilation supply outlets and exhaust inlets interior door closure and use of passive return air transfer grilles Pressure differential measurement points should include
bull dP with respect to outside for each closed room and open space bull dP across closed interior doors bull dP between the floor cavity and outdoors and bull dP between the house and the attic
Measurement of wind direction along with wind speed could also be helpful for modeling these buildings and systems However because of micro-climate wind shielding it may be very difficult to relate a single-point wind direction measurement to actual wind vectors on the building surfaces
ACKNOWLEDGMENTS
The authors express their appreciation to Rich Coyle of DR Horton for providing the test houses and to Joseph Lstiburek of BSC Subrato Chandra and Neil Moyer of FSEC and Greg Barker of Mountain Energy Partnership for their assistance in the planning and execution of this ventilation study
47 of 49
Research Report - 0602
REFERENCES
ASHRAE (1993) ANSIASHRAE Standard 136-1993 A Method of Determining Air Change Rates in Detached Dwellings Atlanta GA American Society of Heating Refrigerating and Air-Conditioning Engineers Inc
ASHRAE (1997) ANSIASHRAE Standard 129-1997 Measuring Air-Change Effectiveness Atlanta GA American Society of Heating Refrigerating and Air-Conditioning Engineers Inc
ASHRAE (2004) ASHRAE Standard 622-2004 Ventilation and Acceptable Indoor Air Quality in Low-Rise Residential Buildings Atlanta GA American Society of Heating Refrigerating and Air-Conditioning Engineers Inc
CSA (2003) CANCSA F326-M91 Residential Mechanical Ventilation Systems Canadian Standards Association Ontario Canada httpwwwcsashyintlorgonlinestoreGetCatalogItemDetailsaspmat=2410793ampParent=102
NBC 2005 National Building Code of Canada httpircnrcshycnrcgccapubscodesnrcc47666_ehtml
Grieve PW (1991) Measuring Ventilation Using Tracer-Gases Denmark Bruumlel amp Kjaeligr
MN Chapter 7672 Minnesota Energy Code Chapter 7672 Detached Single-Family And Two-Family Dwellings httpwwwstatemnusmnexternalDocsCommerceChapter_7672_Residential_111302012428 _72rulepdf
Persily AK Martin SR (2000) A Modeling Study of Ventilation in Manufactured Houses Gaithersburg MD National Institute of Standards and Technology NISTIR 6455
Rudd A Lstiburek J (2000) ldquoMeasurement of Ventilation and Interzonal Distribution in Single-Family Homesrdquo ASHRAE Transactions 2000 MN-00-10-3 V 106 Pt2 American Society of Heating Refrigeration and Air-Conditioning Engineers Atlanta GA
WAC (2004) Washington State Title 51 WAC Community trade and economic development department of (building code council) Chapter 51-13 Ventilation and indoor air quality httpappslegwagovWACdefaultaspxcite=51-13
48 of 49
Research Report - 0602
Field test of room-to-room uniformity of ventilation air distribution in two new houses
About this Report
This report was prepared for the US Department of Energyrsquos Building America
Program The report is freely available to the public at wwwbuildingamericagov
The authors express their appreciation to Rich Coyle of DR Horton for providing the test houses and to Joseph Lstiburek of BSC Subrato Chandra and Neil Moyer of
FSEC and Greg Barker of Mountain Energy Partnership for their assistance in the planning and execution of this ventilation study
About the Authors
Robert Hendron Ren Anderson Dennis Barley are with National Renewable Energy Laboratory Armin Rudd and Aaron Townsend are with Building Science Corporation
Ed Hancock is with Mountain Energy Partnership
Direct all correspondence to Building Science Corporation 30 Forest Street Somerville MA 02143
Limits of Liability and Disclaimer of Warranty
Building Science documents are intended for professionals The author and the publisher of this article have used their best efforts to provide accurate and authoritative information in regard to the subject matter covered The author and publisher make no warranty of any kind expressed or implied with regard to the information contained in this article
The information presented in this article must be used with care by professionals who understand the implications of what they are doing If professional advice or other expert assistance is required the services of a competent professional shall be sought The author and publisher shall not be liable in the event of incidental or consequential damages in connection with or arising from the use of the information contained within this Building Science document
49 of 49
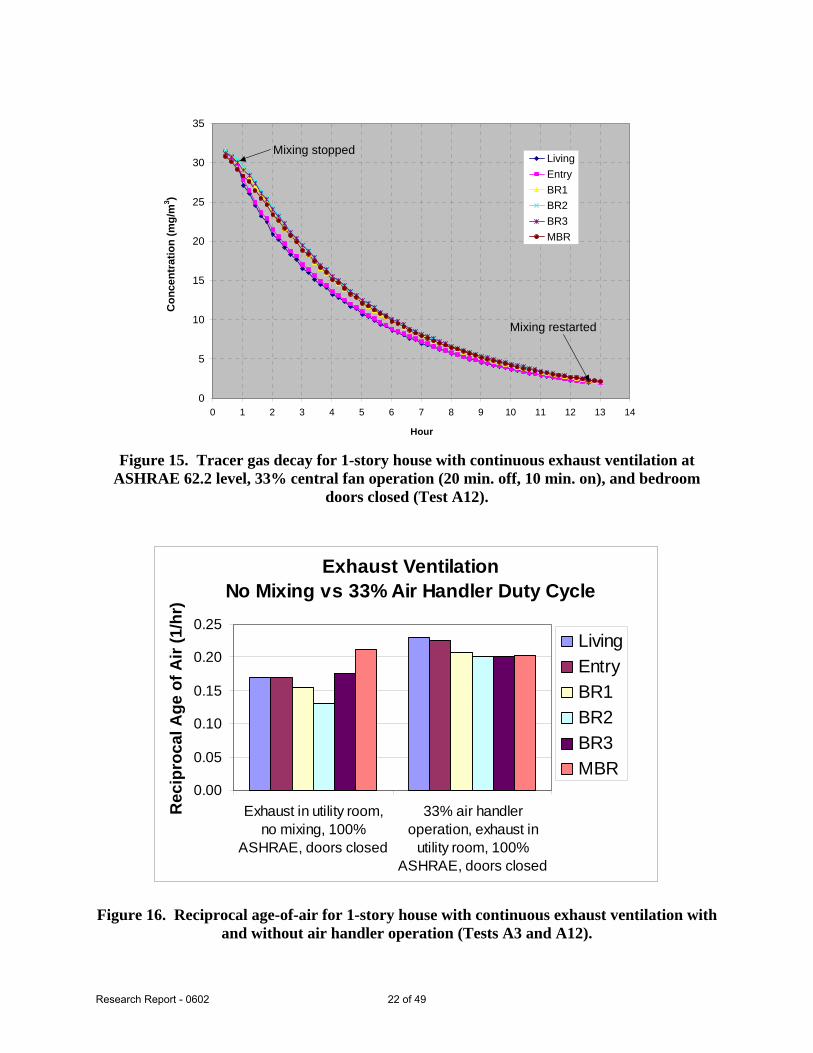
Research Report - 0602
0
5
10
15
20
25
30
35
Co
nce
ntr
ati
on
(m
gm
3 )
Living
Entry
BR1
BR2
BR3
MBR
Mixing stopped
Mixing restarted
0 1 2 3 4 5 6 7 8 9 10 11 12 13 14
Hour
Figure 15 Tracer gas decay for 1-story house with continuous exhaust ventilation at ASHRAE 622 level 33 central fan operation (20 min off 10 min on) and bedroom
doors closed (Test A12)
Exhaust Ventilation No Mixing vs 33 Air Handler Duty Cycle
000
005
010
015
020
025
Recip
rocal A
ge o
f A
ir (
1h
r)
Living
Entry
BR1
BR2
BR3
MBR
Exhaust in utility room 33 air handler
no mixing 100 operation exhaust in
ASHRAE doors closed utility room 100
ASHRAE doors closed
Figure 16 Reciprocal age-of-air for 1-story house with continuous exhaust ventilation with and without air handler operation (Tests A3 and A12)
22 of 49
Research Report - 0602
Exhaust Location
The preceding analysis of exhaust ventilation was based on an exhaust point in the laundry room which was relatively centrally located in the 1-story house To examine the effect of moving the exhaust point the duct blaster was moved to the master bathroom which was located in a far corner of the house (Test A16) A continuous exhaust ventilation rate of 58 cfm was again applied to the house resulting in the tracer gas decay curve shown in Figure 17 It is difficult to visually identify a significant difference between this series of curves and those shown in Figure 12 for the laundry room exhaust location
Because the curves were steady it is again possible to compare the results based on reciprocal age-of-air as shown in Figure 18 There appeared to be very little change in the distribution of outside air to most rooms However the reciprocal age-of-air in the master bedroom dropped noticeably when the exhaust location was moved to the master bathroom probably because a greater fraction of the outside air now passed through other rooms before reaching the master bedroom With the exhaust point centrally located most of the ventilation air passing through the master bedroom probably entered from the outside In both cases however the master bedroom had the highest reciprocal age-of-air of all of the rooms in the house and the BR2 location had the lowest
Co
nc
en
tra
tio
n (
mg
m3)
40
35
30
25
20
15
10
5
0
Living
Entry
BR1
BR2
BR3
MBR
Mixing stopped
Mixing restarted
19 20 21 22 23 0 1 2 3 4 5 6 7 8
Hour
Figure 17 Tracer gas decay for 1-story house with exhaust ventilation from the master bathroom at ASHRAE 622 level no central fan operation and bedroom doors closed (Test
A16)
23 of 49
Research Report - 0602
Exhaust Ventilation
Laundry Room vs Master Bathroom
000
005
010
015
020
025
Exhaust in laundry
room no mixing 100
ASHRAE doors closed
Exhaust in master
bathroom no mixing
100 ASHRAE doors
closed
Re
cip
roc
al A
ge
of
Air
(1
hr)
Living
Entry
BR1
BR2
BR3
MBR
Figure 18 Reciprocal age-of-air for 1-story house with exhaust ventilation from the master bathroom compared to the laundry room at ASHRAE 622 level no central fan operation
and bedroom doors closed (Tests A3 and A16)
Ventilation Rate
The supply ventilation test was repeated using flow rates corresponding to 60 and 33 of the ASHRAE recommendations The intent of this series of tests was to evaluate the room-to-room ventilation uniformity for ventilation rates consistent with ASHRAE 622 compared to the uniformity for reduced mechanical ventilation rates Each test was conducted for only 4 hours because of time limitations The decay curves are shown in Figures 19 and 20 Because the rooms were well-mixed during the supply ventilation tests the average whole-house ACH can be compared directly to the reciprocal age-of-air for the exhaust ventilation tests Figure 21 shows the supply ventilation air change rate for each of the three ventilation levels (33 60 100) compared to room-by-room reciprocal age-of-air for the exhaust ventilation system based on the boundary conditions present during the tests It appears that in the supply ventilation case all rooms receive more outside air than the least-ventilated room in the exhaust case (BR2) even at 60 of ASHRAE 622 These results serve to illustrate the trade-off between whole-house ventilation rate and room-to-room ventilation uniformity in terms of their impact on the worst room(s)
24 of 49
Research Report - 0602
The ASHRAE 622 committee has not currently defined the level of mixing that is required when choosing the minimum ventilation rate Some might interpret the results of this test to suggest that a house without mixing can have individual rooms that do not receive sufficient outside air even though the ventilation system is operating at 622 specified rates Because the 622 committee has not specified the level of mixing that is required when choosing the minimum ventilation rate the ventilation rate required by different ventilation systems is open to interpretation For example if the exhaust system performance shown in Figure 21 is acceptable does this mean that a ventilation system that provides good distribution of outside air may be sufficiently well-ventilated at 60 of the ASHRAE 622 level or perhaps even less Alternatively it might be concluded that exhaust ventilation rates should be increased over current ASHRAE 622 recommendations because of the possibility that certain rooms may receive very little fresh air Unfortunately because the current 622 standard does not specify air mixing requirements and the committeersquos assumptions about ventilation air distribution are not well documented it is difficult to make any firm recommendations in this area However we can conclude that air mixing is required for dilution ventilation systems to provide predictable results independent of the geometry of individual homes
8 9 10 11 12 13 14
Hour
Figure 19 Tracer gas decay for 1-story house with supply ventilation at 60 of ASHRAE 622 level 33 central fan operation (20 min off 10 min on) and bedroom doors closed
(Test A4)
0
10
20
30
40
50
60
Co
nce
ntr
ati
on
m
gm
3
Living
Entry
BR1
BR2
BR3
MBR
Mixing stopped
Mixing restarted
25 of 49
Research Report - 0602
0
5
10
15
20
25
30
Co
nce
ntr
ati
on
(m
gm
3 )
Living
Entry
BR1
BR2
BR3
MBR
Mixing stopped
Mixing restarted
12 13 14 15 16 17 18 19 20
Hour
Figure 20 Tracer gas decay for 1-story house with supply ventilation at 33 of ASHRAE 622 level 33 central fan operation (20 min off 10 min on) and bedroom doors closed
(Test A5)
Simple Exhaust vs Central Fan Integrated
Supply with Lower Ventilation Rates
025
Re
cip
roc
al A
ge
of
Air
(1
hr)
Well Mixed
100
ASHRAE 60
ASHRAE 33
ASHRAE Living Entry 010 Natural
BR1 Infilt
BR2 BR3 005
MBR
Exhaust in laundry room no
000
Central supply Natural infil-
mixing 100 ASHRAE doors mixing 33 duty tration doors
closed cycle doors closed open
Figure 21 Reciprocal age-of-air for 1-story house with supply ventilation at 33 60 and 100 of ASHRAE 622 level (Tests A5 A4 A6) compared to exhaust ventilation with
no central fan operation (Test A3) Bedroom doors were closed
020
015
26 of 49
Research Report - 0602
Simulations by Walker (2006) have shown that all systems will not provide the same service in terms of annual average air change rate For the same air flow rate and duty cycle balanced ventilation will yield a higher average air exchange than supply ventilation and supply ventilation will yield a higher average air exchange than exhaust ventilation That can be explained in general terms by understanding that wind and stack effects act to depressurize a building most of the time Exhaust fans increase the building depressurization further but supply fans decrease the depressurization Balanced fans donrsquot change the enclosure differential pressure and air flow at all Because of the non-linear relationship between differential pressure and air flows across the building enclosure a supply fan changes the pressures across the enclosure less than an exhaust fan acting more like a balanced fan The result is that the effect on ventilation air change rate from a supply fan is somewhere between that of an exhaust fan and a true balanced system
Bedroom Doors
Except for the natural ventilation test the preceding tests were all conducted with the bedroom doors closed to simulate a worst-case situation for air circulation within the house The exhaust ventilation test was repeated with the bedroom doors open (Test A9) producing the tracer gas decay curve shown in Figure 22 It is evident that the decay curves were much more tightly bundled with the doors open than they were with the doors closed (compare Figure 12) A comparison based on reciprocal age-of-air is shown in Figure 23 A significant improvement in room-to-room mixing is evident during the open-door test
It is also evident that the average air change rate was higher when the doors were open (0202 vs 0176 ACH) but it must be remembered that the ventilation rate was controlled using a duct blaster and average wind speed was higher during the open-door test period compared to the closed-door test period (20 mph compared to 06 mph) Therefore this test alone does not necessarily indicate that closing doors reduces the average air change rate associated with an exhaust system In future tests continuous measurement of the depressurization of the house with respect to outside along with single-point pressure measurements across interior doors would provide more information about the effect of closing doors when exhaust ventilation systems are used It would also be valuable to conduct this test during steady weather conditions using the exhaust fan (with uncontrolled ventilation rate) instead of the duct blaster to observe the net effect of closed doors on whole-house air change rate
27 of 49
Research Report - 0602
0
5
10
15
20
25
30
Co
ncen
trati
on
(m
gm
3 )
Living
Entry
BR1
BR2
BR3
MBR
Mixing stopped
Mixing restarted
181 191 201 211 221 231 01 11 21 31 41 51 61 71
Hour
Figure 22 Tracer gas decay for 1-story house with exhaust ventilation from the laundry room at ASHRAE 622 level no central fan operation and bedroom doors open (Test A9)
Exhaust Ventilation
Doors Closed vs Doors Open
000
005
010
015
020
025
Re
cip
roc
al
Ag
e o
f A
ir (
1h
r)
Living
Entry
BR1
BR2
BR3
MBR
Exhaust in laundry room Doors open no mixing
no mixing 100 exhaust in laundry room
ASHRAE doors closed 100 ASHRAE
Figure 23 Reciprocal age-of-air for 1-story house with exhaust ventilation from the laundry room at ASHRAE 622 level no central fan operation In the first case the bedroom doors were closed (Test A3) in the second the doors were open (Test A9)
28 of 49
Research Report - 0602
Transfer Grilles
Because the test houses used central returns instead of hard ducted returns in the bedrooms transfer grilles were installed over the bedroom doors to provide a flow path for return air without excessive room pressurization when the doors were closed These transfer grilles also allowed ventilation air to pass more freely from the bedrooms to the main living space The effect of transfer grilles on ventilation air distribution was evaluated by taping over the grilles (see Figure 24) and re-running the exhaust ventilation test (Test A10) The corresponding tracer gas decay curve is shown in Figure 25 and the reciprocal age-of-air analysis is shown in Figure 26 Taping the transfer grilles did not appear to significantly affect the room-to-room variability in ventilation rate although there appeared to be some slight re-ranking of rooms from highest to lowest reciprocal age-of-air It should be noted that there was an increase in average wind speed from 26 mph to 41 mph starting at 1 pm including a half hour period where the average wind speed was 7 mph This weather effect produced noticeable kinks in the decay curves and therefore would be expected to introduce significant errors into the reciprocal age-of-air results
Itrsquos possible that the transfer grilles played a much smaller role in providing a path for ventilation air than the supply ducts Because the air handler was not operating the ducts were not pressurized and were thus available as passive airflow conduits The resistance to air flow was probably smaller for the air ducts than for the transfer grilles depending on their size and the number of supply registers in each bedroom The existing door undercuts are also thought to have played a role The effect of ducts and door undercuts can be tested in the future by running separate tests with ducts and door undercuts taped over
copy buildingsciencecom
Figure 24 Transfer grilles over bedroom doors taped closed
29 of 49
Research Report - 0602
0
10
20
30
40
50
60
70
Co
nc
en
tra
tio
n (
mg
m3 )
Living
Entry
BR1
BR2
BR3
MBR
Mixing stopped
Mixing restarted
8 9 10 11 12 13 14 15 16 17
Hour
Figure 25 Tracer gas decay for 1-story house with exhaust ventilation from the laundry room at ASHRAE 622 level no central fan operation bedroom doors closed and transfer
grilles taped (Test A10)
Exhaust Ventilation
000
005
010
015
020
025
Re
cip
roc
al
Ag
e o
f A
ir (
1h
r)
Living
Entry
BR1
BR2
BR3
MBR
Transfer Grilles Untaped vs Taped
Exhaust in laundry room no Exhaust in laundry room no
mixing 100 ASHRAE mixing 100 ASHRAE
doors closed doors closed transfer
grilles taped
Figure 26 Reciprocal age-of-air for 1-story house with exhaust ventilation from the laundry room at ASHRAE 622 level no central fan operation and doors closed In the
30 of 49
Research Report - 0602
first case the transfer grilles are untaped (Test A3) in the second they are taped closed (Test A10)
Minimum Test Duration
We were fortunate that DR Horton provided two full weeks of access to these homes to conduct this series of tests which allowed us to run some of the more important tracer gas decay tests as long as 12 hours to help ensure that we could accurately calculate reciprocal age-of-air In most cases test houses would not be available for such a long time period To evaluate the length of time needed to estimate the reciprocal age-of-air with reasonable accuracy we examined the results that we would have obtained for one of the exhaust ventilation tests had we halted the test period after less than 12 hours For the supply ventilation tests the rooms were sufficiently well-mixed that the test could have been stopped after 3 or 4 hours assuming weather effects were steady
The reciprocal age-of-air calculations for the exhaust ventilation decay curves (Test A3 see Figure 12) based on test durations of 3 6 9 and 12 hours are shown in Figure 27 These test durations range from 053 to 21 air changes based on the average air change rate of 018 ACH (56 hours per air change) calculated for this test The ratio of highest to lowest reciprocal ageshyof-air is shown above the data points for each case These results suggest that shorter tests tend to overestimate the range and that perhaps 1frac12-2 air changes (roughly 9 to 12 hours in this case) may be necessary to obtain accurate calculations of reciprocal age-of-air when there is significant divergence among rooms From a qualitative standpoint one air change may be sufficient to determine the basic trend Without knowing in advance what mixing pattern will occur it is difficult to recommend a minimum test duration But assuming this test is fairly representative of a worst-case scenario a minimum of 15 air changes would be necessary to have a high degree of confidence in the quantitative difference in reciprocal age-of-air among rooms
31 of 49
Research Report - 0602
000
005
010
015
020
025
030
035
Re
cip
roc
al
Ag
e-O
f-A
ir (
hr-1
)
Living
Entry
BR1
BR2
BR3
MBR HighLow = 297
HighLow = 168 HighLow = 184 HighLow = 161
3-hour Test 6-hour Test 9-hour Test 12-hour Test
(053 Air Changes) (11 Air Changes) (16 Air Changes) (21 Air Changes)
Test Duration
Figure 27 Reciprocal age-of-air based on alternate test durations for 1-story house with exhaust ventilation from the laundry room at ASHRAE 622 level no central fan operation
and doors closed (Test A3) Average air change rate was 018 ACH
TEST RESULTS FROM 2-STORY HOUSE (1117 MONTAGUE)
The 2-story house was tested from January 3-10 2006 Three zones were selected on the first floor and three more were selected on the second floor as indicated by the red stars in Figure 4 The initial mixing of air among the rooms at the start of each test in this 2-story house was not as thorough as it was in the 1-story house Evidently the combined effects of the air handler and the portable de-stratification fan were not sufficient to overcome upward transport of tracer gas driven by the stack effect from the first to the second floor The resulting difference in initial tracer gas concentration among the rooms was about 5-10 This outcome emphasizes the significant effect of stack-driven infiltration on ventilation non-uniformity in multi-story homes Because our test method and equipment did not achieve a well-mixed condition at the start of each test there were some errors introduced into the reciprocal age-of-air analysis For future tests we would recommend larger de-stratification fans to obtain more well-mixed conditions in multi-story houses
Typical errors introduced by incomplete mixing of the tracer gas at the start of such a test were analyzed by examining two hypothetical cases where either all of the air entering a room comes from the outside or all of the air comes from an adjacent room with a different starting concentration If all of the air entering a space comes from the outside then a change in the initial concentration would have no effect on the reciprocal age-of-air because the decay curve would be exponential from the start and the area under the curve would be normalized based on
32 of 49
Research Report - 0602
the starting concentration in that zone However if the air entering a room passes through another room with a lower initial concentration the room receiving the air will have a lower concentration of tracer gas throughout the test compared to what the concentration would have been if the starting points were the same in both rooms This case is illustrated in Figure 28 where assumptions are made that the rooms are the same size the air exchange rate is 01 ACH for both rooms and the initial tracer gas concentration is 10 lower in the first room (upstream) than it is in the second room
The effect on reciprocal age-of-air is shown in Figure 29 A 10 difference in starting concentration results in an error of about 75 in reciprocal age-of-air for a room downstream of a room with a lower starting concentration assuming 01 ACH for both rooms The error would be somewhat smaller (about 5) if the air change rate was higher for both rooms (02 ACH) There would be no error introduced for rooms where all of the air infiltration comes from the outside Although the amount of error in the reciprocal age-of-air calculations can be affected by additional variables not examined here we feel that these percentages are reasonable estimates of the errors in our results for the 2-story house due to incomplete initial mixing of air
In each case an engineering judgment must be made regarding the significance of the error introduced by incomplete initial mixing As a general rule the differences in concentration at the start of the test should be small compared to the differences that are being measured in order for the results to be considered valid
Figure 28 Theoretical decay curves for a well-mixed case with uniform tracer gas concentration compared to a case where the upstream room starts with a concentration
10 lower than the downstream room
33 of 49
Research Report - 0602
Figure 29 Theoretical reciprocal age-of-air for a well-mixed case with uniform tracer gas concentration compared to a case where the upstream room starts with a concentration
10 lower than the downstream room
Natural Infiltration and Duct Leakage
A natural infiltration test was performed over a two hour period on the evening of January 8 (Test B14) The tracer gas decay curves are shown in Figure 30 There was a slight divergence between the first floor and second floor once the air handler was turned off but the rooms on each floor appeared to remain fairly well-mixed The average air change rate during the test period was about 011 ACH which was somewhat higher than the 1-story house as might be expected with an increased stack height
An air handler bedroom door bump test was conducted just prior to the test period shown in Figure 30 allowing observation of the combined effect of duct leakage to the outside and increased infiltration caused by room pressurization The average air change rate during that bump test was 013 ACH suggesting that closing doors and operating the fan added approximately 002 ACH to the whole-house average air change rate The average wind speed was a bit higher while the air handler was running (17 mph compared to 05 mph) so the effect of air handler operation may actually be somewhat less than the average ACH numbers indicate
34 of 49
Research Report - 0602
0
1
2
3
4
SF
6 C
on
ce
ntr
ati
on
(m
gm
3)
BR1
Living
Kitchen
BR2
BR3
MBR
Mixing stopped
Mixing restarted
1814 1843 1912 1940 2009 2038 2107 2136
Hour
Figure 30 Tracer gas decay for 2-story house with no ventilation no central fan operation and bedroom doors open (Test B14)
Distributed Supply vs Point Exhaust Ventilation
A 14-hour test (Test B1) was performed with an exhaust ventilation rate of 63 cfm in the laundry room which was located near the stairwell in the middle of the first floor The ventilation rate was again consistent with the ASHRAE 622 recommendations The tracer gas decay curves are shown in Figure 31 It is interesting that all three second floor rooms showed a delay before entering an exponential decay suggesting that some amount of air was moving from the first floor to the second floor even though the mechanical exhaust point was on the first floor It appears that the further depressurization of the first floor was insufficient to overcome the stack effect and draw a significant amount of outside air in through the rooms on the second floor
35 of 49
Research Report - 0602
182
9
192
9
202
9
212
9
222
9
232
9
029
129
229
329
429
529
629
729
828
929
102
8
112
8
122
8
0
10
20
30
40
50
60
70
SF
6 C
on
ce
ntr
ati
on
(m
gm
3)
BR1
Living
Kitchen
BR2
BR3
MBR
Mixing stopped
Mixing restarted
Hour
Figure 31 Tracer gas decay for 2-story house with exhaust ventilation from the laundry room at ASHRAE 622 level no central fan operation and bedroom doors closed (Test B1)
A supply ventilation test was performed on the 2-story house for about 11 hours starting late on January 4 (Test B3) The duct blaster was unable to provide the ventilation rate necessary to meet the minimum specified in ASHRAE 622 supplying 180 cfm instead of 189 cfm (95) The decay curves are shown in Figure 32 Although the curves are much more tightly packed than they were with the exhaust system there is more divergence than we saw with the supply system in the 1-story house most notably in the master bedroom
The reciprocal age-of-air calculations for both the exhaust and supply ventilation systems are shown in Figure 33 Again the results indicate that much better room-to-room distribution of ventilation air was achieved by the central-fan integrated supply system compared to the single-point exhaust system However for the supply ventilation test the differences in the initial tracer gas concentration were of the same magnitude as the differences in decay rates among the rooms As a result no conclusions should be drawn about the relative ranking of the supply ventilation rate among rooms based on Figure 33
36 of 49
Research Report - 0602
0
10
20
30
40
50
60
SF
6 C
on
ce
ntr
ati
on
(m
gm
3)
BR1
Living
Kitchen
BR2
BR3
MBR
Mixing stopped
Mixing restarted
2136 000 224 448 712 936 1200
Hour
Figure 32 Tracer gas decay for 2-story house with supply ventilation just under ASHRAE 622 level central fan operation at 33 duty cycle (20 min off 10 min on) and bedroom
doors closed (Test B3)
Simple Exhaust vs Central Fan Integrated
Supply )
000
005
010
015
020
025
Recip
rocal A
ge o
f A
ir (
1h
r
BR1
Living
Kitchen
BR2
BR3
MBR
Exhaust in laundry room no Centralized supply mixing
mixing 100 ASHRAE 33 duty cycle 95
doors closed ASHRAE doors closed
Figure 33 Reciprocal age-of-air for 2-story house with continuous exhaust ventilation (Test B1) compared to central fan integrated supply ventilation (Test B3) (Note
Uncertainties introduced by non-uniform starting concentration are of the same order of magnitude as the differences in reciprocal age-of-air among rooms for the supply ventilation case The relative ranking of rooms is not meaningful for that case)
37 of 49
Research Report - 0602
Air Handler Operation
The effect of occasional air handler operation on the distribution of exhaust ventilation air was evaluated on the afternoon of January 6 (Test B6) The tracer gas decay curves are shown in Figure 34 and reciprocal age-of-air calculations are shown in Figure 35 It should again be noted that before the test started the house was mixed using both the air handler and a de-stratification fan with the doors open During the test the doors were closed the de-stratification fan was turned off and the air handler operated at a 33 duty cycle (20 minutes off 10 minutes on) As was the case in the 1-story house this occasional operation of the air handler substantially improved the distribution of ventilation air among rooms even in conjunction with the point exhaust ventilation system There was very little divergence noticeable even with the air handler cycling on and off every half hour However because the initial differences in tracer gas concentration among rooms were as large as the differences in reciprocal age-of-air for the case with air handler operation no conclusions should be drawn about the relative ranking of ventilation rates among the rooms for that case
SF
6 C
on
cen
trati
on
(m
gm
3)
80
70
60
50
40
30
20
10
0
BR1
Living
Kitchen
BR2
BR3
MBR
Mixing stopped
Mixing restarted
1048 1200 1312 1424 1536 1648 1800 1912 2024
Hour
Figure 34 Tracer gas decay for 2-story house with continuous exhaust ventilation at ASHRAE 622 level central fan operation at 33 duty cycle (20 min off 10 min on) and
bedroom doors closed (Test B6)
38 of 49
Research Report - 0602
020
015 R
ec
ipro
ca
l A
ge
of
Air
(1
hr)
Exhaust Ventilation
No Mixing vs 33 Air Handler Duty Cycle
Exhaust in laundry room
no mixing 100
ASHRAE doors closed
33 air handler
operation exhaust in
laundry room 100
ASHRAE doors closed
BR1
Living
Kitchen
BR2
BR3
MBR
010
005
000
Figure 35 Reciprocal age-of-air for 2-story house with continuous exhaust ventilation with and without air handler operation (Tests B1 and B6) (Note Uncertainties introduced by non-uniform starting concentration are of the same order of magnitude as the differences in reciprocal age-of-air among rooms for the case with air handler operation The relative
ranking of rooms is not meaningful for that case)
Exhaust Location
The duct blaster was moved to the master bathroom exhaust register to see if there was a resulting change in ventilation air distribution (Test B18) The master bathroom was in the back of the house on the second floor between the master bedroom and bedroom 3 The decay curves are shown in Figure 36 and the reciprocal age-of-air results are shown in Figure 37 The rooms on each floor were well mixed before the test began although the mixing between the two floors was not as good Very wide divergence among rooms can be seen during the test especially between the upstairs bedrooms and the rest of the house Once again all three upstairs rooms appear to receive some air from the first floor but the master bedroom experiences a much higher volume of circulated air than the other two second-floor bedrooms which appear to be relatively stagnant
39 of 49
Research Report - 0602
0
10
20
30
40
50
60
70
80
90
SF
6 C
on
ce
ntr
ati
on
(m
gm
3)
BR1
Living
Kitchen
BR2
BR3
MBR
Mixing stopped
Mixing restarted
1912 2136 000 224 448 712 936 1200
Hour
Figure 36 Tracer gas decay for 2-story house with exhaust ventilation from the master bathroom at ASHRAE 622 level no central fan operation and bedroom doors closed (Test
B18)
Exhaust Ventilation
Laundry Room vs Master Bathroom
000
005
010
015
020
025
030
Exhaust in laundry room no
mixing 100 ASHRAE
doors closed
Exhaust in master bathroom
no mixing 100 ASHRAE
doors closed
Re
cip
roc
al A
ge
of
Air
(1
hr)
BR1
Living
Kitchen
BR2
BR3
MBR
Figure 37 Reciprocal age-of-air for 2-story house with exhaust ventilation from the master bathroom compared to the laundry room at ASHRAE 622 level no central fan operation
and bedroom doors closed (Tests B1 and B18)
40 of 49
Research Report - 0602
Ventilation Rate
The supply ventilation tests were repeated using flow rates of 60 and 33 of ASHRAE 622 recommendations corresponding to 114 cfm and 63 cfm respectively (Tests B2 and B4) The decay curves are shown in Figures 38 and 39 Reciprocal age-of-air for all three supply ventilation rates are shown in Figure 40 In all cases the rooms remained fairly well mixed especially rooms on the same floor As we observed in the 1-story house the ventilation rate in the 2-story house appeared to have very little effect on the uniformity of outside air provided to each room as long as it was mixed using the air handler One again the initial differences in tracer gas concentration among rooms were as large as the divergence in the decay curves preventing any conclusions about the relative ranking of ventilation rates among rooms for all three cases The error in initial concentration uniformity was bigger for the cases with air handler mixing because the relative divergence in the decay curves was so small compared to that of no air handler mixing In other words the error in relative ranking of ventilation rates for the cases with air handler mixing were not very important anyway because the relative differences between rooms were so small
1536 1648 1800 1912 2024 2136 2248
Hour
Figure 38 Tracer gas decay for 2-story house with supply ventilation at 60 of ASHRAE 622 level 33 central fan operation (20 min off 10 min on) and bedroom doors closed
(Test B2)
0
5
10
15
20
25
30
SF
6 C
on
cen
trati
on
(m
gm
3)
BR1 Living Kitchen BR2 BR3 MBR
Mixing stopped
Mixing restarted
41 of 49
Research Report - 0602
0
5
10
15
20
25
30
35
40
SF
6 C
on
cen
trati
on
(m
gm
3)
BR1
Living
Kitchen
BR2
BR3
MBR
Mixing stopped
Mixing restarted
1200 1312 1424 1536 1648 1800 1912
Hour
Figure 39 Tracer gas decay for 2-story house with supply ventilation at 33 of ASHRAE 622 level 33 central fan operation (20 min off 10 min on) and bedroom doors closed
(Test B4)
Supply Ventilation Rate Comparison
000
005
010
015
020
025
Re
cip
roc
al
Ag
e o
f A
ir (
1h
r)
BR1
Living
Kitchen
BR2
BR3
MBR
Centralized supply Centralized supply Centralized supply
mixing 33 duty mixing 33 duty mixing 33 duty
cycle 95 ASHRAE cycle 60 ASHRAE cycle 33 ASHRAE
doors closed doors closed doors closed
Figure 40 Reciprocal age-of-air for 2-story house with three levels of supply ventilation central fan operation at 33 duty cycle (20 min off 10 min on) and bedroom doors closed (Tests B3 B2 B4) (Note Uncertainties introduced by non-uniform starting
concentration are of the same order of magnitude as the differences in reciprocal age-of-air among rooms for all three cases The relative ranking of rooms is not meaningful for these
cases)
42 of 49
Research Report - 0602
The average air change rates for the three supply ventilation rates compared to the two exhaust ventilation schemes are shown in Figure 41 The CFIS system at 33 of the 622 ventilation flow rate provided a uniformly higher air change rate (013 ach) than the least ventilated rooms using exhaust ventilation from either the laundry or the master bathroom (010 ach Figure 37) It is noteworthy that the combined net air change rate with exhaust ventilation from the laundry room was significantly less than the air change rates for both exhaust ventilation from the master bathroom and supply ventilation at the air handler This illustrates the unpredictability of interactions between mechanical ventilation and natural infiltration which depend strongly on the distribution and size of cracks through which the outside air must pass to enter the house There may have been a relatively large building enclosure leakage opening near the laundry room (perhaps the utility penetrations or the door to the garage) that allowed a significant amount of outside air to quickly enter and leave the house through the exhaust flow without circulating around the house
0
005
01
015
02
025
Ave
rag
e A
CH
Natural Exhaust Exhaust Supply 95 Supply 60 Supply 33
Laundry Mbath
Rm 100 100
Figure 41 Average air change rates for 2-story house with supply ventilation at 33 60 and 95 of ASHRAE 622 recommendations (Tests B4 B2 B3) compared to natural
infiltration (Test B14) and exhaust ventilation with no central fan operation (Test B1) Bedroom doors were closed except for the natural infiltration test
Bedroom Doors
The laundry room exhaust ventilation test with no air handler operation (see Figure 31) was repeated with the doors open to evaluate the change in room-to-room ventilation air distribution (Test B10) The decay curves are shown in Figure 42 and the reciprocal age-of air calculations are shown in Figure 43 It is evident from Figure 42 that the test began before the rooms were
43 of 49
Research Report - 0602
0
5
10
15
20
25
SF
6 C
on
ce
ntr
ati
on
(m
gm
3)
BR1 Living Kitchen BR2 BR3 MBR
Mixing stopped
Mixing restarted
completely well mixed resulting in decay curves that could be somewhat misleading Because the master bedroom was at a higher concentration than the other rooms at the start of the test any room that received air from the master bedroom would appear to have a slower decay rate than it would have if the rooms started out at the same concentration Despite the difference in starting concentration it is clear that outside air was well distributed when the doors were open even without operation of the air handler
1843 1912 1940 2009 2038 2107 2136 2204 2233 2302
Hour
Figure 42 Tracer gas decay for the 2-story house with exhaust ventilation from the laundry room at ASHRAE 622 level no central fan operation and bedroom doors open
(Test B10)
Reciprocal age-of-air analysis was not performed for this case because of the combined effect of a short test duration (~2 hours) and unequal starting tracer gas concentrations even though the house was relatively well-mixed The important conclusion (that opening doors greatly improves mixing) can be drawn by inspecting the decay curves alone
Transfer Grilles
A final exhaust ventilation test was run on the 2-story house with the doors closed and the transfer grilles taped over The decay curves are shown in Figure 43 and the reciprocal age-ofshyair calculations are shown in Figure 44 The curves were clearly very divergent even after 12 hours By examining the reciprocal age-of-air results it is apparent that the transfer grilles in the 2-story house caused a noticeable improvement in ventilation air distribution but the improvement was smaller than when the doors were opened (Figure 42)
44 of 49
Research Report - 0602
0
5
10
15
20
25
30
SF
6 C
on
cen
tra
tio
n (
mg
m3
) BR1 Living Kitchen BR2 BR3 MBR
Mixing stopped
Mixing restarted
1648 1912 2136 000 224 448 712 936
Hour
Figure 43 Tracer gas decay for 2-story house with exhaust ventilation from the laundry room at ASHRAE 622 level no central fan operation bedroom doors closed transfer
grilles taped closed (Test B7)
Exhaust Ventilation Transfer Grilles Untaped vs Taped
000
005
010
015
020
Re
cip
roc
al
Ag
e o
f A
ir (
1h
r)
BR1
Living
Kitchen
BR2
BR3
MBR
Exhaust in laundry room no Exhaust in laundry room no
mixing 100 ASHRAE mixing 100 ASHRAE
doors closed doors closed transfer
grilles taped
Figure 44 Reciprocal age-of-air for 2-story house with exhaust ventilation from the laundry room at ASHRAE 622 level no central fan operation and doors closed In the first case the transfer grilles are untaped (Test B3) in the second they are taped closed
(Test B7)
45 of 49
Research Report - 0602
CONCLUSIONS
bull Reciprocal age-of-air analysis was chosen as a quantitative method for characterizing distribution of ventilation air among rooms This method worked well in cases where rooms were well mixed to begin the test and weather conditions were sufficiently steady-state
bull A test period of at least 1frac12 air changes was necessary to obtain reasonably accurate ageshyof-air results when there was significant divergence in tracer gas concentration among the rooms
bull Although we did not achieve uniform initial concentration of tracer gas in the 2-story house using our test methodology and the equipment at hand we believe the reciprocal age-of-air calculations were meaningful in many of the cases as indicated in the discussion
bull Both houses were relatively tight with natural infiltration averaging 008 ACH for the 1shystory house and 011 ACH for the 2-story house
bull Both houses had relatively small (but not negligible) duct losses to the outside producing an increase in infiltration of less than 003 ACH for the 1-story house and 002 ACH for the 2-story house when the air handler runs
bull Age-of-air analysis indicated that ventilation supplied through the central air distribution system provided much more uniform distribution of ventilation air than the single-point exhaust system when the doors were closed and the air handler was not running For the 1-story house the central-fan-integrated supply ventilation case at 60 of ASHRAE 622 provided more outside air to all rooms than the least-ventilated room in the exhaust case at 100 of 622 For the 2-story house the central-fan-integrated supply system at 33 of the 622 flow rate provided more outside air to all rooms than the least ventilated rooms using exhaust ventilation at 100 of 622 from either the laundry or the master bathroom
bull Operation of the central fan at a 33 duty cycle maintained relatively well-mixed conditions regardless of ventilation rate type of ventilation system (supply or exhaust) or house configuration (1-story or 2-story)
bull Exhaust location affected both the relative amount of outside air received by different rooms and the overall uniformity among rooms but the effect was not predictable
bull For exhaust-only ventilation without central fan operation opening bedroom doors appeared to significantly improve the mixing of ventilation air among rooms
bull Transfer grilles improved the distribution of ventilation air slightly but much less than opening the bedroom doors
bull In the 2-story house the stack effect caused air movement from the first floor to the second floor even when exhaust ventilation was applied to the first floor resulting in consistently higher tracer gas concentrations on the second floor and more non-uniform ventilation air distribution in general
bull Interactions between natural infiltration and both exhaust and supply mechanical ventilation were very significant When the ventilation system was activated the combined air change rate did not increase commensurate with the measured ventilation rate but instead increased by only half that amount This result was consistent with combining ventilation and infiltration in quadrature to estimate whole-house air change rate in accordance with ASHRAE Standard 136 (ASHRAE 1993)
46 of 49
Research Report - 0602
FUTURE WORK
In future tests continuous monitoring of pressure differentials would enhance our understanding of the multi-zone combined infiltration and ventilation systems and our ability to model them That would help to explain differences between tests in more detail including the effects of multiple stories location of ventilation supply outlets and exhaust inlets interior door closure and use of passive return air transfer grilles Pressure differential measurement points should include
bull dP with respect to outside for each closed room and open space bull dP across closed interior doors bull dP between the floor cavity and outdoors and bull dP between the house and the attic
Measurement of wind direction along with wind speed could also be helpful for modeling these buildings and systems However because of micro-climate wind shielding it may be very difficult to relate a single-point wind direction measurement to actual wind vectors on the building surfaces
ACKNOWLEDGMENTS
The authors express their appreciation to Rich Coyle of DR Horton for providing the test houses and to Joseph Lstiburek of BSC Subrato Chandra and Neil Moyer of FSEC and Greg Barker of Mountain Energy Partnership for their assistance in the planning and execution of this ventilation study
47 of 49
Research Report - 0602
REFERENCES
ASHRAE (1993) ANSIASHRAE Standard 136-1993 A Method of Determining Air Change Rates in Detached Dwellings Atlanta GA American Society of Heating Refrigerating and Air-Conditioning Engineers Inc
ASHRAE (1997) ANSIASHRAE Standard 129-1997 Measuring Air-Change Effectiveness Atlanta GA American Society of Heating Refrigerating and Air-Conditioning Engineers Inc
ASHRAE (2004) ASHRAE Standard 622-2004 Ventilation and Acceptable Indoor Air Quality in Low-Rise Residential Buildings Atlanta GA American Society of Heating Refrigerating and Air-Conditioning Engineers Inc
CSA (2003) CANCSA F326-M91 Residential Mechanical Ventilation Systems Canadian Standards Association Ontario Canada httpwwwcsashyintlorgonlinestoreGetCatalogItemDetailsaspmat=2410793ampParent=102
NBC 2005 National Building Code of Canada httpircnrcshycnrcgccapubscodesnrcc47666_ehtml
Grieve PW (1991) Measuring Ventilation Using Tracer-Gases Denmark Bruumlel amp Kjaeligr
MN Chapter 7672 Minnesota Energy Code Chapter 7672 Detached Single-Family And Two-Family Dwellings httpwwwstatemnusmnexternalDocsCommerceChapter_7672_Residential_111302012428 _72rulepdf
Persily AK Martin SR (2000) A Modeling Study of Ventilation in Manufactured Houses Gaithersburg MD National Institute of Standards and Technology NISTIR 6455
Rudd A Lstiburek J (2000) ldquoMeasurement of Ventilation and Interzonal Distribution in Single-Family Homesrdquo ASHRAE Transactions 2000 MN-00-10-3 V 106 Pt2 American Society of Heating Refrigeration and Air-Conditioning Engineers Atlanta GA
WAC (2004) Washington State Title 51 WAC Community trade and economic development department of (building code council) Chapter 51-13 Ventilation and indoor air quality httpappslegwagovWACdefaultaspxcite=51-13
48 of 49
Research Report - 0602
Field test of room-to-room uniformity of ventilation air distribution in two new houses
About this Report
This report was prepared for the US Department of Energyrsquos Building America
Program The report is freely available to the public at wwwbuildingamericagov
The authors express their appreciation to Rich Coyle of DR Horton for providing the test houses and to Joseph Lstiburek of BSC Subrato Chandra and Neil Moyer of
FSEC and Greg Barker of Mountain Energy Partnership for their assistance in the planning and execution of this ventilation study
About the Authors
Robert Hendron Ren Anderson Dennis Barley are with National Renewable Energy Laboratory Armin Rudd and Aaron Townsend are with Building Science Corporation
Ed Hancock is with Mountain Energy Partnership
Direct all correspondence to Building Science Corporation 30 Forest Street Somerville MA 02143
Limits of Liability and Disclaimer of Warranty
Building Science documents are intended for professionals The author and the publisher of this article have used their best efforts to provide accurate and authoritative information in regard to the subject matter covered The author and publisher make no warranty of any kind expressed or implied with regard to the information contained in this article
The information presented in this article must be used with care by professionals who understand the implications of what they are doing If professional advice or other expert assistance is required the services of a competent professional shall be sought The author and publisher shall not be liable in the event of incidental or consequential damages in connection with or arising from the use of the information contained within this Building Science document
49 of 49
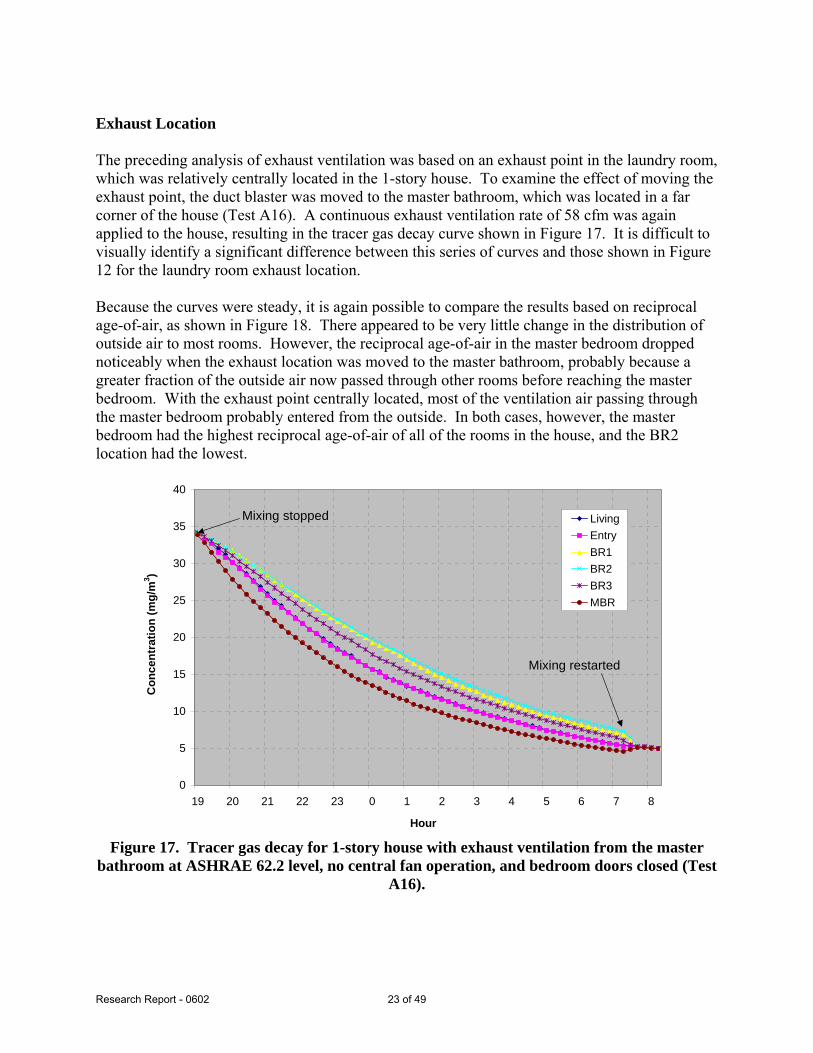
Research Report - 0602
Exhaust Location
The preceding analysis of exhaust ventilation was based on an exhaust point in the laundry room which was relatively centrally located in the 1-story house To examine the effect of moving the exhaust point the duct blaster was moved to the master bathroom which was located in a far corner of the house (Test A16) A continuous exhaust ventilation rate of 58 cfm was again applied to the house resulting in the tracer gas decay curve shown in Figure 17 It is difficult to visually identify a significant difference between this series of curves and those shown in Figure 12 for the laundry room exhaust location
Because the curves were steady it is again possible to compare the results based on reciprocal age-of-air as shown in Figure 18 There appeared to be very little change in the distribution of outside air to most rooms However the reciprocal age-of-air in the master bedroom dropped noticeably when the exhaust location was moved to the master bathroom probably because a greater fraction of the outside air now passed through other rooms before reaching the master bedroom With the exhaust point centrally located most of the ventilation air passing through the master bedroom probably entered from the outside In both cases however the master bedroom had the highest reciprocal age-of-air of all of the rooms in the house and the BR2 location had the lowest
Co
nc
en
tra
tio
n (
mg
m3)
40
35
30
25
20
15
10
5
0
Living
Entry
BR1
BR2
BR3
MBR
Mixing stopped
Mixing restarted
19 20 21 22 23 0 1 2 3 4 5 6 7 8
Hour
Figure 17 Tracer gas decay for 1-story house with exhaust ventilation from the master bathroom at ASHRAE 622 level no central fan operation and bedroom doors closed (Test
A16)
23 of 49
Research Report - 0602
Exhaust Ventilation
Laundry Room vs Master Bathroom
000
005
010
015
020
025
Exhaust in laundry
room no mixing 100
ASHRAE doors closed
Exhaust in master
bathroom no mixing
100 ASHRAE doors
closed
Re
cip
roc
al A
ge
of
Air
(1
hr)
Living
Entry
BR1
BR2
BR3
MBR
Figure 18 Reciprocal age-of-air for 1-story house with exhaust ventilation from the master bathroom compared to the laundry room at ASHRAE 622 level no central fan operation
and bedroom doors closed (Tests A3 and A16)
Ventilation Rate
The supply ventilation test was repeated using flow rates corresponding to 60 and 33 of the ASHRAE recommendations The intent of this series of tests was to evaluate the room-to-room ventilation uniformity for ventilation rates consistent with ASHRAE 622 compared to the uniformity for reduced mechanical ventilation rates Each test was conducted for only 4 hours because of time limitations The decay curves are shown in Figures 19 and 20 Because the rooms were well-mixed during the supply ventilation tests the average whole-house ACH can be compared directly to the reciprocal age-of-air for the exhaust ventilation tests Figure 21 shows the supply ventilation air change rate for each of the three ventilation levels (33 60 100) compared to room-by-room reciprocal age-of-air for the exhaust ventilation system based on the boundary conditions present during the tests It appears that in the supply ventilation case all rooms receive more outside air than the least-ventilated room in the exhaust case (BR2) even at 60 of ASHRAE 622 These results serve to illustrate the trade-off between whole-house ventilation rate and room-to-room ventilation uniformity in terms of their impact on the worst room(s)
24 of 49
Research Report - 0602
The ASHRAE 622 committee has not currently defined the level of mixing that is required when choosing the minimum ventilation rate Some might interpret the results of this test to suggest that a house without mixing can have individual rooms that do not receive sufficient outside air even though the ventilation system is operating at 622 specified rates Because the 622 committee has not specified the level of mixing that is required when choosing the minimum ventilation rate the ventilation rate required by different ventilation systems is open to interpretation For example if the exhaust system performance shown in Figure 21 is acceptable does this mean that a ventilation system that provides good distribution of outside air may be sufficiently well-ventilated at 60 of the ASHRAE 622 level or perhaps even less Alternatively it might be concluded that exhaust ventilation rates should be increased over current ASHRAE 622 recommendations because of the possibility that certain rooms may receive very little fresh air Unfortunately because the current 622 standard does not specify air mixing requirements and the committeersquos assumptions about ventilation air distribution are not well documented it is difficult to make any firm recommendations in this area However we can conclude that air mixing is required for dilution ventilation systems to provide predictable results independent of the geometry of individual homes
8 9 10 11 12 13 14
Hour
Figure 19 Tracer gas decay for 1-story house with supply ventilation at 60 of ASHRAE 622 level 33 central fan operation (20 min off 10 min on) and bedroom doors closed
(Test A4)
0
10
20
30
40
50
60
Co
nce
ntr
ati
on
m
gm
3
Living
Entry
BR1
BR2
BR3
MBR
Mixing stopped
Mixing restarted
25 of 49
Research Report - 0602
0
5
10
15
20
25
30
Co
nce
ntr
ati
on
(m
gm
3 )
Living
Entry
BR1
BR2
BR3
MBR
Mixing stopped
Mixing restarted
12 13 14 15 16 17 18 19 20
Hour
Figure 20 Tracer gas decay for 1-story house with supply ventilation at 33 of ASHRAE 622 level 33 central fan operation (20 min off 10 min on) and bedroom doors closed
(Test A5)
Simple Exhaust vs Central Fan Integrated
Supply with Lower Ventilation Rates
025
Re
cip
roc
al A
ge
of
Air
(1
hr)
Well Mixed
100
ASHRAE 60
ASHRAE 33
ASHRAE Living Entry 010 Natural
BR1 Infilt
BR2 BR3 005
MBR
Exhaust in laundry room no
000
Central supply Natural infil-
mixing 100 ASHRAE doors mixing 33 duty tration doors
closed cycle doors closed open
Figure 21 Reciprocal age-of-air for 1-story house with supply ventilation at 33 60 and 100 of ASHRAE 622 level (Tests A5 A4 A6) compared to exhaust ventilation with
no central fan operation (Test A3) Bedroom doors were closed
020
015
26 of 49
Research Report - 0602
Simulations by Walker (2006) have shown that all systems will not provide the same service in terms of annual average air change rate For the same air flow rate and duty cycle balanced ventilation will yield a higher average air exchange than supply ventilation and supply ventilation will yield a higher average air exchange than exhaust ventilation That can be explained in general terms by understanding that wind and stack effects act to depressurize a building most of the time Exhaust fans increase the building depressurization further but supply fans decrease the depressurization Balanced fans donrsquot change the enclosure differential pressure and air flow at all Because of the non-linear relationship between differential pressure and air flows across the building enclosure a supply fan changes the pressures across the enclosure less than an exhaust fan acting more like a balanced fan The result is that the effect on ventilation air change rate from a supply fan is somewhere between that of an exhaust fan and a true balanced system
Bedroom Doors
Except for the natural ventilation test the preceding tests were all conducted with the bedroom doors closed to simulate a worst-case situation for air circulation within the house The exhaust ventilation test was repeated with the bedroom doors open (Test A9) producing the tracer gas decay curve shown in Figure 22 It is evident that the decay curves were much more tightly bundled with the doors open than they were with the doors closed (compare Figure 12) A comparison based on reciprocal age-of-air is shown in Figure 23 A significant improvement in room-to-room mixing is evident during the open-door test
It is also evident that the average air change rate was higher when the doors were open (0202 vs 0176 ACH) but it must be remembered that the ventilation rate was controlled using a duct blaster and average wind speed was higher during the open-door test period compared to the closed-door test period (20 mph compared to 06 mph) Therefore this test alone does not necessarily indicate that closing doors reduces the average air change rate associated with an exhaust system In future tests continuous measurement of the depressurization of the house with respect to outside along with single-point pressure measurements across interior doors would provide more information about the effect of closing doors when exhaust ventilation systems are used It would also be valuable to conduct this test during steady weather conditions using the exhaust fan (with uncontrolled ventilation rate) instead of the duct blaster to observe the net effect of closed doors on whole-house air change rate
27 of 49
Research Report - 0602
0
5
10
15
20
25
30
Co
ncen
trati
on
(m
gm
3 )
Living
Entry
BR1
BR2
BR3
MBR
Mixing stopped
Mixing restarted
181 191 201 211 221 231 01 11 21 31 41 51 61 71
Hour
Figure 22 Tracer gas decay for 1-story house with exhaust ventilation from the laundry room at ASHRAE 622 level no central fan operation and bedroom doors open (Test A9)
Exhaust Ventilation
Doors Closed vs Doors Open
000
005
010
015
020
025
Re
cip
roc
al
Ag
e o
f A
ir (
1h
r)
Living
Entry
BR1
BR2
BR3
MBR
Exhaust in laundry room Doors open no mixing
no mixing 100 exhaust in laundry room
ASHRAE doors closed 100 ASHRAE
Figure 23 Reciprocal age-of-air for 1-story house with exhaust ventilation from the laundry room at ASHRAE 622 level no central fan operation In the first case the bedroom doors were closed (Test A3) in the second the doors were open (Test A9)
28 of 49
Research Report - 0602
Transfer Grilles
Because the test houses used central returns instead of hard ducted returns in the bedrooms transfer grilles were installed over the bedroom doors to provide a flow path for return air without excessive room pressurization when the doors were closed These transfer grilles also allowed ventilation air to pass more freely from the bedrooms to the main living space The effect of transfer grilles on ventilation air distribution was evaluated by taping over the grilles (see Figure 24) and re-running the exhaust ventilation test (Test A10) The corresponding tracer gas decay curve is shown in Figure 25 and the reciprocal age-of-air analysis is shown in Figure 26 Taping the transfer grilles did not appear to significantly affect the room-to-room variability in ventilation rate although there appeared to be some slight re-ranking of rooms from highest to lowest reciprocal age-of-air It should be noted that there was an increase in average wind speed from 26 mph to 41 mph starting at 1 pm including a half hour period where the average wind speed was 7 mph This weather effect produced noticeable kinks in the decay curves and therefore would be expected to introduce significant errors into the reciprocal age-of-air results
Itrsquos possible that the transfer grilles played a much smaller role in providing a path for ventilation air than the supply ducts Because the air handler was not operating the ducts were not pressurized and were thus available as passive airflow conduits The resistance to air flow was probably smaller for the air ducts than for the transfer grilles depending on their size and the number of supply registers in each bedroom The existing door undercuts are also thought to have played a role The effect of ducts and door undercuts can be tested in the future by running separate tests with ducts and door undercuts taped over
copy buildingsciencecom
Figure 24 Transfer grilles over bedroom doors taped closed
29 of 49
Research Report - 0602
0
10
20
30
40
50
60
70
Co
nc
en
tra
tio
n (
mg
m3 )
Living
Entry
BR1
BR2
BR3
MBR
Mixing stopped
Mixing restarted
8 9 10 11 12 13 14 15 16 17
Hour
Figure 25 Tracer gas decay for 1-story house with exhaust ventilation from the laundry room at ASHRAE 622 level no central fan operation bedroom doors closed and transfer
grilles taped (Test A10)
Exhaust Ventilation
000
005
010
015
020
025
Re
cip
roc
al
Ag
e o
f A
ir (
1h
r)
Living
Entry
BR1
BR2
BR3
MBR
Transfer Grilles Untaped vs Taped
Exhaust in laundry room no Exhaust in laundry room no
mixing 100 ASHRAE mixing 100 ASHRAE
doors closed doors closed transfer
grilles taped
Figure 26 Reciprocal age-of-air for 1-story house with exhaust ventilation from the laundry room at ASHRAE 622 level no central fan operation and doors closed In the
30 of 49
Research Report - 0602
first case the transfer grilles are untaped (Test A3) in the second they are taped closed (Test A10)
Minimum Test Duration
We were fortunate that DR Horton provided two full weeks of access to these homes to conduct this series of tests which allowed us to run some of the more important tracer gas decay tests as long as 12 hours to help ensure that we could accurately calculate reciprocal age-of-air In most cases test houses would not be available for such a long time period To evaluate the length of time needed to estimate the reciprocal age-of-air with reasonable accuracy we examined the results that we would have obtained for one of the exhaust ventilation tests had we halted the test period after less than 12 hours For the supply ventilation tests the rooms were sufficiently well-mixed that the test could have been stopped after 3 or 4 hours assuming weather effects were steady
The reciprocal age-of-air calculations for the exhaust ventilation decay curves (Test A3 see Figure 12) based on test durations of 3 6 9 and 12 hours are shown in Figure 27 These test durations range from 053 to 21 air changes based on the average air change rate of 018 ACH (56 hours per air change) calculated for this test The ratio of highest to lowest reciprocal ageshyof-air is shown above the data points for each case These results suggest that shorter tests tend to overestimate the range and that perhaps 1frac12-2 air changes (roughly 9 to 12 hours in this case) may be necessary to obtain accurate calculations of reciprocal age-of-air when there is significant divergence among rooms From a qualitative standpoint one air change may be sufficient to determine the basic trend Without knowing in advance what mixing pattern will occur it is difficult to recommend a minimum test duration But assuming this test is fairly representative of a worst-case scenario a minimum of 15 air changes would be necessary to have a high degree of confidence in the quantitative difference in reciprocal age-of-air among rooms
31 of 49
Research Report - 0602
000
005
010
015
020
025
030
035
Re
cip
roc
al
Ag
e-O
f-A
ir (
hr-1
)
Living
Entry
BR1
BR2
BR3
MBR HighLow = 297
HighLow = 168 HighLow = 184 HighLow = 161
3-hour Test 6-hour Test 9-hour Test 12-hour Test
(053 Air Changes) (11 Air Changes) (16 Air Changes) (21 Air Changes)
Test Duration
Figure 27 Reciprocal age-of-air based on alternate test durations for 1-story house with exhaust ventilation from the laundry room at ASHRAE 622 level no central fan operation
and doors closed (Test A3) Average air change rate was 018 ACH
TEST RESULTS FROM 2-STORY HOUSE (1117 MONTAGUE)
The 2-story house was tested from January 3-10 2006 Three zones were selected on the first floor and three more were selected on the second floor as indicated by the red stars in Figure 4 The initial mixing of air among the rooms at the start of each test in this 2-story house was not as thorough as it was in the 1-story house Evidently the combined effects of the air handler and the portable de-stratification fan were not sufficient to overcome upward transport of tracer gas driven by the stack effect from the first to the second floor The resulting difference in initial tracer gas concentration among the rooms was about 5-10 This outcome emphasizes the significant effect of stack-driven infiltration on ventilation non-uniformity in multi-story homes Because our test method and equipment did not achieve a well-mixed condition at the start of each test there were some errors introduced into the reciprocal age-of-air analysis For future tests we would recommend larger de-stratification fans to obtain more well-mixed conditions in multi-story houses
Typical errors introduced by incomplete mixing of the tracer gas at the start of such a test were analyzed by examining two hypothetical cases where either all of the air entering a room comes from the outside or all of the air comes from an adjacent room with a different starting concentration If all of the air entering a space comes from the outside then a change in the initial concentration would have no effect on the reciprocal age-of-air because the decay curve would be exponential from the start and the area under the curve would be normalized based on
32 of 49
Research Report - 0602
the starting concentration in that zone However if the air entering a room passes through another room with a lower initial concentration the room receiving the air will have a lower concentration of tracer gas throughout the test compared to what the concentration would have been if the starting points were the same in both rooms This case is illustrated in Figure 28 where assumptions are made that the rooms are the same size the air exchange rate is 01 ACH for both rooms and the initial tracer gas concentration is 10 lower in the first room (upstream) than it is in the second room
The effect on reciprocal age-of-air is shown in Figure 29 A 10 difference in starting concentration results in an error of about 75 in reciprocal age-of-air for a room downstream of a room with a lower starting concentration assuming 01 ACH for both rooms The error would be somewhat smaller (about 5) if the air change rate was higher for both rooms (02 ACH) There would be no error introduced for rooms where all of the air infiltration comes from the outside Although the amount of error in the reciprocal age-of-air calculations can be affected by additional variables not examined here we feel that these percentages are reasonable estimates of the errors in our results for the 2-story house due to incomplete initial mixing of air
In each case an engineering judgment must be made regarding the significance of the error introduced by incomplete initial mixing As a general rule the differences in concentration at the start of the test should be small compared to the differences that are being measured in order for the results to be considered valid
Figure 28 Theoretical decay curves for a well-mixed case with uniform tracer gas concentration compared to a case where the upstream room starts with a concentration
10 lower than the downstream room
33 of 49
Research Report - 0602
Figure 29 Theoretical reciprocal age-of-air for a well-mixed case with uniform tracer gas concentration compared to a case where the upstream room starts with a concentration
10 lower than the downstream room
Natural Infiltration and Duct Leakage
A natural infiltration test was performed over a two hour period on the evening of January 8 (Test B14) The tracer gas decay curves are shown in Figure 30 There was a slight divergence between the first floor and second floor once the air handler was turned off but the rooms on each floor appeared to remain fairly well-mixed The average air change rate during the test period was about 011 ACH which was somewhat higher than the 1-story house as might be expected with an increased stack height
An air handler bedroom door bump test was conducted just prior to the test period shown in Figure 30 allowing observation of the combined effect of duct leakage to the outside and increased infiltration caused by room pressurization The average air change rate during that bump test was 013 ACH suggesting that closing doors and operating the fan added approximately 002 ACH to the whole-house average air change rate The average wind speed was a bit higher while the air handler was running (17 mph compared to 05 mph) so the effect of air handler operation may actually be somewhat less than the average ACH numbers indicate
34 of 49
Research Report - 0602
0
1
2
3
4
SF
6 C
on
ce
ntr
ati
on
(m
gm
3)
BR1
Living
Kitchen
BR2
BR3
MBR
Mixing stopped
Mixing restarted
1814 1843 1912 1940 2009 2038 2107 2136
Hour
Figure 30 Tracer gas decay for 2-story house with no ventilation no central fan operation and bedroom doors open (Test B14)
Distributed Supply vs Point Exhaust Ventilation
A 14-hour test (Test B1) was performed with an exhaust ventilation rate of 63 cfm in the laundry room which was located near the stairwell in the middle of the first floor The ventilation rate was again consistent with the ASHRAE 622 recommendations The tracer gas decay curves are shown in Figure 31 It is interesting that all three second floor rooms showed a delay before entering an exponential decay suggesting that some amount of air was moving from the first floor to the second floor even though the mechanical exhaust point was on the first floor It appears that the further depressurization of the first floor was insufficient to overcome the stack effect and draw a significant amount of outside air in through the rooms on the second floor
35 of 49
Research Report - 0602
182
9
192
9
202
9
212
9
222
9
232
9
029
129
229
329
429
529
629
729
828
929
102
8
112
8
122
8
0
10
20
30
40
50
60
70
SF
6 C
on
ce
ntr
ati
on
(m
gm
3)
BR1
Living
Kitchen
BR2
BR3
MBR
Mixing stopped
Mixing restarted
Hour
Figure 31 Tracer gas decay for 2-story house with exhaust ventilation from the laundry room at ASHRAE 622 level no central fan operation and bedroom doors closed (Test B1)
A supply ventilation test was performed on the 2-story house for about 11 hours starting late on January 4 (Test B3) The duct blaster was unable to provide the ventilation rate necessary to meet the minimum specified in ASHRAE 622 supplying 180 cfm instead of 189 cfm (95) The decay curves are shown in Figure 32 Although the curves are much more tightly packed than they were with the exhaust system there is more divergence than we saw with the supply system in the 1-story house most notably in the master bedroom
The reciprocal age-of-air calculations for both the exhaust and supply ventilation systems are shown in Figure 33 Again the results indicate that much better room-to-room distribution of ventilation air was achieved by the central-fan integrated supply system compared to the single-point exhaust system However for the supply ventilation test the differences in the initial tracer gas concentration were of the same magnitude as the differences in decay rates among the rooms As a result no conclusions should be drawn about the relative ranking of the supply ventilation rate among rooms based on Figure 33
36 of 49
Research Report - 0602
0
10
20
30
40
50
60
SF
6 C
on
ce
ntr
ati
on
(m
gm
3)
BR1
Living
Kitchen
BR2
BR3
MBR
Mixing stopped
Mixing restarted
2136 000 224 448 712 936 1200
Hour
Figure 32 Tracer gas decay for 2-story house with supply ventilation just under ASHRAE 622 level central fan operation at 33 duty cycle (20 min off 10 min on) and bedroom
doors closed (Test B3)
Simple Exhaust vs Central Fan Integrated
Supply )
000
005
010
015
020
025
Recip
rocal A
ge o
f A
ir (
1h
r
BR1
Living
Kitchen
BR2
BR3
MBR
Exhaust in laundry room no Centralized supply mixing
mixing 100 ASHRAE 33 duty cycle 95
doors closed ASHRAE doors closed
Figure 33 Reciprocal age-of-air for 2-story house with continuous exhaust ventilation (Test B1) compared to central fan integrated supply ventilation (Test B3) (Note
Uncertainties introduced by non-uniform starting concentration are of the same order of magnitude as the differences in reciprocal age-of-air among rooms for the supply ventilation case The relative ranking of rooms is not meaningful for that case)
37 of 49
Research Report - 0602
Air Handler Operation
The effect of occasional air handler operation on the distribution of exhaust ventilation air was evaluated on the afternoon of January 6 (Test B6) The tracer gas decay curves are shown in Figure 34 and reciprocal age-of-air calculations are shown in Figure 35 It should again be noted that before the test started the house was mixed using both the air handler and a de-stratification fan with the doors open During the test the doors were closed the de-stratification fan was turned off and the air handler operated at a 33 duty cycle (20 minutes off 10 minutes on) As was the case in the 1-story house this occasional operation of the air handler substantially improved the distribution of ventilation air among rooms even in conjunction with the point exhaust ventilation system There was very little divergence noticeable even with the air handler cycling on and off every half hour However because the initial differences in tracer gas concentration among rooms were as large as the differences in reciprocal age-of-air for the case with air handler operation no conclusions should be drawn about the relative ranking of ventilation rates among the rooms for that case
SF
6 C
on
cen
trati
on
(m
gm
3)
80
70
60
50
40
30
20
10
0
BR1
Living
Kitchen
BR2
BR3
MBR
Mixing stopped
Mixing restarted
1048 1200 1312 1424 1536 1648 1800 1912 2024
Hour
Figure 34 Tracer gas decay for 2-story house with continuous exhaust ventilation at ASHRAE 622 level central fan operation at 33 duty cycle (20 min off 10 min on) and
bedroom doors closed (Test B6)
38 of 49
Research Report - 0602
020
015 R
ec
ipro
ca
l A
ge
of
Air
(1
hr)
Exhaust Ventilation
No Mixing vs 33 Air Handler Duty Cycle
Exhaust in laundry room
no mixing 100
ASHRAE doors closed
33 air handler
operation exhaust in
laundry room 100
ASHRAE doors closed
BR1
Living
Kitchen
BR2
BR3
MBR
010
005
000
Figure 35 Reciprocal age-of-air for 2-story house with continuous exhaust ventilation with and without air handler operation (Tests B1 and B6) (Note Uncertainties introduced by non-uniform starting concentration are of the same order of magnitude as the differences in reciprocal age-of-air among rooms for the case with air handler operation The relative
ranking of rooms is not meaningful for that case)
Exhaust Location
The duct blaster was moved to the master bathroom exhaust register to see if there was a resulting change in ventilation air distribution (Test B18) The master bathroom was in the back of the house on the second floor between the master bedroom and bedroom 3 The decay curves are shown in Figure 36 and the reciprocal age-of-air results are shown in Figure 37 The rooms on each floor were well mixed before the test began although the mixing between the two floors was not as good Very wide divergence among rooms can be seen during the test especially between the upstairs bedrooms and the rest of the house Once again all three upstairs rooms appear to receive some air from the first floor but the master bedroom experiences a much higher volume of circulated air than the other two second-floor bedrooms which appear to be relatively stagnant
39 of 49
Research Report - 0602
0
10
20
30
40
50
60
70
80
90
SF
6 C
on
ce
ntr
ati
on
(m
gm
3)
BR1
Living
Kitchen
BR2
BR3
MBR
Mixing stopped
Mixing restarted
1912 2136 000 224 448 712 936 1200
Hour
Figure 36 Tracer gas decay for 2-story house with exhaust ventilation from the master bathroom at ASHRAE 622 level no central fan operation and bedroom doors closed (Test
B18)
Exhaust Ventilation
Laundry Room vs Master Bathroom
000
005
010
015
020
025
030
Exhaust in laundry room no
mixing 100 ASHRAE
doors closed
Exhaust in master bathroom
no mixing 100 ASHRAE
doors closed
Re
cip
roc
al A
ge
of
Air
(1
hr)
BR1
Living
Kitchen
BR2
BR3
MBR
Figure 37 Reciprocal age-of-air for 2-story house with exhaust ventilation from the master bathroom compared to the laundry room at ASHRAE 622 level no central fan operation
and bedroom doors closed (Tests B1 and B18)
40 of 49
Research Report - 0602
Ventilation Rate
The supply ventilation tests were repeated using flow rates of 60 and 33 of ASHRAE 622 recommendations corresponding to 114 cfm and 63 cfm respectively (Tests B2 and B4) The decay curves are shown in Figures 38 and 39 Reciprocal age-of-air for all three supply ventilation rates are shown in Figure 40 In all cases the rooms remained fairly well mixed especially rooms on the same floor As we observed in the 1-story house the ventilation rate in the 2-story house appeared to have very little effect on the uniformity of outside air provided to each room as long as it was mixed using the air handler One again the initial differences in tracer gas concentration among rooms were as large as the divergence in the decay curves preventing any conclusions about the relative ranking of ventilation rates among rooms for all three cases The error in initial concentration uniformity was bigger for the cases with air handler mixing because the relative divergence in the decay curves was so small compared to that of no air handler mixing In other words the error in relative ranking of ventilation rates for the cases with air handler mixing were not very important anyway because the relative differences between rooms were so small
1536 1648 1800 1912 2024 2136 2248
Hour
Figure 38 Tracer gas decay for 2-story house with supply ventilation at 60 of ASHRAE 622 level 33 central fan operation (20 min off 10 min on) and bedroom doors closed
(Test B2)
0
5
10
15
20
25
30
SF
6 C
on
cen
trati
on
(m
gm
3)
BR1 Living Kitchen BR2 BR3 MBR
Mixing stopped
Mixing restarted
41 of 49
Research Report - 0602
0
5
10
15
20
25
30
35
40
SF
6 C
on
cen
trati
on
(m
gm
3)
BR1
Living
Kitchen
BR2
BR3
MBR
Mixing stopped
Mixing restarted
1200 1312 1424 1536 1648 1800 1912
Hour
Figure 39 Tracer gas decay for 2-story house with supply ventilation at 33 of ASHRAE 622 level 33 central fan operation (20 min off 10 min on) and bedroom doors closed
(Test B4)
Supply Ventilation Rate Comparison
000
005
010
015
020
025
Re
cip
roc
al
Ag
e o
f A
ir (
1h
r)
BR1
Living
Kitchen
BR2
BR3
MBR
Centralized supply Centralized supply Centralized supply
mixing 33 duty mixing 33 duty mixing 33 duty
cycle 95 ASHRAE cycle 60 ASHRAE cycle 33 ASHRAE
doors closed doors closed doors closed
Figure 40 Reciprocal age-of-air for 2-story house with three levels of supply ventilation central fan operation at 33 duty cycle (20 min off 10 min on) and bedroom doors closed (Tests B3 B2 B4) (Note Uncertainties introduced by non-uniform starting
concentration are of the same order of magnitude as the differences in reciprocal age-of-air among rooms for all three cases The relative ranking of rooms is not meaningful for these
cases)
42 of 49
Research Report - 0602
The average air change rates for the three supply ventilation rates compared to the two exhaust ventilation schemes are shown in Figure 41 The CFIS system at 33 of the 622 ventilation flow rate provided a uniformly higher air change rate (013 ach) than the least ventilated rooms using exhaust ventilation from either the laundry or the master bathroom (010 ach Figure 37) It is noteworthy that the combined net air change rate with exhaust ventilation from the laundry room was significantly less than the air change rates for both exhaust ventilation from the master bathroom and supply ventilation at the air handler This illustrates the unpredictability of interactions between mechanical ventilation and natural infiltration which depend strongly on the distribution and size of cracks through which the outside air must pass to enter the house There may have been a relatively large building enclosure leakage opening near the laundry room (perhaps the utility penetrations or the door to the garage) that allowed a significant amount of outside air to quickly enter and leave the house through the exhaust flow without circulating around the house
0
005
01
015
02
025
Ave
rag
e A
CH
Natural Exhaust Exhaust Supply 95 Supply 60 Supply 33
Laundry Mbath
Rm 100 100
Figure 41 Average air change rates for 2-story house with supply ventilation at 33 60 and 95 of ASHRAE 622 recommendations (Tests B4 B2 B3) compared to natural
infiltration (Test B14) and exhaust ventilation with no central fan operation (Test B1) Bedroom doors were closed except for the natural infiltration test
Bedroom Doors
The laundry room exhaust ventilation test with no air handler operation (see Figure 31) was repeated with the doors open to evaluate the change in room-to-room ventilation air distribution (Test B10) The decay curves are shown in Figure 42 and the reciprocal age-of air calculations are shown in Figure 43 It is evident from Figure 42 that the test began before the rooms were
43 of 49
Research Report - 0602
0
5
10
15
20
25
SF
6 C
on
ce
ntr
ati
on
(m
gm
3)
BR1 Living Kitchen BR2 BR3 MBR
Mixing stopped
Mixing restarted
completely well mixed resulting in decay curves that could be somewhat misleading Because the master bedroom was at a higher concentration than the other rooms at the start of the test any room that received air from the master bedroom would appear to have a slower decay rate than it would have if the rooms started out at the same concentration Despite the difference in starting concentration it is clear that outside air was well distributed when the doors were open even without operation of the air handler
1843 1912 1940 2009 2038 2107 2136 2204 2233 2302
Hour
Figure 42 Tracer gas decay for the 2-story house with exhaust ventilation from the laundry room at ASHRAE 622 level no central fan operation and bedroom doors open
(Test B10)
Reciprocal age-of-air analysis was not performed for this case because of the combined effect of a short test duration (~2 hours) and unequal starting tracer gas concentrations even though the house was relatively well-mixed The important conclusion (that opening doors greatly improves mixing) can be drawn by inspecting the decay curves alone
Transfer Grilles
A final exhaust ventilation test was run on the 2-story house with the doors closed and the transfer grilles taped over The decay curves are shown in Figure 43 and the reciprocal age-ofshyair calculations are shown in Figure 44 The curves were clearly very divergent even after 12 hours By examining the reciprocal age-of-air results it is apparent that the transfer grilles in the 2-story house caused a noticeable improvement in ventilation air distribution but the improvement was smaller than when the doors were opened (Figure 42)
44 of 49
Research Report - 0602
0
5
10
15
20
25
30
SF
6 C
on
cen
tra
tio
n (
mg
m3
) BR1 Living Kitchen BR2 BR3 MBR
Mixing stopped
Mixing restarted
1648 1912 2136 000 224 448 712 936
Hour
Figure 43 Tracer gas decay for 2-story house with exhaust ventilation from the laundry room at ASHRAE 622 level no central fan operation bedroom doors closed transfer
grilles taped closed (Test B7)
Exhaust Ventilation Transfer Grilles Untaped vs Taped
000
005
010
015
020
Re
cip
roc
al
Ag
e o
f A
ir (
1h
r)
BR1
Living
Kitchen
BR2
BR3
MBR
Exhaust in laundry room no Exhaust in laundry room no
mixing 100 ASHRAE mixing 100 ASHRAE
doors closed doors closed transfer
grilles taped
Figure 44 Reciprocal age-of-air for 2-story house with exhaust ventilation from the laundry room at ASHRAE 622 level no central fan operation and doors closed In the first case the transfer grilles are untaped (Test B3) in the second they are taped closed
(Test B7)
45 of 49
Research Report - 0602
CONCLUSIONS
bull Reciprocal age-of-air analysis was chosen as a quantitative method for characterizing distribution of ventilation air among rooms This method worked well in cases where rooms were well mixed to begin the test and weather conditions were sufficiently steady-state
bull A test period of at least 1frac12 air changes was necessary to obtain reasonably accurate ageshyof-air results when there was significant divergence in tracer gas concentration among the rooms
bull Although we did not achieve uniform initial concentration of tracer gas in the 2-story house using our test methodology and the equipment at hand we believe the reciprocal age-of-air calculations were meaningful in many of the cases as indicated in the discussion
bull Both houses were relatively tight with natural infiltration averaging 008 ACH for the 1shystory house and 011 ACH for the 2-story house
bull Both houses had relatively small (but not negligible) duct losses to the outside producing an increase in infiltration of less than 003 ACH for the 1-story house and 002 ACH for the 2-story house when the air handler runs
bull Age-of-air analysis indicated that ventilation supplied through the central air distribution system provided much more uniform distribution of ventilation air than the single-point exhaust system when the doors were closed and the air handler was not running For the 1-story house the central-fan-integrated supply ventilation case at 60 of ASHRAE 622 provided more outside air to all rooms than the least-ventilated room in the exhaust case at 100 of 622 For the 2-story house the central-fan-integrated supply system at 33 of the 622 flow rate provided more outside air to all rooms than the least ventilated rooms using exhaust ventilation at 100 of 622 from either the laundry or the master bathroom
bull Operation of the central fan at a 33 duty cycle maintained relatively well-mixed conditions regardless of ventilation rate type of ventilation system (supply or exhaust) or house configuration (1-story or 2-story)
bull Exhaust location affected both the relative amount of outside air received by different rooms and the overall uniformity among rooms but the effect was not predictable
bull For exhaust-only ventilation without central fan operation opening bedroom doors appeared to significantly improve the mixing of ventilation air among rooms
bull Transfer grilles improved the distribution of ventilation air slightly but much less than opening the bedroom doors
bull In the 2-story house the stack effect caused air movement from the first floor to the second floor even when exhaust ventilation was applied to the first floor resulting in consistently higher tracer gas concentrations on the second floor and more non-uniform ventilation air distribution in general
bull Interactions between natural infiltration and both exhaust and supply mechanical ventilation were very significant When the ventilation system was activated the combined air change rate did not increase commensurate with the measured ventilation rate but instead increased by only half that amount This result was consistent with combining ventilation and infiltration in quadrature to estimate whole-house air change rate in accordance with ASHRAE Standard 136 (ASHRAE 1993)
46 of 49
Research Report - 0602
FUTURE WORK
In future tests continuous monitoring of pressure differentials would enhance our understanding of the multi-zone combined infiltration and ventilation systems and our ability to model them That would help to explain differences between tests in more detail including the effects of multiple stories location of ventilation supply outlets and exhaust inlets interior door closure and use of passive return air transfer grilles Pressure differential measurement points should include
bull dP with respect to outside for each closed room and open space bull dP across closed interior doors bull dP between the floor cavity and outdoors and bull dP between the house and the attic
Measurement of wind direction along with wind speed could also be helpful for modeling these buildings and systems However because of micro-climate wind shielding it may be very difficult to relate a single-point wind direction measurement to actual wind vectors on the building surfaces
ACKNOWLEDGMENTS
The authors express their appreciation to Rich Coyle of DR Horton for providing the test houses and to Joseph Lstiburek of BSC Subrato Chandra and Neil Moyer of FSEC and Greg Barker of Mountain Energy Partnership for their assistance in the planning and execution of this ventilation study
47 of 49
Research Report - 0602
REFERENCES
ASHRAE (1993) ANSIASHRAE Standard 136-1993 A Method of Determining Air Change Rates in Detached Dwellings Atlanta GA American Society of Heating Refrigerating and Air-Conditioning Engineers Inc
ASHRAE (1997) ANSIASHRAE Standard 129-1997 Measuring Air-Change Effectiveness Atlanta GA American Society of Heating Refrigerating and Air-Conditioning Engineers Inc
ASHRAE (2004) ASHRAE Standard 622-2004 Ventilation and Acceptable Indoor Air Quality in Low-Rise Residential Buildings Atlanta GA American Society of Heating Refrigerating and Air-Conditioning Engineers Inc
CSA (2003) CANCSA F326-M91 Residential Mechanical Ventilation Systems Canadian Standards Association Ontario Canada httpwwwcsashyintlorgonlinestoreGetCatalogItemDetailsaspmat=2410793ampParent=102
NBC 2005 National Building Code of Canada httpircnrcshycnrcgccapubscodesnrcc47666_ehtml
Grieve PW (1991) Measuring Ventilation Using Tracer-Gases Denmark Bruumlel amp Kjaeligr
MN Chapter 7672 Minnesota Energy Code Chapter 7672 Detached Single-Family And Two-Family Dwellings httpwwwstatemnusmnexternalDocsCommerceChapter_7672_Residential_111302012428 _72rulepdf
Persily AK Martin SR (2000) A Modeling Study of Ventilation in Manufactured Houses Gaithersburg MD National Institute of Standards and Technology NISTIR 6455
Rudd A Lstiburek J (2000) ldquoMeasurement of Ventilation and Interzonal Distribution in Single-Family Homesrdquo ASHRAE Transactions 2000 MN-00-10-3 V 106 Pt2 American Society of Heating Refrigeration and Air-Conditioning Engineers Atlanta GA
WAC (2004) Washington State Title 51 WAC Community trade and economic development department of (building code council) Chapter 51-13 Ventilation and indoor air quality httpappslegwagovWACdefaultaspxcite=51-13
48 of 49
Research Report - 0602
Field test of room-to-room uniformity of ventilation air distribution in two new houses
About this Report
This report was prepared for the US Department of Energyrsquos Building America
Program The report is freely available to the public at wwwbuildingamericagov
The authors express their appreciation to Rich Coyle of DR Horton for providing the test houses and to Joseph Lstiburek of BSC Subrato Chandra and Neil Moyer of
FSEC and Greg Barker of Mountain Energy Partnership for their assistance in the planning and execution of this ventilation study
About the Authors
Robert Hendron Ren Anderson Dennis Barley are with National Renewable Energy Laboratory Armin Rudd and Aaron Townsend are with Building Science Corporation
Ed Hancock is with Mountain Energy Partnership
Direct all correspondence to Building Science Corporation 30 Forest Street Somerville MA 02143
Limits of Liability and Disclaimer of Warranty
Building Science documents are intended for professionals The author and the publisher of this article have used their best efforts to provide accurate and authoritative information in regard to the subject matter covered The author and publisher make no warranty of any kind expressed or implied with regard to the information contained in this article
The information presented in this article must be used with care by professionals who understand the implications of what they are doing If professional advice or other expert assistance is required the services of a competent professional shall be sought The author and publisher shall not be liable in the event of incidental or consequential damages in connection with or arising from the use of the information contained within this Building Science document
49 of 49
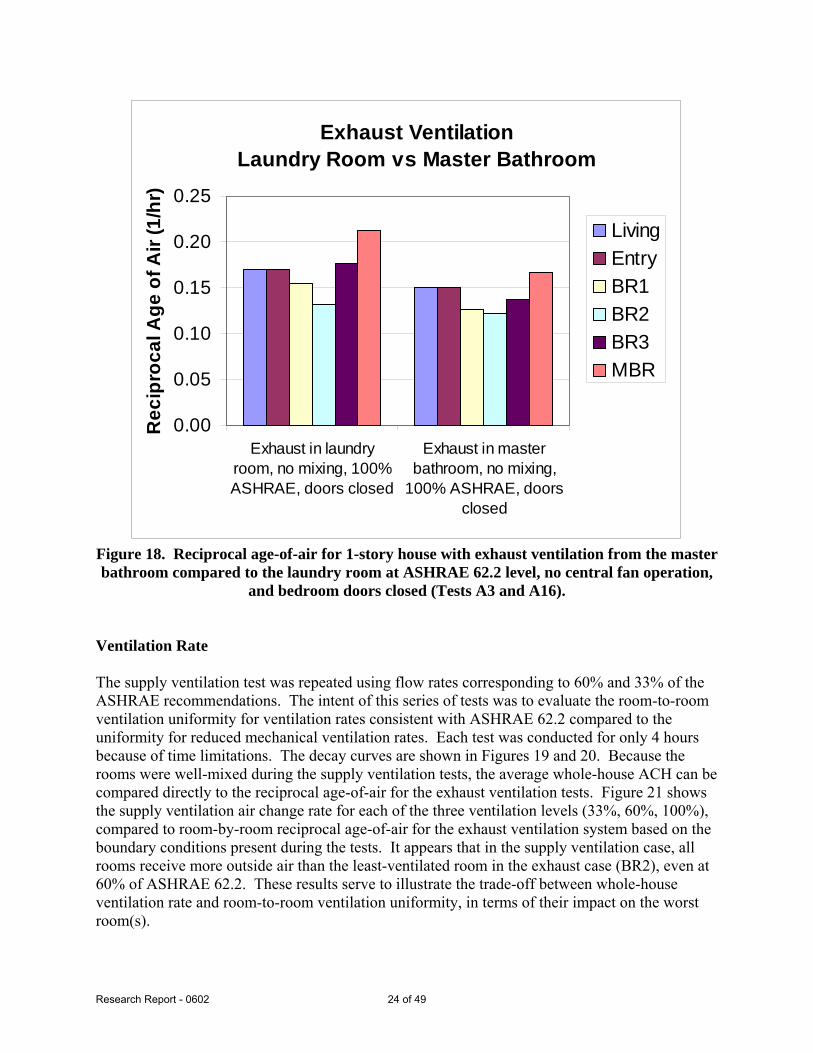
Research Report - 0602
Exhaust Ventilation
Laundry Room vs Master Bathroom
000
005
010
015
020
025
Exhaust in laundry
room no mixing 100
ASHRAE doors closed
Exhaust in master
bathroom no mixing
100 ASHRAE doors
closed
Re
cip
roc
al A
ge
of
Air
(1
hr)
Living
Entry
BR1
BR2
BR3
MBR
Figure 18 Reciprocal age-of-air for 1-story house with exhaust ventilation from the master bathroom compared to the laundry room at ASHRAE 622 level no central fan operation
and bedroom doors closed (Tests A3 and A16)
Ventilation Rate
The supply ventilation test was repeated using flow rates corresponding to 60 and 33 of the ASHRAE recommendations The intent of this series of tests was to evaluate the room-to-room ventilation uniformity for ventilation rates consistent with ASHRAE 622 compared to the uniformity for reduced mechanical ventilation rates Each test was conducted for only 4 hours because of time limitations The decay curves are shown in Figures 19 and 20 Because the rooms were well-mixed during the supply ventilation tests the average whole-house ACH can be compared directly to the reciprocal age-of-air for the exhaust ventilation tests Figure 21 shows the supply ventilation air change rate for each of the three ventilation levels (33 60 100) compared to room-by-room reciprocal age-of-air for the exhaust ventilation system based on the boundary conditions present during the tests It appears that in the supply ventilation case all rooms receive more outside air than the least-ventilated room in the exhaust case (BR2) even at 60 of ASHRAE 622 These results serve to illustrate the trade-off between whole-house ventilation rate and room-to-room ventilation uniformity in terms of their impact on the worst room(s)
24 of 49
Research Report - 0602
The ASHRAE 622 committee has not currently defined the level of mixing that is required when choosing the minimum ventilation rate Some might interpret the results of this test to suggest that a house without mixing can have individual rooms that do not receive sufficient outside air even though the ventilation system is operating at 622 specified rates Because the 622 committee has not specified the level of mixing that is required when choosing the minimum ventilation rate the ventilation rate required by different ventilation systems is open to interpretation For example if the exhaust system performance shown in Figure 21 is acceptable does this mean that a ventilation system that provides good distribution of outside air may be sufficiently well-ventilated at 60 of the ASHRAE 622 level or perhaps even less Alternatively it might be concluded that exhaust ventilation rates should be increased over current ASHRAE 622 recommendations because of the possibility that certain rooms may receive very little fresh air Unfortunately because the current 622 standard does not specify air mixing requirements and the committeersquos assumptions about ventilation air distribution are not well documented it is difficult to make any firm recommendations in this area However we can conclude that air mixing is required for dilution ventilation systems to provide predictable results independent of the geometry of individual homes
8 9 10 11 12 13 14
Hour
Figure 19 Tracer gas decay for 1-story house with supply ventilation at 60 of ASHRAE 622 level 33 central fan operation (20 min off 10 min on) and bedroom doors closed
(Test A4)
0
10
20
30
40
50
60
Co
nce
ntr
ati
on
m
gm
3
Living
Entry
BR1
BR2
BR3
MBR
Mixing stopped
Mixing restarted
25 of 49
Research Report - 0602
0
5
10
15
20
25
30
Co
nce
ntr
ati
on
(m
gm
3 )
Living
Entry
BR1
BR2
BR3
MBR
Mixing stopped
Mixing restarted
12 13 14 15 16 17 18 19 20
Hour
Figure 20 Tracer gas decay for 1-story house with supply ventilation at 33 of ASHRAE 622 level 33 central fan operation (20 min off 10 min on) and bedroom doors closed
(Test A5)
Simple Exhaust vs Central Fan Integrated
Supply with Lower Ventilation Rates
025
Re
cip
roc
al A
ge
of
Air
(1
hr)
Well Mixed
100
ASHRAE 60
ASHRAE 33
ASHRAE Living Entry 010 Natural
BR1 Infilt
BR2 BR3 005
MBR
Exhaust in laundry room no
000
Central supply Natural infil-
mixing 100 ASHRAE doors mixing 33 duty tration doors
closed cycle doors closed open
Figure 21 Reciprocal age-of-air for 1-story house with supply ventilation at 33 60 and 100 of ASHRAE 622 level (Tests A5 A4 A6) compared to exhaust ventilation with
no central fan operation (Test A3) Bedroom doors were closed
020
015
26 of 49
Research Report - 0602
Simulations by Walker (2006) have shown that all systems will not provide the same service in terms of annual average air change rate For the same air flow rate and duty cycle balanced ventilation will yield a higher average air exchange than supply ventilation and supply ventilation will yield a higher average air exchange than exhaust ventilation That can be explained in general terms by understanding that wind and stack effects act to depressurize a building most of the time Exhaust fans increase the building depressurization further but supply fans decrease the depressurization Balanced fans donrsquot change the enclosure differential pressure and air flow at all Because of the non-linear relationship between differential pressure and air flows across the building enclosure a supply fan changes the pressures across the enclosure less than an exhaust fan acting more like a balanced fan The result is that the effect on ventilation air change rate from a supply fan is somewhere between that of an exhaust fan and a true balanced system
Bedroom Doors
Except for the natural ventilation test the preceding tests were all conducted with the bedroom doors closed to simulate a worst-case situation for air circulation within the house The exhaust ventilation test was repeated with the bedroom doors open (Test A9) producing the tracer gas decay curve shown in Figure 22 It is evident that the decay curves were much more tightly bundled with the doors open than they were with the doors closed (compare Figure 12) A comparison based on reciprocal age-of-air is shown in Figure 23 A significant improvement in room-to-room mixing is evident during the open-door test
It is also evident that the average air change rate was higher when the doors were open (0202 vs 0176 ACH) but it must be remembered that the ventilation rate was controlled using a duct blaster and average wind speed was higher during the open-door test period compared to the closed-door test period (20 mph compared to 06 mph) Therefore this test alone does not necessarily indicate that closing doors reduces the average air change rate associated with an exhaust system In future tests continuous measurement of the depressurization of the house with respect to outside along with single-point pressure measurements across interior doors would provide more information about the effect of closing doors when exhaust ventilation systems are used It would also be valuable to conduct this test during steady weather conditions using the exhaust fan (with uncontrolled ventilation rate) instead of the duct blaster to observe the net effect of closed doors on whole-house air change rate
27 of 49
Research Report - 0602
0
5
10
15
20
25
30
Co
ncen
trati
on
(m
gm
3 )
Living
Entry
BR1
BR2
BR3
MBR
Mixing stopped
Mixing restarted
181 191 201 211 221 231 01 11 21 31 41 51 61 71
Hour
Figure 22 Tracer gas decay for 1-story house with exhaust ventilation from the laundry room at ASHRAE 622 level no central fan operation and bedroom doors open (Test A9)
Exhaust Ventilation
Doors Closed vs Doors Open
000
005
010
015
020
025
Re
cip
roc
al
Ag
e o
f A
ir (
1h
r)
Living
Entry
BR1
BR2
BR3
MBR
Exhaust in laundry room Doors open no mixing
no mixing 100 exhaust in laundry room
ASHRAE doors closed 100 ASHRAE
Figure 23 Reciprocal age-of-air for 1-story house with exhaust ventilation from the laundry room at ASHRAE 622 level no central fan operation In the first case the bedroom doors were closed (Test A3) in the second the doors were open (Test A9)
28 of 49
Research Report - 0602
Transfer Grilles
Because the test houses used central returns instead of hard ducted returns in the bedrooms transfer grilles were installed over the bedroom doors to provide a flow path for return air without excessive room pressurization when the doors were closed These transfer grilles also allowed ventilation air to pass more freely from the bedrooms to the main living space The effect of transfer grilles on ventilation air distribution was evaluated by taping over the grilles (see Figure 24) and re-running the exhaust ventilation test (Test A10) The corresponding tracer gas decay curve is shown in Figure 25 and the reciprocal age-of-air analysis is shown in Figure 26 Taping the transfer grilles did not appear to significantly affect the room-to-room variability in ventilation rate although there appeared to be some slight re-ranking of rooms from highest to lowest reciprocal age-of-air It should be noted that there was an increase in average wind speed from 26 mph to 41 mph starting at 1 pm including a half hour period where the average wind speed was 7 mph This weather effect produced noticeable kinks in the decay curves and therefore would be expected to introduce significant errors into the reciprocal age-of-air results
Itrsquos possible that the transfer grilles played a much smaller role in providing a path for ventilation air than the supply ducts Because the air handler was not operating the ducts were not pressurized and were thus available as passive airflow conduits The resistance to air flow was probably smaller for the air ducts than for the transfer grilles depending on their size and the number of supply registers in each bedroom The existing door undercuts are also thought to have played a role The effect of ducts and door undercuts can be tested in the future by running separate tests with ducts and door undercuts taped over
copy buildingsciencecom
Figure 24 Transfer grilles over bedroom doors taped closed
29 of 49
Research Report - 0602
0
10
20
30
40
50
60
70
Co
nc
en
tra
tio
n (
mg
m3 )
Living
Entry
BR1
BR2
BR3
MBR
Mixing stopped
Mixing restarted
8 9 10 11 12 13 14 15 16 17
Hour
Figure 25 Tracer gas decay for 1-story house with exhaust ventilation from the laundry room at ASHRAE 622 level no central fan operation bedroom doors closed and transfer
grilles taped (Test A10)
Exhaust Ventilation
000
005
010
015
020
025
Re
cip
roc
al
Ag
e o
f A
ir (
1h
r)
Living
Entry
BR1
BR2
BR3
MBR
Transfer Grilles Untaped vs Taped
Exhaust in laundry room no Exhaust in laundry room no
mixing 100 ASHRAE mixing 100 ASHRAE
doors closed doors closed transfer
grilles taped
Figure 26 Reciprocal age-of-air for 1-story house with exhaust ventilation from the laundry room at ASHRAE 622 level no central fan operation and doors closed In the
30 of 49
Research Report - 0602
first case the transfer grilles are untaped (Test A3) in the second they are taped closed (Test A10)
Minimum Test Duration
We were fortunate that DR Horton provided two full weeks of access to these homes to conduct this series of tests which allowed us to run some of the more important tracer gas decay tests as long as 12 hours to help ensure that we could accurately calculate reciprocal age-of-air In most cases test houses would not be available for such a long time period To evaluate the length of time needed to estimate the reciprocal age-of-air with reasonable accuracy we examined the results that we would have obtained for one of the exhaust ventilation tests had we halted the test period after less than 12 hours For the supply ventilation tests the rooms were sufficiently well-mixed that the test could have been stopped after 3 or 4 hours assuming weather effects were steady
The reciprocal age-of-air calculations for the exhaust ventilation decay curves (Test A3 see Figure 12) based on test durations of 3 6 9 and 12 hours are shown in Figure 27 These test durations range from 053 to 21 air changes based on the average air change rate of 018 ACH (56 hours per air change) calculated for this test The ratio of highest to lowest reciprocal ageshyof-air is shown above the data points for each case These results suggest that shorter tests tend to overestimate the range and that perhaps 1frac12-2 air changes (roughly 9 to 12 hours in this case) may be necessary to obtain accurate calculations of reciprocal age-of-air when there is significant divergence among rooms From a qualitative standpoint one air change may be sufficient to determine the basic trend Without knowing in advance what mixing pattern will occur it is difficult to recommend a minimum test duration But assuming this test is fairly representative of a worst-case scenario a minimum of 15 air changes would be necessary to have a high degree of confidence in the quantitative difference in reciprocal age-of-air among rooms
31 of 49
Research Report - 0602
000
005
010
015
020
025
030
035
Re
cip
roc
al
Ag
e-O
f-A
ir (
hr-1
)
Living
Entry
BR1
BR2
BR3
MBR HighLow = 297
HighLow = 168 HighLow = 184 HighLow = 161
3-hour Test 6-hour Test 9-hour Test 12-hour Test
(053 Air Changes) (11 Air Changes) (16 Air Changes) (21 Air Changes)
Test Duration
Figure 27 Reciprocal age-of-air based on alternate test durations for 1-story house with exhaust ventilation from the laundry room at ASHRAE 622 level no central fan operation
and doors closed (Test A3) Average air change rate was 018 ACH
TEST RESULTS FROM 2-STORY HOUSE (1117 MONTAGUE)
The 2-story house was tested from January 3-10 2006 Three zones were selected on the first floor and three more were selected on the second floor as indicated by the red stars in Figure 4 The initial mixing of air among the rooms at the start of each test in this 2-story house was not as thorough as it was in the 1-story house Evidently the combined effects of the air handler and the portable de-stratification fan were not sufficient to overcome upward transport of tracer gas driven by the stack effect from the first to the second floor The resulting difference in initial tracer gas concentration among the rooms was about 5-10 This outcome emphasizes the significant effect of stack-driven infiltration on ventilation non-uniformity in multi-story homes Because our test method and equipment did not achieve a well-mixed condition at the start of each test there were some errors introduced into the reciprocal age-of-air analysis For future tests we would recommend larger de-stratification fans to obtain more well-mixed conditions in multi-story houses
Typical errors introduced by incomplete mixing of the tracer gas at the start of such a test were analyzed by examining two hypothetical cases where either all of the air entering a room comes from the outside or all of the air comes from an adjacent room with a different starting concentration If all of the air entering a space comes from the outside then a change in the initial concentration would have no effect on the reciprocal age-of-air because the decay curve would be exponential from the start and the area under the curve would be normalized based on
32 of 49
Research Report - 0602
the starting concentration in that zone However if the air entering a room passes through another room with a lower initial concentration the room receiving the air will have a lower concentration of tracer gas throughout the test compared to what the concentration would have been if the starting points were the same in both rooms This case is illustrated in Figure 28 where assumptions are made that the rooms are the same size the air exchange rate is 01 ACH for both rooms and the initial tracer gas concentration is 10 lower in the first room (upstream) than it is in the second room
The effect on reciprocal age-of-air is shown in Figure 29 A 10 difference in starting concentration results in an error of about 75 in reciprocal age-of-air for a room downstream of a room with a lower starting concentration assuming 01 ACH for both rooms The error would be somewhat smaller (about 5) if the air change rate was higher for both rooms (02 ACH) There would be no error introduced for rooms where all of the air infiltration comes from the outside Although the amount of error in the reciprocal age-of-air calculations can be affected by additional variables not examined here we feel that these percentages are reasonable estimates of the errors in our results for the 2-story house due to incomplete initial mixing of air
In each case an engineering judgment must be made regarding the significance of the error introduced by incomplete initial mixing As a general rule the differences in concentration at the start of the test should be small compared to the differences that are being measured in order for the results to be considered valid
Figure 28 Theoretical decay curves for a well-mixed case with uniform tracer gas concentration compared to a case where the upstream room starts with a concentration
10 lower than the downstream room
33 of 49
Research Report - 0602
Figure 29 Theoretical reciprocal age-of-air for a well-mixed case with uniform tracer gas concentration compared to a case where the upstream room starts with a concentration
10 lower than the downstream room
Natural Infiltration and Duct Leakage
A natural infiltration test was performed over a two hour period on the evening of January 8 (Test B14) The tracer gas decay curves are shown in Figure 30 There was a slight divergence between the first floor and second floor once the air handler was turned off but the rooms on each floor appeared to remain fairly well-mixed The average air change rate during the test period was about 011 ACH which was somewhat higher than the 1-story house as might be expected with an increased stack height
An air handler bedroom door bump test was conducted just prior to the test period shown in Figure 30 allowing observation of the combined effect of duct leakage to the outside and increased infiltration caused by room pressurization The average air change rate during that bump test was 013 ACH suggesting that closing doors and operating the fan added approximately 002 ACH to the whole-house average air change rate The average wind speed was a bit higher while the air handler was running (17 mph compared to 05 mph) so the effect of air handler operation may actually be somewhat less than the average ACH numbers indicate
34 of 49
Research Report - 0602
0
1
2
3
4
SF
6 C
on
ce
ntr
ati
on
(m
gm
3)
BR1
Living
Kitchen
BR2
BR3
MBR
Mixing stopped
Mixing restarted
1814 1843 1912 1940 2009 2038 2107 2136
Hour
Figure 30 Tracer gas decay for 2-story house with no ventilation no central fan operation and bedroom doors open (Test B14)
Distributed Supply vs Point Exhaust Ventilation
A 14-hour test (Test B1) was performed with an exhaust ventilation rate of 63 cfm in the laundry room which was located near the stairwell in the middle of the first floor The ventilation rate was again consistent with the ASHRAE 622 recommendations The tracer gas decay curves are shown in Figure 31 It is interesting that all three second floor rooms showed a delay before entering an exponential decay suggesting that some amount of air was moving from the first floor to the second floor even though the mechanical exhaust point was on the first floor It appears that the further depressurization of the first floor was insufficient to overcome the stack effect and draw a significant amount of outside air in through the rooms on the second floor
35 of 49
Research Report - 0602
182
9
192
9
202
9
212
9
222
9
232
9
029
129
229
329
429
529
629
729
828
929
102
8
112
8
122
8
0
10
20
30
40
50
60
70
SF
6 C
on
ce
ntr
ati
on
(m
gm
3)
BR1
Living
Kitchen
BR2
BR3
MBR
Mixing stopped
Mixing restarted
Hour
Figure 31 Tracer gas decay for 2-story house with exhaust ventilation from the laundry room at ASHRAE 622 level no central fan operation and bedroom doors closed (Test B1)
A supply ventilation test was performed on the 2-story house for about 11 hours starting late on January 4 (Test B3) The duct blaster was unable to provide the ventilation rate necessary to meet the minimum specified in ASHRAE 622 supplying 180 cfm instead of 189 cfm (95) The decay curves are shown in Figure 32 Although the curves are much more tightly packed than they were with the exhaust system there is more divergence than we saw with the supply system in the 1-story house most notably in the master bedroom
The reciprocal age-of-air calculations for both the exhaust and supply ventilation systems are shown in Figure 33 Again the results indicate that much better room-to-room distribution of ventilation air was achieved by the central-fan integrated supply system compared to the single-point exhaust system However for the supply ventilation test the differences in the initial tracer gas concentration were of the same magnitude as the differences in decay rates among the rooms As a result no conclusions should be drawn about the relative ranking of the supply ventilation rate among rooms based on Figure 33
36 of 49
Research Report - 0602
0
10
20
30
40
50
60
SF
6 C
on
ce
ntr
ati
on
(m
gm
3)
BR1
Living
Kitchen
BR2
BR3
MBR
Mixing stopped
Mixing restarted
2136 000 224 448 712 936 1200
Hour
Figure 32 Tracer gas decay for 2-story house with supply ventilation just under ASHRAE 622 level central fan operation at 33 duty cycle (20 min off 10 min on) and bedroom
doors closed (Test B3)
Simple Exhaust vs Central Fan Integrated
Supply )
000
005
010
015
020
025
Recip
rocal A
ge o
f A
ir (
1h
r
BR1
Living
Kitchen
BR2
BR3
MBR
Exhaust in laundry room no Centralized supply mixing
mixing 100 ASHRAE 33 duty cycle 95
doors closed ASHRAE doors closed
Figure 33 Reciprocal age-of-air for 2-story house with continuous exhaust ventilation (Test B1) compared to central fan integrated supply ventilation (Test B3) (Note
Uncertainties introduced by non-uniform starting concentration are of the same order of magnitude as the differences in reciprocal age-of-air among rooms for the supply ventilation case The relative ranking of rooms is not meaningful for that case)
37 of 49
Research Report - 0602
Air Handler Operation
The effect of occasional air handler operation on the distribution of exhaust ventilation air was evaluated on the afternoon of January 6 (Test B6) The tracer gas decay curves are shown in Figure 34 and reciprocal age-of-air calculations are shown in Figure 35 It should again be noted that before the test started the house was mixed using both the air handler and a de-stratification fan with the doors open During the test the doors were closed the de-stratification fan was turned off and the air handler operated at a 33 duty cycle (20 minutes off 10 minutes on) As was the case in the 1-story house this occasional operation of the air handler substantially improved the distribution of ventilation air among rooms even in conjunction with the point exhaust ventilation system There was very little divergence noticeable even with the air handler cycling on and off every half hour However because the initial differences in tracer gas concentration among rooms were as large as the differences in reciprocal age-of-air for the case with air handler operation no conclusions should be drawn about the relative ranking of ventilation rates among the rooms for that case
SF
6 C
on
cen
trati
on
(m
gm
3)
80
70
60
50
40
30
20
10
0
BR1
Living
Kitchen
BR2
BR3
MBR
Mixing stopped
Mixing restarted
1048 1200 1312 1424 1536 1648 1800 1912 2024
Hour
Figure 34 Tracer gas decay for 2-story house with continuous exhaust ventilation at ASHRAE 622 level central fan operation at 33 duty cycle (20 min off 10 min on) and
bedroom doors closed (Test B6)
38 of 49
Research Report - 0602
020
015 R
ec
ipro
ca
l A
ge
of
Air
(1
hr)
Exhaust Ventilation
No Mixing vs 33 Air Handler Duty Cycle
Exhaust in laundry room
no mixing 100
ASHRAE doors closed
33 air handler
operation exhaust in
laundry room 100
ASHRAE doors closed
BR1
Living
Kitchen
BR2
BR3
MBR
010
005
000
Figure 35 Reciprocal age-of-air for 2-story house with continuous exhaust ventilation with and without air handler operation (Tests B1 and B6) (Note Uncertainties introduced by non-uniform starting concentration are of the same order of magnitude as the differences in reciprocal age-of-air among rooms for the case with air handler operation The relative
ranking of rooms is not meaningful for that case)
Exhaust Location
The duct blaster was moved to the master bathroom exhaust register to see if there was a resulting change in ventilation air distribution (Test B18) The master bathroom was in the back of the house on the second floor between the master bedroom and bedroom 3 The decay curves are shown in Figure 36 and the reciprocal age-of-air results are shown in Figure 37 The rooms on each floor were well mixed before the test began although the mixing between the two floors was not as good Very wide divergence among rooms can be seen during the test especially between the upstairs bedrooms and the rest of the house Once again all three upstairs rooms appear to receive some air from the first floor but the master bedroom experiences a much higher volume of circulated air than the other two second-floor bedrooms which appear to be relatively stagnant
39 of 49
Research Report - 0602
0
10
20
30
40
50
60
70
80
90
SF
6 C
on
ce
ntr
ati
on
(m
gm
3)
BR1
Living
Kitchen
BR2
BR3
MBR
Mixing stopped
Mixing restarted
1912 2136 000 224 448 712 936 1200
Hour
Figure 36 Tracer gas decay for 2-story house with exhaust ventilation from the master bathroom at ASHRAE 622 level no central fan operation and bedroom doors closed (Test
B18)
Exhaust Ventilation
Laundry Room vs Master Bathroom
000
005
010
015
020
025
030
Exhaust in laundry room no
mixing 100 ASHRAE
doors closed
Exhaust in master bathroom
no mixing 100 ASHRAE
doors closed
Re
cip
roc
al A
ge
of
Air
(1
hr)
BR1
Living
Kitchen
BR2
BR3
MBR
Figure 37 Reciprocal age-of-air for 2-story house with exhaust ventilation from the master bathroom compared to the laundry room at ASHRAE 622 level no central fan operation
and bedroom doors closed (Tests B1 and B18)
40 of 49
Research Report - 0602
Ventilation Rate
The supply ventilation tests were repeated using flow rates of 60 and 33 of ASHRAE 622 recommendations corresponding to 114 cfm and 63 cfm respectively (Tests B2 and B4) The decay curves are shown in Figures 38 and 39 Reciprocal age-of-air for all three supply ventilation rates are shown in Figure 40 In all cases the rooms remained fairly well mixed especially rooms on the same floor As we observed in the 1-story house the ventilation rate in the 2-story house appeared to have very little effect on the uniformity of outside air provided to each room as long as it was mixed using the air handler One again the initial differences in tracer gas concentration among rooms were as large as the divergence in the decay curves preventing any conclusions about the relative ranking of ventilation rates among rooms for all three cases The error in initial concentration uniformity was bigger for the cases with air handler mixing because the relative divergence in the decay curves was so small compared to that of no air handler mixing In other words the error in relative ranking of ventilation rates for the cases with air handler mixing were not very important anyway because the relative differences between rooms were so small
1536 1648 1800 1912 2024 2136 2248
Hour
Figure 38 Tracer gas decay for 2-story house with supply ventilation at 60 of ASHRAE 622 level 33 central fan operation (20 min off 10 min on) and bedroom doors closed
(Test B2)
0
5
10
15
20
25
30
SF
6 C
on
cen
trati
on
(m
gm
3)
BR1 Living Kitchen BR2 BR3 MBR
Mixing stopped
Mixing restarted
41 of 49
Research Report - 0602
0
5
10
15
20
25
30
35
40
SF
6 C
on
cen
trati
on
(m
gm
3)
BR1
Living
Kitchen
BR2
BR3
MBR
Mixing stopped
Mixing restarted
1200 1312 1424 1536 1648 1800 1912
Hour
Figure 39 Tracer gas decay for 2-story house with supply ventilation at 33 of ASHRAE 622 level 33 central fan operation (20 min off 10 min on) and bedroom doors closed
(Test B4)
Supply Ventilation Rate Comparison
000
005
010
015
020
025
Re
cip
roc
al
Ag
e o
f A
ir (
1h
r)
BR1
Living
Kitchen
BR2
BR3
MBR
Centralized supply Centralized supply Centralized supply
mixing 33 duty mixing 33 duty mixing 33 duty
cycle 95 ASHRAE cycle 60 ASHRAE cycle 33 ASHRAE
doors closed doors closed doors closed
Figure 40 Reciprocal age-of-air for 2-story house with three levels of supply ventilation central fan operation at 33 duty cycle (20 min off 10 min on) and bedroom doors closed (Tests B3 B2 B4) (Note Uncertainties introduced by non-uniform starting
concentration are of the same order of magnitude as the differences in reciprocal age-of-air among rooms for all three cases The relative ranking of rooms is not meaningful for these
cases)
42 of 49
Research Report - 0602
The average air change rates for the three supply ventilation rates compared to the two exhaust ventilation schemes are shown in Figure 41 The CFIS system at 33 of the 622 ventilation flow rate provided a uniformly higher air change rate (013 ach) than the least ventilated rooms using exhaust ventilation from either the laundry or the master bathroom (010 ach Figure 37) It is noteworthy that the combined net air change rate with exhaust ventilation from the laundry room was significantly less than the air change rates for both exhaust ventilation from the master bathroom and supply ventilation at the air handler This illustrates the unpredictability of interactions between mechanical ventilation and natural infiltration which depend strongly on the distribution and size of cracks through which the outside air must pass to enter the house There may have been a relatively large building enclosure leakage opening near the laundry room (perhaps the utility penetrations or the door to the garage) that allowed a significant amount of outside air to quickly enter and leave the house through the exhaust flow without circulating around the house
0
005
01
015
02
025
Ave
rag
e A
CH
Natural Exhaust Exhaust Supply 95 Supply 60 Supply 33
Laundry Mbath
Rm 100 100
Figure 41 Average air change rates for 2-story house with supply ventilation at 33 60 and 95 of ASHRAE 622 recommendations (Tests B4 B2 B3) compared to natural
infiltration (Test B14) and exhaust ventilation with no central fan operation (Test B1) Bedroom doors were closed except for the natural infiltration test
Bedroom Doors
The laundry room exhaust ventilation test with no air handler operation (see Figure 31) was repeated with the doors open to evaluate the change in room-to-room ventilation air distribution (Test B10) The decay curves are shown in Figure 42 and the reciprocal age-of air calculations are shown in Figure 43 It is evident from Figure 42 that the test began before the rooms were
43 of 49
Research Report - 0602
0
5
10
15
20
25
SF
6 C
on
ce
ntr
ati
on
(m
gm
3)
BR1 Living Kitchen BR2 BR3 MBR
Mixing stopped
Mixing restarted
completely well mixed resulting in decay curves that could be somewhat misleading Because the master bedroom was at a higher concentration than the other rooms at the start of the test any room that received air from the master bedroom would appear to have a slower decay rate than it would have if the rooms started out at the same concentration Despite the difference in starting concentration it is clear that outside air was well distributed when the doors were open even without operation of the air handler
1843 1912 1940 2009 2038 2107 2136 2204 2233 2302
Hour
Figure 42 Tracer gas decay for the 2-story house with exhaust ventilation from the laundry room at ASHRAE 622 level no central fan operation and bedroom doors open
(Test B10)
Reciprocal age-of-air analysis was not performed for this case because of the combined effect of a short test duration (~2 hours) and unequal starting tracer gas concentrations even though the house was relatively well-mixed The important conclusion (that opening doors greatly improves mixing) can be drawn by inspecting the decay curves alone
Transfer Grilles
A final exhaust ventilation test was run on the 2-story house with the doors closed and the transfer grilles taped over The decay curves are shown in Figure 43 and the reciprocal age-ofshyair calculations are shown in Figure 44 The curves were clearly very divergent even after 12 hours By examining the reciprocal age-of-air results it is apparent that the transfer grilles in the 2-story house caused a noticeable improvement in ventilation air distribution but the improvement was smaller than when the doors were opened (Figure 42)
44 of 49
Research Report - 0602
0
5
10
15
20
25
30
SF
6 C
on
cen
tra
tio
n (
mg
m3
) BR1 Living Kitchen BR2 BR3 MBR
Mixing stopped
Mixing restarted
1648 1912 2136 000 224 448 712 936
Hour
Figure 43 Tracer gas decay for 2-story house with exhaust ventilation from the laundry room at ASHRAE 622 level no central fan operation bedroom doors closed transfer
grilles taped closed (Test B7)
Exhaust Ventilation Transfer Grilles Untaped vs Taped
000
005
010
015
020
Re
cip
roc
al
Ag
e o
f A
ir (
1h
r)
BR1
Living
Kitchen
BR2
BR3
MBR
Exhaust in laundry room no Exhaust in laundry room no
mixing 100 ASHRAE mixing 100 ASHRAE
doors closed doors closed transfer
grilles taped
Figure 44 Reciprocal age-of-air for 2-story house with exhaust ventilation from the laundry room at ASHRAE 622 level no central fan operation and doors closed In the first case the transfer grilles are untaped (Test B3) in the second they are taped closed
(Test B7)
45 of 49
Research Report - 0602
CONCLUSIONS
bull Reciprocal age-of-air analysis was chosen as a quantitative method for characterizing distribution of ventilation air among rooms This method worked well in cases where rooms were well mixed to begin the test and weather conditions were sufficiently steady-state
bull A test period of at least 1frac12 air changes was necessary to obtain reasonably accurate ageshyof-air results when there was significant divergence in tracer gas concentration among the rooms
bull Although we did not achieve uniform initial concentration of tracer gas in the 2-story house using our test methodology and the equipment at hand we believe the reciprocal age-of-air calculations were meaningful in many of the cases as indicated in the discussion
bull Both houses were relatively tight with natural infiltration averaging 008 ACH for the 1shystory house and 011 ACH for the 2-story house
bull Both houses had relatively small (but not negligible) duct losses to the outside producing an increase in infiltration of less than 003 ACH for the 1-story house and 002 ACH for the 2-story house when the air handler runs
bull Age-of-air analysis indicated that ventilation supplied through the central air distribution system provided much more uniform distribution of ventilation air than the single-point exhaust system when the doors were closed and the air handler was not running For the 1-story house the central-fan-integrated supply ventilation case at 60 of ASHRAE 622 provided more outside air to all rooms than the least-ventilated room in the exhaust case at 100 of 622 For the 2-story house the central-fan-integrated supply system at 33 of the 622 flow rate provided more outside air to all rooms than the least ventilated rooms using exhaust ventilation at 100 of 622 from either the laundry or the master bathroom
bull Operation of the central fan at a 33 duty cycle maintained relatively well-mixed conditions regardless of ventilation rate type of ventilation system (supply or exhaust) or house configuration (1-story or 2-story)
bull Exhaust location affected both the relative amount of outside air received by different rooms and the overall uniformity among rooms but the effect was not predictable
bull For exhaust-only ventilation without central fan operation opening bedroom doors appeared to significantly improve the mixing of ventilation air among rooms
bull Transfer grilles improved the distribution of ventilation air slightly but much less than opening the bedroom doors
bull In the 2-story house the stack effect caused air movement from the first floor to the second floor even when exhaust ventilation was applied to the first floor resulting in consistently higher tracer gas concentrations on the second floor and more non-uniform ventilation air distribution in general
bull Interactions between natural infiltration and both exhaust and supply mechanical ventilation were very significant When the ventilation system was activated the combined air change rate did not increase commensurate with the measured ventilation rate but instead increased by only half that amount This result was consistent with combining ventilation and infiltration in quadrature to estimate whole-house air change rate in accordance with ASHRAE Standard 136 (ASHRAE 1993)
46 of 49
Research Report - 0602
FUTURE WORK
In future tests continuous monitoring of pressure differentials would enhance our understanding of the multi-zone combined infiltration and ventilation systems and our ability to model them That would help to explain differences between tests in more detail including the effects of multiple stories location of ventilation supply outlets and exhaust inlets interior door closure and use of passive return air transfer grilles Pressure differential measurement points should include
bull dP with respect to outside for each closed room and open space bull dP across closed interior doors bull dP between the floor cavity and outdoors and bull dP between the house and the attic
Measurement of wind direction along with wind speed could also be helpful for modeling these buildings and systems However because of micro-climate wind shielding it may be very difficult to relate a single-point wind direction measurement to actual wind vectors on the building surfaces
ACKNOWLEDGMENTS
The authors express their appreciation to Rich Coyle of DR Horton for providing the test houses and to Joseph Lstiburek of BSC Subrato Chandra and Neil Moyer of FSEC and Greg Barker of Mountain Energy Partnership for their assistance in the planning and execution of this ventilation study
47 of 49
Research Report - 0602
REFERENCES
ASHRAE (1993) ANSIASHRAE Standard 136-1993 A Method of Determining Air Change Rates in Detached Dwellings Atlanta GA American Society of Heating Refrigerating and Air-Conditioning Engineers Inc
ASHRAE (1997) ANSIASHRAE Standard 129-1997 Measuring Air-Change Effectiveness Atlanta GA American Society of Heating Refrigerating and Air-Conditioning Engineers Inc
ASHRAE (2004) ASHRAE Standard 622-2004 Ventilation and Acceptable Indoor Air Quality in Low-Rise Residential Buildings Atlanta GA American Society of Heating Refrigerating and Air-Conditioning Engineers Inc
CSA (2003) CANCSA F326-M91 Residential Mechanical Ventilation Systems Canadian Standards Association Ontario Canada httpwwwcsashyintlorgonlinestoreGetCatalogItemDetailsaspmat=2410793ampParent=102
NBC 2005 National Building Code of Canada httpircnrcshycnrcgccapubscodesnrcc47666_ehtml
Grieve PW (1991) Measuring Ventilation Using Tracer-Gases Denmark Bruumlel amp Kjaeligr
MN Chapter 7672 Minnesota Energy Code Chapter 7672 Detached Single-Family And Two-Family Dwellings httpwwwstatemnusmnexternalDocsCommerceChapter_7672_Residential_111302012428 _72rulepdf
Persily AK Martin SR (2000) A Modeling Study of Ventilation in Manufactured Houses Gaithersburg MD National Institute of Standards and Technology NISTIR 6455
Rudd A Lstiburek J (2000) ldquoMeasurement of Ventilation and Interzonal Distribution in Single-Family Homesrdquo ASHRAE Transactions 2000 MN-00-10-3 V 106 Pt2 American Society of Heating Refrigeration and Air-Conditioning Engineers Atlanta GA
WAC (2004) Washington State Title 51 WAC Community trade and economic development department of (building code council) Chapter 51-13 Ventilation and indoor air quality httpappslegwagovWACdefaultaspxcite=51-13
48 of 49
Research Report - 0602
Field test of room-to-room uniformity of ventilation air distribution in two new houses
About this Report
This report was prepared for the US Department of Energyrsquos Building America
Program The report is freely available to the public at wwwbuildingamericagov
The authors express their appreciation to Rich Coyle of DR Horton for providing the test houses and to Joseph Lstiburek of BSC Subrato Chandra and Neil Moyer of
FSEC and Greg Barker of Mountain Energy Partnership for their assistance in the planning and execution of this ventilation study
About the Authors
Robert Hendron Ren Anderson Dennis Barley are with National Renewable Energy Laboratory Armin Rudd and Aaron Townsend are with Building Science Corporation
Ed Hancock is with Mountain Energy Partnership
Direct all correspondence to Building Science Corporation 30 Forest Street Somerville MA 02143
Limits of Liability and Disclaimer of Warranty
Building Science documents are intended for professionals The author and the publisher of this article have used their best efforts to provide accurate and authoritative information in regard to the subject matter covered The author and publisher make no warranty of any kind expressed or implied with regard to the information contained in this article
The information presented in this article must be used with care by professionals who understand the implications of what they are doing If professional advice or other expert assistance is required the services of a competent professional shall be sought The author and publisher shall not be liable in the event of incidental or consequential damages in connection with or arising from the use of the information contained within this Building Science document
49 of 49
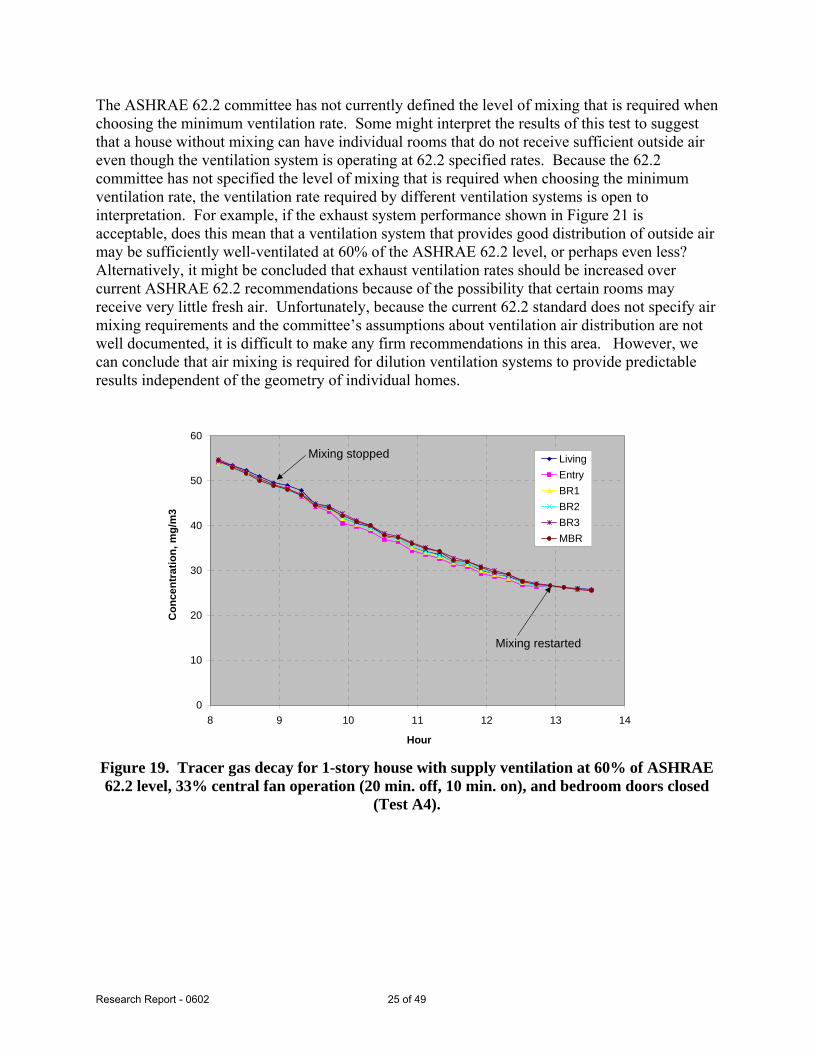
Research Report - 0602
The ASHRAE 622 committee has not currently defined the level of mixing that is required when choosing the minimum ventilation rate Some might interpret the results of this test to suggest that a house without mixing can have individual rooms that do not receive sufficient outside air even though the ventilation system is operating at 622 specified rates Because the 622 committee has not specified the level of mixing that is required when choosing the minimum ventilation rate the ventilation rate required by different ventilation systems is open to interpretation For example if the exhaust system performance shown in Figure 21 is acceptable does this mean that a ventilation system that provides good distribution of outside air may be sufficiently well-ventilated at 60 of the ASHRAE 622 level or perhaps even less Alternatively it might be concluded that exhaust ventilation rates should be increased over current ASHRAE 622 recommendations because of the possibility that certain rooms may receive very little fresh air Unfortunately because the current 622 standard does not specify air mixing requirements and the committeersquos assumptions about ventilation air distribution are not well documented it is difficult to make any firm recommendations in this area However we can conclude that air mixing is required for dilution ventilation systems to provide predictable results independent of the geometry of individual homes
8 9 10 11 12 13 14
Hour
Figure 19 Tracer gas decay for 1-story house with supply ventilation at 60 of ASHRAE 622 level 33 central fan operation (20 min off 10 min on) and bedroom doors closed
(Test A4)
0
10
20
30
40
50
60
Co
nce
ntr
ati
on
m
gm
3
Living
Entry
BR1
BR2
BR3
MBR
Mixing stopped
Mixing restarted
25 of 49
Research Report - 0602
0
5
10
15
20
25
30
Co
nce
ntr
ati
on
(m
gm
3 )
Living
Entry
BR1
BR2
BR3
MBR
Mixing stopped
Mixing restarted
12 13 14 15 16 17 18 19 20
Hour
Figure 20 Tracer gas decay for 1-story house with supply ventilation at 33 of ASHRAE 622 level 33 central fan operation (20 min off 10 min on) and bedroom doors closed
(Test A5)
Simple Exhaust vs Central Fan Integrated
Supply with Lower Ventilation Rates
025
Re
cip
roc
al A
ge
of
Air
(1
hr)
Well Mixed
100
ASHRAE 60
ASHRAE 33
ASHRAE Living Entry 010 Natural
BR1 Infilt
BR2 BR3 005
MBR
Exhaust in laundry room no
000
Central supply Natural infil-
mixing 100 ASHRAE doors mixing 33 duty tration doors
closed cycle doors closed open
Figure 21 Reciprocal age-of-air for 1-story house with supply ventilation at 33 60 and 100 of ASHRAE 622 level (Tests A5 A4 A6) compared to exhaust ventilation with
no central fan operation (Test A3) Bedroom doors were closed
020
015
26 of 49
Research Report - 0602
Simulations by Walker (2006) have shown that all systems will not provide the same service in terms of annual average air change rate For the same air flow rate and duty cycle balanced ventilation will yield a higher average air exchange than supply ventilation and supply ventilation will yield a higher average air exchange than exhaust ventilation That can be explained in general terms by understanding that wind and stack effects act to depressurize a building most of the time Exhaust fans increase the building depressurization further but supply fans decrease the depressurization Balanced fans donrsquot change the enclosure differential pressure and air flow at all Because of the non-linear relationship between differential pressure and air flows across the building enclosure a supply fan changes the pressures across the enclosure less than an exhaust fan acting more like a balanced fan The result is that the effect on ventilation air change rate from a supply fan is somewhere between that of an exhaust fan and a true balanced system
Bedroom Doors
Except for the natural ventilation test the preceding tests were all conducted with the bedroom doors closed to simulate a worst-case situation for air circulation within the house The exhaust ventilation test was repeated with the bedroom doors open (Test A9) producing the tracer gas decay curve shown in Figure 22 It is evident that the decay curves were much more tightly bundled with the doors open than they were with the doors closed (compare Figure 12) A comparison based on reciprocal age-of-air is shown in Figure 23 A significant improvement in room-to-room mixing is evident during the open-door test
It is also evident that the average air change rate was higher when the doors were open (0202 vs 0176 ACH) but it must be remembered that the ventilation rate was controlled using a duct blaster and average wind speed was higher during the open-door test period compared to the closed-door test period (20 mph compared to 06 mph) Therefore this test alone does not necessarily indicate that closing doors reduces the average air change rate associated with an exhaust system In future tests continuous measurement of the depressurization of the house with respect to outside along with single-point pressure measurements across interior doors would provide more information about the effect of closing doors when exhaust ventilation systems are used It would also be valuable to conduct this test during steady weather conditions using the exhaust fan (with uncontrolled ventilation rate) instead of the duct blaster to observe the net effect of closed doors on whole-house air change rate
27 of 49
Research Report - 0602
0
5
10
15
20
25
30
Co
ncen
trati
on
(m
gm
3 )
Living
Entry
BR1
BR2
BR3
MBR
Mixing stopped
Mixing restarted
181 191 201 211 221 231 01 11 21 31 41 51 61 71
Hour
Figure 22 Tracer gas decay for 1-story house with exhaust ventilation from the laundry room at ASHRAE 622 level no central fan operation and bedroom doors open (Test A9)
Exhaust Ventilation
Doors Closed vs Doors Open
000
005
010
015
020
025
Re
cip
roc
al
Ag
e o
f A
ir (
1h
r)
Living
Entry
BR1
BR2
BR3
MBR
Exhaust in laundry room Doors open no mixing
no mixing 100 exhaust in laundry room
ASHRAE doors closed 100 ASHRAE
Figure 23 Reciprocal age-of-air for 1-story house with exhaust ventilation from the laundry room at ASHRAE 622 level no central fan operation In the first case the bedroom doors were closed (Test A3) in the second the doors were open (Test A9)
28 of 49
Research Report - 0602
Transfer Grilles
Because the test houses used central returns instead of hard ducted returns in the bedrooms transfer grilles were installed over the bedroom doors to provide a flow path for return air without excessive room pressurization when the doors were closed These transfer grilles also allowed ventilation air to pass more freely from the bedrooms to the main living space The effect of transfer grilles on ventilation air distribution was evaluated by taping over the grilles (see Figure 24) and re-running the exhaust ventilation test (Test A10) The corresponding tracer gas decay curve is shown in Figure 25 and the reciprocal age-of-air analysis is shown in Figure 26 Taping the transfer grilles did not appear to significantly affect the room-to-room variability in ventilation rate although there appeared to be some slight re-ranking of rooms from highest to lowest reciprocal age-of-air It should be noted that there was an increase in average wind speed from 26 mph to 41 mph starting at 1 pm including a half hour period where the average wind speed was 7 mph This weather effect produced noticeable kinks in the decay curves and therefore would be expected to introduce significant errors into the reciprocal age-of-air results
Itrsquos possible that the transfer grilles played a much smaller role in providing a path for ventilation air than the supply ducts Because the air handler was not operating the ducts were not pressurized and were thus available as passive airflow conduits The resistance to air flow was probably smaller for the air ducts than for the transfer grilles depending on their size and the number of supply registers in each bedroom The existing door undercuts are also thought to have played a role The effect of ducts and door undercuts can be tested in the future by running separate tests with ducts and door undercuts taped over
copy buildingsciencecom
Figure 24 Transfer grilles over bedroom doors taped closed
29 of 49
Research Report - 0602
0
10
20
30
40
50
60
70
Co
nc
en
tra
tio
n (
mg
m3 )
Living
Entry
BR1
BR2
BR3
MBR
Mixing stopped
Mixing restarted
8 9 10 11 12 13 14 15 16 17
Hour
Figure 25 Tracer gas decay for 1-story house with exhaust ventilation from the laundry room at ASHRAE 622 level no central fan operation bedroom doors closed and transfer
grilles taped (Test A10)
Exhaust Ventilation
000
005
010
015
020
025
Re
cip
roc
al
Ag
e o
f A
ir (
1h
r)
Living
Entry
BR1
BR2
BR3
MBR
Transfer Grilles Untaped vs Taped
Exhaust in laundry room no Exhaust in laundry room no
mixing 100 ASHRAE mixing 100 ASHRAE
doors closed doors closed transfer
grilles taped
Figure 26 Reciprocal age-of-air for 1-story house with exhaust ventilation from the laundry room at ASHRAE 622 level no central fan operation and doors closed In the
30 of 49
Research Report - 0602
first case the transfer grilles are untaped (Test A3) in the second they are taped closed (Test A10)
Minimum Test Duration
We were fortunate that DR Horton provided two full weeks of access to these homes to conduct this series of tests which allowed us to run some of the more important tracer gas decay tests as long as 12 hours to help ensure that we could accurately calculate reciprocal age-of-air In most cases test houses would not be available for such a long time period To evaluate the length of time needed to estimate the reciprocal age-of-air with reasonable accuracy we examined the results that we would have obtained for one of the exhaust ventilation tests had we halted the test period after less than 12 hours For the supply ventilation tests the rooms were sufficiently well-mixed that the test could have been stopped after 3 or 4 hours assuming weather effects were steady
The reciprocal age-of-air calculations for the exhaust ventilation decay curves (Test A3 see Figure 12) based on test durations of 3 6 9 and 12 hours are shown in Figure 27 These test durations range from 053 to 21 air changes based on the average air change rate of 018 ACH (56 hours per air change) calculated for this test The ratio of highest to lowest reciprocal ageshyof-air is shown above the data points for each case These results suggest that shorter tests tend to overestimate the range and that perhaps 1frac12-2 air changes (roughly 9 to 12 hours in this case) may be necessary to obtain accurate calculations of reciprocal age-of-air when there is significant divergence among rooms From a qualitative standpoint one air change may be sufficient to determine the basic trend Without knowing in advance what mixing pattern will occur it is difficult to recommend a minimum test duration But assuming this test is fairly representative of a worst-case scenario a minimum of 15 air changes would be necessary to have a high degree of confidence in the quantitative difference in reciprocal age-of-air among rooms
31 of 49
Research Report - 0602
000
005
010
015
020
025
030
035
Re
cip
roc
al
Ag
e-O
f-A
ir (
hr-1
)
Living
Entry
BR1
BR2
BR3
MBR HighLow = 297
HighLow = 168 HighLow = 184 HighLow = 161
3-hour Test 6-hour Test 9-hour Test 12-hour Test
(053 Air Changes) (11 Air Changes) (16 Air Changes) (21 Air Changes)
Test Duration
Figure 27 Reciprocal age-of-air based on alternate test durations for 1-story house with exhaust ventilation from the laundry room at ASHRAE 622 level no central fan operation
and doors closed (Test A3) Average air change rate was 018 ACH
TEST RESULTS FROM 2-STORY HOUSE (1117 MONTAGUE)
The 2-story house was tested from January 3-10 2006 Three zones were selected on the first floor and three more were selected on the second floor as indicated by the red stars in Figure 4 The initial mixing of air among the rooms at the start of each test in this 2-story house was not as thorough as it was in the 1-story house Evidently the combined effects of the air handler and the portable de-stratification fan were not sufficient to overcome upward transport of tracer gas driven by the stack effect from the first to the second floor The resulting difference in initial tracer gas concentration among the rooms was about 5-10 This outcome emphasizes the significant effect of stack-driven infiltration on ventilation non-uniformity in multi-story homes Because our test method and equipment did not achieve a well-mixed condition at the start of each test there were some errors introduced into the reciprocal age-of-air analysis For future tests we would recommend larger de-stratification fans to obtain more well-mixed conditions in multi-story houses
Typical errors introduced by incomplete mixing of the tracer gas at the start of such a test were analyzed by examining two hypothetical cases where either all of the air entering a room comes from the outside or all of the air comes from an adjacent room with a different starting concentration If all of the air entering a space comes from the outside then a change in the initial concentration would have no effect on the reciprocal age-of-air because the decay curve would be exponential from the start and the area under the curve would be normalized based on
32 of 49
Research Report - 0602
the starting concentration in that zone However if the air entering a room passes through another room with a lower initial concentration the room receiving the air will have a lower concentration of tracer gas throughout the test compared to what the concentration would have been if the starting points were the same in both rooms This case is illustrated in Figure 28 where assumptions are made that the rooms are the same size the air exchange rate is 01 ACH for both rooms and the initial tracer gas concentration is 10 lower in the first room (upstream) than it is in the second room
The effect on reciprocal age-of-air is shown in Figure 29 A 10 difference in starting concentration results in an error of about 75 in reciprocal age-of-air for a room downstream of a room with a lower starting concentration assuming 01 ACH for both rooms The error would be somewhat smaller (about 5) if the air change rate was higher for both rooms (02 ACH) There would be no error introduced for rooms where all of the air infiltration comes from the outside Although the amount of error in the reciprocal age-of-air calculations can be affected by additional variables not examined here we feel that these percentages are reasonable estimates of the errors in our results for the 2-story house due to incomplete initial mixing of air
In each case an engineering judgment must be made regarding the significance of the error introduced by incomplete initial mixing As a general rule the differences in concentration at the start of the test should be small compared to the differences that are being measured in order for the results to be considered valid
Figure 28 Theoretical decay curves for a well-mixed case with uniform tracer gas concentration compared to a case where the upstream room starts with a concentration
10 lower than the downstream room
33 of 49
Research Report - 0602
Figure 29 Theoretical reciprocal age-of-air for a well-mixed case with uniform tracer gas concentration compared to a case where the upstream room starts with a concentration
10 lower than the downstream room
Natural Infiltration and Duct Leakage
A natural infiltration test was performed over a two hour period on the evening of January 8 (Test B14) The tracer gas decay curves are shown in Figure 30 There was a slight divergence between the first floor and second floor once the air handler was turned off but the rooms on each floor appeared to remain fairly well-mixed The average air change rate during the test period was about 011 ACH which was somewhat higher than the 1-story house as might be expected with an increased stack height
An air handler bedroom door bump test was conducted just prior to the test period shown in Figure 30 allowing observation of the combined effect of duct leakage to the outside and increased infiltration caused by room pressurization The average air change rate during that bump test was 013 ACH suggesting that closing doors and operating the fan added approximately 002 ACH to the whole-house average air change rate The average wind speed was a bit higher while the air handler was running (17 mph compared to 05 mph) so the effect of air handler operation may actually be somewhat less than the average ACH numbers indicate
34 of 49
Research Report - 0602
0
1
2
3
4
SF
6 C
on
ce
ntr
ati
on
(m
gm
3)
BR1
Living
Kitchen
BR2
BR3
MBR
Mixing stopped
Mixing restarted
1814 1843 1912 1940 2009 2038 2107 2136
Hour
Figure 30 Tracer gas decay for 2-story house with no ventilation no central fan operation and bedroom doors open (Test B14)
Distributed Supply vs Point Exhaust Ventilation
A 14-hour test (Test B1) was performed with an exhaust ventilation rate of 63 cfm in the laundry room which was located near the stairwell in the middle of the first floor The ventilation rate was again consistent with the ASHRAE 622 recommendations The tracer gas decay curves are shown in Figure 31 It is interesting that all three second floor rooms showed a delay before entering an exponential decay suggesting that some amount of air was moving from the first floor to the second floor even though the mechanical exhaust point was on the first floor It appears that the further depressurization of the first floor was insufficient to overcome the stack effect and draw a significant amount of outside air in through the rooms on the second floor
35 of 49
Research Report - 0602
182
9
192
9
202
9
212
9
222
9
232
9
029
129
229
329
429
529
629
729
828
929
102
8
112
8
122
8
0
10
20
30
40
50
60
70
SF
6 C
on
ce
ntr
ati
on
(m
gm
3)
BR1
Living
Kitchen
BR2
BR3
MBR
Mixing stopped
Mixing restarted
Hour
Figure 31 Tracer gas decay for 2-story house with exhaust ventilation from the laundry room at ASHRAE 622 level no central fan operation and bedroom doors closed (Test B1)
A supply ventilation test was performed on the 2-story house for about 11 hours starting late on January 4 (Test B3) The duct blaster was unable to provide the ventilation rate necessary to meet the minimum specified in ASHRAE 622 supplying 180 cfm instead of 189 cfm (95) The decay curves are shown in Figure 32 Although the curves are much more tightly packed than they were with the exhaust system there is more divergence than we saw with the supply system in the 1-story house most notably in the master bedroom
The reciprocal age-of-air calculations for both the exhaust and supply ventilation systems are shown in Figure 33 Again the results indicate that much better room-to-room distribution of ventilation air was achieved by the central-fan integrated supply system compared to the single-point exhaust system However for the supply ventilation test the differences in the initial tracer gas concentration were of the same magnitude as the differences in decay rates among the rooms As a result no conclusions should be drawn about the relative ranking of the supply ventilation rate among rooms based on Figure 33
36 of 49
Research Report - 0602
0
10
20
30
40
50
60
SF
6 C
on
ce
ntr
ati
on
(m
gm
3)
BR1
Living
Kitchen
BR2
BR3
MBR
Mixing stopped
Mixing restarted
2136 000 224 448 712 936 1200
Hour
Figure 32 Tracer gas decay for 2-story house with supply ventilation just under ASHRAE 622 level central fan operation at 33 duty cycle (20 min off 10 min on) and bedroom
doors closed (Test B3)
Simple Exhaust vs Central Fan Integrated
Supply )
000
005
010
015
020
025
Recip
rocal A
ge o
f A
ir (
1h
r
BR1
Living
Kitchen
BR2
BR3
MBR
Exhaust in laundry room no Centralized supply mixing
mixing 100 ASHRAE 33 duty cycle 95
doors closed ASHRAE doors closed
Figure 33 Reciprocal age-of-air for 2-story house with continuous exhaust ventilation (Test B1) compared to central fan integrated supply ventilation (Test B3) (Note
Uncertainties introduced by non-uniform starting concentration are of the same order of magnitude as the differences in reciprocal age-of-air among rooms for the supply ventilation case The relative ranking of rooms is not meaningful for that case)
37 of 49
Research Report - 0602
Air Handler Operation
The effect of occasional air handler operation on the distribution of exhaust ventilation air was evaluated on the afternoon of January 6 (Test B6) The tracer gas decay curves are shown in Figure 34 and reciprocal age-of-air calculations are shown in Figure 35 It should again be noted that before the test started the house was mixed using both the air handler and a de-stratification fan with the doors open During the test the doors were closed the de-stratification fan was turned off and the air handler operated at a 33 duty cycle (20 minutes off 10 minutes on) As was the case in the 1-story house this occasional operation of the air handler substantially improved the distribution of ventilation air among rooms even in conjunction with the point exhaust ventilation system There was very little divergence noticeable even with the air handler cycling on and off every half hour However because the initial differences in tracer gas concentration among rooms were as large as the differences in reciprocal age-of-air for the case with air handler operation no conclusions should be drawn about the relative ranking of ventilation rates among the rooms for that case
SF
6 C
on
cen
trati
on
(m
gm
3)
80
70
60
50
40
30
20
10
0
BR1
Living
Kitchen
BR2
BR3
MBR
Mixing stopped
Mixing restarted
1048 1200 1312 1424 1536 1648 1800 1912 2024
Hour
Figure 34 Tracer gas decay for 2-story house with continuous exhaust ventilation at ASHRAE 622 level central fan operation at 33 duty cycle (20 min off 10 min on) and
bedroom doors closed (Test B6)
38 of 49
Research Report - 0602
020
015 R
ec
ipro
ca
l A
ge
of
Air
(1
hr)
Exhaust Ventilation
No Mixing vs 33 Air Handler Duty Cycle
Exhaust in laundry room
no mixing 100
ASHRAE doors closed
33 air handler
operation exhaust in
laundry room 100
ASHRAE doors closed
BR1
Living
Kitchen
BR2
BR3
MBR
010
005
000
Figure 35 Reciprocal age-of-air for 2-story house with continuous exhaust ventilation with and without air handler operation (Tests B1 and B6) (Note Uncertainties introduced by non-uniform starting concentration are of the same order of magnitude as the differences in reciprocal age-of-air among rooms for the case with air handler operation The relative
ranking of rooms is not meaningful for that case)
Exhaust Location
The duct blaster was moved to the master bathroom exhaust register to see if there was a resulting change in ventilation air distribution (Test B18) The master bathroom was in the back of the house on the second floor between the master bedroom and bedroom 3 The decay curves are shown in Figure 36 and the reciprocal age-of-air results are shown in Figure 37 The rooms on each floor were well mixed before the test began although the mixing between the two floors was not as good Very wide divergence among rooms can be seen during the test especially between the upstairs bedrooms and the rest of the house Once again all three upstairs rooms appear to receive some air from the first floor but the master bedroom experiences a much higher volume of circulated air than the other two second-floor bedrooms which appear to be relatively stagnant
39 of 49
Research Report - 0602
0
10
20
30
40
50
60
70
80
90
SF
6 C
on
ce
ntr
ati
on
(m
gm
3)
BR1
Living
Kitchen
BR2
BR3
MBR
Mixing stopped
Mixing restarted
1912 2136 000 224 448 712 936 1200
Hour
Figure 36 Tracer gas decay for 2-story house with exhaust ventilation from the master bathroom at ASHRAE 622 level no central fan operation and bedroom doors closed (Test
B18)
Exhaust Ventilation
Laundry Room vs Master Bathroom
000
005
010
015
020
025
030
Exhaust in laundry room no
mixing 100 ASHRAE
doors closed
Exhaust in master bathroom
no mixing 100 ASHRAE
doors closed
Re
cip
roc
al A
ge
of
Air
(1
hr)
BR1
Living
Kitchen
BR2
BR3
MBR
Figure 37 Reciprocal age-of-air for 2-story house with exhaust ventilation from the master bathroom compared to the laundry room at ASHRAE 622 level no central fan operation
and bedroom doors closed (Tests B1 and B18)
40 of 49
Research Report - 0602
Ventilation Rate
The supply ventilation tests were repeated using flow rates of 60 and 33 of ASHRAE 622 recommendations corresponding to 114 cfm and 63 cfm respectively (Tests B2 and B4) The decay curves are shown in Figures 38 and 39 Reciprocal age-of-air for all three supply ventilation rates are shown in Figure 40 In all cases the rooms remained fairly well mixed especially rooms on the same floor As we observed in the 1-story house the ventilation rate in the 2-story house appeared to have very little effect on the uniformity of outside air provided to each room as long as it was mixed using the air handler One again the initial differences in tracer gas concentration among rooms were as large as the divergence in the decay curves preventing any conclusions about the relative ranking of ventilation rates among rooms for all three cases The error in initial concentration uniformity was bigger for the cases with air handler mixing because the relative divergence in the decay curves was so small compared to that of no air handler mixing In other words the error in relative ranking of ventilation rates for the cases with air handler mixing were not very important anyway because the relative differences between rooms were so small
1536 1648 1800 1912 2024 2136 2248
Hour
Figure 38 Tracer gas decay for 2-story house with supply ventilation at 60 of ASHRAE 622 level 33 central fan operation (20 min off 10 min on) and bedroom doors closed
(Test B2)
0
5
10
15
20
25
30
SF
6 C
on
cen
trati
on
(m
gm
3)
BR1 Living Kitchen BR2 BR3 MBR
Mixing stopped
Mixing restarted
41 of 49
Research Report - 0602
0
5
10
15
20
25
30
35
40
SF
6 C
on
cen
trati
on
(m
gm
3)
BR1
Living
Kitchen
BR2
BR3
MBR
Mixing stopped
Mixing restarted
1200 1312 1424 1536 1648 1800 1912
Hour
Figure 39 Tracer gas decay for 2-story house with supply ventilation at 33 of ASHRAE 622 level 33 central fan operation (20 min off 10 min on) and bedroom doors closed
(Test B4)
Supply Ventilation Rate Comparison
000
005
010
015
020
025
Re
cip
roc
al
Ag
e o
f A
ir (
1h
r)
BR1
Living
Kitchen
BR2
BR3
MBR
Centralized supply Centralized supply Centralized supply
mixing 33 duty mixing 33 duty mixing 33 duty
cycle 95 ASHRAE cycle 60 ASHRAE cycle 33 ASHRAE
doors closed doors closed doors closed
Figure 40 Reciprocal age-of-air for 2-story house with three levels of supply ventilation central fan operation at 33 duty cycle (20 min off 10 min on) and bedroom doors closed (Tests B3 B2 B4) (Note Uncertainties introduced by non-uniform starting
concentration are of the same order of magnitude as the differences in reciprocal age-of-air among rooms for all three cases The relative ranking of rooms is not meaningful for these
cases)
42 of 49
Research Report - 0602
The average air change rates for the three supply ventilation rates compared to the two exhaust ventilation schemes are shown in Figure 41 The CFIS system at 33 of the 622 ventilation flow rate provided a uniformly higher air change rate (013 ach) than the least ventilated rooms using exhaust ventilation from either the laundry or the master bathroom (010 ach Figure 37) It is noteworthy that the combined net air change rate with exhaust ventilation from the laundry room was significantly less than the air change rates for both exhaust ventilation from the master bathroom and supply ventilation at the air handler This illustrates the unpredictability of interactions between mechanical ventilation and natural infiltration which depend strongly on the distribution and size of cracks through which the outside air must pass to enter the house There may have been a relatively large building enclosure leakage opening near the laundry room (perhaps the utility penetrations or the door to the garage) that allowed a significant amount of outside air to quickly enter and leave the house through the exhaust flow without circulating around the house
0
005
01
015
02
025
Ave
rag
e A
CH
Natural Exhaust Exhaust Supply 95 Supply 60 Supply 33
Laundry Mbath
Rm 100 100
Figure 41 Average air change rates for 2-story house with supply ventilation at 33 60 and 95 of ASHRAE 622 recommendations (Tests B4 B2 B3) compared to natural
infiltration (Test B14) and exhaust ventilation with no central fan operation (Test B1) Bedroom doors were closed except for the natural infiltration test
Bedroom Doors
The laundry room exhaust ventilation test with no air handler operation (see Figure 31) was repeated with the doors open to evaluate the change in room-to-room ventilation air distribution (Test B10) The decay curves are shown in Figure 42 and the reciprocal age-of air calculations are shown in Figure 43 It is evident from Figure 42 that the test began before the rooms were
43 of 49
Research Report - 0602
0
5
10
15
20
25
SF
6 C
on
ce
ntr
ati
on
(m
gm
3)
BR1 Living Kitchen BR2 BR3 MBR
Mixing stopped
Mixing restarted
completely well mixed resulting in decay curves that could be somewhat misleading Because the master bedroom was at a higher concentration than the other rooms at the start of the test any room that received air from the master bedroom would appear to have a slower decay rate than it would have if the rooms started out at the same concentration Despite the difference in starting concentration it is clear that outside air was well distributed when the doors were open even without operation of the air handler
1843 1912 1940 2009 2038 2107 2136 2204 2233 2302
Hour
Figure 42 Tracer gas decay for the 2-story house with exhaust ventilation from the laundry room at ASHRAE 622 level no central fan operation and bedroom doors open
(Test B10)
Reciprocal age-of-air analysis was not performed for this case because of the combined effect of a short test duration (~2 hours) and unequal starting tracer gas concentrations even though the house was relatively well-mixed The important conclusion (that opening doors greatly improves mixing) can be drawn by inspecting the decay curves alone
Transfer Grilles
A final exhaust ventilation test was run on the 2-story house with the doors closed and the transfer grilles taped over The decay curves are shown in Figure 43 and the reciprocal age-ofshyair calculations are shown in Figure 44 The curves were clearly very divergent even after 12 hours By examining the reciprocal age-of-air results it is apparent that the transfer grilles in the 2-story house caused a noticeable improvement in ventilation air distribution but the improvement was smaller than when the doors were opened (Figure 42)
44 of 49
Research Report - 0602
0
5
10
15
20
25
30
SF
6 C
on
cen
tra
tio
n (
mg
m3
) BR1 Living Kitchen BR2 BR3 MBR
Mixing stopped
Mixing restarted
1648 1912 2136 000 224 448 712 936
Hour
Figure 43 Tracer gas decay for 2-story house with exhaust ventilation from the laundry room at ASHRAE 622 level no central fan operation bedroom doors closed transfer
grilles taped closed (Test B7)
Exhaust Ventilation Transfer Grilles Untaped vs Taped
000
005
010
015
020
Re
cip
roc
al
Ag
e o
f A
ir (
1h
r)
BR1
Living
Kitchen
BR2
BR3
MBR
Exhaust in laundry room no Exhaust in laundry room no
mixing 100 ASHRAE mixing 100 ASHRAE
doors closed doors closed transfer
grilles taped
Figure 44 Reciprocal age-of-air for 2-story house with exhaust ventilation from the laundry room at ASHRAE 622 level no central fan operation and doors closed In the first case the transfer grilles are untaped (Test B3) in the second they are taped closed
(Test B7)
45 of 49
Research Report - 0602
CONCLUSIONS
bull Reciprocal age-of-air analysis was chosen as a quantitative method for characterizing distribution of ventilation air among rooms This method worked well in cases where rooms were well mixed to begin the test and weather conditions were sufficiently steady-state
bull A test period of at least 1frac12 air changes was necessary to obtain reasonably accurate ageshyof-air results when there was significant divergence in tracer gas concentration among the rooms
bull Although we did not achieve uniform initial concentration of tracer gas in the 2-story house using our test methodology and the equipment at hand we believe the reciprocal age-of-air calculations were meaningful in many of the cases as indicated in the discussion
bull Both houses were relatively tight with natural infiltration averaging 008 ACH for the 1shystory house and 011 ACH for the 2-story house
bull Both houses had relatively small (but not negligible) duct losses to the outside producing an increase in infiltration of less than 003 ACH for the 1-story house and 002 ACH for the 2-story house when the air handler runs
bull Age-of-air analysis indicated that ventilation supplied through the central air distribution system provided much more uniform distribution of ventilation air than the single-point exhaust system when the doors were closed and the air handler was not running For the 1-story house the central-fan-integrated supply ventilation case at 60 of ASHRAE 622 provided more outside air to all rooms than the least-ventilated room in the exhaust case at 100 of 622 For the 2-story house the central-fan-integrated supply system at 33 of the 622 flow rate provided more outside air to all rooms than the least ventilated rooms using exhaust ventilation at 100 of 622 from either the laundry or the master bathroom
bull Operation of the central fan at a 33 duty cycle maintained relatively well-mixed conditions regardless of ventilation rate type of ventilation system (supply or exhaust) or house configuration (1-story or 2-story)
bull Exhaust location affected both the relative amount of outside air received by different rooms and the overall uniformity among rooms but the effect was not predictable
bull For exhaust-only ventilation without central fan operation opening bedroom doors appeared to significantly improve the mixing of ventilation air among rooms
bull Transfer grilles improved the distribution of ventilation air slightly but much less than opening the bedroom doors
bull In the 2-story house the stack effect caused air movement from the first floor to the second floor even when exhaust ventilation was applied to the first floor resulting in consistently higher tracer gas concentrations on the second floor and more non-uniform ventilation air distribution in general
bull Interactions between natural infiltration and both exhaust and supply mechanical ventilation were very significant When the ventilation system was activated the combined air change rate did not increase commensurate with the measured ventilation rate but instead increased by only half that amount This result was consistent with combining ventilation and infiltration in quadrature to estimate whole-house air change rate in accordance with ASHRAE Standard 136 (ASHRAE 1993)
46 of 49
Research Report - 0602
FUTURE WORK
In future tests continuous monitoring of pressure differentials would enhance our understanding of the multi-zone combined infiltration and ventilation systems and our ability to model them That would help to explain differences between tests in more detail including the effects of multiple stories location of ventilation supply outlets and exhaust inlets interior door closure and use of passive return air transfer grilles Pressure differential measurement points should include
bull dP with respect to outside for each closed room and open space bull dP across closed interior doors bull dP between the floor cavity and outdoors and bull dP between the house and the attic
Measurement of wind direction along with wind speed could also be helpful for modeling these buildings and systems However because of micro-climate wind shielding it may be very difficult to relate a single-point wind direction measurement to actual wind vectors on the building surfaces
ACKNOWLEDGMENTS
The authors express their appreciation to Rich Coyle of DR Horton for providing the test houses and to Joseph Lstiburek of BSC Subrato Chandra and Neil Moyer of FSEC and Greg Barker of Mountain Energy Partnership for their assistance in the planning and execution of this ventilation study
47 of 49
Research Report - 0602
REFERENCES
ASHRAE (1993) ANSIASHRAE Standard 136-1993 A Method of Determining Air Change Rates in Detached Dwellings Atlanta GA American Society of Heating Refrigerating and Air-Conditioning Engineers Inc
ASHRAE (1997) ANSIASHRAE Standard 129-1997 Measuring Air-Change Effectiveness Atlanta GA American Society of Heating Refrigerating and Air-Conditioning Engineers Inc
ASHRAE (2004) ASHRAE Standard 622-2004 Ventilation and Acceptable Indoor Air Quality in Low-Rise Residential Buildings Atlanta GA American Society of Heating Refrigerating and Air-Conditioning Engineers Inc
CSA (2003) CANCSA F326-M91 Residential Mechanical Ventilation Systems Canadian Standards Association Ontario Canada httpwwwcsashyintlorgonlinestoreGetCatalogItemDetailsaspmat=2410793ampParent=102
NBC 2005 National Building Code of Canada httpircnrcshycnrcgccapubscodesnrcc47666_ehtml
Grieve PW (1991) Measuring Ventilation Using Tracer-Gases Denmark Bruumlel amp Kjaeligr
MN Chapter 7672 Minnesota Energy Code Chapter 7672 Detached Single-Family And Two-Family Dwellings httpwwwstatemnusmnexternalDocsCommerceChapter_7672_Residential_111302012428 _72rulepdf
Persily AK Martin SR (2000) A Modeling Study of Ventilation in Manufactured Houses Gaithersburg MD National Institute of Standards and Technology NISTIR 6455
Rudd A Lstiburek J (2000) ldquoMeasurement of Ventilation and Interzonal Distribution in Single-Family Homesrdquo ASHRAE Transactions 2000 MN-00-10-3 V 106 Pt2 American Society of Heating Refrigeration and Air-Conditioning Engineers Atlanta GA
WAC (2004) Washington State Title 51 WAC Community trade and economic development department of (building code council) Chapter 51-13 Ventilation and indoor air quality httpappslegwagovWACdefaultaspxcite=51-13
48 of 49
Research Report - 0602
Field test of room-to-room uniformity of ventilation air distribution in two new houses
About this Report
This report was prepared for the US Department of Energyrsquos Building America
Program The report is freely available to the public at wwwbuildingamericagov
The authors express their appreciation to Rich Coyle of DR Horton for providing the test houses and to Joseph Lstiburek of BSC Subrato Chandra and Neil Moyer of
FSEC and Greg Barker of Mountain Energy Partnership for their assistance in the planning and execution of this ventilation study
About the Authors
Robert Hendron Ren Anderson Dennis Barley are with National Renewable Energy Laboratory Armin Rudd and Aaron Townsend are with Building Science Corporation
Ed Hancock is with Mountain Energy Partnership
Direct all correspondence to Building Science Corporation 30 Forest Street Somerville MA 02143
Limits of Liability and Disclaimer of Warranty
Building Science documents are intended for professionals The author and the publisher of this article have used their best efforts to provide accurate and authoritative information in regard to the subject matter covered The author and publisher make no warranty of any kind expressed or implied with regard to the information contained in this article
The information presented in this article must be used with care by professionals who understand the implications of what they are doing If professional advice or other expert assistance is required the services of a competent professional shall be sought The author and publisher shall not be liable in the event of incidental or consequential damages in connection with or arising from the use of the information contained within this Building Science document
49 of 49
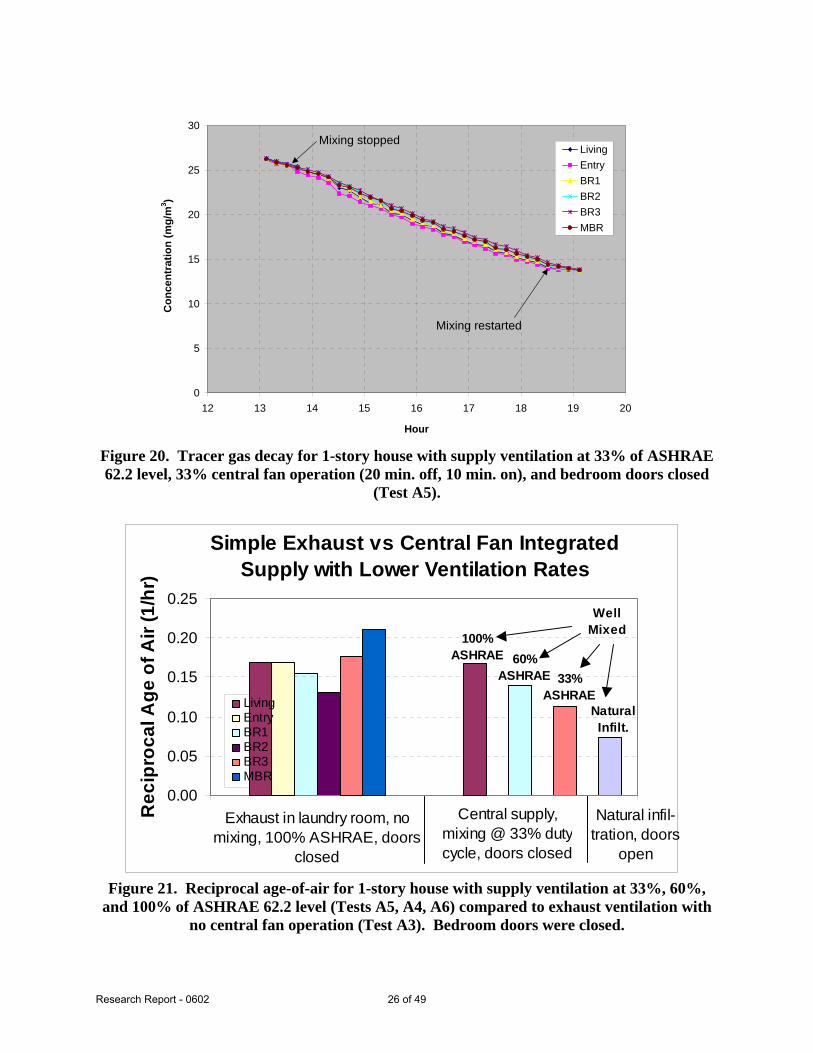
Research Report - 0602
0
5
10
15
20
25
30
Co
nce
ntr
ati
on
(m
gm
3 )
Living
Entry
BR1
BR2
BR3
MBR
Mixing stopped
Mixing restarted
12 13 14 15 16 17 18 19 20
Hour
Figure 20 Tracer gas decay for 1-story house with supply ventilation at 33 of ASHRAE 622 level 33 central fan operation (20 min off 10 min on) and bedroom doors closed
(Test A5)
Simple Exhaust vs Central Fan Integrated
Supply with Lower Ventilation Rates
025
Re
cip
roc
al A
ge
of
Air
(1
hr)
Well Mixed
100
ASHRAE 60
ASHRAE 33
ASHRAE Living Entry 010 Natural
BR1 Infilt
BR2 BR3 005
MBR
Exhaust in laundry room no
000
Central supply Natural infil-
mixing 100 ASHRAE doors mixing 33 duty tration doors
closed cycle doors closed open
Figure 21 Reciprocal age-of-air for 1-story house with supply ventilation at 33 60 and 100 of ASHRAE 622 level (Tests A5 A4 A6) compared to exhaust ventilation with
no central fan operation (Test A3) Bedroom doors were closed
020
015
26 of 49
Research Report - 0602
Simulations by Walker (2006) have shown that all systems will not provide the same service in terms of annual average air change rate For the same air flow rate and duty cycle balanced ventilation will yield a higher average air exchange than supply ventilation and supply ventilation will yield a higher average air exchange than exhaust ventilation That can be explained in general terms by understanding that wind and stack effects act to depressurize a building most of the time Exhaust fans increase the building depressurization further but supply fans decrease the depressurization Balanced fans donrsquot change the enclosure differential pressure and air flow at all Because of the non-linear relationship between differential pressure and air flows across the building enclosure a supply fan changes the pressures across the enclosure less than an exhaust fan acting more like a balanced fan The result is that the effect on ventilation air change rate from a supply fan is somewhere between that of an exhaust fan and a true balanced system
Bedroom Doors
Except for the natural ventilation test the preceding tests were all conducted with the bedroom doors closed to simulate a worst-case situation for air circulation within the house The exhaust ventilation test was repeated with the bedroom doors open (Test A9) producing the tracer gas decay curve shown in Figure 22 It is evident that the decay curves were much more tightly bundled with the doors open than they were with the doors closed (compare Figure 12) A comparison based on reciprocal age-of-air is shown in Figure 23 A significant improvement in room-to-room mixing is evident during the open-door test
It is also evident that the average air change rate was higher when the doors were open (0202 vs 0176 ACH) but it must be remembered that the ventilation rate was controlled using a duct blaster and average wind speed was higher during the open-door test period compared to the closed-door test period (20 mph compared to 06 mph) Therefore this test alone does not necessarily indicate that closing doors reduces the average air change rate associated with an exhaust system In future tests continuous measurement of the depressurization of the house with respect to outside along with single-point pressure measurements across interior doors would provide more information about the effect of closing doors when exhaust ventilation systems are used It would also be valuable to conduct this test during steady weather conditions using the exhaust fan (with uncontrolled ventilation rate) instead of the duct blaster to observe the net effect of closed doors on whole-house air change rate
27 of 49
Research Report - 0602
0
5
10
15
20
25
30
Co
ncen
trati
on
(m
gm
3 )
Living
Entry
BR1
BR2
BR3
MBR
Mixing stopped
Mixing restarted
181 191 201 211 221 231 01 11 21 31 41 51 61 71
Hour
Figure 22 Tracer gas decay for 1-story house with exhaust ventilation from the laundry room at ASHRAE 622 level no central fan operation and bedroom doors open (Test A9)
Exhaust Ventilation
Doors Closed vs Doors Open
000
005
010
015
020
025
Re
cip
roc
al
Ag
e o
f A
ir (
1h
r)
Living
Entry
BR1
BR2
BR3
MBR
Exhaust in laundry room Doors open no mixing
no mixing 100 exhaust in laundry room
ASHRAE doors closed 100 ASHRAE
Figure 23 Reciprocal age-of-air for 1-story house with exhaust ventilation from the laundry room at ASHRAE 622 level no central fan operation In the first case the bedroom doors were closed (Test A3) in the second the doors were open (Test A9)
28 of 49
Research Report - 0602
Transfer Grilles
Because the test houses used central returns instead of hard ducted returns in the bedrooms transfer grilles were installed over the bedroom doors to provide a flow path for return air without excessive room pressurization when the doors were closed These transfer grilles also allowed ventilation air to pass more freely from the bedrooms to the main living space The effect of transfer grilles on ventilation air distribution was evaluated by taping over the grilles (see Figure 24) and re-running the exhaust ventilation test (Test A10) The corresponding tracer gas decay curve is shown in Figure 25 and the reciprocal age-of-air analysis is shown in Figure 26 Taping the transfer grilles did not appear to significantly affect the room-to-room variability in ventilation rate although there appeared to be some slight re-ranking of rooms from highest to lowest reciprocal age-of-air It should be noted that there was an increase in average wind speed from 26 mph to 41 mph starting at 1 pm including a half hour period where the average wind speed was 7 mph This weather effect produced noticeable kinks in the decay curves and therefore would be expected to introduce significant errors into the reciprocal age-of-air results
Itrsquos possible that the transfer grilles played a much smaller role in providing a path for ventilation air than the supply ducts Because the air handler was not operating the ducts were not pressurized and were thus available as passive airflow conduits The resistance to air flow was probably smaller for the air ducts than for the transfer grilles depending on their size and the number of supply registers in each bedroom The existing door undercuts are also thought to have played a role The effect of ducts and door undercuts can be tested in the future by running separate tests with ducts and door undercuts taped over
copy buildingsciencecom
Figure 24 Transfer grilles over bedroom doors taped closed
29 of 49
Research Report - 0602
0
10
20
30
40
50
60
70
Co
nc
en
tra
tio
n (
mg
m3 )
Living
Entry
BR1
BR2
BR3
MBR
Mixing stopped
Mixing restarted
8 9 10 11 12 13 14 15 16 17
Hour
Figure 25 Tracer gas decay for 1-story house with exhaust ventilation from the laundry room at ASHRAE 622 level no central fan operation bedroom doors closed and transfer
grilles taped (Test A10)
Exhaust Ventilation
000
005
010
015
020
025
Re
cip
roc
al
Ag
e o
f A
ir (
1h
r)
Living
Entry
BR1
BR2
BR3
MBR
Transfer Grilles Untaped vs Taped
Exhaust in laundry room no Exhaust in laundry room no
mixing 100 ASHRAE mixing 100 ASHRAE
doors closed doors closed transfer
grilles taped
Figure 26 Reciprocal age-of-air for 1-story house with exhaust ventilation from the laundry room at ASHRAE 622 level no central fan operation and doors closed In the
30 of 49
Research Report - 0602
first case the transfer grilles are untaped (Test A3) in the second they are taped closed (Test A10)
Minimum Test Duration
We were fortunate that DR Horton provided two full weeks of access to these homes to conduct this series of tests which allowed us to run some of the more important tracer gas decay tests as long as 12 hours to help ensure that we could accurately calculate reciprocal age-of-air In most cases test houses would not be available for such a long time period To evaluate the length of time needed to estimate the reciprocal age-of-air with reasonable accuracy we examined the results that we would have obtained for one of the exhaust ventilation tests had we halted the test period after less than 12 hours For the supply ventilation tests the rooms were sufficiently well-mixed that the test could have been stopped after 3 or 4 hours assuming weather effects were steady
The reciprocal age-of-air calculations for the exhaust ventilation decay curves (Test A3 see Figure 12) based on test durations of 3 6 9 and 12 hours are shown in Figure 27 These test durations range from 053 to 21 air changes based on the average air change rate of 018 ACH (56 hours per air change) calculated for this test The ratio of highest to lowest reciprocal ageshyof-air is shown above the data points for each case These results suggest that shorter tests tend to overestimate the range and that perhaps 1frac12-2 air changes (roughly 9 to 12 hours in this case) may be necessary to obtain accurate calculations of reciprocal age-of-air when there is significant divergence among rooms From a qualitative standpoint one air change may be sufficient to determine the basic trend Without knowing in advance what mixing pattern will occur it is difficult to recommend a minimum test duration But assuming this test is fairly representative of a worst-case scenario a minimum of 15 air changes would be necessary to have a high degree of confidence in the quantitative difference in reciprocal age-of-air among rooms
31 of 49
Research Report - 0602
000
005
010
015
020
025
030
035
Re
cip
roc
al
Ag
e-O
f-A
ir (
hr-1
)
Living
Entry
BR1
BR2
BR3
MBR HighLow = 297
HighLow = 168 HighLow = 184 HighLow = 161
3-hour Test 6-hour Test 9-hour Test 12-hour Test
(053 Air Changes) (11 Air Changes) (16 Air Changes) (21 Air Changes)
Test Duration
Figure 27 Reciprocal age-of-air based on alternate test durations for 1-story house with exhaust ventilation from the laundry room at ASHRAE 622 level no central fan operation
and doors closed (Test A3) Average air change rate was 018 ACH
TEST RESULTS FROM 2-STORY HOUSE (1117 MONTAGUE)
The 2-story house was tested from January 3-10 2006 Three zones were selected on the first floor and three more were selected on the second floor as indicated by the red stars in Figure 4 The initial mixing of air among the rooms at the start of each test in this 2-story house was not as thorough as it was in the 1-story house Evidently the combined effects of the air handler and the portable de-stratification fan were not sufficient to overcome upward transport of tracer gas driven by the stack effect from the first to the second floor The resulting difference in initial tracer gas concentration among the rooms was about 5-10 This outcome emphasizes the significant effect of stack-driven infiltration on ventilation non-uniformity in multi-story homes Because our test method and equipment did not achieve a well-mixed condition at the start of each test there were some errors introduced into the reciprocal age-of-air analysis For future tests we would recommend larger de-stratification fans to obtain more well-mixed conditions in multi-story houses
Typical errors introduced by incomplete mixing of the tracer gas at the start of such a test were analyzed by examining two hypothetical cases where either all of the air entering a room comes from the outside or all of the air comes from an adjacent room with a different starting concentration If all of the air entering a space comes from the outside then a change in the initial concentration would have no effect on the reciprocal age-of-air because the decay curve would be exponential from the start and the area under the curve would be normalized based on
32 of 49
Research Report - 0602
the starting concentration in that zone However if the air entering a room passes through another room with a lower initial concentration the room receiving the air will have a lower concentration of tracer gas throughout the test compared to what the concentration would have been if the starting points were the same in both rooms This case is illustrated in Figure 28 where assumptions are made that the rooms are the same size the air exchange rate is 01 ACH for both rooms and the initial tracer gas concentration is 10 lower in the first room (upstream) than it is in the second room
The effect on reciprocal age-of-air is shown in Figure 29 A 10 difference in starting concentration results in an error of about 75 in reciprocal age-of-air for a room downstream of a room with a lower starting concentration assuming 01 ACH for both rooms The error would be somewhat smaller (about 5) if the air change rate was higher for both rooms (02 ACH) There would be no error introduced for rooms where all of the air infiltration comes from the outside Although the amount of error in the reciprocal age-of-air calculations can be affected by additional variables not examined here we feel that these percentages are reasonable estimates of the errors in our results for the 2-story house due to incomplete initial mixing of air
In each case an engineering judgment must be made regarding the significance of the error introduced by incomplete initial mixing As a general rule the differences in concentration at the start of the test should be small compared to the differences that are being measured in order for the results to be considered valid
Figure 28 Theoretical decay curves for a well-mixed case with uniform tracer gas concentration compared to a case where the upstream room starts with a concentration
10 lower than the downstream room
33 of 49
Research Report - 0602
Figure 29 Theoretical reciprocal age-of-air for a well-mixed case with uniform tracer gas concentration compared to a case where the upstream room starts with a concentration
10 lower than the downstream room
Natural Infiltration and Duct Leakage
A natural infiltration test was performed over a two hour period on the evening of January 8 (Test B14) The tracer gas decay curves are shown in Figure 30 There was a slight divergence between the first floor and second floor once the air handler was turned off but the rooms on each floor appeared to remain fairly well-mixed The average air change rate during the test period was about 011 ACH which was somewhat higher than the 1-story house as might be expected with an increased stack height
An air handler bedroom door bump test was conducted just prior to the test period shown in Figure 30 allowing observation of the combined effect of duct leakage to the outside and increased infiltration caused by room pressurization The average air change rate during that bump test was 013 ACH suggesting that closing doors and operating the fan added approximately 002 ACH to the whole-house average air change rate The average wind speed was a bit higher while the air handler was running (17 mph compared to 05 mph) so the effect of air handler operation may actually be somewhat less than the average ACH numbers indicate
34 of 49
Research Report - 0602
0
1
2
3
4
SF
6 C
on
ce
ntr
ati
on
(m
gm
3)
BR1
Living
Kitchen
BR2
BR3
MBR
Mixing stopped
Mixing restarted
1814 1843 1912 1940 2009 2038 2107 2136
Hour
Figure 30 Tracer gas decay for 2-story house with no ventilation no central fan operation and bedroom doors open (Test B14)
Distributed Supply vs Point Exhaust Ventilation
A 14-hour test (Test B1) was performed with an exhaust ventilation rate of 63 cfm in the laundry room which was located near the stairwell in the middle of the first floor The ventilation rate was again consistent with the ASHRAE 622 recommendations The tracer gas decay curves are shown in Figure 31 It is interesting that all three second floor rooms showed a delay before entering an exponential decay suggesting that some amount of air was moving from the first floor to the second floor even though the mechanical exhaust point was on the first floor It appears that the further depressurization of the first floor was insufficient to overcome the stack effect and draw a significant amount of outside air in through the rooms on the second floor
35 of 49
Research Report - 0602
182
9
192
9
202
9
212
9
222
9
232
9
029
129
229
329
429
529
629
729
828
929
102
8
112
8
122
8
0
10
20
30
40
50
60
70
SF
6 C
on
ce
ntr
ati
on
(m
gm
3)
BR1
Living
Kitchen
BR2
BR3
MBR
Mixing stopped
Mixing restarted
Hour
Figure 31 Tracer gas decay for 2-story house with exhaust ventilation from the laundry room at ASHRAE 622 level no central fan operation and bedroom doors closed (Test B1)
A supply ventilation test was performed on the 2-story house for about 11 hours starting late on January 4 (Test B3) The duct blaster was unable to provide the ventilation rate necessary to meet the minimum specified in ASHRAE 622 supplying 180 cfm instead of 189 cfm (95) The decay curves are shown in Figure 32 Although the curves are much more tightly packed than they were with the exhaust system there is more divergence than we saw with the supply system in the 1-story house most notably in the master bedroom
The reciprocal age-of-air calculations for both the exhaust and supply ventilation systems are shown in Figure 33 Again the results indicate that much better room-to-room distribution of ventilation air was achieved by the central-fan integrated supply system compared to the single-point exhaust system However for the supply ventilation test the differences in the initial tracer gas concentration were of the same magnitude as the differences in decay rates among the rooms As a result no conclusions should be drawn about the relative ranking of the supply ventilation rate among rooms based on Figure 33
36 of 49
Research Report - 0602
0
10
20
30
40
50
60
SF
6 C
on
ce
ntr
ati
on
(m
gm
3)
BR1
Living
Kitchen
BR2
BR3
MBR
Mixing stopped
Mixing restarted
2136 000 224 448 712 936 1200
Hour
Figure 32 Tracer gas decay for 2-story house with supply ventilation just under ASHRAE 622 level central fan operation at 33 duty cycle (20 min off 10 min on) and bedroom
doors closed (Test B3)
Simple Exhaust vs Central Fan Integrated
Supply )
000
005
010
015
020
025
Recip
rocal A
ge o
f A
ir (
1h
r
BR1
Living
Kitchen
BR2
BR3
MBR
Exhaust in laundry room no Centralized supply mixing
mixing 100 ASHRAE 33 duty cycle 95
doors closed ASHRAE doors closed
Figure 33 Reciprocal age-of-air for 2-story house with continuous exhaust ventilation (Test B1) compared to central fan integrated supply ventilation (Test B3) (Note
Uncertainties introduced by non-uniform starting concentration are of the same order of magnitude as the differences in reciprocal age-of-air among rooms for the supply ventilation case The relative ranking of rooms is not meaningful for that case)
37 of 49
Research Report - 0602
Air Handler Operation
The effect of occasional air handler operation on the distribution of exhaust ventilation air was evaluated on the afternoon of January 6 (Test B6) The tracer gas decay curves are shown in Figure 34 and reciprocal age-of-air calculations are shown in Figure 35 It should again be noted that before the test started the house was mixed using both the air handler and a de-stratification fan with the doors open During the test the doors were closed the de-stratification fan was turned off and the air handler operated at a 33 duty cycle (20 minutes off 10 minutes on) As was the case in the 1-story house this occasional operation of the air handler substantially improved the distribution of ventilation air among rooms even in conjunction with the point exhaust ventilation system There was very little divergence noticeable even with the air handler cycling on and off every half hour However because the initial differences in tracer gas concentration among rooms were as large as the differences in reciprocal age-of-air for the case with air handler operation no conclusions should be drawn about the relative ranking of ventilation rates among the rooms for that case
SF
6 C
on
cen
trati
on
(m
gm
3)
80
70
60
50
40
30
20
10
0
BR1
Living
Kitchen
BR2
BR3
MBR
Mixing stopped
Mixing restarted
1048 1200 1312 1424 1536 1648 1800 1912 2024
Hour
Figure 34 Tracer gas decay for 2-story house with continuous exhaust ventilation at ASHRAE 622 level central fan operation at 33 duty cycle (20 min off 10 min on) and
bedroom doors closed (Test B6)
38 of 49
Research Report - 0602
020
015 R
ec
ipro
ca
l A
ge
of
Air
(1
hr)
Exhaust Ventilation
No Mixing vs 33 Air Handler Duty Cycle
Exhaust in laundry room
no mixing 100
ASHRAE doors closed
33 air handler
operation exhaust in
laundry room 100
ASHRAE doors closed
BR1
Living
Kitchen
BR2
BR3
MBR
010
005
000
Figure 35 Reciprocal age-of-air for 2-story house with continuous exhaust ventilation with and without air handler operation (Tests B1 and B6) (Note Uncertainties introduced by non-uniform starting concentration are of the same order of magnitude as the differences in reciprocal age-of-air among rooms for the case with air handler operation The relative
ranking of rooms is not meaningful for that case)
Exhaust Location
The duct blaster was moved to the master bathroom exhaust register to see if there was a resulting change in ventilation air distribution (Test B18) The master bathroom was in the back of the house on the second floor between the master bedroom and bedroom 3 The decay curves are shown in Figure 36 and the reciprocal age-of-air results are shown in Figure 37 The rooms on each floor were well mixed before the test began although the mixing between the two floors was not as good Very wide divergence among rooms can be seen during the test especially between the upstairs bedrooms and the rest of the house Once again all three upstairs rooms appear to receive some air from the first floor but the master bedroom experiences a much higher volume of circulated air than the other two second-floor bedrooms which appear to be relatively stagnant
39 of 49
Research Report - 0602
0
10
20
30
40
50
60
70
80
90
SF
6 C
on
ce
ntr
ati
on
(m
gm
3)
BR1
Living
Kitchen
BR2
BR3
MBR
Mixing stopped
Mixing restarted
1912 2136 000 224 448 712 936 1200
Hour
Figure 36 Tracer gas decay for 2-story house with exhaust ventilation from the master bathroom at ASHRAE 622 level no central fan operation and bedroom doors closed (Test
B18)
Exhaust Ventilation
Laundry Room vs Master Bathroom
000
005
010
015
020
025
030
Exhaust in laundry room no
mixing 100 ASHRAE
doors closed
Exhaust in master bathroom
no mixing 100 ASHRAE
doors closed
Re
cip
roc
al A
ge
of
Air
(1
hr)
BR1
Living
Kitchen
BR2
BR3
MBR
Figure 37 Reciprocal age-of-air for 2-story house with exhaust ventilation from the master bathroom compared to the laundry room at ASHRAE 622 level no central fan operation
and bedroom doors closed (Tests B1 and B18)
40 of 49
Research Report - 0602
Ventilation Rate
The supply ventilation tests were repeated using flow rates of 60 and 33 of ASHRAE 622 recommendations corresponding to 114 cfm and 63 cfm respectively (Tests B2 and B4) The decay curves are shown in Figures 38 and 39 Reciprocal age-of-air for all three supply ventilation rates are shown in Figure 40 In all cases the rooms remained fairly well mixed especially rooms on the same floor As we observed in the 1-story house the ventilation rate in the 2-story house appeared to have very little effect on the uniformity of outside air provided to each room as long as it was mixed using the air handler One again the initial differences in tracer gas concentration among rooms were as large as the divergence in the decay curves preventing any conclusions about the relative ranking of ventilation rates among rooms for all three cases The error in initial concentration uniformity was bigger for the cases with air handler mixing because the relative divergence in the decay curves was so small compared to that of no air handler mixing In other words the error in relative ranking of ventilation rates for the cases with air handler mixing were not very important anyway because the relative differences between rooms were so small
1536 1648 1800 1912 2024 2136 2248
Hour
Figure 38 Tracer gas decay for 2-story house with supply ventilation at 60 of ASHRAE 622 level 33 central fan operation (20 min off 10 min on) and bedroom doors closed
(Test B2)
0
5
10
15
20
25
30
SF
6 C
on
cen
trati
on
(m
gm
3)
BR1 Living Kitchen BR2 BR3 MBR
Mixing stopped
Mixing restarted
41 of 49
Research Report - 0602
0
5
10
15
20
25
30
35
40
SF
6 C
on
cen
trati
on
(m
gm
3)
BR1
Living
Kitchen
BR2
BR3
MBR
Mixing stopped
Mixing restarted
1200 1312 1424 1536 1648 1800 1912
Hour
Figure 39 Tracer gas decay for 2-story house with supply ventilation at 33 of ASHRAE 622 level 33 central fan operation (20 min off 10 min on) and bedroom doors closed
(Test B4)
Supply Ventilation Rate Comparison
000
005
010
015
020
025
Re
cip
roc
al
Ag
e o
f A
ir (
1h
r)
BR1
Living
Kitchen
BR2
BR3
MBR
Centralized supply Centralized supply Centralized supply
mixing 33 duty mixing 33 duty mixing 33 duty
cycle 95 ASHRAE cycle 60 ASHRAE cycle 33 ASHRAE
doors closed doors closed doors closed
Figure 40 Reciprocal age-of-air for 2-story house with three levels of supply ventilation central fan operation at 33 duty cycle (20 min off 10 min on) and bedroom doors closed (Tests B3 B2 B4) (Note Uncertainties introduced by non-uniform starting
concentration are of the same order of magnitude as the differences in reciprocal age-of-air among rooms for all three cases The relative ranking of rooms is not meaningful for these
cases)
42 of 49
Research Report - 0602
The average air change rates for the three supply ventilation rates compared to the two exhaust ventilation schemes are shown in Figure 41 The CFIS system at 33 of the 622 ventilation flow rate provided a uniformly higher air change rate (013 ach) than the least ventilated rooms using exhaust ventilation from either the laundry or the master bathroom (010 ach Figure 37) It is noteworthy that the combined net air change rate with exhaust ventilation from the laundry room was significantly less than the air change rates for both exhaust ventilation from the master bathroom and supply ventilation at the air handler This illustrates the unpredictability of interactions between mechanical ventilation and natural infiltration which depend strongly on the distribution and size of cracks through which the outside air must pass to enter the house There may have been a relatively large building enclosure leakage opening near the laundry room (perhaps the utility penetrations or the door to the garage) that allowed a significant amount of outside air to quickly enter and leave the house through the exhaust flow without circulating around the house
0
005
01
015
02
025
Ave
rag
e A
CH
Natural Exhaust Exhaust Supply 95 Supply 60 Supply 33
Laundry Mbath
Rm 100 100
Figure 41 Average air change rates for 2-story house with supply ventilation at 33 60 and 95 of ASHRAE 622 recommendations (Tests B4 B2 B3) compared to natural
infiltration (Test B14) and exhaust ventilation with no central fan operation (Test B1) Bedroom doors were closed except for the natural infiltration test
Bedroom Doors
The laundry room exhaust ventilation test with no air handler operation (see Figure 31) was repeated with the doors open to evaluate the change in room-to-room ventilation air distribution (Test B10) The decay curves are shown in Figure 42 and the reciprocal age-of air calculations are shown in Figure 43 It is evident from Figure 42 that the test began before the rooms were
43 of 49
Research Report - 0602
0
5
10
15
20
25
SF
6 C
on
ce
ntr
ati
on
(m
gm
3)
BR1 Living Kitchen BR2 BR3 MBR
Mixing stopped
Mixing restarted
completely well mixed resulting in decay curves that could be somewhat misleading Because the master bedroom was at a higher concentration than the other rooms at the start of the test any room that received air from the master bedroom would appear to have a slower decay rate than it would have if the rooms started out at the same concentration Despite the difference in starting concentration it is clear that outside air was well distributed when the doors were open even without operation of the air handler
1843 1912 1940 2009 2038 2107 2136 2204 2233 2302
Hour
Figure 42 Tracer gas decay for the 2-story house with exhaust ventilation from the laundry room at ASHRAE 622 level no central fan operation and bedroom doors open
(Test B10)
Reciprocal age-of-air analysis was not performed for this case because of the combined effect of a short test duration (~2 hours) and unequal starting tracer gas concentrations even though the house was relatively well-mixed The important conclusion (that opening doors greatly improves mixing) can be drawn by inspecting the decay curves alone
Transfer Grilles
A final exhaust ventilation test was run on the 2-story house with the doors closed and the transfer grilles taped over The decay curves are shown in Figure 43 and the reciprocal age-ofshyair calculations are shown in Figure 44 The curves were clearly very divergent even after 12 hours By examining the reciprocal age-of-air results it is apparent that the transfer grilles in the 2-story house caused a noticeable improvement in ventilation air distribution but the improvement was smaller than when the doors were opened (Figure 42)
44 of 49
Research Report - 0602
0
5
10
15
20
25
30
SF
6 C
on
cen
tra
tio
n (
mg
m3
) BR1 Living Kitchen BR2 BR3 MBR
Mixing stopped
Mixing restarted
1648 1912 2136 000 224 448 712 936
Hour
Figure 43 Tracer gas decay for 2-story house with exhaust ventilation from the laundry room at ASHRAE 622 level no central fan operation bedroom doors closed transfer
grilles taped closed (Test B7)
Exhaust Ventilation Transfer Grilles Untaped vs Taped
000
005
010
015
020
Re
cip
roc
al
Ag
e o
f A
ir (
1h
r)
BR1
Living
Kitchen
BR2
BR3
MBR
Exhaust in laundry room no Exhaust in laundry room no
mixing 100 ASHRAE mixing 100 ASHRAE
doors closed doors closed transfer
grilles taped
Figure 44 Reciprocal age-of-air for 2-story house with exhaust ventilation from the laundry room at ASHRAE 622 level no central fan operation and doors closed In the first case the transfer grilles are untaped (Test B3) in the second they are taped closed
(Test B7)
45 of 49
Research Report - 0602
CONCLUSIONS
bull Reciprocal age-of-air analysis was chosen as a quantitative method for characterizing distribution of ventilation air among rooms This method worked well in cases where rooms were well mixed to begin the test and weather conditions were sufficiently steady-state
bull A test period of at least 1frac12 air changes was necessary to obtain reasonably accurate ageshyof-air results when there was significant divergence in tracer gas concentration among the rooms
bull Although we did not achieve uniform initial concentration of tracer gas in the 2-story house using our test methodology and the equipment at hand we believe the reciprocal age-of-air calculations were meaningful in many of the cases as indicated in the discussion
bull Both houses were relatively tight with natural infiltration averaging 008 ACH for the 1shystory house and 011 ACH for the 2-story house
bull Both houses had relatively small (but not negligible) duct losses to the outside producing an increase in infiltration of less than 003 ACH for the 1-story house and 002 ACH for the 2-story house when the air handler runs
bull Age-of-air analysis indicated that ventilation supplied through the central air distribution system provided much more uniform distribution of ventilation air than the single-point exhaust system when the doors were closed and the air handler was not running For the 1-story house the central-fan-integrated supply ventilation case at 60 of ASHRAE 622 provided more outside air to all rooms than the least-ventilated room in the exhaust case at 100 of 622 For the 2-story house the central-fan-integrated supply system at 33 of the 622 flow rate provided more outside air to all rooms than the least ventilated rooms using exhaust ventilation at 100 of 622 from either the laundry or the master bathroom
bull Operation of the central fan at a 33 duty cycle maintained relatively well-mixed conditions regardless of ventilation rate type of ventilation system (supply or exhaust) or house configuration (1-story or 2-story)
bull Exhaust location affected both the relative amount of outside air received by different rooms and the overall uniformity among rooms but the effect was not predictable
bull For exhaust-only ventilation without central fan operation opening bedroom doors appeared to significantly improve the mixing of ventilation air among rooms
bull Transfer grilles improved the distribution of ventilation air slightly but much less than opening the bedroom doors
bull In the 2-story house the stack effect caused air movement from the first floor to the second floor even when exhaust ventilation was applied to the first floor resulting in consistently higher tracer gas concentrations on the second floor and more non-uniform ventilation air distribution in general
bull Interactions between natural infiltration and both exhaust and supply mechanical ventilation were very significant When the ventilation system was activated the combined air change rate did not increase commensurate with the measured ventilation rate but instead increased by only half that amount This result was consistent with combining ventilation and infiltration in quadrature to estimate whole-house air change rate in accordance with ASHRAE Standard 136 (ASHRAE 1993)
46 of 49
Research Report - 0602
FUTURE WORK
In future tests continuous monitoring of pressure differentials would enhance our understanding of the multi-zone combined infiltration and ventilation systems and our ability to model them That would help to explain differences between tests in more detail including the effects of multiple stories location of ventilation supply outlets and exhaust inlets interior door closure and use of passive return air transfer grilles Pressure differential measurement points should include
bull dP with respect to outside for each closed room and open space bull dP across closed interior doors bull dP between the floor cavity and outdoors and bull dP between the house and the attic
Measurement of wind direction along with wind speed could also be helpful for modeling these buildings and systems However because of micro-climate wind shielding it may be very difficult to relate a single-point wind direction measurement to actual wind vectors on the building surfaces
ACKNOWLEDGMENTS
The authors express their appreciation to Rich Coyle of DR Horton for providing the test houses and to Joseph Lstiburek of BSC Subrato Chandra and Neil Moyer of FSEC and Greg Barker of Mountain Energy Partnership for their assistance in the planning and execution of this ventilation study
47 of 49
Research Report - 0602
REFERENCES
ASHRAE (1993) ANSIASHRAE Standard 136-1993 A Method of Determining Air Change Rates in Detached Dwellings Atlanta GA American Society of Heating Refrigerating and Air-Conditioning Engineers Inc
ASHRAE (1997) ANSIASHRAE Standard 129-1997 Measuring Air-Change Effectiveness Atlanta GA American Society of Heating Refrigerating and Air-Conditioning Engineers Inc
ASHRAE (2004) ASHRAE Standard 622-2004 Ventilation and Acceptable Indoor Air Quality in Low-Rise Residential Buildings Atlanta GA American Society of Heating Refrigerating and Air-Conditioning Engineers Inc
CSA (2003) CANCSA F326-M91 Residential Mechanical Ventilation Systems Canadian Standards Association Ontario Canada httpwwwcsashyintlorgonlinestoreGetCatalogItemDetailsaspmat=2410793ampParent=102
NBC 2005 National Building Code of Canada httpircnrcshycnrcgccapubscodesnrcc47666_ehtml
Grieve PW (1991) Measuring Ventilation Using Tracer-Gases Denmark Bruumlel amp Kjaeligr
MN Chapter 7672 Minnesota Energy Code Chapter 7672 Detached Single-Family And Two-Family Dwellings httpwwwstatemnusmnexternalDocsCommerceChapter_7672_Residential_111302012428 _72rulepdf
Persily AK Martin SR (2000) A Modeling Study of Ventilation in Manufactured Houses Gaithersburg MD National Institute of Standards and Technology NISTIR 6455
Rudd A Lstiburek J (2000) ldquoMeasurement of Ventilation and Interzonal Distribution in Single-Family Homesrdquo ASHRAE Transactions 2000 MN-00-10-3 V 106 Pt2 American Society of Heating Refrigeration and Air-Conditioning Engineers Atlanta GA
WAC (2004) Washington State Title 51 WAC Community trade and economic development department of (building code council) Chapter 51-13 Ventilation and indoor air quality httpappslegwagovWACdefaultaspxcite=51-13
48 of 49
Research Report - 0602
Field test of room-to-room uniformity of ventilation air distribution in two new houses
About this Report
This report was prepared for the US Department of Energyrsquos Building America
Program The report is freely available to the public at wwwbuildingamericagov
The authors express their appreciation to Rich Coyle of DR Horton for providing the test houses and to Joseph Lstiburek of BSC Subrato Chandra and Neil Moyer of
FSEC and Greg Barker of Mountain Energy Partnership for their assistance in the planning and execution of this ventilation study
About the Authors
Robert Hendron Ren Anderson Dennis Barley are with National Renewable Energy Laboratory Armin Rudd and Aaron Townsend are with Building Science Corporation
Ed Hancock is with Mountain Energy Partnership
Direct all correspondence to Building Science Corporation 30 Forest Street Somerville MA 02143
Limits of Liability and Disclaimer of Warranty
Building Science documents are intended for professionals The author and the publisher of this article have used their best efforts to provide accurate and authoritative information in regard to the subject matter covered The author and publisher make no warranty of any kind expressed or implied with regard to the information contained in this article
The information presented in this article must be used with care by professionals who understand the implications of what they are doing If professional advice or other expert assistance is required the services of a competent professional shall be sought The author and publisher shall not be liable in the event of incidental or consequential damages in connection with or arising from the use of the information contained within this Building Science document
49 of 49
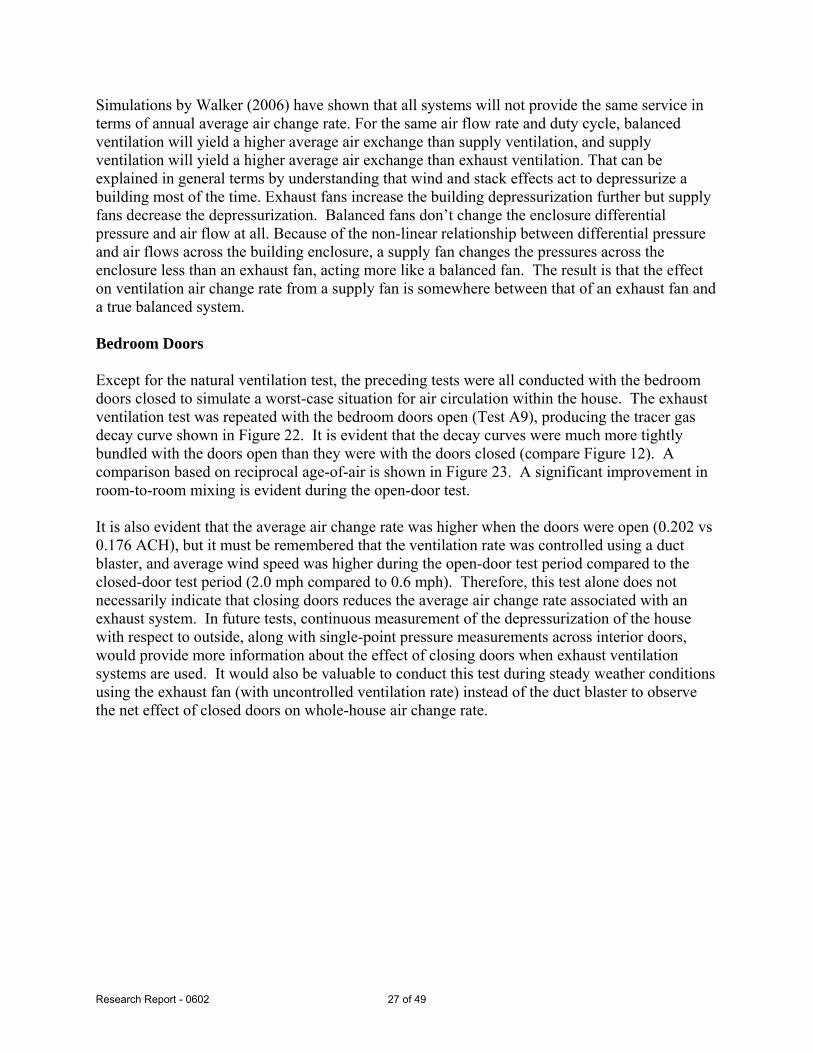
Research Report - 0602
0
5
10
15
20
25
30
Co
ncen
trati
on
(m
gm
3 )
Living
Entry
BR1
BR2
BR3
MBR
Mixing stopped
Mixing restarted
181 191 201 211 221 231 01 11 21 31 41 51 61 71
Hour
Figure 22 Tracer gas decay for 1-story house with exhaust ventilation from the laundry room at ASHRAE 622 level no central fan operation and bedroom doors open (Test A9)
Exhaust Ventilation
Doors Closed vs Doors Open
000
005
010
015
020
025
Re
cip
roc
al
Ag
e o
f A
ir (
1h
r)
Living
Entry
BR1
BR2
BR3
MBR
Exhaust in laundry room Doors open no mixing
no mixing 100 exhaust in laundry room
ASHRAE doors closed 100 ASHRAE
Figure 23 Reciprocal age-of-air for 1-story house with exhaust ventilation from the laundry room at ASHRAE 622 level no central fan operation In the first case the bedroom doors were closed (Test A3) in the second the doors were open (Test A9)
28 of 49
Research Report - 0602
Transfer Grilles
Because the test houses used central returns instead of hard ducted returns in the bedrooms transfer grilles were installed over the bedroom doors to provide a flow path for return air without excessive room pressurization when the doors were closed These transfer grilles also allowed ventilation air to pass more freely from the bedrooms to the main living space The effect of transfer grilles on ventilation air distribution was evaluated by taping over the grilles (see Figure 24) and re-running the exhaust ventilation test (Test A10) The corresponding tracer gas decay curve is shown in Figure 25 and the reciprocal age-of-air analysis is shown in Figure 26 Taping the transfer grilles did not appear to significantly affect the room-to-room variability in ventilation rate although there appeared to be some slight re-ranking of rooms from highest to lowest reciprocal age-of-air It should be noted that there was an increase in average wind speed from 26 mph to 41 mph starting at 1 pm including a half hour period where the average wind speed was 7 mph This weather effect produced noticeable kinks in the decay curves and therefore would be expected to introduce significant errors into the reciprocal age-of-air results
Itrsquos possible that the transfer grilles played a much smaller role in providing a path for ventilation air than the supply ducts Because the air handler was not operating the ducts were not pressurized and were thus available as passive airflow conduits The resistance to air flow was probably smaller for the air ducts than for the transfer grilles depending on their size and the number of supply registers in each bedroom The existing door undercuts are also thought to have played a role The effect of ducts and door undercuts can be tested in the future by running separate tests with ducts and door undercuts taped over
copy buildingsciencecom
Figure 24 Transfer grilles over bedroom doors taped closed
29 of 49
Research Report - 0602
0
10
20
30
40
50
60
70
Co
nc
en
tra
tio
n (
mg
m3 )
Living
Entry
BR1
BR2
BR3
MBR
Mixing stopped
Mixing restarted
8 9 10 11 12 13 14 15 16 17
Hour
Figure 25 Tracer gas decay for 1-story house with exhaust ventilation from the laundry room at ASHRAE 622 level no central fan operation bedroom doors closed and transfer
grilles taped (Test A10)
Exhaust Ventilation
000
005
010
015
020
025
Re
cip
roc
al
Ag
e o
f A
ir (
1h
r)
Living
Entry
BR1
BR2
BR3
MBR
Transfer Grilles Untaped vs Taped
Exhaust in laundry room no Exhaust in laundry room no
mixing 100 ASHRAE mixing 100 ASHRAE
doors closed doors closed transfer
grilles taped
Figure 26 Reciprocal age-of-air for 1-story house with exhaust ventilation from the laundry room at ASHRAE 622 level no central fan operation and doors closed In the
30 of 49
Research Report - 0602
first case the transfer grilles are untaped (Test A3) in the second they are taped closed (Test A10)
Minimum Test Duration
We were fortunate that DR Horton provided two full weeks of access to these homes to conduct this series of tests which allowed us to run some of the more important tracer gas decay tests as long as 12 hours to help ensure that we could accurately calculate reciprocal age-of-air In most cases test houses would not be available for such a long time period To evaluate the length of time needed to estimate the reciprocal age-of-air with reasonable accuracy we examined the results that we would have obtained for one of the exhaust ventilation tests had we halted the test period after less than 12 hours For the supply ventilation tests the rooms were sufficiently well-mixed that the test could have been stopped after 3 or 4 hours assuming weather effects were steady
The reciprocal age-of-air calculations for the exhaust ventilation decay curves (Test A3 see Figure 12) based on test durations of 3 6 9 and 12 hours are shown in Figure 27 These test durations range from 053 to 21 air changes based on the average air change rate of 018 ACH (56 hours per air change) calculated for this test The ratio of highest to lowest reciprocal ageshyof-air is shown above the data points for each case These results suggest that shorter tests tend to overestimate the range and that perhaps 1frac12-2 air changes (roughly 9 to 12 hours in this case) may be necessary to obtain accurate calculations of reciprocal age-of-air when there is significant divergence among rooms From a qualitative standpoint one air change may be sufficient to determine the basic trend Without knowing in advance what mixing pattern will occur it is difficult to recommend a minimum test duration But assuming this test is fairly representative of a worst-case scenario a minimum of 15 air changes would be necessary to have a high degree of confidence in the quantitative difference in reciprocal age-of-air among rooms
31 of 49
Research Report - 0602
000
005
010
015
020
025
030
035
Re
cip
roc
al
Ag
e-O
f-A
ir (
hr-1
)
Living
Entry
BR1
BR2
BR3
MBR HighLow = 297
HighLow = 168 HighLow = 184 HighLow = 161
3-hour Test 6-hour Test 9-hour Test 12-hour Test
(053 Air Changes) (11 Air Changes) (16 Air Changes) (21 Air Changes)
Test Duration
Figure 27 Reciprocal age-of-air based on alternate test durations for 1-story house with exhaust ventilation from the laundry room at ASHRAE 622 level no central fan operation
and doors closed (Test A3) Average air change rate was 018 ACH
TEST RESULTS FROM 2-STORY HOUSE (1117 MONTAGUE)
The 2-story house was tested from January 3-10 2006 Three zones were selected on the first floor and three more were selected on the second floor as indicated by the red stars in Figure 4 The initial mixing of air among the rooms at the start of each test in this 2-story house was not as thorough as it was in the 1-story house Evidently the combined effects of the air handler and the portable de-stratification fan were not sufficient to overcome upward transport of tracer gas driven by the stack effect from the first to the second floor The resulting difference in initial tracer gas concentration among the rooms was about 5-10 This outcome emphasizes the significant effect of stack-driven infiltration on ventilation non-uniformity in multi-story homes Because our test method and equipment did not achieve a well-mixed condition at the start of each test there were some errors introduced into the reciprocal age-of-air analysis For future tests we would recommend larger de-stratification fans to obtain more well-mixed conditions in multi-story houses
Typical errors introduced by incomplete mixing of the tracer gas at the start of such a test were analyzed by examining two hypothetical cases where either all of the air entering a room comes from the outside or all of the air comes from an adjacent room with a different starting concentration If all of the air entering a space comes from the outside then a change in the initial concentration would have no effect on the reciprocal age-of-air because the decay curve would be exponential from the start and the area under the curve would be normalized based on
32 of 49
Research Report - 0602
the starting concentration in that zone However if the air entering a room passes through another room with a lower initial concentration the room receiving the air will have a lower concentration of tracer gas throughout the test compared to what the concentration would have been if the starting points were the same in both rooms This case is illustrated in Figure 28 where assumptions are made that the rooms are the same size the air exchange rate is 01 ACH for both rooms and the initial tracer gas concentration is 10 lower in the first room (upstream) than it is in the second room
The effect on reciprocal age-of-air is shown in Figure 29 A 10 difference in starting concentration results in an error of about 75 in reciprocal age-of-air for a room downstream of a room with a lower starting concentration assuming 01 ACH for both rooms The error would be somewhat smaller (about 5) if the air change rate was higher for both rooms (02 ACH) There would be no error introduced for rooms where all of the air infiltration comes from the outside Although the amount of error in the reciprocal age-of-air calculations can be affected by additional variables not examined here we feel that these percentages are reasonable estimates of the errors in our results for the 2-story house due to incomplete initial mixing of air
In each case an engineering judgment must be made regarding the significance of the error introduced by incomplete initial mixing As a general rule the differences in concentration at the start of the test should be small compared to the differences that are being measured in order for the results to be considered valid
Figure 28 Theoretical decay curves for a well-mixed case with uniform tracer gas concentration compared to a case where the upstream room starts with a concentration
10 lower than the downstream room
33 of 49
Research Report - 0602
Figure 29 Theoretical reciprocal age-of-air for a well-mixed case with uniform tracer gas concentration compared to a case where the upstream room starts with a concentration
10 lower than the downstream room
Natural Infiltration and Duct Leakage
A natural infiltration test was performed over a two hour period on the evening of January 8 (Test B14) The tracer gas decay curves are shown in Figure 30 There was a slight divergence between the first floor and second floor once the air handler was turned off but the rooms on each floor appeared to remain fairly well-mixed The average air change rate during the test period was about 011 ACH which was somewhat higher than the 1-story house as might be expected with an increased stack height
An air handler bedroom door bump test was conducted just prior to the test period shown in Figure 30 allowing observation of the combined effect of duct leakage to the outside and increased infiltration caused by room pressurization The average air change rate during that bump test was 013 ACH suggesting that closing doors and operating the fan added approximately 002 ACH to the whole-house average air change rate The average wind speed was a bit higher while the air handler was running (17 mph compared to 05 mph) so the effect of air handler operation may actually be somewhat less than the average ACH numbers indicate
34 of 49
Research Report - 0602
0
1
2
3
4
SF
6 C
on
ce
ntr
ati
on
(m
gm
3)
BR1
Living
Kitchen
BR2
BR3
MBR
Mixing stopped
Mixing restarted
1814 1843 1912 1940 2009 2038 2107 2136
Hour
Figure 30 Tracer gas decay for 2-story house with no ventilation no central fan operation and bedroom doors open (Test B14)
Distributed Supply vs Point Exhaust Ventilation
A 14-hour test (Test B1) was performed with an exhaust ventilation rate of 63 cfm in the laundry room which was located near the stairwell in the middle of the first floor The ventilation rate was again consistent with the ASHRAE 622 recommendations The tracer gas decay curves are shown in Figure 31 It is interesting that all three second floor rooms showed a delay before entering an exponential decay suggesting that some amount of air was moving from the first floor to the second floor even though the mechanical exhaust point was on the first floor It appears that the further depressurization of the first floor was insufficient to overcome the stack effect and draw a significant amount of outside air in through the rooms on the second floor
35 of 49
Research Report - 0602
182
9
192
9
202
9
212
9
222
9
232
9
029
129
229
329
429
529
629
729
828
929
102
8
112
8
122
8
0
10
20
30
40
50
60
70
SF
6 C
on
ce
ntr
ati
on
(m
gm
3)
BR1
Living
Kitchen
BR2
BR3
MBR
Mixing stopped
Mixing restarted
Hour
Figure 31 Tracer gas decay for 2-story house with exhaust ventilation from the laundry room at ASHRAE 622 level no central fan operation and bedroom doors closed (Test B1)
A supply ventilation test was performed on the 2-story house for about 11 hours starting late on January 4 (Test B3) The duct blaster was unable to provide the ventilation rate necessary to meet the minimum specified in ASHRAE 622 supplying 180 cfm instead of 189 cfm (95) The decay curves are shown in Figure 32 Although the curves are much more tightly packed than they were with the exhaust system there is more divergence than we saw with the supply system in the 1-story house most notably in the master bedroom
The reciprocal age-of-air calculations for both the exhaust and supply ventilation systems are shown in Figure 33 Again the results indicate that much better room-to-room distribution of ventilation air was achieved by the central-fan integrated supply system compared to the single-point exhaust system However for the supply ventilation test the differences in the initial tracer gas concentration were of the same magnitude as the differences in decay rates among the rooms As a result no conclusions should be drawn about the relative ranking of the supply ventilation rate among rooms based on Figure 33
36 of 49
Research Report - 0602
0
10
20
30
40
50
60
SF
6 C
on
ce
ntr
ati
on
(m
gm
3)
BR1
Living
Kitchen
BR2
BR3
MBR
Mixing stopped
Mixing restarted
2136 000 224 448 712 936 1200
Hour
Figure 32 Tracer gas decay for 2-story house with supply ventilation just under ASHRAE 622 level central fan operation at 33 duty cycle (20 min off 10 min on) and bedroom
doors closed (Test B3)
Simple Exhaust vs Central Fan Integrated
Supply )
000
005
010
015
020
025
Recip
rocal A
ge o
f A
ir (
1h
r
BR1
Living
Kitchen
BR2
BR3
MBR
Exhaust in laundry room no Centralized supply mixing
mixing 100 ASHRAE 33 duty cycle 95
doors closed ASHRAE doors closed
Figure 33 Reciprocal age-of-air for 2-story house with continuous exhaust ventilation (Test B1) compared to central fan integrated supply ventilation (Test B3) (Note
Uncertainties introduced by non-uniform starting concentration are of the same order of magnitude as the differences in reciprocal age-of-air among rooms for the supply ventilation case The relative ranking of rooms is not meaningful for that case)
37 of 49
Research Report - 0602
Air Handler Operation
The effect of occasional air handler operation on the distribution of exhaust ventilation air was evaluated on the afternoon of January 6 (Test B6) The tracer gas decay curves are shown in Figure 34 and reciprocal age-of-air calculations are shown in Figure 35 It should again be noted that before the test started the house was mixed using both the air handler and a de-stratification fan with the doors open During the test the doors were closed the de-stratification fan was turned off and the air handler operated at a 33 duty cycle (20 minutes off 10 minutes on) As was the case in the 1-story house this occasional operation of the air handler substantially improved the distribution of ventilation air among rooms even in conjunction with the point exhaust ventilation system There was very little divergence noticeable even with the air handler cycling on and off every half hour However because the initial differences in tracer gas concentration among rooms were as large as the differences in reciprocal age-of-air for the case with air handler operation no conclusions should be drawn about the relative ranking of ventilation rates among the rooms for that case
SF
6 C
on
cen
trati
on
(m
gm
3)
80
70
60
50
40
30
20
10
0
BR1
Living
Kitchen
BR2
BR3
MBR
Mixing stopped
Mixing restarted
1048 1200 1312 1424 1536 1648 1800 1912 2024
Hour
Figure 34 Tracer gas decay for 2-story house with continuous exhaust ventilation at ASHRAE 622 level central fan operation at 33 duty cycle (20 min off 10 min on) and
bedroom doors closed (Test B6)
38 of 49
Research Report - 0602
020
015 R
ec
ipro
ca
l A
ge
of
Air
(1
hr)
Exhaust Ventilation
No Mixing vs 33 Air Handler Duty Cycle
Exhaust in laundry room
no mixing 100
ASHRAE doors closed
33 air handler
operation exhaust in
laundry room 100
ASHRAE doors closed
BR1
Living
Kitchen
BR2
BR3
MBR
010
005
000
Figure 35 Reciprocal age-of-air for 2-story house with continuous exhaust ventilation with and without air handler operation (Tests B1 and B6) (Note Uncertainties introduced by non-uniform starting concentration are of the same order of magnitude as the differences in reciprocal age-of-air among rooms for the case with air handler operation The relative
ranking of rooms is not meaningful for that case)
Exhaust Location
The duct blaster was moved to the master bathroom exhaust register to see if there was a resulting change in ventilation air distribution (Test B18) The master bathroom was in the back of the house on the second floor between the master bedroom and bedroom 3 The decay curves are shown in Figure 36 and the reciprocal age-of-air results are shown in Figure 37 The rooms on each floor were well mixed before the test began although the mixing between the two floors was not as good Very wide divergence among rooms can be seen during the test especially between the upstairs bedrooms and the rest of the house Once again all three upstairs rooms appear to receive some air from the first floor but the master bedroom experiences a much higher volume of circulated air than the other two second-floor bedrooms which appear to be relatively stagnant
39 of 49
Research Report - 0602
0
10
20
30
40
50
60
70
80
90
SF
6 C
on
ce
ntr
ati
on
(m
gm
3)
BR1
Living
Kitchen
BR2
BR3
MBR
Mixing stopped
Mixing restarted
1912 2136 000 224 448 712 936 1200
Hour
Figure 36 Tracer gas decay for 2-story house with exhaust ventilation from the master bathroom at ASHRAE 622 level no central fan operation and bedroom doors closed (Test
B18)
Exhaust Ventilation
Laundry Room vs Master Bathroom
000
005
010
015
020
025
030
Exhaust in laundry room no
mixing 100 ASHRAE
doors closed
Exhaust in master bathroom
no mixing 100 ASHRAE
doors closed
Re
cip
roc
al A
ge
of
Air
(1
hr)
BR1
Living
Kitchen
BR2
BR3
MBR
Figure 37 Reciprocal age-of-air for 2-story house with exhaust ventilation from the master bathroom compared to the laundry room at ASHRAE 622 level no central fan operation
and bedroom doors closed (Tests B1 and B18)
40 of 49
Research Report - 0602
Ventilation Rate
The supply ventilation tests were repeated using flow rates of 60 and 33 of ASHRAE 622 recommendations corresponding to 114 cfm and 63 cfm respectively (Tests B2 and B4) The decay curves are shown in Figures 38 and 39 Reciprocal age-of-air for all three supply ventilation rates are shown in Figure 40 In all cases the rooms remained fairly well mixed especially rooms on the same floor As we observed in the 1-story house the ventilation rate in the 2-story house appeared to have very little effect on the uniformity of outside air provided to each room as long as it was mixed using the air handler One again the initial differences in tracer gas concentration among rooms were as large as the divergence in the decay curves preventing any conclusions about the relative ranking of ventilation rates among rooms for all three cases The error in initial concentration uniformity was bigger for the cases with air handler mixing because the relative divergence in the decay curves was so small compared to that of no air handler mixing In other words the error in relative ranking of ventilation rates for the cases with air handler mixing were not very important anyway because the relative differences between rooms were so small
1536 1648 1800 1912 2024 2136 2248
Hour
Figure 38 Tracer gas decay for 2-story house with supply ventilation at 60 of ASHRAE 622 level 33 central fan operation (20 min off 10 min on) and bedroom doors closed
(Test B2)
0
5
10
15
20
25
30
SF
6 C
on
cen
trati
on
(m
gm
3)
BR1 Living Kitchen BR2 BR3 MBR
Mixing stopped
Mixing restarted
41 of 49
Research Report - 0602
0
5
10
15
20
25
30
35
40
SF
6 C
on
cen
trati
on
(m
gm
3)
BR1
Living
Kitchen
BR2
BR3
MBR
Mixing stopped
Mixing restarted
1200 1312 1424 1536 1648 1800 1912
Hour
Figure 39 Tracer gas decay for 2-story house with supply ventilation at 33 of ASHRAE 622 level 33 central fan operation (20 min off 10 min on) and bedroom doors closed
(Test B4)
Supply Ventilation Rate Comparison
000
005
010
015
020
025
Re
cip
roc
al
Ag
e o
f A
ir (
1h
r)
BR1
Living
Kitchen
BR2
BR3
MBR
Centralized supply Centralized supply Centralized supply
mixing 33 duty mixing 33 duty mixing 33 duty
cycle 95 ASHRAE cycle 60 ASHRAE cycle 33 ASHRAE
doors closed doors closed doors closed
Figure 40 Reciprocal age-of-air for 2-story house with three levels of supply ventilation central fan operation at 33 duty cycle (20 min off 10 min on) and bedroom doors closed (Tests B3 B2 B4) (Note Uncertainties introduced by non-uniform starting
concentration are of the same order of magnitude as the differences in reciprocal age-of-air among rooms for all three cases The relative ranking of rooms is not meaningful for these
cases)
42 of 49
Research Report - 0602
The average air change rates for the three supply ventilation rates compared to the two exhaust ventilation schemes are shown in Figure 41 The CFIS system at 33 of the 622 ventilation flow rate provided a uniformly higher air change rate (013 ach) than the least ventilated rooms using exhaust ventilation from either the laundry or the master bathroom (010 ach Figure 37) It is noteworthy that the combined net air change rate with exhaust ventilation from the laundry room was significantly less than the air change rates for both exhaust ventilation from the master bathroom and supply ventilation at the air handler This illustrates the unpredictability of interactions between mechanical ventilation and natural infiltration which depend strongly on the distribution and size of cracks through which the outside air must pass to enter the house There may have been a relatively large building enclosure leakage opening near the laundry room (perhaps the utility penetrations or the door to the garage) that allowed a significant amount of outside air to quickly enter and leave the house through the exhaust flow without circulating around the house
0
005
01
015
02
025
Ave
rag
e A
CH
Natural Exhaust Exhaust Supply 95 Supply 60 Supply 33
Laundry Mbath
Rm 100 100
Figure 41 Average air change rates for 2-story house with supply ventilation at 33 60 and 95 of ASHRAE 622 recommendations (Tests B4 B2 B3) compared to natural
infiltration (Test B14) and exhaust ventilation with no central fan operation (Test B1) Bedroom doors were closed except for the natural infiltration test
Bedroom Doors
The laundry room exhaust ventilation test with no air handler operation (see Figure 31) was repeated with the doors open to evaluate the change in room-to-room ventilation air distribution (Test B10) The decay curves are shown in Figure 42 and the reciprocal age-of air calculations are shown in Figure 43 It is evident from Figure 42 that the test began before the rooms were
43 of 49
Research Report - 0602
0
5
10
15
20
25
SF
6 C
on
ce
ntr
ati
on
(m
gm
3)
BR1 Living Kitchen BR2 BR3 MBR
Mixing stopped
Mixing restarted
completely well mixed resulting in decay curves that could be somewhat misleading Because the master bedroom was at a higher concentration than the other rooms at the start of the test any room that received air from the master bedroom would appear to have a slower decay rate than it would have if the rooms started out at the same concentration Despite the difference in starting concentration it is clear that outside air was well distributed when the doors were open even without operation of the air handler
1843 1912 1940 2009 2038 2107 2136 2204 2233 2302
Hour
Figure 42 Tracer gas decay for the 2-story house with exhaust ventilation from the laundry room at ASHRAE 622 level no central fan operation and bedroom doors open
(Test B10)
Reciprocal age-of-air analysis was not performed for this case because of the combined effect of a short test duration (~2 hours) and unequal starting tracer gas concentrations even though the house was relatively well-mixed The important conclusion (that opening doors greatly improves mixing) can be drawn by inspecting the decay curves alone
Transfer Grilles
A final exhaust ventilation test was run on the 2-story house with the doors closed and the transfer grilles taped over The decay curves are shown in Figure 43 and the reciprocal age-ofshyair calculations are shown in Figure 44 The curves were clearly very divergent even after 12 hours By examining the reciprocal age-of-air results it is apparent that the transfer grilles in the 2-story house caused a noticeable improvement in ventilation air distribution but the improvement was smaller than when the doors were opened (Figure 42)
44 of 49
Research Report - 0602
0
5
10
15
20
25
30
SF
6 C
on
cen
tra
tio
n (
mg
m3
) BR1 Living Kitchen BR2 BR3 MBR
Mixing stopped
Mixing restarted
1648 1912 2136 000 224 448 712 936
Hour
Figure 43 Tracer gas decay for 2-story house with exhaust ventilation from the laundry room at ASHRAE 622 level no central fan operation bedroom doors closed transfer
grilles taped closed (Test B7)
Exhaust Ventilation Transfer Grilles Untaped vs Taped
000
005
010
015
020
Re
cip
roc
al
Ag
e o
f A
ir (
1h
r)
BR1
Living
Kitchen
BR2
BR3
MBR
Exhaust in laundry room no Exhaust in laundry room no
mixing 100 ASHRAE mixing 100 ASHRAE
doors closed doors closed transfer
grilles taped
Figure 44 Reciprocal age-of-air for 2-story house with exhaust ventilation from the laundry room at ASHRAE 622 level no central fan operation and doors closed In the first case the transfer grilles are untaped (Test B3) in the second they are taped closed
(Test B7)
45 of 49
Research Report - 0602
CONCLUSIONS
bull Reciprocal age-of-air analysis was chosen as a quantitative method for characterizing distribution of ventilation air among rooms This method worked well in cases where rooms were well mixed to begin the test and weather conditions were sufficiently steady-state
bull A test period of at least 1frac12 air changes was necessary to obtain reasonably accurate ageshyof-air results when there was significant divergence in tracer gas concentration among the rooms
bull Although we did not achieve uniform initial concentration of tracer gas in the 2-story house using our test methodology and the equipment at hand we believe the reciprocal age-of-air calculations were meaningful in many of the cases as indicated in the discussion
bull Both houses were relatively tight with natural infiltration averaging 008 ACH for the 1shystory house and 011 ACH for the 2-story house
bull Both houses had relatively small (but not negligible) duct losses to the outside producing an increase in infiltration of less than 003 ACH for the 1-story house and 002 ACH for the 2-story house when the air handler runs
bull Age-of-air analysis indicated that ventilation supplied through the central air distribution system provided much more uniform distribution of ventilation air than the single-point exhaust system when the doors were closed and the air handler was not running For the 1-story house the central-fan-integrated supply ventilation case at 60 of ASHRAE 622 provided more outside air to all rooms than the least-ventilated room in the exhaust case at 100 of 622 For the 2-story house the central-fan-integrated supply system at 33 of the 622 flow rate provided more outside air to all rooms than the least ventilated rooms using exhaust ventilation at 100 of 622 from either the laundry or the master bathroom
bull Operation of the central fan at a 33 duty cycle maintained relatively well-mixed conditions regardless of ventilation rate type of ventilation system (supply or exhaust) or house configuration (1-story or 2-story)
bull Exhaust location affected both the relative amount of outside air received by different rooms and the overall uniformity among rooms but the effect was not predictable
bull For exhaust-only ventilation without central fan operation opening bedroom doors appeared to significantly improve the mixing of ventilation air among rooms
bull Transfer grilles improved the distribution of ventilation air slightly but much less than opening the bedroom doors
bull In the 2-story house the stack effect caused air movement from the first floor to the second floor even when exhaust ventilation was applied to the first floor resulting in consistently higher tracer gas concentrations on the second floor and more non-uniform ventilation air distribution in general
bull Interactions between natural infiltration and both exhaust and supply mechanical ventilation were very significant When the ventilation system was activated the combined air change rate did not increase commensurate with the measured ventilation rate but instead increased by only half that amount This result was consistent with combining ventilation and infiltration in quadrature to estimate whole-house air change rate in accordance with ASHRAE Standard 136 (ASHRAE 1993)
46 of 49
Research Report - 0602
FUTURE WORK
In future tests continuous monitoring of pressure differentials would enhance our understanding of the multi-zone combined infiltration and ventilation systems and our ability to model them That would help to explain differences between tests in more detail including the effects of multiple stories location of ventilation supply outlets and exhaust inlets interior door closure and use of passive return air transfer grilles Pressure differential measurement points should include
bull dP with respect to outside for each closed room and open space bull dP across closed interior doors bull dP between the floor cavity and outdoors and bull dP between the house and the attic
Measurement of wind direction along with wind speed could also be helpful for modeling these buildings and systems However because of micro-climate wind shielding it may be very difficult to relate a single-point wind direction measurement to actual wind vectors on the building surfaces
ACKNOWLEDGMENTS
The authors express their appreciation to Rich Coyle of DR Horton for providing the test houses and to Joseph Lstiburek of BSC Subrato Chandra and Neil Moyer of FSEC and Greg Barker of Mountain Energy Partnership for their assistance in the planning and execution of this ventilation study
47 of 49
Research Report - 0602
REFERENCES
ASHRAE (1993) ANSIASHRAE Standard 136-1993 A Method of Determining Air Change Rates in Detached Dwellings Atlanta GA American Society of Heating Refrigerating and Air-Conditioning Engineers Inc
ASHRAE (1997) ANSIASHRAE Standard 129-1997 Measuring Air-Change Effectiveness Atlanta GA American Society of Heating Refrigerating and Air-Conditioning Engineers Inc
ASHRAE (2004) ASHRAE Standard 622-2004 Ventilation and Acceptable Indoor Air Quality in Low-Rise Residential Buildings Atlanta GA American Society of Heating Refrigerating and Air-Conditioning Engineers Inc
CSA (2003) CANCSA F326-M91 Residential Mechanical Ventilation Systems Canadian Standards Association Ontario Canada httpwwwcsashyintlorgonlinestoreGetCatalogItemDetailsaspmat=2410793ampParent=102
NBC 2005 National Building Code of Canada httpircnrcshycnrcgccapubscodesnrcc47666_ehtml
Grieve PW (1991) Measuring Ventilation Using Tracer-Gases Denmark Bruumlel amp Kjaeligr
MN Chapter 7672 Minnesota Energy Code Chapter 7672 Detached Single-Family And Two-Family Dwellings httpwwwstatemnusmnexternalDocsCommerceChapter_7672_Residential_111302012428 _72rulepdf
Persily AK Martin SR (2000) A Modeling Study of Ventilation in Manufactured Houses Gaithersburg MD National Institute of Standards and Technology NISTIR 6455
Rudd A Lstiburek J (2000) ldquoMeasurement of Ventilation and Interzonal Distribution in Single-Family Homesrdquo ASHRAE Transactions 2000 MN-00-10-3 V 106 Pt2 American Society of Heating Refrigeration and Air-Conditioning Engineers Atlanta GA
WAC (2004) Washington State Title 51 WAC Community trade and economic development department of (building code council) Chapter 51-13 Ventilation and indoor air quality httpappslegwagovWACdefaultaspxcite=51-13
48 of 49
Research Report - 0602
Field test of room-to-room uniformity of ventilation air distribution in two new houses
About this Report
This report was prepared for the US Department of Energyrsquos Building America
Program The report is freely available to the public at wwwbuildingamericagov
The authors express their appreciation to Rich Coyle of DR Horton for providing the test houses and to Joseph Lstiburek of BSC Subrato Chandra and Neil Moyer of
FSEC and Greg Barker of Mountain Energy Partnership for their assistance in the planning and execution of this ventilation study
About the Authors
Robert Hendron Ren Anderson Dennis Barley are with National Renewable Energy Laboratory Armin Rudd and Aaron Townsend are with Building Science Corporation
Ed Hancock is with Mountain Energy Partnership
Direct all correspondence to Building Science Corporation 30 Forest Street Somerville MA 02143
Limits of Liability and Disclaimer of Warranty
Building Science documents are intended for professionals The author and the publisher of this article have used their best efforts to provide accurate and authoritative information in regard to the subject matter covered The author and publisher make no warranty of any kind expressed or implied with regard to the information contained in this article
The information presented in this article must be used with care by professionals who understand the implications of what they are doing If professional advice or other expert assistance is required the services of a competent professional shall be sought The author and publisher shall not be liable in the event of incidental or consequential damages in connection with or arising from the use of the information contained within this Building Science document
49 of 49
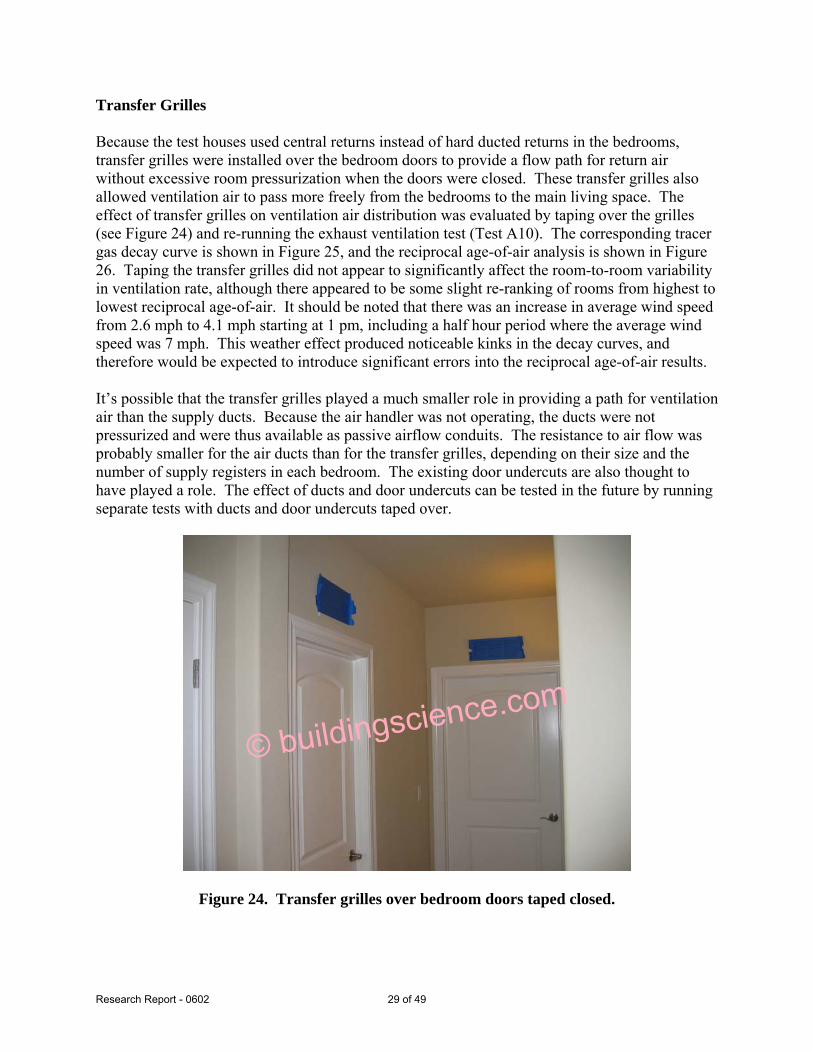
Research Report - 0602
Transfer Grilles
Because the test houses used central returns instead of hard ducted returns in the bedrooms transfer grilles were installed over the bedroom doors to provide a flow path for return air without excessive room pressurization when the doors were closed These transfer grilles also allowed ventilation air to pass more freely from the bedrooms to the main living space The effect of transfer grilles on ventilation air distribution was evaluated by taping over the grilles (see Figure 24) and re-running the exhaust ventilation test (Test A10) The corresponding tracer gas decay curve is shown in Figure 25 and the reciprocal age-of-air analysis is shown in Figure 26 Taping the transfer grilles did not appear to significantly affect the room-to-room variability in ventilation rate although there appeared to be some slight re-ranking of rooms from highest to lowest reciprocal age-of-air It should be noted that there was an increase in average wind speed from 26 mph to 41 mph starting at 1 pm including a half hour period where the average wind speed was 7 mph This weather effect produced noticeable kinks in the decay curves and therefore would be expected to introduce significant errors into the reciprocal age-of-air results
Itrsquos possible that the transfer grilles played a much smaller role in providing a path for ventilation air than the supply ducts Because the air handler was not operating the ducts were not pressurized and were thus available as passive airflow conduits The resistance to air flow was probably smaller for the air ducts than for the transfer grilles depending on their size and the number of supply registers in each bedroom The existing door undercuts are also thought to have played a role The effect of ducts and door undercuts can be tested in the future by running separate tests with ducts and door undercuts taped over
copy buildingsciencecom
Figure 24 Transfer grilles over bedroom doors taped closed
29 of 49
Research Report - 0602
0
10
20
30
40
50
60
70
Co
nc
en
tra
tio
n (
mg
m3 )
Living
Entry
BR1
BR2
BR3
MBR
Mixing stopped
Mixing restarted
8 9 10 11 12 13 14 15 16 17
Hour
Figure 25 Tracer gas decay for 1-story house with exhaust ventilation from the laundry room at ASHRAE 622 level no central fan operation bedroom doors closed and transfer
grilles taped (Test A10)
Exhaust Ventilation
000
005
010
015
020
025
Re
cip
roc
al
Ag
e o
f A
ir (
1h
r)
Living
Entry
BR1
BR2
BR3
MBR
Transfer Grilles Untaped vs Taped
Exhaust in laundry room no Exhaust in laundry room no
mixing 100 ASHRAE mixing 100 ASHRAE
doors closed doors closed transfer
grilles taped
Figure 26 Reciprocal age-of-air for 1-story house with exhaust ventilation from the laundry room at ASHRAE 622 level no central fan operation and doors closed In the
30 of 49
Research Report - 0602
first case the transfer grilles are untaped (Test A3) in the second they are taped closed (Test A10)
Minimum Test Duration
We were fortunate that DR Horton provided two full weeks of access to these homes to conduct this series of tests which allowed us to run some of the more important tracer gas decay tests as long as 12 hours to help ensure that we could accurately calculate reciprocal age-of-air In most cases test houses would not be available for such a long time period To evaluate the length of time needed to estimate the reciprocal age-of-air with reasonable accuracy we examined the results that we would have obtained for one of the exhaust ventilation tests had we halted the test period after less than 12 hours For the supply ventilation tests the rooms were sufficiently well-mixed that the test could have been stopped after 3 or 4 hours assuming weather effects were steady
The reciprocal age-of-air calculations for the exhaust ventilation decay curves (Test A3 see Figure 12) based on test durations of 3 6 9 and 12 hours are shown in Figure 27 These test durations range from 053 to 21 air changes based on the average air change rate of 018 ACH (56 hours per air change) calculated for this test The ratio of highest to lowest reciprocal ageshyof-air is shown above the data points for each case These results suggest that shorter tests tend to overestimate the range and that perhaps 1frac12-2 air changes (roughly 9 to 12 hours in this case) may be necessary to obtain accurate calculations of reciprocal age-of-air when there is significant divergence among rooms From a qualitative standpoint one air change may be sufficient to determine the basic trend Without knowing in advance what mixing pattern will occur it is difficult to recommend a minimum test duration But assuming this test is fairly representative of a worst-case scenario a minimum of 15 air changes would be necessary to have a high degree of confidence in the quantitative difference in reciprocal age-of-air among rooms
31 of 49
Research Report - 0602
000
005
010
015
020
025
030
035
Re
cip
roc
al
Ag
e-O
f-A
ir (
hr-1
)
Living
Entry
BR1
BR2
BR3
MBR HighLow = 297
HighLow = 168 HighLow = 184 HighLow = 161
3-hour Test 6-hour Test 9-hour Test 12-hour Test
(053 Air Changes) (11 Air Changes) (16 Air Changes) (21 Air Changes)
Test Duration
Figure 27 Reciprocal age-of-air based on alternate test durations for 1-story house with exhaust ventilation from the laundry room at ASHRAE 622 level no central fan operation
and doors closed (Test A3) Average air change rate was 018 ACH
TEST RESULTS FROM 2-STORY HOUSE (1117 MONTAGUE)
The 2-story house was tested from January 3-10 2006 Three zones were selected on the first floor and three more were selected on the second floor as indicated by the red stars in Figure 4 The initial mixing of air among the rooms at the start of each test in this 2-story house was not as thorough as it was in the 1-story house Evidently the combined effects of the air handler and the portable de-stratification fan were not sufficient to overcome upward transport of tracer gas driven by the stack effect from the first to the second floor The resulting difference in initial tracer gas concentration among the rooms was about 5-10 This outcome emphasizes the significant effect of stack-driven infiltration on ventilation non-uniformity in multi-story homes Because our test method and equipment did not achieve a well-mixed condition at the start of each test there were some errors introduced into the reciprocal age-of-air analysis For future tests we would recommend larger de-stratification fans to obtain more well-mixed conditions in multi-story houses
Typical errors introduced by incomplete mixing of the tracer gas at the start of such a test were analyzed by examining two hypothetical cases where either all of the air entering a room comes from the outside or all of the air comes from an adjacent room with a different starting concentration If all of the air entering a space comes from the outside then a change in the initial concentration would have no effect on the reciprocal age-of-air because the decay curve would be exponential from the start and the area under the curve would be normalized based on
32 of 49
Research Report - 0602
the starting concentration in that zone However if the air entering a room passes through another room with a lower initial concentration the room receiving the air will have a lower concentration of tracer gas throughout the test compared to what the concentration would have been if the starting points were the same in both rooms This case is illustrated in Figure 28 where assumptions are made that the rooms are the same size the air exchange rate is 01 ACH for both rooms and the initial tracer gas concentration is 10 lower in the first room (upstream) than it is in the second room
The effect on reciprocal age-of-air is shown in Figure 29 A 10 difference in starting concentration results in an error of about 75 in reciprocal age-of-air for a room downstream of a room with a lower starting concentration assuming 01 ACH for both rooms The error would be somewhat smaller (about 5) if the air change rate was higher for both rooms (02 ACH) There would be no error introduced for rooms where all of the air infiltration comes from the outside Although the amount of error in the reciprocal age-of-air calculations can be affected by additional variables not examined here we feel that these percentages are reasonable estimates of the errors in our results for the 2-story house due to incomplete initial mixing of air
In each case an engineering judgment must be made regarding the significance of the error introduced by incomplete initial mixing As a general rule the differences in concentration at the start of the test should be small compared to the differences that are being measured in order for the results to be considered valid
Figure 28 Theoretical decay curves for a well-mixed case with uniform tracer gas concentration compared to a case where the upstream room starts with a concentration
10 lower than the downstream room
33 of 49
Research Report - 0602
Figure 29 Theoretical reciprocal age-of-air for a well-mixed case with uniform tracer gas concentration compared to a case where the upstream room starts with a concentration
10 lower than the downstream room
Natural Infiltration and Duct Leakage
A natural infiltration test was performed over a two hour period on the evening of January 8 (Test B14) The tracer gas decay curves are shown in Figure 30 There was a slight divergence between the first floor and second floor once the air handler was turned off but the rooms on each floor appeared to remain fairly well-mixed The average air change rate during the test period was about 011 ACH which was somewhat higher than the 1-story house as might be expected with an increased stack height
An air handler bedroom door bump test was conducted just prior to the test period shown in Figure 30 allowing observation of the combined effect of duct leakage to the outside and increased infiltration caused by room pressurization The average air change rate during that bump test was 013 ACH suggesting that closing doors and operating the fan added approximately 002 ACH to the whole-house average air change rate The average wind speed was a bit higher while the air handler was running (17 mph compared to 05 mph) so the effect of air handler operation may actually be somewhat less than the average ACH numbers indicate
34 of 49
Research Report - 0602
0
1
2
3
4
SF
6 C
on
ce
ntr
ati
on
(m
gm
3)
BR1
Living
Kitchen
BR2
BR3
MBR
Mixing stopped
Mixing restarted
1814 1843 1912 1940 2009 2038 2107 2136
Hour
Figure 30 Tracer gas decay for 2-story house with no ventilation no central fan operation and bedroom doors open (Test B14)
Distributed Supply vs Point Exhaust Ventilation
A 14-hour test (Test B1) was performed with an exhaust ventilation rate of 63 cfm in the laundry room which was located near the stairwell in the middle of the first floor The ventilation rate was again consistent with the ASHRAE 622 recommendations The tracer gas decay curves are shown in Figure 31 It is interesting that all three second floor rooms showed a delay before entering an exponential decay suggesting that some amount of air was moving from the first floor to the second floor even though the mechanical exhaust point was on the first floor It appears that the further depressurization of the first floor was insufficient to overcome the stack effect and draw a significant amount of outside air in through the rooms on the second floor
35 of 49
Research Report - 0602
182
9
192
9
202
9
212
9
222
9
232
9
029
129
229
329
429
529
629
729
828
929
102
8
112
8
122
8
0
10
20
30
40
50
60
70
SF
6 C
on
ce
ntr
ati
on
(m
gm
3)
BR1
Living
Kitchen
BR2
BR3
MBR
Mixing stopped
Mixing restarted
Hour
Figure 31 Tracer gas decay for 2-story house with exhaust ventilation from the laundry room at ASHRAE 622 level no central fan operation and bedroom doors closed (Test B1)
A supply ventilation test was performed on the 2-story house for about 11 hours starting late on January 4 (Test B3) The duct blaster was unable to provide the ventilation rate necessary to meet the minimum specified in ASHRAE 622 supplying 180 cfm instead of 189 cfm (95) The decay curves are shown in Figure 32 Although the curves are much more tightly packed than they were with the exhaust system there is more divergence than we saw with the supply system in the 1-story house most notably in the master bedroom
The reciprocal age-of-air calculations for both the exhaust and supply ventilation systems are shown in Figure 33 Again the results indicate that much better room-to-room distribution of ventilation air was achieved by the central-fan integrated supply system compared to the single-point exhaust system However for the supply ventilation test the differences in the initial tracer gas concentration were of the same magnitude as the differences in decay rates among the rooms As a result no conclusions should be drawn about the relative ranking of the supply ventilation rate among rooms based on Figure 33
36 of 49
Research Report - 0602
0
10
20
30
40
50
60
SF
6 C
on
ce
ntr
ati
on
(m
gm
3)
BR1
Living
Kitchen
BR2
BR3
MBR
Mixing stopped
Mixing restarted
2136 000 224 448 712 936 1200
Hour
Figure 32 Tracer gas decay for 2-story house with supply ventilation just under ASHRAE 622 level central fan operation at 33 duty cycle (20 min off 10 min on) and bedroom
doors closed (Test B3)
Simple Exhaust vs Central Fan Integrated
Supply )
000
005
010
015
020
025
Recip
rocal A
ge o
f A
ir (
1h
r
BR1
Living
Kitchen
BR2
BR3
MBR
Exhaust in laundry room no Centralized supply mixing
mixing 100 ASHRAE 33 duty cycle 95
doors closed ASHRAE doors closed
Figure 33 Reciprocal age-of-air for 2-story house with continuous exhaust ventilation (Test B1) compared to central fan integrated supply ventilation (Test B3) (Note
Uncertainties introduced by non-uniform starting concentration are of the same order of magnitude as the differences in reciprocal age-of-air among rooms for the supply ventilation case The relative ranking of rooms is not meaningful for that case)
37 of 49
Research Report - 0602
Air Handler Operation
The effect of occasional air handler operation on the distribution of exhaust ventilation air was evaluated on the afternoon of January 6 (Test B6) The tracer gas decay curves are shown in Figure 34 and reciprocal age-of-air calculations are shown in Figure 35 It should again be noted that before the test started the house was mixed using both the air handler and a de-stratification fan with the doors open During the test the doors were closed the de-stratification fan was turned off and the air handler operated at a 33 duty cycle (20 minutes off 10 minutes on) As was the case in the 1-story house this occasional operation of the air handler substantially improved the distribution of ventilation air among rooms even in conjunction with the point exhaust ventilation system There was very little divergence noticeable even with the air handler cycling on and off every half hour However because the initial differences in tracer gas concentration among rooms were as large as the differences in reciprocal age-of-air for the case with air handler operation no conclusions should be drawn about the relative ranking of ventilation rates among the rooms for that case
SF
6 C
on
cen
trati
on
(m
gm
3)
80
70
60
50
40
30
20
10
0
BR1
Living
Kitchen
BR2
BR3
MBR
Mixing stopped
Mixing restarted
1048 1200 1312 1424 1536 1648 1800 1912 2024
Hour
Figure 34 Tracer gas decay for 2-story house with continuous exhaust ventilation at ASHRAE 622 level central fan operation at 33 duty cycle (20 min off 10 min on) and
bedroom doors closed (Test B6)
38 of 49
Research Report - 0602
020
015 R
ec
ipro
ca
l A
ge
of
Air
(1
hr)
Exhaust Ventilation
No Mixing vs 33 Air Handler Duty Cycle
Exhaust in laundry room
no mixing 100
ASHRAE doors closed
33 air handler
operation exhaust in
laundry room 100
ASHRAE doors closed
BR1
Living
Kitchen
BR2
BR3
MBR
010
005
000
Figure 35 Reciprocal age-of-air for 2-story house with continuous exhaust ventilation with and without air handler operation (Tests B1 and B6) (Note Uncertainties introduced by non-uniform starting concentration are of the same order of magnitude as the differences in reciprocal age-of-air among rooms for the case with air handler operation The relative
ranking of rooms is not meaningful for that case)
Exhaust Location
The duct blaster was moved to the master bathroom exhaust register to see if there was a resulting change in ventilation air distribution (Test B18) The master bathroom was in the back of the house on the second floor between the master bedroom and bedroom 3 The decay curves are shown in Figure 36 and the reciprocal age-of-air results are shown in Figure 37 The rooms on each floor were well mixed before the test began although the mixing between the two floors was not as good Very wide divergence among rooms can be seen during the test especially between the upstairs bedrooms and the rest of the house Once again all three upstairs rooms appear to receive some air from the first floor but the master bedroom experiences a much higher volume of circulated air than the other two second-floor bedrooms which appear to be relatively stagnant
39 of 49
Research Report - 0602
0
10
20
30
40
50
60
70
80
90
SF
6 C
on
ce
ntr
ati
on
(m
gm
3)
BR1
Living
Kitchen
BR2
BR3
MBR
Mixing stopped
Mixing restarted
1912 2136 000 224 448 712 936 1200
Hour
Figure 36 Tracer gas decay for 2-story house with exhaust ventilation from the master bathroom at ASHRAE 622 level no central fan operation and bedroom doors closed (Test
B18)
Exhaust Ventilation
Laundry Room vs Master Bathroom
000
005
010
015
020
025
030
Exhaust in laundry room no
mixing 100 ASHRAE
doors closed
Exhaust in master bathroom
no mixing 100 ASHRAE
doors closed
Re
cip
roc
al A
ge
of
Air
(1
hr)
BR1
Living
Kitchen
BR2
BR3
MBR
Figure 37 Reciprocal age-of-air for 2-story house with exhaust ventilation from the master bathroom compared to the laundry room at ASHRAE 622 level no central fan operation
and bedroom doors closed (Tests B1 and B18)
40 of 49
Research Report - 0602
Ventilation Rate
The supply ventilation tests were repeated using flow rates of 60 and 33 of ASHRAE 622 recommendations corresponding to 114 cfm and 63 cfm respectively (Tests B2 and B4) The decay curves are shown in Figures 38 and 39 Reciprocal age-of-air for all three supply ventilation rates are shown in Figure 40 In all cases the rooms remained fairly well mixed especially rooms on the same floor As we observed in the 1-story house the ventilation rate in the 2-story house appeared to have very little effect on the uniformity of outside air provided to each room as long as it was mixed using the air handler One again the initial differences in tracer gas concentration among rooms were as large as the divergence in the decay curves preventing any conclusions about the relative ranking of ventilation rates among rooms for all three cases The error in initial concentration uniformity was bigger for the cases with air handler mixing because the relative divergence in the decay curves was so small compared to that of no air handler mixing In other words the error in relative ranking of ventilation rates for the cases with air handler mixing were not very important anyway because the relative differences between rooms were so small
1536 1648 1800 1912 2024 2136 2248
Hour
Figure 38 Tracer gas decay for 2-story house with supply ventilation at 60 of ASHRAE 622 level 33 central fan operation (20 min off 10 min on) and bedroom doors closed
(Test B2)
0
5
10
15
20
25
30
SF
6 C
on
cen
trati
on
(m
gm
3)
BR1 Living Kitchen BR2 BR3 MBR
Mixing stopped
Mixing restarted
41 of 49
Research Report - 0602
0
5
10
15
20
25
30
35
40
SF
6 C
on
cen
trati
on
(m
gm
3)
BR1
Living
Kitchen
BR2
BR3
MBR
Mixing stopped
Mixing restarted
1200 1312 1424 1536 1648 1800 1912
Hour
Figure 39 Tracer gas decay for 2-story house with supply ventilation at 33 of ASHRAE 622 level 33 central fan operation (20 min off 10 min on) and bedroom doors closed
(Test B4)
Supply Ventilation Rate Comparison
000
005
010
015
020
025
Re
cip
roc
al
Ag
e o
f A
ir (
1h
r)
BR1
Living
Kitchen
BR2
BR3
MBR
Centralized supply Centralized supply Centralized supply
mixing 33 duty mixing 33 duty mixing 33 duty
cycle 95 ASHRAE cycle 60 ASHRAE cycle 33 ASHRAE
doors closed doors closed doors closed
Figure 40 Reciprocal age-of-air for 2-story house with three levels of supply ventilation central fan operation at 33 duty cycle (20 min off 10 min on) and bedroom doors closed (Tests B3 B2 B4) (Note Uncertainties introduced by non-uniform starting
concentration are of the same order of magnitude as the differences in reciprocal age-of-air among rooms for all three cases The relative ranking of rooms is not meaningful for these
cases)
42 of 49
Research Report - 0602
The average air change rates for the three supply ventilation rates compared to the two exhaust ventilation schemes are shown in Figure 41 The CFIS system at 33 of the 622 ventilation flow rate provided a uniformly higher air change rate (013 ach) than the least ventilated rooms using exhaust ventilation from either the laundry or the master bathroom (010 ach Figure 37) It is noteworthy that the combined net air change rate with exhaust ventilation from the laundry room was significantly less than the air change rates for both exhaust ventilation from the master bathroom and supply ventilation at the air handler This illustrates the unpredictability of interactions between mechanical ventilation and natural infiltration which depend strongly on the distribution and size of cracks through which the outside air must pass to enter the house There may have been a relatively large building enclosure leakage opening near the laundry room (perhaps the utility penetrations or the door to the garage) that allowed a significant amount of outside air to quickly enter and leave the house through the exhaust flow without circulating around the house
0
005
01
015
02
025
Ave
rag
e A
CH
Natural Exhaust Exhaust Supply 95 Supply 60 Supply 33
Laundry Mbath
Rm 100 100
Figure 41 Average air change rates for 2-story house with supply ventilation at 33 60 and 95 of ASHRAE 622 recommendations (Tests B4 B2 B3) compared to natural
infiltration (Test B14) and exhaust ventilation with no central fan operation (Test B1) Bedroom doors were closed except for the natural infiltration test
Bedroom Doors
The laundry room exhaust ventilation test with no air handler operation (see Figure 31) was repeated with the doors open to evaluate the change in room-to-room ventilation air distribution (Test B10) The decay curves are shown in Figure 42 and the reciprocal age-of air calculations are shown in Figure 43 It is evident from Figure 42 that the test began before the rooms were
43 of 49
Research Report - 0602
0
5
10
15
20
25
SF
6 C
on
ce
ntr
ati
on
(m
gm
3)
BR1 Living Kitchen BR2 BR3 MBR
Mixing stopped
Mixing restarted
completely well mixed resulting in decay curves that could be somewhat misleading Because the master bedroom was at a higher concentration than the other rooms at the start of the test any room that received air from the master bedroom would appear to have a slower decay rate than it would have if the rooms started out at the same concentration Despite the difference in starting concentration it is clear that outside air was well distributed when the doors were open even without operation of the air handler
1843 1912 1940 2009 2038 2107 2136 2204 2233 2302
Hour
Figure 42 Tracer gas decay for the 2-story house with exhaust ventilation from the laundry room at ASHRAE 622 level no central fan operation and bedroom doors open
(Test B10)
Reciprocal age-of-air analysis was not performed for this case because of the combined effect of a short test duration (~2 hours) and unequal starting tracer gas concentrations even though the house was relatively well-mixed The important conclusion (that opening doors greatly improves mixing) can be drawn by inspecting the decay curves alone
Transfer Grilles
A final exhaust ventilation test was run on the 2-story house with the doors closed and the transfer grilles taped over The decay curves are shown in Figure 43 and the reciprocal age-ofshyair calculations are shown in Figure 44 The curves were clearly very divergent even after 12 hours By examining the reciprocal age-of-air results it is apparent that the transfer grilles in the 2-story house caused a noticeable improvement in ventilation air distribution but the improvement was smaller than when the doors were opened (Figure 42)
44 of 49
Research Report - 0602
0
5
10
15
20
25
30
SF
6 C
on
cen
tra
tio
n (
mg
m3
) BR1 Living Kitchen BR2 BR3 MBR
Mixing stopped
Mixing restarted
1648 1912 2136 000 224 448 712 936
Hour
Figure 43 Tracer gas decay for 2-story house with exhaust ventilation from the laundry room at ASHRAE 622 level no central fan operation bedroom doors closed transfer
grilles taped closed (Test B7)
Exhaust Ventilation Transfer Grilles Untaped vs Taped
000
005
010
015
020
Re
cip
roc
al
Ag
e o
f A
ir (
1h
r)
BR1
Living
Kitchen
BR2
BR3
MBR
Exhaust in laundry room no Exhaust in laundry room no
mixing 100 ASHRAE mixing 100 ASHRAE
doors closed doors closed transfer
grilles taped
Figure 44 Reciprocal age-of-air for 2-story house with exhaust ventilation from the laundry room at ASHRAE 622 level no central fan operation and doors closed In the first case the transfer grilles are untaped (Test B3) in the second they are taped closed
(Test B7)
45 of 49
Research Report - 0602
CONCLUSIONS
bull Reciprocal age-of-air analysis was chosen as a quantitative method for characterizing distribution of ventilation air among rooms This method worked well in cases where rooms were well mixed to begin the test and weather conditions were sufficiently steady-state
bull A test period of at least 1frac12 air changes was necessary to obtain reasonably accurate ageshyof-air results when there was significant divergence in tracer gas concentration among the rooms
bull Although we did not achieve uniform initial concentration of tracer gas in the 2-story house using our test methodology and the equipment at hand we believe the reciprocal age-of-air calculations were meaningful in many of the cases as indicated in the discussion
bull Both houses were relatively tight with natural infiltration averaging 008 ACH for the 1shystory house and 011 ACH for the 2-story house
bull Both houses had relatively small (but not negligible) duct losses to the outside producing an increase in infiltration of less than 003 ACH for the 1-story house and 002 ACH for the 2-story house when the air handler runs
bull Age-of-air analysis indicated that ventilation supplied through the central air distribution system provided much more uniform distribution of ventilation air than the single-point exhaust system when the doors were closed and the air handler was not running For the 1-story house the central-fan-integrated supply ventilation case at 60 of ASHRAE 622 provided more outside air to all rooms than the least-ventilated room in the exhaust case at 100 of 622 For the 2-story house the central-fan-integrated supply system at 33 of the 622 flow rate provided more outside air to all rooms than the least ventilated rooms using exhaust ventilation at 100 of 622 from either the laundry or the master bathroom
bull Operation of the central fan at a 33 duty cycle maintained relatively well-mixed conditions regardless of ventilation rate type of ventilation system (supply or exhaust) or house configuration (1-story or 2-story)
bull Exhaust location affected both the relative amount of outside air received by different rooms and the overall uniformity among rooms but the effect was not predictable
bull For exhaust-only ventilation without central fan operation opening bedroom doors appeared to significantly improve the mixing of ventilation air among rooms
bull Transfer grilles improved the distribution of ventilation air slightly but much less than opening the bedroom doors
bull In the 2-story house the stack effect caused air movement from the first floor to the second floor even when exhaust ventilation was applied to the first floor resulting in consistently higher tracer gas concentrations on the second floor and more non-uniform ventilation air distribution in general
bull Interactions between natural infiltration and both exhaust and supply mechanical ventilation were very significant When the ventilation system was activated the combined air change rate did not increase commensurate with the measured ventilation rate but instead increased by only half that amount This result was consistent with combining ventilation and infiltration in quadrature to estimate whole-house air change rate in accordance with ASHRAE Standard 136 (ASHRAE 1993)
46 of 49
Research Report - 0602
FUTURE WORK
In future tests continuous monitoring of pressure differentials would enhance our understanding of the multi-zone combined infiltration and ventilation systems and our ability to model them That would help to explain differences between tests in more detail including the effects of multiple stories location of ventilation supply outlets and exhaust inlets interior door closure and use of passive return air transfer grilles Pressure differential measurement points should include
bull dP with respect to outside for each closed room and open space bull dP across closed interior doors bull dP between the floor cavity and outdoors and bull dP between the house and the attic
Measurement of wind direction along with wind speed could also be helpful for modeling these buildings and systems However because of micro-climate wind shielding it may be very difficult to relate a single-point wind direction measurement to actual wind vectors on the building surfaces
ACKNOWLEDGMENTS
The authors express their appreciation to Rich Coyle of DR Horton for providing the test houses and to Joseph Lstiburek of BSC Subrato Chandra and Neil Moyer of FSEC and Greg Barker of Mountain Energy Partnership for their assistance in the planning and execution of this ventilation study
47 of 49
Research Report - 0602
REFERENCES
ASHRAE (1993) ANSIASHRAE Standard 136-1993 A Method of Determining Air Change Rates in Detached Dwellings Atlanta GA American Society of Heating Refrigerating and Air-Conditioning Engineers Inc
ASHRAE (1997) ANSIASHRAE Standard 129-1997 Measuring Air-Change Effectiveness Atlanta GA American Society of Heating Refrigerating and Air-Conditioning Engineers Inc
ASHRAE (2004) ASHRAE Standard 622-2004 Ventilation and Acceptable Indoor Air Quality in Low-Rise Residential Buildings Atlanta GA American Society of Heating Refrigerating and Air-Conditioning Engineers Inc
CSA (2003) CANCSA F326-M91 Residential Mechanical Ventilation Systems Canadian Standards Association Ontario Canada httpwwwcsashyintlorgonlinestoreGetCatalogItemDetailsaspmat=2410793ampParent=102
NBC 2005 National Building Code of Canada httpircnrcshycnrcgccapubscodesnrcc47666_ehtml
Grieve PW (1991) Measuring Ventilation Using Tracer-Gases Denmark Bruumlel amp Kjaeligr
MN Chapter 7672 Minnesota Energy Code Chapter 7672 Detached Single-Family And Two-Family Dwellings httpwwwstatemnusmnexternalDocsCommerceChapter_7672_Residential_111302012428 _72rulepdf
Persily AK Martin SR (2000) A Modeling Study of Ventilation in Manufactured Houses Gaithersburg MD National Institute of Standards and Technology NISTIR 6455
Rudd A Lstiburek J (2000) ldquoMeasurement of Ventilation and Interzonal Distribution in Single-Family Homesrdquo ASHRAE Transactions 2000 MN-00-10-3 V 106 Pt2 American Society of Heating Refrigeration and Air-Conditioning Engineers Atlanta GA
WAC (2004) Washington State Title 51 WAC Community trade and economic development department of (building code council) Chapter 51-13 Ventilation and indoor air quality httpappslegwagovWACdefaultaspxcite=51-13
48 of 49
Research Report - 0602
Field test of room-to-room uniformity of ventilation air distribution in two new houses
About this Report
This report was prepared for the US Department of Energyrsquos Building America
Program The report is freely available to the public at wwwbuildingamericagov
The authors express their appreciation to Rich Coyle of DR Horton for providing the test houses and to Joseph Lstiburek of BSC Subrato Chandra and Neil Moyer of
FSEC and Greg Barker of Mountain Energy Partnership for their assistance in the planning and execution of this ventilation study
About the Authors
Robert Hendron Ren Anderson Dennis Barley are with National Renewable Energy Laboratory Armin Rudd and Aaron Townsend are with Building Science Corporation
Ed Hancock is with Mountain Energy Partnership
Direct all correspondence to Building Science Corporation 30 Forest Street Somerville MA 02143
Limits of Liability and Disclaimer of Warranty
Building Science documents are intended for professionals The author and the publisher of this article have used their best efforts to provide accurate and authoritative information in regard to the subject matter covered The author and publisher make no warranty of any kind expressed or implied with regard to the information contained in this article
The information presented in this article must be used with care by professionals who understand the implications of what they are doing If professional advice or other expert assistance is required the services of a competent professional shall be sought The author and publisher shall not be liable in the event of incidental or consequential damages in connection with or arising from the use of the information contained within this Building Science document
49 of 49
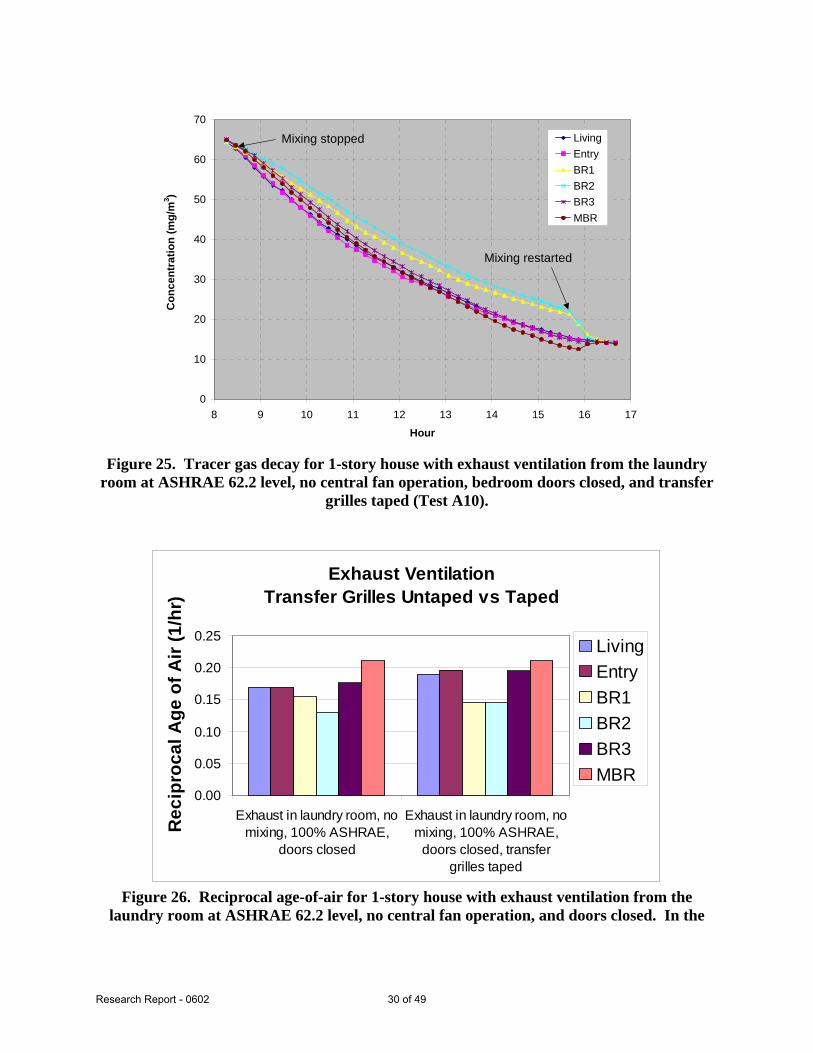
Research Report - 0602
0
10
20
30
40
50
60
70
Co
nc
en
tra
tio
n (
mg
m3 )
Living
Entry
BR1
BR2
BR3
MBR
Mixing stopped
Mixing restarted
8 9 10 11 12 13 14 15 16 17
Hour
Figure 25 Tracer gas decay for 1-story house with exhaust ventilation from the laundry room at ASHRAE 622 level no central fan operation bedroom doors closed and transfer
grilles taped (Test A10)
Exhaust Ventilation
000
005
010
015
020
025
Re
cip
roc
al
Ag
e o
f A
ir (
1h
r)
Living
Entry
BR1
BR2
BR3
MBR
Transfer Grilles Untaped vs Taped
Exhaust in laundry room no Exhaust in laundry room no
mixing 100 ASHRAE mixing 100 ASHRAE
doors closed doors closed transfer
grilles taped
Figure 26 Reciprocal age-of-air for 1-story house with exhaust ventilation from the laundry room at ASHRAE 622 level no central fan operation and doors closed In the
30 of 49
Research Report - 0602
first case the transfer grilles are untaped (Test A3) in the second they are taped closed (Test A10)
Minimum Test Duration
We were fortunate that DR Horton provided two full weeks of access to these homes to conduct this series of tests which allowed us to run some of the more important tracer gas decay tests as long as 12 hours to help ensure that we could accurately calculate reciprocal age-of-air In most cases test houses would not be available for such a long time period To evaluate the length of time needed to estimate the reciprocal age-of-air with reasonable accuracy we examined the results that we would have obtained for one of the exhaust ventilation tests had we halted the test period after less than 12 hours For the supply ventilation tests the rooms were sufficiently well-mixed that the test could have been stopped after 3 or 4 hours assuming weather effects were steady
The reciprocal age-of-air calculations for the exhaust ventilation decay curves (Test A3 see Figure 12) based on test durations of 3 6 9 and 12 hours are shown in Figure 27 These test durations range from 053 to 21 air changes based on the average air change rate of 018 ACH (56 hours per air change) calculated for this test The ratio of highest to lowest reciprocal ageshyof-air is shown above the data points for each case These results suggest that shorter tests tend to overestimate the range and that perhaps 1frac12-2 air changes (roughly 9 to 12 hours in this case) may be necessary to obtain accurate calculations of reciprocal age-of-air when there is significant divergence among rooms From a qualitative standpoint one air change may be sufficient to determine the basic trend Without knowing in advance what mixing pattern will occur it is difficult to recommend a minimum test duration But assuming this test is fairly representative of a worst-case scenario a minimum of 15 air changes would be necessary to have a high degree of confidence in the quantitative difference in reciprocal age-of-air among rooms
31 of 49
Research Report - 0602
000
005
010
015
020
025
030
035
Re
cip
roc
al
Ag
e-O
f-A
ir (
hr-1
)
Living
Entry
BR1
BR2
BR3
MBR HighLow = 297
HighLow = 168 HighLow = 184 HighLow = 161
3-hour Test 6-hour Test 9-hour Test 12-hour Test
(053 Air Changes) (11 Air Changes) (16 Air Changes) (21 Air Changes)
Test Duration
Figure 27 Reciprocal age-of-air based on alternate test durations for 1-story house with exhaust ventilation from the laundry room at ASHRAE 622 level no central fan operation
and doors closed (Test A3) Average air change rate was 018 ACH
TEST RESULTS FROM 2-STORY HOUSE (1117 MONTAGUE)
The 2-story house was tested from January 3-10 2006 Three zones were selected on the first floor and three more were selected on the second floor as indicated by the red stars in Figure 4 The initial mixing of air among the rooms at the start of each test in this 2-story house was not as thorough as it was in the 1-story house Evidently the combined effects of the air handler and the portable de-stratification fan were not sufficient to overcome upward transport of tracer gas driven by the stack effect from the first to the second floor The resulting difference in initial tracer gas concentration among the rooms was about 5-10 This outcome emphasizes the significant effect of stack-driven infiltration on ventilation non-uniformity in multi-story homes Because our test method and equipment did not achieve a well-mixed condition at the start of each test there were some errors introduced into the reciprocal age-of-air analysis For future tests we would recommend larger de-stratification fans to obtain more well-mixed conditions in multi-story houses
Typical errors introduced by incomplete mixing of the tracer gas at the start of such a test were analyzed by examining two hypothetical cases where either all of the air entering a room comes from the outside or all of the air comes from an adjacent room with a different starting concentration If all of the air entering a space comes from the outside then a change in the initial concentration would have no effect on the reciprocal age-of-air because the decay curve would be exponential from the start and the area under the curve would be normalized based on
32 of 49
Research Report - 0602
the starting concentration in that zone However if the air entering a room passes through another room with a lower initial concentration the room receiving the air will have a lower concentration of tracer gas throughout the test compared to what the concentration would have been if the starting points were the same in both rooms This case is illustrated in Figure 28 where assumptions are made that the rooms are the same size the air exchange rate is 01 ACH for both rooms and the initial tracer gas concentration is 10 lower in the first room (upstream) than it is in the second room
The effect on reciprocal age-of-air is shown in Figure 29 A 10 difference in starting concentration results in an error of about 75 in reciprocal age-of-air for a room downstream of a room with a lower starting concentration assuming 01 ACH for both rooms The error would be somewhat smaller (about 5) if the air change rate was higher for both rooms (02 ACH) There would be no error introduced for rooms where all of the air infiltration comes from the outside Although the amount of error in the reciprocal age-of-air calculations can be affected by additional variables not examined here we feel that these percentages are reasonable estimates of the errors in our results for the 2-story house due to incomplete initial mixing of air
In each case an engineering judgment must be made regarding the significance of the error introduced by incomplete initial mixing As a general rule the differences in concentration at the start of the test should be small compared to the differences that are being measured in order for the results to be considered valid
Figure 28 Theoretical decay curves for a well-mixed case with uniform tracer gas concentration compared to a case where the upstream room starts with a concentration
10 lower than the downstream room
33 of 49
Research Report - 0602
Figure 29 Theoretical reciprocal age-of-air for a well-mixed case with uniform tracer gas concentration compared to a case where the upstream room starts with a concentration
10 lower than the downstream room
Natural Infiltration and Duct Leakage
A natural infiltration test was performed over a two hour period on the evening of January 8 (Test B14) The tracer gas decay curves are shown in Figure 30 There was a slight divergence between the first floor and second floor once the air handler was turned off but the rooms on each floor appeared to remain fairly well-mixed The average air change rate during the test period was about 011 ACH which was somewhat higher than the 1-story house as might be expected with an increased stack height
An air handler bedroom door bump test was conducted just prior to the test period shown in Figure 30 allowing observation of the combined effect of duct leakage to the outside and increased infiltration caused by room pressurization The average air change rate during that bump test was 013 ACH suggesting that closing doors and operating the fan added approximately 002 ACH to the whole-house average air change rate The average wind speed was a bit higher while the air handler was running (17 mph compared to 05 mph) so the effect of air handler operation may actually be somewhat less than the average ACH numbers indicate
34 of 49
Research Report - 0602
0
1
2
3
4
SF
6 C
on
ce
ntr
ati
on
(m
gm
3)
BR1
Living
Kitchen
BR2
BR3
MBR
Mixing stopped
Mixing restarted
1814 1843 1912 1940 2009 2038 2107 2136
Hour
Figure 30 Tracer gas decay for 2-story house with no ventilation no central fan operation and bedroom doors open (Test B14)
Distributed Supply vs Point Exhaust Ventilation
A 14-hour test (Test B1) was performed with an exhaust ventilation rate of 63 cfm in the laundry room which was located near the stairwell in the middle of the first floor The ventilation rate was again consistent with the ASHRAE 622 recommendations The tracer gas decay curves are shown in Figure 31 It is interesting that all three second floor rooms showed a delay before entering an exponential decay suggesting that some amount of air was moving from the first floor to the second floor even though the mechanical exhaust point was on the first floor It appears that the further depressurization of the first floor was insufficient to overcome the stack effect and draw a significant amount of outside air in through the rooms on the second floor
35 of 49
Research Report - 0602
182
9
192
9
202
9
212
9
222
9
232
9
029
129
229
329
429
529
629
729
828
929
102
8
112
8
122
8
0
10
20
30
40
50
60
70
SF
6 C
on
ce
ntr
ati
on
(m
gm
3)
BR1
Living
Kitchen
BR2
BR3
MBR
Mixing stopped
Mixing restarted
Hour
Figure 31 Tracer gas decay for 2-story house with exhaust ventilation from the laundry room at ASHRAE 622 level no central fan operation and bedroom doors closed (Test B1)
A supply ventilation test was performed on the 2-story house for about 11 hours starting late on January 4 (Test B3) The duct blaster was unable to provide the ventilation rate necessary to meet the minimum specified in ASHRAE 622 supplying 180 cfm instead of 189 cfm (95) The decay curves are shown in Figure 32 Although the curves are much more tightly packed than they were with the exhaust system there is more divergence than we saw with the supply system in the 1-story house most notably in the master bedroom
The reciprocal age-of-air calculations for both the exhaust and supply ventilation systems are shown in Figure 33 Again the results indicate that much better room-to-room distribution of ventilation air was achieved by the central-fan integrated supply system compared to the single-point exhaust system However for the supply ventilation test the differences in the initial tracer gas concentration were of the same magnitude as the differences in decay rates among the rooms As a result no conclusions should be drawn about the relative ranking of the supply ventilation rate among rooms based on Figure 33
36 of 49
Research Report - 0602
0
10
20
30
40
50
60
SF
6 C
on
ce
ntr
ati
on
(m
gm
3)
BR1
Living
Kitchen
BR2
BR3
MBR
Mixing stopped
Mixing restarted
2136 000 224 448 712 936 1200
Hour
Figure 32 Tracer gas decay for 2-story house with supply ventilation just under ASHRAE 622 level central fan operation at 33 duty cycle (20 min off 10 min on) and bedroom
doors closed (Test B3)
Simple Exhaust vs Central Fan Integrated
Supply )
000
005
010
015
020
025
Recip
rocal A
ge o
f A
ir (
1h
r
BR1
Living
Kitchen
BR2
BR3
MBR
Exhaust in laundry room no Centralized supply mixing
mixing 100 ASHRAE 33 duty cycle 95
doors closed ASHRAE doors closed
Figure 33 Reciprocal age-of-air for 2-story house with continuous exhaust ventilation (Test B1) compared to central fan integrated supply ventilation (Test B3) (Note
Uncertainties introduced by non-uniform starting concentration are of the same order of magnitude as the differences in reciprocal age-of-air among rooms for the supply ventilation case The relative ranking of rooms is not meaningful for that case)
37 of 49
Research Report - 0602
Air Handler Operation
The effect of occasional air handler operation on the distribution of exhaust ventilation air was evaluated on the afternoon of January 6 (Test B6) The tracer gas decay curves are shown in Figure 34 and reciprocal age-of-air calculations are shown in Figure 35 It should again be noted that before the test started the house was mixed using both the air handler and a de-stratification fan with the doors open During the test the doors were closed the de-stratification fan was turned off and the air handler operated at a 33 duty cycle (20 minutes off 10 minutes on) As was the case in the 1-story house this occasional operation of the air handler substantially improved the distribution of ventilation air among rooms even in conjunction with the point exhaust ventilation system There was very little divergence noticeable even with the air handler cycling on and off every half hour However because the initial differences in tracer gas concentration among rooms were as large as the differences in reciprocal age-of-air for the case with air handler operation no conclusions should be drawn about the relative ranking of ventilation rates among the rooms for that case
SF
6 C
on
cen
trati
on
(m
gm
3)
80
70
60
50
40
30
20
10
0
BR1
Living
Kitchen
BR2
BR3
MBR
Mixing stopped
Mixing restarted
1048 1200 1312 1424 1536 1648 1800 1912 2024
Hour
Figure 34 Tracer gas decay for 2-story house with continuous exhaust ventilation at ASHRAE 622 level central fan operation at 33 duty cycle (20 min off 10 min on) and
bedroom doors closed (Test B6)
38 of 49
Research Report - 0602
020
015 R
ec
ipro
ca
l A
ge
of
Air
(1
hr)
Exhaust Ventilation
No Mixing vs 33 Air Handler Duty Cycle
Exhaust in laundry room
no mixing 100
ASHRAE doors closed
33 air handler
operation exhaust in
laundry room 100
ASHRAE doors closed
BR1
Living
Kitchen
BR2
BR3
MBR
010
005
000
Figure 35 Reciprocal age-of-air for 2-story house with continuous exhaust ventilation with and without air handler operation (Tests B1 and B6) (Note Uncertainties introduced by non-uniform starting concentration are of the same order of magnitude as the differences in reciprocal age-of-air among rooms for the case with air handler operation The relative
ranking of rooms is not meaningful for that case)
Exhaust Location
The duct blaster was moved to the master bathroom exhaust register to see if there was a resulting change in ventilation air distribution (Test B18) The master bathroom was in the back of the house on the second floor between the master bedroom and bedroom 3 The decay curves are shown in Figure 36 and the reciprocal age-of-air results are shown in Figure 37 The rooms on each floor were well mixed before the test began although the mixing between the two floors was not as good Very wide divergence among rooms can be seen during the test especially between the upstairs bedrooms and the rest of the house Once again all three upstairs rooms appear to receive some air from the first floor but the master bedroom experiences a much higher volume of circulated air than the other two second-floor bedrooms which appear to be relatively stagnant
39 of 49
Research Report - 0602
0
10
20
30
40
50
60
70
80
90
SF
6 C
on
ce
ntr
ati
on
(m
gm
3)
BR1
Living
Kitchen
BR2
BR3
MBR
Mixing stopped
Mixing restarted
1912 2136 000 224 448 712 936 1200
Hour
Figure 36 Tracer gas decay for 2-story house with exhaust ventilation from the master bathroom at ASHRAE 622 level no central fan operation and bedroom doors closed (Test
B18)
Exhaust Ventilation
Laundry Room vs Master Bathroom
000
005
010
015
020
025
030
Exhaust in laundry room no
mixing 100 ASHRAE
doors closed
Exhaust in master bathroom
no mixing 100 ASHRAE
doors closed
Re
cip
roc
al A
ge
of
Air
(1
hr)
BR1
Living
Kitchen
BR2
BR3
MBR
Figure 37 Reciprocal age-of-air for 2-story house with exhaust ventilation from the master bathroom compared to the laundry room at ASHRAE 622 level no central fan operation
and bedroom doors closed (Tests B1 and B18)
40 of 49
Research Report - 0602
Ventilation Rate
The supply ventilation tests were repeated using flow rates of 60 and 33 of ASHRAE 622 recommendations corresponding to 114 cfm and 63 cfm respectively (Tests B2 and B4) The decay curves are shown in Figures 38 and 39 Reciprocal age-of-air for all three supply ventilation rates are shown in Figure 40 In all cases the rooms remained fairly well mixed especially rooms on the same floor As we observed in the 1-story house the ventilation rate in the 2-story house appeared to have very little effect on the uniformity of outside air provided to each room as long as it was mixed using the air handler One again the initial differences in tracer gas concentration among rooms were as large as the divergence in the decay curves preventing any conclusions about the relative ranking of ventilation rates among rooms for all three cases The error in initial concentration uniformity was bigger for the cases with air handler mixing because the relative divergence in the decay curves was so small compared to that of no air handler mixing In other words the error in relative ranking of ventilation rates for the cases with air handler mixing were not very important anyway because the relative differences between rooms were so small
1536 1648 1800 1912 2024 2136 2248
Hour
Figure 38 Tracer gas decay for 2-story house with supply ventilation at 60 of ASHRAE 622 level 33 central fan operation (20 min off 10 min on) and bedroom doors closed
(Test B2)
0
5
10
15
20
25
30
SF
6 C
on
cen
trati
on
(m
gm
3)
BR1 Living Kitchen BR2 BR3 MBR
Mixing stopped
Mixing restarted
41 of 49
Research Report - 0602
0
5
10
15
20
25
30
35
40
SF
6 C
on
cen
trati
on
(m
gm
3)
BR1
Living
Kitchen
BR2
BR3
MBR
Mixing stopped
Mixing restarted
1200 1312 1424 1536 1648 1800 1912
Hour
Figure 39 Tracer gas decay for 2-story house with supply ventilation at 33 of ASHRAE 622 level 33 central fan operation (20 min off 10 min on) and bedroom doors closed
(Test B4)
Supply Ventilation Rate Comparison
000
005
010
015
020
025
Re
cip
roc
al
Ag
e o
f A
ir (
1h
r)
BR1
Living
Kitchen
BR2
BR3
MBR
Centralized supply Centralized supply Centralized supply
mixing 33 duty mixing 33 duty mixing 33 duty
cycle 95 ASHRAE cycle 60 ASHRAE cycle 33 ASHRAE
doors closed doors closed doors closed
Figure 40 Reciprocal age-of-air for 2-story house with three levels of supply ventilation central fan operation at 33 duty cycle (20 min off 10 min on) and bedroom doors closed (Tests B3 B2 B4) (Note Uncertainties introduced by non-uniform starting
concentration are of the same order of magnitude as the differences in reciprocal age-of-air among rooms for all three cases The relative ranking of rooms is not meaningful for these
cases)
42 of 49
Research Report - 0602
The average air change rates for the three supply ventilation rates compared to the two exhaust ventilation schemes are shown in Figure 41 The CFIS system at 33 of the 622 ventilation flow rate provided a uniformly higher air change rate (013 ach) than the least ventilated rooms using exhaust ventilation from either the laundry or the master bathroom (010 ach Figure 37) It is noteworthy that the combined net air change rate with exhaust ventilation from the laundry room was significantly less than the air change rates for both exhaust ventilation from the master bathroom and supply ventilation at the air handler This illustrates the unpredictability of interactions between mechanical ventilation and natural infiltration which depend strongly on the distribution and size of cracks through which the outside air must pass to enter the house There may have been a relatively large building enclosure leakage opening near the laundry room (perhaps the utility penetrations or the door to the garage) that allowed a significant amount of outside air to quickly enter and leave the house through the exhaust flow without circulating around the house
0
005
01
015
02
025
Ave
rag
e A
CH
Natural Exhaust Exhaust Supply 95 Supply 60 Supply 33
Laundry Mbath
Rm 100 100
Figure 41 Average air change rates for 2-story house with supply ventilation at 33 60 and 95 of ASHRAE 622 recommendations (Tests B4 B2 B3) compared to natural
infiltration (Test B14) and exhaust ventilation with no central fan operation (Test B1) Bedroom doors were closed except for the natural infiltration test
Bedroom Doors
The laundry room exhaust ventilation test with no air handler operation (see Figure 31) was repeated with the doors open to evaluate the change in room-to-room ventilation air distribution (Test B10) The decay curves are shown in Figure 42 and the reciprocal age-of air calculations are shown in Figure 43 It is evident from Figure 42 that the test began before the rooms were
43 of 49
Research Report - 0602
0
5
10
15
20
25
SF
6 C
on
ce
ntr
ati
on
(m
gm
3)
BR1 Living Kitchen BR2 BR3 MBR
Mixing stopped
Mixing restarted
completely well mixed resulting in decay curves that could be somewhat misleading Because the master bedroom was at a higher concentration than the other rooms at the start of the test any room that received air from the master bedroom would appear to have a slower decay rate than it would have if the rooms started out at the same concentration Despite the difference in starting concentration it is clear that outside air was well distributed when the doors were open even without operation of the air handler
1843 1912 1940 2009 2038 2107 2136 2204 2233 2302
Hour
Figure 42 Tracer gas decay for the 2-story house with exhaust ventilation from the laundry room at ASHRAE 622 level no central fan operation and bedroom doors open
(Test B10)
Reciprocal age-of-air analysis was not performed for this case because of the combined effect of a short test duration (~2 hours) and unequal starting tracer gas concentrations even though the house was relatively well-mixed The important conclusion (that opening doors greatly improves mixing) can be drawn by inspecting the decay curves alone
Transfer Grilles
A final exhaust ventilation test was run on the 2-story house with the doors closed and the transfer grilles taped over The decay curves are shown in Figure 43 and the reciprocal age-ofshyair calculations are shown in Figure 44 The curves were clearly very divergent even after 12 hours By examining the reciprocal age-of-air results it is apparent that the transfer grilles in the 2-story house caused a noticeable improvement in ventilation air distribution but the improvement was smaller than when the doors were opened (Figure 42)
44 of 49
Research Report - 0602
0
5
10
15
20
25
30
SF
6 C
on
cen
tra
tio
n (
mg
m3
) BR1 Living Kitchen BR2 BR3 MBR
Mixing stopped
Mixing restarted
1648 1912 2136 000 224 448 712 936
Hour
Figure 43 Tracer gas decay for 2-story house with exhaust ventilation from the laundry room at ASHRAE 622 level no central fan operation bedroom doors closed transfer
grilles taped closed (Test B7)
Exhaust Ventilation Transfer Grilles Untaped vs Taped
000
005
010
015
020
Re
cip
roc
al
Ag
e o
f A
ir (
1h
r)
BR1
Living
Kitchen
BR2
BR3
MBR
Exhaust in laundry room no Exhaust in laundry room no
mixing 100 ASHRAE mixing 100 ASHRAE
doors closed doors closed transfer
grilles taped
Figure 44 Reciprocal age-of-air for 2-story house with exhaust ventilation from the laundry room at ASHRAE 622 level no central fan operation and doors closed In the first case the transfer grilles are untaped (Test B3) in the second they are taped closed
(Test B7)
45 of 49
Research Report - 0602
CONCLUSIONS
bull Reciprocal age-of-air analysis was chosen as a quantitative method for characterizing distribution of ventilation air among rooms This method worked well in cases where rooms were well mixed to begin the test and weather conditions were sufficiently steady-state
bull A test period of at least 1frac12 air changes was necessary to obtain reasonably accurate ageshyof-air results when there was significant divergence in tracer gas concentration among the rooms
bull Although we did not achieve uniform initial concentration of tracer gas in the 2-story house using our test methodology and the equipment at hand we believe the reciprocal age-of-air calculations were meaningful in many of the cases as indicated in the discussion
bull Both houses were relatively tight with natural infiltration averaging 008 ACH for the 1shystory house and 011 ACH for the 2-story house
bull Both houses had relatively small (but not negligible) duct losses to the outside producing an increase in infiltration of less than 003 ACH for the 1-story house and 002 ACH for the 2-story house when the air handler runs
bull Age-of-air analysis indicated that ventilation supplied through the central air distribution system provided much more uniform distribution of ventilation air than the single-point exhaust system when the doors were closed and the air handler was not running For the 1-story house the central-fan-integrated supply ventilation case at 60 of ASHRAE 622 provided more outside air to all rooms than the least-ventilated room in the exhaust case at 100 of 622 For the 2-story house the central-fan-integrated supply system at 33 of the 622 flow rate provided more outside air to all rooms than the least ventilated rooms using exhaust ventilation at 100 of 622 from either the laundry or the master bathroom
bull Operation of the central fan at a 33 duty cycle maintained relatively well-mixed conditions regardless of ventilation rate type of ventilation system (supply or exhaust) or house configuration (1-story or 2-story)
bull Exhaust location affected both the relative amount of outside air received by different rooms and the overall uniformity among rooms but the effect was not predictable
bull For exhaust-only ventilation without central fan operation opening bedroom doors appeared to significantly improve the mixing of ventilation air among rooms
bull Transfer grilles improved the distribution of ventilation air slightly but much less than opening the bedroom doors
bull In the 2-story house the stack effect caused air movement from the first floor to the second floor even when exhaust ventilation was applied to the first floor resulting in consistently higher tracer gas concentrations on the second floor and more non-uniform ventilation air distribution in general
bull Interactions between natural infiltration and both exhaust and supply mechanical ventilation were very significant When the ventilation system was activated the combined air change rate did not increase commensurate with the measured ventilation rate but instead increased by only half that amount This result was consistent with combining ventilation and infiltration in quadrature to estimate whole-house air change rate in accordance with ASHRAE Standard 136 (ASHRAE 1993)
46 of 49
Research Report - 0602
FUTURE WORK
In future tests continuous monitoring of pressure differentials would enhance our understanding of the multi-zone combined infiltration and ventilation systems and our ability to model them That would help to explain differences between tests in more detail including the effects of multiple stories location of ventilation supply outlets and exhaust inlets interior door closure and use of passive return air transfer grilles Pressure differential measurement points should include
bull dP with respect to outside for each closed room and open space bull dP across closed interior doors bull dP between the floor cavity and outdoors and bull dP between the house and the attic
Measurement of wind direction along with wind speed could also be helpful for modeling these buildings and systems However because of micro-climate wind shielding it may be very difficult to relate a single-point wind direction measurement to actual wind vectors on the building surfaces
ACKNOWLEDGMENTS
The authors express their appreciation to Rich Coyle of DR Horton for providing the test houses and to Joseph Lstiburek of BSC Subrato Chandra and Neil Moyer of FSEC and Greg Barker of Mountain Energy Partnership for their assistance in the planning and execution of this ventilation study
47 of 49
Research Report - 0602
REFERENCES
ASHRAE (1993) ANSIASHRAE Standard 136-1993 A Method of Determining Air Change Rates in Detached Dwellings Atlanta GA American Society of Heating Refrigerating and Air-Conditioning Engineers Inc
ASHRAE (1997) ANSIASHRAE Standard 129-1997 Measuring Air-Change Effectiveness Atlanta GA American Society of Heating Refrigerating and Air-Conditioning Engineers Inc
ASHRAE (2004) ASHRAE Standard 622-2004 Ventilation and Acceptable Indoor Air Quality in Low-Rise Residential Buildings Atlanta GA American Society of Heating Refrigerating and Air-Conditioning Engineers Inc
CSA (2003) CANCSA F326-M91 Residential Mechanical Ventilation Systems Canadian Standards Association Ontario Canada httpwwwcsashyintlorgonlinestoreGetCatalogItemDetailsaspmat=2410793ampParent=102
NBC 2005 National Building Code of Canada httpircnrcshycnrcgccapubscodesnrcc47666_ehtml
Grieve PW (1991) Measuring Ventilation Using Tracer-Gases Denmark Bruumlel amp Kjaeligr
MN Chapter 7672 Minnesota Energy Code Chapter 7672 Detached Single-Family And Two-Family Dwellings httpwwwstatemnusmnexternalDocsCommerceChapter_7672_Residential_111302012428 _72rulepdf
Persily AK Martin SR (2000) A Modeling Study of Ventilation in Manufactured Houses Gaithersburg MD National Institute of Standards and Technology NISTIR 6455
Rudd A Lstiburek J (2000) ldquoMeasurement of Ventilation and Interzonal Distribution in Single-Family Homesrdquo ASHRAE Transactions 2000 MN-00-10-3 V 106 Pt2 American Society of Heating Refrigeration and Air-Conditioning Engineers Atlanta GA
WAC (2004) Washington State Title 51 WAC Community trade and economic development department of (building code council) Chapter 51-13 Ventilation and indoor air quality httpappslegwagovWACdefaultaspxcite=51-13
48 of 49
Research Report - 0602
Field test of room-to-room uniformity of ventilation air distribution in two new houses
About this Report
This report was prepared for the US Department of Energyrsquos Building America
Program The report is freely available to the public at wwwbuildingamericagov
The authors express their appreciation to Rich Coyle of DR Horton for providing the test houses and to Joseph Lstiburek of BSC Subrato Chandra and Neil Moyer of
FSEC and Greg Barker of Mountain Energy Partnership for their assistance in the planning and execution of this ventilation study
About the Authors
Robert Hendron Ren Anderson Dennis Barley are with National Renewable Energy Laboratory Armin Rudd and Aaron Townsend are with Building Science Corporation
Ed Hancock is with Mountain Energy Partnership
Direct all correspondence to Building Science Corporation 30 Forest Street Somerville MA 02143
Limits of Liability and Disclaimer of Warranty
Building Science documents are intended for professionals The author and the publisher of this article have used their best efforts to provide accurate and authoritative information in regard to the subject matter covered The author and publisher make no warranty of any kind expressed or implied with regard to the information contained in this article
The information presented in this article must be used with care by professionals who understand the implications of what they are doing If professional advice or other expert assistance is required the services of a competent professional shall be sought The author and publisher shall not be liable in the event of incidental or consequential damages in connection with or arising from the use of the information contained within this Building Science document
49 of 49

Research Report - 0602
first case the transfer grilles are untaped (Test A3) in the second they are taped closed (Test A10)
Minimum Test Duration
We were fortunate that DR Horton provided two full weeks of access to these homes to conduct this series of tests which allowed us to run some of the more important tracer gas decay tests as long as 12 hours to help ensure that we could accurately calculate reciprocal age-of-air In most cases test houses would not be available for such a long time period To evaluate the length of time needed to estimate the reciprocal age-of-air with reasonable accuracy we examined the results that we would have obtained for one of the exhaust ventilation tests had we halted the test period after less than 12 hours For the supply ventilation tests the rooms were sufficiently well-mixed that the test could have been stopped after 3 or 4 hours assuming weather effects were steady
The reciprocal age-of-air calculations for the exhaust ventilation decay curves (Test A3 see Figure 12) based on test durations of 3 6 9 and 12 hours are shown in Figure 27 These test durations range from 053 to 21 air changes based on the average air change rate of 018 ACH (56 hours per air change) calculated for this test The ratio of highest to lowest reciprocal ageshyof-air is shown above the data points for each case These results suggest that shorter tests tend to overestimate the range and that perhaps 1frac12-2 air changes (roughly 9 to 12 hours in this case) may be necessary to obtain accurate calculations of reciprocal age-of-air when there is significant divergence among rooms From a qualitative standpoint one air change may be sufficient to determine the basic trend Without knowing in advance what mixing pattern will occur it is difficult to recommend a minimum test duration But assuming this test is fairly representative of a worst-case scenario a minimum of 15 air changes would be necessary to have a high degree of confidence in the quantitative difference in reciprocal age-of-air among rooms
31 of 49
Research Report - 0602
000
005
010
015
020
025
030
035
Re
cip
roc
al
Ag
e-O
f-A
ir (
hr-1
)
Living
Entry
BR1
BR2
BR3
MBR HighLow = 297
HighLow = 168 HighLow = 184 HighLow = 161
3-hour Test 6-hour Test 9-hour Test 12-hour Test
(053 Air Changes) (11 Air Changes) (16 Air Changes) (21 Air Changes)
Test Duration
Figure 27 Reciprocal age-of-air based on alternate test durations for 1-story house with exhaust ventilation from the laundry room at ASHRAE 622 level no central fan operation
and doors closed (Test A3) Average air change rate was 018 ACH
TEST RESULTS FROM 2-STORY HOUSE (1117 MONTAGUE)
The 2-story house was tested from January 3-10 2006 Three zones were selected on the first floor and three more were selected on the second floor as indicated by the red stars in Figure 4 The initial mixing of air among the rooms at the start of each test in this 2-story house was not as thorough as it was in the 1-story house Evidently the combined effects of the air handler and the portable de-stratification fan were not sufficient to overcome upward transport of tracer gas driven by the stack effect from the first to the second floor The resulting difference in initial tracer gas concentration among the rooms was about 5-10 This outcome emphasizes the significant effect of stack-driven infiltration on ventilation non-uniformity in multi-story homes Because our test method and equipment did not achieve a well-mixed condition at the start of each test there were some errors introduced into the reciprocal age-of-air analysis For future tests we would recommend larger de-stratification fans to obtain more well-mixed conditions in multi-story houses
Typical errors introduced by incomplete mixing of the tracer gas at the start of such a test were analyzed by examining two hypothetical cases where either all of the air entering a room comes from the outside or all of the air comes from an adjacent room with a different starting concentration If all of the air entering a space comes from the outside then a change in the initial concentration would have no effect on the reciprocal age-of-air because the decay curve would be exponential from the start and the area under the curve would be normalized based on
32 of 49
Research Report - 0602
the starting concentration in that zone However if the air entering a room passes through another room with a lower initial concentration the room receiving the air will have a lower concentration of tracer gas throughout the test compared to what the concentration would have been if the starting points were the same in both rooms This case is illustrated in Figure 28 where assumptions are made that the rooms are the same size the air exchange rate is 01 ACH for both rooms and the initial tracer gas concentration is 10 lower in the first room (upstream) than it is in the second room
The effect on reciprocal age-of-air is shown in Figure 29 A 10 difference in starting concentration results in an error of about 75 in reciprocal age-of-air for a room downstream of a room with a lower starting concentration assuming 01 ACH for both rooms The error would be somewhat smaller (about 5) if the air change rate was higher for both rooms (02 ACH) There would be no error introduced for rooms where all of the air infiltration comes from the outside Although the amount of error in the reciprocal age-of-air calculations can be affected by additional variables not examined here we feel that these percentages are reasonable estimates of the errors in our results for the 2-story house due to incomplete initial mixing of air
In each case an engineering judgment must be made regarding the significance of the error introduced by incomplete initial mixing As a general rule the differences in concentration at the start of the test should be small compared to the differences that are being measured in order for the results to be considered valid
Figure 28 Theoretical decay curves for a well-mixed case with uniform tracer gas concentration compared to a case where the upstream room starts with a concentration
10 lower than the downstream room
33 of 49
Research Report - 0602
Figure 29 Theoretical reciprocal age-of-air for a well-mixed case with uniform tracer gas concentration compared to a case where the upstream room starts with a concentration
10 lower than the downstream room
Natural Infiltration and Duct Leakage
A natural infiltration test was performed over a two hour period on the evening of January 8 (Test B14) The tracer gas decay curves are shown in Figure 30 There was a slight divergence between the first floor and second floor once the air handler was turned off but the rooms on each floor appeared to remain fairly well-mixed The average air change rate during the test period was about 011 ACH which was somewhat higher than the 1-story house as might be expected with an increased stack height
An air handler bedroom door bump test was conducted just prior to the test period shown in Figure 30 allowing observation of the combined effect of duct leakage to the outside and increased infiltration caused by room pressurization The average air change rate during that bump test was 013 ACH suggesting that closing doors and operating the fan added approximately 002 ACH to the whole-house average air change rate The average wind speed was a bit higher while the air handler was running (17 mph compared to 05 mph) so the effect of air handler operation may actually be somewhat less than the average ACH numbers indicate
34 of 49
Research Report - 0602
0
1
2
3
4
SF
6 C
on
ce
ntr
ati
on
(m
gm
3)
BR1
Living
Kitchen
BR2
BR3
MBR
Mixing stopped
Mixing restarted
1814 1843 1912 1940 2009 2038 2107 2136
Hour
Figure 30 Tracer gas decay for 2-story house with no ventilation no central fan operation and bedroom doors open (Test B14)
Distributed Supply vs Point Exhaust Ventilation
A 14-hour test (Test B1) was performed with an exhaust ventilation rate of 63 cfm in the laundry room which was located near the stairwell in the middle of the first floor The ventilation rate was again consistent with the ASHRAE 622 recommendations The tracer gas decay curves are shown in Figure 31 It is interesting that all three second floor rooms showed a delay before entering an exponential decay suggesting that some amount of air was moving from the first floor to the second floor even though the mechanical exhaust point was on the first floor It appears that the further depressurization of the first floor was insufficient to overcome the stack effect and draw a significant amount of outside air in through the rooms on the second floor
35 of 49
Research Report - 0602
182
9
192
9
202
9
212
9
222
9
232
9
029
129
229
329
429
529
629
729
828
929
102
8
112
8
122
8
0
10
20
30
40
50
60
70
SF
6 C
on
ce
ntr
ati
on
(m
gm
3)
BR1
Living
Kitchen
BR2
BR3
MBR
Mixing stopped
Mixing restarted
Hour
Figure 31 Tracer gas decay for 2-story house with exhaust ventilation from the laundry room at ASHRAE 622 level no central fan operation and bedroom doors closed (Test B1)
A supply ventilation test was performed on the 2-story house for about 11 hours starting late on January 4 (Test B3) The duct blaster was unable to provide the ventilation rate necessary to meet the minimum specified in ASHRAE 622 supplying 180 cfm instead of 189 cfm (95) The decay curves are shown in Figure 32 Although the curves are much more tightly packed than they were with the exhaust system there is more divergence than we saw with the supply system in the 1-story house most notably in the master bedroom
The reciprocal age-of-air calculations for both the exhaust and supply ventilation systems are shown in Figure 33 Again the results indicate that much better room-to-room distribution of ventilation air was achieved by the central-fan integrated supply system compared to the single-point exhaust system However for the supply ventilation test the differences in the initial tracer gas concentration were of the same magnitude as the differences in decay rates among the rooms As a result no conclusions should be drawn about the relative ranking of the supply ventilation rate among rooms based on Figure 33
36 of 49
Research Report - 0602
0
10
20
30
40
50
60
SF
6 C
on
ce
ntr
ati
on
(m
gm
3)
BR1
Living
Kitchen
BR2
BR3
MBR
Mixing stopped
Mixing restarted
2136 000 224 448 712 936 1200
Hour
Figure 32 Tracer gas decay for 2-story house with supply ventilation just under ASHRAE 622 level central fan operation at 33 duty cycle (20 min off 10 min on) and bedroom
doors closed (Test B3)
Simple Exhaust vs Central Fan Integrated
Supply )
000
005
010
015
020
025
Recip
rocal A
ge o
f A
ir (
1h
r
BR1
Living
Kitchen
BR2
BR3
MBR
Exhaust in laundry room no Centralized supply mixing
mixing 100 ASHRAE 33 duty cycle 95
doors closed ASHRAE doors closed
Figure 33 Reciprocal age-of-air for 2-story house with continuous exhaust ventilation (Test B1) compared to central fan integrated supply ventilation (Test B3) (Note
Uncertainties introduced by non-uniform starting concentration are of the same order of magnitude as the differences in reciprocal age-of-air among rooms for the supply ventilation case The relative ranking of rooms is not meaningful for that case)
37 of 49
Research Report - 0602
Air Handler Operation
The effect of occasional air handler operation on the distribution of exhaust ventilation air was evaluated on the afternoon of January 6 (Test B6) The tracer gas decay curves are shown in Figure 34 and reciprocal age-of-air calculations are shown in Figure 35 It should again be noted that before the test started the house was mixed using both the air handler and a de-stratification fan with the doors open During the test the doors were closed the de-stratification fan was turned off and the air handler operated at a 33 duty cycle (20 minutes off 10 minutes on) As was the case in the 1-story house this occasional operation of the air handler substantially improved the distribution of ventilation air among rooms even in conjunction with the point exhaust ventilation system There was very little divergence noticeable even with the air handler cycling on and off every half hour However because the initial differences in tracer gas concentration among rooms were as large as the differences in reciprocal age-of-air for the case with air handler operation no conclusions should be drawn about the relative ranking of ventilation rates among the rooms for that case
SF
6 C
on
cen
trati
on
(m
gm
3)
80
70
60
50
40
30
20
10
0
BR1
Living
Kitchen
BR2
BR3
MBR
Mixing stopped
Mixing restarted
1048 1200 1312 1424 1536 1648 1800 1912 2024
Hour
Figure 34 Tracer gas decay for 2-story house with continuous exhaust ventilation at ASHRAE 622 level central fan operation at 33 duty cycle (20 min off 10 min on) and
bedroom doors closed (Test B6)
38 of 49
Research Report - 0602
020
015 R
ec
ipro
ca
l A
ge
of
Air
(1
hr)
Exhaust Ventilation
No Mixing vs 33 Air Handler Duty Cycle
Exhaust in laundry room
no mixing 100
ASHRAE doors closed
33 air handler
operation exhaust in
laundry room 100
ASHRAE doors closed
BR1
Living
Kitchen
BR2
BR3
MBR
010
005
000
Figure 35 Reciprocal age-of-air for 2-story house with continuous exhaust ventilation with and without air handler operation (Tests B1 and B6) (Note Uncertainties introduced by non-uniform starting concentration are of the same order of magnitude as the differences in reciprocal age-of-air among rooms for the case with air handler operation The relative
ranking of rooms is not meaningful for that case)
Exhaust Location
The duct blaster was moved to the master bathroom exhaust register to see if there was a resulting change in ventilation air distribution (Test B18) The master bathroom was in the back of the house on the second floor between the master bedroom and bedroom 3 The decay curves are shown in Figure 36 and the reciprocal age-of-air results are shown in Figure 37 The rooms on each floor were well mixed before the test began although the mixing between the two floors was not as good Very wide divergence among rooms can be seen during the test especially between the upstairs bedrooms and the rest of the house Once again all three upstairs rooms appear to receive some air from the first floor but the master bedroom experiences a much higher volume of circulated air than the other two second-floor bedrooms which appear to be relatively stagnant
39 of 49
Research Report - 0602
0
10
20
30
40
50
60
70
80
90
SF
6 C
on
ce
ntr
ati
on
(m
gm
3)
BR1
Living
Kitchen
BR2
BR3
MBR
Mixing stopped
Mixing restarted
1912 2136 000 224 448 712 936 1200
Hour
Figure 36 Tracer gas decay for 2-story house with exhaust ventilation from the master bathroom at ASHRAE 622 level no central fan operation and bedroom doors closed (Test
B18)
Exhaust Ventilation
Laundry Room vs Master Bathroom
000
005
010
015
020
025
030
Exhaust in laundry room no
mixing 100 ASHRAE
doors closed
Exhaust in master bathroom
no mixing 100 ASHRAE
doors closed
Re
cip
roc
al A
ge
of
Air
(1
hr)
BR1
Living
Kitchen
BR2
BR3
MBR
Figure 37 Reciprocal age-of-air for 2-story house with exhaust ventilation from the master bathroom compared to the laundry room at ASHRAE 622 level no central fan operation
and bedroom doors closed (Tests B1 and B18)
40 of 49
Research Report - 0602
Ventilation Rate
The supply ventilation tests were repeated using flow rates of 60 and 33 of ASHRAE 622 recommendations corresponding to 114 cfm and 63 cfm respectively (Tests B2 and B4) The decay curves are shown in Figures 38 and 39 Reciprocal age-of-air for all three supply ventilation rates are shown in Figure 40 In all cases the rooms remained fairly well mixed especially rooms on the same floor As we observed in the 1-story house the ventilation rate in the 2-story house appeared to have very little effect on the uniformity of outside air provided to each room as long as it was mixed using the air handler One again the initial differences in tracer gas concentration among rooms were as large as the divergence in the decay curves preventing any conclusions about the relative ranking of ventilation rates among rooms for all three cases The error in initial concentration uniformity was bigger for the cases with air handler mixing because the relative divergence in the decay curves was so small compared to that of no air handler mixing In other words the error in relative ranking of ventilation rates for the cases with air handler mixing were not very important anyway because the relative differences between rooms were so small
1536 1648 1800 1912 2024 2136 2248
Hour
Figure 38 Tracer gas decay for 2-story house with supply ventilation at 60 of ASHRAE 622 level 33 central fan operation (20 min off 10 min on) and bedroom doors closed
(Test B2)
0
5
10
15
20
25
30
SF
6 C
on
cen
trati
on
(m
gm
3)
BR1 Living Kitchen BR2 BR3 MBR
Mixing stopped
Mixing restarted
41 of 49
Research Report - 0602
0
5
10
15
20
25
30
35
40
SF
6 C
on
cen
trati
on
(m
gm
3)
BR1
Living
Kitchen
BR2
BR3
MBR
Mixing stopped
Mixing restarted
1200 1312 1424 1536 1648 1800 1912
Hour
Figure 39 Tracer gas decay for 2-story house with supply ventilation at 33 of ASHRAE 622 level 33 central fan operation (20 min off 10 min on) and bedroom doors closed
(Test B4)
Supply Ventilation Rate Comparison
000
005
010
015
020
025
Re
cip
roc
al
Ag
e o
f A
ir (
1h
r)
BR1
Living
Kitchen
BR2
BR3
MBR
Centralized supply Centralized supply Centralized supply
mixing 33 duty mixing 33 duty mixing 33 duty
cycle 95 ASHRAE cycle 60 ASHRAE cycle 33 ASHRAE
doors closed doors closed doors closed
Figure 40 Reciprocal age-of-air for 2-story house with three levels of supply ventilation central fan operation at 33 duty cycle (20 min off 10 min on) and bedroom doors closed (Tests B3 B2 B4) (Note Uncertainties introduced by non-uniform starting
concentration are of the same order of magnitude as the differences in reciprocal age-of-air among rooms for all three cases The relative ranking of rooms is not meaningful for these
cases)
42 of 49
Research Report - 0602
The average air change rates for the three supply ventilation rates compared to the two exhaust ventilation schemes are shown in Figure 41 The CFIS system at 33 of the 622 ventilation flow rate provided a uniformly higher air change rate (013 ach) than the least ventilated rooms using exhaust ventilation from either the laundry or the master bathroom (010 ach Figure 37) It is noteworthy that the combined net air change rate with exhaust ventilation from the laundry room was significantly less than the air change rates for both exhaust ventilation from the master bathroom and supply ventilation at the air handler This illustrates the unpredictability of interactions between mechanical ventilation and natural infiltration which depend strongly on the distribution and size of cracks through which the outside air must pass to enter the house There may have been a relatively large building enclosure leakage opening near the laundry room (perhaps the utility penetrations or the door to the garage) that allowed a significant amount of outside air to quickly enter and leave the house through the exhaust flow without circulating around the house
0
005
01
015
02
025
Ave
rag
e A
CH
Natural Exhaust Exhaust Supply 95 Supply 60 Supply 33
Laundry Mbath
Rm 100 100
Figure 41 Average air change rates for 2-story house with supply ventilation at 33 60 and 95 of ASHRAE 622 recommendations (Tests B4 B2 B3) compared to natural
infiltration (Test B14) and exhaust ventilation with no central fan operation (Test B1) Bedroom doors were closed except for the natural infiltration test
Bedroom Doors
The laundry room exhaust ventilation test with no air handler operation (see Figure 31) was repeated with the doors open to evaluate the change in room-to-room ventilation air distribution (Test B10) The decay curves are shown in Figure 42 and the reciprocal age-of air calculations are shown in Figure 43 It is evident from Figure 42 that the test began before the rooms were
43 of 49
Research Report - 0602
0
5
10
15
20
25
SF
6 C
on
ce
ntr
ati
on
(m
gm
3)
BR1 Living Kitchen BR2 BR3 MBR
Mixing stopped
Mixing restarted
completely well mixed resulting in decay curves that could be somewhat misleading Because the master bedroom was at a higher concentration than the other rooms at the start of the test any room that received air from the master bedroom would appear to have a slower decay rate than it would have if the rooms started out at the same concentration Despite the difference in starting concentration it is clear that outside air was well distributed when the doors were open even without operation of the air handler
1843 1912 1940 2009 2038 2107 2136 2204 2233 2302
Hour
Figure 42 Tracer gas decay for the 2-story house with exhaust ventilation from the laundry room at ASHRAE 622 level no central fan operation and bedroom doors open
(Test B10)
Reciprocal age-of-air analysis was not performed for this case because of the combined effect of a short test duration (~2 hours) and unequal starting tracer gas concentrations even though the house was relatively well-mixed The important conclusion (that opening doors greatly improves mixing) can be drawn by inspecting the decay curves alone
Transfer Grilles
A final exhaust ventilation test was run on the 2-story house with the doors closed and the transfer grilles taped over The decay curves are shown in Figure 43 and the reciprocal age-ofshyair calculations are shown in Figure 44 The curves were clearly very divergent even after 12 hours By examining the reciprocal age-of-air results it is apparent that the transfer grilles in the 2-story house caused a noticeable improvement in ventilation air distribution but the improvement was smaller than when the doors were opened (Figure 42)
44 of 49
Research Report - 0602
0
5
10
15
20
25
30
SF
6 C
on
cen
tra
tio
n (
mg
m3
) BR1 Living Kitchen BR2 BR3 MBR
Mixing stopped
Mixing restarted
1648 1912 2136 000 224 448 712 936
Hour
Figure 43 Tracer gas decay for 2-story house with exhaust ventilation from the laundry room at ASHRAE 622 level no central fan operation bedroom doors closed transfer
grilles taped closed (Test B7)
Exhaust Ventilation Transfer Grilles Untaped vs Taped
000
005
010
015
020
Re
cip
roc
al
Ag
e o
f A
ir (
1h
r)
BR1
Living
Kitchen
BR2
BR3
MBR
Exhaust in laundry room no Exhaust in laundry room no
mixing 100 ASHRAE mixing 100 ASHRAE
doors closed doors closed transfer
grilles taped
Figure 44 Reciprocal age-of-air for 2-story house with exhaust ventilation from the laundry room at ASHRAE 622 level no central fan operation and doors closed In the first case the transfer grilles are untaped (Test B3) in the second they are taped closed
(Test B7)
45 of 49
Research Report - 0602
CONCLUSIONS
bull Reciprocal age-of-air analysis was chosen as a quantitative method for characterizing distribution of ventilation air among rooms This method worked well in cases where rooms were well mixed to begin the test and weather conditions were sufficiently steady-state
bull A test period of at least 1frac12 air changes was necessary to obtain reasonably accurate ageshyof-air results when there was significant divergence in tracer gas concentration among the rooms
bull Although we did not achieve uniform initial concentration of tracer gas in the 2-story house using our test methodology and the equipment at hand we believe the reciprocal age-of-air calculations were meaningful in many of the cases as indicated in the discussion
bull Both houses were relatively tight with natural infiltration averaging 008 ACH for the 1shystory house and 011 ACH for the 2-story house
bull Both houses had relatively small (but not negligible) duct losses to the outside producing an increase in infiltration of less than 003 ACH for the 1-story house and 002 ACH for the 2-story house when the air handler runs
bull Age-of-air analysis indicated that ventilation supplied through the central air distribution system provided much more uniform distribution of ventilation air than the single-point exhaust system when the doors were closed and the air handler was not running For the 1-story house the central-fan-integrated supply ventilation case at 60 of ASHRAE 622 provided more outside air to all rooms than the least-ventilated room in the exhaust case at 100 of 622 For the 2-story house the central-fan-integrated supply system at 33 of the 622 flow rate provided more outside air to all rooms than the least ventilated rooms using exhaust ventilation at 100 of 622 from either the laundry or the master bathroom
bull Operation of the central fan at a 33 duty cycle maintained relatively well-mixed conditions regardless of ventilation rate type of ventilation system (supply or exhaust) or house configuration (1-story or 2-story)
bull Exhaust location affected both the relative amount of outside air received by different rooms and the overall uniformity among rooms but the effect was not predictable
bull For exhaust-only ventilation without central fan operation opening bedroom doors appeared to significantly improve the mixing of ventilation air among rooms
bull Transfer grilles improved the distribution of ventilation air slightly but much less than opening the bedroom doors
bull In the 2-story house the stack effect caused air movement from the first floor to the second floor even when exhaust ventilation was applied to the first floor resulting in consistently higher tracer gas concentrations on the second floor and more non-uniform ventilation air distribution in general
bull Interactions between natural infiltration and both exhaust and supply mechanical ventilation were very significant When the ventilation system was activated the combined air change rate did not increase commensurate with the measured ventilation rate but instead increased by only half that amount This result was consistent with combining ventilation and infiltration in quadrature to estimate whole-house air change rate in accordance with ASHRAE Standard 136 (ASHRAE 1993)
46 of 49
Research Report - 0602
FUTURE WORK
In future tests continuous monitoring of pressure differentials would enhance our understanding of the multi-zone combined infiltration and ventilation systems and our ability to model them That would help to explain differences between tests in more detail including the effects of multiple stories location of ventilation supply outlets and exhaust inlets interior door closure and use of passive return air transfer grilles Pressure differential measurement points should include
bull dP with respect to outside for each closed room and open space bull dP across closed interior doors bull dP between the floor cavity and outdoors and bull dP between the house and the attic
Measurement of wind direction along with wind speed could also be helpful for modeling these buildings and systems However because of micro-climate wind shielding it may be very difficult to relate a single-point wind direction measurement to actual wind vectors on the building surfaces
ACKNOWLEDGMENTS
The authors express their appreciation to Rich Coyle of DR Horton for providing the test houses and to Joseph Lstiburek of BSC Subrato Chandra and Neil Moyer of FSEC and Greg Barker of Mountain Energy Partnership for their assistance in the planning and execution of this ventilation study
47 of 49
Research Report - 0602
REFERENCES
ASHRAE (1993) ANSIASHRAE Standard 136-1993 A Method of Determining Air Change Rates in Detached Dwellings Atlanta GA American Society of Heating Refrigerating and Air-Conditioning Engineers Inc
ASHRAE (1997) ANSIASHRAE Standard 129-1997 Measuring Air-Change Effectiveness Atlanta GA American Society of Heating Refrigerating and Air-Conditioning Engineers Inc
ASHRAE (2004) ASHRAE Standard 622-2004 Ventilation and Acceptable Indoor Air Quality in Low-Rise Residential Buildings Atlanta GA American Society of Heating Refrigerating and Air-Conditioning Engineers Inc
CSA (2003) CANCSA F326-M91 Residential Mechanical Ventilation Systems Canadian Standards Association Ontario Canada httpwwwcsashyintlorgonlinestoreGetCatalogItemDetailsaspmat=2410793ampParent=102
NBC 2005 National Building Code of Canada httpircnrcshycnrcgccapubscodesnrcc47666_ehtml
Grieve PW (1991) Measuring Ventilation Using Tracer-Gases Denmark Bruumlel amp Kjaeligr
MN Chapter 7672 Minnesota Energy Code Chapter 7672 Detached Single-Family And Two-Family Dwellings httpwwwstatemnusmnexternalDocsCommerceChapter_7672_Residential_111302012428 _72rulepdf
Persily AK Martin SR (2000) A Modeling Study of Ventilation in Manufactured Houses Gaithersburg MD National Institute of Standards and Technology NISTIR 6455
Rudd A Lstiburek J (2000) ldquoMeasurement of Ventilation and Interzonal Distribution in Single-Family Homesrdquo ASHRAE Transactions 2000 MN-00-10-3 V 106 Pt2 American Society of Heating Refrigeration and Air-Conditioning Engineers Atlanta GA
WAC (2004) Washington State Title 51 WAC Community trade and economic development department of (building code council) Chapter 51-13 Ventilation and indoor air quality httpappslegwagovWACdefaultaspxcite=51-13
48 of 49
Research Report - 0602
Field test of room-to-room uniformity of ventilation air distribution in two new houses
About this Report
This report was prepared for the US Department of Energyrsquos Building America
Program The report is freely available to the public at wwwbuildingamericagov
The authors express their appreciation to Rich Coyle of DR Horton for providing the test houses and to Joseph Lstiburek of BSC Subrato Chandra and Neil Moyer of
FSEC and Greg Barker of Mountain Energy Partnership for their assistance in the planning and execution of this ventilation study
About the Authors
Robert Hendron Ren Anderson Dennis Barley are with National Renewable Energy Laboratory Armin Rudd and Aaron Townsend are with Building Science Corporation
Ed Hancock is with Mountain Energy Partnership
Direct all correspondence to Building Science Corporation 30 Forest Street Somerville MA 02143
Limits of Liability and Disclaimer of Warranty
Building Science documents are intended for professionals The author and the publisher of this article have used their best efforts to provide accurate and authoritative information in regard to the subject matter covered The author and publisher make no warranty of any kind expressed or implied with regard to the information contained in this article
The information presented in this article must be used with care by professionals who understand the implications of what they are doing If professional advice or other expert assistance is required the services of a competent professional shall be sought The author and publisher shall not be liable in the event of incidental or consequential damages in connection with or arising from the use of the information contained within this Building Science document
49 of 49
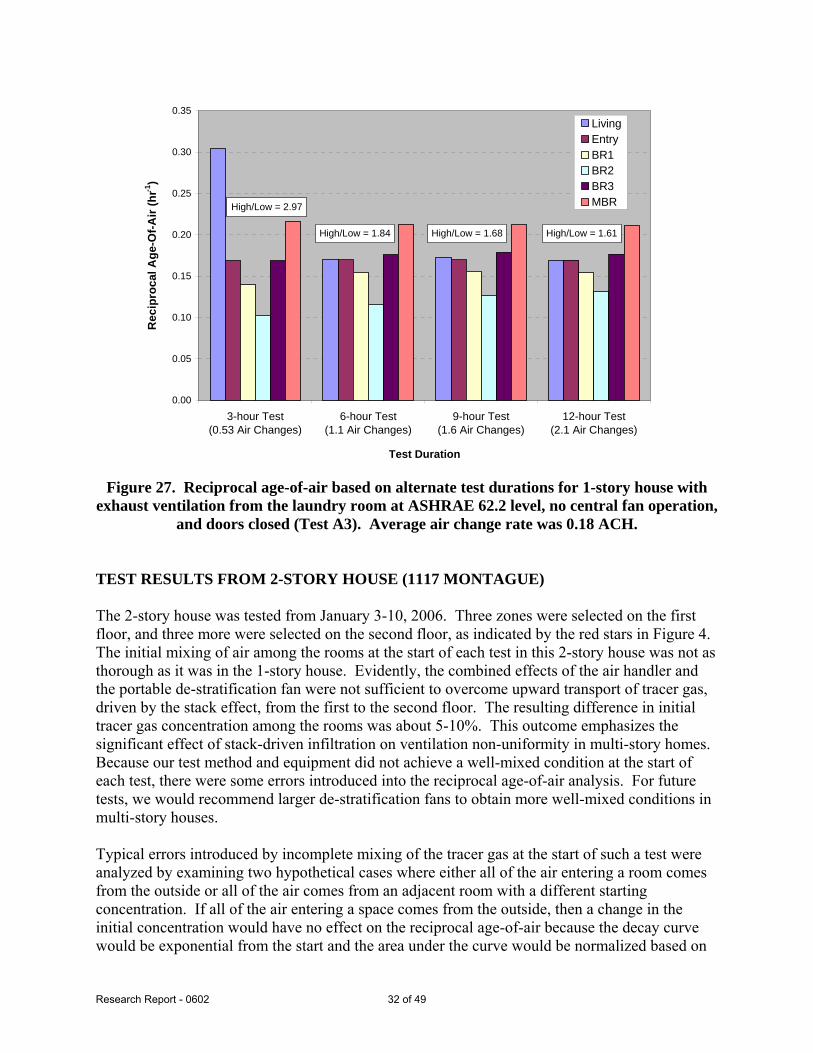
Research Report - 0602
000
005
010
015
020
025
030
035
Re
cip
roc
al
Ag
e-O
f-A
ir (
hr-1
)
Living
Entry
BR1
BR2
BR3
MBR HighLow = 297
HighLow = 168 HighLow = 184 HighLow = 161
3-hour Test 6-hour Test 9-hour Test 12-hour Test
(053 Air Changes) (11 Air Changes) (16 Air Changes) (21 Air Changes)
Test Duration
Figure 27 Reciprocal age-of-air based on alternate test durations for 1-story house with exhaust ventilation from the laundry room at ASHRAE 622 level no central fan operation
and doors closed (Test A3) Average air change rate was 018 ACH
TEST RESULTS FROM 2-STORY HOUSE (1117 MONTAGUE)
The 2-story house was tested from January 3-10 2006 Three zones were selected on the first floor and three more were selected on the second floor as indicated by the red stars in Figure 4 The initial mixing of air among the rooms at the start of each test in this 2-story house was not as thorough as it was in the 1-story house Evidently the combined effects of the air handler and the portable de-stratification fan were not sufficient to overcome upward transport of tracer gas driven by the stack effect from the first to the second floor The resulting difference in initial tracer gas concentration among the rooms was about 5-10 This outcome emphasizes the significant effect of stack-driven infiltration on ventilation non-uniformity in multi-story homes Because our test method and equipment did not achieve a well-mixed condition at the start of each test there were some errors introduced into the reciprocal age-of-air analysis For future tests we would recommend larger de-stratification fans to obtain more well-mixed conditions in multi-story houses
Typical errors introduced by incomplete mixing of the tracer gas at the start of such a test were analyzed by examining two hypothetical cases where either all of the air entering a room comes from the outside or all of the air comes from an adjacent room with a different starting concentration If all of the air entering a space comes from the outside then a change in the initial concentration would have no effect on the reciprocal age-of-air because the decay curve would be exponential from the start and the area under the curve would be normalized based on
32 of 49
Research Report - 0602
the starting concentration in that zone However if the air entering a room passes through another room with a lower initial concentration the room receiving the air will have a lower concentration of tracer gas throughout the test compared to what the concentration would have been if the starting points were the same in both rooms This case is illustrated in Figure 28 where assumptions are made that the rooms are the same size the air exchange rate is 01 ACH for both rooms and the initial tracer gas concentration is 10 lower in the first room (upstream) than it is in the second room
The effect on reciprocal age-of-air is shown in Figure 29 A 10 difference in starting concentration results in an error of about 75 in reciprocal age-of-air for a room downstream of a room with a lower starting concentration assuming 01 ACH for both rooms The error would be somewhat smaller (about 5) if the air change rate was higher for both rooms (02 ACH) There would be no error introduced for rooms where all of the air infiltration comes from the outside Although the amount of error in the reciprocal age-of-air calculations can be affected by additional variables not examined here we feel that these percentages are reasonable estimates of the errors in our results for the 2-story house due to incomplete initial mixing of air
In each case an engineering judgment must be made regarding the significance of the error introduced by incomplete initial mixing As a general rule the differences in concentration at the start of the test should be small compared to the differences that are being measured in order for the results to be considered valid
Figure 28 Theoretical decay curves for a well-mixed case with uniform tracer gas concentration compared to a case where the upstream room starts with a concentration
10 lower than the downstream room
33 of 49
Research Report - 0602
Figure 29 Theoretical reciprocal age-of-air for a well-mixed case with uniform tracer gas concentration compared to a case where the upstream room starts with a concentration
10 lower than the downstream room
Natural Infiltration and Duct Leakage
A natural infiltration test was performed over a two hour period on the evening of January 8 (Test B14) The tracer gas decay curves are shown in Figure 30 There was a slight divergence between the first floor and second floor once the air handler was turned off but the rooms on each floor appeared to remain fairly well-mixed The average air change rate during the test period was about 011 ACH which was somewhat higher than the 1-story house as might be expected with an increased stack height
An air handler bedroom door bump test was conducted just prior to the test period shown in Figure 30 allowing observation of the combined effect of duct leakage to the outside and increased infiltration caused by room pressurization The average air change rate during that bump test was 013 ACH suggesting that closing doors and operating the fan added approximately 002 ACH to the whole-house average air change rate The average wind speed was a bit higher while the air handler was running (17 mph compared to 05 mph) so the effect of air handler operation may actually be somewhat less than the average ACH numbers indicate
34 of 49
Research Report - 0602
0
1
2
3
4
SF
6 C
on
ce
ntr
ati
on
(m
gm
3)
BR1
Living
Kitchen
BR2
BR3
MBR
Mixing stopped
Mixing restarted
1814 1843 1912 1940 2009 2038 2107 2136
Hour
Figure 30 Tracer gas decay for 2-story house with no ventilation no central fan operation and bedroom doors open (Test B14)
Distributed Supply vs Point Exhaust Ventilation
A 14-hour test (Test B1) was performed with an exhaust ventilation rate of 63 cfm in the laundry room which was located near the stairwell in the middle of the first floor The ventilation rate was again consistent with the ASHRAE 622 recommendations The tracer gas decay curves are shown in Figure 31 It is interesting that all three second floor rooms showed a delay before entering an exponential decay suggesting that some amount of air was moving from the first floor to the second floor even though the mechanical exhaust point was on the first floor It appears that the further depressurization of the first floor was insufficient to overcome the stack effect and draw a significant amount of outside air in through the rooms on the second floor
35 of 49
Research Report - 0602
182
9
192
9
202
9
212
9
222
9
232
9
029
129
229
329
429
529
629
729
828
929
102
8
112
8
122
8
0
10
20
30
40
50
60
70
SF
6 C
on
ce
ntr
ati
on
(m
gm
3)
BR1
Living
Kitchen
BR2
BR3
MBR
Mixing stopped
Mixing restarted
Hour
Figure 31 Tracer gas decay for 2-story house with exhaust ventilation from the laundry room at ASHRAE 622 level no central fan operation and bedroom doors closed (Test B1)
A supply ventilation test was performed on the 2-story house for about 11 hours starting late on January 4 (Test B3) The duct blaster was unable to provide the ventilation rate necessary to meet the minimum specified in ASHRAE 622 supplying 180 cfm instead of 189 cfm (95) The decay curves are shown in Figure 32 Although the curves are much more tightly packed than they were with the exhaust system there is more divergence than we saw with the supply system in the 1-story house most notably in the master bedroom
The reciprocal age-of-air calculations for both the exhaust and supply ventilation systems are shown in Figure 33 Again the results indicate that much better room-to-room distribution of ventilation air was achieved by the central-fan integrated supply system compared to the single-point exhaust system However for the supply ventilation test the differences in the initial tracer gas concentration were of the same magnitude as the differences in decay rates among the rooms As a result no conclusions should be drawn about the relative ranking of the supply ventilation rate among rooms based on Figure 33
36 of 49
Research Report - 0602
0
10
20
30
40
50
60
SF
6 C
on
ce
ntr
ati
on
(m
gm
3)
BR1
Living
Kitchen
BR2
BR3
MBR
Mixing stopped
Mixing restarted
2136 000 224 448 712 936 1200
Hour
Figure 32 Tracer gas decay for 2-story house with supply ventilation just under ASHRAE 622 level central fan operation at 33 duty cycle (20 min off 10 min on) and bedroom
doors closed (Test B3)
Simple Exhaust vs Central Fan Integrated
Supply )
000
005
010
015
020
025
Recip
rocal A
ge o
f A
ir (
1h
r
BR1
Living
Kitchen
BR2
BR3
MBR
Exhaust in laundry room no Centralized supply mixing
mixing 100 ASHRAE 33 duty cycle 95
doors closed ASHRAE doors closed
Figure 33 Reciprocal age-of-air for 2-story house with continuous exhaust ventilation (Test B1) compared to central fan integrated supply ventilation (Test B3) (Note
Uncertainties introduced by non-uniform starting concentration are of the same order of magnitude as the differences in reciprocal age-of-air among rooms for the supply ventilation case The relative ranking of rooms is not meaningful for that case)
37 of 49
Research Report - 0602
Air Handler Operation
The effect of occasional air handler operation on the distribution of exhaust ventilation air was evaluated on the afternoon of January 6 (Test B6) The tracer gas decay curves are shown in Figure 34 and reciprocal age-of-air calculations are shown in Figure 35 It should again be noted that before the test started the house was mixed using both the air handler and a de-stratification fan with the doors open During the test the doors were closed the de-stratification fan was turned off and the air handler operated at a 33 duty cycle (20 minutes off 10 minutes on) As was the case in the 1-story house this occasional operation of the air handler substantially improved the distribution of ventilation air among rooms even in conjunction with the point exhaust ventilation system There was very little divergence noticeable even with the air handler cycling on and off every half hour However because the initial differences in tracer gas concentration among rooms were as large as the differences in reciprocal age-of-air for the case with air handler operation no conclusions should be drawn about the relative ranking of ventilation rates among the rooms for that case
SF
6 C
on
cen
trati
on
(m
gm
3)
80
70
60
50
40
30
20
10
0
BR1
Living
Kitchen
BR2
BR3
MBR
Mixing stopped
Mixing restarted
1048 1200 1312 1424 1536 1648 1800 1912 2024
Hour
Figure 34 Tracer gas decay for 2-story house with continuous exhaust ventilation at ASHRAE 622 level central fan operation at 33 duty cycle (20 min off 10 min on) and
bedroom doors closed (Test B6)
38 of 49
Research Report - 0602
020
015 R
ec
ipro
ca
l A
ge
of
Air
(1
hr)
Exhaust Ventilation
No Mixing vs 33 Air Handler Duty Cycle
Exhaust in laundry room
no mixing 100
ASHRAE doors closed
33 air handler
operation exhaust in
laundry room 100
ASHRAE doors closed
BR1
Living
Kitchen
BR2
BR3
MBR
010
005
000
Figure 35 Reciprocal age-of-air for 2-story house with continuous exhaust ventilation with and without air handler operation (Tests B1 and B6) (Note Uncertainties introduced by non-uniform starting concentration are of the same order of magnitude as the differences in reciprocal age-of-air among rooms for the case with air handler operation The relative
ranking of rooms is not meaningful for that case)
Exhaust Location
The duct blaster was moved to the master bathroom exhaust register to see if there was a resulting change in ventilation air distribution (Test B18) The master bathroom was in the back of the house on the second floor between the master bedroom and bedroom 3 The decay curves are shown in Figure 36 and the reciprocal age-of-air results are shown in Figure 37 The rooms on each floor were well mixed before the test began although the mixing between the two floors was not as good Very wide divergence among rooms can be seen during the test especially between the upstairs bedrooms and the rest of the house Once again all three upstairs rooms appear to receive some air from the first floor but the master bedroom experiences a much higher volume of circulated air than the other two second-floor bedrooms which appear to be relatively stagnant
39 of 49
Research Report - 0602
0
10
20
30
40
50
60
70
80
90
SF
6 C
on
ce
ntr
ati
on
(m
gm
3)
BR1
Living
Kitchen
BR2
BR3
MBR
Mixing stopped
Mixing restarted
1912 2136 000 224 448 712 936 1200
Hour
Figure 36 Tracer gas decay for 2-story house with exhaust ventilation from the master bathroom at ASHRAE 622 level no central fan operation and bedroom doors closed (Test
B18)
Exhaust Ventilation
Laundry Room vs Master Bathroom
000
005
010
015
020
025
030
Exhaust in laundry room no
mixing 100 ASHRAE
doors closed
Exhaust in master bathroom
no mixing 100 ASHRAE
doors closed
Re
cip
roc
al A
ge
of
Air
(1
hr)
BR1
Living
Kitchen
BR2
BR3
MBR
Figure 37 Reciprocal age-of-air for 2-story house with exhaust ventilation from the master bathroom compared to the laundry room at ASHRAE 622 level no central fan operation
and bedroom doors closed (Tests B1 and B18)
40 of 49
Research Report - 0602
Ventilation Rate
The supply ventilation tests were repeated using flow rates of 60 and 33 of ASHRAE 622 recommendations corresponding to 114 cfm and 63 cfm respectively (Tests B2 and B4) The decay curves are shown in Figures 38 and 39 Reciprocal age-of-air for all three supply ventilation rates are shown in Figure 40 In all cases the rooms remained fairly well mixed especially rooms on the same floor As we observed in the 1-story house the ventilation rate in the 2-story house appeared to have very little effect on the uniformity of outside air provided to each room as long as it was mixed using the air handler One again the initial differences in tracer gas concentration among rooms were as large as the divergence in the decay curves preventing any conclusions about the relative ranking of ventilation rates among rooms for all three cases The error in initial concentration uniformity was bigger for the cases with air handler mixing because the relative divergence in the decay curves was so small compared to that of no air handler mixing In other words the error in relative ranking of ventilation rates for the cases with air handler mixing were not very important anyway because the relative differences between rooms were so small
1536 1648 1800 1912 2024 2136 2248
Hour
Figure 38 Tracer gas decay for 2-story house with supply ventilation at 60 of ASHRAE 622 level 33 central fan operation (20 min off 10 min on) and bedroom doors closed
(Test B2)
0
5
10
15
20
25
30
SF
6 C
on
cen
trati
on
(m
gm
3)
BR1 Living Kitchen BR2 BR3 MBR
Mixing stopped
Mixing restarted
41 of 49
Research Report - 0602
0
5
10
15
20
25
30
35
40
SF
6 C
on
cen
trati
on
(m
gm
3)
BR1
Living
Kitchen
BR2
BR3
MBR
Mixing stopped
Mixing restarted
1200 1312 1424 1536 1648 1800 1912
Hour
Figure 39 Tracer gas decay for 2-story house with supply ventilation at 33 of ASHRAE 622 level 33 central fan operation (20 min off 10 min on) and bedroom doors closed
(Test B4)
Supply Ventilation Rate Comparison
000
005
010
015
020
025
Re
cip
roc
al
Ag
e o
f A
ir (
1h
r)
BR1
Living
Kitchen
BR2
BR3
MBR
Centralized supply Centralized supply Centralized supply
mixing 33 duty mixing 33 duty mixing 33 duty
cycle 95 ASHRAE cycle 60 ASHRAE cycle 33 ASHRAE
doors closed doors closed doors closed
Figure 40 Reciprocal age-of-air for 2-story house with three levels of supply ventilation central fan operation at 33 duty cycle (20 min off 10 min on) and bedroom doors closed (Tests B3 B2 B4) (Note Uncertainties introduced by non-uniform starting
concentration are of the same order of magnitude as the differences in reciprocal age-of-air among rooms for all three cases The relative ranking of rooms is not meaningful for these
cases)
42 of 49
Research Report - 0602
The average air change rates for the three supply ventilation rates compared to the two exhaust ventilation schemes are shown in Figure 41 The CFIS system at 33 of the 622 ventilation flow rate provided a uniformly higher air change rate (013 ach) than the least ventilated rooms using exhaust ventilation from either the laundry or the master bathroom (010 ach Figure 37) It is noteworthy that the combined net air change rate with exhaust ventilation from the laundry room was significantly less than the air change rates for both exhaust ventilation from the master bathroom and supply ventilation at the air handler This illustrates the unpredictability of interactions between mechanical ventilation and natural infiltration which depend strongly on the distribution and size of cracks through which the outside air must pass to enter the house There may have been a relatively large building enclosure leakage opening near the laundry room (perhaps the utility penetrations or the door to the garage) that allowed a significant amount of outside air to quickly enter and leave the house through the exhaust flow without circulating around the house
0
005
01
015
02
025
Ave
rag
e A
CH
Natural Exhaust Exhaust Supply 95 Supply 60 Supply 33
Laundry Mbath
Rm 100 100
Figure 41 Average air change rates for 2-story house with supply ventilation at 33 60 and 95 of ASHRAE 622 recommendations (Tests B4 B2 B3) compared to natural
infiltration (Test B14) and exhaust ventilation with no central fan operation (Test B1) Bedroom doors were closed except for the natural infiltration test
Bedroom Doors
The laundry room exhaust ventilation test with no air handler operation (see Figure 31) was repeated with the doors open to evaluate the change in room-to-room ventilation air distribution (Test B10) The decay curves are shown in Figure 42 and the reciprocal age-of air calculations are shown in Figure 43 It is evident from Figure 42 that the test began before the rooms were
43 of 49
Research Report - 0602
0
5
10
15
20
25
SF
6 C
on
ce
ntr
ati
on
(m
gm
3)
BR1 Living Kitchen BR2 BR3 MBR
Mixing stopped
Mixing restarted
completely well mixed resulting in decay curves that could be somewhat misleading Because the master bedroom was at a higher concentration than the other rooms at the start of the test any room that received air from the master bedroom would appear to have a slower decay rate than it would have if the rooms started out at the same concentration Despite the difference in starting concentration it is clear that outside air was well distributed when the doors were open even without operation of the air handler
1843 1912 1940 2009 2038 2107 2136 2204 2233 2302
Hour
Figure 42 Tracer gas decay for the 2-story house with exhaust ventilation from the laundry room at ASHRAE 622 level no central fan operation and bedroom doors open
(Test B10)
Reciprocal age-of-air analysis was not performed for this case because of the combined effect of a short test duration (~2 hours) and unequal starting tracer gas concentrations even though the house was relatively well-mixed The important conclusion (that opening doors greatly improves mixing) can be drawn by inspecting the decay curves alone
Transfer Grilles
A final exhaust ventilation test was run on the 2-story house with the doors closed and the transfer grilles taped over The decay curves are shown in Figure 43 and the reciprocal age-ofshyair calculations are shown in Figure 44 The curves were clearly very divergent even after 12 hours By examining the reciprocal age-of-air results it is apparent that the transfer grilles in the 2-story house caused a noticeable improvement in ventilation air distribution but the improvement was smaller than when the doors were opened (Figure 42)
44 of 49
Research Report - 0602
0
5
10
15
20
25
30
SF
6 C
on
cen
tra
tio
n (
mg
m3
) BR1 Living Kitchen BR2 BR3 MBR
Mixing stopped
Mixing restarted
1648 1912 2136 000 224 448 712 936
Hour
Figure 43 Tracer gas decay for 2-story house with exhaust ventilation from the laundry room at ASHRAE 622 level no central fan operation bedroom doors closed transfer
grilles taped closed (Test B7)
Exhaust Ventilation Transfer Grilles Untaped vs Taped
000
005
010
015
020
Re
cip
roc
al
Ag
e o
f A
ir (
1h
r)
BR1
Living
Kitchen
BR2
BR3
MBR
Exhaust in laundry room no Exhaust in laundry room no
mixing 100 ASHRAE mixing 100 ASHRAE
doors closed doors closed transfer
grilles taped
Figure 44 Reciprocal age-of-air for 2-story house with exhaust ventilation from the laundry room at ASHRAE 622 level no central fan operation and doors closed In the first case the transfer grilles are untaped (Test B3) in the second they are taped closed
(Test B7)
45 of 49
Research Report - 0602
CONCLUSIONS
bull Reciprocal age-of-air analysis was chosen as a quantitative method for characterizing distribution of ventilation air among rooms This method worked well in cases where rooms were well mixed to begin the test and weather conditions were sufficiently steady-state
bull A test period of at least 1frac12 air changes was necessary to obtain reasonably accurate ageshyof-air results when there was significant divergence in tracer gas concentration among the rooms
bull Although we did not achieve uniform initial concentration of tracer gas in the 2-story house using our test methodology and the equipment at hand we believe the reciprocal age-of-air calculations were meaningful in many of the cases as indicated in the discussion
bull Both houses were relatively tight with natural infiltration averaging 008 ACH for the 1shystory house and 011 ACH for the 2-story house
bull Both houses had relatively small (but not negligible) duct losses to the outside producing an increase in infiltration of less than 003 ACH for the 1-story house and 002 ACH for the 2-story house when the air handler runs
bull Age-of-air analysis indicated that ventilation supplied through the central air distribution system provided much more uniform distribution of ventilation air than the single-point exhaust system when the doors were closed and the air handler was not running For the 1-story house the central-fan-integrated supply ventilation case at 60 of ASHRAE 622 provided more outside air to all rooms than the least-ventilated room in the exhaust case at 100 of 622 For the 2-story house the central-fan-integrated supply system at 33 of the 622 flow rate provided more outside air to all rooms than the least ventilated rooms using exhaust ventilation at 100 of 622 from either the laundry or the master bathroom
bull Operation of the central fan at a 33 duty cycle maintained relatively well-mixed conditions regardless of ventilation rate type of ventilation system (supply or exhaust) or house configuration (1-story or 2-story)
bull Exhaust location affected both the relative amount of outside air received by different rooms and the overall uniformity among rooms but the effect was not predictable
bull For exhaust-only ventilation without central fan operation opening bedroom doors appeared to significantly improve the mixing of ventilation air among rooms
bull Transfer grilles improved the distribution of ventilation air slightly but much less than opening the bedroom doors
bull In the 2-story house the stack effect caused air movement from the first floor to the second floor even when exhaust ventilation was applied to the first floor resulting in consistently higher tracer gas concentrations on the second floor and more non-uniform ventilation air distribution in general
bull Interactions between natural infiltration and both exhaust and supply mechanical ventilation were very significant When the ventilation system was activated the combined air change rate did not increase commensurate with the measured ventilation rate but instead increased by only half that amount This result was consistent with combining ventilation and infiltration in quadrature to estimate whole-house air change rate in accordance with ASHRAE Standard 136 (ASHRAE 1993)
46 of 49
Research Report - 0602
FUTURE WORK
In future tests continuous monitoring of pressure differentials would enhance our understanding of the multi-zone combined infiltration and ventilation systems and our ability to model them That would help to explain differences between tests in more detail including the effects of multiple stories location of ventilation supply outlets and exhaust inlets interior door closure and use of passive return air transfer grilles Pressure differential measurement points should include
bull dP with respect to outside for each closed room and open space bull dP across closed interior doors bull dP between the floor cavity and outdoors and bull dP between the house and the attic
Measurement of wind direction along with wind speed could also be helpful for modeling these buildings and systems However because of micro-climate wind shielding it may be very difficult to relate a single-point wind direction measurement to actual wind vectors on the building surfaces
ACKNOWLEDGMENTS
The authors express their appreciation to Rich Coyle of DR Horton for providing the test houses and to Joseph Lstiburek of BSC Subrato Chandra and Neil Moyer of FSEC and Greg Barker of Mountain Energy Partnership for their assistance in the planning and execution of this ventilation study
47 of 49
Research Report - 0602
REFERENCES
ASHRAE (1993) ANSIASHRAE Standard 136-1993 A Method of Determining Air Change Rates in Detached Dwellings Atlanta GA American Society of Heating Refrigerating and Air-Conditioning Engineers Inc
ASHRAE (1997) ANSIASHRAE Standard 129-1997 Measuring Air-Change Effectiveness Atlanta GA American Society of Heating Refrigerating and Air-Conditioning Engineers Inc
ASHRAE (2004) ASHRAE Standard 622-2004 Ventilation and Acceptable Indoor Air Quality in Low-Rise Residential Buildings Atlanta GA American Society of Heating Refrigerating and Air-Conditioning Engineers Inc
CSA (2003) CANCSA F326-M91 Residential Mechanical Ventilation Systems Canadian Standards Association Ontario Canada httpwwwcsashyintlorgonlinestoreGetCatalogItemDetailsaspmat=2410793ampParent=102
NBC 2005 National Building Code of Canada httpircnrcshycnrcgccapubscodesnrcc47666_ehtml
Grieve PW (1991) Measuring Ventilation Using Tracer-Gases Denmark Bruumlel amp Kjaeligr
MN Chapter 7672 Minnesota Energy Code Chapter 7672 Detached Single-Family And Two-Family Dwellings httpwwwstatemnusmnexternalDocsCommerceChapter_7672_Residential_111302012428 _72rulepdf
Persily AK Martin SR (2000) A Modeling Study of Ventilation in Manufactured Houses Gaithersburg MD National Institute of Standards and Technology NISTIR 6455
Rudd A Lstiburek J (2000) ldquoMeasurement of Ventilation and Interzonal Distribution in Single-Family Homesrdquo ASHRAE Transactions 2000 MN-00-10-3 V 106 Pt2 American Society of Heating Refrigeration and Air-Conditioning Engineers Atlanta GA
WAC (2004) Washington State Title 51 WAC Community trade and economic development department of (building code council) Chapter 51-13 Ventilation and indoor air quality httpappslegwagovWACdefaultaspxcite=51-13
48 of 49
Research Report - 0602
Field test of room-to-room uniformity of ventilation air distribution in two new houses
About this Report
This report was prepared for the US Department of Energyrsquos Building America
Program The report is freely available to the public at wwwbuildingamericagov
The authors express their appreciation to Rich Coyle of DR Horton for providing the test houses and to Joseph Lstiburek of BSC Subrato Chandra and Neil Moyer of
FSEC and Greg Barker of Mountain Energy Partnership for their assistance in the planning and execution of this ventilation study
About the Authors
Robert Hendron Ren Anderson Dennis Barley are with National Renewable Energy Laboratory Armin Rudd and Aaron Townsend are with Building Science Corporation
Ed Hancock is with Mountain Energy Partnership
Direct all correspondence to Building Science Corporation 30 Forest Street Somerville MA 02143
Limits of Liability and Disclaimer of Warranty
Building Science documents are intended for professionals The author and the publisher of this article have used their best efforts to provide accurate and authoritative information in regard to the subject matter covered The author and publisher make no warranty of any kind expressed or implied with regard to the information contained in this article
The information presented in this article must be used with care by professionals who understand the implications of what they are doing If professional advice or other expert assistance is required the services of a competent professional shall be sought The author and publisher shall not be liable in the event of incidental or consequential damages in connection with or arising from the use of the information contained within this Building Science document
49 of 49
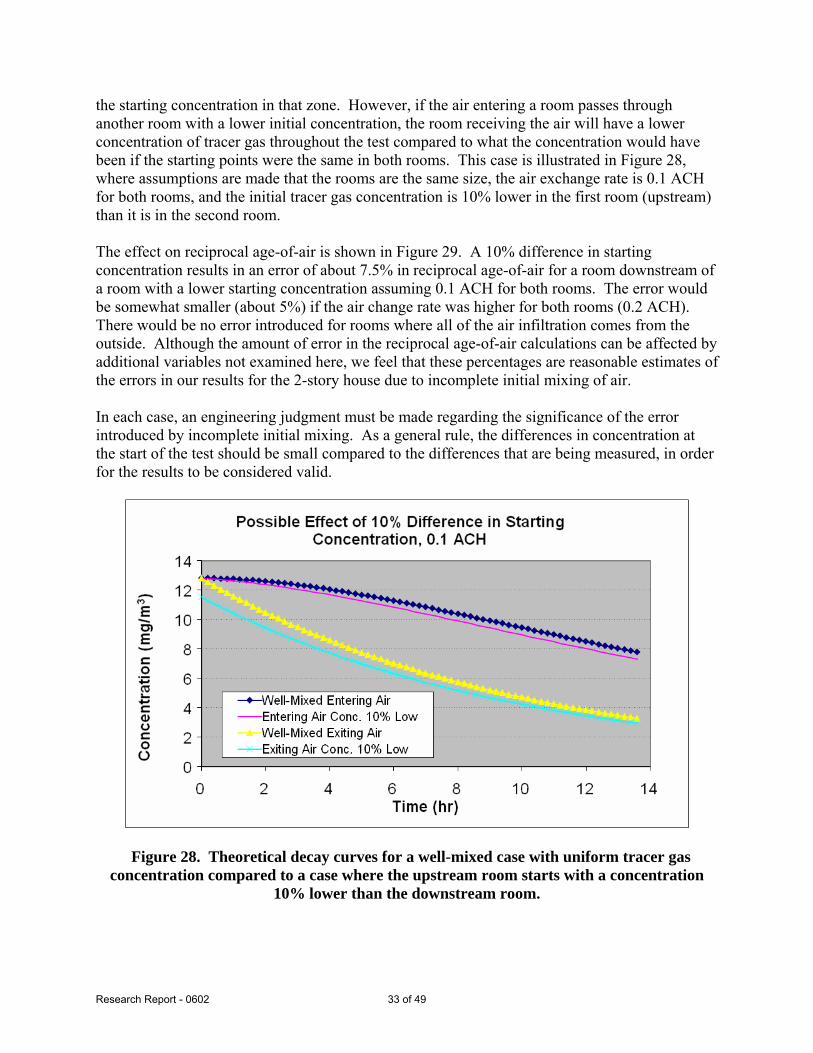
Research Report - 0602
the starting concentration in that zone However if the air entering a room passes through another room with a lower initial concentration the room receiving the air will have a lower concentration of tracer gas throughout the test compared to what the concentration would have been if the starting points were the same in both rooms This case is illustrated in Figure 28 where assumptions are made that the rooms are the same size the air exchange rate is 01 ACH for both rooms and the initial tracer gas concentration is 10 lower in the first room (upstream) than it is in the second room
The effect on reciprocal age-of-air is shown in Figure 29 A 10 difference in starting concentration results in an error of about 75 in reciprocal age-of-air for a room downstream of a room with a lower starting concentration assuming 01 ACH for both rooms The error would be somewhat smaller (about 5) if the air change rate was higher for both rooms (02 ACH) There would be no error introduced for rooms where all of the air infiltration comes from the outside Although the amount of error in the reciprocal age-of-air calculations can be affected by additional variables not examined here we feel that these percentages are reasonable estimates of the errors in our results for the 2-story house due to incomplete initial mixing of air
In each case an engineering judgment must be made regarding the significance of the error introduced by incomplete initial mixing As a general rule the differences in concentration at the start of the test should be small compared to the differences that are being measured in order for the results to be considered valid
Figure 28 Theoretical decay curves for a well-mixed case with uniform tracer gas concentration compared to a case where the upstream room starts with a concentration
10 lower than the downstream room
33 of 49
Research Report - 0602
Figure 29 Theoretical reciprocal age-of-air for a well-mixed case with uniform tracer gas concentration compared to a case where the upstream room starts with a concentration
10 lower than the downstream room
Natural Infiltration and Duct Leakage
A natural infiltration test was performed over a two hour period on the evening of January 8 (Test B14) The tracer gas decay curves are shown in Figure 30 There was a slight divergence between the first floor and second floor once the air handler was turned off but the rooms on each floor appeared to remain fairly well-mixed The average air change rate during the test period was about 011 ACH which was somewhat higher than the 1-story house as might be expected with an increased stack height
An air handler bedroom door bump test was conducted just prior to the test period shown in Figure 30 allowing observation of the combined effect of duct leakage to the outside and increased infiltration caused by room pressurization The average air change rate during that bump test was 013 ACH suggesting that closing doors and operating the fan added approximately 002 ACH to the whole-house average air change rate The average wind speed was a bit higher while the air handler was running (17 mph compared to 05 mph) so the effect of air handler operation may actually be somewhat less than the average ACH numbers indicate
34 of 49
Research Report - 0602
0
1
2
3
4
SF
6 C
on
ce
ntr
ati
on
(m
gm
3)
BR1
Living
Kitchen
BR2
BR3
MBR
Mixing stopped
Mixing restarted
1814 1843 1912 1940 2009 2038 2107 2136
Hour
Figure 30 Tracer gas decay for 2-story house with no ventilation no central fan operation and bedroom doors open (Test B14)
Distributed Supply vs Point Exhaust Ventilation
A 14-hour test (Test B1) was performed with an exhaust ventilation rate of 63 cfm in the laundry room which was located near the stairwell in the middle of the first floor The ventilation rate was again consistent with the ASHRAE 622 recommendations The tracer gas decay curves are shown in Figure 31 It is interesting that all three second floor rooms showed a delay before entering an exponential decay suggesting that some amount of air was moving from the first floor to the second floor even though the mechanical exhaust point was on the first floor It appears that the further depressurization of the first floor was insufficient to overcome the stack effect and draw a significant amount of outside air in through the rooms on the second floor
35 of 49
Research Report - 0602
182
9
192
9
202
9
212
9
222
9
232
9
029
129
229
329
429
529
629
729
828
929
102
8
112
8
122
8
0
10
20
30
40
50
60
70
SF
6 C
on
ce
ntr
ati
on
(m
gm
3)
BR1
Living
Kitchen
BR2
BR3
MBR
Mixing stopped
Mixing restarted
Hour
Figure 31 Tracer gas decay for 2-story house with exhaust ventilation from the laundry room at ASHRAE 622 level no central fan operation and bedroom doors closed (Test B1)
A supply ventilation test was performed on the 2-story house for about 11 hours starting late on January 4 (Test B3) The duct blaster was unable to provide the ventilation rate necessary to meet the minimum specified in ASHRAE 622 supplying 180 cfm instead of 189 cfm (95) The decay curves are shown in Figure 32 Although the curves are much more tightly packed than they were with the exhaust system there is more divergence than we saw with the supply system in the 1-story house most notably in the master bedroom
The reciprocal age-of-air calculations for both the exhaust and supply ventilation systems are shown in Figure 33 Again the results indicate that much better room-to-room distribution of ventilation air was achieved by the central-fan integrated supply system compared to the single-point exhaust system However for the supply ventilation test the differences in the initial tracer gas concentration were of the same magnitude as the differences in decay rates among the rooms As a result no conclusions should be drawn about the relative ranking of the supply ventilation rate among rooms based on Figure 33
36 of 49
Research Report - 0602
0
10
20
30
40
50
60
SF
6 C
on
ce
ntr
ati
on
(m
gm
3)
BR1
Living
Kitchen
BR2
BR3
MBR
Mixing stopped
Mixing restarted
2136 000 224 448 712 936 1200
Hour
Figure 32 Tracer gas decay for 2-story house with supply ventilation just under ASHRAE 622 level central fan operation at 33 duty cycle (20 min off 10 min on) and bedroom
doors closed (Test B3)
Simple Exhaust vs Central Fan Integrated
Supply )
000
005
010
015
020
025
Recip
rocal A
ge o
f A
ir (
1h
r
BR1
Living
Kitchen
BR2
BR3
MBR
Exhaust in laundry room no Centralized supply mixing
mixing 100 ASHRAE 33 duty cycle 95
doors closed ASHRAE doors closed
Figure 33 Reciprocal age-of-air for 2-story house with continuous exhaust ventilation (Test B1) compared to central fan integrated supply ventilation (Test B3) (Note
Uncertainties introduced by non-uniform starting concentration are of the same order of magnitude as the differences in reciprocal age-of-air among rooms for the supply ventilation case The relative ranking of rooms is not meaningful for that case)
37 of 49
Research Report - 0602
Air Handler Operation
The effect of occasional air handler operation on the distribution of exhaust ventilation air was evaluated on the afternoon of January 6 (Test B6) The tracer gas decay curves are shown in Figure 34 and reciprocal age-of-air calculations are shown in Figure 35 It should again be noted that before the test started the house was mixed using both the air handler and a de-stratification fan with the doors open During the test the doors were closed the de-stratification fan was turned off and the air handler operated at a 33 duty cycle (20 minutes off 10 minutes on) As was the case in the 1-story house this occasional operation of the air handler substantially improved the distribution of ventilation air among rooms even in conjunction with the point exhaust ventilation system There was very little divergence noticeable even with the air handler cycling on and off every half hour However because the initial differences in tracer gas concentration among rooms were as large as the differences in reciprocal age-of-air for the case with air handler operation no conclusions should be drawn about the relative ranking of ventilation rates among the rooms for that case
SF
6 C
on
cen
trati
on
(m
gm
3)
80
70
60
50
40
30
20
10
0
BR1
Living
Kitchen
BR2
BR3
MBR
Mixing stopped
Mixing restarted
1048 1200 1312 1424 1536 1648 1800 1912 2024
Hour
Figure 34 Tracer gas decay for 2-story house with continuous exhaust ventilation at ASHRAE 622 level central fan operation at 33 duty cycle (20 min off 10 min on) and
bedroom doors closed (Test B6)
38 of 49
Research Report - 0602
020
015 R
ec
ipro
ca
l A
ge
of
Air
(1
hr)
Exhaust Ventilation
No Mixing vs 33 Air Handler Duty Cycle
Exhaust in laundry room
no mixing 100
ASHRAE doors closed
33 air handler
operation exhaust in
laundry room 100
ASHRAE doors closed
BR1
Living
Kitchen
BR2
BR3
MBR
010
005
000
Figure 35 Reciprocal age-of-air for 2-story house with continuous exhaust ventilation with and without air handler operation (Tests B1 and B6) (Note Uncertainties introduced by non-uniform starting concentration are of the same order of magnitude as the differences in reciprocal age-of-air among rooms for the case with air handler operation The relative
ranking of rooms is not meaningful for that case)
Exhaust Location
The duct blaster was moved to the master bathroom exhaust register to see if there was a resulting change in ventilation air distribution (Test B18) The master bathroom was in the back of the house on the second floor between the master bedroom and bedroom 3 The decay curves are shown in Figure 36 and the reciprocal age-of-air results are shown in Figure 37 The rooms on each floor were well mixed before the test began although the mixing between the two floors was not as good Very wide divergence among rooms can be seen during the test especially between the upstairs bedrooms and the rest of the house Once again all three upstairs rooms appear to receive some air from the first floor but the master bedroom experiences a much higher volume of circulated air than the other two second-floor bedrooms which appear to be relatively stagnant
39 of 49
Research Report - 0602
0
10
20
30
40
50
60
70
80
90
SF
6 C
on
ce
ntr
ati
on
(m
gm
3)
BR1
Living
Kitchen
BR2
BR3
MBR
Mixing stopped
Mixing restarted
1912 2136 000 224 448 712 936 1200
Hour
Figure 36 Tracer gas decay for 2-story house with exhaust ventilation from the master bathroom at ASHRAE 622 level no central fan operation and bedroom doors closed (Test
B18)
Exhaust Ventilation
Laundry Room vs Master Bathroom
000
005
010
015
020
025
030
Exhaust in laundry room no
mixing 100 ASHRAE
doors closed
Exhaust in master bathroom
no mixing 100 ASHRAE
doors closed
Re
cip
roc
al A
ge
of
Air
(1
hr)
BR1
Living
Kitchen
BR2
BR3
MBR
Figure 37 Reciprocal age-of-air for 2-story house with exhaust ventilation from the master bathroom compared to the laundry room at ASHRAE 622 level no central fan operation
and bedroom doors closed (Tests B1 and B18)
40 of 49
Research Report - 0602
Ventilation Rate
The supply ventilation tests were repeated using flow rates of 60 and 33 of ASHRAE 622 recommendations corresponding to 114 cfm and 63 cfm respectively (Tests B2 and B4) The decay curves are shown in Figures 38 and 39 Reciprocal age-of-air for all three supply ventilation rates are shown in Figure 40 In all cases the rooms remained fairly well mixed especially rooms on the same floor As we observed in the 1-story house the ventilation rate in the 2-story house appeared to have very little effect on the uniformity of outside air provided to each room as long as it was mixed using the air handler One again the initial differences in tracer gas concentration among rooms were as large as the divergence in the decay curves preventing any conclusions about the relative ranking of ventilation rates among rooms for all three cases The error in initial concentration uniformity was bigger for the cases with air handler mixing because the relative divergence in the decay curves was so small compared to that of no air handler mixing In other words the error in relative ranking of ventilation rates for the cases with air handler mixing were not very important anyway because the relative differences between rooms were so small
1536 1648 1800 1912 2024 2136 2248
Hour
Figure 38 Tracer gas decay for 2-story house with supply ventilation at 60 of ASHRAE 622 level 33 central fan operation (20 min off 10 min on) and bedroom doors closed
(Test B2)
0
5
10
15
20
25
30
SF
6 C
on
cen
trati
on
(m
gm
3)
BR1 Living Kitchen BR2 BR3 MBR
Mixing stopped
Mixing restarted
41 of 49
Research Report - 0602
0
5
10
15
20
25
30
35
40
SF
6 C
on
cen
trati
on
(m
gm
3)
BR1
Living
Kitchen
BR2
BR3
MBR
Mixing stopped
Mixing restarted
1200 1312 1424 1536 1648 1800 1912
Hour
Figure 39 Tracer gas decay for 2-story house with supply ventilation at 33 of ASHRAE 622 level 33 central fan operation (20 min off 10 min on) and bedroom doors closed
(Test B4)
Supply Ventilation Rate Comparison
000
005
010
015
020
025
Re
cip
roc
al
Ag
e o
f A
ir (
1h
r)
BR1
Living
Kitchen
BR2
BR3
MBR
Centralized supply Centralized supply Centralized supply
mixing 33 duty mixing 33 duty mixing 33 duty
cycle 95 ASHRAE cycle 60 ASHRAE cycle 33 ASHRAE
doors closed doors closed doors closed
Figure 40 Reciprocal age-of-air for 2-story house with three levels of supply ventilation central fan operation at 33 duty cycle (20 min off 10 min on) and bedroom doors closed (Tests B3 B2 B4) (Note Uncertainties introduced by non-uniform starting
concentration are of the same order of magnitude as the differences in reciprocal age-of-air among rooms for all three cases The relative ranking of rooms is not meaningful for these
cases)
42 of 49
Research Report - 0602
The average air change rates for the three supply ventilation rates compared to the two exhaust ventilation schemes are shown in Figure 41 The CFIS system at 33 of the 622 ventilation flow rate provided a uniformly higher air change rate (013 ach) than the least ventilated rooms using exhaust ventilation from either the laundry or the master bathroom (010 ach Figure 37) It is noteworthy that the combined net air change rate with exhaust ventilation from the laundry room was significantly less than the air change rates for both exhaust ventilation from the master bathroom and supply ventilation at the air handler This illustrates the unpredictability of interactions between mechanical ventilation and natural infiltration which depend strongly on the distribution and size of cracks through which the outside air must pass to enter the house There may have been a relatively large building enclosure leakage opening near the laundry room (perhaps the utility penetrations or the door to the garage) that allowed a significant amount of outside air to quickly enter and leave the house through the exhaust flow without circulating around the house
0
005
01
015
02
025
Ave
rag
e A
CH
Natural Exhaust Exhaust Supply 95 Supply 60 Supply 33
Laundry Mbath
Rm 100 100
Figure 41 Average air change rates for 2-story house with supply ventilation at 33 60 and 95 of ASHRAE 622 recommendations (Tests B4 B2 B3) compared to natural
infiltration (Test B14) and exhaust ventilation with no central fan operation (Test B1) Bedroom doors were closed except for the natural infiltration test
Bedroom Doors
The laundry room exhaust ventilation test with no air handler operation (see Figure 31) was repeated with the doors open to evaluate the change in room-to-room ventilation air distribution (Test B10) The decay curves are shown in Figure 42 and the reciprocal age-of air calculations are shown in Figure 43 It is evident from Figure 42 that the test began before the rooms were
43 of 49
Research Report - 0602
0
5
10
15
20
25
SF
6 C
on
ce
ntr
ati
on
(m
gm
3)
BR1 Living Kitchen BR2 BR3 MBR
Mixing stopped
Mixing restarted
completely well mixed resulting in decay curves that could be somewhat misleading Because the master bedroom was at a higher concentration than the other rooms at the start of the test any room that received air from the master bedroom would appear to have a slower decay rate than it would have if the rooms started out at the same concentration Despite the difference in starting concentration it is clear that outside air was well distributed when the doors were open even without operation of the air handler
1843 1912 1940 2009 2038 2107 2136 2204 2233 2302
Hour
Figure 42 Tracer gas decay for the 2-story house with exhaust ventilation from the laundry room at ASHRAE 622 level no central fan operation and bedroom doors open
(Test B10)
Reciprocal age-of-air analysis was not performed for this case because of the combined effect of a short test duration (~2 hours) and unequal starting tracer gas concentrations even though the house was relatively well-mixed The important conclusion (that opening doors greatly improves mixing) can be drawn by inspecting the decay curves alone
Transfer Grilles
A final exhaust ventilation test was run on the 2-story house with the doors closed and the transfer grilles taped over The decay curves are shown in Figure 43 and the reciprocal age-ofshyair calculations are shown in Figure 44 The curves were clearly very divergent even after 12 hours By examining the reciprocal age-of-air results it is apparent that the transfer grilles in the 2-story house caused a noticeable improvement in ventilation air distribution but the improvement was smaller than when the doors were opened (Figure 42)
44 of 49
Research Report - 0602
0
5
10
15
20
25
30
SF
6 C
on
cen
tra
tio
n (
mg
m3
) BR1 Living Kitchen BR2 BR3 MBR
Mixing stopped
Mixing restarted
1648 1912 2136 000 224 448 712 936
Hour
Figure 43 Tracer gas decay for 2-story house with exhaust ventilation from the laundry room at ASHRAE 622 level no central fan operation bedroom doors closed transfer
grilles taped closed (Test B7)
Exhaust Ventilation Transfer Grilles Untaped vs Taped
000
005
010
015
020
Re
cip
roc
al
Ag
e o
f A
ir (
1h
r)
BR1
Living
Kitchen
BR2
BR3
MBR
Exhaust in laundry room no Exhaust in laundry room no
mixing 100 ASHRAE mixing 100 ASHRAE
doors closed doors closed transfer
grilles taped
Figure 44 Reciprocal age-of-air for 2-story house with exhaust ventilation from the laundry room at ASHRAE 622 level no central fan operation and doors closed In the first case the transfer grilles are untaped (Test B3) in the second they are taped closed
(Test B7)
45 of 49
Research Report - 0602
CONCLUSIONS
bull Reciprocal age-of-air analysis was chosen as a quantitative method for characterizing distribution of ventilation air among rooms This method worked well in cases where rooms were well mixed to begin the test and weather conditions were sufficiently steady-state
bull A test period of at least 1frac12 air changes was necessary to obtain reasonably accurate ageshyof-air results when there was significant divergence in tracer gas concentration among the rooms
bull Although we did not achieve uniform initial concentration of tracer gas in the 2-story house using our test methodology and the equipment at hand we believe the reciprocal age-of-air calculations were meaningful in many of the cases as indicated in the discussion
bull Both houses were relatively tight with natural infiltration averaging 008 ACH for the 1shystory house and 011 ACH for the 2-story house
bull Both houses had relatively small (but not negligible) duct losses to the outside producing an increase in infiltration of less than 003 ACH for the 1-story house and 002 ACH for the 2-story house when the air handler runs
bull Age-of-air analysis indicated that ventilation supplied through the central air distribution system provided much more uniform distribution of ventilation air than the single-point exhaust system when the doors were closed and the air handler was not running For the 1-story house the central-fan-integrated supply ventilation case at 60 of ASHRAE 622 provided more outside air to all rooms than the least-ventilated room in the exhaust case at 100 of 622 For the 2-story house the central-fan-integrated supply system at 33 of the 622 flow rate provided more outside air to all rooms than the least ventilated rooms using exhaust ventilation at 100 of 622 from either the laundry or the master bathroom
bull Operation of the central fan at a 33 duty cycle maintained relatively well-mixed conditions regardless of ventilation rate type of ventilation system (supply or exhaust) or house configuration (1-story or 2-story)
bull Exhaust location affected both the relative amount of outside air received by different rooms and the overall uniformity among rooms but the effect was not predictable
bull For exhaust-only ventilation without central fan operation opening bedroom doors appeared to significantly improve the mixing of ventilation air among rooms
bull Transfer grilles improved the distribution of ventilation air slightly but much less than opening the bedroom doors
bull In the 2-story house the stack effect caused air movement from the first floor to the second floor even when exhaust ventilation was applied to the first floor resulting in consistently higher tracer gas concentrations on the second floor and more non-uniform ventilation air distribution in general
bull Interactions between natural infiltration and both exhaust and supply mechanical ventilation were very significant When the ventilation system was activated the combined air change rate did not increase commensurate with the measured ventilation rate but instead increased by only half that amount This result was consistent with combining ventilation and infiltration in quadrature to estimate whole-house air change rate in accordance with ASHRAE Standard 136 (ASHRAE 1993)
46 of 49
Research Report - 0602
FUTURE WORK
In future tests continuous monitoring of pressure differentials would enhance our understanding of the multi-zone combined infiltration and ventilation systems and our ability to model them That would help to explain differences between tests in more detail including the effects of multiple stories location of ventilation supply outlets and exhaust inlets interior door closure and use of passive return air transfer grilles Pressure differential measurement points should include
bull dP with respect to outside for each closed room and open space bull dP across closed interior doors bull dP between the floor cavity and outdoors and bull dP between the house and the attic
Measurement of wind direction along with wind speed could also be helpful for modeling these buildings and systems However because of micro-climate wind shielding it may be very difficult to relate a single-point wind direction measurement to actual wind vectors on the building surfaces
ACKNOWLEDGMENTS
The authors express their appreciation to Rich Coyle of DR Horton for providing the test houses and to Joseph Lstiburek of BSC Subrato Chandra and Neil Moyer of FSEC and Greg Barker of Mountain Energy Partnership for their assistance in the planning and execution of this ventilation study
47 of 49
Research Report - 0602
REFERENCES
ASHRAE (1993) ANSIASHRAE Standard 136-1993 A Method of Determining Air Change Rates in Detached Dwellings Atlanta GA American Society of Heating Refrigerating and Air-Conditioning Engineers Inc
ASHRAE (1997) ANSIASHRAE Standard 129-1997 Measuring Air-Change Effectiveness Atlanta GA American Society of Heating Refrigerating and Air-Conditioning Engineers Inc
ASHRAE (2004) ASHRAE Standard 622-2004 Ventilation and Acceptable Indoor Air Quality in Low-Rise Residential Buildings Atlanta GA American Society of Heating Refrigerating and Air-Conditioning Engineers Inc
CSA (2003) CANCSA F326-M91 Residential Mechanical Ventilation Systems Canadian Standards Association Ontario Canada httpwwwcsashyintlorgonlinestoreGetCatalogItemDetailsaspmat=2410793ampParent=102
NBC 2005 National Building Code of Canada httpircnrcshycnrcgccapubscodesnrcc47666_ehtml
Grieve PW (1991) Measuring Ventilation Using Tracer-Gases Denmark Bruumlel amp Kjaeligr
MN Chapter 7672 Minnesota Energy Code Chapter 7672 Detached Single-Family And Two-Family Dwellings httpwwwstatemnusmnexternalDocsCommerceChapter_7672_Residential_111302012428 _72rulepdf
Persily AK Martin SR (2000) A Modeling Study of Ventilation in Manufactured Houses Gaithersburg MD National Institute of Standards and Technology NISTIR 6455
Rudd A Lstiburek J (2000) ldquoMeasurement of Ventilation and Interzonal Distribution in Single-Family Homesrdquo ASHRAE Transactions 2000 MN-00-10-3 V 106 Pt2 American Society of Heating Refrigeration and Air-Conditioning Engineers Atlanta GA
WAC (2004) Washington State Title 51 WAC Community trade and economic development department of (building code council) Chapter 51-13 Ventilation and indoor air quality httpappslegwagovWACdefaultaspxcite=51-13
48 of 49
Research Report - 0602
Field test of room-to-room uniformity of ventilation air distribution in two new houses
About this Report
This report was prepared for the US Department of Energyrsquos Building America
Program The report is freely available to the public at wwwbuildingamericagov
The authors express their appreciation to Rich Coyle of DR Horton for providing the test houses and to Joseph Lstiburek of BSC Subrato Chandra and Neil Moyer of
FSEC and Greg Barker of Mountain Energy Partnership for their assistance in the planning and execution of this ventilation study
About the Authors
Robert Hendron Ren Anderson Dennis Barley are with National Renewable Energy Laboratory Armin Rudd and Aaron Townsend are with Building Science Corporation
Ed Hancock is with Mountain Energy Partnership
Direct all correspondence to Building Science Corporation 30 Forest Street Somerville MA 02143
Limits of Liability and Disclaimer of Warranty
Building Science documents are intended for professionals The author and the publisher of this article have used their best efforts to provide accurate and authoritative information in regard to the subject matter covered The author and publisher make no warranty of any kind expressed or implied with regard to the information contained in this article
The information presented in this article must be used with care by professionals who understand the implications of what they are doing If professional advice or other expert assistance is required the services of a competent professional shall be sought The author and publisher shall not be liable in the event of incidental or consequential damages in connection with or arising from the use of the information contained within this Building Science document
49 of 49
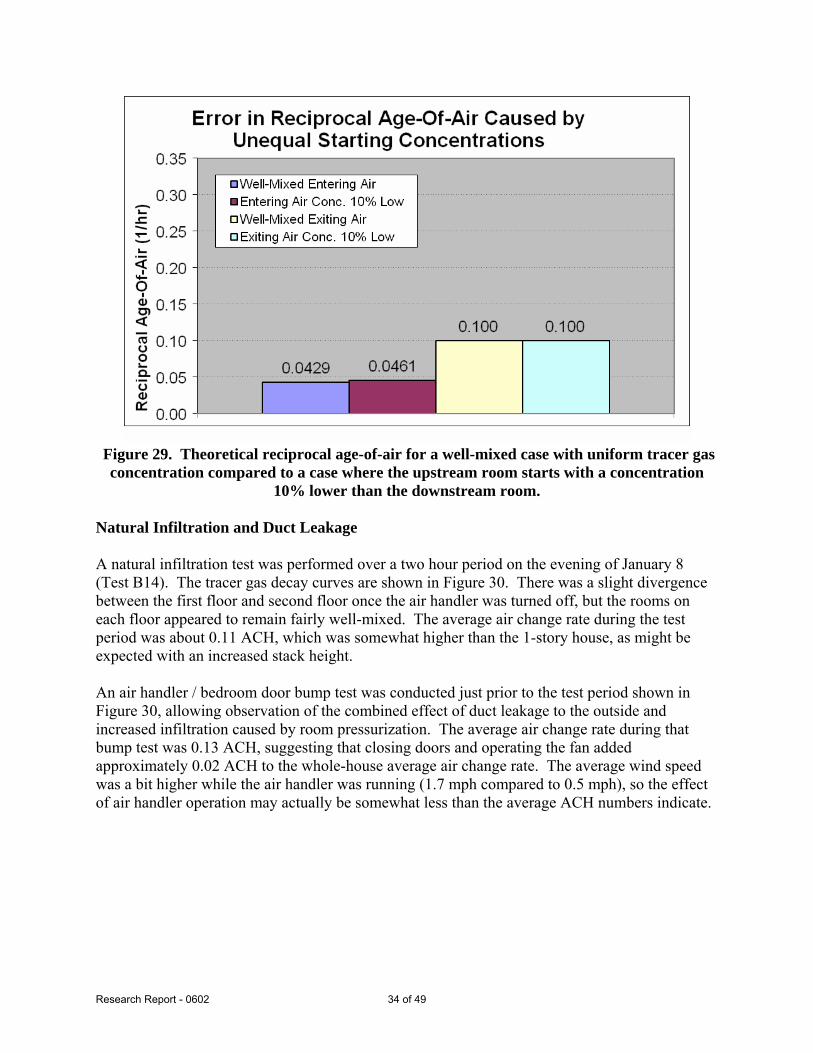
Research Report - 0602
0
1
2
3
4
SF
6 C
on
ce
ntr
ati
on
(m
gm
3)
BR1
Living
Kitchen
BR2
BR3
MBR
Mixing stopped
Mixing restarted
1814 1843 1912 1940 2009 2038 2107 2136
Hour
Figure 30 Tracer gas decay for 2-story house with no ventilation no central fan operation and bedroom doors open (Test B14)
Distributed Supply vs Point Exhaust Ventilation
A 14-hour test (Test B1) was performed with an exhaust ventilation rate of 63 cfm in the laundry room which was located near the stairwell in the middle of the first floor The ventilation rate was again consistent with the ASHRAE 622 recommendations The tracer gas decay curves are shown in Figure 31 It is interesting that all three second floor rooms showed a delay before entering an exponential decay suggesting that some amount of air was moving from the first floor to the second floor even though the mechanical exhaust point was on the first floor It appears that the further depressurization of the first floor was insufficient to overcome the stack effect and draw a significant amount of outside air in through the rooms on the second floor
35 of 49
Research Report - 0602
182
9
192
9
202
9
212
9
222
9
232
9
029
129
229
329
429
529
629
729
828
929
102
8
112
8
122
8
0
10
20
30
40
50
60
70
SF
6 C
on
ce
ntr
ati
on
(m
gm
3)
BR1
Living
Kitchen
BR2
BR3
MBR
Mixing stopped
Mixing restarted
Hour
Figure 31 Tracer gas decay for 2-story house with exhaust ventilation from the laundry room at ASHRAE 622 level no central fan operation and bedroom doors closed (Test B1)
A supply ventilation test was performed on the 2-story house for about 11 hours starting late on January 4 (Test B3) The duct blaster was unable to provide the ventilation rate necessary to meet the minimum specified in ASHRAE 622 supplying 180 cfm instead of 189 cfm (95) The decay curves are shown in Figure 32 Although the curves are much more tightly packed than they were with the exhaust system there is more divergence than we saw with the supply system in the 1-story house most notably in the master bedroom
The reciprocal age-of-air calculations for both the exhaust and supply ventilation systems are shown in Figure 33 Again the results indicate that much better room-to-room distribution of ventilation air was achieved by the central-fan integrated supply system compared to the single-point exhaust system However for the supply ventilation test the differences in the initial tracer gas concentration were of the same magnitude as the differences in decay rates among the rooms As a result no conclusions should be drawn about the relative ranking of the supply ventilation rate among rooms based on Figure 33
36 of 49
Research Report - 0602
0
10
20
30
40
50
60
SF
6 C
on
ce
ntr
ati
on
(m
gm
3)
BR1
Living
Kitchen
BR2
BR3
MBR
Mixing stopped
Mixing restarted
2136 000 224 448 712 936 1200
Hour
Figure 32 Tracer gas decay for 2-story house with supply ventilation just under ASHRAE 622 level central fan operation at 33 duty cycle (20 min off 10 min on) and bedroom
doors closed (Test B3)
Simple Exhaust vs Central Fan Integrated
Supply )
000
005
010
015
020
025
Recip
rocal A
ge o
f A
ir (
1h
r
BR1
Living
Kitchen
BR2
BR3
MBR
Exhaust in laundry room no Centralized supply mixing
mixing 100 ASHRAE 33 duty cycle 95
doors closed ASHRAE doors closed
Figure 33 Reciprocal age-of-air for 2-story house with continuous exhaust ventilation (Test B1) compared to central fan integrated supply ventilation (Test B3) (Note
Uncertainties introduced by non-uniform starting concentration are of the same order of magnitude as the differences in reciprocal age-of-air among rooms for the supply ventilation case The relative ranking of rooms is not meaningful for that case)
37 of 49
Research Report - 0602
Air Handler Operation
The effect of occasional air handler operation on the distribution of exhaust ventilation air was evaluated on the afternoon of January 6 (Test B6) The tracer gas decay curves are shown in Figure 34 and reciprocal age-of-air calculations are shown in Figure 35 It should again be noted that before the test started the house was mixed using both the air handler and a de-stratification fan with the doors open During the test the doors were closed the de-stratification fan was turned off and the air handler operated at a 33 duty cycle (20 minutes off 10 minutes on) As was the case in the 1-story house this occasional operation of the air handler substantially improved the distribution of ventilation air among rooms even in conjunction with the point exhaust ventilation system There was very little divergence noticeable even with the air handler cycling on and off every half hour However because the initial differences in tracer gas concentration among rooms were as large as the differences in reciprocal age-of-air for the case with air handler operation no conclusions should be drawn about the relative ranking of ventilation rates among the rooms for that case
SF
6 C
on
cen
trati
on
(m
gm
3)
80
70
60
50
40
30
20
10
0
BR1
Living
Kitchen
BR2
BR3
MBR
Mixing stopped
Mixing restarted
1048 1200 1312 1424 1536 1648 1800 1912 2024
Hour
Figure 34 Tracer gas decay for 2-story house with continuous exhaust ventilation at ASHRAE 622 level central fan operation at 33 duty cycle (20 min off 10 min on) and
bedroom doors closed (Test B6)
38 of 49
Research Report - 0602
020
015 R
ec
ipro
ca
l A
ge
of
Air
(1
hr)
Exhaust Ventilation
No Mixing vs 33 Air Handler Duty Cycle
Exhaust in laundry room
no mixing 100
ASHRAE doors closed
33 air handler
operation exhaust in
laundry room 100
ASHRAE doors closed
BR1
Living
Kitchen
BR2
BR3
MBR
010
005
000
Figure 35 Reciprocal age-of-air for 2-story house with continuous exhaust ventilation with and without air handler operation (Tests B1 and B6) (Note Uncertainties introduced by non-uniform starting concentration are of the same order of magnitude as the differences in reciprocal age-of-air among rooms for the case with air handler operation The relative
ranking of rooms is not meaningful for that case)
Exhaust Location
The duct blaster was moved to the master bathroom exhaust register to see if there was a resulting change in ventilation air distribution (Test B18) The master bathroom was in the back of the house on the second floor between the master bedroom and bedroom 3 The decay curves are shown in Figure 36 and the reciprocal age-of-air results are shown in Figure 37 The rooms on each floor were well mixed before the test began although the mixing between the two floors was not as good Very wide divergence among rooms can be seen during the test especially between the upstairs bedrooms and the rest of the house Once again all three upstairs rooms appear to receive some air from the first floor but the master bedroom experiences a much higher volume of circulated air than the other two second-floor bedrooms which appear to be relatively stagnant
39 of 49
Research Report - 0602
0
10
20
30
40
50
60
70
80
90
SF
6 C
on
ce
ntr
ati
on
(m
gm
3)
BR1
Living
Kitchen
BR2
BR3
MBR
Mixing stopped
Mixing restarted
1912 2136 000 224 448 712 936 1200
Hour
Figure 36 Tracer gas decay for 2-story house with exhaust ventilation from the master bathroom at ASHRAE 622 level no central fan operation and bedroom doors closed (Test
B18)
Exhaust Ventilation
Laundry Room vs Master Bathroom
000
005
010
015
020
025
030
Exhaust in laundry room no
mixing 100 ASHRAE
doors closed
Exhaust in master bathroom
no mixing 100 ASHRAE
doors closed
Re
cip
roc
al A
ge
of
Air
(1
hr)
BR1
Living
Kitchen
BR2
BR3
MBR
Figure 37 Reciprocal age-of-air for 2-story house with exhaust ventilation from the master bathroom compared to the laundry room at ASHRAE 622 level no central fan operation
and bedroom doors closed (Tests B1 and B18)
40 of 49
Research Report - 0602
Ventilation Rate
The supply ventilation tests were repeated using flow rates of 60 and 33 of ASHRAE 622 recommendations corresponding to 114 cfm and 63 cfm respectively (Tests B2 and B4) The decay curves are shown in Figures 38 and 39 Reciprocal age-of-air for all three supply ventilation rates are shown in Figure 40 In all cases the rooms remained fairly well mixed especially rooms on the same floor As we observed in the 1-story house the ventilation rate in the 2-story house appeared to have very little effect on the uniformity of outside air provided to each room as long as it was mixed using the air handler One again the initial differences in tracer gas concentration among rooms were as large as the divergence in the decay curves preventing any conclusions about the relative ranking of ventilation rates among rooms for all three cases The error in initial concentration uniformity was bigger for the cases with air handler mixing because the relative divergence in the decay curves was so small compared to that of no air handler mixing In other words the error in relative ranking of ventilation rates for the cases with air handler mixing were not very important anyway because the relative differences between rooms were so small
1536 1648 1800 1912 2024 2136 2248
Hour
Figure 38 Tracer gas decay for 2-story house with supply ventilation at 60 of ASHRAE 622 level 33 central fan operation (20 min off 10 min on) and bedroom doors closed
(Test B2)
0
5
10
15
20
25
30
SF
6 C
on
cen
trati
on
(m
gm
3)
BR1 Living Kitchen BR2 BR3 MBR
Mixing stopped
Mixing restarted
41 of 49
Research Report - 0602
0
5
10
15
20
25
30
35
40
SF
6 C
on
cen
trati
on
(m
gm
3)
BR1
Living
Kitchen
BR2
BR3
MBR
Mixing stopped
Mixing restarted
1200 1312 1424 1536 1648 1800 1912
Hour
Figure 39 Tracer gas decay for 2-story house with supply ventilation at 33 of ASHRAE 622 level 33 central fan operation (20 min off 10 min on) and bedroom doors closed
(Test B4)
Supply Ventilation Rate Comparison
000
005
010
015
020
025
Re
cip
roc
al
Ag
e o
f A
ir (
1h
r)
BR1
Living
Kitchen
BR2
BR3
MBR
Centralized supply Centralized supply Centralized supply
mixing 33 duty mixing 33 duty mixing 33 duty
cycle 95 ASHRAE cycle 60 ASHRAE cycle 33 ASHRAE
doors closed doors closed doors closed
Figure 40 Reciprocal age-of-air for 2-story house with three levels of supply ventilation central fan operation at 33 duty cycle (20 min off 10 min on) and bedroom doors closed (Tests B3 B2 B4) (Note Uncertainties introduced by non-uniform starting
concentration are of the same order of magnitude as the differences in reciprocal age-of-air among rooms for all three cases The relative ranking of rooms is not meaningful for these
cases)
42 of 49
Research Report - 0602
The average air change rates for the three supply ventilation rates compared to the two exhaust ventilation schemes are shown in Figure 41 The CFIS system at 33 of the 622 ventilation flow rate provided a uniformly higher air change rate (013 ach) than the least ventilated rooms using exhaust ventilation from either the laundry or the master bathroom (010 ach Figure 37) It is noteworthy that the combined net air change rate with exhaust ventilation from the laundry room was significantly less than the air change rates for both exhaust ventilation from the master bathroom and supply ventilation at the air handler This illustrates the unpredictability of interactions between mechanical ventilation and natural infiltration which depend strongly on the distribution and size of cracks through which the outside air must pass to enter the house There may have been a relatively large building enclosure leakage opening near the laundry room (perhaps the utility penetrations or the door to the garage) that allowed a significant amount of outside air to quickly enter and leave the house through the exhaust flow without circulating around the house
0
005
01
015
02
025
Ave
rag
e A
CH
Natural Exhaust Exhaust Supply 95 Supply 60 Supply 33
Laundry Mbath
Rm 100 100
Figure 41 Average air change rates for 2-story house with supply ventilation at 33 60 and 95 of ASHRAE 622 recommendations (Tests B4 B2 B3) compared to natural
infiltration (Test B14) and exhaust ventilation with no central fan operation (Test B1) Bedroom doors were closed except for the natural infiltration test
Bedroom Doors
The laundry room exhaust ventilation test with no air handler operation (see Figure 31) was repeated with the doors open to evaluate the change in room-to-room ventilation air distribution (Test B10) The decay curves are shown in Figure 42 and the reciprocal age-of air calculations are shown in Figure 43 It is evident from Figure 42 that the test began before the rooms were
43 of 49
Research Report - 0602
0
5
10
15
20
25
SF
6 C
on
ce
ntr
ati
on
(m
gm
3)
BR1 Living Kitchen BR2 BR3 MBR
Mixing stopped
Mixing restarted
completely well mixed resulting in decay curves that could be somewhat misleading Because the master bedroom was at a higher concentration than the other rooms at the start of the test any room that received air from the master bedroom would appear to have a slower decay rate than it would have if the rooms started out at the same concentration Despite the difference in starting concentration it is clear that outside air was well distributed when the doors were open even without operation of the air handler
1843 1912 1940 2009 2038 2107 2136 2204 2233 2302
Hour
Figure 42 Tracer gas decay for the 2-story house with exhaust ventilation from the laundry room at ASHRAE 622 level no central fan operation and bedroom doors open
(Test B10)
Reciprocal age-of-air analysis was not performed for this case because of the combined effect of a short test duration (~2 hours) and unequal starting tracer gas concentrations even though the house was relatively well-mixed The important conclusion (that opening doors greatly improves mixing) can be drawn by inspecting the decay curves alone
Transfer Grilles
A final exhaust ventilation test was run on the 2-story house with the doors closed and the transfer grilles taped over The decay curves are shown in Figure 43 and the reciprocal age-ofshyair calculations are shown in Figure 44 The curves were clearly very divergent even after 12 hours By examining the reciprocal age-of-air results it is apparent that the transfer grilles in the 2-story house caused a noticeable improvement in ventilation air distribution but the improvement was smaller than when the doors were opened (Figure 42)
44 of 49
Research Report - 0602
0
5
10
15
20
25
30
SF
6 C
on
cen
tra
tio
n (
mg
m3
) BR1 Living Kitchen BR2 BR3 MBR
Mixing stopped
Mixing restarted
1648 1912 2136 000 224 448 712 936
Hour
Figure 43 Tracer gas decay for 2-story house with exhaust ventilation from the laundry room at ASHRAE 622 level no central fan operation bedroom doors closed transfer
grilles taped closed (Test B7)
Exhaust Ventilation Transfer Grilles Untaped vs Taped
000
005
010
015
020
Re
cip
roc
al
Ag
e o
f A
ir (
1h
r)
BR1
Living
Kitchen
BR2
BR3
MBR
Exhaust in laundry room no Exhaust in laundry room no
mixing 100 ASHRAE mixing 100 ASHRAE
doors closed doors closed transfer
grilles taped
Figure 44 Reciprocal age-of-air for 2-story house with exhaust ventilation from the laundry room at ASHRAE 622 level no central fan operation and doors closed In the first case the transfer grilles are untaped (Test B3) in the second they are taped closed
(Test B7)
45 of 49
Research Report - 0602
CONCLUSIONS
bull Reciprocal age-of-air analysis was chosen as a quantitative method for characterizing distribution of ventilation air among rooms This method worked well in cases where rooms were well mixed to begin the test and weather conditions were sufficiently steady-state
bull A test period of at least 1frac12 air changes was necessary to obtain reasonably accurate ageshyof-air results when there was significant divergence in tracer gas concentration among the rooms
bull Although we did not achieve uniform initial concentration of tracer gas in the 2-story house using our test methodology and the equipment at hand we believe the reciprocal age-of-air calculations were meaningful in many of the cases as indicated in the discussion
bull Both houses were relatively tight with natural infiltration averaging 008 ACH for the 1shystory house and 011 ACH for the 2-story house
bull Both houses had relatively small (but not negligible) duct losses to the outside producing an increase in infiltration of less than 003 ACH for the 1-story house and 002 ACH for the 2-story house when the air handler runs
bull Age-of-air analysis indicated that ventilation supplied through the central air distribution system provided much more uniform distribution of ventilation air than the single-point exhaust system when the doors were closed and the air handler was not running For the 1-story house the central-fan-integrated supply ventilation case at 60 of ASHRAE 622 provided more outside air to all rooms than the least-ventilated room in the exhaust case at 100 of 622 For the 2-story house the central-fan-integrated supply system at 33 of the 622 flow rate provided more outside air to all rooms than the least ventilated rooms using exhaust ventilation at 100 of 622 from either the laundry or the master bathroom
bull Operation of the central fan at a 33 duty cycle maintained relatively well-mixed conditions regardless of ventilation rate type of ventilation system (supply or exhaust) or house configuration (1-story or 2-story)
bull Exhaust location affected both the relative amount of outside air received by different rooms and the overall uniformity among rooms but the effect was not predictable
bull For exhaust-only ventilation without central fan operation opening bedroom doors appeared to significantly improve the mixing of ventilation air among rooms
bull Transfer grilles improved the distribution of ventilation air slightly but much less than opening the bedroom doors
bull In the 2-story house the stack effect caused air movement from the first floor to the second floor even when exhaust ventilation was applied to the first floor resulting in consistently higher tracer gas concentrations on the second floor and more non-uniform ventilation air distribution in general
bull Interactions between natural infiltration and both exhaust and supply mechanical ventilation were very significant When the ventilation system was activated the combined air change rate did not increase commensurate with the measured ventilation rate but instead increased by only half that amount This result was consistent with combining ventilation and infiltration in quadrature to estimate whole-house air change rate in accordance with ASHRAE Standard 136 (ASHRAE 1993)
46 of 49
Research Report - 0602
FUTURE WORK
In future tests continuous monitoring of pressure differentials would enhance our understanding of the multi-zone combined infiltration and ventilation systems and our ability to model them That would help to explain differences between tests in more detail including the effects of multiple stories location of ventilation supply outlets and exhaust inlets interior door closure and use of passive return air transfer grilles Pressure differential measurement points should include
bull dP with respect to outside for each closed room and open space bull dP across closed interior doors bull dP between the floor cavity and outdoors and bull dP between the house and the attic
Measurement of wind direction along with wind speed could also be helpful for modeling these buildings and systems However because of micro-climate wind shielding it may be very difficult to relate a single-point wind direction measurement to actual wind vectors on the building surfaces
ACKNOWLEDGMENTS
The authors express their appreciation to Rich Coyle of DR Horton for providing the test houses and to Joseph Lstiburek of BSC Subrato Chandra and Neil Moyer of FSEC and Greg Barker of Mountain Energy Partnership for their assistance in the planning and execution of this ventilation study
47 of 49
Research Report - 0602
REFERENCES
ASHRAE (1993) ANSIASHRAE Standard 136-1993 A Method of Determining Air Change Rates in Detached Dwellings Atlanta GA American Society of Heating Refrigerating and Air-Conditioning Engineers Inc
ASHRAE (1997) ANSIASHRAE Standard 129-1997 Measuring Air-Change Effectiveness Atlanta GA American Society of Heating Refrigerating and Air-Conditioning Engineers Inc
ASHRAE (2004) ASHRAE Standard 622-2004 Ventilation and Acceptable Indoor Air Quality in Low-Rise Residential Buildings Atlanta GA American Society of Heating Refrigerating and Air-Conditioning Engineers Inc
CSA (2003) CANCSA F326-M91 Residential Mechanical Ventilation Systems Canadian Standards Association Ontario Canada httpwwwcsashyintlorgonlinestoreGetCatalogItemDetailsaspmat=2410793ampParent=102
NBC 2005 National Building Code of Canada httpircnrcshycnrcgccapubscodesnrcc47666_ehtml
Grieve PW (1991) Measuring Ventilation Using Tracer-Gases Denmark Bruumlel amp Kjaeligr
MN Chapter 7672 Minnesota Energy Code Chapter 7672 Detached Single-Family And Two-Family Dwellings httpwwwstatemnusmnexternalDocsCommerceChapter_7672_Residential_111302012428 _72rulepdf
Persily AK Martin SR (2000) A Modeling Study of Ventilation in Manufactured Houses Gaithersburg MD National Institute of Standards and Technology NISTIR 6455
Rudd A Lstiburek J (2000) ldquoMeasurement of Ventilation and Interzonal Distribution in Single-Family Homesrdquo ASHRAE Transactions 2000 MN-00-10-3 V 106 Pt2 American Society of Heating Refrigeration and Air-Conditioning Engineers Atlanta GA
WAC (2004) Washington State Title 51 WAC Community trade and economic development department of (building code council) Chapter 51-13 Ventilation and indoor air quality httpappslegwagovWACdefaultaspxcite=51-13
48 of 49
Research Report - 0602
Field test of room-to-room uniformity of ventilation air distribution in two new houses
About this Report
This report was prepared for the US Department of Energyrsquos Building America
Program The report is freely available to the public at wwwbuildingamericagov
The authors express their appreciation to Rich Coyle of DR Horton for providing the test houses and to Joseph Lstiburek of BSC Subrato Chandra and Neil Moyer of
FSEC and Greg Barker of Mountain Energy Partnership for their assistance in the planning and execution of this ventilation study
About the Authors
Robert Hendron Ren Anderson Dennis Barley are with National Renewable Energy Laboratory Armin Rudd and Aaron Townsend are with Building Science Corporation
Ed Hancock is with Mountain Energy Partnership
Direct all correspondence to Building Science Corporation 30 Forest Street Somerville MA 02143
Limits of Liability and Disclaimer of Warranty
Building Science documents are intended for professionals The author and the publisher of this article have used their best efforts to provide accurate and authoritative information in regard to the subject matter covered The author and publisher make no warranty of any kind expressed or implied with regard to the information contained in this article
The information presented in this article must be used with care by professionals who understand the implications of what they are doing If professional advice or other expert assistance is required the services of a competent professional shall be sought The author and publisher shall not be liable in the event of incidental or consequential damages in connection with or arising from the use of the information contained within this Building Science document
49 of 49
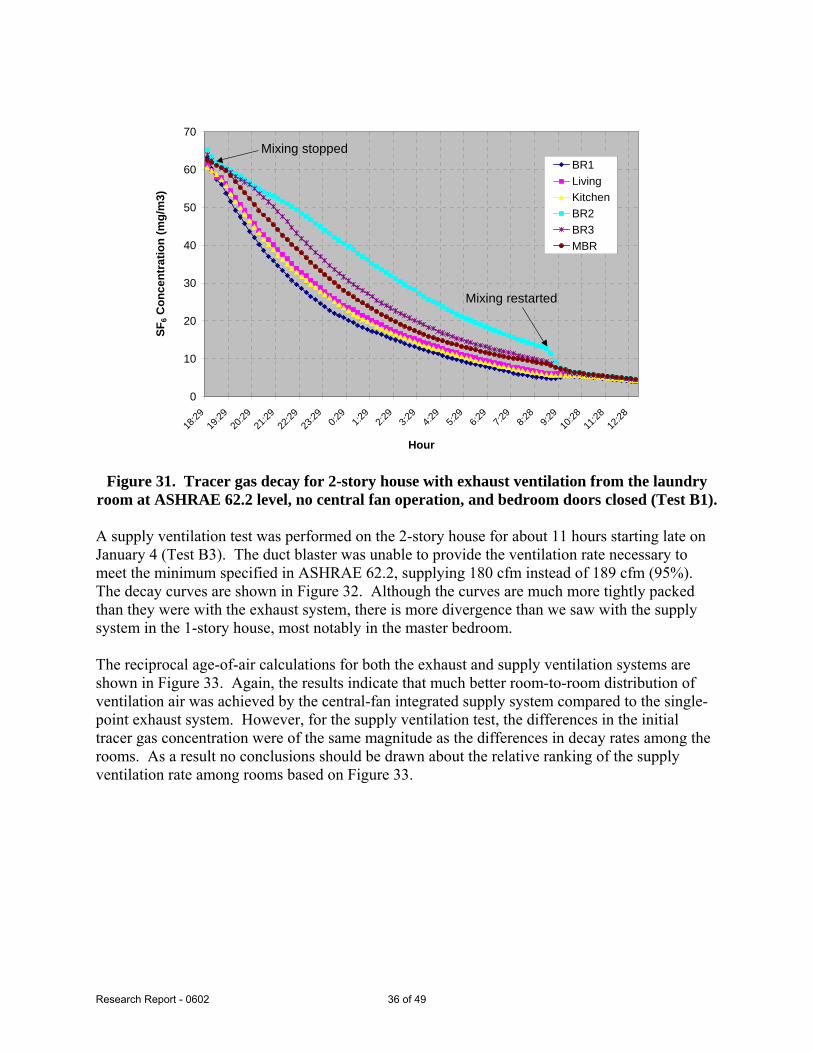
Research Report - 0602
0
10
20
30
40
50
60
SF
6 C
on
ce
ntr
ati
on
(m
gm
3)
BR1
Living
Kitchen
BR2
BR3
MBR
Mixing stopped
Mixing restarted
2136 000 224 448 712 936 1200
Hour
Figure 32 Tracer gas decay for 2-story house with supply ventilation just under ASHRAE 622 level central fan operation at 33 duty cycle (20 min off 10 min on) and bedroom
doors closed (Test B3)
Simple Exhaust vs Central Fan Integrated
Supply )
000
005
010
015
020
025
Recip
rocal A
ge o
f A
ir (
1h
r
BR1
Living
Kitchen
BR2
BR3
MBR
Exhaust in laundry room no Centralized supply mixing
mixing 100 ASHRAE 33 duty cycle 95
doors closed ASHRAE doors closed
Figure 33 Reciprocal age-of-air for 2-story house with continuous exhaust ventilation (Test B1) compared to central fan integrated supply ventilation (Test B3) (Note
Uncertainties introduced by non-uniform starting concentration are of the same order of magnitude as the differences in reciprocal age-of-air among rooms for the supply ventilation case The relative ranking of rooms is not meaningful for that case)
37 of 49
Research Report - 0602
Air Handler Operation
The effect of occasional air handler operation on the distribution of exhaust ventilation air was evaluated on the afternoon of January 6 (Test B6) The tracer gas decay curves are shown in Figure 34 and reciprocal age-of-air calculations are shown in Figure 35 It should again be noted that before the test started the house was mixed using both the air handler and a de-stratification fan with the doors open During the test the doors were closed the de-stratification fan was turned off and the air handler operated at a 33 duty cycle (20 minutes off 10 minutes on) As was the case in the 1-story house this occasional operation of the air handler substantially improved the distribution of ventilation air among rooms even in conjunction with the point exhaust ventilation system There was very little divergence noticeable even with the air handler cycling on and off every half hour However because the initial differences in tracer gas concentration among rooms were as large as the differences in reciprocal age-of-air for the case with air handler operation no conclusions should be drawn about the relative ranking of ventilation rates among the rooms for that case
SF
6 C
on
cen
trati
on
(m
gm
3)
80
70
60
50
40
30
20
10
0
BR1
Living
Kitchen
BR2
BR3
MBR
Mixing stopped
Mixing restarted
1048 1200 1312 1424 1536 1648 1800 1912 2024
Hour
Figure 34 Tracer gas decay for 2-story house with continuous exhaust ventilation at ASHRAE 622 level central fan operation at 33 duty cycle (20 min off 10 min on) and
bedroom doors closed (Test B6)
38 of 49
Research Report - 0602
020
015 R
ec
ipro
ca
l A
ge
of
Air
(1
hr)
Exhaust Ventilation
No Mixing vs 33 Air Handler Duty Cycle
Exhaust in laundry room
no mixing 100
ASHRAE doors closed
33 air handler
operation exhaust in
laundry room 100
ASHRAE doors closed
BR1
Living
Kitchen
BR2
BR3
MBR
010
005
000
Figure 35 Reciprocal age-of-air for 2-story house with continuous exhaust ventilation with and without air handler operation (Tests B1 and B6) (Note Uncertainties introduced by non-uniform starting concentration are of the same order of magnitude as the differences in reciprocal age-of-air among rooms for the case with air handler operation The relative
ranking of rooms is not meaningful for that case)
Exhaust Location
The duct blaster was moved to the master bathroom exhaust register to see if there was a resulting change in ventilation air distribution (Test B18) The master bathroom was in the back of the house on the second floor between the master bedroom and bedroom 3 The decay curves are shown in Figure 36 and the reciprocal age-of-air results are shown in Figure 37 The rooms on each floor were well mixed before the test began although the mixing between the two floors was not as good Very wide divergence among rooms can be seen during the test especially between the upstairs bedrooms and the rest of the house Once again all three upstairs rooms appear to receive some air from the first floor but the master bedroom experiences a much higher volume of circulated air than the other two second-floor bedrooms which appear to be relatively stagnant
39 of 49
Research Report - 0602
0
10
20
30
40
50
60
70
80
90
SF
6 C
on
ce
ntr
ati
on
(m
gm
3)
BR1
Living
Kitchen
BR2
BR3
MBR
Mixing stopped
Mixing restarted
1912 2136 000 224 448 712 936 1200
Hour
Figure 36 Tracer gas decay for 2-story house with exhaust ventilation from the master bathroom at ASHRAE 622 level no central fan operation and bedroom doors closed (Test
B18)
Exhaust Ventilation
Laundry Room vs Master Bathroom
000
005
010
015
020
025
030
Exhaust in laundry room no
mixing 100 ASHRAE
doors closed
Exhaust in master bathroom
no mixing 100 ASHRAE
doors closed
Re
cip
roc
al A
ge
of
Air
(1
hr)
BR1
Living
Kitchen
BR2
BR3
MBR
Figure 37 Reciprocal age-of-air for 2-story house with exhaust ventilation from the master bathroom compared to the laundry room at ASHRAE 622 level no central fan operation
and bedroom doors closed (Tests B1 and B18)
40 of 49
Research Report - 0602
Ventilation Rate
The supply ventilation tests were repeated using flow rates of 60 and 33 of ASHRAE 622 recommendations corresponding to 114 cfm and 63 cfm respectively (Tests B2 and B4) The decay curves are shown in Figures 38 and 39 Reciprocal age-of-air for all three supply ventilation rates are shown in Figure 40 In all cases the rooms remained fairly well mixed especially rooms on the same floor As we observed in the 1-story house the ventilation rate in the 2-story house appeared to have very little effect on the uniformity of outside air provided to each room as long as it was mixed using the air handler One again the initial differences in tracer gas concentration among rooms were as large as the divergence in the decay curves preventing any conclusions about the relative ranking of ventilation rates among rooms for all three cases The error in initial concentration uniformity was bigger for the cases with air handler mixing because the relative divergence in the decay curves was so small compared to that of no air handler mixing In other words the error in relative ranking of ventilation rates for the cases with air handler mixing were not very important anyway because the relative differences between rooms were so small
1536 1648 1800 1912 2024 2136 2248
Hour
Figure 38 Tracer gas decay for 2-story house with supply ventilation at 60 of ASHRAE 622 level 33 central fan operation (20 min off 10 min on) and bedroom doors closed
(Test B2)
0
5
10
15
20
25
30
SF
6 C
on
cen
trati
on
(m
gm
3)
BR1 Living Kitchen BR2 BR3 MBR
Mixing stopped
Mixing restarted
41 of 49
Research Report - 0602
0
5
10
15
20
25
30
35
40
SF
6 C
on
cen
trati
on
(m
gm
3)
BR1
Living
Kitchen
BR2
BR3
MBR
Mixing stopped
Mixing restarted
1200 1312 1424 1536 1648 1800 1912
Hour
Figure 39 Tracer gas decay for 2-story house with supply ventilation at 33 of ASHRAE 622 level 33 central fan operation (20 min off 10 min on) and bedroom doors closed
(Test B4)
Supply Ventilation Rate Comparison
000
005
010
015
020
025
Re
cip
roc
al
Ag
e o
f A
ir (
1h
r)
BR1
Living
Kitchen
BR2
BR3
MBR
Centralized supply Centralized supply Centralized supply
mixing 33 duty mixing 33 duty mixing 33 duty
cycle 95 ASHRAE cycle 60 ASHRAE cycle 33 ASHRAE
doors closed doors closed doors closed
Figure 40 Reciprocal age-of-air for 2-story house with three levels of supply ventilation central fan operation at 33 duty cycle (20 min off 10 min on) and bedroom doors closed (Tests B3 B2 B4) (Note Uncertainties introduced by non-uniform starting
concentration are of the same order of magnitude as the differences in reciprocal age-of-air among rooms for all three cases The relative ranking of rooms is not meaningful for these
cases)
42 of 49
Research Report - 0602
The average air change rates for the three supply ventilation rates compared to the two exhaust ventilation schemes are shown in Figure 41 The CFIS system at 33 of the 622 ventilation flow rate provided a uniformly higher air change rate (013 ach) than the least ventilated rooms using exhaust ventilation from either the laundry or the master bathroom (010 ach Figure 37) It is noteworthy that the combined net air change rate with exhaust ventilation from the laundry room was significantly less than the air change rates for both exhaust ventilation from the master bathroom and supply ventilation at the air handler This illustrates the unpredictability of interactions between mechanical ventilation and natural infiltration which depend strongly on the distribution and size of cracks through which the outside air must pass to enter the house There may have been a relatively large building enclosure leakage opening near the laundry room (perhaps the utility penetrations or the door to the garage) that allowed a significant amount of outside air to quickly enter and leave the house through the exhaust flow without circulating around the house
0
005
01
015
02
025
Ave
rag
e A
CH
Natural Exhaust Exhaust Supply 95 Supply 60 Supply 33
Laundry Mbath
Rm 100 100
Figure 41 Average air change rates for 2-story house with supply ventilation at 33 60 and 95 of ASHRAE 622 recommendations (Tests B4 B2 B3) compared to natural
infiltration (Test B14) and exhaust ventilation with no central fan operation (Test B1) Bedroom doors were closed except for the natural infiltration test
Bedroom Doors
The laundry room exhaust ventilation test with no air handler operation (see Figure 31) was repeated with the doors open to evaluate the change in room-to-room ventilation air distribution (Test B10) The decay curves are shown in Figure 42 and the reciprocal age-of air calculations are shown in Figure 43 It is evident from Figure 42 that the test began before the rooms were
43 of 49
Research Report - 0602
0
5
10
15
20
25
SF
6 C
on
ce
ntr
ati
on
(m
gm
3)
BR1 Living Kitchen BR2 BR3 MBR
Mixing stopped
Mixing restarted
completely well mixed resulting in decay curves that could be somewhat misleading Because the master bedroom was at a higher concentration than the other rooms at the start of the test any room that received air from the master bedroom would appear to have a slower decay rate than it would have if the rooms started out at the same concentration Despite the difference in starting concentration it is clear that outside air was well distributed when the doors were open even without operation of the air handler
1843 1912 1940 2009 2038 2107 2136 2204 2233 2302
Hour
Figure 42 Tracer gas decay for the 2-story house with exhaust ventilation from the laundry room at ASHRAE 622 level no central fan operation and bedroom doors open
(Test B10)
Reciprocal age-of-air analysis was not performed for this case because of the combined effect of a short test duration (~2 hours) and unequal starting tracer gas concentrations even though the house was relatively well-mixed The important conclusion (that opening doors greatly improves mixing) can be drawn by inspecting the decay curves alone
Transfer Grilles
A final exhaust ventilation test was run on the 2-story house with the doors closed and the transfer grilles taped over The decay curves are shown in Figure 43 and the reciprocal age-ofshyair calculations are shown in Figure 44 The curves were clearly very divergent even after 12 hours By examining the reciprocal age-of-air results it is apparent that the transfer grilles in the 2-story house caused a noticeable improvement in ventilation air distribution but the improvement was smaller than when the doors were opened (Figure 42)
44 of 49
Research Report - 0602
0
5
10
15
20
25
30
SF
6 C
on
cen
tra
tio
n (
mg
m3
) BR1 Living Kitchen BR2 BR3 MBR
Mixing stopped
Mixing restarted
1648 1912 2136 000 224 448 712 936
Hour
Figure 43 Tracer gas decay for 2-story house with exhaust ventilation from the laundry room at ASHRAE 622 level no central fan operation bedroom doors closed transfer
grilles taped closed (Test B7)
Exhaust Ventilation Transfer Grilles Untaped vs Taped
000
005
010
015
020
Re
cip
roc
al
Ag
e o
f A
ir (
1h
r)
BR1
Living
Kitchen
BR2
BR3
MBR
Exhaust in laundry room no Exhaust in laundry room no
mixing 100 ASHRAE mixing 100 ASHRAE
doors closed doors closed transfer
grilles taped
Figure 44 Reciprocal age-of-air for 2-story house with exhaust ventilation from the laundry room at ASHRAE 622 level no central fan operation and doors closed In the first case the transfer grilles are untaped (Test B3) in the second they are taped closed
(Test B7)
45 of 49
Research Report - 0602
CONCLUSIONS
bull Reciprocal age-of-air analysis was chosen as a quantitative method for characterizing distribution of ventilation air among rooms This method worked well in cases where rooms were well mixed to begin the test and weather conditions were sufficiently steady-state
bull A test period of at least 1frac12 air changes was necessary to obtain reasonably accurate ageshyof-air results when there was significant divergence in tracer gas concentration among the rooms
bull Although we did not achieve uniform initial concentration of tracer gas in the 2-story house using our test methodology and the equipment at hand we believe the reciprocal age-of-air calculations were meaningful in many of the cases as indicated in the discussion
bull Both houses were relatively tight with natural infiltration averaging 008 ACH for the 1shystory house and 011 ACH for the 2-story house
bull Both houses had relatively small (but not negligible) duct losses to the outside producing an increase in infiltration of less than 003 ACH for the 1-story house and 002 ACH for the 2-story house when the air handler runs
bull Age-of-air analysis indicated that ventilation supplied through the central air distribution system provided much more uniform distribution of ventilation air than the single-point exhaust system when the doors were closed and the air handler was not running For the 1-story house the central-fan-integrated supply ventilation case at 60 of ASHRAE 622 provided more outside air to all rooms than the least-ventilated room in the exhaust case at 100 of 622 For the 2-story house the central-fan-integrated supply system at 33 of the 622 flow rate provided more outside air to all rooms than the least ventilated rooms using exhaust ventilation at 100 of 622 from either the laundry or the master bathroom
bull Operation of the central fan at a 33 duty cycle maintained relatively well-mixed conditions regardless of ventilation rate type of ventilation system (supply or exhaust) or house configuration (1-story or 2-story)
bull Exhaust location affected both the relative amount of outside air received by different rooms and the overall uniformity among rooms but the effect was not predictable
bull For exhaust-only ventilation without central fan operation opening bedroom doors appeared to significantly improve the mixing of ventilation air among rooms
bull Transfer grilles improved the distribution of ventilation air slightly but much less than opening the bedroom doors
bull In the 2-story house the stack effect caused air movement from the first floor to the second floor even when exhaust ventilation was applied to the first floor resulting in consistently higher tracer gas concentrations on the second floor and more non-uniform ventilation air distribution in general
bull Interactions between natural infiltration and both exhaust and supply mechanical ventilation were very significant When the ventilation system was activated the combined air change rate did not increase commensurate with the measured ventilation rate but instead increased by only half that amount This result was consistent with combining ventilation and infiltration in quadrature to estimate whole-house air change rate in accordance with ASHRAE Standard 136 (ASHRAE 1993)
46 of 49
Research Report - 0602
FUTURE WORK
In future tests continuous monitoring of pressure differentials would enhance our understanding of the multi-zone combined infiltration and ventilation systems and our ability to model them That would help to explain differences between tests in more detail including the effects of multiple stories location of ventilation supply outlets and exhaust inlets interior door closure and use of passive return air transfer grilles Pressure differential measurement points should include
bull dP with respect to outside for each closed room and open space bull dP across closed interior doors bull dP between the floor cavity and outdoors and bull dP between the house and the attic
Measurement of wind direction along with wind speed could also be helpful for modeling these buildings and systems However because of micro-climate wind shielding it may be very difficult to relate a single-point wind direction measurement to actual wind vectors on the building surfaces
ACKNOWLEDGMENTS
The authors express their appreciation to Rich Coyle of DR Horton for providing the test houses and to Joseph Lstiburek of BSC Subrato Chandra and Neil Moyer of FSEC and Greg Barker of Mountain Energy Partnership for their assistance in the planning and execution of this ventilation study
47 of 49
Research Report - 0602
REFERENCES
ASHRAE (1993) ANSIASHRAE Standard 136-1993 A Method of Determining Air Change Rates in Detached Dwellings Atlanta GA American Society of Heating Refrigerating and Air-Conditioning Engineers Inc
ASHRAE (1997) ANSIASHRAE Standard 129-1997 Measuring Air-Change Effectiveness Atlanta GA American Society of Heating Refrigerating and Air-Conditioning Engineers Inc
ASHRAE (2004) ASHRAE Standard 622-2004 Ventilation and Acceptable Indoor Air Quality in Low-Rise Residential Buildings Atlanta GA American Society of Heating Refrigerating and Air-Conditioning Engineers Inc
CSA (2003) CANCSA F326-M91 Residential Mechanical Ventilation Systems Canadian Standards Association Ontario Canada httpwwwcsashyintlorgonlinestoreGetCatalogItemDetailsaspmat=2410793ampParent=102
NBC 2005 National Building Code of Canada httpircnrcshycnrcgccapubscodesnrcc47666_ehtml
Grieve PW (1991) Measuring Ventilation Using Tracer-Gases Denmark Bruumlel amp Kjaeligr
MN Chapter 7672 Minnesota Energy Code Chapter 7672 Detached Single-Family And Two-Family Dwellings httpwwwstatemnusmnexternalDocsCommerceChapter_7672_Residential_111302012428 _72rulepdf
Persily AK Martin SR (2000) A Modeling Study of Ventilation in Manufactured Houses Gaithersburg MD National Institute of Standards and Technology NISTIR 6455
Rudd A Lstiburek J (2000) ldquoMeasurement of Ventilation and Interzonal Distribution in Single-Family Homesrdquo ASHRAE Transactions 2000 MN-00-10-3 V 106 Pt2 American Society of Heating Refrigeration and Air-Conditioning Engineers Atlanta GA
WAC (2004) Washington State Title 51 WAC Community trade and economic development department of (building code council) Chapter 51-13 Ventilation and indoor air quality httpappslegwagovWACdefaultaspxcite=51-13
48 of 49
Research Report - 0602
Field test of room-to-room uniformity of ventilation air distribution in two new houses
About this Report
This report was prepared for the US Department of Energyrsquos Building America
Program The report is freely available to the public at wwwbuildingamericagov
The authors express their appreciation to Rich Coyle of DR Horton for providing the test houses and to Joseph Lstiburek of BSC Subrato Chandra and Neil Moyer of
FSEC and Greg Barker of Mountain Energy Partnership for their assistance in the planning and execution of this ventilation study
About the Authors
Robert Hendron Ren Anderson Dennis Barley are with National Renewable Energy Laboratory Armin Rudd and Aaron Townsend are with Building Science Corporation
Ed Hancock is with Mountain Energy Partnership
Direct all correspondence to Building Science Corporation 30 Forest Street Somerville MA 02143
Limits of Liability and Disclaimer of Warranty
Building Science documents are intended for professionals The author and the publisher of this article have used their best efforts to provide accurate and authoritative information in regard to the subject matter covered The author and publisher make no warranty of any kind expressed or implied with regard to the information contained in this article
The information presented in this article must be used with care by professionals who understand the implications of what they are doing If professional advice or other expert assistance is required the services of a competent professional shall be sought The author and publisher shall not be liable in the event of incidental or consequential damages in connection with or arising from the use of the information contained within this Building Science document
49 of 49
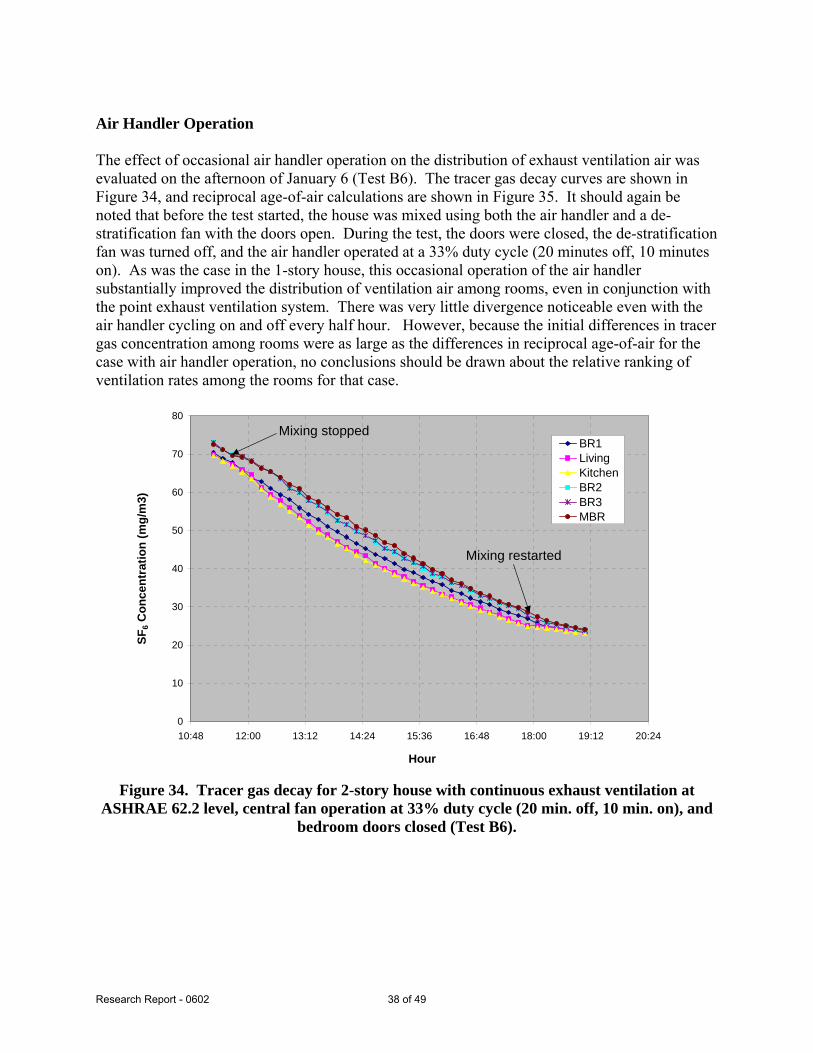
Research Report - 0602
020
015 R
ec
ipro
ca
l A
ge
of
Air
(1
hr)
Exhaust Ventilation
No Mixing vs 33 Air Handler Duty Cycle
Exhaust in laundry room
no mixing 100
ASHRAE doors closed
33 air handler
operation exhaust in
laundry room 100
ASHRAE doors closed
BR1
Living
Kitchen
BR2
BR3
MBR
010
005
000
Figure 35 Reciprocal age-of-air for 2-story house with continuous exhaust ventilation with and without air handler operation (Tests B1 and B6) (Note Uncertainties introduced by non-uniform starting concentration are of the same order of magnitude as the differences in reciprocal age-of-air among rooms for the case with air handler operation The relative
ranking of rooms is not meaningful for that case)
Exhaust Location
The duct blaster was moved to the master bathroom exhaust register to see if there was a resulting change in ventilation air distribution (Test B18) The master bathroom was in the back of the house on the second floor between the master bedroom and bedroom 3 The decay curves are shown in Figure 36 and the reciprocal age-of-air results are shown in Figure 37 The rooms on each floor were well mixed before the test began although the mixing between the two floors was not as good Very wide divergence among rooms can be seen during the test especially between the upstairs bedrooms and the rest of the house Once again all three upstairs rooms appear to receive some air from the first floor but the master bedroom experiences a much higher volume of circulated air than the other two second-floor bedrooms which appear to be relatively stagnant
39 of 49
Research Report - 0602
0
10
20
30
40
50
60
70
80
90
SF
6 C
on
ce
ntr
ati
on
(m
gm
3)
BR1
Living
Kitchen
BR2
BR3
MBR
Mixing stopped
Mixing restarted
1912 2136 000 224 448 712 936 1200
Hour
Figure 36 Tracer gas decay for 2-story house with exhaust ventilation from the master bathroom at ASHRAE 622 level no central fan operation and bedroom doors closed (Test
B18)
Exhaust Ventilation
Laundry Room vs Master Bathroom
000
005
010
015
020
025
030
Exhaust in laundry room no
mixing 100 ASHRAE
doors closed
Exhaust in master bathroom
no mixing 100 ASHRAE
doors closed
Re
cip
roc
al A
ge
of
Air
(1
hr)
BR1
Living
Kitchen
BR2
BR3
MBR
Figure 37 Reciprocal age-of-air for 2-story house with exhaust ventilation from the master bathroom compared to the laundry room at ASHRAE 622 level no central fan operation
and bedroom doors closed (Tests B1 and B18)
40 of 49
Research Report - 0602
Ventilation Rate
The supply ventilation tests were repeated using flow rates of 60 and 33 of ASHRAE 622 recommendations corresponding to 114 cfm and 63 cfm respectively (Tests B2 and B4) The decay curves are shown in Figures 38 and 39 Reciprocal age-of-air for all three supply ventilation rates are shown in Figure 40 In all cases the rooms remained fairly well mixed especially rooms on the same floor As we observed in the 1-story house the ventilation rate in the 2-story house appeared to have very little effect on the uniformity of outside air provided to each room as long as it was mixed using the air handler One again the initial differences in tracer gas concentration among rooms were as large as the divergence in the decay curves preventing any conclusions about the relative ranking of ventilation rates among rooms for all three cases The error in initial concentration uniformity was bigger for the cases with air handler mixing because the relative divergence in the decay curves was so small compared to that of no air handler mixing In other words the error in relative ranking of ventilation rates for the cases with air handler mixing were not very important anyway because the relative differences between rooms were so small
1536 1648 1800 1912 2024 2136 2248
Hour
Figure 38 Tracer gas decay for 2-story house with supply ventilation at 60 of ASHRAE 622 level 33 central fan operation (20 min off 10 min on) and bedroom doors closed
(Test B2)
0
5
10
15
20
25
30
SF
6 C
on
cen
trati
on
(m
gm
3)
BR1 Living Kitchen BR2 BR3 MBR
Mixing stopped
Mixing restarted
41 of 49
Research Report - 0602
0
5
10
15
20
25
30
35
40
SF
6 C
on
cen
trati
on
(m
gm
3)
BR1
Living
Kitchen
BR2
BR3
MBR
Mixing stopped
Mixing restarted
1200 1312 1424 1536 1648 1800 1912
Hour
Figure 39 Tracer gas decay for 2-story house with supply ventilation at 33 of ASHRAE 622 level 33 central fan operation (20 min off 10 min on) and bedroom doors closed
(Test B4)
Supply Ventilation Rate Comparison
000
005
010
015
020
025
Re
cip
roc
al
Ag
e o
f A
ir (
1h
r)
BR1
Living
Kitchen
BR2
BR3
MBR
Centralized supply Centralized supply Centralized supply
mixing 33 duty mixing 33 duty mixing 33 duty
cycle 95 ASHRAE cycle 60 ASHRAE cycle 33 ASHRAE
doors closed doors closed doors closed
Figure 40 Reciprocal age-of-air for 2-story house with three levels of supply ventilation central fan operation at 33 duty cycle (20 min off 10 min on) and bedroom doors closed (Tests B3 B2 B4) (Note Uncertainties introduced by non-uniform starting
concentration are of the same order of magnitude as the differences in reciprocal age-of-air among rooms for all three cases The relative ranking of rooms is not meaningful for these
cases)
42 of 49
Research Report - 0602
The average air change rates for the three supply ventilation rates compared to the two exhaust ventilation schemes are shown in Figure 41 The CFIS system at 33 of the 622 ventilation flow rate provided a uniformly higher air change rate (013 ach) than the least ventilated rooms using exhaust ventilation from either the laundry or the master bathroom (010 ach Figure 37) It is noteworthy that the combined net air change rate with exhaust ventilation from the laundry room was significantly less than the air change rates for both exhaust ventilation from the master bathroom and supply ventilation at the air handler This illustrates the unpredictability of interactions between mechanical ventilation and natural infiltration which depend strongly on the distribution and size of cracks through which the outside air must pass to enter the house There may have been a relatively large building enclosure leakage opening near the laundry room (perhaps the utility penetrations or the door to the garage) that allowed a significant amount of outside air to quickly enter and leave the house through the exhaust flow without circulating around the house
0
005
01
015
02
025
Ave
rag
e A
CH
Natural Exhaust Exhaust Supply 95 Supply 60 Supply 33
Laundry Mbath
Rm 100 100
Figure 41 Average air change rates for 2-story house with supply ventilation at 33 60 and 95 of ASHRAE 622 recommendations (Tests B4 B2 B3) compared to natural
infiltration (Test B14) and exhaust ventilation with no central fan operation (Test B1) Bedroom doors were closed except for the natural infiltration test
Bedroom Doors
The laundry room exhaust ventilation test with no air handler operation (see Figure 31) was repeated with the doors open to evaluate the change in room-to-room ventilation air distribution (Test B10) The decay curves are shown in Figure 42 and the reciprocal age-of air calculations are shown in Figure 43 It is evident from Figure 42 that the test began before the rooms were
43 of 49
Research Report - 0602
0
5
10
15
20
25
SF
6 C
on
ce
ntr
ati
on
(m
gm
3)
BR1 Living Kitchen BR2 BR3 MBR
Mixing stopped
Mixing restarted
completely well mixed resulting in decay curves that could be somewhat misleading Because the master bedroom was at a higher concentration than the other rooms at the start of the test any room that received air from the master bedroom would appear to have a slower decay rate than it would have if the rooms started out at the same concentration Despite the difference in starting concentration it is clear that outside air was well distributed when the doors were open even without operation of the air handler
1843 1912 1940 2009 2038 2107 2136 2204 2233 2302
Hour
Figure 42 Tracer gas decay for the 2-story house with exhaust ventilation from the laundry room at ASHRAE 622 level no central fan operation and bedroom doors open
(Test B10)
Reciprocal age-of-air analysis was not performed for this case because of the combined effect of a short test duration (~2 hours) and unequal starting tracer gas concentrations even though the house was relatively well-mixed The important conclusion (that opening doors greatly improves mixing) can be drawn by inspecting the decay curves alone
Transfer Grilles
A final exhaust ventilation test was run on the 2-story house with the doors closed and the transfer grilles taped over The decay curves are shown in Figure 43 and the reciprocal age-ofshyair calculations are shown in Figure 44 The curves were clearly very divergent even after 12 hours By examining the reciprocal age-of-air results it is apparent that the transfer grilles in the 2-story house caused a noticeable improvement in ventilation air distribution but the improvement was smaller than when the doors were opened (Figure 42)
44 of 49
Research Report - 0602
0
5
10
15
20
25
30
SF
6 C
on
cen
tra
tio
n (
mg
m3
) BR1 Living Kitchen BR2 BR3 MBR
Mixing stopped
Mixing restarted
1648 1912 2136 000 224 448 712 936
Hour
Figure 43 Tracer gas decay for 2-story house with exhaust ventilation from the laundry room at ASHRAE 622 level no central fan operation bedroom doors closed transfer
grilles taped closed (Test B7)
Exhaust Ventilation Transfer Grilles Untaped vs Taped
000
005
010
015
020
Re
cip
roc
al
Ag
e o
f A
ir (
1h
r)
BR1
Living
Kitchen
BR2
BR3
MBR
Exhaust in laundry room no Exhaust in laundry room no
mixing 100 ASHRAE mixing 100 ASHRAE
doors closed doors closed transfer
grilles taped
Figure 44 Reciprocal age-of-air for 2-story house with exhaust ventilation from the laundry room at ASHRAE 622 level no central fan operation and doors closed In the first case the transfer grilles are untaped (Test B3) in the second they are taped closed
(Test B7)
45 of 49
Research Report - 0602
CONCLUSIONS
bull Reciprocal age-of-air analysis was chosen as a quantitative method for characterizing distribution of ventilation air among rooms This method worked well in cases where rooms were well mixed to begin the test and weather conditions were sufficiently steady-state
bull A test period of at least 1frac12 air changes was necessary to obtain reasonably accurate ageshyof-air results when there was significant divergence in tracer gas concentration among the rooms
bull Although we did not achieve uniform initial concentration of tracer gas in the 2-story house using our test methodology and the equipment at hand we believe the reciprocal age-of-air calculations were meaningful in many of the cases as indicated in the discussion
bull Both houses were relatively tight with natural infiltration averaging 008 ACH for the 1shystory house and 011 ACH for the 2-story house
bull Both houses had relatively small (but not negligible) duct losses to the outside producing an increase in infiltration of less than 003 ACH for the 1-story house and 002 ACH for the 2-story house when the air handler runs
bull Age-of-air analysis indicated that ventilation supplied through the central air distribution system provided much more uniform distribution of ventilation air than the single-point exhaust system when the doors were closed and the air handler was not running For the 1-story house the central-fan-integrated supply ventilation case at 60 of ASHRAE 622 provided more outside air to all rooms than the least-ventilated room in the exhaust case at 100 of 622 For the 2-story house the central-fan-integrated supply system at 33 of the 622 flow rate provided more outside air to all rooms than the least ventilated rooms using exhaust ventilation at 100 of 622 from either the laundry or the master bathroom
bull Operation of the central fan at a 33 duty cycle maintained relatively well-mixed conditions regardless of ventilation rate type of ventilation system (supply or exhaust) or house configuration (1-story or 2-story)
bull Exhaust location affected both the relative amount of outside air received by different rooms and the overall uniformity among rooms but the effect was not predictable
bull For exhaust-only ventilation without central fan operation opening bedroom doors appeared to significantly improve the mixing of ventilation air among rooms
bull Transfer grilles improved the distribution of ventilation air slightly but much less than opening the bedroom doors
bull In the 2-story house the stack effect caused air movement from the first floor to the second floor even when exhaust ventilation was applied to the first floor resulting in consistently higher tracer gas concentrations on the second floor and more non-uniform ventilation air distribution in general
bull Interactions between natural infiltration and both exhaust and supply mechanical ventilation were very significant When the ventilation system was activated the combined air change rate did not increase commensurate with the measured ventilation rate but instead increased by only half that amount This result was consistent with combining ventilation and infiltration in quadrature to estimate whole-house air change rate in accordance with ASHRAE Standard 136 (ASHRAE 1993)
46 of 49
Research Report - 0602
FUTURE WORK
In future tests continuous monitoring of pressure differentials would enhance our understanding of the multi-zone combined infiltration and ventilation systems and our ability to model them That would help to explain differences between tests in more detail including the effects of multiple stories location of ventilation supply outlets and exhaust inlets interior door closure and use of passive return air transfer grilles Pressure differential measurement points should include
bull dP with respect to outside for each closed room and open space bull dP across closed interior doors bull dP between the floor cavity and outdoors and bull dP between the house and the attic
Measurement of wind direction along with wind speed could also be helpful for modeling these buildings and systems However because of micro-climate wind shielding it may be very difficult to relate a single-point wind direction measurement to actual wind vectors on the building surfaces
ACKNOWLEDGMENTS
The authors express their appreciation to Rich Coyle of DR Horton for providing the test houses and to Joseph Lstiburek of BSC Subrato Chandra and Neil Moyer of FSEC and Greg Barker of Mountain Energy Partnership for their assistance in the planning and execution of this ventilation study
47 of 49
Research Report - 0602
REFERENCES
ASHRAE (1993) ANSIASHRAE Standard 136-1993 A Method of Determining Air Change Rates in Detached Dwellings Atlanta GA American Society of Heating Refrigerating and Air-Conditioning Engineers Inc
ASHRAE (1997) ANSIASHRAE Standard 129-1997 Measuring Air-Change Effectiveness Atlanta GA American Society of Heating Refrigerating and Air-Conditioning Engineers Inc
ASHRAE (2004) ASHRAE Standard 622-2004 Ventilation and Acceptable Indoor Air Quality in Low-Rise Residential Buildings Atlanta GA American Society of Heating Refrigerating and Air-Conditioning Engineers Inc
CSA (2003) CANCSA F326-M91 Residential Mechanical Ventilation Systems Canadian Standards Association Ontario Canada httpwwwcsashyintlorgonlinestoreGetCatalogItemDetailsaspmat=2410793ampParent=102
NBC 2005 National Building Code of Canada httpircnrcshycnrcgccapubscodesnrcc47666_ehtml
Grieve PW (1991) Measuring Ventilation Using Tracer-Gases Denmark Bruumlel amp Kjaeligr
MN Chapter 7672 Minnesota Energy Code Chapter 7672 Detached Single-Family And Two-Family Dwellings httpwwwstatemnusmnexternalDocsCommerceChapter_7672_Residential_111302012428 _72rulepdf
Persily AK Martin SR (2000) A Modeling Study of Ventilation in Manufactured Houses Gaithersburg MD National Institute of Standards and Technology NISTIR 6455
Rudd A Lstiburek J (2000) ldquoMeasurement of Ventilation and Interzonal Distribution in Single-Family Homesrdquo ASHRAE Transactions 2000 MN-00-10-3 V 106 Pt2 American Society of Heating Refrigeration and Air-Conditioning Engineers Atlanta GA
WAC (2004) Washington State Title 51 WAC Community trade and economic development department of (building code council) Chapter 51-13 Ventilation and indoor air quality httpappslegwagovWACdefaultaspxcite=51-13
48 of 49
Research Report - 0602
Field test of room-to-room uniformity of ventilation air distribution in two new houses
About this Report
This report was prepared for the US Department of Energyrsquos Building America
Program The report is freely available to the public at wwwbuildingamericagov
The authors express their appreciation to Rich Coyle of DR Horton for providing the test houses and to Joseph Lstiburek of BSC Subrato Chandra and Neil Moyer of
FSEC and Greg Barker of Mountain Energy Partnership for their assistance in the planning and execution of this ventilation study
About the Authors
Robert Hendron Ren Anderson Dennis Barley are with National Renewable Energy Laboratory Armin Rudd and Aaron Townsend are with Building Science Corporation
Ed Hancock is with Mountain Energy Partnership
Direct all correspondence to Building Science Corporation 30 Forest Street Somerville MA 02143
Limits of Liability and Disclaimer of Warranty
Building Science documents are intended for professionals The author and the publisher of this article have used their best efforts to provide accurate and authoritative information in regard to the subject matter covered The author and publisher make no warranty of any kind expressed or implied with regard to the information contained in this article
The information presented in this article must be used with care by professionals who understand the implications of what they are doing If professional advice or other expert assistance is required the services of a competent professional shall be sought The author and publisher shall not be liable in the event of incidental or consequential damages in connection with or arising from the use of the information contained within this Building Science document
49 of 49
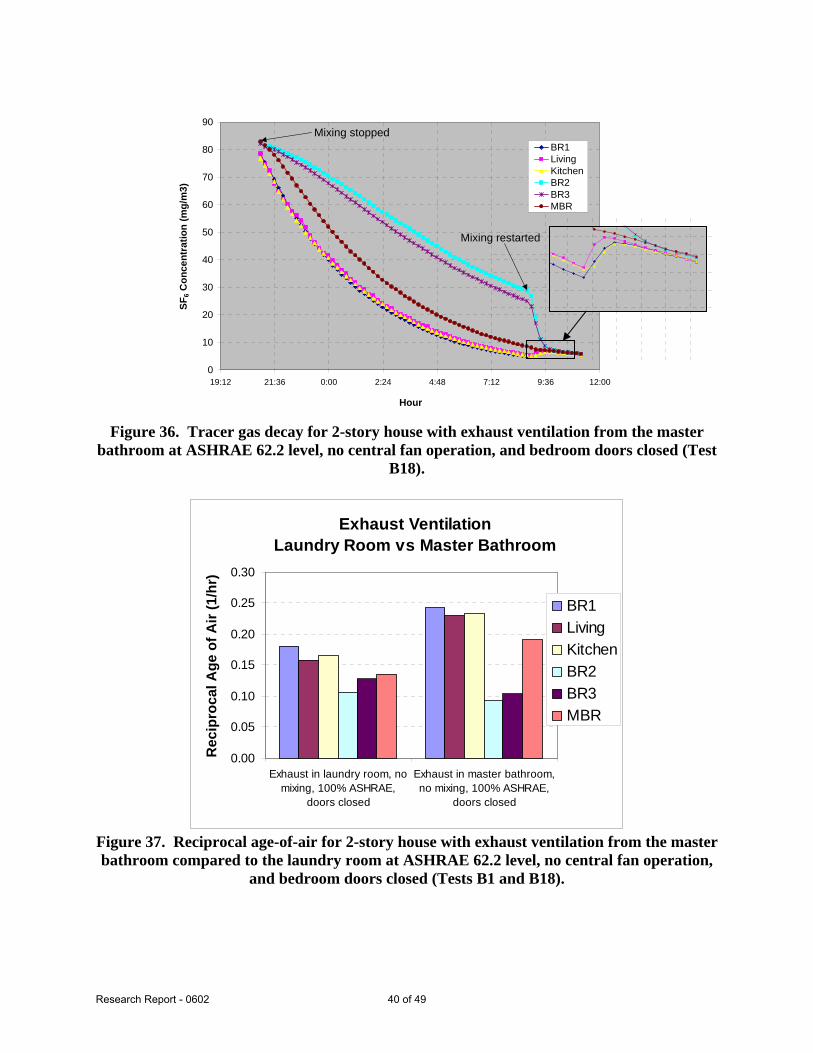
Research Report - 0602
0
10
20
30
40
50
60
70
80
90
SF
6 C
on
ce
ntr
ati
on
(m
gm
3)
BR1
Living
Kitchen
BR2
BR3
MBR
Mixing stopped
Mixing restarted
1912 2136 000 224 448 712 936 1200
Hour
Figure 36 Tracer gas decay for 2-story house with exhaust ventilation from the master bathroom at ASHRAE 622 level no central fan operation and bedroom doors closed (Test
B18)
Exhaust Ventilation
Laundry Room vs Master Bathroom
000
005
010
015
020
025
030
Exhaust in laundry room no
mixing 100 ASHRAE
doors closed
Exhaust in master bathroom
no mixing 100 ASHRAE
doors closed
Re
cip
roc
al A
ge
of
Air
(1
hr)
BR1
Living
Kitchen
BR2
BR3
MBR
Figure 37 Reciprocal age-of-air for 2-story house with exhaust ventilation from the master bathroom compared to the laundry room at ASHRAE 622 level no central fan operation
and bedroom doors closed (Tests B1 and B18)
40 of 49
Research Report - 0602
Ventilation Rate
The supply ventilation tests were repeated using flow rates of 60 and 33 of ASHRAE 622 recommendations corresponding to 114 cfm and 63 cfm respectively (Tests B2 and B4) The decay curves are shown in Figures 38 and 39 Reciprocal age-of-air for all three supply ventilation rates are shown in Figure 40 In all cases the rooms remained fairly well mixed especially rooms on the same floor As we observed in the 1-story house the ventilation rate in the 2-story house appeared to have very little effect on the uniformity of outside air provided to each room as long as it was mixed using the air handler One again the initial differences in tracer gas concentration among rooms were as large as the divergence in the decay curves preventing any conclusions about the relative ranking of ventilation rates among rooms for all three cases The error in initial concentration uniformity was bigger for the cases with air handler mixing because the relative divergence in the decay curves was so small compared to that of no air handler mixing In other words the error in relative ranking of ventilation rates for the cases with air handler mixing were not very important anyway because the relative differences between rooms were so small
1536 1648 1800 1912 2024 2136 2248
Hour
Figure 38 Tracer gas decay for 2-story house with supply ventilation at 60 of ASHRAE 622 level 33 central fan operation (20 min off 10 min on) and bedroom doors closed
(Test B2)
0
5
10
15
20
25
30
SF
6 C
on
cen
trati
on
(m
gm
3)
BR1 Living Kitchen BR2 BR3 MBR
Mixing stopped
Mixing restarted
41 of 49
Research Report - 0602
0
5
10
15
20
25
30
35
40
SF
6 C
on
cen
trati
on
(m
gm
3)
BR1
Living
Kitchen
BR2
BR3
MBR
Mixing stopped
Mixing restarted
1200 1312 1424 1536 1648 1800 1912
Hour
Figure 39 Tracer gas decay for 2-story house with supply ventilation at 33 of ASHRAE 622 level 33 central fan operation (20 min off 10 min on) and bedroom doors closed
(Test B4)
Supply Ventilation Rate Comparison
000
005
010
015
020
025
Re
cip
roc
al
Ag
e o
f A
ir (
1h
r)
BR1
Living
Kitchen
BR2
BR3
MBR
Centralized supply Centralized supply Centralized supply
mixing 33 duty mixing 33 duty mixing 33 duty
cycle 95 ASHRAE cycle 60 ASHRAE cycle 33 ASHRAE
doors closed doors closed doors closed
Figure 40 Reciprocal age-of-air for 2-story house with three levels of supply ventilation central fan operation at 33 duty cycle (20 min off 10 min on) and bedroom doors closed (Tests B3 B2 B4) (Note Uncertainties introduced by non-uniform starting
concentration are of the same order of magnitude as the differences in reciprocal age-of-air among rooms for all three cases The relative ranking of rooms is not meaningful for these
cases)
42 of 49
Research Report - 0602
The average air change rates for the three supply ventilation rates compared to the two exhaust ventilation schemes are shown in Figure 41 The CFIS system at 33 of the 622 ventilation flow rate provided a uniformly higher air change rate (013 ach) than the least ventilated rooms using exhaust ventilation from either the laundry or the master bathroom (010 ach Figure 37) It is noteworthy that the combined net air change rate with exhaust ventilation from the laundry room was significantly less than the air change rates for both exhaust ventilation from the master bathroom and supply ventilation at the air handler This illustrates the unpredictability of interactions between mechanical ventilation and natural infiltration which depend strongly on the distribution and size of cracks through which the outside air must pass to enter the house There may have been a relatively large building enclosure leakage opening near the laundry room (perhaps the utility penetrations or the door to the garage) that allowed a significant amount of outside air to quickly enter and leave the house through the exhaust flow without circulating around the house
0
005
01
015
02
025
Ave
rag
e A
CH
Natural Exhaust Exhaust Supply 95 Supply 60 Supply 33
Laundry Mbath
Rm 100 100
Figure 41 Average air change rates for 2-story house with supply ventilation at 33 60 and 95 of ASHRAE 622 recommendations (Tests B4 B2 B3) compared to natural
infiltration (Test B14) and exhaust ventilation with no central fan operation (Test B1) Bedroom doors were closed except for the natural infiltration test
Bedroom Doors
The laundry room exhaust ventilation test with no air handler operation (see Figure 31) was repeated with the doors open to evaluate the change in room-to-room ventilation air distribution (Test B10) The decay curves are shown in Figure 42 and the reciprocal age-of air calculations are shown in Figure 43 It is evident from Figure 42 that the test began before the rooms were
43 of 49
Research Report - 0602
0
5
10
15
20
25
SF
6 C
on
ce
ntr
ati
on
(m
gm
3)
BR1 Living Kitchen BR2 BR3 MBR
Mixing stopped
Mixing restarted
completely well mixed resulting in decay curves that could be somewhat misleading Because the master bedroom was at a higher concentration than the other rooms at the start of the test any room that received air from the master bedroom would appear to have a slower decay rate than it would have if the rooms started out at the same concentration Despite the difference in starting concentration it is clear that outside air was well distributed when the doors were open even without operation of the air handler
1843 1912 1940 2009 2038 2107 2136 2204 2233 2302
Hour
Figure 42 Tracer gas decay for the 2-story house with exhaust ventilation from the laundry room at ASHRAE 622 level no central fan operation and bedroom doors open
(Test B10)
Reciprocal age-of-air analysis was not performed for this case because of the combined effect of a short test duration (~2 hours) and unequal starting tracer gas concentrations even though the house was relatively well-mixed The important conclusion (that opening doors greatly improves mixing) can be drawn by inspecting the decay curves alone
Transfer Grilles
A final exhaust ventilation test was run on the 2-story house with the doors closed and the transfer grilles taped over The decay curves are shown in Figure 43 and the reciprocal age-ofshyair calculations are shown in Figure 44 The curves were clearly very divergent even after 12 hours By examining the reciprocal age-of-air results it is apparent that the transfer grilles in the 2-story house caused a noticeable improvement in ventilation air distribution but the improvement was smaller than when the doors were opened (Figure 42)
44 of 49
Research Report - 0602
0
5
10
15
20
25
30
SF
6 C
on
cen
tra
tio
n (
mg
m3
) BR1 Living Kitchen BR2 BR3 MBR
Mixing stopped
Mixing restarted
1648 1912 2136 000 224 448 712 936
Hour
Figure 43 Tracer gas decay for 2-story house with exhaust ventilation from the laundry room at ASHRAE 622 level no central fan operation bedroom doors closed transfer
grilles taped closed (Test B7)
Exhaust Ventilation Transfer Grilles Untaped vs Taped
000
005
010
015
020
Re
cip
roc
al
Ag
e o
f A
ir (
1h
r)
BR1
Living
Kitchen
BR2
BR3
MBR
Exhaust in laundry room no Exhaust in laundry room no
mixing 100 ASHRAE mixing 100 ASHRAE
doors closed doors closed transfer
grilles taped
Figure 44 Reciprocal age-of-air for 2-story house with exhaust ventilation from the laundry room at ASHRAE 622 level no central fan operation and doors closed In the first case the transfer grilles are untaped (Test B3) in the second they are taped closed
(Test B7)
45 of 49
Research Report - 0602
CONCLUSIONS
bull Reciprocal age-of-air analysis was chosen as a quantitative method for characterizing distribution of ventilation air among rooms This method worked well in cases where rooms were well mixed to begin the test and weather conditions were sufficiently steady-state
bull A test period of at least 1frac12 air changes was necessary to obtain reasonably accurate ageshyof-air results when there was significant divergence in tracer gas concentration among the rooms
bull Although we did not achieve uniform initial concentration of tracer gas in the 2-story house using our test methodology and the equipment at hand we believe the reciprocal age-of-air calculations were meaningful in many of the cases as indicated in the discussion
bull Both houses were relatively tight with natural infiltration averaging 008 ACH for the 1shystory house and 011 ACH for the 2-story house
bull Both houses had relatively small (but not negligible) duct losses to the outside producing an increase in infiltration of less than 003 ACH for the 1-story house and 002 ACH for the 2-story house when the air handler runs
bull Age-of-air analysis indicated that ventilation supplied through the central air distribution system provided much more uniform distribution of ventilation air than the single-point exhaust system when the doors were closed and the air handler was not running For the 1-story house the central-fan-integrated supply ventilation case at 60 of ASHRAE 622 provided more outside air to all rooms than the least-ventilated room in the exhaust case at 100 of 622 For the 2-story house the central-fan-integrated supply system at 33 of the 622 flow rate provided more outside air to all rooms than the least ventilated rooms using exhaust ventilation at 100 of 622 from either the laundry or the master bathroom
bull Operation of the central fan at a 33 duty cycle maintained relatively well-mixed conditions regardless of ventilation rate type of ventilation system (supply or exhaust) or house configuration (1-story or 2-story)
bull Exhaust location affected both the relative amount of outside air received by different rooms and the overall uniformity among rooms but the effect was not predictable
bull For exhaust-only ventilation without central fan operation opening bedroom doors appeared to significantly improve the mixing of ventilation air among rooms
bull Transfer grilles improved the distribution of ventilation air slightly but much less than opening the bedroom doors
bull In the 2-story house the stack effect caused air movement from the first floor to the second floor even when exhaust ventilation was applied to the first floor resulting in consistently higher tracer gas concentrations on the second floor and more non-uniform ventilation air distribution in general
bull Interactions between natural infiltration and both exhaust and supply mechanical ventilation were very significant When the ventilation system was activated the combined air change rate did not increase commensurate with the measured ventilation rate but instead increased by only half that amount This result was consistent with combining ventilation and infiltration in quadrature to estimate whole-house air change rate in accordance with ASHRAE Standard 136 (ASHRAE 1993)
46 of 49
Research Report - 0602
FUTURE WORK
In future tests continuous monitoring of pressure differentials would enhance our understanding of the multi-zone combined infiltration and ventilation systems and our ability to model them That would help to explain differences between tests in more detail including the effects of multiple stories location of ventilation supply outlets and exhaust inlets interior door closure and use of passive return air transfer grilles Pressure differential measurement points should include
bull dP with respect to outside for each closed room and open space bull dP across closed interior doors bull dP between the floor cavity and outdoors and bull dP between the house and the attic
Measurement of wind direction along with wind speed could also be helpful for modeling these buildings and systems However because of micro-climate wind shielding it may be very difficult to relate a single-point wind direction measurement to actual wind vectors on the building surfaces
ACKNOWLEDGMENTS
The authors express their appreciation to Rich Coyle of DR Horton for providing the test houses and to Joseph Lstiburek of BSC Subrato Chandra and Neil Moyer of FSEC and Greg Barker of Mountain Energy Partnership for their assistance in the planning and execution of this ventilation study
47 of 49
Research Report - 0602
REFERENCES
ASHRAE (1993) ANSIASHRAE Standard 136-1993 A Method of Determining Air Change Rates in Detached Dwellings Atlanta GA American Society of Heating Refrigerating and Air-Conditioning Engineers Inc
ASHRAE (1997) ANSIASHRAE Standard 129-1997 Measuring Air-Change Effectiveness Atlanta GA American Society of Heating Refrigerating and Air-Conditioning Engineers Inc
ASHRAE (2004) ASHRAE Standard 622-2004 Ventilation and Acceptable Indoor Air Quality in Low-Rise Residential Buildings Atlanta GA American Society of Heating Refrigerating and Air-Conditioning Engineers Inc
CSA (2003) CANCSA F326-M91 Residential Mechanical Ventilation Systems Canadian Standards Association Ontario Canada httpwwwcsashyintlorgonlinestoreGetCatalogItemDetailsaspmat=2410793ampParent=102
NBC 2005 National Building Code of Canada httpircnrcshycnrcgccapubscodesnrcc47666_ehtml
Grieve PW (1991) Measuring Ventilation Using Tracer-Gases Denmark Bruumlel amp Kjaeligr
MN Chapter 7672 Minnesota Energy Code Chapter 7672 Detached Single-Family And Two-Family Dwellings httpwwwstatemnusmnexternalDocsCommerceChapter_7672_Residential_111302012428 _72rulepdf
Persily AK Martin SR (2000) A Modeling Study of Ventilation in Manufactured Houses Gaithersburg MD National Institute of Standards and Technology NISTIR 6455
Rudd A Lstiburek J (2000) ldquoMeasurement of Ventilation and Interzonal Distribution in Single-Family Homesrdquo ASHRAE Transactions 2000 MN-00-10-3 V 106 Pt2 American Society of Heating Refrigeration and Air-Conditioning Engineers Atlanta GA
WAC (2004) Washington State Title 51 WAC Community trade and economic development department of (building code council) Chapter 51-13 Ventilation and indoor air quality httpappslegwagovWACdefaultaspxcite=51-13
48 of 49
Research Report - 0602
Field test of room-to-room uniformity of ventilation air distribution in two new houses
About this Report
This report was prepared for the US Department of Energyrsquos Building America
Program The report is freely available to the public at wwwbuildingamericagov
The authors express their appreciation to Rich Coyle of DR Horton for providing the test houses and to Joseph Lstiburek of BSC Subrato Chandra and Neil Moyer of
FSEC and Greg Barker of Mountain Energy Partnership for their assistance in the planning and execution of this ventilation study
About the Authors
Robert Hendron Ren Anderson Dennis Barley are with National Renewable Energy Laboratory Armin Rudd and Aaron Townsend are with Building Science Corporation
Ed Hancock is with Mountain Energy Partnership
Direct all correspondence to Building Science Corporation 30 Forest Street Somerville MA 02143
Limits of Liability and Disclaimer of Warranty
Building Science documents are intended for professionals The author and the publisher of this article have used their best efforts to provide accurate and authoritative information in regard to the subject matter covered The author and publisher make no warranty of any kind expressed or implied with regard to the information contained in this article
The information presented in this article must be used with care by professionals who understand the implications of what they are doing If professional advice or other expert assistance is required the services of a competent professional shall be sought The author and publisher shall not be liable in the event of incidental or consequential damages in connection with or arising from the use of the information contained within this Building Science document
49 of 49
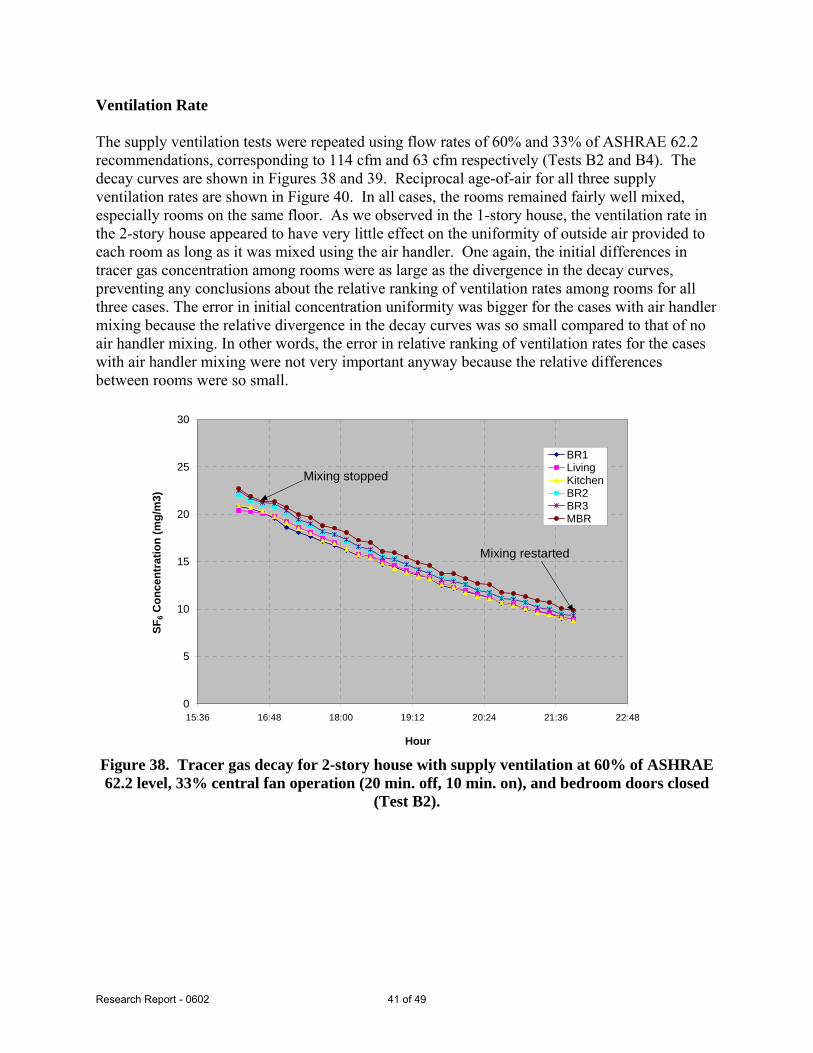
Research Report - 0602
0
5
10
15
20
25
30
35
40
SF
6 C
on
cen
trati
on
(m
gm
3)
BR1
Living
Kitchen
BR2
BR3
MBR
Mixing stopped
Mixing restarted
1200 1312 1424 1536 1648 1800 1912
Hour
Figure 39 Tracer gas decay for 2-story house with supply ventilation at 33 of ASHRAE 622 level 33 central fan operation (20 min off 10 min on) and bedroom doors closed
(Test B4)
Supply Ventilation Rate Comparison
000
005
010
015
020
025
Re
cip
roc
al
Ag
e o
f A
ir (
1h
r)
BR1
Living
Kitchen
BR2
BR3
MBR
Centralized supply Centralized supply Centralized supply
mixing 33 duty mixing 33 duty mixing 33 duty
cycle 95 ASHRAE cycle 60 ASHRAE cycle 33 ASHRAE
doors closed doors closed doors closed
Figure 40 Reciprocal age-of-air for 2-story house with three levels of supply ventilation central fan operation at 33 duty cycle (20 min off 10 min on) and bedroom doors closed (Tests B3 B2 B4) (Note Uncertainties introduced by non-uniform starting
concentration are of the same order of magnitude as the differences in reciprocal age-of-air among rooms for all three cases The relative ranking of rooms is not meaningful for these
cases)
42 of 49
Research Report - 0602
The average air change rates for the three supply ventilation rates compared to the two exhaust ventilation schemes are shown in Figure 41 The CFIS system at 33 of the 622 ventilation flow rate provided a uniformly higher air change rate (013 ach) than the least ventilated rooms using exhaust ventilation from either the laundry or the master bathroom (010 ach Figure 37) It is noteworthy that the combined net air change rate with exhaust ventilation from the laundry room was significantly less than the air change rates for both exhaust ventilation from the master bathroom and supply ventilation at the air handler This illustrates the unpredictability of interactions between mechanical ventilation and natural infiltration which depend strongly on the distribution and size of cracks through which the outside air must pass to enter the house There may have been a relatively large building enclosure leakage opening near the laundry room (perhaps the utility penetrations or the door to the garage) that allowed a significant amount of outside air to quickly enter and leave the house through the exhaust flow without circulating around the house
0
005
01
015
02
025
Ave
rag
e A
CH
Natural Exhaust Exhaust Supply 95 Supply 60 Supply 33
Laundry Mbath
Rm 100 100
Figure 41 Average air change rates for 2-story house with supply ventilation at 33 60 and 95 of ASHRAE 622 recommendations (Tests B4 B2 B3) compared to natural
infiltration (Test B14) and exhaust ventilation with no central fan operation (Test B1) Bedroom doors were closed except for the natural infiltration test
Bedroom Doors
The laundry room exhaust ventilation test with no air handler operation (see Figure 31) was repeated with the doors open to evaluate the change in room-to-room ventilation air distribution (Test B10) The decay curves are shown in Figure 42 and the reciprocal age-of air calculations are shown in Figure 43 It is evident from Figure 42 that the test began before the rooms were
43 of 49
Research Report - 0602
0
5
10
15
20
25
SF
6 C
on
ce
ntr
ati
on
(m
gm
3)
BR1 Living Kitchen BR2 BR3 MBR
Mixing stopped
Mixing restarted
completely well mixed resulting in decay curves that could be somewhat misleading Because the master bedroom was at a higher concentration than the other rooms at the start of the test any room that received air from the master bedroom would appear to have a slower decay rate than it would have if the rooms started out at the same concentration Despite the difference in starting concentration it is clear that outside air was well distributed when the doors were open even without operation of the air handler
1843 1912 1940 2009 2038 2107 2136 2204 2233 2302
Hour
Figure 42 Tracer gas decay for the 2-story house with exhaust ventilation from the laundry room at ASHRAE 622 level no central fan operation and bedroom doors open
(Test B10)
Reciprocal age-of-air analysis was not performed for this case because of the combined effect of a short test duration (~2 hours) and unequal starting tracer gas concentrations even though the house was relatively well-mixed The important conclusion (that opening doors greatly improves mixing) can be drawn by inspecting the decay curves alone
Transfer Grilles
A final exhaust ventilation test was run on the 2-story house with the doors closed and the transfer grilles taped over The decay curves are shown in Figure 43 and the reciprocal age-ofshyair calculations are shown in Figure 44 The curves were clearly very divergent even after 12 hours By examining the reciprocal age-of-air results it is apparent that the transfer grilles in the 2-story house caused a noticeable improvement in ventilation air distribution but the improvement was smaller than when the doors were opened (Figure 42)
44 of 49
Research Report - 0602
0
5
10
15
20
25
30
SF
6 C
on
cen
tra
tio
n (
mg
m3
) BR1 Living Kitchen BR2 BR3 MBR
Mixing stopped
Mixing restarted
1648 1912 2136 000 224 448 712 936
Hour
Figure 43 Tracer gas decay for 2-story house with exhaust ventilation from the laundry room at ASHRAE 622 level no central fan operation bedroom doors closed transfer
grilles taped closed (Test B7)
Exhaust Ventilation Transfer Grilles Untaped vs Taped
000
005
010
015
020
Re
cip
roc
al
Ag
e o
f A
ir (
1h
r)
BR1
Living
Kitchen
BR2
BR3
MBR
Exhaust in laundry room no Exhaust in laundry room no
mixing 100 ASHRAE mixing 100 ASHRAE
doors closed doors closed transfer
grilles taped
Figure 44 Reciprocal age-of-air for 2-story house with exhaust ventilation from the laundry room at ASHRAE 622 level no central fan operation and doors closed In the first case the transfer grilles are untaped (Test B3) in the second they are taped closed
(Test B7)
45 of 49
Research Report - 0602
CONCLUSIONS
bull Reciprocal age-of-air analysis was chosen as a quantitative method for characterizing distribution of ventilation air among rooms This method worked well in cases where rooms were well mixed to begin the test and weather conditions were sufficiently steady-state
bull A test period of at least 1frac12 air changes was necessary to obtain reasonably accurate ageshyof-air results when there was significant divergence in tracer gas concentration among the rooms
bull Although we did not achieve uniform initial concentration of tracer gas in the 2-story house using our test methodology and the equipment at hand we believe the reciprocal age-of-air calculations were meaningful in many of the cases as indicated in the discussion
bull Both houses were relatively tight with natural infiltration averaging 008 ACH for the 1shystory house and 011 ACH for the 2-story house
bull Both houses had relatively small (but not negligible) duct losses to the outside producing an increase in infiltration of less than 003 ACH for the 1-story house and 002 ACH for the 2-story house when the air handler runs
bull Age-of-air analysis indicated that ventilation supplied through the central air distribution system provided much more uniform distribution of ventilation air than the single-point exhaust system when the doors were closed and the air handler was not running For the 1-story house the central-fan-integrated supply ventilation case at 60 of ASHRAE 622 provided more outside air to all rooms than the least-ventilated room in the exhaust case at 100 of 622 For the 2-story house the central-fan-integrated supply system at 33 of the 622 flow rate provided more outside air to all rooms than the least ventilated rooms using exhaust ventilation at 100 of 622 from either the laundry or the master bathroom
bull Operation of the central fan at a 33 duty cycle maintained relatively well-mixed conditions regardless of ventilation rate type of ventilation system (supply or exhaust) or house configuration (1-story or 2-story)
bull Exhaust location affected both the relative amount of outside air received by different rooms and the overall uniformity among rooms but the effect was not predictable
bull For exhaust-only ventilation without central fan operation opening bedroom doors appeared to significantly improve the mixing of ventilation air among rooms
bull Transfer grilles improved the distribution of ventilation air slightly but much less than opening the bedroom doors
bull In the 2-story house the stack effect caused air movement from the first floor to the second floor even when exhaust ventilation was applied to the first floor resulting in consistently higher tracer gas concentrations on the second floor and more non-uniform ventilation air distribution in general
bull Interactions between natural infiltration and both exhaust and supply mechanical ventilation were very significant When the ventilation system was activated the combined air change rate did not increase commensurate with the measured ventilation rate but instead increased by only half that amount This result was consistent with combining ventilation and infiltration in quadrature to estimate whole-house air change rate in accordance with ASHRAE Standard 136 (ASHRAE 1993)
46 of 49
Research Report - 0602
FUTURE WORK
In future tests continuous monitoring of pressure differentials would enhance our understanding of the multi-zone combined infiltration and ventilation systems and our ability to model them That would help to explain differences between tests in more detail including the effects of multiple stories location of ventilation supply outlets and exhaust inlets interior door closure and use of passive return air transfer grilles Pressure differential measurement points should include
bull dP with respect to outside for each closed room and open space bull dP across closed interior doors bull dP between the floor cavity and outdoors and bull dP between the house and the attic
Measurement of wind direction along with wind speed could also be helpful for modeling these buildings and systems However because of micro-climate wind shielding it may be very difficult to relate a single-point wind direction measurement to actual wind vectors on the building surfaces
ACKNOWLEDGMENTS
The authors express their appreciation to Rich Coyle of DR Horton for providing the test houses and to Joseph Lstiburek of BSC Subrato Chandra and Neil Moyer of FSEC and Greg Barker of Mountain Energy Partnership for their assistance in the planning and execution of this ventilation study
47 of 49
Research Report - 0602
REFERENCES
ASHRAE (1993) ANSIASHRAE Standard 136-1993 A Method of Determining Air Change Rates in Detached Dwellings Atlanta GA American Society of Heating Refrigerating and Air-Conditioning Engineers Inc
ASHRAE (1997) ANSIASHRAE Standard 129-1997 Measuring Air-Change Effectiveness Atlanta GA American Society of Heating Refrigerating and Air-Conditioning Engineers Inc
ASHRAE (2004) ASHRAE Standard 622-2004 Ventilation and Acceptable Indoor Air Quality in Low-Rise Residential Buildings Atlanta GA American Society of Heating Refrigerating and Air-Conditioning Engineers Inc
CSA (2003) CANCSA F326-M91 Residential Mechanical Ventilation Systems Canadian Standards Association Ontario Canada httpwwwcsashyintlorgonlinestoreGetCatalogItemDetailsaspmat=2410793ampParent=102
NBC 2005 National Building Code of Canada httpircnrcshycnrcgccapubscodesnrcc47666_ehtml
Grieve PW (1991) Measuring Ventilation Using Tracer-Gases Denmark Bruumlel amp Kjaeligr
MN Chapter 7672 Minnesota Energy Code Chapter 7672 Detached Single-Family And Two-Family Dwellings httpwwwstatemnusmnexternalDocsCommerceChapter_7672_Residential_111302012428 _72rulepdf
Persily AK Martin SR (2000) A Modeling Study of Ventilation in Manufactured Houses Gaithersburg MD National Institute of Standards and Technology NISTIR 6455
Rudd A Lstiburek J (2000) ldquoMeasurement of Ventilation and Interzonal Distribution in Single-Family Homesrdquo ASHRAE Transactions 2000 MN-00-10-3 V 106 Pt2 American Society of Heating Refrigeration and Air-Conditioning Engineers Atlanta GA
WAC (2004) Washington State Title 51 WAC Community trade and economic development department of (building code council) Chapter 51-13 Ventilation and indoor air quality httpappslegwagovWACdefaultaspxcite=51-13
48 of 49
Research Report - 0602
Field test of room-to-room uniformity of ventilation air distribution in two new houses
About this Report
This report was prepared for the US Department of Energyrsquos Building America
Program The report is freely available to the public at wwwbuildingamericagov
The authors express their appreciation to Rich Coyle of DR Horton for providing the test houses and to Joseph Lstiburek of BSC Subrato Chandra and Neil Moyer of
FSEC and Greg Barker of Mountain Energy Partnership for their assistance in the planning and execution of this ventilation study
About the Authors
Robert Hendron Ren Anderson Dennis Barley are with National Renewable Energy Laboratory Armin Rudd and Aaron Townsend are with Building Science Corporation
Ed Hancock is with Mountain Energy Partnership
Direct all correspondence to Building Science Corporation 30 Forest Street Somerville MA 02143
Limits of Liability and Disclaimer of Warranty
Building Science documents are intended for professionals The author and the publisher of this article have used their best efforts to provide accurate and authoritative information in regard to the subject matter covered The author and publisher make no warranty of any kind expressed or implied with regard to the information contained in this article
The information presented in this article must be used with care by professionals who understand the implications of what they are doing If professional advice or other expert assistance is required the services of a competent professional shall be sought The author and publisher shall not be liable in the event of incidental or consequential damages in connection with or arising from the use of the information contained within this Building Science document
49 of 49

Research Report - 0602
The average air change rates for the three supply ventilation rates compared to the two exhaust ventilation schemes are shown in Figure 41 The CFIS system at 33 of the 622 ventilation flow rate provided a uniformly higher air change rate (013 ach) than the least ventilated rooms using exhaust ventilation from either the laundry or the master bathroom (010 ach Figure 37) It is noteworthy that the combined net air change rate with exhaust ventilation from the laundry room was significantly less than the air change rates for both exhaust ventilation from the master bathroom and supply ventilation at the air handler This illustrates the unpredictability of interactions between mechanical ventilation and natural infiltration which depend strongly on the distribution and size of cracks through which the outside air must pass to enter the house There may have been a relatively large building enclosure leakage opening near the laundry room (perhaps the utility penetrations or the door to the garage) that allowed a significant amount of outside air to quickly enter and leave the house through the exhaust flow without circulating around the house
0
005
01
015
02
025
Ave
rag
e A
CH
Natural Exhaust Exhaust Supply 95 Supply 60 Supply 33
Laundry Mbath
Rm 100 100
Figure 41 Average air change rates for 2-story house with supply ventilation at 33 60 and 95 of ASHRAE 622 recommendations (Tests B4 B2 B3) compared to natural
infiltration (Test B14) and exhaust ventilation with no central fan operation (Test B1) Bedroom doors were closed except for the natural infiltration test
Bedroom Doors
The laundry room exhaust ventilation test with no air handler operation (see Figure 31) was repeated with the doors open to evaluate the change in room-to-room ventilation air distribution (Test B10) The decay curves are shown in Figure 42 and the reciprocal age-of air calculations are shown in Figure 43 It is evident from Figure 42 that the test began before the rooms were
43 of 49
Research Report - 0602
0
5
10
15
20
25
SF
6 C
on
ce
ntr
ati
on
(m
gm
3)
BR1 Living Kitchen BR2 BR3 MBR
Mixing stopped
Mixing restarted
completely well mixed resulting in decay curves that could be somewhat misleading Because the master bedroom was at a higher concentration than the other rooms at the start of the test any room that received air from the master bedroom would appear to have a slower decay rate than it would have if the rooms started out at the same concentration Despite the difference in starting concentration it is clear that outside air was well distributed when the doors were open even without operation of the air handler
1843 1912 1940 2009 2038 2107 2136 2204 2233 2302
Hour
Figure 42 Tracer gas decay for the 2-story house with exhaust ventilation from the laundry room at ASHRAE 622 level no central fan operation and bedroom doors open
(Test B10)
Reciprocal age-of-air analysis was not performed for this case because of the combined effect of a short test duration (~2 hours) and unequal starting tracer gas concentrations even though the house was relatively well-mixed The important conclusion (that opening doors greatly improves mixing) can be drawn by inspecting the decay curves alone
Transfer Grilles
A final exhaust ventilation test was run on the 2-story house with the doors closed and the transfer grilles taped over The decay curves are shown in Figure 43 and the reciprocal age-ofshyair calculations are shown in Figure 44 The curves were clearly very divergent even after 12 hours By examining the reciprocal age-of-air results it is apparent that the transfer grilles in the 2-story house caused a noticeable improvement in ventilation air distribution but the improvement was smaller than when the doors were opened (Figure 42)
44 of 49
Research Report - 0602
0
5
10
15
20
25
30
SF
6 C
on
cen
tra
tio
n (
mg
m3
) BR1 Living Kitchen BR2 BR3 MBR
Mixing stopped
Mixing restarted
1648 1912 2136 000 224 448 712 936
Hour
Figure 43 Tracer gas decay for 2-story house with exhaust ventilation from the laundry room at ASHRAE 622 level no central fan operation bedroom doors closed transfer
grilles taped closed (Test B7)
Exhaust Ventilation Transfer Grilles Untaped vs Taped
000
005
010
015
020
Re
cip
roc
al
Ag
e o
f A
ir (
1h
r)
BR1
Living
Kitchen
BR2
BR3
MBR
Exhaust in laundry room no Exhaust in laundry room no
mixing 100 ASHRAE mixing 100 ASHRAE
doors closed doors closed transfer
grilles taped
Figure 44 Reciprocal age-of-air for 2-story house with exhaust ventilation from the laundry room at ASHRAE 622 level no central fan operation and doors closed In the first case the transfer grilles are untaped (Test B3) in the second they are taped closed
(Test B7)
45 of 49
Research Report - 0602
CONCLUSIONS
bull Reciprocal age-of-air analysis was chosen as a quantitative method for characterizing distribution of ventilation air among rooms This method worked well in cases where rooms were well mixed to begin the test and weather conditions were sufficiently steady-state
bull A test period of at least 1frac12 air changes was necessary to obtain reasonably accurate ageshyof-air results when there was significant divergence in tracer gas concentration among the rooms
bull Although we did not achieve uniform initial concentration of tracer gas in the 2-story house using our test methodology and the equipment at hand we believe the reciprocal age-of-air calculations were meaningful in many of the cases as indicated in the discussion
bull Both houses were relatively tight with natural infiltration averaging 008 ACH for the 1shystory house and 011 ACH for the 2-story house
bull Both houses had relatively small (but not negligible) duct losses to the outside producing an increase in infiltration of less than 003 ACH for the 1-story house and 002 ACH for the 2-story house when the air handler runs
bull Age-of-air analysis indicated that ventilation supplied through the central air distribution system provided much more uniform distribution of ventilation air than the single-point exhaust system when the doors were closed and the air handler was not running For the 1-story house the central-fan-integrated supply ventilation case at 60 of ASHRAE 622 provided more outside air to all rooms than the least-ventilated room in the exhaust case at 100 of 622 For the 2-story house the central-fan-integrated supply system at 33 of the 622 flow rate provided more outside air to all rooms than the least ventilated rooms using exhaust ventilation at 100 of 622 from either the laundry or the master bathroom
bull Operation of the central fan at a 33 duty cycle maintained relatively well-mixed conditions regardless of ventilation rate type of ventilation system (supply or exhaust) or house configuration (1-story or 2-story)
bull Exhaust location affected both the relative amount of outside air received by different rooms and the overall uniformity among rooms but the effect was not predictable
bull For exhaust-only ventilation without central fan operation opening bedroom doors appeared to significantly improve the mixing of ventilation air among rooms
bull Transfer grilles improved the distribution of ventilation air slightly but much less than opening the bedroom doors
bull In the 2-story house the stack effect caused air movement from the first floor to the second floor even when exhaust ventilation was applied to the first floor resulting in consistently higher tracer gas concentrations on the second floor and more non-uniform ventilation air distribution in general
bull Interactions between natural infiltration and both exhaust and supply mechanical ventilation were very significant When the ventilation system was activated the combined air change rate did not increase commensurate with the measured ventilation rate but instead increased by only half that amount This result was consistent with combining ventilation and infiltration in quadrature to estimate whole-house air change rate in accordance with ASHRAE Standard 136 (ASHRAE 1993)
46 of 49
Research Report - 0602
FUTURE WORK
In future tests continuous monitoring of pressure differentials would enhance our understanding of the multi-zone combined infiltration and ventilation systems and our ability to model them That would help to explain differences between tests in more detail including the effects of multiple stories location of ventilation supply outlets and exhaust inlets interior door closure and use of passive return air transfer grilles Pressure differential measurement points should include
bull dP with respect to outside for each closed room and open space bull dP across closed interior doors bull dP between the floor cavity and outdoors and bull dP between the house and the attic
Measurement of wind direction along with wind speed could also be helpful for modeling these buildings and systems However because of micro-climate wind shielding it may be very difficult to relate a single-point wind direction measurement to actual wind vectors on the building surfaces
ACKNOWLEDGMENTS
The authors express their appreciation to Rich Coyle of DR Horton for providing the test houses and to Joseph Lstiburek of BSC Subrato Chandra and Neil Moyer of FSEC and Greg Barker of Mountain Energy Partnership for their assistance in the planning and execution of this ventilation study
47 of 49
Research Report - 0602
REFERENCES
ASHRAE (1993) ANSIASHRAE Standard 136-1993 A Method of Determining Air Change Rates in Detached Dwellings Atlanta GA American Society of Heating Refrigerating and Air-Conditioning Engineers Inc
ASHRAE (1997) ANSIASHRAE Standard 129-1997 Measuring Air-Change Effectiveness Atlanta GA American Society of Heating Refrigerating and Air-Conditioning Engineers Inc
ASHRAE (2004) ASHRAE Standard 622-2004 Ventilation and Acceptable Indoor Air Quality in Low-Rise Residential Buildings Atlanta GA American Society of Heating Refrigerating and Air-Conditioning Engineers Inc
CSA (2003) CANCSA F326-M91 Residential Mechanical Ventilation Systems Canadian Standards Association Ontario Canada httpwwwcsashyintlorgonlinestoreGetCatalogItemDetailsaspmat=2410793ampParent=102
NBC 2005 National Building Code of Canada httpircnrcshycnrcgccapubscodesnrcc47666_ehtml
Grieve PW (1991) Measuring Ventilation Using Tracer-Gases Denmark Bruumlel amp Kjaeligr
MN Chapter 7672 Minnesota Energy Code Chapter 7672 Detached Single-Family And Two-Family Dwellings httpwwwstatemnusmnexternalDocsCommerceChapter_7672_Residential_111302012428 _72rulepdf
Persily AK Martin SR (2000) A Modeling Study of Ventilation in Manufactured Houses Gaithersburg MD National Institute of Standards and Technology NISTIR 6455
Rudd A Lstiburek J (2000) ldquoMeasurement of Ventilation and Interzonal Distribution in Single-Family Homesrdquo ASHRAE Transactions 2000 MN-00-10-3 V 106 Pt2 American Society of Heating Refrigeration and Air-Conditioning Engineers Atlanta GA
WAC (2004) Washington State Title 51 WAC Community trade and economic development department of (building code council) Chapter 51-13 Ventilation and indoor air quality httpappslegwagovWACdefaultaspxcite=51-13
48 of 49
Research Report - 0602
Field test of room-to-room uniformity of ventilation air distribution in two new houses
About this Report
This report was prepared for the US Department of Energyrsquos Building America
Program The report is freely available to the public at wwwbuildingamericagov
The authors express their appreciation to Rich Coyle of DR Horton for providing the test houses and to Joseph Lstiburek of BSC Subrato Chandra and Neil Moyer of
FSEC and Greg Barker of Mountain Energy Partnership for their assistance in the planning and execution of this ventilation study
About the Authors
Robert Hendron Ren Anderson Dennis Barley are with National Renewable Energy Laboratory Armin Rudd and Aaron Townsend are with Building Science Corporation
Ed Hancock is with Mountain Energy Partnership
Direct all correspondence to Building Science Corporation 30 Forest Street Somerville MA 02143
Limits of Liability and Disclaimer of Warranty
Building Science documents are intended for professionals The author and the publisher of this article have used their best efforts to provide accurate and authoritative information in regard to the subject matter covered The author and publisher make no warranty of any kind expressed or implied with regard to the information contained in this article
The information presented in this article must be used with care by professionals who understand the implications of what they are doing If professional advice or other expert assistance is required the services of a competent professional shall be sought The author and publisher shall not be liable in the event of incidental or consequential damages in connection with or arising from the use of the information contained within this Building Science document
49 of 49
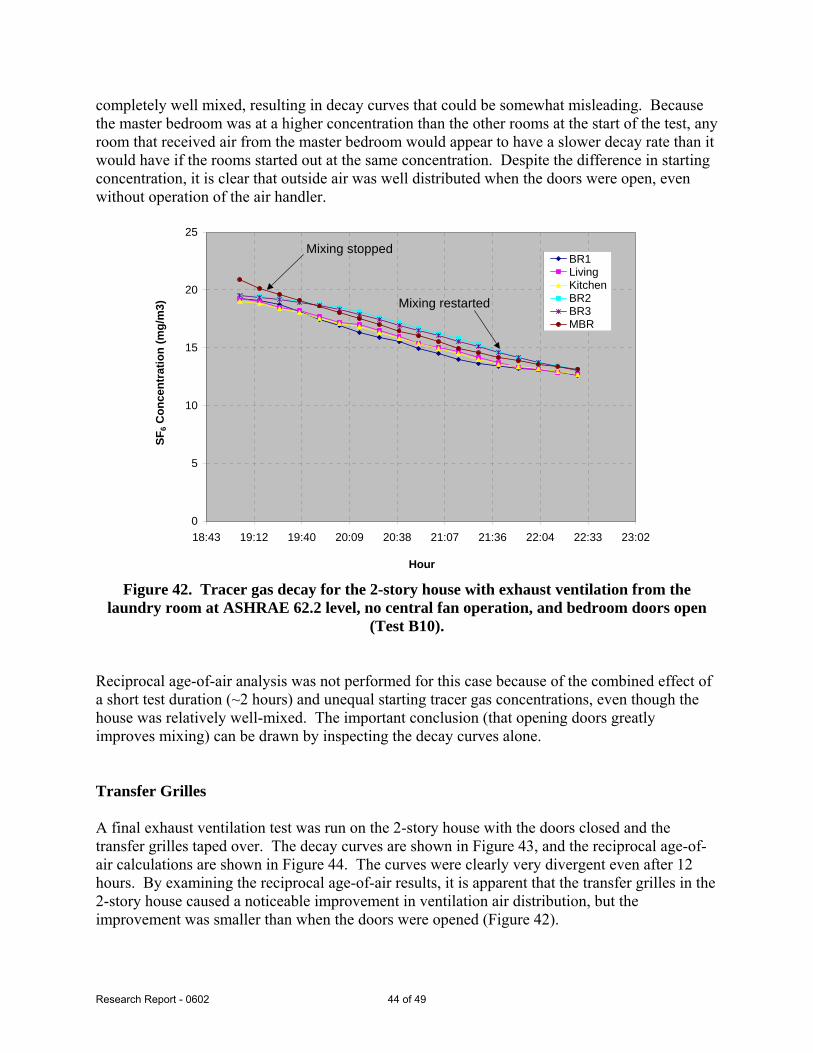
Research Report - 0602
0
5
10
15
20
25
SF
6 C
on
ce
ntr
ati
on
(m
gm
3)
BR1 Living Kitchen BR2 BR3 MBR
Mixing stopped
Mixing restarted
completely well mixed resulting in decay curves that could be somewhat misleading Because the master bedroom was at a higher concentration than the other rooms at the start of the test any room that received air from the master bedroom would appear to have a slower decay rate than it would have if the rooms started out at the same concentration Despite the difference in starting concentration it is clear that outside air was well distributed when the doors were open even without operation of the air handler
1843 1912 1940 2009 2038 2107 2136 2204 2233 2302
Hour
Figure 42 Tracer gas decay for the 2-story house with exhaust ventilation from the laundry room at ASHRAE 622 level no central fan operation and bedroom doors open
(Test B10)
Reciprocal age-of-air analysis was not performed for this case because of the combined effect of a short test duration (~2 hours) and unequal starting tracer gas concentrations even though the house was relatively well-mixed The important conclusion (that opening doors greatly improves mixing) can be drawn by inspecting the decay curves alone
Transfer Grilles
A final exhaust ventilation test was run on the 2-story house with the doors closed and the transfer grilles taped over The decay curves are shown in Figure 43 and the reciprocal age-ofshyair calculations are shown in Figure 44 The curves were clearly very divergent even after 12 hours By examining the reciprocal age-of-air results it is apparent that the transfer grilles in the 2-story house caused a noticeable improvement in ventilation air distribution but the improvement was smaller than when the doors were opened (Figure 42)
44 of 49
Research Report - 0602
0
5
10
15
20
25
30
SF
6 C
on
cen
tra
tio
n (
mg
m3
) BR1 Living Kitchen BR2 BR3 MBR
Mixing stopped
Mixing restarted
1648 1912 2136 000 224 448 712 936
Hour
Figure 43 Tracer gas decay for 2-story house with exhaust ventilation from the laundry room at ASHRAE 622 level no central fan operation bedroom doors closed transfer
grilles taped closed (Test B7)
Exhaust Ventilation Transfer Grilles Untaped vs Taped
000
005
010
015
020
Re
cip
roc
al
Ag
e o
f A
ir (
1h
r)
BR1
Living
Kitchen
BR2
BR3
MBR
Exhaust in laundry room no Exhaust in laundry room no
mixing 100 ASHRAE mixing 100 ASHRAE
doors closed doors closed transfer
grilles taped
Figure 44 Reciprocal age-of-air for 2-story house with exhaust ventilation from the laundry room at ASHRAE 622 level no central fan operation and doors closed In the first case the transfer grilles are untaped (Test B3) in the second they are taped closed
(Test B7)
45 of 49
Research Report - 0602
CONCLUSIONS
bull Reciprocal age-of-air analysis was chosen as a quantitative method for characterizing distribution of ventilation air among rooms This method worked well in cases where rooms were well mixed to begin the test and weather conditions were sufficiently steady-state
bull A test period of at least 1frac12 air changes was necessary to obtain reasonably accurate ageshyof-air results when there was significant divergence in tracer gas concentration among the rooms
bull Although we did not achieve uniform initial concentration of tracer gas in the 2-story house using our test methodology and the equipment at hand we believe the reciprocal age-of-air calculations were meaningful in many of the cases as indicated in the discussion
bull Both houses were relatively tight with natural infiltration averaging 008 ACH for the 1shystory house and 011 ACH for the 2-story house
bull Both houses had relatively small (but not negligible) duct losses to the outside producing an increase in infiltration of less than 003 ACH for the 1-story house and 002 ACH for the 2-story house when the air handler runs
bull Age-of-air analysis indicated that ventilation supplied through the central air distribution system provided much more uniform distribution of ventilation air than the single-point exhaust system when the doors were closed and the air handler was not running For the 1-story house the central-fan-integrated supply ventilation case at 60 of ASHRAE 622 provided more outside air to all rooms than the least-ventilated room in the exhaust case at 100 of 622 For the 2-story house the central-fan-integrated supply system at 33 of the 622 flow rate provided more outside air to all rooms than the least ventilated rooms using exhaust ventilation at 100 of 622 from either the laundry or the master bathroom
bull Operation of the central fan at a 33 duty cycle maintained relatively well-mixed conditions regardless of ventilation rate type of ventilation system (supply or exhaust) or house configuration (1-story or 2-story)
bull Exhaust location affected both the relative amount of outside air received by different rooms and the overall uniformity among rooms but the effect was not predictable
bull For exhaust-only ventilation without central fan operation opening bedroom doors appeared to significantly improve the mixing of ventilation air among rooms
bull Transfer grilles improved the distribution of ventilation air slightly but much less than opening the bedroom doors
bull In the 2-story house the stack effect caused air movement from the first floor to the second floor even when exhaust ventilation was applied to the first floor resulting in consistently higher tracer gas concentrations on the second floor and more non-uniform ventilation air distribution in general
bull Interactions between natural infiltration and both exhaust and supply mechanical ventilation were very significant When the ventilation system was activated the combined air change rate did not increase commensurate with the measured ventilation rate but instead increased by only half that amount This result was consistent with combining ventilation and infiltration in quadrature to estimate whole-house air change rate in accordance with ASHRAE Standard 136 (ASHRAE 1993)
46 of 49
Research Report - 0602
FUTURE WORK
In future tests continuous monitoring of pressure differentials would enhance our understanding of the multi-zone combined infiltration and ventilation systems and our ability to model them That would help to explain differences between tests in more detail including the effects of multiple stories location of ventilation supply outlets and exhaust inlets interior door closure and use of passive return air transfer grilles Pressure differential measurement points should include
bull dP with respect to outside for each closed room and open space bull dP across closed interior doors bull dP between the floor cavity and outdoors and bull dP between the house and the attic
Measurement of wind direction along with wind speed could also be helpful for modeling these buildings and systems However because of micro-climate wind shielding it may be very difficult to relate a single-point wind direction measurement to actual wind vectors on the building surfaces
ACKNOWLEDGMENTS
The authors express their appreciation to Rich Coyle of DR Horton for providing the test houses and to Joseph Lstiburek of BSC Subrato Chandra and Neil Moyer of FSEC and Greg Barker of Mountain Energy Partnership for their assistance in the planning and execution of this ventilation study
47 of 49
Research Report - 0602
REFERENCES
ASHRAE (1993) ANSIASHRAE Standard 136-1993 A Method of Determining Air Change Rates in Detached Dwellings Atlanta GA American Society of Heating Refrigerating and Air-Conditioning Engineers Inc
ASHRAE (1997) ANSIASHRAE Standard 129-1997 Measuring Air-Change Effectiveness Atlanta GA American Society of Heating Refrigerating and Air-Conditioning Engineers Inc
ASHRAE (2004) ASHRAE Standard 622-2004 Ventilation and Acceptable Indoor Air Quality in Low-Rise Residential Buildings Atlanta GA American Society of Heating Refrigerating and Air-Conditioning Engineers Inc
CSA (2003) CANCSA F326-M91 Residential Mechanical Ventilation Systems Canadian Standards Association Ontario Canada httpwwwcsashyintlorgonlinestoreGetCatalogItemDetailsaspmat=2410793ampParent=102
NBC 2005 National Building Code of Canada httpircnrcshycnrcgccapubscodesnrcc47666_ehtml
Grieve PW (1991) Measuring Ventilation Using Tracer-Gases Denmark Bruumlel amp Kjaeligr
MN Chapter 7672 Minnesota Energy Code Chapter 7672 Detached Single-Family And Two-Family Dwellings httpwwwstatemnusmnexternalDocsCommerceChapter_7672_Residential_111302012428 _72rulepdf
Persily AK Martin SR (2000) A Modeling Study of Ventilation in Manufactured Houses Gaithersburg MD National Institute of Standards and Technology NISTIR 6455
Rudd A Lstiburek J (2000) ldquoMeasurement of Ventilation and Interzonal Distribution in Single-Family Homesrdquo ASHRAE Transactions 2000 MN-00-10-3 V 106 Pt2 American Society of Heating Refrigeration and Air-Conditioning Engineers Atlanta GA
WAC (2004) Washington State Title 51 WAC Community trade and economic development department of (building code council) Chapter 51-13 Ventilation and indoor air quality httpappslegwagovWACdefaultaspxcite=51-13
48 of 49
Research Report - 0602
Field test of room-to-room uniformity of ventilation air distribution in two new houses
About this Report
This report was prepared for the US Department of Energyrsquos Building America
Program The report is freely available to the public at wwwbuildingamericagov
The authors express their appreciation to Rich Coyle of DR Horton for providing the test houses and to Joseph Lstiburek of BSC Subrato Chandra and Neil Moyer of
FSEC and Greg Barker of Mountain Energy Partnership for their assistance in the planning and execution of this ventilation study
About the Authors
Robert Hendron Ren Anderson Dennis Barley are with National Renewable Energy Laboratory Armin Rudd and Aaron Townsend are with Building Science Corporation
Ed Hancock is with Mountain Energy Partnership
Direct all correspondence to Building Science Corporation 30 Forest Street Somerville MA 02143
Limits of Liability and Disclaimer of Warranty
Building Science documents are intended for professionals The author and the publisher of this article have used their best efforts to provide accurate and authoritative information in regard to the subject matter covered The author and publisher make no warranty of any kind expressed or implied with regard to the information contained in this article
The information presented in this article must be used with care by professionals who understand the implications of what they are doing If professional advice or other expert assistance is required the services of a competent professional shall be sought The author and publisher shall not be liable in the event of incidental or consequential damages in connection with or arising from the use of the information contained within this Building Science document
49 of 49
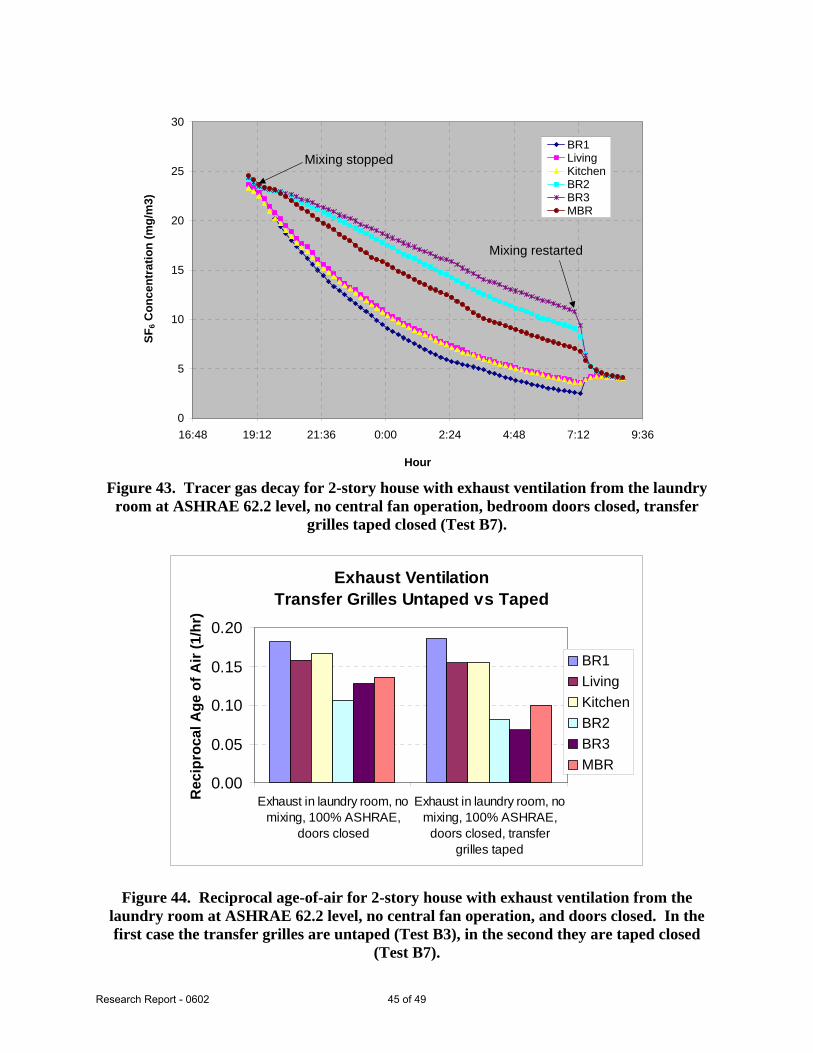
Research Report - 0602
0
5
10
15
20
25
30
SF
6 C
on
cen
tra
tio
n (
mg
m3
) BR1 Living Kitchen BR2 BR3 MBR
Mixing stopped
Mixing restarted
1648 1912 2136 000 224 448 712 936
Hour
Figure 43 Tracer gas decay for 2-story house with exhaust ventilation from the laundry room at ASHRAE 622 level no central fan operation bedroom doors closed transfer
grilles taped closed (Test B7)
Exhaust Ventilation Transfer Grilles Untaped vs Taped
000
005
010
015
020
Re
cip
roc
al
Ag
e o
f A
ir (
1h
r)
BR1
Living
Kitchen
BR2
BR3
MBR
Exhaust in laundry room no Exhaust in laundry room no
mixing 100 ASHRAE mixing 100 ASHRAE
doors closed doors closed transfer
grilles taped
Figure 44 Reciprocal age-of-air for 2-story house with exhaust ventilation from the laundry room at ASHRAE 622 level no central fan operation and doors closed In the first case the transfer grilles are untaped (Test B3) in the second they are taped closed
(Test B7)
45 of 49
Research Report - 0602
CONCLUSIONS
bull Reciprocal age-of-air analysis was chosen as a quantitative method for characterizing distribution of ventilation air among rooms This method worked well in cases where rooms were well mixed to begin the test and weather conditions were sufficiently steady-state
bull A test period of at least 1frac12 air changes was necessary to obtain reasonably accurate ageshyof-air results when there was significant divergence in tracer gas concentration among the rooms
bull Although we did not achieve uniform initial concentration of tracer gas in the 2-story house using our test methodology and the equipment at hand we believe the reciprocal age-of-air calculations were meaningful in many of the cases as indicated in the discussion
bull Both houses were relatively tight with natural infiltration averaging 008 ACH for the 1shystory house and 011 ACH for the 2-story house
bull Both houses had relatively small (but not negligible) duct losses to the outside producing an increase in infiltration of less than 003 ACH for the 1-story house and 002 ACH for the 2-story house when the air handler runs
bull Age-of-air analysis indicated that ventilation supplied through the central air distribution system provided much more uniform distribution of ventilation air than the single-point exhaust system when the doors were closed and the air handler was not running For the 1-story house the central-fan-integrated supply ventilation case at 60 of ASHRAE 622 provided more outside air to all rooms than the least-ventilated room in the exhaust case at 100 of 622 For the 2-story house the central-fan-integrated supply system at 33 of the 622 flow rate provided more outside air to all rooms than the least ventilated rooms using exhaust ventilation at 100 of 622 from either the laundry or the master bathroom
bull Operation of the central fan at a 33 duty cycle maintained relatively well-mixed conditions regardless of ventilation rate type of ventilation system (supply or exhaust) or house configuration (1-story or 2-story)
bull Exhaust location affected both the relative amount of outside air received by different rooms and the overall uniformity among rooms but the effect was not predictable
bull For exhaust-only ventilation without central fan operation opening bedroom doors appeared to significantly improve the mixing of ventilation air among rooms
bull Transfer grilles improved the distribution of ventilation air slightly but much less than opening the bedroom doors
bull In the 2-story house the stack effect caused air movement from the first floor to the second floor even when exhaust ventilation was applied to the first floor resulting in consistently higher tracer gas concentrations on the second floor and more non-uniform ventilation air distribution in general
bull Interactions between natural infiltration and both exhaust and supply mechanical ventilation were very significant When the ventilation system was activated the combined air change rate did not increase commensurate with the measured ventilation rate but instead increased by only half that amount This result was consistent with combining ventilation and infiltration in quadrature to estimate whole-house air change rate in accordance with ASHRAE Standard 136 (ASHRAE 1993)
46 of 49
Research Report - 0602
FUTURE WORK
In future tests continuous monitoring of pressure differentials would enhance our understanding of the multi-zone combined infiltration and ventilation systems and our ability to model them That would help to explain differences between tests in more detail including the effects of multiple stories location of ventilation supply outlets and exhaust inlets interior door closure and use of passive return air transfer grilles Pressure differential measurement points should include
bull dP with respect to outside for each closed room and open space bull dP across closed interior doors bull dP between the floor cavity and outdoors and bull dP between the house and the attic
Measurement of wind direction along with wind speed could also be helpful for modeling these buildings and systems However because of micro-climate wind shielding it may be very difficult to relate a single-point wind direction measurement to actual wind vectors on the building surfaces
ACKNOWLEDGMENTS
The authors express their appreciation to Rich Coyle of DR Horton for providing the test houses and to Joseph Lstiburek of BSC Subrato Chandra and Neil Moyer of FSEC and Greg Barker of Mountain Energy Partnership for their assistance in the planning and execution of this ventilation study
47 of 49
Research Report - 0602
REFERENCES
ASHRAE (1993) ANSIASHRAE Standard 136-1993 A Method of Determining Air Change Rates in Detached Dwellings Atlanta GA American Society of Heating Refrigerating and Air-Conditioning Engineers Inc
ASHRAE (1997) ANSIASHRAE Standard 129-1997 Measuring Air-Change Effectiveness Atlanta GA American Society of Heating Refrigerating and Air-Conditioning Engineers Inc
ASHRAE (2004) ASHRAE Standard 622-2004 Ventilation and Acceptable Indoor Air Quality in Low-Rise Residential Buildings Atlanta GA American Society of Heating Refrigerating and Air-Conditioning Engineers Inc
CSA (2003) CANCSA F326-M91 Residential Mechanical Ventilation Systems Canadian Standards Association Ontario Canada httpwwwcsashyintlorgonlinestoreGetCatalogItemDetailsaspmat=2410793ampParent=102
NBC 2005 National Building Code of Canada httpircnrcshycnrcgccapubscodesnrcc47666_ehtml
Grieve PW (1991) Measuring Ventilation Using Tracer-Gases Denmark Bruumlel amp Kjaeligr
MN Chapter 7672 Minnesota Energy Code Chapter 7672 Detached Single-Family And Two-Family Dwellings httpwwwstatemnusmnexternalDocsCommerceChapter_7672_Residential_111302012428 _72rulepdf
Persily AK Martin SR (2000) A Modeling Study of Ventilation in Manufactured Houses Gaithersburg MD National Institute of Standards and Technology NISTIR 6455
Rudd A Lstiburek J (2000) ldquoMeasurement of Ventilation and Interzonal Distribution in Single-Family Homesrdquo ASHRAE Transactions 2000 MN-00-10-3 V 106 Pt2 American Society of Heating Refrigeration and Air-Conditioning Engineers Atlanta GA
WAC (2004) Washington State Title 51 WAC Community trade and economic development department of (building code council) Chapter 51-13 Ventilation and indoor air quality httpappslegwagovWACdefaultaspxcite=51-13
48 of 49
Research Report - 0602
Field test of room-to-room uniformity of ventilation air distribution in two new houses
About this Report
This report was prepared for the US Department of Energyrsquos Building America
Program The report is freely available to the public at wwwbuildingamericagov
The authors express their appreciation to Rich Coyle of DR Horton for providing the test houses and to Joseph Lstiburek of BSC Subrato Chandra and Neil Moyer of
FSEC and Greg Barker of Mountain Energy Partnership for their assistance in the planning and execution of this ventilation study
About the Authors
Robert Hendron Ren Anderson Dennis Barley are with National Renewable Energy Laboratory Armin Rudd and Aaron Townsend are with Building Science Corporation
Ed Hancock is with Mountain Energy Partnership
Direct all correspondence to Building Science Corporation 30 Forest Street Somerville MA 02143
Limits of Liability and Disclaimer of Warranty
Building Science documents are intended for professionals The author and the publisher of this article have used their best efforts to provide accurate and authoritative information in regard to the subject matter covered The author and publisher make no warranty of any kind expressed or implied with regard to the information contained in this article
The information presented in this article must be used with care by professionals who understand the implications of what they are doing If professional advice or other expert assistance is required the services of a competent professional shall be sought The author and publisher shall not be liable in the event of incidental or consequential damages in connection with or arising from the use of the information contained within this Building Science document
49 of 49

Research Report - 0602
CONCLUSIONS
bull Reciprocal age-of-air analysis was chosen as a quantitative method for characterizing distribution of ventilation air among rooms This method worked well in cases where rooms were well mixed to begin the test and weather conditions were sufficiently steady-state
bull A test period of at least 1frac12 air changes was necessary to obtain reasonably accurate ageshyof-air results when there was significant divergence in tracer gas concentration among the rooms
bull Although we did not achieve uniform initial concentration of tracer gas in the 2-story house using our test methodology and the equipment at hand we believe the reciprocal age-of-air calculations were meaningful in many of the cases as indicated in the discussion
bull Both houses were relatively tight with natural infiltration averaging 008 ACH for the 1shystory house and 011 ACH for the 2-story house
bull Both houses had relatively small (but not negligible) duct losses to the outside producing an increase in infiltration of less than 003 ACH for the 1-story house and 002 ACH for the 2-story house when the air handler runs
bull Age-of-air analysis indicated that ventilation supplied through the central air distribution system provided much more uniform distribution of ventilation air than the single-point exhaust system when the doors were closed and the air handler was not running For the 1-story house the central-fan-integrated supply ventilation case at 60 of ASHRAE 622 provided more outside air to all rooms than the least-ventilated room in the exhaust case at 100 of 622 For the 2-story house the central-fan-integrated supply system at 33 of the 622 flow rate provided more outside air to all rooms than the least ventilated rooms using exhaust ventilation at 100 of 622 from either the laundry or the master bathroom
bull Operation of the central fan at a 33 duty cycle maintained relatively well-mixed conditions regardless of ventilation rate type of ventilation system (supply or exhaust) or house configuration (1-story or 2-story)
bull Exhaust location affected both the relative amount of outside air received by different rooms and the overall uniformity among rooms but the effect was not predictable
bull For exhaust-only ventilation without central fan operation opening bedroom doors appeared to significantly improve the mixing of ventilation air among rooms
bull Transfer grilles improved the distribution of ventilation air slightly but much less than opening the bedroom doors
bull In the 2-story house the stack effect caused air movement from the first floor to the second floor even when exhaust ventilation was applied to the first floor resulting in consistently higher tracer gas concentrations on the second floor and more non-uniform ventilation air distribution in general
bull Interactions between natural infiltration and both exhaust and supply mechanical ventilation were very significant When the ventilation system was activated the combined air change rate did not increase commensurate with the measured ventilation rate but instead increased by only half that amount This result was consistent with combining ventilation and infiltration in quadrature to estimate whole-house air change rate in accordance with ASHRAE Standard 136 (ASHRAE 1993)
46 of 49
Research Report - 0602
FUTURE WORK
In future tests continuous monitoring of pressure differentials would enhance our understanding of the multi-zone combined infiltration and ventilation systems and our ability to model them That would help to explain differences between tests in more detail including the effects of multiple stories location of ventilation supply outlets and exhaust inlets interior door closure and use of passive return air transfer grilles Pressure differential measurement points should include
bull dP with respect to outside for each closed room and open space bull dP across closed interior doors bull dP between the floor cavity and outdoors and bull dP between the house and the attic
Measurement of wind direction along with wind speed could also be helpful for modeling these buildings and systems However because of micro-climate wind shielding it may be very difficult to relate a single-point wind direction measurement to actual wind vectors on the building surfaces
ACKNOWLEDGMENTS
The authors express their appreciation to Rich Coyle of DR Horton for providing the test houses and to Joseph Lstiburek of BSC Subrato Chandra and Neil Moyer of FSEC and Greg Barker of Mountain Energy Partnership for their assistance in the planning and execution of this ventilation study
47 of 49
Research Report - 0602
REFERENCES
ASHRAE (1993) ANSIASHRAE Standard 136-1993 A Method of Determining Air Change Rates in Detached Dwellings Atlanta GA American Society of Heating Refrigerating and Air-Conditioning Engineers Inc
ASHRAE (1997) ANSIASHRAE Standard 129-1997 Measuring Air-Change Effectiveness Atlanta GA American Society of Heating Refrigerating and Air-Conditioning Engineers Inc
ASHRAE (2004) ASHRAE Standard 622-2004 Ventilation and Acceptable Indoor Air Quality in Low-Rise Residential Buildings Atlanta GA American Society of Heating Refrigerating and Air-Conditioning Engineers Inc
CSA (2003) CANCSA F326-M91 Residential Mechanical Ventilation Systems Canadian Standards Association Ontario Canada httpwwwcsashyintlorgonlinestoreGetCatalogItemDetailsaspmat=2410793ampParent=102
NBC 2005 National Building Code of Canada httpircnrcshycnrcgccapubscodesnrcc47666_ehtml
Grieve PW (1991) Measuring Ventilation Using Tracer-Gases Denmark Bruumlel amp Kjaeligr
MN Chapter 7672 Minnesota Energy Code Chapter 7672 Detached Single-Family And Two-Family Dwellings httpwwwstatemnusmnexternalDocsCommerceChapter_7672_Residential_111302012428 _72rulepdf
Persily AK Martin SR (2000) A Modeling Study of Ventilation in Manufactured Houses Gaithersburg MD National Institute of Standards and Technology NISTIR 6455
Rudd A Lstiburek J (2000) ldquoMeasurement of Ventilation and Interzonal Distribution in Single-Family Homesrdquo ASHRAE Transactions 2000 MN-00-10-3 V 106 Pt2 American Society of Heating Refrigeration and Air-Conditioning Engineers Atlanta GA
WAC (2004) Washington State Title 51 WAC Community trade and economic development department of (building code council) Chapter 51-13 Ventilation and indoor air quality httpappslegwagovWACdefaultaspxcite=51-13
48 of 49
Research Report - 0602
Field test of room-to-room uniformity of ventilation air distribution in two new houses
About this Report
This report was prepared for the US Department of Energyrsquos Building America
Program The report is freely available to the public at wwwbuildingamericagov
The authors express their appreciation to Rich Coyle of DR Horton for providing the test houses and to Joseph Lstiburek of BSC Subrato Chandra and Neil Moyer of
FSEC and Greg Barker of Mountain Energy Partnership for their assistance in the planning and execution of this ventilation study
About the Authors
Robert Hendron Ren Anderson Dennis Barley are with National Renewable Energy Laboratory Armin Rudd and Aaron Townsend are with Building Science Corporation
Ed Hancock is with Mountain Energy Partnership
Direct all correspondence to Building Science Corporation 30 Forest Street Somerville MA 02143
Limits of Liability and Disclaimer of Warranty
Building Science documents are intended for professionals The author and the publisher of this article have used their best efforts to provide accurate and authoritative information in regard to the subject matter covered The author and publisher make no warranty of any kind expressed or implied with regard to the information contained in this article
The information presented in this article must be used with care by professionals who understand the implications of what they are doing If professional advice or other expert assistance is required the services of a competent professional shall be sought The author and publisher shall not be liable in the event of incidental or consequential damages in connection with or arising from the use of the information contained within this Building Science document
49 of 49
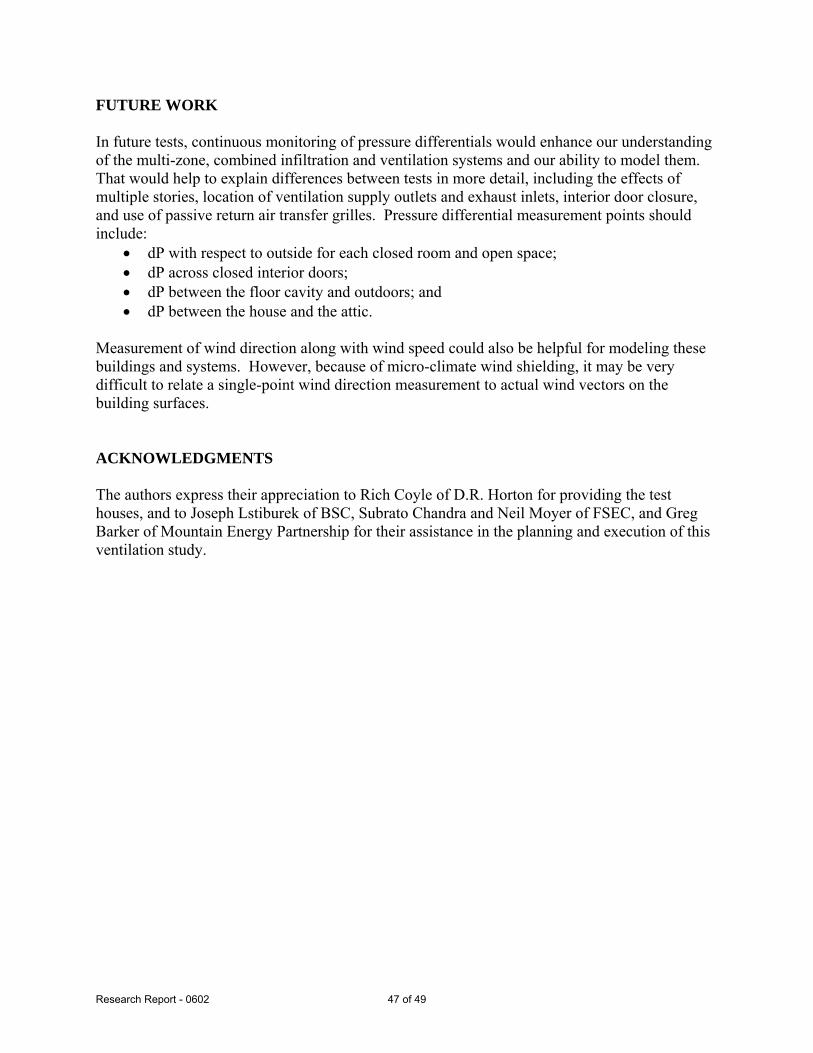
Research Report - 0602
FUTURE WORK
In future tests continuous monitoring of pressure differentials would enhance our understanding of the multi-zone combined infiltration and ventilation systems and our ability to model them That would help to explain differences between tests in more detail including the effects of multiple stories location of ventilation supply outlets and exhaust inlets interior door closure and use of passive return air transfer grilles Pressure differential measurement points should include
bull dP with respect to outside for each closed room and open space bull dP across closed interior doors bull dP between the floor cavity and outdoors and bull dP between the house and the attic
Measurement of wind direction along with wind speed could also be helpful for modeling these buildings and systems However because of micro-climate wind shielding it may be very difficult to relate a single-point wind direction measurement to actual wind vectors on the building surfaces
ACKNOWLEDGMENTS
The authors express their appreciation to Rich Coyle of DR Horton for providing the test houses and to Joseph Lstiburek of BSC Subrato Chandra and Neil Moyer of FSEC and Greg Barker of Mountain Energy Partnership for their assistance in the planning and execution of this ventilation study
47 of 49
Research Report - 0602
REFERENCES
ASHRAE (1993) ANSIASHRAE Standard 136-1993 A Method of Determining Air Change Rates in Detached Dwellings Atlanta GA American Society of Heating Refrigerating and Air-Conditioning Engineers Inc
ASHRAE (1997) ANSIASHRAE Standard 129-1997 Measuring Air-Change Effectiveness Atlanta GA American Society of Heating Refrigerating and Air-Conditioning Engineers Inc
ASHRAE (2004) ASHRAE Standard 622-2004 Ventilation and Acceptable Indoor Air Quality in Low-Rise Residential Buildings Atlanta GA American Society of Heating Refrigerating and Air-Conditioning Engineers Inc
CSA (2003) CANCSA F326-M91 Residential Mechanical Ventilation Systems Canadian Standards Association Ontario Canada httpwwwcsashyintlorgonlinestoreGetCatalogItemDetailsaspmat=2410793ampParent=102
NBC 2005 National Building Code of Canada httpircnrcshycnrcgccapubscodesnrcc47666_ehtml
Grieve PW (1991) Measuring Ventilation Using Tracer-Gases Denmark Bruumlel amp Kjaeligr
MN Chapter 7672 Minnesota Energy Code Chapter 7672 Detached Single-Family And Two-Family Dwellings httpwwwstatemnusmnexternalDocsCommerceChapter_7672_Residential_111302012428 _72rulepdf
Persily AK Martin SR (2000) A Modeling Study of Ventilation in Manufactured Houses Gaithersburg MD National Institute of Standards and Technology NISTIR 6455
Rudd A Lstiburek J (2000) ldquoMeasurement of Ventilation and Interzonal Distribution in Single-Family Homesrdquo ASHRAE Transactions 2000 MN-00-10-3 V 106 Pt2 American Society of Heating Refrigeration and Air-Conditioning Engineers Atlanta GA
WAC (2004) Washington State Title 51 WAC Community trade and economic development department of (building code council) Chapter 51-13 Ventilation and indoor air quality httpappslegwagovWACdefaultaspxcite=51-13
48 of 49
Research Report - 0602
Field test of room-to-room uniformity of ventilation air distribution in two new houses
About this Report
This report was prepared for the US Department of Energyrsquos Building America
Program The report is freely available to the public at wwwbuildingamericagov
The authors express their appreciation to Rich Coyle of DR Horton for providing the test houses and to Joseph Lstiburek of BSC Subrato Chandra and Neil Moyer of
FSEC and Greg Barker of Mountain Energy Partnership for their assistance in the planning and execution of this ventilation study
About the Authors
Robert Hendron Ren Anderson Dennis Barley are with National Renewable Energy Laboratory Armin Rudd and Aaron Townsend are with Building Science Corporation
Ed Hancock is with Mountain Energy Partnership
Direct all correspondence to Building Science Corporation 30 Forest Street Somerville MA 02143
Limits of Liability and Disclaimer of Warranty
Building Science documents are intended for professionals The author and the publisher of this article have used their best efforts to provide accurate and authoritative information in regard to the subject matter covered The author and publisher make no warranty of any kind expressed or implied with regard to the information contained in this article
The information presented in this article must be used with care by professionals who understand the implications of what they are doing If professional advice or other expert assistance is required the services of a competent professional shall be sought The author and publisher shall not be liable in the event of incidental or consequential damages in connection with or arising from the use of the information contained within this Building Science document
49 of 49
Research Report - 0602
Field test of room-to-room uniformity of ventilation air distribution in two new houses
About this Report
This report was prepared for the US Department of Energyrsquos Building America
Program The report is freely available to the public at wwwbuildingamericagov
The authors express their appreciation to Rich Coyle of DR Horton for providing the test houses and to Joseph Lstiburek of BSC Subrato Chandra and Neil Moyer of
FSEC and Greg Barker of Mountain Energy Partnership for their assistance in the planning and execution of this ventilation study
About the Authors
Robert Hendron Ren Anderson Dennis Barley are with National Renewable Energy Laboratory Armin Rudd and Aaron Townsend are with Building Science Corporation
Ed Hancock is with Mountain Energy Partnership
Direct all correspondence to Building Science Corporation 30 Forest Street Somerville MA 02143
Limits of Liability and Disclaimer of Warranty
Building Science documents are intended for professionals The author and the publisher of this article have used their best efforts to provide accurate and authoritative information in regard to the subject matter covered The author and publisher make no warranty of any kind expressed or implied with regard to the information contained in this article
The information presented in this article must be used with care by professionals who understand the implications of what they are doing If professional advice or other expert assistance is required the services of a competent professional shall be sought The author and publisher shall not be liable in the event of incidental or consequential damages in connection with or arising from the use of the information contained within this Building Science document
49 of 49