Embed Size (px)
Citation preview

Wind Energ. Sci., 2, 229–239, 2017www.wind-energ-sci.net/2/229/2017/doi:10.5194/wes-2-229-2017© Author(s) 2017. CC Attribution 3.0 License.
Field test of wake steering at an offshore wind farm
Paul Fleming1, Jennifer Annoni1, Jigar J. Shah2, Linpeng Wang3, Shreyas Ananthan2, Zhijun Zhang3,Kyle Hutchings2, Peng Wang3, Weiguo Chen3, and Lin Chen3
1National Wind Technology Center, National Renewable Energy Laboratory, Golden, CO 80401, USA2Research & Development, Envision Energy USA Ltd, Houston, TX 77002, USA
3Research & Development, Envision Energy Ltd, Shanghai, 200051, China
Correspondence to: Paul Fleming ([email protected])
Received: 16 January 2017 – Discussion started: 6 February 2017Revised: 4 April 2017 – Accepted: 7 April 2017 – Published: 8 May 2017
Abstract. In this paper, a field test of wake-steering control is presented. The field test is the result of a col-laboration between the National Renewable Energy Laboratory (NREL) and Envision Energy, a smart energymanagement company and turbine manufacturer. In the campaign, an array of turbines within an operatingcommercial offshore wind farm in China have the normal yaw controller modified to implement wake steer-ing according to a yaw control strategy. The strategy was designed using NREL wind farm models, includinga computational fluid dynamics model, Simulator fOr Wind Farm Applications (SOWFA), for understandingwake dynamics and an engineering model, FLOw Redirection and Induction in Steady State (FLORIS), for yawcontrol optimization. Results indicate that, within the certainty afforded by the data, the wake-steering controllerwas successful in increasing power capture, by amounts similar to those predicted from the models.
1 Introduction
Wind farm control is an active field of research in which thecontrols of individual turbines co-located within a wind farmare coordinated to improve the overall performance of thefarm. One objective of wind farm control is improving thepower production of wind farms by accounting for the wakeinteractions between nearby turbines.
In one wind farm control concept, turbines are yawed tointroduce a deflection of the wake away from downstreamturbines. This method has been referred to as “controllingthe wind” (Wagenaar et al., 2012) and “yaw-based wakesteering” (Fleming et al., 2014b). High-fidelity simulationsof wake steering have shown the potential of this technique.Jiménez et al. (2010) used computational fluid dynamics(CFD) simulations to demonstrate the wake deflection ca-pability of wind turbines and provided a model of this de-flection. In Fleming et al. (2014b), they used National Re-newable Energy Laboratory (NREL)’s CFD-based Simula-tor fOr Wind Farm Applications (SOWFA) to investigate thecapabilities of wind turbines to redirect wakes. In Vollmeret al. (2016), the behavior of wake steering in different atmo-
spheric conditions was investigated, also using CFD. Finally,in Fleming et al. (2014a), simulations of two-turbine windfarms, again using SOWFA, were used to show that throughwake steering, the net power of the two turbines is increasedwhen the upstream turbine applies an intentional yaw mis-alignment.
Based on high-fidelity simulations, there appears to begood opportunities for improved power performance of windfarms with significant wake losses. Recent efforts have fo-cused on the design of lower-fidelity, controller-orientedmodels, and controllers based on these models that usewake steering to actively improve power. In Gebraad et al.(2014), the FLOw Redirection and Induction in Steady State(FLORIS) model is described and used to determine optimalyaw settings for a model six-turbine wind farm. Set pointsfor a particular wind speed and direction are determined byoptimizing the yaw angles of the turbines using FLORIS, andthese set points are used in SOWFA simulations. The resultsfrom SOWFA agree with the predictions from FLORIS, andtotal power capture is increased by 13 %. This work is car-ried further, and FLORIS is used to assess the overall im-provement from control, first for one speed and over a wind
Published by Copernicus Publications on behalf of the European Academy of Wind Energy e.V.

230 P. Fleming et al.: Field test of wake steering at an offshore wind farm
rose of directions in Fleming et al. (2015) and then to deter-mine the overall annual energy production in Gebraad et al.(2016). These studies indicate a good potential for improvedoverall annual power production for wind farms experiencingsignificant wake losses. It should be noted that even greaterbenefits can be yielded if future wind farms are designed foractive control of wakes, rather than using large inter-turbinespacings to avoid wake losses. This combined optimizationof wind farm control and wind farm system engineering isa subject of active research. These simulation studies havedemonstrated a theoretical potential of wind farm control.However, it is often noted that issues arising in implementa-tion in real conditions might undermine the positive results.Inaccuracies in the control-oriented models or high-fidelitysimulations have been cited as a potential issue. Additionalmodeling of constantly changing wind direction could im-prove the comparison between simulation and field testing.
Some field testing of wake steering has been performedto date to understand the potential of this wind farm controlstrategy. In Wagenaar et al. (2012), wake steering is imple-mented at a scaled wind farm; however, the results are incon-clusive. Wind tunnel testing of wake steering is performed inSchottler et al. (2016) and Campagnolo et al. (2016), and theresults are encouraging because in each case that wake steer-ing is observed, overall power capture is improved for two-turbine cases. The results are in alignment with earlier sim-ulation studies conducted by Jiménez et al. (2010), Gebraadet al. (2014), and Fleming et al. (2014a) in the amount of im-provement and the asymmetric relationship of yaw misalign-ment and power improvement. On the full scale, a nacelle-mounted lidar is used to observe wake deflection on a utility-scale turbine in Trujillo et al. (2016). Finally, in Fleming et al.(2016), two ongoing studies of wake steering are presented,which are both part of a multiyear US Department of EnergyAtmosphere to Electrons project. In one of the field studiesat the Scaled Wind Farm Test Facility (SWiFT), two 27 mdiameter (D) turbines (intentionally aligned in the dominantwind direction at a spacing of 5 D) were used to perform acomprehensive test of wake steering. A second ongoing ex-periment was done, in which a rear-mounted lidar was usedto monitor a wake of a utility-scale turbine, which is set tohold a specific yaw misalignment for a prolonged period oftime. Initial results from both campaigns are in accord withthe model predictions described earlier.
In the present study, a wind farm controller that performswake steering is designed and implemented for an operat-ing commercial offshore wind farm in China with Envisionturbines. The control strategy is simple and based on the ap-proach used to control the simulated wind farm in Gebraadet al. (2014). The test was run for several months and datawere collected and compared from time periods when thecontroller was operating and not operating. The results andanalysis indicate a successful improvement in power produc-tion. Additionally, the data provide important validation ofthe models, specifically SOWFA and FLORIS, used in the
Figure 1. This figure demonstrates the workflow of this project.In particular, this project started by running CFD models of theturbines in this field study to understand the wake characteristics.The FLORIS model was tuned to those CFD simulations. A controllook-up table was generated that contained the optimal yaw settingsfor the control turbine. A field test was conducted with the controlleron and off. The data were analyzed and the results are presented inthis paper. LUT – look-up table; SCADA – supervisory control anddata acquisition.
design of the controller, and can be generalized to similarCFD and control-oriented models. There are some qualifica-tions to these results that will be fully considered in the text.
The contributions of this paper include the results andanalysis from a wind farm test of wake-steering control. Theproject is a collaborative project between the NREL and En-vision Energy, a smart energy management company and tur-bine manufacturer. The positive results motivate further ef-forts into the design and development of such control. Ad-ditionally, this paper provides evaluation on the performanceof wind farm control modeling tools in their ability to predictthe effect of wind farm control strategies.
2 Project overview
The goal of the project was to implement a test of yaw-basedwake steering at an operating wind farm. The project wasbroken down into a workflow illustrated in Fig. 1, whichshows the stages of work and the structure by which this pa-per is organized.
The first stage of work is the selection of a wind farm foruse in the experiment. The Longyuan Rudong Chaojiandaioffshore wind farm in Jiangsu, China, consists of turbinesfrom multiple manufacturers undergoing various phases ofconstruction. A selected portion of the site was studied forthis effort, consisting of 25 Envision EN136/4 MW turbinesincorporating a high-speed three-stage gearbox and induc-tion generator (see Fig. 2a).
From the wind farm, a subset of turbines was selected forimplementing the experiment. These turbines form the fronttwo rows of turbines for winds coming from the northeast.The arrangement of these turbines and their names to be usedthroughout this paper are shown in Fig. 2.
For the campaign, a single turbine was selected to be thecontrolled turbine. This is turbine C1, indicated in Fig. 2.The turbine is shown to wake three particular turbines: D1,from a wind direction of 340◦ at a distance of 7 D; D2, froma wind direction of 51◦ at a distance of 8.6 D; and D3, froma wind direction of 81◦ at a distance of 14.3 D. A control
Wind Energ. Sci., 2, 229–239, 2017 www.wind-energ-sci.net/2/229/2017/

P. Fleming et al.: Field test of wake steering at an offshore wind farm 231
Figure 2. (a) Rudong wind farm used in the field study. (b) Turbine locations. The wake-steering control strategy is implemented to mitigatethe wake interactions between C1, on the one hand, and D1, D2, and D3, on the other. As indicated by the diagram, C1 is the control turbine,R1 is the reference turbine, and D1, D2, and D3 are downstream turbines waked by C1. Turbines O1 and O2 are other turbines not directlyused in the study but whose wakes are noticed in certain directions.
strategy was designed to improve the summed power of tur-bine C1 and a downstream turbine (i.e., C1 and D1, C1 andD2, and C1 and D3) through yaw misalignment of turbineC1. This approach provides three tests of wake steering atdifferent inter-turbine distances. Of these, the pairing withturbine D1, at 7 D, is most promising. This is the distanceused in Fleming et al. (2014a), which showed a potential netimprovement of 4.5 % in power capture in a study with theNREL 5 MW reference turbine for the waking wind direc-tion. Finally, a reference turbine which is not waked in anyof the experimental directions is chosen to provide referencesignals. This is turbine R1 in Fig. 2.
In the initial phase of work, Envision shared with NRELa FAST model of the turbines (FAST is an aero-servo-elasticwind turbine simulation tool maintained by NREL; Jonkmanand Buhl Jr., 2005). Additionally, Envision provided the lay-out of the turbines used in the campaign. Finally, Envisionprovided several months of supervisory control and data ac-quisition (SCADA) data used to evaluate and tune models inadvance of the campaign. As shown in Fig. 1, these inputswere then included in the derivation of the models used inthe yaw control strategy, which will be described in the nextsection.
3 Modeling
3.1 SOWFA
The first model to be used in this study was the SOWFAmodel (Churchfield and Lee, 2014). SOWFA is a wind farmsimulation tool, which models the atmospheric boundarylayer using CFD and then models the turbines using embed-ded FAST models (in the version of SOWFA used in thiswork). The turbines and flow interact through a two-way ac-tuator line coupling.
SOWFA has been validated against wind farm SCADAdata (see, for example, Churchfield et al., 2012). However,
validating SOWFA is not the focus of this campaign. Theprimary use of SOWFA in this study is generating data setsof wakes simulated from the Envision turbine, which can beused to tune the FLORIS model (and repeating the proce-dure that was done for the NREL 5 MW reference turbine inGebraad et al., 2014).
Using the FAST model of the turbine, a suite of simula-tions is assembled. A wind condition of 8 m s−1 wind and6 % turbulence (Gebraad et al., 2014) was used for this study.Simulations were then run with a single turbine operatingwith various amounts of yaw misalignment, as well as fortwo turbine cases, wherein the upstream turbine has variousyaw misalignments and the downstream turbine is placed invarious positions downstream and cross-stream. The trendsin power for the single-turbine case and two-turbine case pro-vide important data with which to tune the control-orientedFLORIS model, described in the next section.
3.2 FLORIS
Using a FAST model of the turbine and the data sets pro-duced by SOWFA, it is possible to obtain a FLORIS modelthat can predict the power of turbines in a farm in steadystate, including wake redirection. As discussed in Gebraadet al. (2014), the FLORIS model is primarily based onthe Jensen model (Jensen, 1984) and the Jiménez model(Jiménez et al., 2010). In particular, FLORIS identifies threedifferent wake zones with separate wake recovery parame-ters to capture the wake characteristics. In addition, FLORISincludes the Jiménez model to incorporate the wake deflec-tion caused by yaw misalignment. FLORIS contains a set ofparameters to be tuned for a given turbine, including param-eters describing the turbine and wake behavior.
Some parameters of the FLORIS model can be set directlyusing the FAST model. Examples of this include the rotor ra-dius and the table of power and thrust coefficients by wind
www.wind-energ-sci.net/2/229/2017/ Wind Energ. Sci., 2, 229–239, 2017

232 P. Fleming et al.: Field test of wake steering at an offshore wind farm
Table 1. FLORIS wake tuning.
Parameter NREL 5 MW Envision 4 MW
kd 0.17 0.26ke 0.05 0.063WDinit −4.5◦ −3.7◦
pP 1.88 1.43
speed, which can be obtained by running steady wind simu-lations in FAST.
The remaining parameters are tuned in this work throughan optimization routine that minimizes the error between thepower outputs simulated in SOWFA and those predicted byFLORIS. As a design rule, the smallest set of parametersshould be adjusted away from their default settings that pro-duce a reasonable fit. Through iteration, it was determinedthat adjustments to four parameters gave a good approxima-tion. The parameters that we focus on are described below.
The parameter pP relates yaw misalignment to reductionin power by
Lyaw = cos(γ )pP , (1)
where γ is the yaw misalignment of the turbine and Lyaw isthe fraction of power relative to a non-yawed baseline. Thehigher pP is, the more quickly a turbine loses power by mis-alignment and the less likely it is that wake steering will workbecause the downstream turbine needs to recover more powerto compensate for power lost by the upstream turbine.
The parameter ke determines the rate at which a wake ex-pands and recovers to the free-stream velocity. A larger kevalue indicates a faster wake recovery to free stream. Stan-dard values in the literature range from 0.05 to 0.1. Simi-larly, kd, based on the Jiménez model, describes the rate atwhich a deflected wake reverts to the free-stream direction.A larger kd parameter indicates that the wake is less sensitiveto yaw misalignment. Standard values in the literature rangefrom kd = 0.1 to kd = 0.3. Finally,WDinit describes an initialwake deflection angle without steering, which is importantfor capturing the asymmetry of wake steering. This asym-metry is likely caused by the combination of the rotation ofthe turbine and the shear layer in the atmospheric boundarylayer.
The results of the tuning optimization are presented in Ta-ble 1, which shows both the default values obtained from tun-ing to the NREL 5 MW reference turbine as well as the newlyobtained values.
Among these, the lower value of pP is interesting, as 1.43is below the value obtained for the NREL 5 MW turbine(1.88) and other experimental results. For example, the co-efficient is fit to wind tunnel tests in Medici (2005) to be 2.0.However, 1.43 is an attractive number as it implies that wakesteering can be performed with less losses incurred on theupstream yawed turbine.
4 Control design and field test
Given a completed FLORIS model, it is now possible to de-rive a set of yaw misalignments for turbine C1 that will opti-mize power for the pairs of turbines (D1, D2, and D3 down-stream) by wind direction. Wind speed is not used as an inputas inspection indicated minimal sensitivity. It is important tonote that there is not much benefit at very low and very highwind speeds, suggesting that it is sufficient to enable and dis-able the controller by wind speed rather than scheduling.
Some constraints were placed on the optimization. First,for turbine loading and safety reasons, the maximum yawmisalignment was limited to 25◦. Second, it was decidedfor this experiment to limit the controller to positive yawmisalignment angles (in our nomenclature this is rotatingthe turbine counterclockwise from the wind when viewedfrom above). This is because this has been demonstrated tobe more effective (see, for example, Fleming et al., 2014a,where positive yaw misalignments yield higher power in-creases as compared to negative yaw misalignments), andincluding negative misalignments might raise loads and re-quire a nontrivial transition from positive to negative yawmisalignments near the wake crossover point, i.e., when itbecomes more beneficial to redirect the wake from the rightside of the downstream turbine to the left side of the down-stream turbine. Using the tuned FLORIS model and theseconstraints, it is possible to now derive an optimal table ofyaw misalignments for turbine C1. This is shown in Fig. 3.
The optimal yaw misalignment angles for turbine C1 areshown in the upper left of Fig. 3. The dashed lines indicatethe directions in which turbine C1 wakes one of the threedownstream turbines (see Fig. 2). Near the fully waked di-rections, the misalignments are largest and taper down as lessdeflection is needed to remove the partial wake overlap sit-uations. The power loss of turbine C1, shown in normalizedpower, is indicated in the middle left plot. The overall “plant”gain for these four turbines is then shown in the lower left. Fi-nally, the right panels show the normalized power of the threedownstream turbines with and without wake steering. Basedon the percent improvement, the sum power is expected to in-crease for all three pairings, meaning the gains downstreamexceed the losses upstream. However, this is least so for tur-bine D3 as at 14.3 D, the baseline wake loss is much less,which is expected.
Using this table of offsets by wind direction, engineers atEnvision modified the yaw controller of turbine C1 to de-liver these offsets. Note that this offset tracking must be donewithin the limits of yaw control actuation, and for safetyreasons the offset was disabled in sustained winds above10 m s−1. We note here also that the purpose of the experi-ment was to demonstrate the principle of wake steering andnot produce a fully optimized closed-loop control implemen-tation, which is expected to be the subject of future work. Aswill be discussed, the present controller offsets correctly in
Wind Energ. Sci., 2, 229–239, 2017 www.wind-energ-sci.net/2/229/2017/

P. Fleming et al.: Field test of wake steering at an offshore wind farm 233
Figure 3. FLORIS optimal yaw misalignment results. The dashed vertical line indicates the direction in which the downstream turbine isfully waked by turbine C1. See Fig. 2 for details on the precise wind directions. Specifically, the first dashed line (from left to right) refers tothe direction of turbine C1 fully waking downstream turbine D1. The second dashed line refers to the direction of turbine C1 fully wakingdownstream turbine D2. Finally, the third dashed line refers to the direction of turbine C1 fully waking downstream turbine D3. Wakes fromturbines other than C1 are also evident from the dashed lines. Note that for the power subplots, the power is given normalized to the powerof the turbine in un-yawed and un-waked conditions
Figure 4. Cosine exponent fit. Panel (a) shows the range of data over various yaw misalignments and the power ratio. The blue line indicatesa cosine function with the fit exponent value of pP = 1.41, and the banded region indicates the confidence interval as described in the text.Panel (b) indicates the number of points included in each yaw alignment position.
the average sense, with a wide variation of offsets occurringdynamically.
Following the implementation of the controller, the exper-imental campaign was then run in two phases. In the firstphase, the wind farm was operated normally while data rel-evant for this campaign were collected. This phase lasted 4months, from 3 April 2016 to 5 August 2016. The secondphase used the controller designed above and was run an ad-ditional 4 months, from 5 August 2016 to 2 December 2016.
It is regrettable that the campaign could not be run longer.Naturally, only a portion of the data features the wind di-
rections of primary interest. Additionally, it should be notedthat it would be better to alternate the controller on and offregularly throughout the campaign to better compare condi-tions when the controller is on than when it is off. However,Rudong is a commercial wind site with internal and externalrestrictions, and it was necessary to run the test within theseconstraints. It is important to note that there are limitationswith field testing and data collection. In particular, the re-sults are impacted because of the relatively short window ofdata collection. Further, the sequential testing pattern opensthe possibility of confounding influences such as seasonal
www.wind-energ-sci.net/2/229/2017/ Wind Energ. Sci., 2, 229–239, 2017

234 P. Fleming et al.: Field test of wake steering at an offshore wind farm
Figure 5. Statistical analysis of the SCADA vane data from turbine C1, with the offset controller off and on. This graph shows the controllerof turbine C1 operating to redirect the wake away from the downstream turbines. The black and red lines indicate the average yaw offsetpositions from SCADA data for the baseline and offset strategy, while the dashed lines are those of the look-up table (LUT) from FLORIS.Finally, the red and black regions show the range of points from the 25th through 75th percentiles for the baseline and offset SCADA data.
variation in atmospheric conditions. The results of these lim-itations will be discussed more in the analysis section.
5 Results and analysis
In this section, the results of the campaign are presentedand analyzed. As a first step, the behavior of the upstreamturbine can be analyzed independently. Specifically, the pPterm, which describes the loss of power against yaw mis-alignment, can be derived from the experimental data andcompared with the value computed from SOWFA and usedin FLORIS.
The data are collected at a 20 Hz rate from the campaignand are reduced to 1 min averages. Next, we define a powerratio, which is the power of turbine C1 (the controlled tur-bine) divided by the power of turbine R1 (the reference tur-bine). We then consider this ratio as a function of the yawmisalignment of turbine C1. This misalignment is measuredby the wind vane of turbine C1. Note that this calculationwas repeated, wherein the misalignment is the difference be-tween the yaw angle of turbine R1 and C1, without substan-tially affecting the results. The value of pP is determined asthe result of a minimization problem between the data andEq. (1). Additionally, to provide a form of confidence inter-val, a separate pP is similarly derived for every day of data,and the 25th and 75th percentile values are used as a rangeof confidence. The data, fit, confidence interval, and amountof available data are shown in Fig. 4.
Using this method, the determined value of pP was 1.41,which is close to the value derived from SOWFA. This is thefirst encouraging result, as the value from SOWFA initiallyappeared lower than expected. From a wake-steering per-spective, it is useful that the upstream turbine will lose less
power when operating in yawed conditions with a smallerexponent.
Figure 5 shows the performance of the controller in ob-taining the desired offsets. In the figure, for the baseline andoptimized control strategies, the mean offset of turbine C1is shown, as well as a shaded region including points (1 minaverages) from the 25th through 75th percentile of observedpoints. Finally, the initially prescribed pattern of FLORIS isshown. What can be observed is that implementing the off-set strategy in real conditions where the turbine must trackan ever-changing wind direction within the bounds of theyaw controller results in the sharp narrow peak of the optimalstrategy being smoothed and spread. This implies that the ac-tual control is somewhere between the baseline and optimumin terms of performance.
Finally, Figs. 6, 7, and 8 compare the overall performanceacross the directions for the three two-turbine pairings. Tocompute this performance, the following procedure is used.First, for each wind direction (in 5◦ bins) and for each turbinea power curve of the form
P =min(aNv3,Prated) (2)
is computed for each day using an error-minimization tech-nique, where a is the fitted value and N is the nominal value,which includes the air density, coefficient of power, rotorarea, and efficiency losses. v is the wind speed measured bythe reference turbine R1.
The value a represents a scalar gain on the power curvebelow rated and also effectively shifts the rated wind speed.N is selected such that a turbine operating normally and un-waked would on average have an a value of 1.0.
This method, in which the data are used to derive a reduc-tion value to the power curve, was selected after significant
Wind Energ. Sci., 2, 229–239, 2017 www.wind-energ-sci.net/2/229/2017/

P. Fleming et al.: Field test of wake steering at an offshore wind farm 235
Figure 6. This figure shows the results fitting power curves for the turbine C1 to turbine D1 pair. FLORIS-BASE refers to the results fromthe FLORIS model with no wake steering, and FLORIS-OPT refers to the results from the FLORIS model with the optimal yaw set points.SCADA-BASE refers to the field test where the controller was off, and SCADA-OPT refers to the field test where the controller was on.The banded region shows the range of fit values from the 25th to 75th percentile of fitted power curves. In particular, (a) shows turbine C1and the resulting power with the controller on (red) and off (black). Panel (b) shows the downstream turbine, i.e., turbine D1, with the offsetcontroller of C1 on (red) and off (black). Panel (c) shows the overall power between the pair of turbines. There is a significant power gainwhen the controller is on versus when it is off. Finally, (d) indicates the number of days used to compute the statistics provided in the topthree plots.
effort to combine the available data into a complete analy-sis. Note that alternative methods, such as directly compar-ing the power production of the turbines was performed andgives similar results. The power curves are fit on a per-daybasis (and not for example globally or through random boot-strapping) to help visualize the day-to-day variation in per-formance.
The computed value a is the amount by which the powercurve is reduced below nominal as observed for non-wakedand non-yawed turbines. From these values computed foreach available day, for each control setting, the 25th, 50th,and 75th percentile values are determined and used as themiddle fit and confidence range. The reason for not comput-ing the power curve globally was to limit the impact of par-ticular outlier days and give some indication of the range ofresults observed. Where the range is small and the number of
days of data collected large, the trends converge. Finally, thepower predictions of FLORIS, for the same conditions, areoverlaid on the plots for comparison. The power values fromFLORIS were computed by simulating the same conditionsand then using the same fitting approach to include some ofthe effects such as blurring between wind directions in the 5◦
bins.For a first analysis, consider the turbine C1–D1 pair in
Fig. 6. In particular, the results shown in Fig. 6 show the re-sults from FLORIS with no wake steering (FLORIS-BASE,shown as the dashed black line with star symbols), FLORISwith optimal yaw set points (FLORIS-OPT, shown with thedashed red line with star symbols), the field test with nowake steering (SCADA-BASE, shown with the solid blackline with squares), and the field test with the optimal yawset points (SCADA-OPT, shown with the solid red line with
www.wind-energ-sci.net/2/229/2017/ Wind Energ. Sci., 2, 229–239, 2017
236 P. Fleming et al.: Field test of wake steering at an offshore wind farm
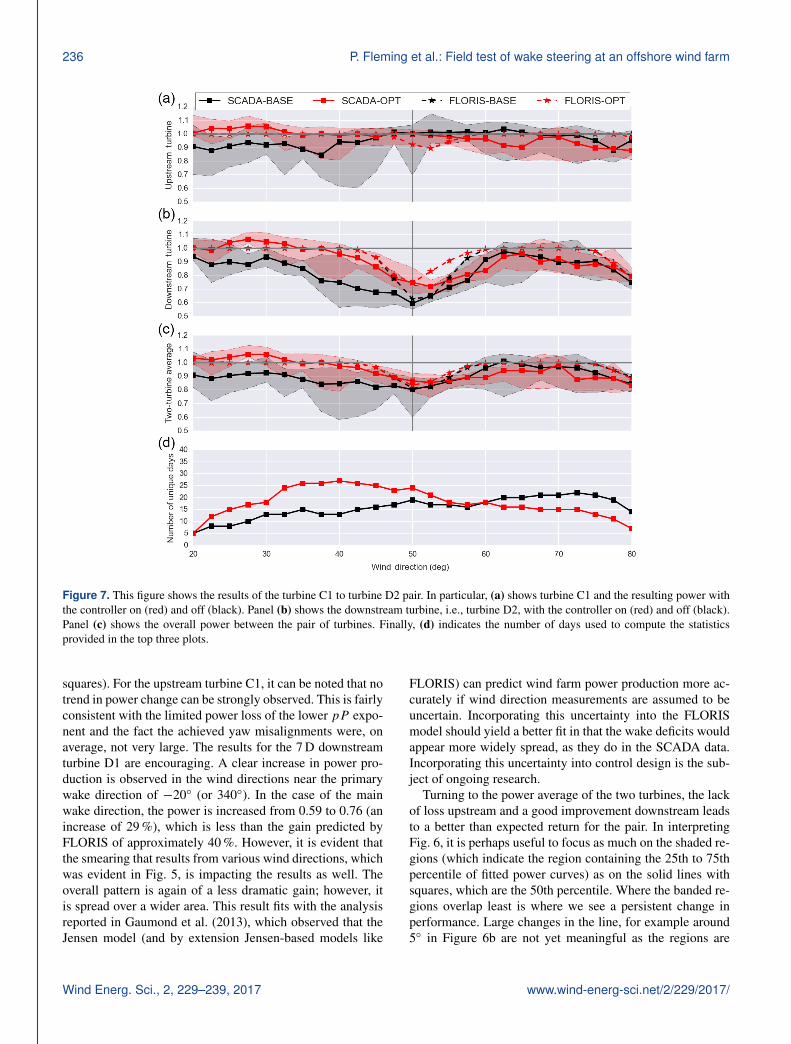
Figure 7. This figure shows the results of the turbine C1 to turbine D2 pair. In particular, (a) shows turbine C1 and the resulting power withthe controller on (red) and off (black). Panel (b) shows the downstream turbine, i.e., turbine D2, with the controller on (red) and off (black).Panel (c) shows the overall power between the pair of turbines. Finally, (d) indicates the number of days used to compute the statisticsprovided in the top three plots.
squares). For the upstream turbine C1, it can be noted that notrend in power change can be strongly observed. This is fairlyconsistent with the limited power loss of the lower pP expo-nent and the fact the achieved yaw misalignments were, onaverage, not very large. The results for the 7 D downstreamturbine D1 are encouraging. A clear increase in power pro-duction is observed in the wind directions near the primarywake direction of −20◦ (or 340◦). In the case of the mainwake direction, the power is increased from 0.59 to 0.76 (anincrease of 29 %), which is less than the gain predicted byFLORIS of approximately 40 %. However, it is evident thatthe smearing that results from various wind directions, whichwas evident in Fig. 5, is impacting the results as well. Theoverall pattern is again of a less dramatic gain; however, itis spread over a wider area. This result fits with the analysisreported in Gaumond et al. (2013), which observed that theJensen model (and by extension Jensen-based models like
FLORIS) can predict wind farm power production more ac-curately if wind direction measurements are assumed to beuncertain. Incorporating this uncertainty into the FLORISmodel should yield a better fit in that the wake deficits wouldappear more widely spread, as they do in the SCADA data.Incorporating this uncertainty into control design is the sub-ject of ongoing research.
Turning to the power average of the two turbines, the lackof loss upstream and a good improvement downstream leadsto a better than expected return for the pair. In interpretingFig. 6, it is perhaps useful to focus as much on the shaded re-gions (which indicate the region containing the 25th to 75thpercentile of fitted power curves) as on the solid lines withsquares, which are the 50th percentile. Where the banded re-gions overlap least is where we see a persistent change inperformance. Large changes in the line, for example around5◦ in Figure 6b are not yet meaningful as the regions are
Wind Energ. Sci., 2, 229–239, 2017 www.wind-energ-sci.net/2/229/2017/

P. Fleming et al.: Field test of wake steering at an offshore wind farm 237
Figure 8. This figure shows the results of the turbine C1 to turbine D3 pair. In particular, (a) shows turbine C1 and the resulting power withthe controller on (red) and off (black). Panel (b) shows the downstream turbine, i.e., turbine D3, with the controller on (red) and off (black).Panel (c) shows the overall power between the pair of turbines. There is no noticeable power gain with the controller on or off. This is likelybecause of the increase in spacing between turbines C1 and D3 (14.3 D) in comparison to the spacing between turbine C1 and D1 (7 D).Finally, (d) indicates the number of days used to compute the statistics provided in the top three plots.
completely overlapping. That the banded regions of the two-turbine average contain significant nonoverlapping regionsaround the wake control direction is probably the main posi-tive finding of this paper. It suggests that the power improve-ment is consistent.
Finally, Fig. 6d shows the number of separate days avail-able for computing the data in each bin. It is useful to notethat these do not indicate full days but that some data werecollected on a given day, which was in this direction, and aseparate power curve computed. A value of 10, for exam-ple, indicates that 10 days were used for a given bin for agiven controller (sharing no data points), and these valueswere used to produce the statistics shown in the plot.
In the wind directions in which wake control is not active(to the left and right of the plot), there is no persistent trendbetween the baseline and optimized control on the down-
stream turbine. This is also mostly true where the turbine iswaked by the reference turbine R1 at −47◦. This helps toconfirm that the change observed is caused by wake deflec-tion, rather than a difference in atmosphere between testingperiods being the cause of the underlying changes in wakebehavior. This observation could be made for turbine D2 and80◦ in Fig. 7, when it is waked by turbine O2 (refer to Fig. 2),and turbine D3 at 55◦ in Fig. 8, when it is waked by refer-ence turbine R1. This last case is especially compelling, asthe spacing is 8.5 D, which is similar to the space betweenC1 and D2 and there is a comparable amount of data. How-ever, unlike D1 and D2 when they are behind the controlledturbine C1, there is no improvement in power production.
For the pairing of turbine C1 and D2 in Fig. 7, the spac-ing is now 8.5 D and wake steering is expected to becomemore challenging. Nevertheless, the combination yields an
www.wind-energ-sci.net/2/229/2017/ Wind Energ. Sci., 2, 229–239, 2017

238 P. Fleming et al.: Field test of wake steering at an offshore wind farm
improvement in the main wake direction (50◦) for the down-stream turbine and the two as a pair. When stepping awayfrom the main wake direction of 50◦ in either direction,however, things become ambiguous. To the left, we see theamount of data for the baseline case grows smaller and thespread in results for the downstream turbine D2 grows larger(observing the large gray regions). The power is low despiteno wake (although this is a wind direction in which the inflowto turbine D2 runs in between turbine R1 and turbine C1.)Therefore, it is probable that a lack of data plays a part, andwe would expect little change here. To the right, the trend inpower goes negative for the downstream turbine and the pair.Nevertheless, it should be noted that the spread of results, in-dicated by the bands, is completely overlapping, and so thesignificance of this impact cannot be established.
Finally, observing the results of the turbine C1–D3 pair inFig. 8, at a spacing of 14 D, little improvement is expectedand basically none is observed. It is useful to note that tur-bine D3 has the most data collected and the results seem bestconverged. As noted earlier, when turbine D3 is waked byturbine R1 at 54◦, it is the deeper wake, having a spacingof 8.5 D, and no noticeable change in wake loss occurs (thepower of the downstream turbine is the same in the baselineand optimized cases); this points to wake steering being theprimary cause of change in power for the earlier cases at 7and 8.5 D between the baseline and optimized cases.
Also, it is interesting to consider what is happening west of80◦ for the downstream turbine D3. FLORIS predicts a returnto full power, followed by a dip around 95◦ when turbine O2is upstream. However, what is actually observed is a reduc-tion in power basically across the whole range. ConsideringFig. 2, this is a range of wind direction without an obvioussingle-turbine wake but with four turbines still upstream. No-tice that unlike an explanation of shallower but more spreadloss from wind direction uncertainty, this deficit is deeperthan what is predicted by FLORIS. This deficit speaks to anunmodeled deep array effect that may prove important to in-clude when FLORIS is used to model and design controllersfor multi-turbine arrays.
6 Conclusions and future work
This study provided several encouraging, albeit qualified re-sults. The main result was that for the directions and spac-ings (7 D and 8.5 D) expected to produce an improvementin power for the pair of turbines, such an improvement isobserved. The most easily interpreted results come fromthe closer 7 D spacing, whereas the 8.5 D spacing has somechanges that are partly caused by limited data availability.Another good result was the observed agreement between thelower than expected power loss with yaw function predictedby SOWFA and the loss derived experimentally. This resultis positive because it provides another form of validation forSOWFA (data sets of utility turbines operating misaligned
are not commonly available for testing), and the low powerloss value makes wake steering in general more successful.
In this paper, it was discussed that the primary limitationswere constraints placed on the amount of data that could becollected at a commercial wind farm and constraints placedon the wind turbine yaw controller’s ability to control. In thecase of the pairing with turbine D3, the control and optimalcases are very close in midpoint and range, suggesting that30–40 separate days of testing is a good target per controller.Had it been possible to toggle between control set points, it isvery likely that this number could be reduced although tog-gling creates some issues of transition. On the controller side,it would appear that the implemented controller was suffi-cient to secure power gains; however, it could be that a moreadvanced controller could achieve more.
Also an important concern is the impact this control willhave on turbine loads, both of upstream and downstream tur-bines. This question was outside the scope of the presentcampaign, and the turbine load data were not available forthis joint study. However, there are ongoing research cam-paigns which seek to understand and quantify the impacts toloading. Already published are studies which consider theimpact on loads from operating in yaw using aero-servo-elastic wind turbine models (Zalkind and Pao, 2016) andcomputational fluid dynamics (Schulz et al., 2016). Addi-tionally, there is a currently ongoing field test in which autility-scale wind turbine which is highly instrumented withload sensors is operated intentionally in yaw to assess im-pacts (Fleming et al., 2017). Finally, in order to systemati-cally understand the impact on loads of turbines downstreamfrom wake steering, new engineering tools are being devel-oped, which include mid-fidelity models of wakes, such thatloads can be simulated, but which are computationally in-expensive enough for load suites to be computed (Jonkmanet al., 2017).
More generally, the design of closed-loop control systemsfor wake steering remains an open topic of research. Thepresent method can be regarded as open loop because theactual wake to be controlled is never observed or estimatedby the controller. Research that uses lidar to track and con-trol wakes (Raach et al., 2016) or uses estimation techniques(Doekemeijer, 2016) may very well improve upon these firstresults. This is also the subject of ongoing multiyear researchprojects in the United States (A2e, 2016) and Europe (CL-Windcon, 2016).
Data availability. No data sets were used in this article.
Competing interests. The authors declare that they have no con-flict of interest.
Wind Energ. Sci., 2, 229–239, 2017 www.wind-energ-sci.net/2/229/2017/

P. Fleming et al.: Field test of wake steering at an offshore wind farm 239
Acknowledgements. The authors would like to acknowledge andthank Matthew Churchfield for his support in the use of SOWFAand the development of the simulations. Additionally, the authorsthank Pieter Gebraad for his work on this effort during his tenure atNREL.
The US Government retains, and the publisher, by acceptingthe article for publication, acknowledges that the US Governmentretains, a nonexclusive, paid-up, irrevocable, worldwide license topublish or reproduce the published form of this work or to allowothers to do so, for US Government purposes.
Edited by: S. AubrunReviewed by: two anonymous referees
References
A2e: Atmosphere To Electrons, http://energy.gov/eere/wind/atmosphere-electrons, last access: 15 December 2016.
Campagnolo, F. P., Vlaho Bottasso, C. L., and Croce, A.: Wind tun-nel testing of wake control strategies, in: American Control Con-ference (ACC),
Churchfield, M., Lee, S., Moriarty, P., Martinez, L., Leonardi, S.,Vijayakumar, G., and Brasseur, J.: A large-eddy simulation ofwind-plant aerodynamics, in: 50th AIAA Aerospace SciencesMeeting Including the New Horizons Forum and AerospaceExposition, Nashville, TN, Nashville, Tennessee, USA, 2012.American Automatic Control Council (AACC), 513–518, 2016.
Churchfield, M. and Lee, S.: NWTC Information Portal (SOWFA),https://nwtc.nrel.gov/SOWFA (last access: 1 February 2017),2014.
CL-Windcon: CL-Windcon project kicked-off in Pampolna, http://www.ifb.uni-stuttgart.de/news/CL-Windcon-Kickoff, last ac-cess: 15 December 2016.
Doekemeijer, B. M.: Enhanced Kalman filtering for a 2D CFDNavier-Stokes wind farm model, Ph.D. thesis, Delft Universityof Technology, 2016.
Fleming, P. A., Gebraad, P. M. O., Lee, S., van Wingerden, J. W.,Johnson, K., Churchfield, M., Michalakes, J., Spalart, P., andMoriarty, P.: Simulation comparison of wake mitigation controlstrategies for a two-turbine case, Wind Energy, 18, 2135–2143,2014a.
Fleming, P. A., Gebraad, P. M., Lee, S., van Wingerden, J.-W., Johnson, K., Churchfield, M., Michalakes, J., Spalart, P.,and Moriarty, P.: Evaluating techniques for redirecting tur-bine wakes using {SOWFA}, Renew. Energ., 70, 211–218,doi:10.1016/j.renene.2014.02.015, 2014b.
Fleming, P. A., Ning, A., Gebraad, P. M. O., and Dykes, K.: Windplant system engineering through optimization of layout and yawcontrol, Wind Energy, 19, 329–344, 2015.
Fleming, P., Churchfield, M., Scholbrock, A., Clifton, A., Schreck,S., Johnson, K., Wright, A., Gebraad, P., Annoni, J., Naughton,B., Berg, J., Herges, T., White, J., Mikkelsen, T., Sjoholm,M., and Angelou, N.: Detailed field test of yaw-based wakesteering, J. Phys. Conf. Ser., 753, 052003, doi:10.1088/1742-6596/753/5/052003, 2016.
Fleming, P., Annoni, J., Scholbrock, A., Quon, E., Dana, S.,Schreck, S., Raach, S., Haizmann, F., and Schlipf, D.: Full-ScaleField Test of Wake Steering (Under Review), in: Wake Confer-ence, Visby, Sweden, 2017.
Gaumond, M., Réthoré, P.-E., Ott, S., Peña, A., Bechmann, A., andHansen, K. S.: Evaluation of the wind direction uncertainty andits impact on wake modeling at the Horns Rev offshore windfarm, Wind Energy, 17, 1169–1178, 2013.
Gebraad, P., Teeuwisse, F., van Wingerden, J., Fleming, P., Ruben,S., Marden, J., and Pao, L.: Wind plant power optimizationthrough yaw control using a parametric model for wake effects –a CFD simulation study, Wind Energy, 19, 95–114, 2014.
Gebraad, P., Thomas, J. J., Ning, A., Fleming, P., and Dykes, K.:Maximization of the annual energy production of wind powerplants by optimization of layout and yaw-based wake control,Wind Energy, 20, 97–107, doi:10.1002/we.1993, 2016.
Jensen, N. O.: A note on wind generator interaction, Tech. Rep.Risø-M-2411, Risø National Laboratory, 1984.
Jiménez, Á., Crespo, A., and Migoya, E.: Application of a LES tech-nique to characterize the wake deflection of a wind turbine inyaw, Wind Energy, 13, 559–572, 2010.
Jonkman, J. M. and Buhl Jr., M. L.: FAST Manual User’s Guide,NREL report No. NREL/EL-500-38230, 2005.
Jonkman, J. M., Annoni, J., Hayman, G., Jonkman, B., andPurkayastha, A.: Development of FAST, Farm: A New Multi-Physics Engineering Tool for Wind-Farm Design and Analysis,in: 35th Wind Energy Symposium, 0454, 2017.
Medici, D.: Experimental studies of wind turbine wakes: power op-timisation and meandering, Ph.D. thesis, KTH, Mechanics, qC20101018, 2005.
Raach, S., Schlipf, D., Borisade, F., and Cheng, P. W.: Wake redi-recting using feedback control to improve the power output ofwind farms, in: American Control Conference (ACC), AmericanAutomatic Control Council (AACC), 1387–1392, 2016.
Schottler, J., Hölling, A., Peinke, J., and Hölling, M.: Wind tunneltests on controllable model wind turbines in yaw, in: 34th WindEnergy Symposium, 1523, 2016.
Schulz, C., Letzgus, P., Lutz, T., and Krämer, E.: CFD study onthe impact of yawed inflow on loads, power and near wake of ageneric wind turbine, Wind Energy, 20, 253–268, 2016.
Trujillo, J. J., Seifert, J. K., Würth, I., Schlipf, D., and Kühn,M.: Full-field assessment of wind turbine near-wake deviationin relation to yaw misalignment, Wind Energ. Sci., 1, 41–53,doi:10.5194/wes-1-41-2016, 2016.
Vollmer, L., Steinfeld, G., Heinemann, D., and Kühn, M.: Estimat-ing the wake deflection downstream of a wind turbine in differentatmospheric stabilities: an LES study, Wind Energ. Sci., 1, 129–141, doi:10.5194/wes-1-129-2016, 2016.
Wagenaar, J. W., Machielse, L., and Schepers, J.: Controlling windin ECN’s scaled wind farm, in: EWEA Annual Meeting, Copen-hagen, Denmark, 2012.
Zalkind, D. S. and Pao, L. Y.: The Fatigue Loading Effects ofYaw Control for Wind Plants, in: American Control Conference,Boston, MA, 2016.
www.wind-energ-sci.net/2/229/2017/ Wind Energ. Sci., 2, 229–239, 2017