Embed Size (px)
Citation preview

FIELD TEST OF FORWARD SCATTER VISIBILITY SENSORS AT GERMAN AIRPORTS
Stefan Waas
German Meteorological Service (DWD),
Frahmredder 95, D-22393 Hamburg, Germany
Tel: +49 40 6690-2456
E-mail: [email protected]
Abstract The German Meteorological Service (DWD) plans to replace transmissometers used for visibility measurements at all international airports in Germany. ICAO admits the use of transmissometers as well as forward scatter sensors to measure runway visual range (RVR) [1]. A field test was conducted to gain operational experience with forward scatter sensors and to enable the decision which type of visibility sensor should be acquired.
The field test was accomplished at three international airports using 11 forward scatter sensors in parallel to the operational transmissometers. It covered a time period of 9 months beginning in fall 2006. Results of this comparison are presented.
1. Introduction ‘Skopograph II’ transmissometers presently being used by DWD at the international airports in Ger-many are out of production and spare parts are unavailable. A replacement of these visibility sensors was therefore initiated. ICAO admits the use of forward scatter sensors [1] which are less expensive, easier to install and require less maintenance compared to transmissometers. The Meteorological Optical Range (MOR) in the German observational network is mainly measured by Degreane DF20+ forward scatter sensors. Since this sensor was already available, a ‘RVR task force’ had the mission to conduct a field test to gain operational experience with this type of visibility sensor as an example for the forward scatter measuring principle. The DF20+ used in the observational network had to be modified by the use of a special main board and to be supplemented by an additional ambient light sensor (LU320). The type designation of the modified sensors is ‘DF20+A’. A total of 11 DF20 were used at three airports (Hamburg, Munich and Düsseldorf) where backup transmissometers at the runway thresholds were replaced by DF20+A sen-sors. The DF20 transmits modulated light (f=20Hz) of a white halogen lamp (λ=350-900nm). The receiver measures the part of the light which is scattered from a volume of ~10 liters within 20° to 50° toward s the receiver head (see [3] for details). The forward scatter coefficient is then used to calculate the MOR values which are averaged over 1 minute. Special converters were used to convert the DF20 telegrams which into the Skopograph format. In this way the present DWD data acquisition system (‘ASDUV’) could be used without change.

Fig. 1: DF20+A with ambient light sensor (LU320).
Fig. 2: Skopograph II transmissometers and DF20+A for-ward scatter sensor at Hamburg airport.
2. Reference-Data The operational ‘Skopograph II’ transmissometers with double baseline of 15 m and 50 m were used as a reference for the MOR measurements (see Fig. 2 and [7]). They are in operation in Germany for about 20 years. The transmissometers use the light of a Xenon flash light to determine the transmis-sion and to calculate the MOR. The measuring range of the instruments is from 7.5 m to 2 km; averag-ing time is 1 min. They are cleaned about once a week (or more if necessary) and calibrated about every six weeks during regular maintenance. A big disadvantage of the Skopograph II transmissometers is that transmission readings are not cor-rected automatically for contaminations (as with modern transmissometers). For that reason the con-tamination accumulated during precipitation events, especially when aircraft turbine engines blew droplets and dust particles away from the runways towards the sensors. This reduced the transmission values continuously between the regular cleaning of the optical parts of the sensors. It resulted in par-ticular in a problem with MOR values above 1000 m; below 200 m - 300 m almost no influence was noticeable.
3. Measurements All data used for the comparison had to be validated by an operator. The operator sorted out all time sequences were one of the sensors could not be used due to contamination, problems with the data transmission or other technical reasons. The data was used only when homogenous meteorological conditions (homogeneous MOR values) were determined: within a time period of 10 min. ahead of the measured value the fluctuation range had to be less than ±20% from the mean value for both of the sensors (see also [5]).
The sensors at positions ‘Echo’ and ‘Hotel’ at Munich airport were used for the evaluation. ‘Echo’ was used to compare two transmissometers. It could be demonstrated that even two reference systems of one kind can differ due to natural local variability and special properties of these sensors. The distance between the different sensors was about 30 m, the distance to the runways about 150 m.

4. Results The following pages show some exemplary results of the comparison. Each of the figures consists of four diagrams and two tables: On the left hand you find a) the comparison between a transmissometer and b) a DF20 and two transmissometers. In the left half of the diagrams time series of the two pairs of sensors (transmis-someter/transmissometer, transmisssometer/DF20) are plotted in magenta and blue.
Homogenous periods (variation of MOR <± 20% from mean value) marked by green dots. In the upper diagram present weather is marked by blue dots (ww4677 code; 40s: fog, 50s: drizzle, 60s: rain, 70s: snow); in the lower diagram (also blue dots): visibility determined by an observer (limited to 10000 m).
On the right hand two scatter plots are presented, where the measurements of both sensors are plot-ted against each other (identical values would be on the black diagonal, ±20% deviation shown as red lines). Homogenous conditions are plotted with green dots (analogue to the figure on the left side).
The tables on the bottom compare, which IFR category would have been proposed by the two sensors (only homogenous conditions were used). Shown is the number of cases of each class.
Indicated are the categories of instrument flight approaches CAT1, II, IIIa, IIIb, IIIc (according to the table below) and virtual CAT “0” (1550m < MOR < 2000, and MOR >= 2000m). ‘Green’ means agree-ment of the sensors, ‘orange’ disagreement of one step, and ‘red’ two or more steps difference.
Categories of precision approach and landing operations: CAT I CAT II CAT IIIA CAT IIIB CAT IIIC
Decision Height
>60 m (200 ft) <60 m (200 ft) >30 m (100 ft)
<30 m (100 ft) <15 m (50 ft) No limitations
RVR > 550 m > 350 m > 200 m < 200 m > 50 m
No limitations
RVR Range 550 - 1500 350 – 550 200 - 350 50 – 200 0 – 50
Visibility > 800 m
Table 1: Categories of Instrument Approach Procedures according to ICAO [10].

Fig. 3: EDDM, Echo & Hotel, 2.12.2006 Example for good agreement of both transmissometer pairs in good maintenance condition. Homoge-nous events (green dots) are close to the diagonal, nearly all the rest lies within the ±20%-intervall. Observers (blue dots) estimate higher visibility values (6-9 UTC, 19-22 UTC)

Fig. 4: EDDM, Echo & Hotel, 26.12.2006 Example for large variation of both transmissometer pairs. Transmissometer H1 with some contamina-tion results in lower MOR as H2 at values above 1000m. Homogenous events (green) are close to the diagonal. In this case, observers estimate lower visibility values as measured with transmissometers.

Fig. 5: EDDM, Echo & Hotel (now with DF20 in lower plot); 16.01.2006 Long duration of fog with good agreement of transmissometer H1 and DF20 H2, especially at ho-mogenous events (green). Observers estimate considerably higher visibility values as the ones meas-ured by the sensors.

Fig. 6 EDDM, Echo & Hotel (DF20 in lower plot), 23.01.2006 Snow fall, starting at 2:00 UTC (ww: 71-73). Contamination of Transmissometer H1 clearly visible (typically identifiable by the bent green curve)

Fig. 7: EDDM, Echo & Hotel; 24.01.2006 Heavy contamination of all transmissometers during snow fall resulting in strong disagreement even between the two transmissometers.

Fig. 8 EDDM, Echo & Hotel; 29.01. & 23.3.2007, Influence of the cleaning of the transmissometers (peaks downwards).

Fig. 9: EDDM, Echo & Hotel, 24.3.2007 Heavy snowing from 3:00 to 7:00 UTC. Transmissometer H1 contaminated. Very good agreement of transmissometer E1 and E2. Visibilities of observers are higher then measured values (2000m and more).
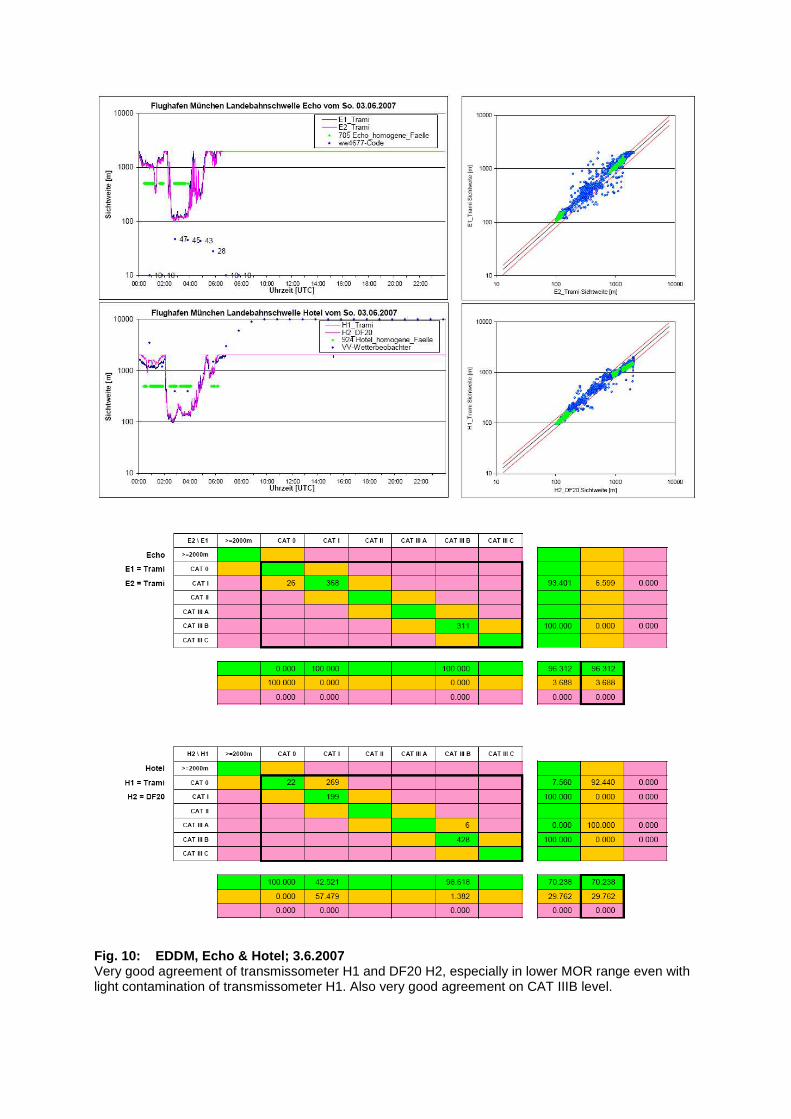
Fig. 10: EDDM, Echo & Hotel; 3.6.2007 Very good agreement of transmissometer H1 and DF20 H2, especially in lower MOR range even with light contamination of transmissometer H1. Also very good agreement on CAT IIIB level.

Fig. 11: EDDM, Echo & Hotel; 18.8.2007 Example for very inhomogeneous MOR-values with high variability. Homogenous events agree very well, especially CAT IIIB levels.

Fig. 12: EDDM, Echo & Hotel, 4.10.2007 Example for MOR values below 100m, very good agreement of Transmissometer H1 and DF20 H2, perfect agreement on CAT IIIb level.

Fig. 13: EDDM, Echo & Hotel, 10.10.2007 Additional example for MOR values below 100m; transmissometer H1 and DF20 H2 agree very well during homogenous conditions. Noticeable is the strong variation during non-homogenous events (blue dots).

Fig. 14: EDDM, Echo & Hotel, 12.10.2007 Example for good agreement of indicated values in upper MOR range (800m – 2000m).

5. Conclusions
� In general, measurements of forward scatter sensors and transmissometers match very well in homogenous visibility conditions, especially at visibilities below 1000m which are most rele-vant for IFR approaches.
� During inhomogeneous visibility conditions even transmissometers can differ very strongly in direct comparison to each other.
� During rainfall events, both techniques agree quite well, although the measured values are lower than the visibility determined by an observer.
� In drizzle, forward scatter sensors tend to lower MOR values compared to transmissometers (which is the safe direction). (The reason might be the limited efficiency of the filter algorithm.)
� Snow: due to the few events during the winter season 2006/2007and long periods with con-tamination during the few snowing events a reliable statistical conclusion can not be drawn. Remark: transmissometers show considerable lower values compared to the ones determined by observers; DF20 values are higher and closer to the observed values.
� Differences at MOR above 1000m are normally caused by contamination of the transmisso-meters.
� CAT levels (for IFR approaches) determined by MOR values of the different sensors agree very well with both techniques.
� MOR values of the DF20s that were obviously too low during bright sunshine and high wind speeds were caused by moving weeds (blades of grass). (According to the manufacturer this has been improved by a firmware update.)
� Operational problems were mainly caused by difficulties with data transmission (partly due to lightning).
� For calibration of forward scatter sensors it is necessary to use a modern transmissometer with auto-correction of contamination. “Skopograph II” transmissometers are not appropriate for that purpose.
� The results of this test confirm the experience and findings of tests conducted by other mete-orological services as well as the ICAO recommendation:
Forward scatter sensors are technically capable to be used to measure MOR respec-tively RVR.
Acknowledgments The author would like to thank Manfred Theel, Rainer Jordan and Joachim Langosch for their valuable contribution to this work.

References
[1] ICAO, Annex 3 to the Convention on International Civil Aviation, Fifteenth Edition, July 2004
[2] Manual of Runway Visual Range Observing and Reporting Practices, ICAO Doc. 9328-AN/908, 2nd Edition 2000
[3] User Manual DF20+, Degreane Horizon, 2007-10-25
[4] Jitze van der Meulen, Visibility Measuring Instruments: Differences between Scatterometers and Transmissometers, Instruments and Observing Methods, Report No.49 (WMO/TD - No.462), WMO Technical Conference on Instruments and Methods of Observation, "TECO-92" (Vienna, Austria, 11-15 May 1992
[5] Hannelore I. Bloemink, KNMI, Visibility Standard for Calibration of Scatterometers
[6] The First WMO Intercomparison of Visibility Measurements, Final Report, Instruments and Observing Methods Report No. 41 (1990, WMO/TD - No. 401)
[7] User Manual Skopograph II Flamingo; Impulsphysik, 1997
[8] European Guidance Material on Aerodrome Operations Under Limited Visibility Conditions, ICAO EUR Doc 013, Second Edition: April 2005