Embed Size (px)
Citation preview
- -
3 4~ .4::»"
Earth Pressures and Retaining Structures
FIELD STUDY OFSURCHARGE EFFECTS
ON A STEEL SHEETPILE BULKHEAD
byThomas D. Dismuke
December 1968
Fritz Engineering Laboratory Report No. 342.4
Earth Pressures and Retaining Structures
FIELD STUDY OF SURCHARGE EFFECTS
ON A STEEL SHEET PILE BULKHEAD
by
Thomas D. Dismuke
This work was carried out as part of an investigationon the performance of steel sheet pi 1e bulkheads for the BethlehemSteel Corporation.
Fritz Engineering LaboratoryDepartment of Civil Engineering
Lehigh UniversityBethlehem, Pennsylvania
December 1968
Fritz Engineering Laboratory Report No. 34204
i i
TABLE OF CONTENTS
2.1.1 Site Conditions
1.3 Experimental and Theoretical Procedure
WHARF DESIGN, CONSTRUCTION AND INSTRUMENTATION
2.1 Wharf Design •••••
ABS TRACT . • . • • • . . . . • . • . •
INTRODUCTION .•••
1.1 Objective and Scope of Program
1.2 Methods of Bulkhead Design
2.1.2 Wharf Geometry. •• . •••••.
2.1.3 Loading on Wharf .•••••• 0 ••••••
2.2 Wharf Construction ••.••. • •••
2
2
2
3
5
5
5
6
6
7
7
7
8
8
9
10
10
12
12
12
12
13
14
14
Procedure
P i 1e 0r i vi ng •
Instrumentation •.
2.2. 1
2.2.2
2.3.1 Phi losophy •.•••.
2.3.2 Strain Gages •••••
2.3.3 Slope Indicators.
2.304 Surcharge Pressure Gages •
EXPERIMENTAL RESULTS ••.•
3.1 Post Driving Stresses.
3.2 Lateral Loading
3.20 1 Backfill
302.2 Surcharge
303 Wharf Movement 0 •••
3.4 Surcharge Measurements
2.3
I I I •
I I •
I •
IV.
TABLE OF CONTENTS
(cont1d)
ANALYSIS AND DISCUSSION OF RESULTS. 15
iii
4.1 Comparison of Experimental andTheoretical Results •••••• 15
VI.
VI I.
VIII.
IX.
x.
4.2 Slope Indicator Well Movementat Elevation +10.8
4 .3 Pos tOr i v i n9 S t res 5 es • .' • • • •
4.4 Discussion of Experimental Data Results.
4.4.1 SR4 Gages
4.4.2 Slope Indicator
4.4.3 Surcharge Pressure Gages •
4.4.4 Ground Control
SUMMARY AND CONCLUSIONS.
NOMENCLATURE •
APPENDIX ••
TABLES AND FIGURES •
REFERENCES
ACKNOWLEDGMENTS
18
19
19
19
20
21
21
22
24
25
31
S3
56
iv
LIST OF FIGURES
FigureNo. Title
Soil Profile on Bulkhead Centerline
2 Plan of Coal Field Extension
3 Elevation of Coal Field Wharf
4 Theoretical Loads and Moments for Bulkhead
5 Construction Sequence
6 Completed Wharf and Coal Field
7 SR4 External Bridge on Flange of ZP 38 Sheet Piling
8 Waterproofing of SR4 Gages
9 Clamped, Shielded SR4 Gage Lead Wires and Protective Channel
10 Channels Over SR4 Gages and Slope Indicator Pipe at Bottomof Instrumented Sheet Pi ling
11 Slope Indicator Equipment
12 Location of Instrumentation on Sheet Piling
13 Location of Surcharge Pressure Gages
14 Axial Loads and Bending Moments in Sheet Piling at Bent 18After Driving
15 Horizontal Component of Batter Pile Loads at 26E and 26wSheet Piling
16 Deflection of ZP 38 Sheet Piling at Bent 18 After Backfil11ngand Surcharging
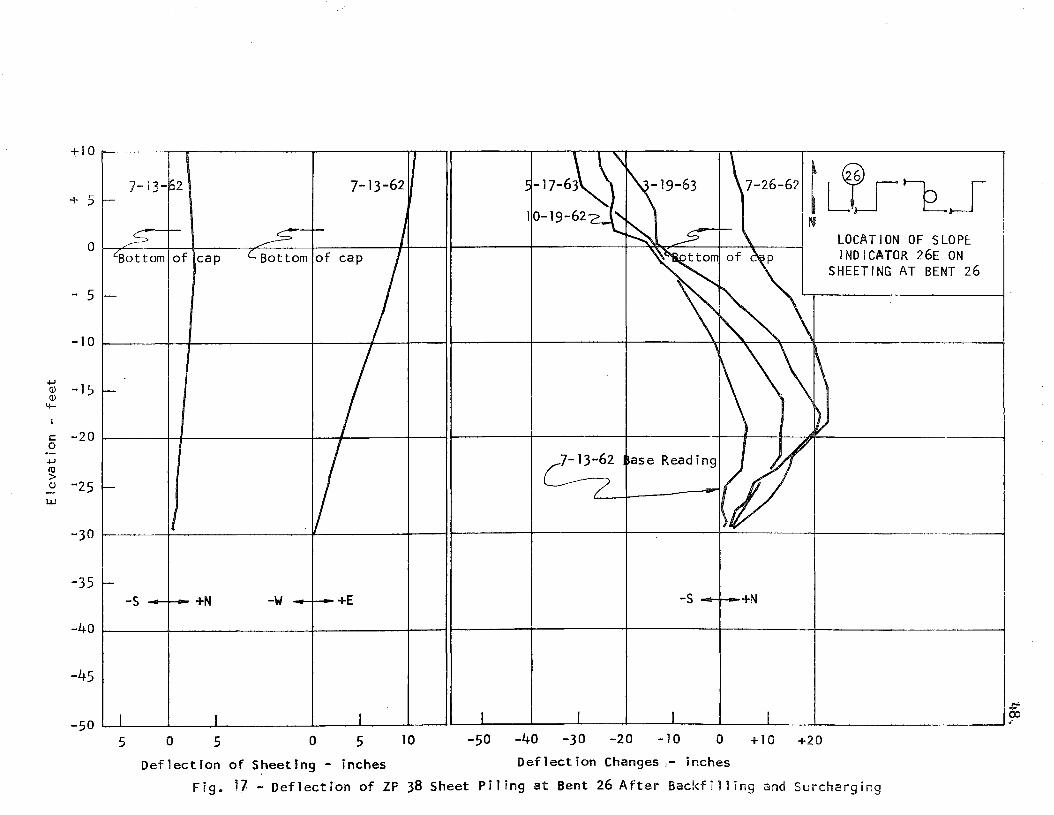
17 Deflection of ZP 38 Sheet Piling at Bent 26 After Backfillingand Surcharging (Slope Indicator 26E)
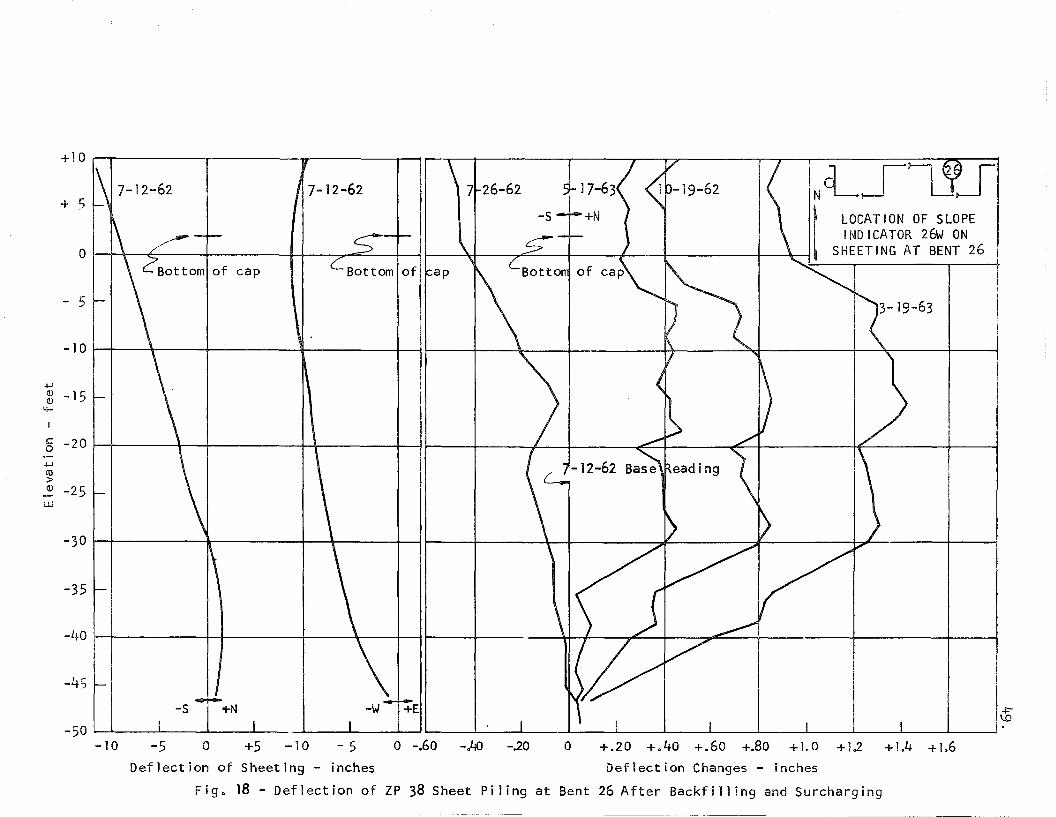
18 Deflection of ZP 38 Sheet Piling at Bent 26 After Backfillingand Surcharging (Slope Indicator 26W)
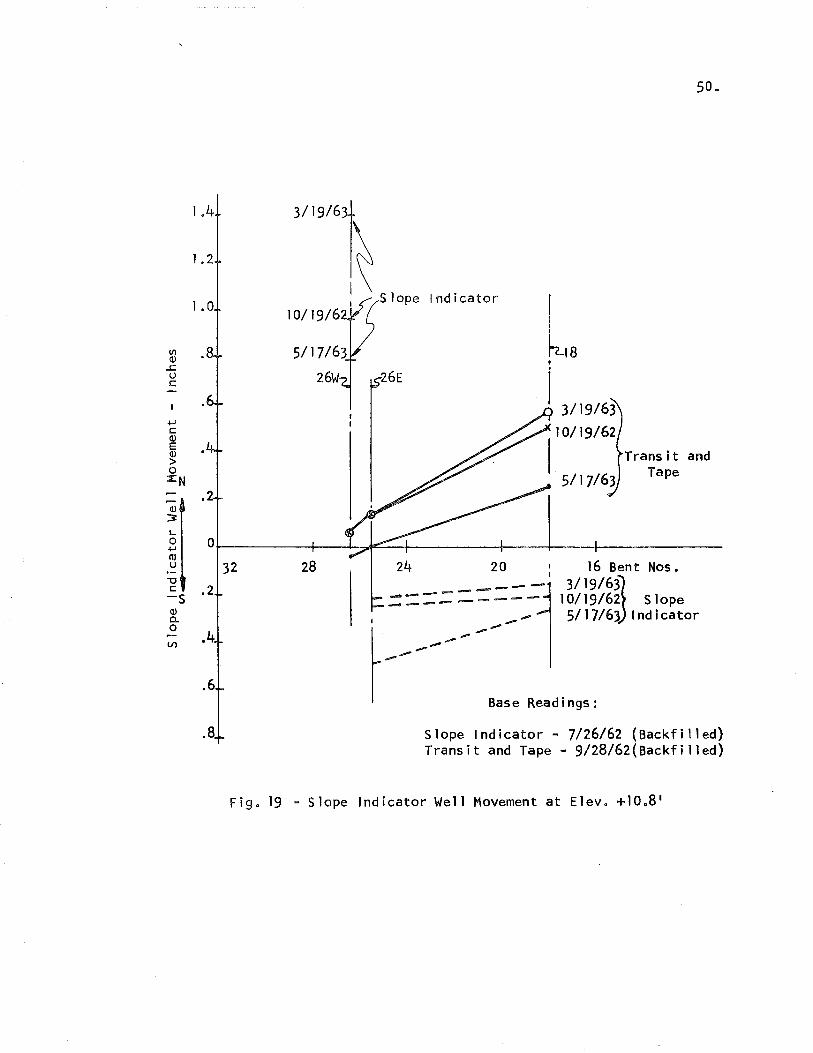
19 Slope Indicator Well Movement at Elev. +10.8 1
20 Diagrams Showing Results of Backfilling ZP 38 Sheet Pilingat Bent 18
21 Diagrams Showing Results of Surcharging ZP 38 Sheet Pilingat Bent 18
v
LIST OF TABLES
TableNo.
Theoretical and Experimental Maximum Bulkhead Moments BelowCap and Anchor Loads
2 stress Change on South Flange of ZP 38 Sheet Piling atElev. -45.0·, Bent 18
FIELD STUDY OF SURCHARGE EFFECTS
ON A STEEL SHEET PILE BULKHEAD
by
Thomas D. Dismuke*
ABSTRACT
This paper presents the results and analysis of a field study
conducted to determine surcharge effects on a steel sheet pile bulkhead.
Slope indicator and strain gage data were used to determine the loads,
shears, moments and deflections at one instrumented pile location. These
results are compared to the results of theoretical calculations.
Field information was obtained through the use of strain gages,
slope indicators and transit and tape surveys. The performance and
accuracy of the instrumentation and data are reviewed with respect to
the effect on the results.
Large axial loads and moments which developed on one of the
instrumented sheet piling due to driving into soil were observed.
The development of soil arching or other means of reducing load
on the bulkhead was evident.
It is concluded that the effects of wall friction should be
included when flexible bulkheads with granular surcharges are designed.
In addition, this study corroborated the results of previous field studies
with respect to observed moment reduction (compared to the theoretical)
for bulkheads when normally loaded by backfilling.
*Engineer, Product Development, Engineering Department, Bethlehem SteelCorporation, Bethlehem, Pennsylvania
2 •
I. INTRODUCTION
1.1 Objective and Scope of Program
The objective of the test program was to determine the effect
of surcharge on a steel sheet piling bulkhead. In recent years, a number
of prototype steel sheet pi ling bulkheads have been instrumented (1, 2, 5,
6, 23, 25, 26). In addition, a number of model and theoretical studies
have been made in order to develop realistic design methods for bulkheads
(3,4,12,13,14,16,17,19,20,21,22,24). These tests and studies
have produced much valuable information and serious attempts to develop
better design criteria and methods have resulted; however, there is 1itt1e
field information on the effect of surcharge on flexible bulkheads.
The scope of this investigation, while primarily intended
to determine surcharge effects on the bulkhead, includes results of back
fill ing the bulkhead prior to placing the surcharge.
1.2 Methods of Bulkhead Design
Common design methods in general use in this country include
free earth support, fixed earth support, equivalent beam and Tschebotari
offls modification of the equi~alent beam. The free earth support method
has been modified and updated by using Rowels flexibility procedure. In
all of these methods the pressure against the bulkhead is usually
calculated by the classical Rankine-Coulomb methods. Lateral bulkhead
pressure due to surface loads other than bulk materials are generally
calculated by Spanglerls adaptation of the Boussinesq formula (18) 0
Rowels flexibility method of bulkhead design gives results
similar to those developed by Tschebotarioffls method when steel sheet
pi 1e bulkheads are used. For stiff bulkheads, such as those made of
3~
concrete, Rowels method gives more conservative results.
Subgrade reaction methods (10, 11, 15, 27) of analysis have been
proposed and appear to more nearly reflect the effect of the loads on
bulkheads, but the difficulty in using these methods lies in the task of
defining soil response from existing soil test data.
Many bulkheads have been greatly overloaded (as defined by exist
ing design and analytical methods) principally by surface surcharges such
as iron are and other bulk materials (8). No bending failures due to
overloading of steel sheet piling bulkheads have been reported. Therefore,
it is evident that the computations of bulkhead loads and bending stresses
(not anchor loads) due to any cause by existing methods are conservative.
l.3 Experimental and Theoretical Procedure
There are several methods by which the effects of surcharge on
bulkheads may be determined experimentally. These include direct methods
such as placing pressure cells at the soil-bulkhead interface and/or
indirect methods such as measuring sheet piling strain or curvature (slope)
changes. The reliability of strain and slope change measurements appeared
better than other types of measurements. The experimental procedure con
sisted of attaching strain measuring devices and receptacles for inserting
slope measuring devices to the sheet piling before the piling was driven,
establishing instrumentation zeros, and taking measurements of the strain
and slope changes, after placement, due to surcharge changes.
The theoretical procedure for finding the pressure was to deter
mine moments from slope changes, shears from the change of moment between
two points and pressures by the change in shear between two points. In
addition, differentiation was used for checking the above by taking

4.
successive slopes of the moment distribution curve. which are ordinates
of the shear curve, and so on to the pressure curve. These pressure curves
are then compared with the theoretical bulkhead pressures imposed by the
surcharges.
5.
11.. WHARF DESIGN, CONSTRUCTIO~ AND ~NSTRUMEN7AT~ON
2.1 Wharf Design
The bulkhead on which the test program was conducted was the
450-ft extension to the existing coal field wharf at the Sparrows Point
Plant of Bethlehem Steel Corporation. The plant is located on the upper
reaches of Chesapeake Bay. Construction of the wharf started in January
1962 and was completed in October 1962.
The coal wharf is used for receiving and storing coal. Coal is
brought in on barges and unloaded by anyone of three bridges. A conveyor
also runs on that portion of the wharf immediately behind the bridge rails.
2.1.1 Site Conditions
The site is sheltered and has a normal tidal variation of 1.5
feet. At times, weather conditions have raised the height of the
water to +7.0 feet and lowered i,t to -4.0 feet. From 1935 to date
the lowest water elevation has been -2.0 feet. The normal mean low
water level is -1.5 feet.
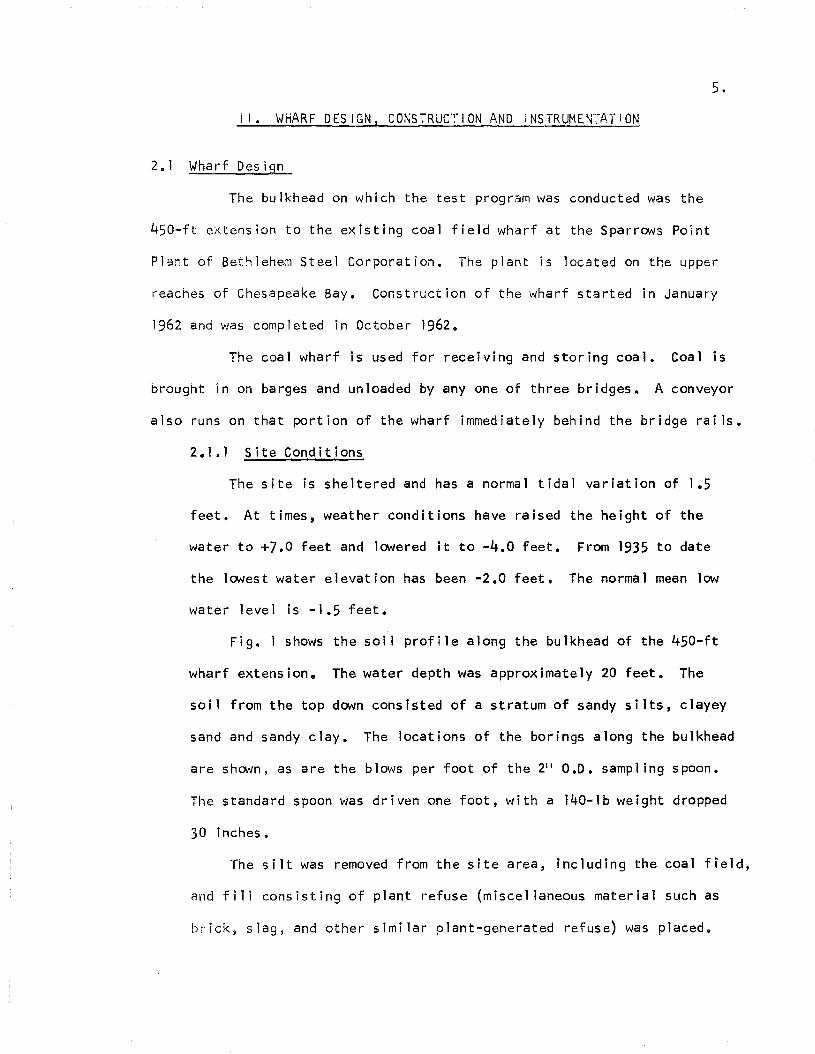
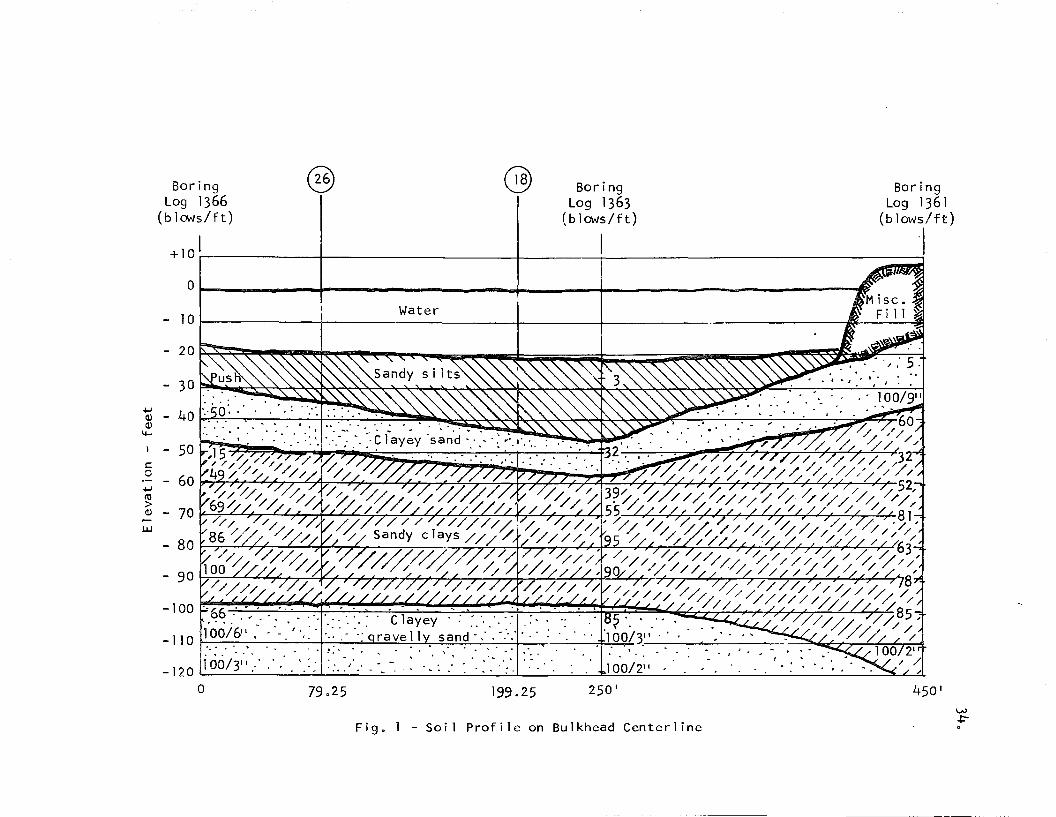
Fig. 1 shows the soil profile along the bulkhead of the 4S0-ft
wharf extension. The water depth was approximately 20 feet. The
soil from the top down consisted of a stratum of sandy silts, clayey
sand and sandy clay. The lbcations of the borings along the bulkhead
are shown, as are the blows per foot of the 21f 0.0. samplihg spoon.
The standard spoon was driven one foot, with a l40-1b weight dropped
30 inches.
The silt was removed from the site area, includ'ing the coal field,
and fill consisting of plant refuse (miscellaneous material such as
brick, slag, and other similar plant-generated refuse) was placed.
No organic materf21 is mixed with the refuse. Dry weight of the
plant refuse is approximately 120 pcf.
W{th the exception of the si It, the soi 1 is dense and soil
conditions are excellent for bulkhead construction.
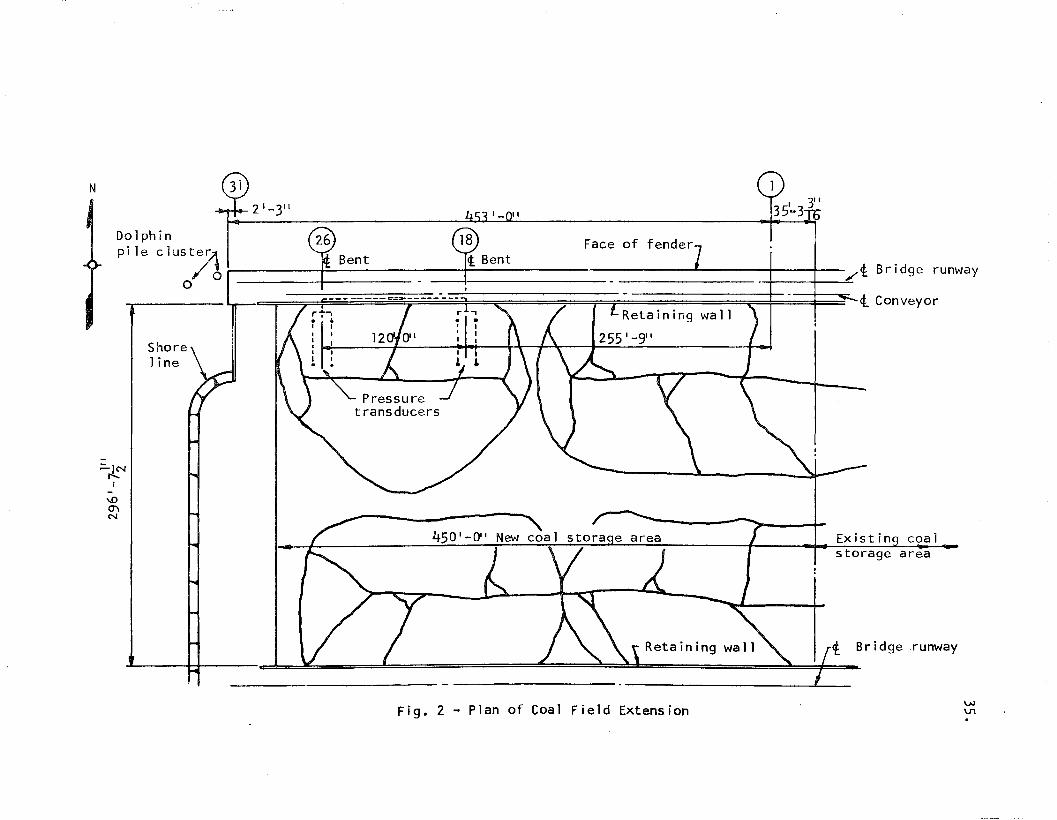
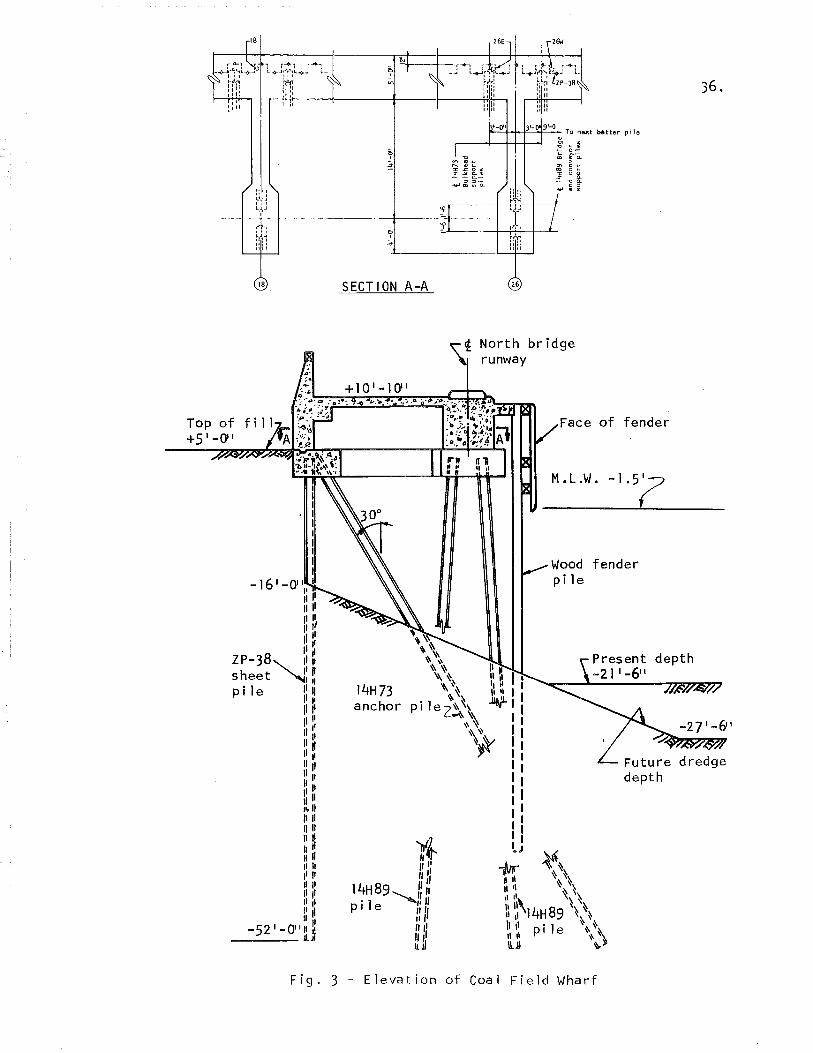
2.1.2 Wharf Geometry
Figu~es 2 and 3 show the plan and elevation of the coal field
and wharf. The sheet piling serves as a cut~off wall behind the
batter- and coal-bridge~support piling.
This type of wharf was used so that the support system could be
placed in front of the sheet piling rather than in the coal field
where bridge buckets may damage tie-backs.
The original portion of the wharf was constructed of concrete
sheeting and tie-backs. The sheeting was placed immediately behind
the fender system.
Since barges are constantly increasing in size consequently
drawing more water the wharf was designed to handle barges drawing
25 feet. The soil in front of the piling would then have to be
dredged to -27.5 feet, but for the present the dredged depth is
limited to -21.5 feet.
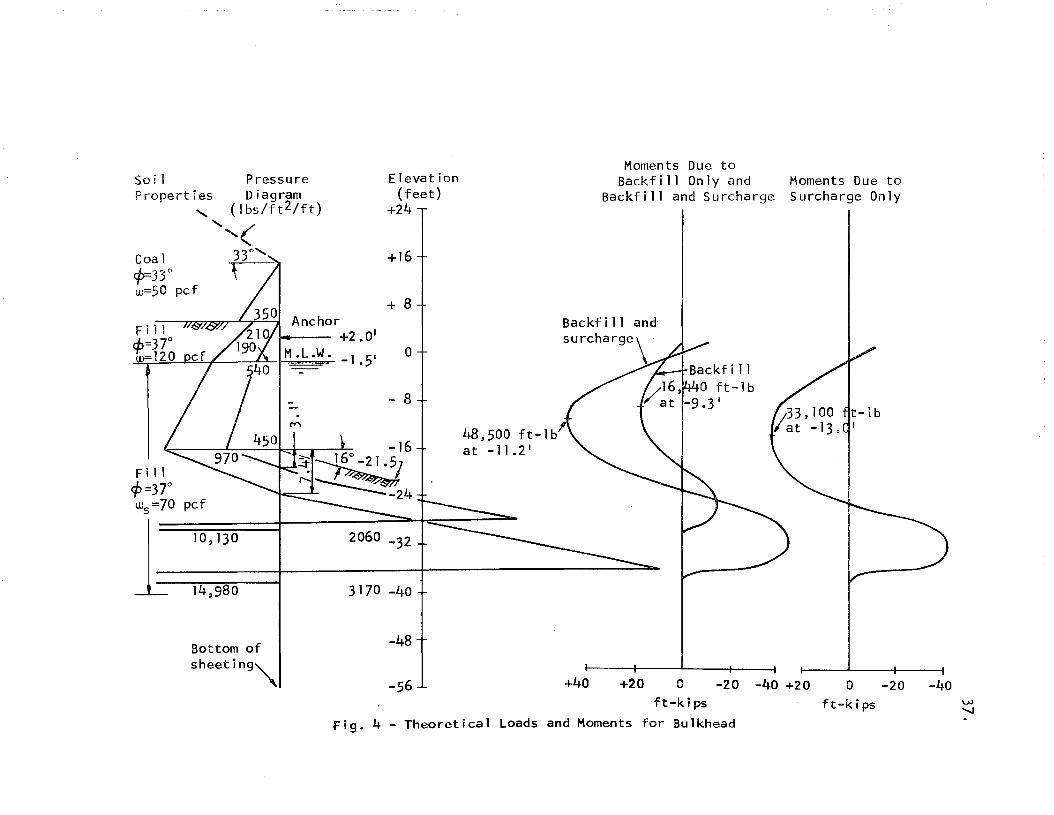
2.1.3 Loading on Wharf
Figure 4 shows the estimated loads applied to the bulkhead.
Moments for the backfilled and surcharged conditions for a dredged
depth of -21.5 feet are also showne The fixed earth support method
was used in the calculations.
A comparison of the support load, maximum moment, and location
of the maximum moment below the support are given in Table 1 for the
7.
several design methods.
2.2 Wharf Construction
2.2.1 Procedure
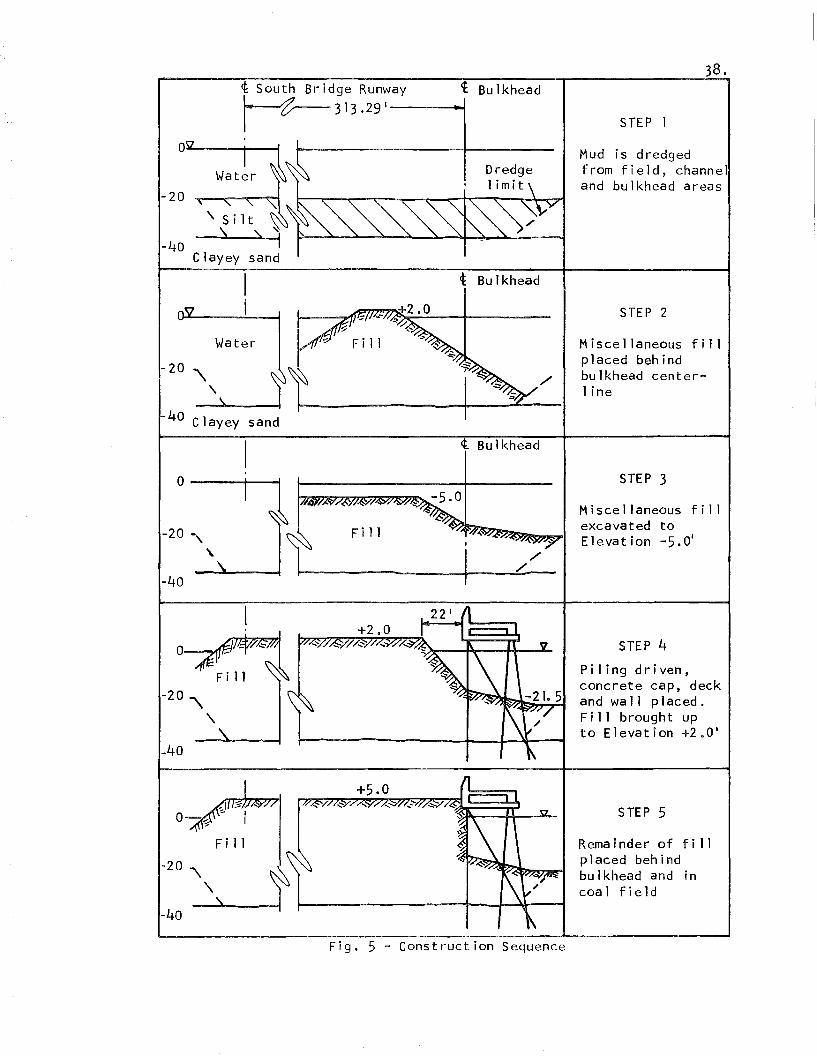
The construction procedure consisted of five steps. The first
step was to dredge the area of the soft, silty material in the
channel as well as in the coal field area. The second step consisted
of making a fill behind the bulkhead to an elevation of +2.0 feet,
using miscellaneous fill. This fill was constructed by trucks. The
third step consisted of removing the top of the fill by dragline to
an elevation of -5.0 feet so that a floating pile rig could operate
immediately behind the bulkhead in order to drive the piling. The
fourth phase consisted of driving the piling and applying the concrete
cap and deck. The fifth step included the placing of fill behind the
bulkhead after completion of the concrete work. While the fourth
phase was in progress, the remainder of the coal field was being
filled to Elevation +5.0 feet, the elevation for the coal field.
Fig. 5 shows the sequence of steps at Bent 18. Fig. 6 shows the
wharf after completion of construction.
2.2.2 Pile Driving
Pile driving started from the end of the existing wharf and
progressed outward. Driving records of the ZP 38 paired sheet piling
show that the number of blows per last foot of penetration varied from
48 to 250 using a McKiernan-Terry 1183 hammer, and from 40 to 70
using the Vulcan 0 hammer. The instrumented piling was driven by the
Vulcan 0 hammer. The resistance to driving of the instrumented
sheeting and H-pi ling indicated that all of the penetrated soi 1 was
dense and afforded excellent support for the wharf structure.
8.
2.3 Instrumentation
2.3.1 Philosophy
The number of measurable quantities in this particular field
study is quite large. These include surcharge (horizontal) pressure,
pore, intergranular and total soil pressures, bulkhead pressures,
movement, strain (stresses) and shape, batter pile strains, etc. All
of the above measurements involve the determination of a change in
length and may be measured by various transducers. Many existing
transducers are not suitable for use in a soil-water environment.
This is usually due to the .fact that most transducers or connections
are not adequately constructed to be protected from physical damage
such as may occur during pile driving or from short-circuiting and/or
disbanding when immersed in water.
For this study it was decided that minor emphasis should be
placed on direct measurements in the soil phase of the 2-phase system.
Redundancy of measurement systems on the sheet pile bulkhead was
desirable as other investigators had experienced difficulties with
SR4 gages.
A study of this type necessarily involves the time factor. Sur
charge changes result in changes in bulkhead configurations. Since
these changes can occur over short periods (hours) or many days, daily
manual or, preferably, automatic recording of data is desirable.
The placement of the transducers influences the accuracy of the
results as well as the length of time the instrumentation is effective.
Whenever possible, the strain gages were placed above the water lineo
9 ·
2.3.2 Strain Gages
SR4 gages were mounted on the flanges of three ZP 38 sheet
piling as shown in Figs. 7 and 8. An external bridge at each point
of measurement was formed so as to eliminate the effect of the
shielded lead wire resistance. Similar gage configurations were
installed on the two anchor H-piling on either side of the instru
mented sheet piling and the bridge support piling.
The number and location of the SR4 gages would permit recording
of adequate data from which the axial and bending stresses in the
H-pi ling could be determined. This information could then be used
to establish indirectly the intensity and distribution of the lateral
loads on the sheet piling caused by the coal field surcharge.
Calibration of the SR4 gages on the sheet piling was accomplished
by interlocking two ZP 38 sections together and forming a simple beam
by placing them horizontally on two wood supports. Known loads were
placed at the centerline of the span and strain readings were taken.
A return to the initial strain reading was accomplished after several
loading cycles.
The SR4 gages for the H-piling were installed on short sections.
These sections were then spliced to the H-piling when they were very
close to the termination of driving~ Following the splicing of the
short instrumented sections, the H-pi ling was driven several feet
to complete the driving.
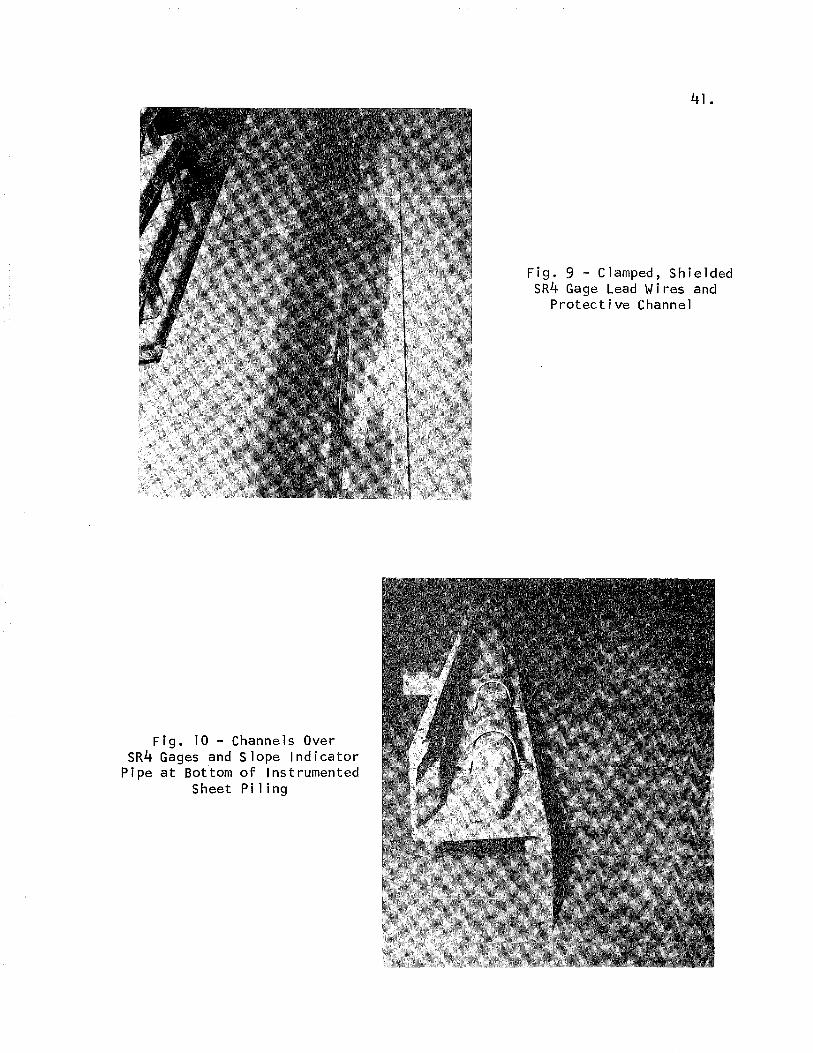
Details of the shielded SR4 gage lead wires and protective
channel are shown in Figo 90 The severe conditions, driving and water
immersion, which the SR4 gages were subjected to dictated the care
used for installation of the gages 0
10.
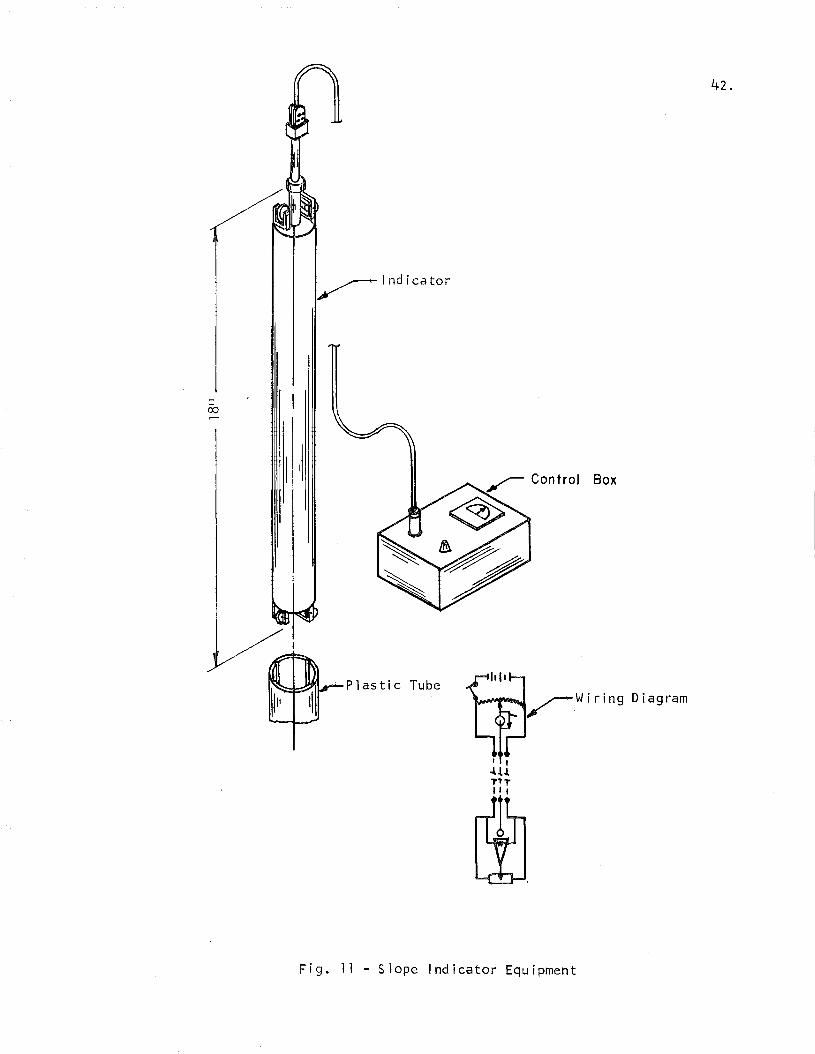
2.3-3 Slope Indicators
The Wilson slope indicator as shown in Fig. 11 has been described
in the literature but will also be briefly described here. It is a
device to determine the slope of a member for a standard length
element. An internal pendulum swings along a calibrated resistance
which is one arm of a Wheatstone bridge. The maximum angle from
vertical position that the model used in this investigation could
make is 8 degrees. A plastic tube with 4 grooves spaced at 90° in
the tube interior was placed in the steel pipe after the sheet
piling was driven and the concrete cap placed. Sand was vibrated into
the annular space between the plastic tube and steel pipe.
The grooves in the plastic tube guide the slope indicator wheels
(180° apart) and are so oriented that one set of grooves is parallel
to the bulkhead line and the other set perpendicular. As the pendulum
swings in line with the guide wheels, the perpendicular and parallel
profiles of the sheet piling may be determined when the slope indicator
is used in both sets of guide grooves.
Slope indicator pipes were fastened at the neutral axis of the
same sheet piling to which SR4 gages were attached. Figs. 10 and 12
show the details of the installation.
The slope indicator is a rugged instrument and is well suited for
its purpose. Since its operation is manual, the cost of using the
instrument is higher than an electrical type of transducer which can
have various types of automatic recording devices attached to it.
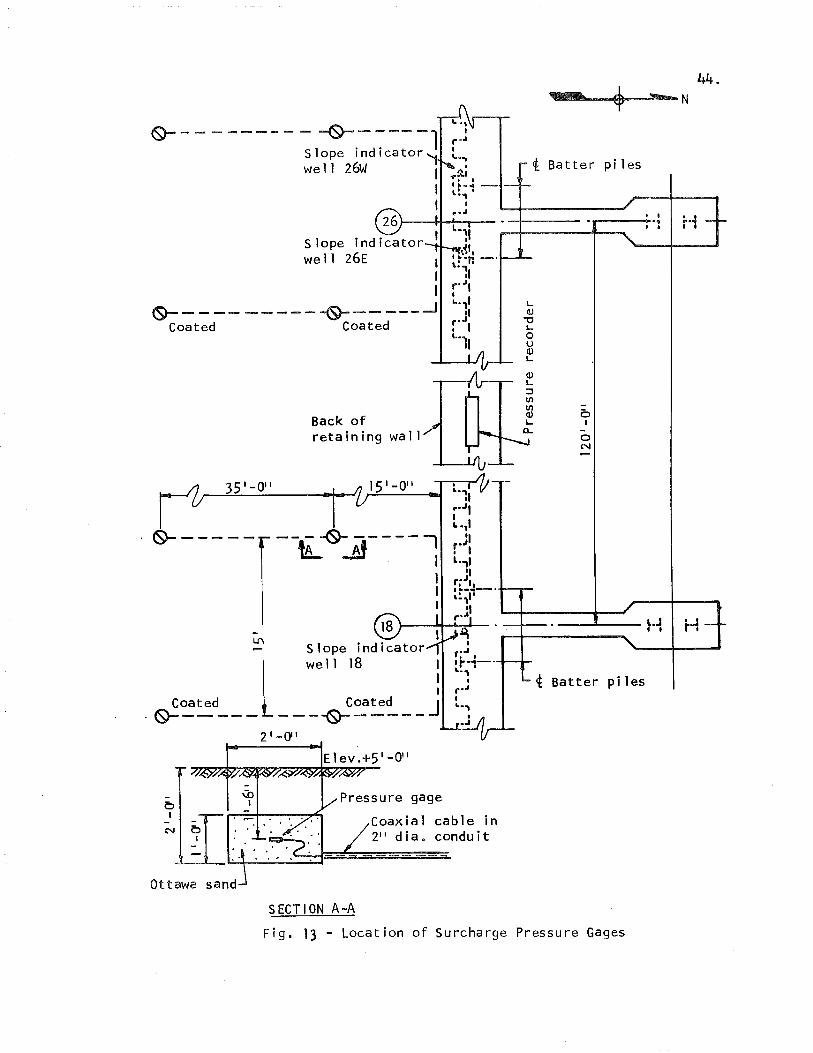
2.3.4 Surcharge Pressure Gages
Pressure gages were placed at several locations in the coal field
behind the instrumented piling as shown in Fig. 13. These gages were
11 •
to be used to determine the vertical surcharge pressures. The equip
ment consisted of small capacitor type transducers, oscillator, bridge
detector and amplifier. A recorder was connected to the indicating
equipment using a stepping .relay, 4-pole, IO-position round and round.
type with timer for sequentially selecting each channel.
A deVice for recording the surcharge pressure was particularly
desirable since coal is transferred in and out of the field on a
continuous basis. At times, particular piles of coal were not touched
for several days or more, but the amount and location of coal and
time of movement are neither predetermined nor recorded.
12.
I I I. EXPERIMENTAL RESULTS
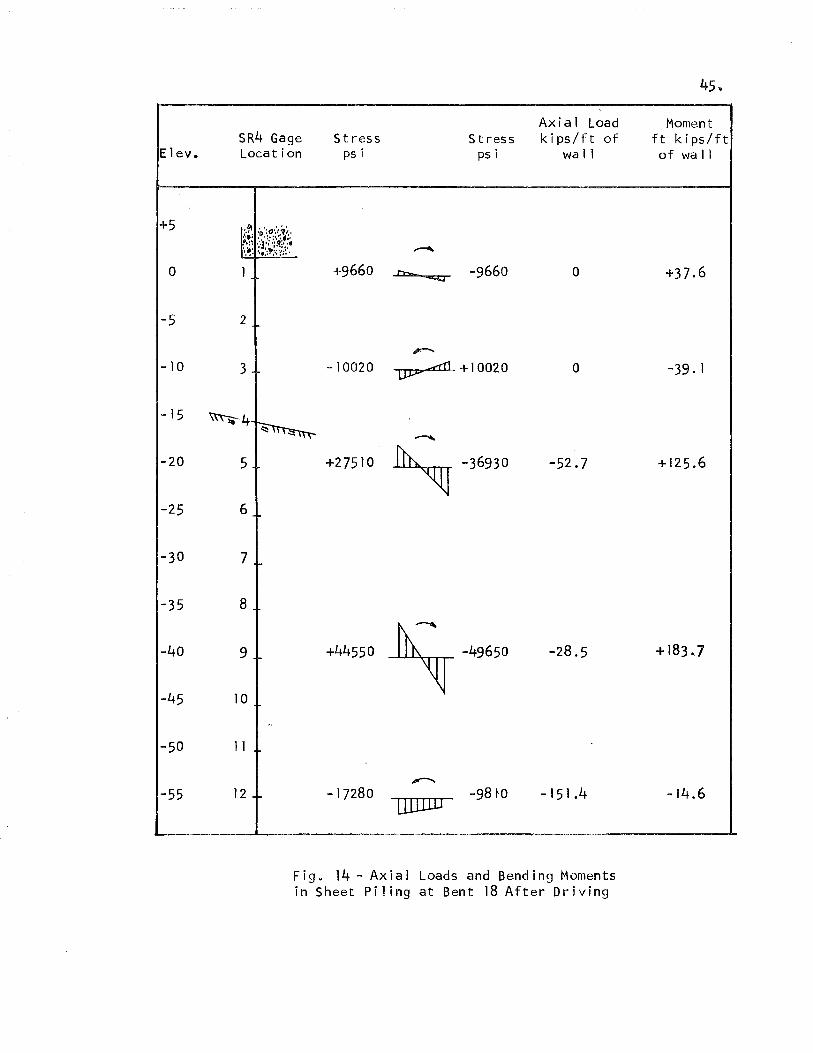
3.1 Post Driving Stresses
Post driving stresses were determined by taking the difference
in gage readings between the no-load condition and immediately after
driving. The zero load condition for the sheet piling was taken as those
gage readings recorded while the piling was hung from a crane.
Fig. 14 shows the axial loads and bending moments along the
sheet pil ing due to driving the pile into the soil. Only those stresses
where SR4 gage readings were obtained on both flanges are shown. Readings
were obtained at gage locations 6 and 10 on the south flange.
Unfortunately, during the driving of the instrumented sheet
piling at Bent 26 the lead wires became entangled with adjacent piling and
pulled the wires away from all gages. The only SR4 gage data on the sheet
piling after backfill was placed were obtained at Bent 18.
3.2 Lateral Loading
The method used to construct the wharf is similar to that of a
"fi 11" bulkhead. The concrete cap was placed after the sheet and H-pi 1ing
were driven. As a result, construction activity around the slope indicator
pipe prevented installation of the plastic tube in the pipe until after
the concrete was placed and backfilling had been completed at Bent 18.
302.1 Backfill
Because of the procedure outlined above at Bent 18 no slope
indicator data were available to determine the effect of the backfill
on the bulkhead. Also, with the exception of gage 10 at Bent 18, all
sheet piling strain gages that survived pile driving became inoperable
a few days after driving and before the backfill was placed. The
resistance of all of the Bent 18 sheet piling strain gages, except
at location 10, dropped to very ION va lues.
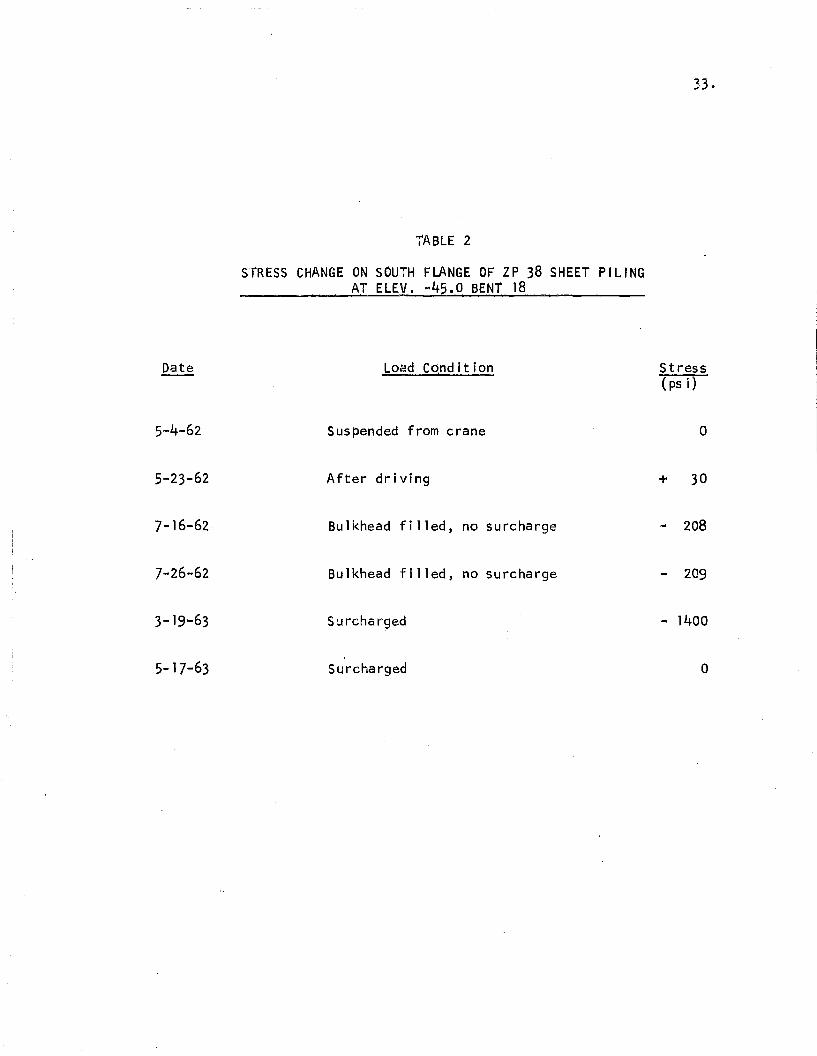
Table 2 gives the SR4 gage data at location 10 noted above.
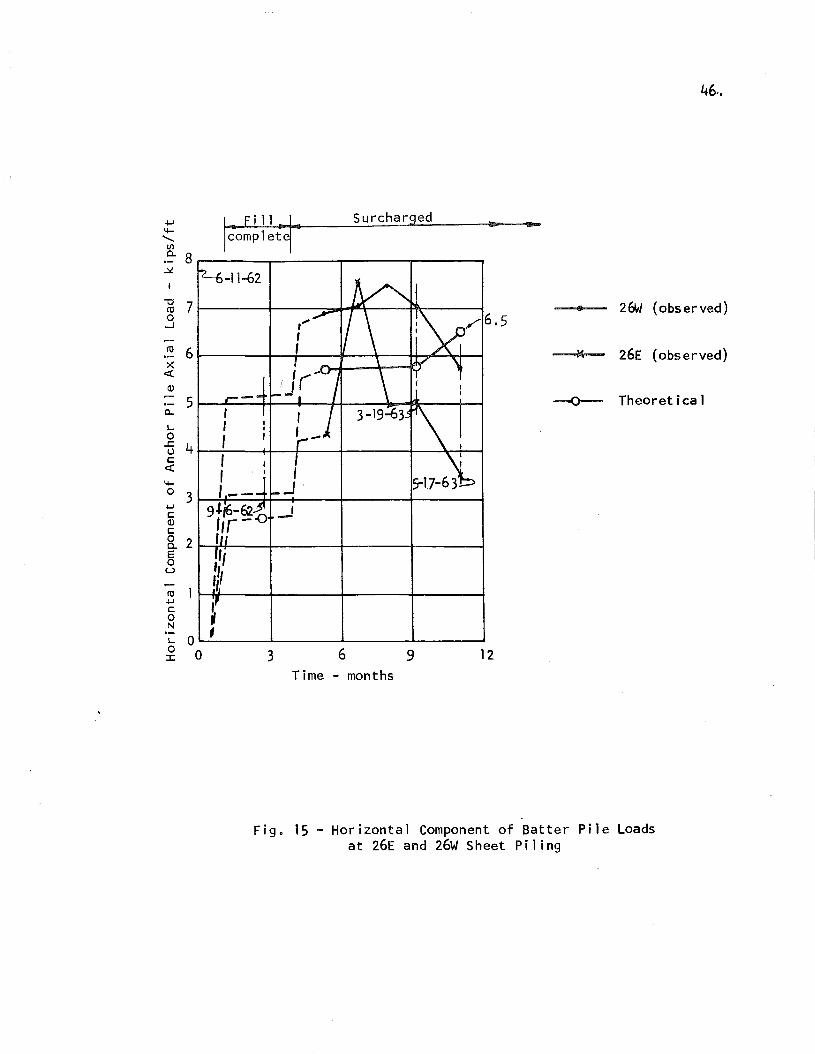
Fig. 15 s hO\NS the hori-zontal component of the batter pi le loads
for the backfilled and surcharged load conditions at Bents 26E and
26w. On ly one SR4 gage on each flange of the batter pi les at Bent
18 remained operable a few days after installation; therefore, axial
loads could not be determined.
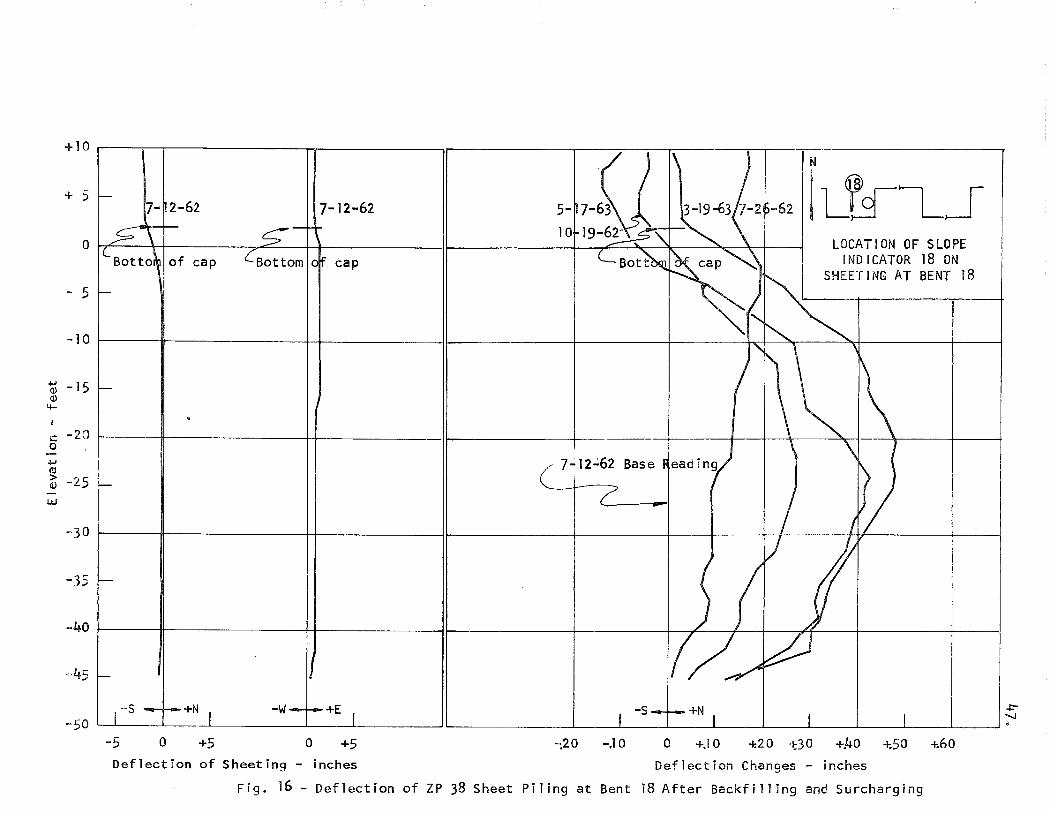
3.2.2 Surcharge
The slope of the driven sheet piling and deflection changes
due to the surcharge loadings on the bulkhead are given in Figs. 16,
17 and 18. Three complete sets of observations were made. These
data include results of manually cross-sectioning the coal surcharge
adjacent to the bulkhead, strain gage, slope indicator and surcharge
pressure readings. A number of slope indicator readings were made
without cross-sectioning the coal surcharge simultaneously. These
data did not indicate any anomalies with other slope indicator
data, so they are not included. The first slope indicator readings
taken on July 12, 1962 are used as the base readings. In the
Analysis and Discussion section the July 26, 1962 readings were
used as the base readings. Both sets of data were taken before
surcharge was placed in the field.
The profile of the driven sheet piling is shown in the north
south and east-\f!lest directions. This slope reflects· the effect
of backfilling the bulkhead at 26E and 26w, but not at Bent 18.
14.
As noted in Section 3.2.1, the horizontal component of batter
pile loads due to surcharges at Bent 26 is given in Fig. 15.
3.3 Wharf Movement
The movement of the top of the slope indicator wells is shown
in Fig. 19. The bulkhead base line was not established until September 28,
1962. This information, established by optical ~eans (transit and tape),
is compared to that of the slope indicator considering the lowest reading
as a fixed point. The lowest point varied, depending on where the well
broke away from the piling, or where the grooves in the plastic pipe did
not line up as at 26E.
3.4 Surcharge Measurements
The manual surcharge measurements were necessary because the
output of the capacitor transducer did not give consistent results. The
surcharge loading slowly and continuously changes; therefore, a monitor
giving only relative results would have been helpful. Data from the
capacitor transducer are not included.
15.
IV. ANALYSIS AND DISCUSSION OF RESULTS
4~1 Compariso~ of Experimental and Theoretical Results
Table 2 and Fig. 4 show the theoretical and experimental
results for the sheet piling and. anchor loads. For the backfill condition
the prototype anchor loads, as expected, are equal to or higher than
calculated values. In addition, _the· maximum bending moment below the cap
is 76 percent lower than the lowest theoretical value. Fig. 20 gives the
complete data concerning the bending of the sheet piling under backfill
conditions at Bent 18. Since the backfill at Bent 18 was placed prior to
taking the initial slope indicator readings, the strain gage bending moment
data after driving were taken as the unloaded condition. Then the initial
slope indicator data were corrected to reflect the change due to backfill-
ing. The slope data from Elev. -10.0 up could not be corrected because
after driving the piling an additional length of 411 diameter slope indicator
pipe was welded to the driven pipe to bring the top of the pipe to Eleve
+12.0. Apparently, the top of the driven pipe was bent to make the exten
sion into the concrete forms, thereby altering the pipe position. From
Fig. 20 it may be seen that the points of maximum bending and zero active
load are lower than expected.
Fig. 21 shows the reactions of the flexible wall at Bent 18 to
the surcharge loadings. In general, the derived imposed loads below the cap
show that they are considerably less than those computed by classical methods.
In contrast, the experimentally derived loads just below and presumably above
the cap are generally much higher than can be accounted for by any method.
This results in high sheet piling moments at the cap.
Since analysis of the slope indicator data suggests high loads
16.
for the portion of the wall above E1ev. 0.0, it would be expected that
the anchor pile loads would be even higher than those given by model and
field studies. Fig. 19 shows that the horizontal components of the axial
load on the batter piles are close to the calculated values for the sur-
charged condition; however, the bridge support piling could provide
considerable resistance to lateral movement in either the north or south
direction. The strain gage data from the bridge batter piling at Bent 26
are not complete as only one gage on the outboard flange of outboard pile
functioned; therefore, the bending and axial loads could not be determined.
On Figs. 20 and 21 the points of zero load were considerably
lower than had been expected from results of model studies (24). The
results from the Port of Toledo tests by Hakman and Buser (2) indicated
lower hinge (or zero load) points than expected. Because of this and the
fact that maximum bending moments were lower than the theoretical values,
they concluded that the active pressure was considerably less than assumed.
In this study the lower hinge and maximum moment points were probably
partially due to fixity of the sheet piling in the pile cap. Several feet
of ZP 38 or H-pile embedment into pile caps produces a joint capable of
considerable moment transfer (7). Fig. 21 illustrates this point. The
highest moments were at the pile cap, but complete fixity was not obtained
because the slope curve was not zero at the cap line." The slope at the
cap increased with each observation. The point of maximum moment on a
beam with uniform loading, which has one end fixed and the other end
simply supported, is one-eighth the span closer to the simple support
than that of a uniformly loaded simple beam span.
The deflection of the bulkhead at Bent 18 due to the surcharge,
as calculated from the smoothed slope curves, are shown in Fig. 21. The
17.
deflection of the bulkhead on October 19, 1962, calculated directly from
the slope data, is compared to that derived from the smoothed slope curves.
Figs. 16, 17 and 18 show the initial slope of the sheet piling and deflec
tion changes at all three sheet .pile observation points. The initial
slope readings were used as the base readings for these figures. The
difference between the initial reading and the July 26, 1962 deflection
curve at Bent 18 was not due to a change in load conditions at the bent.
The July 26, 1962 deflection shows an almost straight line from the cap
down. This is most likely due to the fact that the cap, retaining wall
and walkway form an extremely stiff structure with regard to lateral
movement. Backfilling was proceeding toward Bent 26 after the July 13,
1962 (initial) reading was made at Bent 18. Therefore, the top of the
wharf at Bent 18 moved outward, carrying the sheet piling with it. At
Bent 26 the two instrumented sheet piling (26E and 26W) are 6 feet apart.
Somewhat similar results were expected because of this close spacing.
Fig. 17 shows that the July 26, 1962 slope reading revealed a sheeting
deflection after the backfilling was completed, as well as slight movement
at the anchor point. The surcharge deflection readings at 26w are quali
tatively and quantitatively similar to those at Bent 18. The similarities
consist of an apparent southward movement of the cap with sheeting deflec
tion, lower than theoretical points of maximum deflection, and the relative
position of the sheeting at each observation date.
The change of deflection shown in Fig. 18 for instrumented pile
26W shows a decided difference from either Bent 18 or 26E. Apparently,
the slope indicator pipes tore away from the sheeting (at Bent 18:
-43.0 1 and at 26w: -40.0 1) due to driving into hard material. How-
ever, the slope indicator well at 26w was on the south (soil) side of
18.
the sheeting, while at Bent 18 and 26E the wells were on the north or
water side of the sheeting. The east-west profiles of the sheeting show
that at Bent 18 and 26E the sheeting is leaning to the east, but at 26w
it is leaning toward the west. Normal lean of the sheeting would be
toward the west as the driving progressed from east to west, although this
is not always the case. In any event, the slope indicator data from 26w
are sufficiently different from the data shown for Bent 18 and 26E to
indicate that some problem apparently has developed and extreme care must
be exercised in using these data. No further analytical use will be
made of data from 26w in this study.
4.2 Slope Indicator Well Movement at Elevation +10.8
It was stated above that the concrete structure above the sheet
and H-piling provided considerable resistance to relative lateral movement 0
Also, it very likely resisted rotation above Elev. +2.0 and, due to
~esistance of the batter piling to northward movement, actually forced
the top of the bulkhead to move southward when the sheeting was deflected
due to active loads. This is illustrated in Figs. 16 and 17, showing that
southerly movement occurred at the anchor point. Fig. 19 shows the compari
son between the deflections at Elev. +10.8 determined by the deflections
calculated from slope indicator data and the ground survey control.
Although the base readings of the two methods of determining well movement
differ, the relative,movements at Bent 18 and 26E are similar. These
movements are in direct contrast to model and other field studies made
on flexible walls with tie-back systems 0 The above-described wall movement
may result in high bending moments at the cap and much higher anchor loads
and bending moments in the batter piling.
19.
Table 2 gives the stress in the south flange of the sheet piling
at Bent 18. From all available data, the stress in the piling at Elev.
-45.0 should be very small as the pile at this elevation is much deeper
than required for the fixed earth condition. The field data indicate that
such is the case, although only information from one flange is available.
4.3 Post-Drivin'g Stresses
The post driving stress condition of the instrumented piling at
Bent 18 (as given in Fig. 14) is somewhat surprising. The data were taken
within several hours after the pile was driven. The wave equation used to
determine stresses while the piling was being driven shows that com
pressive and tensile stresses do exist during driving. It is possible
that at the termination of driving the pile stresses could vary. Another
possible cause of moments in the pile is the fact that the instrumented
piling is interlocked with the adjacent piling. The adjacent piling may
be deformed somewhat due to driving, and each pile driven thereafter would
roughly conform to the slope of the preceding piling, thereby introducing
moments into the piling. It is assumed that in time the axial loads will
dissipate. The axial load at Elev. -55.0 is quite high considering that
the piling was driven to Elev. -56.0.
4.4 Discussion of Experimental Data Results
4.4. 1 SR4 gages
The SR4 gage installations were intended to produce reliable data
for an extended time period -- hopefully more than a year. The zero
drift technique was used and gage resistance checks were made (9).
As a result, the SR4 readings are satisfactory until the resistance
of the SR4 gages falls below 100 megohms.
20.
Sources of error exist when the plane at which measurements are
to be made is not accurately laid out, and gages are not placed on
the extremities of the shape when axial loads and bending moments are
to be determined.
The SR4 gage data used in this study are bel ieved to be as
accurate as information obtained from normal structural laboratory
studies, assuming proper orientation of the sheet piling. Large
errors which can occur result from twisting of the sheet and H-pil ing
during driving& This is a common occurrence and can be detected by
the use of rosettes.
4.4.2 Slope Indicator
Slope indicator results are claimed to be satisfactory in deter
mining the stress within a range of 1000-2000 psi when satisfactory
tangents can be drawn from the slope curve data (2). In this study,
as with the Port of Toledo study, the accuracy of the moment (stress)
determination was better where the slope curve did not change rapidly.
From the cap down to Elev. -10.0 the accuracy of the smoothed slope
curve is probably one-half that between E1evs. -12.0 and -22.0.
Regardless of this quantitative inaccuracy, the qualitative indica
tions such as slope direction are unmistakable.
It is possible that when the plastic inner guide casing was
inserted into the wells some rotation may have occurred. This
could, of course, result in considerable inaccuracy if the rotation
were more than a few degrees. In this study Ottawa sand was vibrated
into the annular space between the casing and the ~I diameter pipeo
If the sand did not completely fill the void a limited accuracy
21.
problem may result because the outside diameter of the plastic
casing is 3-1/~r which leaves little room for movement within the
~r diameter pipe.
The use of a torsion ,device to determine the rotation of the
inner casing may be necessary to eliminate this problem.
4.4.3 Surcharge £ressure gages
The malfunction of these gages experienced in this study are
probably due more to inadequate gage preparation than anything else.
The small surface of the transducers (1 cm2) will react to pressure
from one sand grain. Since intergranular pressure, as determined from
a few sand grains, is rarely indicative of the pressure on a square
foot, a much larger sensing element should have been used.
4.4.4 Ground control
Ground controls were not established for the slope indicator
wells until the backfilling was complete. The control consisted of
placing a tranSit near the shore (east) end of the coal field extension
along the walkway in front of the bulkhead retaining wall and sighting
on a point at the west end of the bulkhead. The point at the west end
of the bulkhead was established by chaining a set distance from the
west end of the southerly retaining wall to a point in front of the
bulkhead retaining wall. The chained distance was determined by
using the standard methods of constant chain tension and temperature
correction e
These measurements are probably accurate to 1/1&1.
22.
V. SUMMARY AND CONCLUSIONS
This study, conducted on a somewhat unusual type of wharf,
shows that information developed over the past 20 years on model and
full-scale tie-back type bulkheads is far from complete. In keeping with
results of other recent tests, the sheet piling moments are considerably
reduced and anchor loads increased for backfilled condition compared to
those calculated by most methods. There are indications of very high
loads behind the concrete retaining wall and cap, possibly due to the
movement of the concrete wall into the surcharge an~ fill, even though
the batter pile loads under surcharge did not show this. Additional slope
indicator readings will be made in the near future to determine the changes
that may have taken place since 1963.
The combination of strain gages and slope indicators provides
an excellent system for enabling investigators to describe bulkhead loads,
moments and movements. Pressure gages against the bulkhead-soil interface
are desirable, as are methods for determining soil movement in front of
and behind the bulkhead.
When classical pressure theories are used, ~esults of this and
other field studies of bulkheads in granular soils show that wall friction
should be used in the computation of active bulkhead pressures in order to
reduce the theoretical moment values.
This study has produced some interesting information. O~ly
several field tests have been conducted to determine bulkhead resistance
without surcharges. Since this is the only known study primarily concerned
with granular surcharge effects on bulkheads, additional analysis of the
slope indicator data at 26E and 26w will be made.
In conclusion, it is felt that Rowels and Tschebotarioffls work

on bulkheads is only the beginning in the effort to design economical
bulkheadsa The nonlinear 5ubgrade reaction method of design, along with
satisfactory soil property data, may be a proper tool to use in the
development of design methods.·
b
c
d
E
hah lh2
I
M.L.W.
Mdesign
Mmax
m
t
w
z
24.
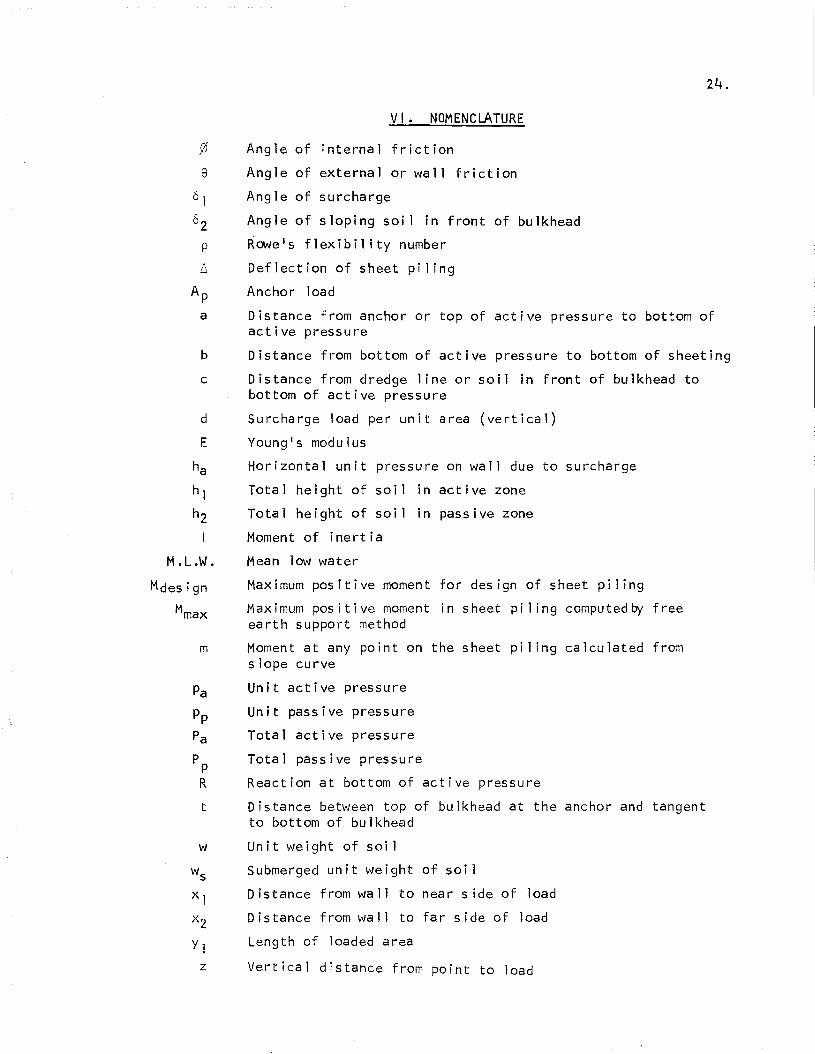
VI. NOMENCLATURE
Angle of internal friction
Angle of external or wall friction
Angle of surcharge
Angle of sloping soil in front of bulkhead
Rowels flexibility number
Deflection of sheet piling
Anchor load
Distance from anchor or top of active pressure to bottom ofactive pressure
Distance from bottom of active pressure to bottom of sheeting
Distance from dredge line or soil in front of bulkhead tobottom of active pressure
Surcharge load per unit area (vertical)
Young1s modulus
Horizontal unit pressure on wall due to surcharge
Total height of soil in active zone
Total height of soil in passive zone
Moment of inertia
Mean low water
Maximum positive moment for design of sheet piling
Maximum positive moment in sheet piling computedby freeearth support method
Moment at any point on the sheet piling calculated fromslope curve
Unit active pressure
Unit passive pressure
Total active pressure
Total passive pressure
Reaction at bottom of active pressure
Distance between top of bulkhead at the anchor and tangentto bottom of bulkhead
Unit weight of soil
Submerged unit weight of soil
Distance from wall to near s ide of load
Distance from wall to far side of load
Length of loaded area
Vertical distance from point to load
25.
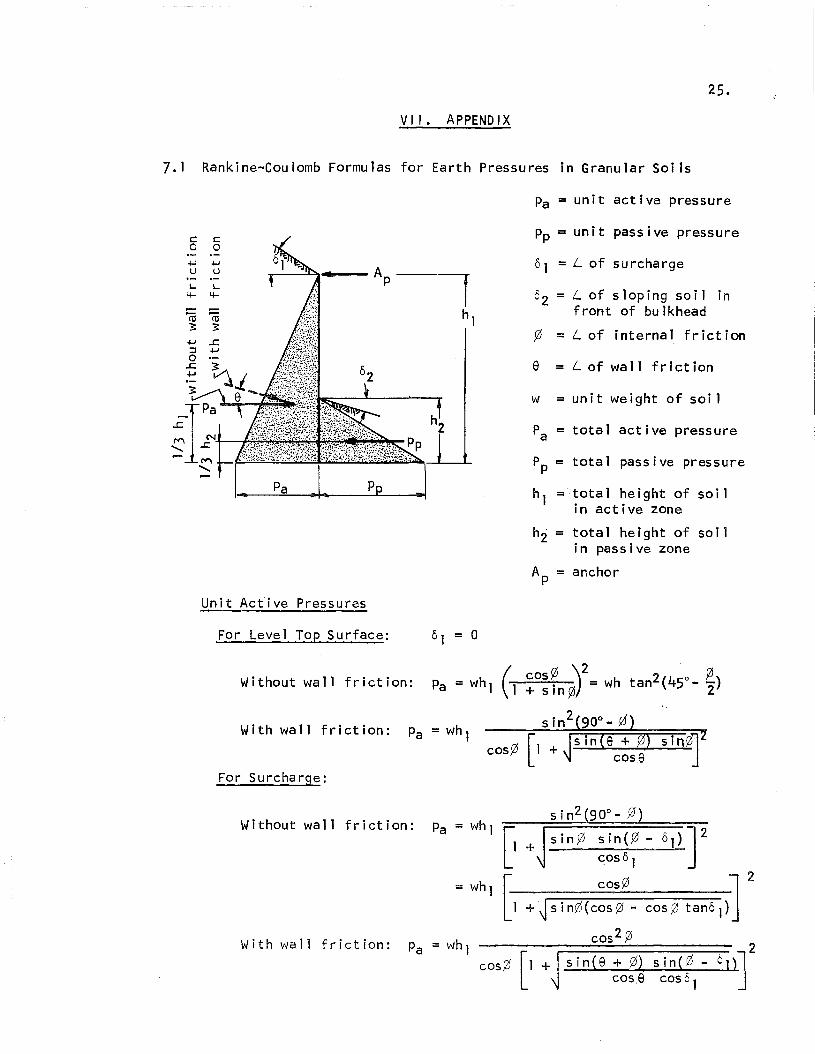
VII • APPENDIX
7.1 Rankine-Coulomb Formulas for Earth Pressures in Granu·lar Soils
Pa = unit active pressure
c c0 0
.J-J ~
U u Ap'- 1-4- 4-
...-mco
~ 34-J ...c.::J ~
0..c.......
Pa l---p-L,p_-
Pp = unit passive pressure
61 = L of surcharge
62 = L of sloping soil infront of bulkhead
o = L of internal friction
e = L of wall friction
w = unit weight of soi I
Pa = total active pressure
Pp = total passive pressure
hI ='·total height of soi 1in active zone
hZ = total height of soilin passive zone
Ap = anchor
Un it Act'i ve Pressures
Fdr Level Top Surface:
cos¢ [1 + fs inca + ;q) sin~2
\J cos,S J
(-1 ~o:rn0)2= wh tan2(45°- ~)
s in 2(900- 0}With wall friction:
Without wall friction:
For Surcharge:
2sinCS + 91} sinC~ - o])l
cos,e cos°1 J
~ + sin,0 sin(,0 - 01}J2L' coso 1
r. cos,0 ] 2
L1 +~ s i n0' (cos 91 - cos,0 tan6 1)
cos 2 }?5
Pa = wh I
Pa = wh lcos91 [1 +
With wall friction:
Without wall friction:
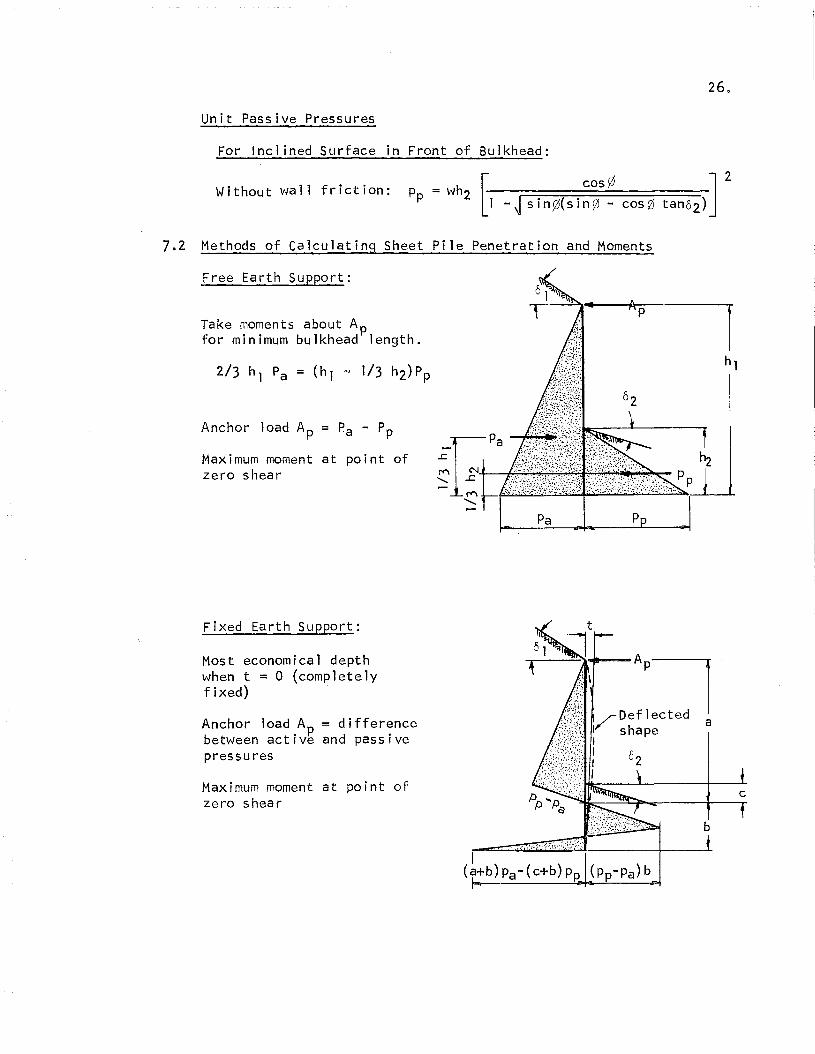
Unit Passive Pressures
For Inclined Surface in Front of Bulkhead:
Without wall friction: p - wh 2 I. cos.0 ] 2p - LJ -~ sin.0(sin.0 - cos0 tano2)
7.2 Methods of Calculating Sheet Pile Penetration and Moments
Free Earth Support:
ill Ap
rTake moments about Apfor minimum bulkhead length.
2/3 h 1 Pa = (h 1 - 1/3 h2)P phl
°2
Anchor load Ap = Pa - Pp
~~paMaximum moment at point ofZero shear rr\ C'J
............ ...c(Y"\
..........
-LPa Pp
Fixed Earth Support:
Most economical depthwhen t = 0 (completelyfixed)
Anchor load Ap = differencebetween active and passivepressures
Maximum moment at point ofZero shear
c
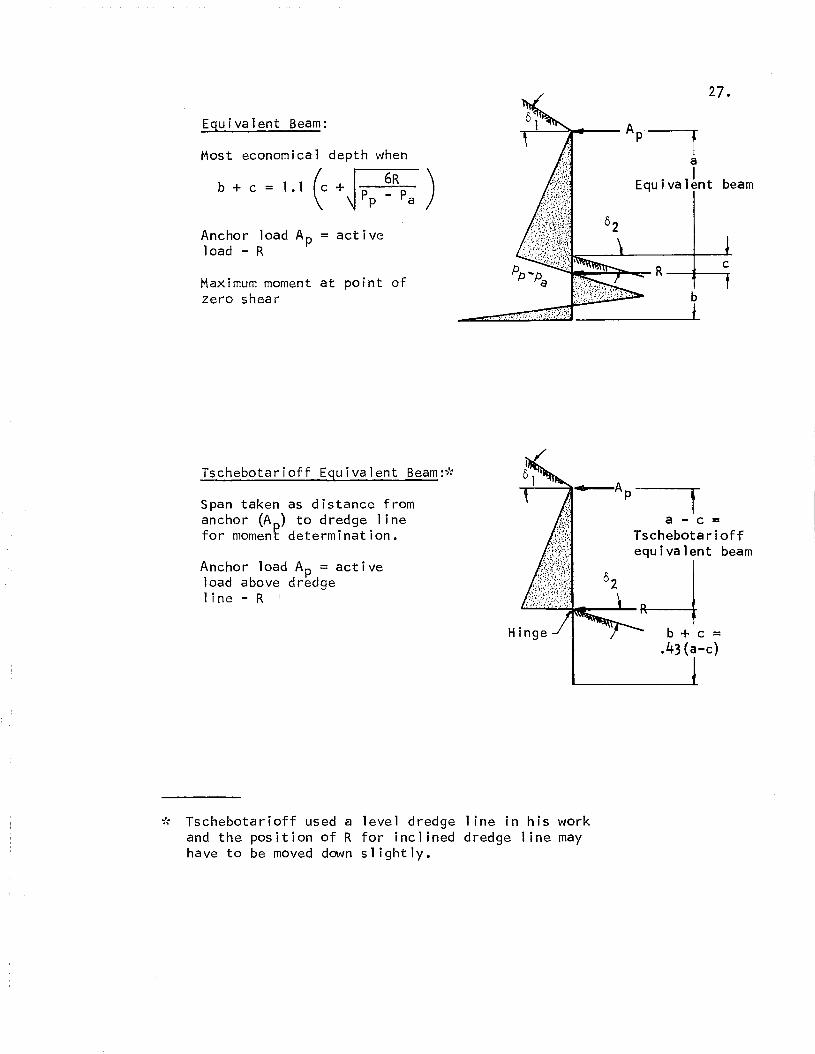
Equivalent Beam:
Most economical depth when
b + c = 1 1 ( +~ pP ~RPa )
Anchor load Ap = activeload - R
Maximum moment at point ofzero shear
Tschebotarioff Equivalent Beam:*
Span taken as distance fromanchor (A ) to dredge linefor momen~ determination.
Anchor load Ap = activeload above dredgeline - R
27.
Ap-ra
• 11
bEqu I va ent earn
b~~~.. I-
ra - c =
Tschebota r i offequivalent beam
b + c =.43(a-c)
* Tschebotarioff used a level dredge line in his workand the position of R for inclined dredge line mayhave to be moved down slightly.
Flexibili~y No. p
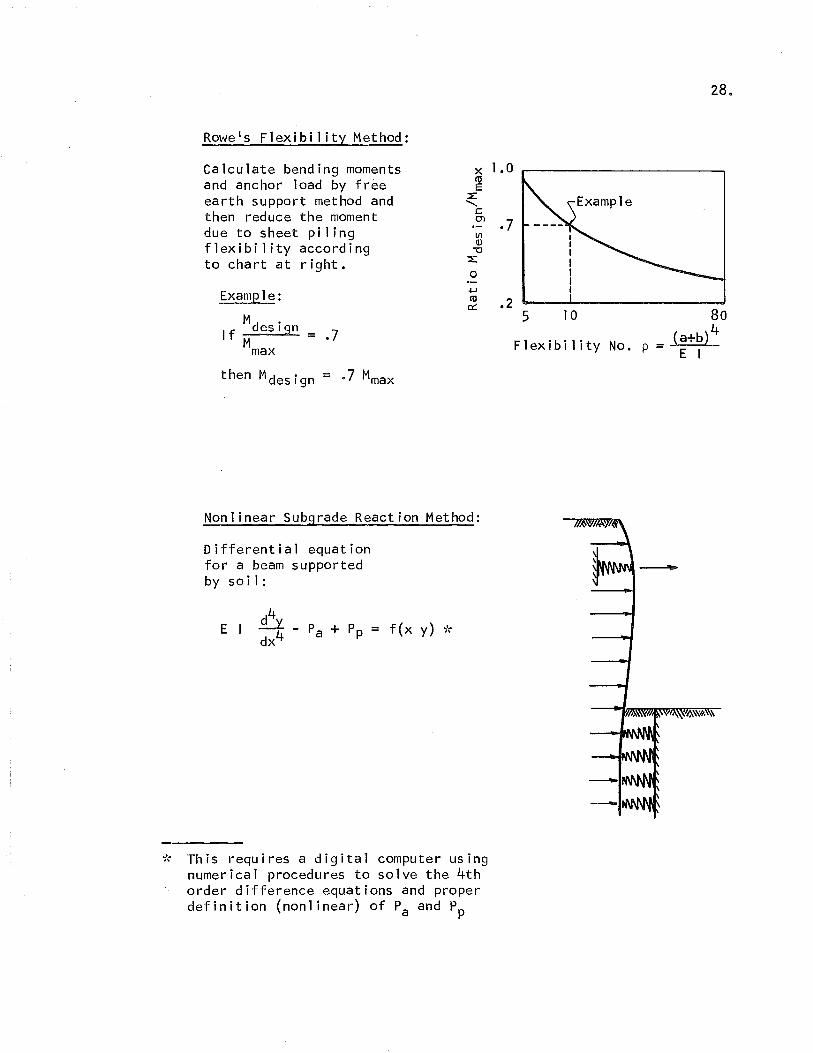
Rowels Flexibility Method:
Calculate bending momentsand anchor load by freeearth support method andthen reduce the momentdue to sheet pilingflexibility accordingto chart at right.
Example:
Md •I f M es I gn = •7
max
then Mdesign = .7 Mmax
x 1.0roE
:L..........
c:0'> • 7tilQ)
-0~
o
.25 10
28.
80
= (a+b)4E I
Nonlinear Subgrade Reaction Method:
Differential equationfor a beam supportedby soi l:
E I d\~4 - Pa + Pp = f(x y) *
dx
..
* This requires a digital computer usingnumerical procedures to solve the 4thorder difference equations and properdefinition (nonlinear) of Pa and Pp
29.
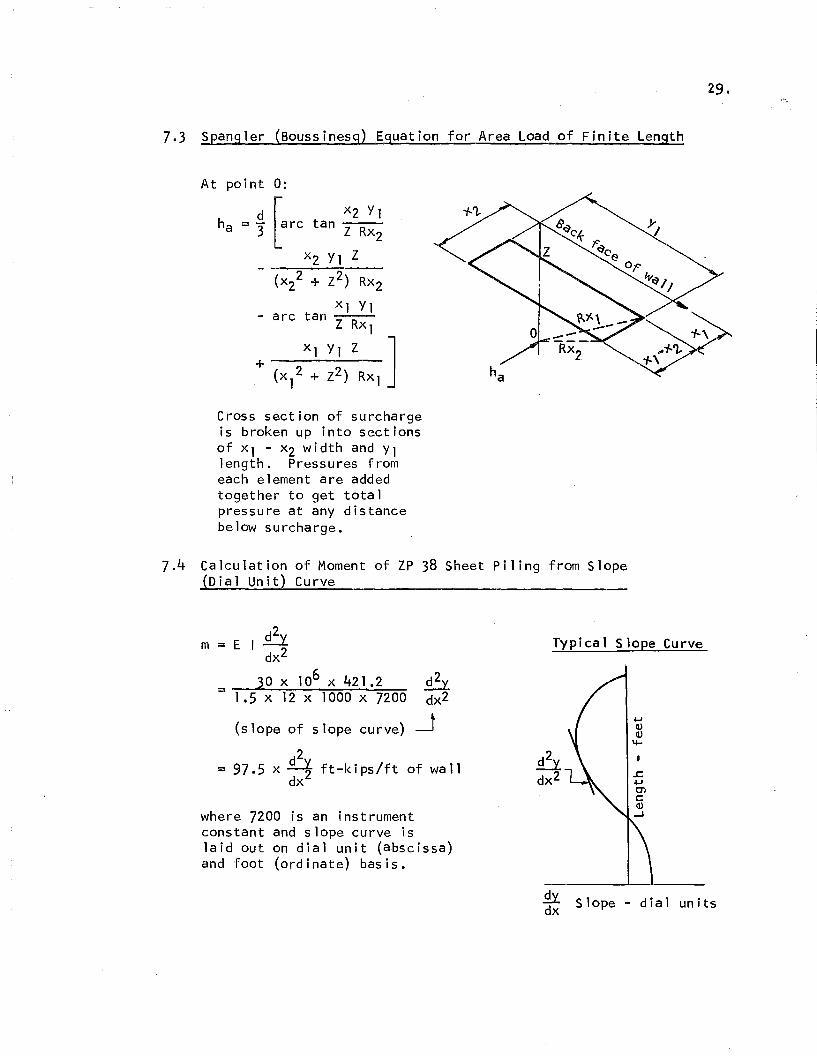
7.3 Spangler (Boussinesg) Equation for Area Load of Finite Length
At point 0:
d r x2 y 1ha = 3 Larc tan Z RX2
X2 Yl Z
(X22 + z2) RX2
Xl Yl- arc tan Z RXl
+ (X12x~ :~)ZRXl ]
Cross section of surchargeis broken up into sectionsof xl - x2 width and Yllength. Pressures fromeach element are addedtogether to get totalpressure at any distancebelow surcharge.
7.4 Calculation of Moment of ZP 38 Sheet Piling from Slope(Dial Unit) Curve
m = Typical Slope Curve
30x106 x42l.2=----------1.5 x 12 x 1000 x 7200
(slope of slope curve)
d2= 97.5 x~ ft-kips/ft of wall
dx
where 7200 is an instrumentconstant and slope curve islaid out on dial unit (abscissa)and foot (ordinate) basis.
.9Ydx Slope - dial units
7.5 Calculation of Deflection from Slope Indicator Data
Average distance between slopereadings is 20 inches.
Calculations referenced to thebottom of the sheeting and dialreadings are summed from thebottom to the top.
L dial readings x 207200
30.

V11,1. TABLES lAND FIGURES
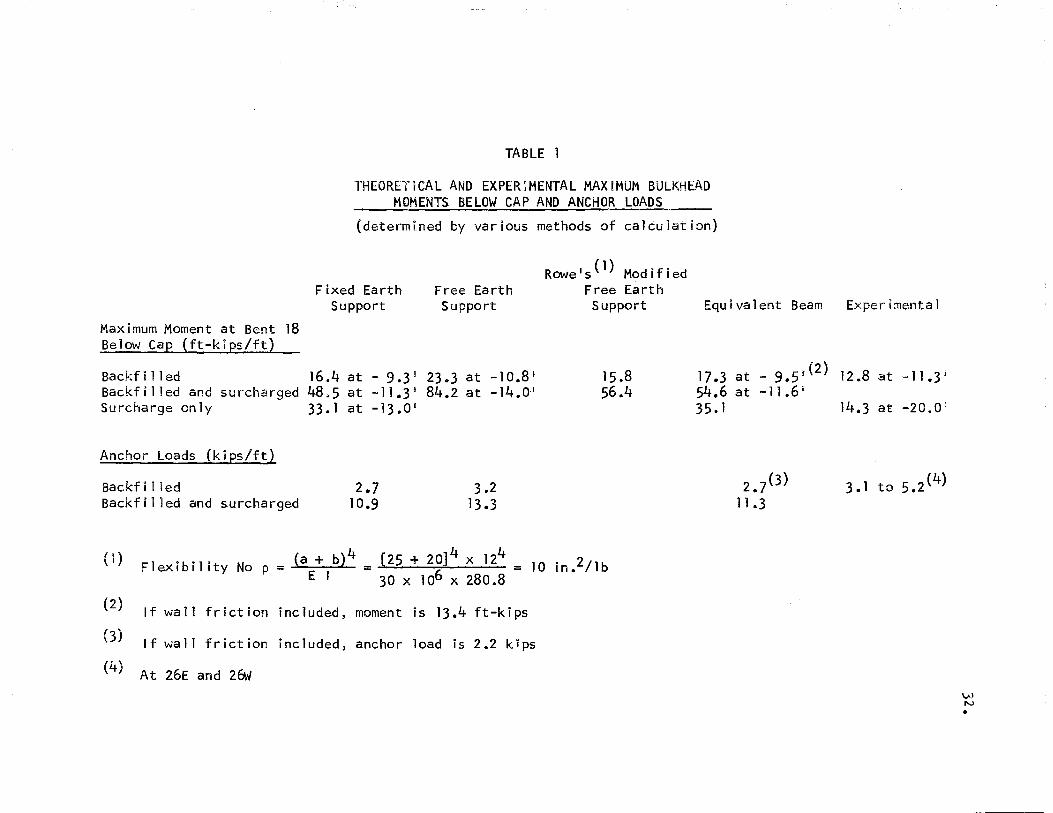
TABLE 1
THEORETiCAL AND EXPER~MENTAL MAXIMUM BULKHEADMOMENTS BELOW CAP AND ANCHOR LOADS
(determined by various methods of calculation)
Maximum Moment at Bent 18Below Cap (ft-kips/ft)
Fixed EarthSupport
Free EarthSupport
Rowe l s(1) ModifiedFree EarthSupport Equivalent Beam Experimental
Backfilled 16.4 at - 9.3 g 23.3 at -10.8 1
Backf i 11 ed and surcharged 48.5 at -11.3 I 84.2 at -14.0-1
Surcharge only 33.1 at -13.0 1
Anchor Loads (kips/ftl
15.856.4
17.3 at - 9.5 r (2) 12.8 at -11.3 1
54.6 at -11.6 i
35.1 14.3 at -20.0~
Backf i 11 edBackfilled and surcharged
2.710.9
3.213.3
2.7(3)11 .3
3.1 to 5.2(4)
(1 )Flexibility No p
4 44_ (a + b) = [25 + 20] x 12 = 10 in.2/1b- E I 30 x 106 x 280.8
(2)If wall friction included, moment is 13.4 ft-kips
(3) If wall friction included, anchor load is 2.2 kips
(4)At 26E and 2611
\.NN•
5-4-62
5-23-62
7-16-62-
7-26-62
3-19-63
5-17-63
fABLE 2
stRESS CHANGE ON SOUTH FLANGE OF ZP 38 SHEET PILINGAT ELEV. -45.0 BENT 18
Load Cd.nd i t ion
Suspended from crane
After driving
Bulkhead filled, no surcharge
Bulkhead filled, no surcharge
Surchar~ed
,Surcharged
33.
Stress(ps i)
o
+ 30
.... 208
- 209
- 1400
o
Bar i ng @ @ Bar i ng Bar i ngLog 1366 Log 1363 Log 1361
(blows/ft) (b1ows/ft) (b1ows/ft)
+10 1 I '1
0
- 10 Ir~ Water
20
- 30
....d) -CLl
4-
I -C0.-....co>CLl-lLJ
- 80
- 90
-100
-1101;-60"'1':-: ',:.' " ~·l>,:: = -' >.'.": >,: ..·.-·:I:~:···· ' 1" --.- '.,',
- 120 /3. p ~.. • •• ~ .. - ... • -, ",.. - -... •• • •: '.'i 0'0/2; I " .' '-. .',
I " I
0 79 0 25 199.25 250· 450·\,I.J
Fig. 1 - Soil Profile on Bulkhead Centerline +-0
Bridge .runway
Existino coalstorage area
t
1.-/ 311
3SI"3Jb
Shore1 i ne
Dolphin ~IO) Face of fender
pi Ie cluste/i\ Bent ~ -_.-- . /ct Bridge runway/ 0 _ _
o - · - - <l Conveyor--------~:~- ------ ~
-\,,()
0"\N
-'=-IN
........I
N
Fig. 2 - Plan of Coal Field Extension \N\.Tl
~.+----+--9
SECTION A-A
2&..1
~..................-.=----+---- To next batter pi IecotTl III
"'lJ I... co- 0-I... :;:....-m III Do.
>~ c ...00 0 I...
J 0 &.- "'lJ Do.
"tit ~ ~
36.
-16 1 -011IIIIII(IIII')1 11
I I'I ~
ZP-38~"sheet lip
I "pile II qII ~1111
IIIIII t
IIIIIIII
"I'II,..IIIIIIIIIIII~ ~d II1111"III'll
-"-52 I -0" ~l
14H73anchor
Yt'ff'" IIII"14H89~1l"
Pile ,.11"'1III
""II,'kH
North br idgerunway
Face of fender
Wood fenderpi 1e
Present depth-21 1 -6"
Future dredgedepth
Fig. 3 - Elevation of Coal Field Wharf
-56~ +40 +20 0 -20 -40 +20ft-kips
Fig. 4 - Theoretical Loads and Moments for Bulkhead
\..JrJ"J
-40o -20
ft-k i ps
Moments Due toSurcharge Only
Moments Due toBackfill Only and
Backfill and Surcharge
Backf i 11 and,surCharge\ .
48,500 ft-lb'at -11.2 1
- 8
o
+16
Elevat ion(feet)
+24
+ 8
3170 -40
2060 -32
-48
j[!~t 16° -16
~~-24
10,130
14,980
Bottom ofSheeting""
Soil PressureProperties Diagram
" (lbs/ft2/ft)...... ,(
33°'r-Coalcj>=33°w=50 pef
F i 11'+'=37°fu- 120 pcT/ l' II I • '- • n. - 1•5 I
Fill¢=37°ws=70 pcf
~ South Bridge Runway
~313.291
-20
-40 "IClayey sand
-20 "\
40 Clayey sand
t Bulkhead
4 Bu I khead
/'
t Bulkhead
38.
STEP 1
Mud is dredgedfrom field, channeland bulkhead areas
STEP 2
Miscellaneous fillplaced behindbulkhead center-1 ine
o ---+__---1
..40
-20 "\.
-40
-20 "\
\-40
Fill
//'
STEP 3
Miscellaneous fillexcavated toElevat ion -5.0'
STEP 4P iIi ng d riven,concrete cap, deckand wa 11 p I aced.Fill brought upto Elevation +200'
STEP 5
Remainder of fillplaced behindbulkhead and incoal field
Fig. 5 - Construction Sequence
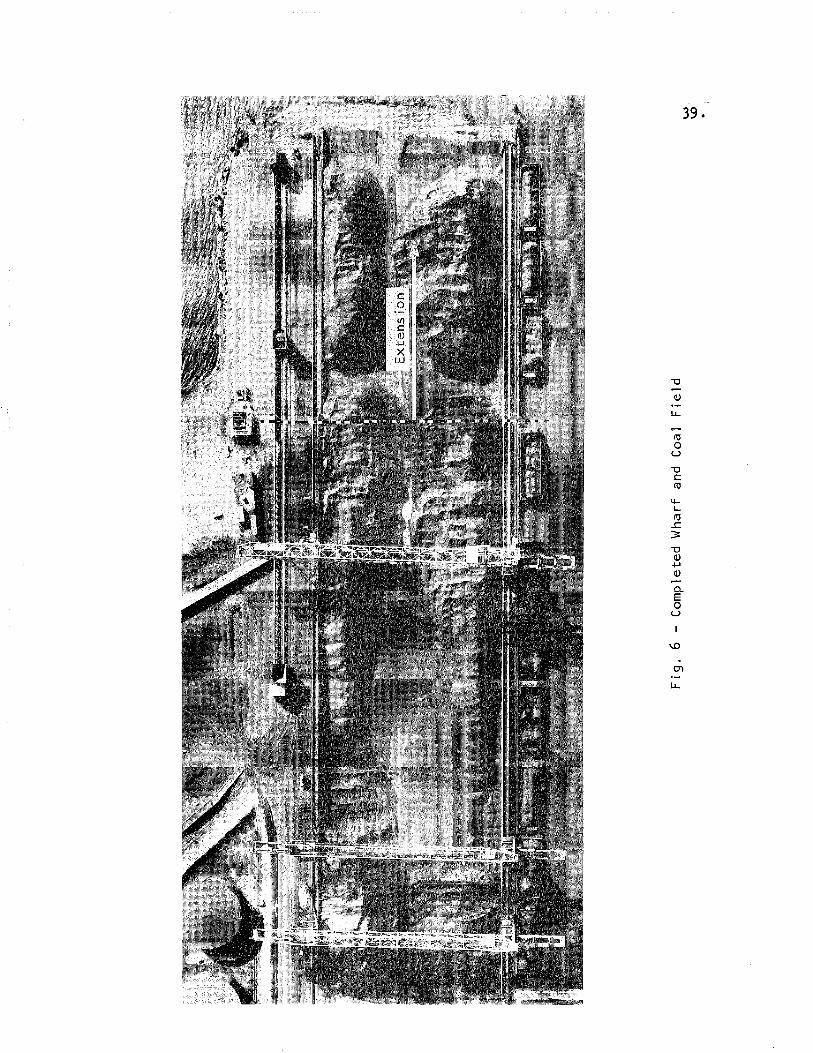
39 •
a.>
l.L.
mo
U
-0c:co
4L-eo..c:;:-0
a.>~
a.>
0..Eo
u
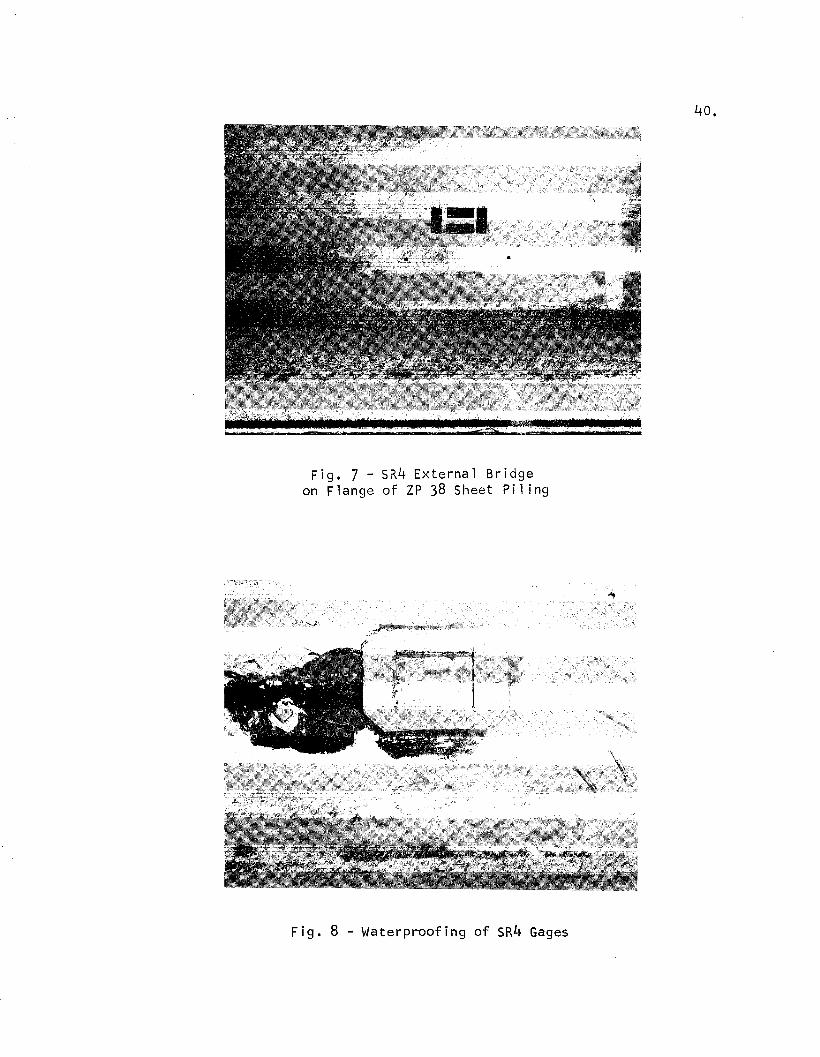
Fig. 7 - SR4 External Bridgeon Flange of ZP 38 Sheet Pil ing
Fig. 8 - Waterproofing of SR4 Gages
40.
41.
Fig. 9 - Clamped, ShieldedSR4 Gage Lead Wires and
Protective Channel
Fig. 10 - Channels OverSR4 Gages and Slope Indicator
Pipe at Bot'tom of InstrumentedSheet Piling
~Indicator
42.
-00
Box
Plastic Tube/'"Wiring Diagram
Fig. 11 - Slope Indicator Equipment
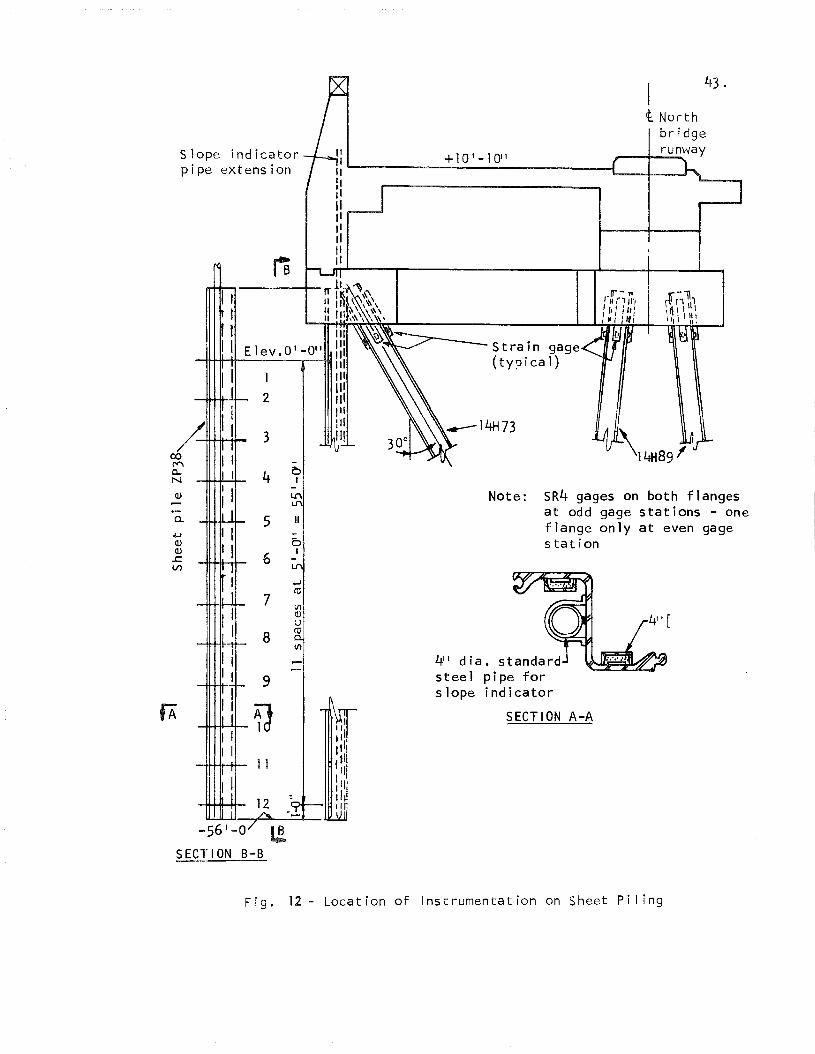
Note: SR4 gages on both flangesat odd gage stations - oneflange only at even gagestation
43.It North
bridgerunway
Strain gage(ty?ical)
+ 10 1 -1011
~l dia. standardsteel pipe forslope indicator
SECTION A-A
Slope indicatorpipe extension
IIIIIIIIIIII
1 III
2IIIIIIpi
~III
3 IIICX)(V'\ -CL. 4 0N I
Q.) Lf'\
a.. 5.f-JQ.)Q.)
6..c::V)
7
8Vl
9
fA tl11
-56 1 -0 l!SECTION B-B
Fig. 12 - Location of Instrumentation on Sheet Piling
44.
I.Jt •
I ,---.......,, .
__..B-__ L.J, .
4 Batter piles
t Batter pi les
1-eu
"'C1...0UQ)l....
<UL.::::J't/)t/) -<0 0l.... I0- -0
N
• t...,.1
r·JIIL .,1
'I,.,J• IL·,I
'Ir:JI.I~-..-·'~ ...I·
'I,..,A
15 1 -011
Back ofretaining wall
----&------,tL-8J I
II,
-It'\
35 1 -011
lwell 1
~~te~__ ___~~te~-_J2 1 -Ql'
III
(S)-- - -- -----~-- -----ICoated Coated
&---------- ~-----lSlope indicatorwe 11 26W I
II
, <S;>------
E1ev .+5 1 -a"
-o
I -N 0
I
Pressure gage
Coaxial cable in2" dia o conduit
SECTION A-A
Fig. 13 - Location of Surcharge Pressure Gages
Axial Load MomentSR4 Gage Stress Stress k i ps/ft of ft kips/ft
Elev. Location ps i ps i wall of wa 11
+5 r...·:()~·:~i,,I,,:
~'iMM!~"!~
~.~. ~
0 1 +9660 D:r=n -9660 a +37.6"""CiIJ
-5 2
,--...-10 3 -10020 «11l +10020 0 -39.1LJJ:P"
-15 ~-·4
~ ...--.-..
-20 5 +27510
~-36930 -52.7 +125e6
-25 6
-30 7 t-
-35 8
-40 9 +44550~~
-49650 -28.5 +183,7
~-45 10
...
-50 11
~
-55 12 ~ -172801ilJIID
-98l0 -151.4 -14.6
Figo 14 - Axial Loads and Bending Momentsin Sheet Piling at Bent 18 After Driving
4-J I" Fi 11 ~ ..Surcharged ... ...
4-'- complet
U')
0- 8.::L.
-11-62
-c 7 2f:M (observed)co ,0-'
co 6 )( 26E (observed).-x«Q)
5 --Q- Theoretical0- ,1-
,0 ,...c: 4uc: ,« ,4-0 3 ,.--+J 9l j6-62 .() ..Jc<D I,r -c0 2
,a.E
':'0u
to 'I'4-J
~C0N
IL- a0 a 3 6 9 12:I:
Time - months
Figo 15 - Horizontal Component of Batter Pile Loadsat 26E and 26w Sheet Piling
LOCAT!ON OF SLOPEINDiCATOR 18 ON
SHEETING AT BENT 18
N
'L!9LJcap
+E
7~12~62
7-12-62
-w .,J::'-J
'I I I II I I I I ! I I I I I 'fi
o +5 -:20 -.1 0 0 +,.1 0 ..J:20 -1;30 +Ao -1;50 -1:60
Deflection of Sheeting - inches Deflect-ion thanges - inches
Fig. 16 - Deflection of ZP 38 Sheet Piling at Bent 18 After Backfilling and Surcharging
I II I I ,...........-. I
+10
+ 5
0
- 5
-10
-&-IOJ -15<J.)
4-
I
c.: -20o -4-Jro>~ -25UJ
"'30
-35
-40
-=45
-50 I 1 .... 5 ----r- +N
-5 0 +5
LOCATION OF SLOPElNDICATOR 26E ON
SHEETING AT BENT 26
tL~S~JN
+ 10 +20o
7-13-62 Sase Reading
-50 -40 -30 -20 -10
+00I I I I I I I I I I
105o
.. I .... +E
+10
I7-13-62
+ 5
0
- 5
-10
+-J
-15())CD~
I
c -200.-+-J(fJ
>Q) -25-
UJ
-30
-35
I -S~+N -w-40
-45
-505 0 5
Deflection of S~eetln9 - inches Deflection Changes j- inches
Fig. '7 - Deflection of ZP 38 Sheet Piling at Bent 26 After Backfilling and Surcharging
-r;:\..0
+.20 +040 +.60 +.80 + 1.0 + 12 + 1.4 + 106ao -.60 -J-iJ -.20
-w I +E
- 5
7-12-62
+5 -10
+N
o
-5
-5-10-50' · · , , , "I~~.~~'~~.~'~,~.~L-J..L---.J.L-J.LJ.
-45
I If dC I ,""""- II • I I i I \ I M a-40 I I I I II
-30 I t 1& I' I I ~ I ..... I Ii!~ 1 I I:IJjIV I
-35
+10, • • Ii I 'I \ [ I l;r II INcLSlJJI
t
LOCATION OF SLOPEINDiCATOR 26W ON
o I ! \ £: I I I :> zcc:=::' 1 Ii \.1 7 c:::::: I I I I liSHEET I NG AT BENT 26
+ 5
- 5
-10
4-J
~ -154-
i
c -200.-J,-J
ro>~ -25l.JJ
Deflection of Sheeting - inches Deflection Changes - inches
Figo 18 - Deflection of ZP 38 Sheet Piling at Bent 26 After Backfilling and Surcharging
50 ..
Slope Indicator - 7/26/62 (Backfilled)Transit and Tape - 9/28/62(Backfil1ed)
Transit andTape
16 Bent Noso3/ 19/63
310/19/62 Slope5/17/63 Indicator
lIB•.
I 3/19/63
10/19/62
I5/17/63
20
Base Readings:
------'"' -- ---==-------
~6E
Slope Indicator
3/19/6
5/17/63
26W
1.2
(/)Q)
..cuc::
.f-JCQ)EQ)>0:1:N
Q)
:31...0 0~
euu 32
""0c .2-sQ)
c-o
.4U')
.6
.8
Figa 19 - Slope Indicator Well Movement at Eleva +1008 1


IX. REFERENCES
1 • Duke, C. MQ ,
FIELD STUDY OF A SHEET PILE BULKHEAD,ASCE, Transactions Paper No. 2572, Vol. 118 pp 1131-1196, 1953.
211 Hakman, pjJ All and Buser, W. M.,BULKHEAD TEST PROGRAM AT PORT OF TOLEDO, OHIO,ASCE Journal of the Soil Mechanics and Foundation Division,Proceedings Paper 3176, June 1962.
3~ Hansen, J. Brinch,A GENERAL EARTH PRESSURE THEORY,Proceedings, 3rd International Conference on Soil Mechanics andFoundation Engineering, Vol. 11 p 170, 1953.
4. Hansen, J. Brinch,SIMPLIFIED STRESS DETERMINATION IN SOILS,Danish Geotechnical Institute, Bulletin No. 20, Copenhagen, 1966.
5• Lea, N. D.,PERFORMANCE OF A STEEL SHEET PILING BULKHEAD,Proceedings, 3rd International Conference on Soil Mechanics andFoundation Engineering, Vol. 11 p 180, Zurich, 1953.
6. Matich, M. A. J., Henderson, R. D. and Oates, D. B.,PERFORMANCE MEASUREMENTS ON TWO NEW ANCHORED BULKHEADS,Canadian Geotechnical Journal, Vol. 1, No.3 pp 167-178, July 1964.
7. Northrup, D. O. and Dismuke, T. D.,PRELIMINARY REPORT - INSPECTION OF EARTHQUAKE DAMAGED PILEDSTRUCTURES IN ALASKA,Unpublished report, American Iron and Steel Institute, 1964.
8. Peck, R. B. and Raamot, T.,FOUNDATION OF IRON ORE STORAGE YARDS,ASCE Journal of the Soil Mechanics and Foundation Division,May 1964.
9. Perry, C. C. and Lissner, H. R.,THE STRAIN GAGE PRIMER,2nd Edition, McGraw-Hill Book Co., Inc., New York, 1962.
10. Rauhut, J. B.,A FINITE-ELEMENT METHOD FOR ANALYSIS OF ANCHORED BULKHEADS ANDANCHOR WALLS,Unpublished PhD dissertation, University of Texas, Austin, 1966.
11. Richart, F. E., Jr.,ANALYSIS FOR SHEET PILE RETAINING WALLS,ASCE Transactions, Vol. 122 p 1113,1957.
12. Richart, F. E., Jr.,ANCHORED BULKHEAD DESIGN BY NUMERiCAL METHOD,ASCE Journal of the Soil Mechanics and Foundation Division, February19600
13 • Rowe, P. W~ ,ANCHORED SHEET PILE WALLS.Proceedings, Institution of Civil Engineers, Part I, Vol. 1,London, England, 1952Q
14. Rowe, P. WQ,A STRESS-STRAIN THEORY FOR COHESIONLESS SOIL WITH APPLICATIONS TOEARTH PRESSURES AT REST AND MOVING WALLS,Geotechnique, London, Vol. IV P 70, 1954.
15. Rowe, P. W.,A THEORETICAL AND EXPERIMENTAL ANALYSIS OF SHEET PILE WALLS,Proceedings, Institution of Ci·vi1 Engineers Part I, Vol. 1 P 32,London, 1955.
16 • Rowe, P. W.,SHEET PILE WALLS ENCASTRE AT ANCHORAGE,Proceedings, Institution of Civil Engineers, Part I, Vol. 1 P 70,London, 1955.
17 • Rowe, P. W.,THE STRESS-DILATANCY RELATION OF STATIC EQUILIBRIUM OF AN ASSEMBLYOF PARTICLES IN CONTACT,Proceedings, Royal Society, Series A, Vol. 269 P 500, London, 1962.
18. Spangler, M. G.,SOIL ENGINEERING,International Textbook Co., Scranton, Pa., 1960.
1ge Strayer, J. R.,EARTH PRESSURE ON FLEXIBLE WALLS,Institute of Civil Engineers, Journal Vol. 1 P 94, London, 1930.
20. Terzaghi, K.,EVALUATION OF COEFFICIENTS OF SUBGRADE REACTION,Geotechnique, Vol. 5 P 297, December 1935.
21 • Terzagh i, K0 ,
GENERAL WEDGE THEORY OF EARTH PRESSURE,ASCE Transactions, Vol. 106 pp 68-97, 1941.
22 0 Terzaghi, Ke,ANCHORED BULKHEADS,ASCE Transactions, Vol. 119 p 1243, 1954.
55~
23g Thompson, P. J. and Matich, J. A. J.,THE PERFORMANCE OF SOME STEEL SHEET PILE BULKHEADS,Proceedings, 15th Canadian Soil Mechanics Conference, pp 80-114, 1961.
24. Tschebotarioff, G. P.,FINAL REPORT ON LARGE SCALE EARTH PRESSURE TEST WITH MODELFLEXIBLE BULKHEADS,Princeton University, 1949.
25. Tschebotarioff, G. P. and Ward, E. R.,MEASUREMENTS WITH WIEGMANN INCLINOMETER ON FIVE SHEET PILE BULKHEADS,Proceedings, 4th International Conference on Soil Mechanics andFoundation Engineering, Vol. I I p. 248, London, 1957.
26. Tschebotarioff, Go P., Ward, Eo, D-iBiagio, Eo, Watkins, J., andPerrine, D.,BENDING MOMENTS BY DIRECT MEASUREMENTS,Engineering News-Record, April 24, 1958.
27. Turabi, D. A. and Ballo, A.,SHEET-PILE ANALYSIS BY DISTRIBUTION THEORY,ASCE Journal of the Soil Mechanics and Foundation Division,January 1968.

ACKNOWLEDGMENTS
This investigation by Bethlehem Steel Corporation was
conducted on a bulkhead constructed at its Sparrows Point, Maryland
Plant.
Special thanks are due for the assistance of L. F. Baum
and the Field Engineers of the Sparrows Point Plant Engineering
Department 0
The review of this work by Professor H. Y. Fang is
apprec i ated .
56.