Embed Size (px)
Citation preview

FIELD STUDY OF MACRODISPERSION IN A HETEROGENEOUS AQUIFER1. OVERVIEW OF TRACER EXPERIMENT
J. Mark Boggs, Steven C. Young, and William R. Waldrop Tennessee Valley Authority Engineering Laboratory
Norris, Tennessee 37828
Lynn W. Gelhar and E. Eric Adams Massachusetts Institute of Technology
Cambridge, Massachusetts 02139
Kenneth R. Rehfeldt Illinois State Water Survey
Champaign, Illinois 61820-7495
ABSTRACT
A large-scale natural-gradient tracer experiment has been conducted at a field site located at Columbus Air Force Base in northeastern Mississippi. The alluvial aquifer at the test site is composed of lenticular deposits of sand, gravel, silt and clay, and is quite heterogeneous with respect to its hydraulic properties. Ten cubic meters of a solution containing bromide and three organic tracers (pentafluorobenzoic acid, o-trifluoromethylbenzoic acid, and 2,6-difluorobenzoic acid) were injected into the aquifer at a uniform rate over a period of two days. The tracer plume was subsequently monitored in three dimensions over a 20-month period using a network of 258 multilevel sampling wells. The tracer concentration distribution of the plume at the conclusion of the experiment was highly asymmetric in the longitudinal direction. The peak tracer concentration was located only 7 m from the injection point, while the advancing side of the plumeextended downgradient a distance of more than 260 ml The extremeskewness of the plume was caused by large-scale spatial variations in themean groundwater velocity along the plume travel path produced by the approximate two-order of magnitude increase in the mean hydraulic conductivity between the near-field and far-field regions of the experimental site. The tracer mass balance during the experiment showed a declining trend between sampling events with approximately 50 percent of the injected tracer mass unaccounted for at the end of theexperiment. Laboratory column experiments indicated that approximately 20 percent of the tracer mass was adsorbed to the aquifer matrix. The remaining 30 percent of the missing tracer mass was attributed to incomplete sampling coverage of the plume, particularly on the advancing side, and to a sampling bias produced by the multilevel samplers.
INTRODUCTION
The current awareness and concern over the environmental impacts of groundwater contamination have motivated research aimed at improving methods for predicting groundwater solute transport. Much of the research in recent years has been directed towards development of a more

physically-based mathematical description of the physical transport processes in naturally heterogeneous aquifers, particularly with respect to the treatment of field-scale dispersion. Common to most of the new modeling approaches is the recognition that macroscopic dispersion is not a diffusion phenomenon as described by the classical convection- dispersion equation, but is produced by the spatial variability of the hydraulic characteristics of natural aquifers [e.g., Smith and Schwartz, 1980; Dagan, 1982; Gelhar and Axness, 1983; and Nolz et al., 1983]. To evaluate the new modeling concepts requires controlled field experiments providing three-dimensional observations of large-scale transport of nonreactive tracers as well as extensive measurements of hydraulic conductivity from which the spatial statistics conductivity variability can be estimated. Recently completed field experiments at the Borden site [Freyberg, 1986 and Sudicky, 1986] and at the Cape Cod site [Garabedian, 1987] offer this type of data for relatively homogeneous glacio-fluvial aquifers. However, to fully evaluate the predictive value and robustness of the new transport theories, models must be applied to a wide range of aquifers including very heterogeneous systems exhibiting large variances of hydraulic conductivity.
This paper describes the results of a large-scale field study conducted for the Electric Power Research Institute in a substantially more heterogeneous aquifer than those of the Borden and the Cape Cod sites. An alluvial aquifer setting was selected for the study because of its relevance to the electric power industry. The overall approach involved a natural-gradient tracer experiment initiated with a pulse injection ofa known quantity of tracer solution. Because only physical processes ofgroundwater transport were of interest, nonreactive chemical tracers were selected for the experiment. The tracer plume was monitored in three-dimensions periodically during the experiment with an extensivenetwork of multilevel sampling wells. The overall features of the plume,including the total tracer mass, the centroid, the concentration variance about the centroid in longitudinal and traverse directions, were estimated from the spatial moments of the concentration measurements for each sampling event. In addition, a detailed characterization of the aquifer at the test site was carried out emphasizing measurements of the spatial variability of hydraulic conductivity. Investigations of hydraulic conductivity variability at the test site are the subject of a companion paper by Boggs and Rehfeldt [these proceedings].
In this paper, we present a description of the field test site, the overall experimental design and procedures, and a qualitative review of the tracer test results. Investigations into the anomalous tracer mass balance trend observed during the experiment and a summary of the findings associated with these investigations are also discussed.
SITE DESCRIPTION
The experimental site is located at Columbus Air Force Base in northeastern Mississippi (Figure 1). The shallow unconfined aquiferwhich immediately underlies the site consists of a shallow alluvial

Figure 1. Site Location Map
terrace deposit averaging approximately 11 m in thickness. The aquifer is composed of poorly-sorted to well-sorted sandy gravel and gravelly sand with minor amounts of silt and clay. Sediments are generally unconsolidated and cohesionless below the water table, but occasional semi-consolidated zones have been encountered during drilling. Mapping of an aquifer exposure (approximately 20 m in length by 2 m in height) by Rehfeldt et al. [1989] indicated soil facies occur as irregular lenses and layers having horizontal dimensions ranging up to 8 m and vertical dimensions of less than 1 m. Marine sediments belonging to the Eutaw Formation and consisting of clays, silts, and fine-grained sands form an aquitard beneath the alluvial aquifer.
The sand and gravel components of the aquifer are composed of chert, feldspar, and mica. Fine-grained materials (i.e., those passing the 0.074-mm sieve) consist of quartz, potassium feldspar, muscovite, and clay minerals. Clay minerals present are predominantly kaolinites and illites with minor amounts of montmorillonites and vermiculites. Soil particles are commonly coated with iron oxides. Measurements of free iron oxides ranged from 2.0 to 3.9 percent by weight for particles less than 2 mm in diameter, and from 0.5 to 0.8 percent for particles larger than 2 mm. Aquifer porosity, bulk density, and particle density

determinations were made for 84 minimally-disturbed soil cores collected from four coreholes at the tracer test site. The bulk density of the samples were estimated from the measured dimensions and dry mass of the core segments. The mean bulk density of the 84 samples was 1.77 g/cc, and the standard deviation of the measurements was 0.18 g/cc. The mean and standard deviation of the particle density measurements were 2.57 and 0.07 g/cc, respectively. Sample porosity was estimated from the measured sample volume and the calculated bulk density and particle density for each sample. The mean and standard deviation of the porosity measurements were 0.31 and 0.08, respectively.
The groundwater has a low total dissolved solids content averaging43 mg/L and consequently a low electrical conductance. The ioniccomposition of the groundwater is dominated by sodium, silica andchloride. Total acidity averages 71 mg/L (as CaC03). Alkalinityaverages 9.6 mg/L and is mainly in the form of carbon dioxide andbicarbonate. Because of the low acid-neutralizing capacity of the groundwater, dissolved carbon dioxide strongly affects the pH which averages only 4.8.
The hydraulic-head field at the tracer test site exhibits complex temporal and spatial variability produced by the heterogeneity of the aquifer and large seasonal fluctuations of the water table. Figure 2 shows a comparison of the potentiometrie surfaces constructed using head measurements from the deep and shallow piezometer networks at the test site. The general direction of groundwater movement inferred from both potentiometric surfaces is northward, although local differences in the magnitude and direction of the horizontal hydraulic gradient are evident particularly in the far-field region of the site. An important feature of both surfaces is the V-shaped pattern of contours indicated in the southern part of the site. This contour configuration indicates converging groundwater flow toward a narrow zone of relatively high meanhydraulic conductivity approximately aligned with the vertex of theV-contours, and an increasing groundwater velocity in the zone of convergence. The converging groundwater flow field in the vicinity of the tracer injection site played an important role in the overall evolution of the tracer plume. The overall configurations of thepotentiometric surfaces shown on Figure 2 are indicative of the relative hydraulic conductivity distribution at the test site. The widely spaced contours corresponding to small hydraulic gradients shown in thefar-field region of the test site indicate relatively high conductivity, whereas the closely-spaced contours (large hydraulic gradients) in the near-field indicate relatively low conductivity.
Seasonal fluctuations in the water table during the study period range from 2 to 3 m, resulting in a 20 to 30 percent variation in the saturated thickness of the aquifer (Figure 3). The magnitude of the horizontal hydraulic gradient (|Jhl)* estimated by fitting a plane to the piezometric head measurements, averaged approximately 0.003, and exhibited seasonal periodicity corresponding to water table fluctuations. Directional variations in the mean horizontal gradient

Y (m
)
u>œ
X (m)
Figure 2. Potentiometrie Surface Haps Derived From October 11, 1989 Head Measurements in Shallow (Left) and Deep (Right) Observation Wells. Mean Well Screen Elevations for Shallow and Deep Well Networks Were 61.1 m and 56.3 m, Respectively

I Po
tent
iom
etrie
Su
rfac
eG
h (d
egre
es)
« hi
Elev
aUon
(m
)
Figure 3. Temporal Variations in the Potentiometric Surface Elevation, Magnitude of the Horizontal Hydraulic Gradient (|Jhl)» Direction of Horizontal Gradient (9^, Measured in Degrees West of North), and Magnitude of the Vertical Hydraulic Gradient (|J2 |)

(6^) were not correlated with the water table position, and no clear seasonal trend was indicated. The mean and standard deviation of the directional component of the horizontal gradient were N29°W and 11”, respectively. Unlike other experimental sites [e.g., MacKay et al., 1986 and Garabedian, 1987], the vertical hydraulic gradients at the Columbus site were commonly of the same magnitude or larger than the horizontal gradients. Temporal variations of the vertical hydraulic gradients estimated from head measurements in two staged piezometers are shown in Figure 3. It is evident that the magnitude of the vertical gradient was also correlated with seasonal water level variations. Piezometers located upgradient of the tracer injection point (e.g., P22AB) exhibited downward (positive) vertical gradients ranging up to approximately 0.1, while upward to near-neutral vertical gradients ranging from -0.003 to 0.000 were indicated for piezometers (e.g., P42AB) positioned downgradient of the injection point.
A summary of the results from two large-scale aquifer tests (ATI and AT2) and the tracer injection test (IW) conducted at the site is given in Table 1. The aquifer parameters for AT2 are the most relevant because the test was approximately centered on the tracer test site. The order of magnitude difference in the hydraulic conductivities for AT2 and the other two tests is an indication of large-scale variability in aquifer characteristics at the site. The specific yield estimates indicate the aquifer is unconfined to semi-confined.
TABLE 1
Global Aquifer Properties From Large-Scale Aquifer Tests [Boggs et al., 1990]
Transmissivity, Hor. K, Vert. K,Test cm2/s cm/s x 10-3 cm/s x 10“3ATI 1.8 2.2 0.13 0.04AT2 20.1 20.0 2.8 0.10IW 2.1 2.5 --------- —
The spatial distribution of hydraulic conductivity at the site was determined from 2187 measurements of conductivity obtained from borehole flowmeter tests in 49 wells [Boggs et al., 1990]. In general, these data indicated a distinct contrast between the mean hydraulic conductivities of the near-field and far-field regions of the tracer test site. Themean hydraulic conductivity estimated for the near-field wasapproximately 10“3 cm/s, whereas conductivities in the far-field were generally one to two orders of magnitude larger. Boggs et al. [1990] reported that the variance of log hydraulic conductivity estimated from a detrended set of borehole flowmeter measurements was 2.8. By contrast, the estimated log conductivity variances for the Borden [Sudicky, 1986] and Cape Cod [Hess, 1989] sites were 0.29 and 0.26, respectively. Thereader is referred to Rehfeldt and Boggs [these proceedings] for a morecomprehensive discussion of the spatial variability of hydraulic conductivity at the test site estimated from the borehole flowmeter and other techniques.
METHODS
Tracer Iniss-tion
Because the intent of the natural-gcadient tracer experiment was to investigate physical transport processes, a group of inorganic and organic anions shown to be conservative in previous laboratory and field groundwater studies were selected as tracers. These tracers included bromide in the form of CaBr2, pentafluorobenzoic acid (PFBA), trifluoromethylbenzoic acid (TFBA), and orthodifluorobenzoic acid (DFBA). Bromide was the primary tracer because it performed conservatively in numerous previous field and laboratory experiments [e.g., Jester and Uhler, 1974; Bassett et al., 1981]. The three fluorinated benzoic acids (FBA) were shown by Malcolm et al. [1980] and Bentley and Walter [1983] to perform conservatively in field studies, and were included in the tracer solution as backups and checks on bromide. There was the additional advantage that the three FBA tracers could be analyzed simultaneously with bromide by high pressure liquid chromatography (HPLC) coupled with ultraviolet adsorption detection.
The method of injecting the tracer solution into the aquifer was designed, to the extent possible, to produce a uniform pulse release of tracers into approximately the middle of the saturated zone of the alluvial aquifer with a minimal amount of disturbance to the natural flow field. Five 5.2-cm diameter injection wells spaced one meter apart in a linear array were used to introduce the tracer solution into the aquifer. Injection wells were screened between depths of 7.4 to 8.0 m below ground surface (or approximately 2.9 to 3.5 m below the water table). Beginning on October 28, 1986, 10.07 m 3 of groundwatercontaining 2,500 mg/L of bromide and 400 mg/L of each of the FBA tracers were metered into the injection wells at a uniform rate over a period of48.5 hours. The maximum pressure head increase in the injection wells during the period w aB 0.64 m.
Monitoring Approach
The primary goal in designing the tracer sampling network was to obtain detailed measurements of the tracer distribution in three dimensions during the experiment. This required the use of multilevel samplers (MLS) to provide representative water samples from discrete zones in the aquifer. Because the natural vertical hydraulic gradients were large in comparison to the horizontal gradients in some areas of the test site, special MLS designs were required to prevent or minimize artificial vertical groundwater movement in the disturbed annulus created by sampler installation.
Two basic MLS designs, referred to as the augered MLS and the driven MLS, were developed and tested for use in the field study. Both samplers generally consist of a rigid pipe through which 20 to 30 teflon sampling tubes were inserted to different sampling depths. A uniform spacing between sampling ports of 38 cm was used on the majority of the MLS,
although several of the initial driven MLS prototypes installed in the injection site vicinity had port spacings ranging from 25 to 46 cm. Theaugered MLS was installed by augering to the base of the alluvialaquifer, installing the sampler through an 8.6-cm ID by 18-cm OD hollow-stem auger, removing the auger, and allowing the aquifer to collapse around the sampler. External bentonite packers attached between sampling ports on the augered samplers were intended to prevent artificial groundwater movement in the well annulus. The driven MLS was constructed from 4.4-cm diameter flush-joint steel casing. These devices were installed by augering to the water table, lowering the sampler into the auger hole, then driving the sampler to final depth using a 63.6 kg standard penetration hammer. Unlike the augered MLS which tended to reduce the density of the aquifer at the point of installation, thedriven sampler tended to compact the aquifer locally. Both samplersshowed similar results in field tests designed to evaluate the ability of each well to provide discrete representative groundwater samples. The augered MLS was selected as the primary design for the tracer sampling network because of its lower construction costs.
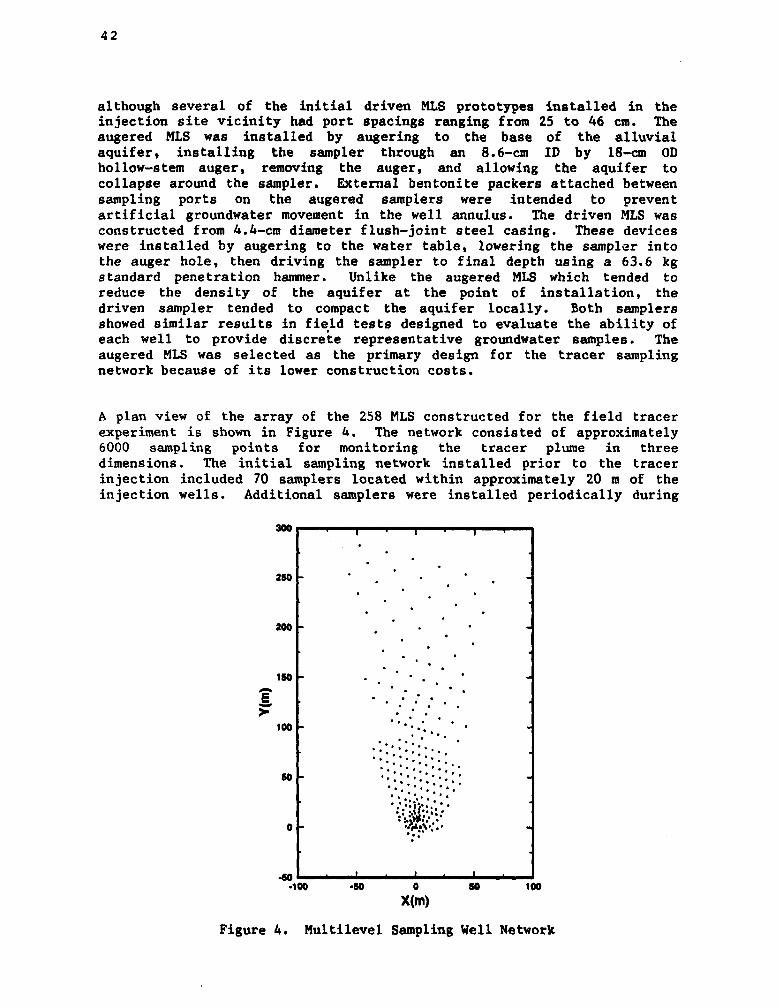
A plan view of the array of the 258 MLS constructed for the field tracer experiment is shown in Figure 4. The network consisted of approximately 6000 sampling points for monitoring the tracer plume in three dimensions. The initial sampling network installed prior to the tracer injection included 70 samplers located within approximately 20 m of the injection wells. Additional samplers were installed periodically during
Figure 4. Multilevel Sampling Well Network

the experiment as the overall direction and transverse dimensions of the plume became evident. Groundwater samples were collected from the multilevel samplers using a mobile sampling cart equipped with three, ten-channel peristaltic pumps. This device permitted simultaneous collection of groundwater samples from all sampling tubes for a single MLS.
Three basic monitoring schemes were employed during the natural-gradient tracer experiment. The emphasis of the monitoring program was on "snapshots" of the tracer plumes which consisted of periodic sampling of the complete three-dimensional concentration distribution of each tracer. A total of eight snapshot sampling events were conducted during the experiment at intervals ranging from 5 to 19 weeks. A summary of general information regarding the plume snapshots is given in Table 2. Note that for the eighth snapshot only samples collected from MLS located along the approximate centerline of the network and those located beyond a distance of 160 m from the injection site were analyzed. In addition to the snapshots, samples were routinely collected at 3 to 6 week intervals at selected MLS ports for purposes of tracer breakthrough curve analysis. In conjunction with each breakthrough sampling event, a reconnaissance survey of the leading edge of the tracer plume was carried out by sampling approximately 20 MLS located along the downgradient fringe of the sampling network.
TABLE 2
Plume Snapshot Sampling Summary
Elapsed No. MLS SamplesSnapshot Time, davs Sampled Analyzed
1 9 45 8092 49 61 10343 126 102 17954 202 124 18125 279 128 16816 370 139 15577 503 162 22398 594 182 519
TRACER PLUME MONITORING RESULTS
Plume Observations
Isoconcentration plots of the vertically-averaged bromide concentration at 49, 279, and 503 days after injection are shown in Figure 5. The dominant feature of the plume was the asymmetry of the concentration distribution in the longitudinal dimension which evolved during the study. The more concentrated region of the plume remained within approximately 20 m of the

40
20e
•>_* 0>-
-20
-40 ln . I____ L jL J ____ L J _____L'40 -20 0 20 40 60 80 100 120 140 160 180 200
X (m)279 d a y s
40
206
w 0>-
1 ru <S
-40 J___1___I _L-40 -20 0 20 40 60 60 100 120 140 160 180 200
X Cm)
503 d a y s
BROMIDE CONCENTRATION (mg/I)3 > LOG,g C > 2
1 > LQGt0 C > 0
2 > LOG,0 C > 1
I l 0 > >
Figure 5. Depth-Averaged Bromide Concentration Distributions49 Days, 279 Days, and 503 Days Since Injection
injection point, while the advancing side of the plume extended downgradient a distance of more than 160 m after 503 days. By contrast, the horizontal transverse spreading of the plume was relatively small and symmetrical.
Figure 6 presents vertical cross sections through the bromide plume at 49, 279, and 594 days after injection. As in the case of the horizontal views

49 days
o>_a>a>
646 2605 8
565 4
1 1V
-
“ +JIc o n c e n tro tio n
”
> too ppm“ fajj ÎSI > 10 ppm- * ■ > 1 ppm
WÊ > 0.1 ppm----- 1------------ j _ i i__L
f* +______1___
279 days
594 days
c oo >
9 1 0 0 1 5 0
x(m)Figure 6. Longitudinal Sections of Bromide Plume 49 Days,
279 Days, and 594 Days Since Injection
of the plume, the extreme longitudinal skewness of the concentration distribution of the plume is evident in the vertical plume sections. Considering the fact that the injection wells were screened over an approximate one-meter interval from elevation 57 to 58 m, the initial vertical spreading of the plume of approximately 6 m was surprisingly large. The large initial vertical mixing is primarily attributed to the artificial vertical gradients created by tracer injection as well as the natural upward vertical gradients present in the injection site vicinity. Density differences between the tracer solution and ambient groundwater may also have contributed to the downward spreading of the plume as evidenced by the zone of high bromide concentration between approximate elevations 55 and 58 m. The subsequent response of the plume to the natural upward vertical gradients in the near-field region is indicated in the two later bromide concentration profiles. Examination of the bromide profile at 594 days shows the maximum bromide concentrations were located in the upper part of the plume near the water table. An interesting feature of plume waB the reduction in plume thickness that occurred between distances of approximately 20 and 40 m downgradient from the injection point. Natural channeling of groundwater flow through a

relatively permeable zone coinciding with the vertical position of the plume in this region is inferred from this feature. Downgradient of this neck-like feature, the vertical extent of the plume increased once again. The progressive downward spreading of the plume in the far-field region was consistent with the downward vertical hydraulic gradients observed in this region.
It is clear from the comparison of the longitudinal bromide profile at 594 days and the hydraulic conductivity profile along approximately the same transect shown on Figure 7, that the overall plume migration behavior can be explained by the spatial distribution of hydraulic conductivity along the travel path of the plume. The tracer injection site was located in a region of relatively low hydraulic conductivity, i.e., approximately 10~3 cm/s. Consequently, movement of the main body of the plume in the near-field was relatively slow, i.e., on the order of 5 to 10 tn/yr. Approximately 20 m downgradient of the injection point, the front of the plume slowly discharged into sediments in the middle to upper part of the aquifer having hydraulic conductivities of 10-2 to 10-1 cm/s. Once in the higher conductivity materials which dominate the far-field region of the test site, the plume migrated rapidly downgradient at rates in excess of 100 m/yr. The high degree of longitudinal asymmetry of the plume was clearly the result of large-scale variations in the mean groundwater velocity field which, in turn, were a consequence of the large-scale variations in mean hydraulic conductivity along the plume travel path.
64 62
E 60w SB
S S2J 50* 4#
46
HYDRAULIC CONDUCTIVITY PROFILE64
_ 62 E 60
w SB
§ M “ 54S 52 £ 50
46
-10 0 20 40 60 BO 100 120 140 160 180 200 220 240 260 2<0
x (m)
Figure 7. Comparison of Vertical Profiles of Bromide Concentration 594 Days Since Injection (Top) and Hydraulic Conductivity (Bottom) Along a North-South Transect
B R O M I D E P L U M E P R O F I L E ( 1 = 5 9 4 d a y s )T — T ■ I ...il. ! — I—«iniT" ■ 1. 1.1 I 1 1 1 I" 1 I
> 100 ppm ■ > 1 ppmU S > 10 ppm ■ > 0.1 ppm■ ■ ■ ■ ■ » ■ i I - ■ ■ ■ ' ■ '
Tracer Mass Balance
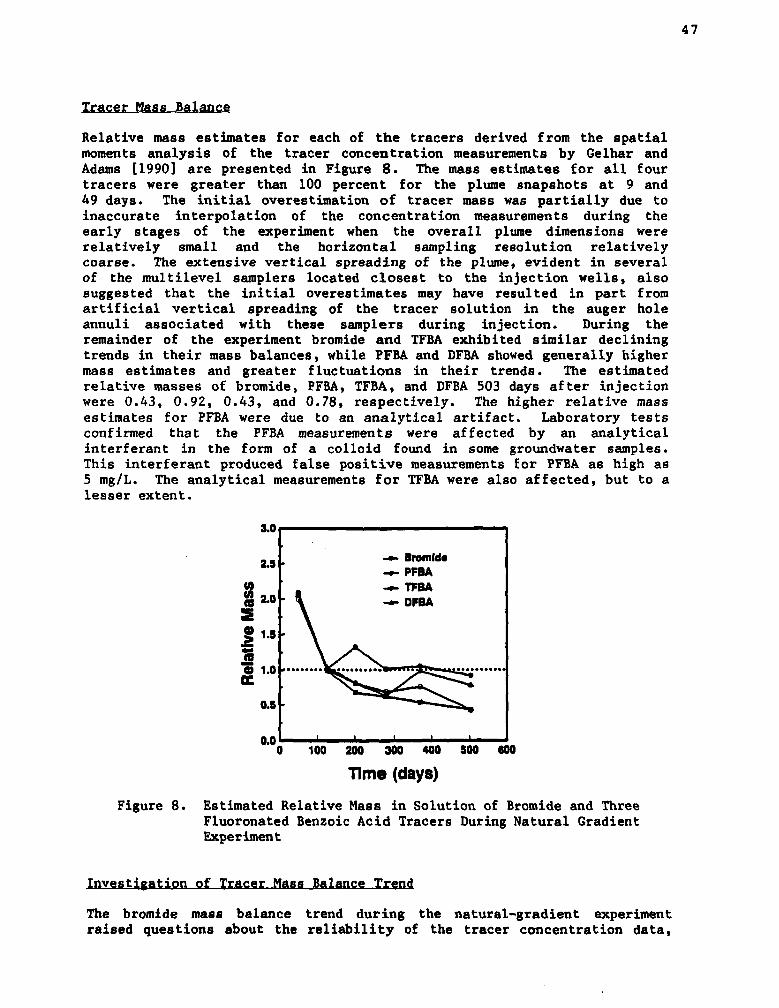
Relative mass estimates for each of the tracers derived from the spatial moments analysis of the tracer concentration measurements by Gelhar and Adams [1990] are presented in Figure 8. The mass estimates for all four tracers were greater than 100 percent for the plume snapshots at 9 and49 days. The initial overestimation of tracer mass was partially due to inaccurate interpolation of the concentration measurements during the early stages of the experiment when the overall plume dimensions were relatively small and the horizontal sampling resolution relatively coarse. The extensive vertical spreading of the plume, evident in several of the multilevel samplers located closest to the injection wells, also suggested that the initial overestimates may have resulted in part from artificial vertical spreading of the tracer solution in the auger hole annuli associated with these samplers during injection. During the remainder of the experiment bromide and TFBA exhibited similar declining trends in their mass balances, while PFBA and DFBA showed generally higher mass estimates and greater fluctuations in their trends. The estimated relative masses of bromide, PFBA, TFBA, and DFBA 503 days after injection were 0.43, 0.92, 0.43, and 0.78, respectively. The higher relative mass estimates for PFBA were due to an analytical artifact. Laboratory tests confirmed that the PFBA measurements were affected by an analytical interférant in the form of a colloid found in some groundwater samples. This interférant produced false positive measurements for PFBA as high as5 mg/L. The analytical measurements for TFBA were also affected, but to a lesser extent.
Figure 8. Estimated Relative Mass in Solution of Bromide and Three Fluoronated Benzoic Acid Tracers During Natural Gradient Experiment
Investigation of Tracer Mass Balance Trend
The bromide mass balance trend during the natural-gradient experiment raised questions about the reliability of the tracer concentration data,

and consequently the validity of the calculated spatial moments based upon these data. Several possible causes for the mass balance trend were investigated, including: the method of tracer mass estimation; analyticalerror associated with tracer concentration measurements; tracer retention in the vadose zone resulting from water table fluctuations; variations in aquifer porosity; incomplete sampling of the plume; tracer adsorption to the aquifer matrix; and sampling bias associated with the multilevel samplers.
Sensitivity analyses related to the interpolation and integration of the tracer mass from the spatial concentration measurements indicated no systematic bias that would account for the observed tracer mass balance trends [Gelhar and Adams, 1990]. Similarly, an evaluation of laboratory quality control showed no evidence of an analytical bias in the tracer concentration measurements to account for the anomalous mass trend.
The potential for capillary retention of a fraction of the dissolved tracer mass in the vadose zone was clearly indicated from the close proximity of the plume to the water table (Figure 6) and the large seasonal fluctuations of the water table during the experiment (Figure 3). In an attempt to quantify the amount of tracer mass retained in the vadose zone following a decrease in the water table elevation, nine coreholes were completed in the vadose zone overlying the more concentrated part of the plume in October 1988 (approximately 360 days after injection). The bromide concentrations measured for the pore-water extracts from 117 soil cores indicated an average bromide concentration of 0.9 g per cubic meter of soil was estimated for the 2-m interval above the water table within the region encompassed by the coring investigation. Extrapolating this result over the approximate areal extent of the tracer plume at the time of the investigation, yielded a conservative estimate of the total bromide within the vadose zone of 0.6 kg or less than two percent of the total injected bromide mass.
Estimation of the tracer mass in solution assumed a constant porosity. If the mean porosity of the aquifer actually varied substantially in the tracer test region, mass balance calculation errors could result. However, the mean porosities estimated from 84 minimally-disturbed soil samples collected from four coreholes located along the approximate centerline of the plume were quite similar, ranging from 0.30 to 0.32. These results eliminate large-scale porosity variation as an explanation for the observed mass balance trend.
The network of multilevel samplers installed prior to and during the experiment adequately encompassed the tracer plume in the horizontal transverse direction, however, as indicated by Figure 5, bounding of the leading edge of the plume was incomplete. Following the snapshot 503 days after injection, a serious effort was made to bound the front of the plume. Thirty-three samplers were installed to extend the downgradient limit of the sampling network from 160 m to 260 m. However, results of the subsequent partial snapshot conducted 594 days after injection showed
bromide concentrations of up to approximately 0.4 mg/L (i.e., approximately ten times the background bromide concentration) at several sampling points along the 260-m row of samplers. Integration of the bromide mass over the region represented by the 33 new samplers accounted for approximately 17 percent of the injected bromide mass. How much more of the missing tracer mass was present beyond the 260-m row of samplers at the time of this sampling cannot be reliably estimated due to the lack of accurate groundwater velocity estimates in the far-field region of the test site.
Minor truncation of the upper side of plume also occurred during theexperiment as a result of incomplete sampling of the plume between the phreatic surface and the first MLS sampling points below the phreaticsurface. Sensitivity analyses involving linear extrapolation of the measured tracer concentrations at the uppermost sampled point to a zero concentration one port-spacing above showed that vertical truncation couldonly account for approximately ten percent of the injected tracer mass[Gelhar and Adams, 1990].
The presence of iron oxides in the aquifer matrix in combination with the low groundwater pH produced a geochemical environment conducive to adsorption of the anionic tracers during the field experiment. To quantify the level of adsorption that may have occurred a laboratory column experiment was conducted. The experiment was carried out using a5.2-cm diameter by 100-cm long column packed with minimally disturbed aquifer material. The pH of the column was maintained at approximately 4.6, and tritium was included in the solution as the conservative reference tracer along with bromide and the FBA tracers. The flowrate through the column was maintained at approximately 4.8 cm/d or about 18 m/yr to provide pore-water residence times comparable to actual field conditions.
The normalized breakthrough curves for bromide and tritium shown in Figure 9 indicate retardation of bromide relative to the bulk solution. A retardation factor of 1.2 was estimated for bromide based on the ratio of the centroids of the bromide and tritium breakthrough distributions. The FBA tracers exhibited slightly less retardation than bromide with estimated retardation factors of approximately 1.1. The calculated retardation factors, Rf, for bromide and the FBA tracers were used to obtain an approximate estimate of the total mass of each tracer adsorbed during the field experiment. Assuming a linear reversible adsorption isotherm describes the adsorption reaction in both the laboratory and field experiments, the distribution coefficient, K<|, for each tracer can be estimated from its measured Rf using Equation (1) [Freeze and Cherry, 1978].
Kd = n(Rf - l)/p (1)
where n is the porosity and p is the dry bulk density of the aquifer. Recognizing that the distribution coefficient physically represents the ratio of the adsorbed tracer mass (Ma) per unit mass of soil to the

Figure 9. Soil Column Breakthrough Curves for Tritium and Bromide
tracer mass in solution (Ns) per unit volume of solution, and that the sum of Ma and Ms must equal the total injected tracer mass (M0), the fraction of the total injected tracer mass in the adsorbed phase can be estimated from Equation (2).
Ma/M0 = pKd/(n+pKd) (2)
Using these results it is estimated that approximately 17 percent of the injected bromide and 9 percent of the injected FBA tracers were adsorbed during the field experiment. The column results indicate that adsorption of the anionic tracers contributed to the under-recovery of tracer mass during the field experiment. However, it is unlikely that adsorption alone accounted for the total underestimation of the tracer mass.
The question of whether the samplers provided representative groundwater samples during the field study was investigated primarily through a comparison of the bromide measurements for samples collected from the multilevel samplers with measurements obtained from adjacent soil cores. Minimally disturbed soil cores were collected adjacent to five multilevel samplers, four of which were located in the near-field region and a fifth site located approximately 70 m downgradient of the injection point. Coreholes were positioned within approximately one meter from each designated sampler. At one site (sampler D18), two coreholes spaced 1.5 m apart were completed to provide reference measurements on the natural variability of tracer concentration over distances comparable to the spacing between the samplers and coreholes. Separate pore-water samples were serially extracted from the soil cores in the laboratory under vacuums of 0.5 bar and 5 bars. The bromide concentrations measured for the core extracts were then compared with concentrations measured for samples collected from vertically adjacent sampling points on the multilevel sampler.
Before examining the comparisons between the bromide measurements for soil core extracts and the multilevel samples, two general observations concerning the results are noteworthy. First, the bromide concentrations for the 5-bar soil pore-water extracts were an average of 3.1 times higher

than those for the 0.5-bar extracts. The 0.5-bar extracts probably represent more mobile, lower concentration groundwater associated with the more permeable zones in the aquifer matrix, while the 5-bar extracts represent less mobile, more concentrated fluids which diffused into less permeable regions of the matrix. This result suggests that matrix diffusion may be an important process in the heterogeneous aquifer at the test site. Second, the discrepancies between the bromide measurements at certain elevations (e.g., elevation 61 m) for the two closely-spaced coreholes shown on Figure 10 indicate that some allowance for natural variability must be made when comparing on a point-by-point basis the bromide profiles for adjacent multilevel samplers and coreholes. Such differences are the result of the aquifer heterogeneity, and will complicate any attempt to ground-truth the multilevel samplers using alternative groundwater sampling methods such as coring.
I “0 58
1 56ÛJ
54
52
0* - 11 !»»»»■
•.... CD18N — CD18W
10 20 30 40Bromide (mg/L)
50
Figure 10. Comparison of Soil Core Extract Bromide ConcentrationMeasurements for Two Corehole Sites Located Approximately1.5 m Apart
Figure 11 shows bromide measurements for MLS-core comparison sites D21 and M151 located at distances of approximately 5 m and 70 m, respectively, from the injection point. These results indicate that the MLS data generally showed the same vertical bromide concentration distribution as the soil core extracts. Large discrepancies in the bromide measurements for the two sampling methods were observed in some cases (e.g., site 021, approximate elevation 58 m); however, it is unclear whether suchdifferences were attributable to natural spatial variability or to sampling bias.
A statistical comparison of the vertically-averaged bromide concentrations for the two sampling methods provide a means of examining the overall

Figure 11. Comparison of Bromide Concentration Measurements for MLS Samples and Pore-Water Extracts From Adjacent Soil Cores. Sites DZ1 and M151 are Located Approximately 5 m and 7k m, Respectively, Northwest of the Injection Point
differences between the MLS and core sampling tracer concentration measurements. A weighted-average bromide concentration was calculated for each core sample based on the measured volumes and concentrations for the 0.5-bar extract, 5-bar extract, and the residual pore-water remaining in the sample after extraction. The bromide concentration of the residual pore-water was assumed equal to the 5-bar extract concentration. Thevertically-averaged concentration for each corehole was then computedusing the individual sample weighted-average values. The average was calculated for a vertical interval common to both the corehole and the adjacent MLS. The resulting mean bromide concentrations for the sixcoreholes and closest adjacent MLS are given in Table 3. A t-test of thenormalized paired differences indicated that the mean difference in the vertically-averaged concentrations for the two methods was significant at the 70 percent confidence level, but not at the 95 percent level. This result can be interpreted as a weak indication of a systematic difference between the two sampling methods. If sampling bias occurred during the field experiment, it was most likely the result of (1) preferential sampling of the more mobile fluids within the aquifer by the MLS in a system where the migration of the tracer was affected by matrix diffusion, (2) artificial groundwater movement within the disturbed well annuli associated with the multilevel samplers, or (3) a combination of these processes. Both processes can be shown to qualitatively account for the entire tracer mass balance trend including the initial overestimation of tracer mass.

TABLE 3
Comparison of Depth-Averaged Bromide Concentrations Estimated for Soil Core Samples and Adjacent Mulilevel Samplers
Corehole Adjacent Separation Aygi BjcQW>idaimg/L.) NormalizedNo. MLS Di8-tan.ç.e.(fli) Core MLS Difference
CD21 D21 0.95 25.1 15.7 0.37CD18N D18 1.00 15.7 16.5 -0.05CD18W D18 0.90 12.7 16.8 -0.32CM50 M50 0.95 13.7 8.1 0.41CM66 M66 1.00 5.5 3.8 0.31CM151 M151 1.10 0.73 0.58 0.21
In summary, the investigations indicated that the anomalous mass balance trend observed during the natural-gradient tracer experiment was produced by a combination of several factors. The initial overestimates of the bromide mass were attributable to poor sampling resolution and to artificial vertical spreading of the tracer solution in the disturbed auger hole annuli associated with several of the multilevel samplers located close to the injection site. With respect to the subsequent decline and under-recovery of tracer mass, laboratory column studies showed that approximately 15 to 20 percent of the initial injected bromidemass was adsorbed during the field experiment. In addition, incompletesampling of the upper side of the plume accounted for an estimated 10 percent of the bromide mass. The remaining 20 to 25 percent of the unrecovered bromide mass during the experiment was the result of truncation of the advancing side of the plume and sampling bias associated with the multilevel samplers. Although truncation of the front of the tracer plume was evident from the spatial concentration measurements, the actual longitudinal extent of the plume during the experiment remainshighly uncertain. Therefore no reliable estimates of the unsampled tracermass associated with the truncated region of the plume were possible.
SUMMARY AND CONCLUSIONS
A large-scale natural gradient tracer experiment was conducted in a heterogeneous alluvial aquifer with the intent of providing a quality data base for groundwater solute transport model validation. The experiment was carried out over a period of approximately 20 months during which seven comprehensive samplings of the tracer plume were performed using an extensive three-dimensional sampling well network. In conjunction with the tracer experiment, the hydrogeology of the experimental site was characterized in detail. The hydrogeological characterization studies focused on the three-dimensional spatial distribution of hydraulic conductivity of the aquifer in which the tracer test was conducted. Large-scale spatial variations in the mean hydraulic conductivity of the aquifer were consistently indicated by the aquifer test results, borehole flowmeter measurements, and the overall hydraulic head field. A relatively low mean hydraulic conductivity of approximately 10~3 cm/s

was observed in the vicinity of the tracer injection point, whereas the mean conductivities in the far-field region of the test site were from one to two orders of magnitude larger. The trend in the mean hydraulic conductivity along the plume travel path produced corresponding variations in the mean groundwater seepage velocity that strongly affected plume migration behavior. The estimated log hydraulic conductivity variance of Z.8 for the alluvial aquifer at the test site is approximately an order of magnitude larger than the variance estimates for the Borden [Sudicky, 1986] and Cape Cod [Hess, 1989] research sites, and indicates that the Columbus site is one of the most heterogeneous sites studied to date.
The salient feature of the tracer plume that evolved during the natural-gradient experiment was the high degree of longitudinal asymmetry in the tracer concentration distribution. At the conclusion of the experiment, the main body of the plume remained within approximately 20 m of the injection site in the low conductivity zone, while the advancing side of the plume extended downgradient a distance of more than 260 m. The overall features of the plume were consistent with the spatial distribution of hydraulic conductivity and measured hydraulic gradients. The spatial moments analysis of the tracer concentration measurements indicated an anomalous mass balance trend during the study. The tracer mass initially was overestimated by a factor of approximately two followed by an approximately exponential decrease in mass recovery such that by the end of the experiment, approximately 50 percent of the bromide mass was unaccounted for in the field samples. Investigations revealed that from 15 to 20 percent of the injected bromide mass was adsorbed. Incomplete sampling of the upper part of the plume accounted for another 10 percent of the missing mass. The remaining 20 to 25 percent of the bromide mass deficit was the result of truncation of the advancing side of the plume and sampling bias associated with the multilevel samplers.
The experience of the natural-gradient tracer experiment at the Columbus site indicates that conducting highly-controlled field studies to investigate solute transport processes in very heterogeneous aquifers is quite challenging. Large variations in the magnitude of hydraulic conductivity (e.g., more than five orders of magnitude at the Columbus site) may produce large variations in groundwater velocity making it difficult to maintain complete spatial coverage of the tracer plume throughout the field experiment. However, perhaps the most serious problem, and one which is likely to be more difficult to overcome, is the difficulty in obtaining representative groundwater samples from wells completed in heterogeneous aquifers. Comparisons of groundwater samples collected from the multilevel samplers and adjacent soil cores indicated that diffusion of tracer into (and out of) low permeability zones within the aquifer was an important transport process. Because wells, even discrete point sampling wells such as the MLS, inherently tend to sample from the more permeable zones within their radius of sampling influence, the pore water in the low conductivity materials may be under-represented in well water samples. This may lead to an overestimate or underestimate of the tracer concentration depending on the state of the diffusion process. Extraction of pore-water from soil samples may be the only means

of obtaining truly representative water samples in extremely heterogeneous media.
ACKNOWLEDGMENTS
The work reported here was supported by the Electric Power Institute, Land and Water Quality Division, Palo Alto, California, under Research Project 2485-5.
REFERENCES
Bassett, R. L., E. P. Weeks, M. L. Leazan, S. G. Perkins, D. C. Signor, D. L. Redinger, R. L. Malcolm, G. R. Aiken, E. M. Thurman, P. A. Avery, W. W. Wood, G. M. Thompson, and G. K. Stiles, 1981, "Preliminary Data From a Series of Artificial Recharge Experiments at Stanton, Texas," USGS Open-file Rept. 81-149.
Bentley, H. W., and G. R. Walter, 1983, "Two-Well Recirculating Tracer Test at H-2: Waste Isolation Pilot Plant (WIPP), Southeast New Mexico,"Rept. SAND83-7014, Sandia Nat. Lab., Los Alamos, NM.
Boggs, J. M., S. C. Young, D. J. Benton and Y. C. Chung, 1990, "Hydrogeologie Characterization of the MADE Site," EPRI Topical Rept. EN-6915, Electric Power Res. Inst., Palo Alto, CA.
Dagan, G., 1982, "Stochastic Modelling of Groundwater Flow byUnconditional and Conditional Probabilities, 2, The Solute Transport," Water Resources Researchf 18(4), 835-848.
Freeze, R. A., and J. A. Cherry, 1978, Groundwater. Prentice-Hall, p 404.
Freyberg, D. L., 1986, "A Natural Gradient Experiment on Solute Transport in a Sand Aquifer: 2t Spatial Moments and the Advection and Dispersion ofNonreactive Tracers," Water Resour. Res.. 22(13), 2031-2046.
Garabedian, S. P., 1987, "Large-Scale Dispersive Transport in Aquifers: Field Experiments and Reactive Transport Theory," Ph.D. Dissertation. Dept, of Civil Engineering, Mass. Inst, of Tech., Cambridge, Massachusetts.
Gelhar, L. W., and C. L. Axness, 1983, "Three-Dimensional Stochastic Analysis of Macrodispersion in Aquifers," Water Resour. Res.. 19(1), 161-180.
Gelhar, L. W., and E. E. Adams, 1990, personal communication.
Hess, K. M., 1989, "Use of Borehole Flowmeter to Determine SpatialHeterogeneity of Hydraulic Conductivity and Macrodispersivity in a Sand and Gravel Aquifer, Cape Cod, Massachusetts,” in Proceedings of NWWACQtlf.erence- -On.-.N.gw., Field Techniques__for Quantifying the Physical andChemical- Properties of Heterogeneous Aquifers. Houston, TX.

Jester, W. A., and K. A. Uhler, 1974, "Identification and Evaluation of Water Tracers Amenable to Post-Sampling Neutron Activation Analysis," Res. Publ. 85, Penn. State Univ. Inst, for Res. on Land and Water Resour.
MacKay, D. M., D. L. Freyberg, and P. V. Roberts, 1986, "A Natural Gradient Experiment on Solute Transport in a Sand Aquifer: 1, Approachand Overview of Plume Movement," Water Resour. Res.. 22(13), 2017-2029.
Malcolm, R. L., G. R. Aiken, E. M. Thurman, and P. A. Avery, 1980, "Hydrophilic Organic Solutes as Tracers in Groundwater Recharge Studies," in Contaminants and Sediments. 2. Ann Arbor Sei. Publ., Inc.
Molz, F. J., 0. Guven and J. Melville, 1983, "An Examination ofScale-Dependent Dispersion Coefficients," Ground Water. 21(6), 715-725.
Rehfeldt, K. R., L. W. Gelhar, J. B. Southard, and A. M. Dasinger, 1989, "Estimates of Macrodispersivity Based on Analyses of Hydraulic Conductivity Variability at the MADE Site," EPRI Topical Rept. EN-6405, Electric Power Res. Inst., Palo Alto, CA.
Smith, L. and F. W. Schwartz, 1980, "Mass Transport, 1, A Stochastic Analysis of Macrodispersion," Water Resources Research. 16(2), 305-313.
Sudicky, E. A., 1986, "A Natural Gradient Experiment on Solute Transport in a Sand Aquifer: Spatial Variability of Hydraulic Conductivity and itsRole in the Dispersion Process," Water Resour. Res.. 22(13), 2069-2082.