Embed Size (px)
Citation preview

Field-scale modeling of microbially induced calcite precipitation
Authors: Alfred B. Cunningham, H. Class, A. Ebigbo, Robin Gerlach, Adrienne J. Phillips, Johanna HommelThe final publication is available at Springer via https://doi.org/10.1007/s10596-018-9797-6.
Cunningham, Alfred B., H. Class, A. Ebigbo, Robin Gerlach, Adrienne J. Phillips, Johanna Hommel, “Field-scale modeling of microbially induced calcite precipitation,” Computational Geosciences, November 2018, 1-16. doi: 10.1007/s10596-018-9797-6.
Made available through Montana State University’s ScholarWorks scholarworks.montana.edu
Field-scale modeling of microbially induced calcite precipitation
A. B. Cunningham1 · H. Class2 · A. Ebigbo3 · R. Gerlach1 · A. J. Phillips1 · J. Hommel2
AbstractThe biogeochemical process known as microbially induced calcite precipitation (MICP) is being investigated for engineering and material science applications. To model MICP process behavior in porous media, computational simulators must couple flow, transport, and relevant biogeochemical reactions. Changes in media porosity and permeability due to biomass growth and calcite precipitation, as well as their effects on one another must be considered. A comprehensive Darcy-scale model has been developed by Ebigbo et al. (Water Resour. Res. 48(7), W07519, 2012) and Hommel et al. (Water Resour. Res. 51, 3695–3715, 2015) and validated at different scales of observation using laboratory experimental systems at the Center for Biofilm Engineering (CBE), Montana State University (MSU). This investigation clearly demonstrates that a close synergy between laboratory experimentation at different scales and corresponding simulation model development is necessary to advance MICP application to the field scale. Ultimately, model predictions of MICP sealing of a fractured sandstone formation, located 340.8 m below ground surface, were made and compared with corresponding field observations. Modeling MICP at the field scale poses special challenges, including choosing a reasonable model-domain size, initial and boundary conditions, and determining the initial distribution of porosity and permeability. In the presented study, model predictions of deposited calcite volume agree favorably with corresponding field observations of increased injection pressure during the MICP fracture sealing test in the field. Results indicate that the current status of our MICP model now allows its use for further subsurface engineering applications, including well-bore cement sealing and certain fracture-related applications in unconventional oil and gas production.
Keywords Microbially induced calcite precipitation (MICP) · Permeability modification · Field-scale modeling · Reactive transport
1 Introduction
Microbially induced calcite precipitation (MICP) is becom-ing established as a useful technology for a range ofgeoscience and engineering applications, as summarizedby [59], including amending or improving constructionmaterials, cementing porous media, environmental remedi-ation, and containment of nuclear waste. In the subsurface
environment, MICP causes deposition of calcium carbon-ate, resulting in a reduction of porosity and permeability.For example, MICP minerals deposited in preferential flowpaths in fractured porous media, and in the near-well-boreenvironment can mitigate leakage potential of sequesteredcarbon dioxide, methane, and well-bore fluids [50, 60].MICP technology is based on the injection of relativelylow-viscosity aqueous solutions which promote calcite pre-cipitation to seal unwanted flow paths, especially in smallaperture fractures. MICP therefore compliments traditionalhigh-viscosity sealants (e.g., cement) used to seal unwantedflow paths in the near-well-bore environment.
To better understand and predict MICP process behaviorin porous media systems, computational simulators must bedeveloped which couple flow, transport, and biogeochemi-cal reactions. Changes in media porosity and permeabilityneed to be considered and coupled to biomass growth andcalcite precipitation. A significant challenge in modelingMICP is that many of the standard staple methodologies
in reservoir engineering are not applicable. This is becauseMICP applications are rather short (a few days) singularevents and, ideally, many simulations are carried out longbefore the start of the application to guide the design of theinjection strategy and other design parameters of the appli-cation. In standard reservoir engineering, a host of data isacquired over time, which can be used to improve the reser-voir model over the years of the production from a reservoir.Thus, for a typical MICP application, the amount of dataavailable for modeling is significantly smaller than that forstandard reservoir engineering and, additionally, parame-ters such as formation porosity or permeability will changeduring MICP, further increasing the difficulty of applyingmethods such as history matching.
A comprehensive model has been developed by the Uni-versity of Stuttgart and partners and validated at differentscales of observation using laboratory experimental sys-tems at the Center for Biofilm Engineering (CBE), MontanaState University (MSU) [18, 19, 34, 35]. Ultimately, modelpredictions of MICP sealing of a fractured sandstone for-mation, located 340.8 m below ground surface, were madeand compared with actual field experiments which resultedin virtually complete fracture sealing. Results indicate that,even though parts of the current MICP model are still con-sidered as work in progress, it might now be suitable forother types of important subsurface field-scale applications,including well-bore cement sealing and certain unconven-tional oil- and gas-related applications. Field experiments inboth of these areas are now beginning.
Below, we review briefly the major fundamentals ofmicrobially induced calcite precipitation, while referring,for details, to our previous publications in this field. Subse-quently, we summarize the history of the development of ourmathematical and numerical model, thereby discussing thedifferent scales and the importance of experimental resultsfor step-wise validation of the model. The core part of thispaper is then the presentation of the field demonstration,its modeling, and the discussion of the results of this study.This allows us to draw conclusions on the current state ofthe model and on perspectives on its application in futurework.
2MICP fundamentals
Microbially induced calcite precipitation (MICP) occurswhen microbial metabolism alters the surrounding aqueousphase in a way that leads to precipitation of calcite. Inthis study, we focus on biofilm-based MICP via ureolysisby the bacterium Sporosarcina pasteurii. MICP offers anengineering option that uses controlled biofilm growthto achieve targeted calcite precipitation, which can beemployed in various applications [e.g., 40, 59, 70]. In
subsurface applications, this process is typically associatedwith a reduction of porosity and, even more importantly, ofpermeability [e.g., 17, 22, 52, 75]. For example, Minto etal. [49] show the reduction in permeability also by solvingthe Navier-Stokes equation on the geometry extracted fromX-ray computed tomography of samples before and afterMICP treatment. S. pasteurii expresses the enzyme ureasethat catalyzes the hydrolysis reaction of urea (CO(NH2)2)into ammonia (NH3) and carbon dioxide (CO2) [e.g., 1].Aqueous solutions of ammonia become alkaline. Thus, theureolysis reaction leads to an increase in alkalinity. Thisshifts the carbonate balance in an aqueous solution towardhigher concentrations of dissolved carbonate (CO2−
3 ).Adding calcium (Ca2+) to the system then results in theprecipitation of calcium carbonate (CaCO3).
CO(NH2)2 + 2H2O + Ca2+ −→ 2NH4+ + CaCO3 ↓. (1)
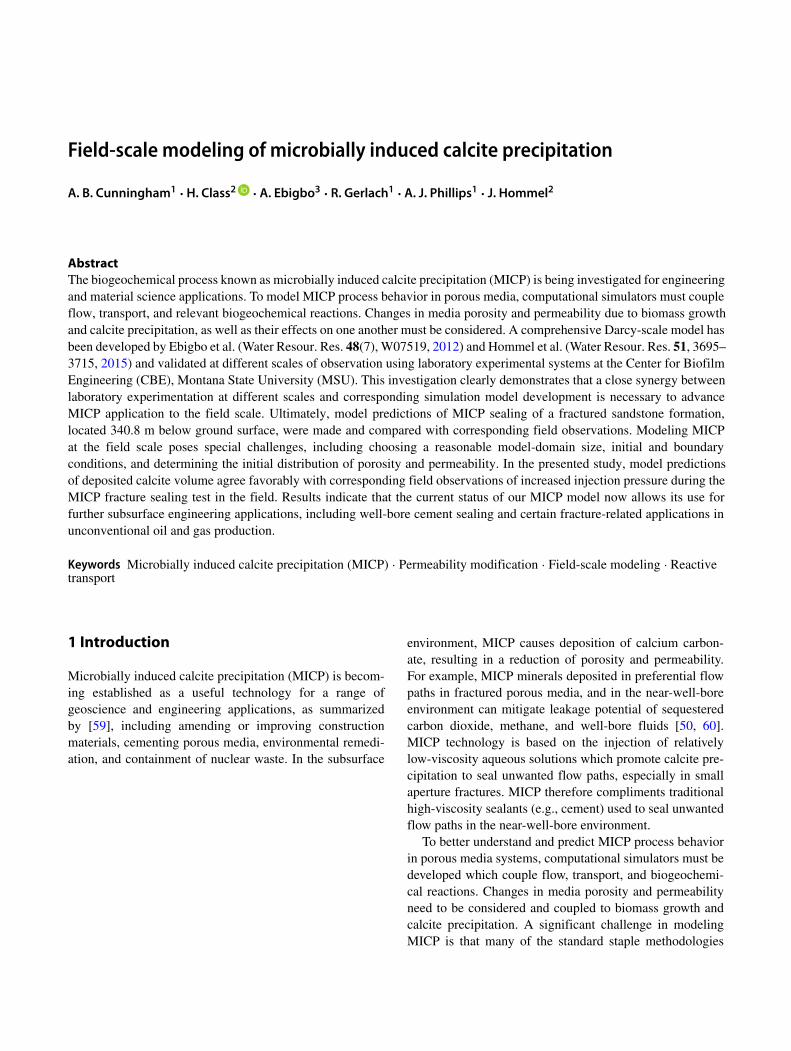
Figure 1 illustrates the main processes governing MICPat the pore scale. Ureolytically active S. pasteurii cells areintroduced in aqueous suspension. These cells attach tosurfaces, take up nutrients, and form a biofilm. As biofilmgrowth continues, some cells detach and are transporteddown gradient. A detailed discussion of biofilm processes inporous media appears in [18]. The MICP process continueswith the addition of urea which is hydrolyzed, resultingin a pH increase. Subsequent addition of Ca2+ results incalcium carbonate (calcite) deposition, which, together withthe accumulated biofilm, causes a reduction in porosity andpermeability of the porous medium.
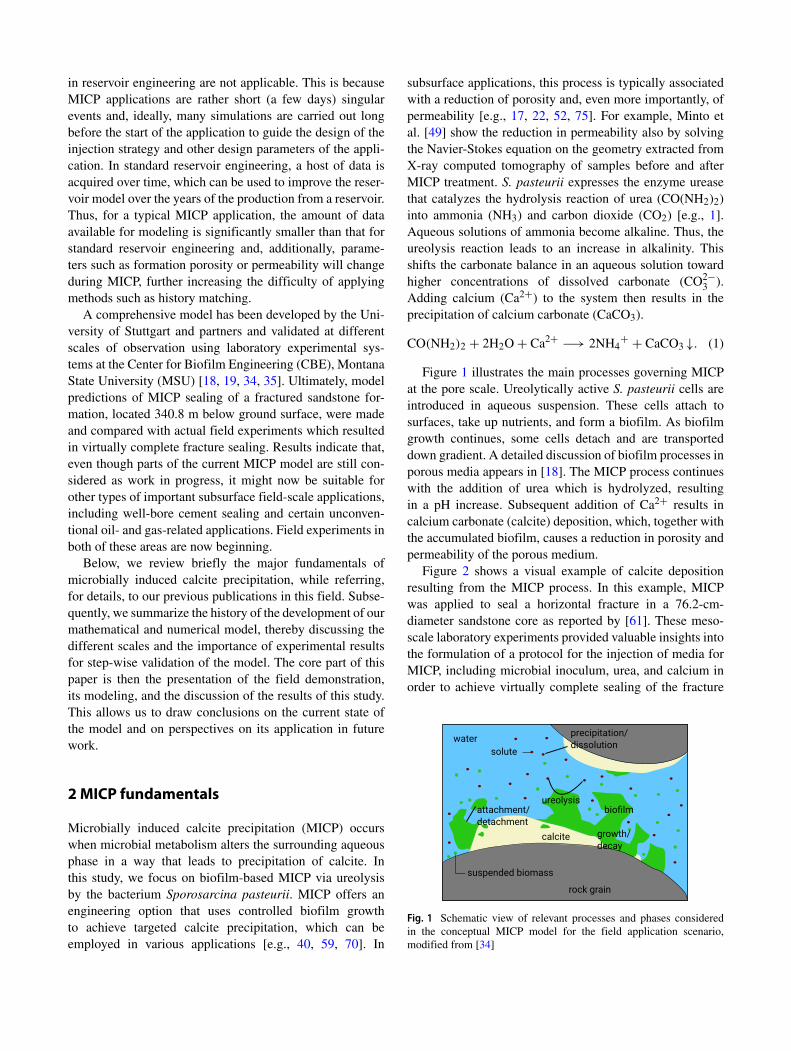
Figure 2 shows a visual example of calcite depositionresulting from the MICP process. In this example, MICPwas applied to seal a horizontal fracture in a 76.2-cm-diameter sandstone core as reported by [61]. These meso-scale laboratory experiments provided valuable insights intothe formulation of a protocol for the injection of media forMICP, including microbial inoculum, urea, and calcium inorder to achieve virtually complete sealing of the fracture
Fig. 1 Schematic view of relevant processes and phases consideredin the conceptual MICP model for the field application scenario,modified from [34]
Fig. 2 Precipitates observed from MICP sealing of a 1-mm fracture(33 cm in length) in a 76.2-cm-diameter sandstone core. a, b Precipi-tates formed in the region of the fracture. c Precipitates were observed
inside the 5.4-cm-diameter stainless steel injection tube. These pho-tographs help visualize the nature of the mineral deposits resultingfrom the application of MICP to seal fractured porous media
under radial flow conditions. Modeling of these experimentsas an intermediate step before modeling the field-scaleapplication is discussed below in Section 3.3.
3Model development
The major challenge in constructing a predictive modelfor permeability reduction in the underground with MICPis quantifying the complex interactions between flow,transport, biofilm growth, and reaction kinetics. Anymodel for MICP, or, more generally, reactive transport, isnecessarily a simplification of these processes and theirinteractions and any new experimental insight into theprocesses has the potential to improve such models. Thus,there exist a variety of numerical models for reactivetransport in porous media which involve microbial activity.Applications found in the literature include the interactionof microbes with the subsurface transport of contaminants,[e.g., 37, 63, 69, 74], microbially enhanced oil recovery[e.g., 44, 53, 54, 72], or biomineralization, of whichespecially the engineered application of MICP has receivedconsiderable attention. Most numerical models for MICPare, similarly to the model used in this study, formulated atthe REV scale (or Darcy scale) [e.g., 2, 17, 46, 51, 76–78],while [64] and [80–82] use pore-network and pore-scalemodels, respectively.
Many models are designed to match some experiments,focusing on the processes of relevance in the particularexperiments while neglecting other processes that mightbe relevant at the field scale. The models presented by[46] and [2] use a complex ureolysis rate equation [23],the same as our initial model [19], and a saturation-statedependent precipitation rate, while neglecting changes inpermeability and assuming a constant biomass distribution.This results in a constant ureolytic activity over time for
each point. Cuthbert et al. [17] use a first-order kineticmodel for ureolysis and model bacterial transport andattachment. However, they simplified the geochemistry bysetting the precipitation rate equal to the ureolysis rate. Onthe other hand, they account for the impact of the calciteprecipitated during MICP on hydrodynamics. Michaelis-Menten kinetics are used to model the ureolysis rate in[76–78] and, like Cuthbert et al. [17], they assume that theprecipitation rate is proportional to the ureolysis rate. Thepermeability change is accounted for by a Kozeny-Carmanrelationship, but only calcite is assumed to have an effect.Bacteria are assumed to be homogeneously distributedin [76], while van Wijngaarden et al. [77] account forattachment, detachment, and bacterial transport and vanWijngaarden et al. [78] investigate the effect of variousdecay and biomass removal rates. For special cases, [76, 77]propose analytical solutions. The kinetic rate equations, in[64] are identical to those used in our modified model [34].
3.1 Brief presentation of MICPmodel equations
The initial model for MICP published by [19] wasdeveloped based on the final calcite distribution from fourquasi-1D column experiments. It, and its improvement by[34], is to our knowledge the most complex numericalmodel for MICP that has been published, including a fairlycomplex solution chemistry, growth, decay, attachment,detachment, transport of biomass, detailed kinetic rateequations for the biomass processes, ureolysis, precipitationand dissolution of calcite, effects of both biofilm and calciteon porosity and permeability, and the possibility to accountfor two-phase flow. The model is based on standard massbalance equations for each dissolved component (water(w), inorganic carbon (ic), sodium (Na), chloride (Cl),calcium (Ca), urea (u), ammonium/ammonia (a), substrate(s), oxygen (O2), and suspended biomass(sb)) and solid
phase (biofilm (b) and calcite (c)), using Darcy’s law for thephase velocities. Primary variables are the phase pressure,the mole fractions of the components, and the volumefractions of the solid phases.∑
α
∂∂t
(φραxκ
αSα
) + ∇· (ραxκαvα
)
−∇· (ραDpm,α∇xκα
) = qκ,(2)
here, t is time, φ porosity, ρα , Sα , and vα the density,saturation, and velocity of phase α respectively, and xκ
α themole fraction of component κ in phase α. Dpm,α is thedispersion tensor of phase α in the porous medium, and qκ
is the source term of component κ due to biogeochemicalreactions. The mass balances for the solid phases calcite (c)and biofilm (b) contain only a storage and source term sincethey are immobile:
∂
∂t(φλρλ) = qλ, (3)
here, φλ and ρλ are volume fraction and density of thesolid phase λ, and qλ is the source term of phase λ dueto biochemical reactions. The mass balance equations forthe transported components (2) and the solid phases (3) arecoupled by the component-specific reactive source and sinkterms qκ and qλ, which are discussed in detail in [19] and[34]. The porosity is updated by subtracting the solid-phasevolume fractions φλ from the initial porosity φ0:
φ = φ0 −∑
i
φi = φ0 − φb − φc. (4)
As both the volume fractions of biofilm φb and calciteφc are assumed to be impermeable, the permeability K
can be calculated using the porosity from Eq. 4, withoutdistinguishing between the contribution of each solid. Torelate the changes in porosity to the change in permeability,a Verma-Pruess type relation [71] with an exponent of 3is chosen, reducing the effective porosity by the parameterof the critical porosity φcrit, at and below which thepermeability becomes zero even though a residual porositypersists:
K
K0=
[(φ − φcrit)
(φ0 − φcrit)
]3
. (5)
The model is implemented in the open-source simulatorDuMuX (DUNE for Multi-Phase, Component, Scale,Physics, . . .) [24], which is based on DUNE (Distributedand Unified Numerics Environment) which, itself, is anopen-source framework for solving partial differentialequations [3, 4]. This study uses as discretization methodsimplicit Euler for time and a fully coupled, vertex-centeredfinite volume (box) scheme [30] for space. The resultingsystem of equations is solved using the BiCGStab solver
[73] after being linearized using the Newton-Raphsonmethod. The time stepping is adaptive and the size for eachtime step is determined by the number of Newton iterationsuntil convergence of the previous time step and its size. Incase the Newton-Raphson method does not converge withina maximum number of iterations, the time step is restartedwith half the initial time-step size.
A comprehensive discussion of the MICP model,especially the individual reactive source and sink terms,the capability for including a potential second fluid phase,and the treatment of equilibrium dissociation reactions, isgiven in [19] and [34] (for convenience, we summarize thereactive source and sink terms, the reaction rate equations,the model parameters used, and the initial and boundaryconditions in the Appendix).
3.2 How themodel was improved by experiments
In [34], the MICP model was improved based on newinsights regarding the main driving force of the MICPreactions, urea hydrolysis. Experiments with S. pasteurii,the organism mostly used for engineered MICP researchand development, allowed us the determination of whole-cell ureolysis kinetics parameters [45]. This in turn allowedfor the implementation of more appropriate ureolysis ratekinetics in the reactive source and sink terms associated withureolysis.
Simultaneous to the investigation of the ureolysis kinet-ics, new column experiments were conducted monitoringCa2+ and NH+
4 concentrations at 10-cm intervals along thecolumn over time to provide improved experimental datafor recalibration of the model by inverse modeling [34].This significantly increased the experimental data avail-able for calibration compared to the previous experiments,where only the final amount of calcite along the columnwas available [19]. The updated and recalibrated model wasvalidated using data of the replicate of the new columnexperiment, again with Ca2+ and NH+
4 concentration andfinal calcite measurements, as well as a previous experimentdescribed in [19, 34]. The improved model proved to bemore robust with respect to the medium chemistry, whichchanged between the experiments reported in [19] and [34],increasing its predictive capabilities. However, the modelwas, up to that point, almost exclusively validated with datafrom quasi-1D column experiments with plug-flow condi-tions. Thus, a comparison between model predictions andexperimental data in a full 3D setup with radial flow con-ditions was conducted before the model was applied toinvestigate a field-scale scenario. Figure 3 provides a sum-mary of the interaction between laboratory experimentationand model development.
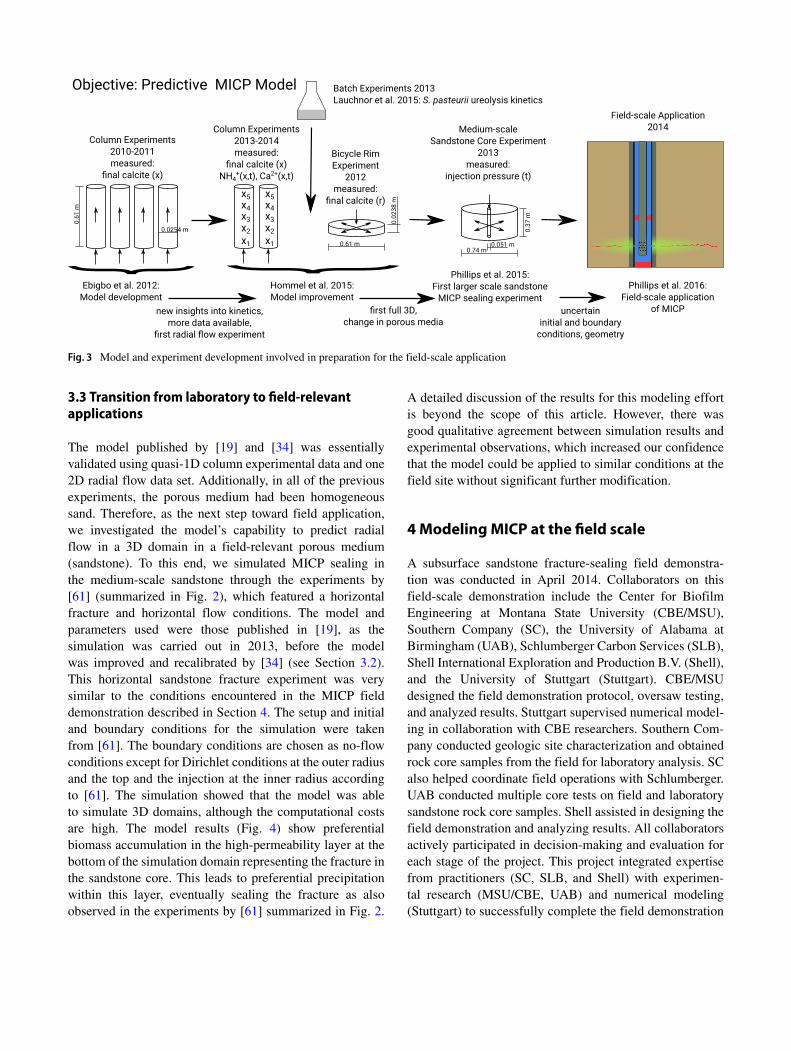
Fig. 3 Model and experiment development involved in preparation for the field-scale application
3.3 Transition from laboratory to field-relevantapplications
The model published by [19] and [34] was essentiallyvalidated using quasi-1D column experimental data and one2D radial flow data set. Additionally, in all of the previousexperiments, the porous medium had been homogeneoussand. Therefore, as the next step toward field application,we investigated the model’s capability to predict radialflow in a 3D domain in a field-relevant porous medium(sandstone). To this end, we simulated MICP sealing inthe medium-scale sandstone through the experiments by[61] (summarized in Fig. 2), which featured a horizontalfracture and horizontal flow conditions. The model andparameters used were those published in [19], as thesimulation was carried out in 2013, before the modelwas improved and recalibrated by [34] (see Section 3.2).This horizontal sandstone fracture experiment was verysimilar to the conditions encountered in the MICP fielddemonstration described in Section 4. The setup and initialand boundary conditions for the simulation were takenfrom [61]. The boundary conditions are chosen as no-flowconditions except for Dirichlet conditions at the outer radiusand the top and the injection at the inner radius accordingto [61]. The simulation showed that the model was ableto simulate 3D domains, although the computational costsare high. The model results (Fig. 4) show preferentialbiomass accumulation in the high-permeability layer at thebottom of the simulation domain representing the fracture inthe sandstone core. This leads to preferential precipitationwithin this layer, eventually sealing the fracture as alsoobserved in the experiments by [61] summarized in Fig. 2.
A detailed discussion of the results for this modeling effortis beyond the scope of this article. However, there wasgood qualitative agreement between simulation results andexperimental observations, which increased our confidencethat the model could be applied to similar conditions at thefield site without significant further modification.
4ModelingMICP at the field scale
A subsurface sandstone fracture-sealing field demonstra-tion was conducted in April 2014. Collaborators on thisfield-scale demonstration include the Center for BiofilmEngineering at Montana State University (CBE/MSU),Southern Company (SC), the University of Alabama atBirmingham (UAB), Schlumberger Carbon Services (SLB),Shell International Exploration and Production B.V. (Shell),and the University of Stuttgart (Stuttgart). CBE/MSUdesigned the field demonstration protocol, oversaw testing,and analyzed results. Stuttgart supervised numerical model-ing in collaboration with CBE researchers. Southern Com-pany conducted geologic site characterization and obtainedrock core samples from the field for laboratory analysis. SCalso helped coordinate field operations with Schlumberger.UAB conducted multiple core tests on field and laboratorysandstone rock core samples. Shell assisted in designing thefield demonstration and analyzing results. All collaboratorsactively participated in decision-making and evaluation foreach stage of the project. This project integrated expertisefrom practitioners (SC, SLB, and Shell) with experimen-tal research (MSU/CBE, UAB) and numerical modeling(Stuttgart) to successfully complete the field demonstration
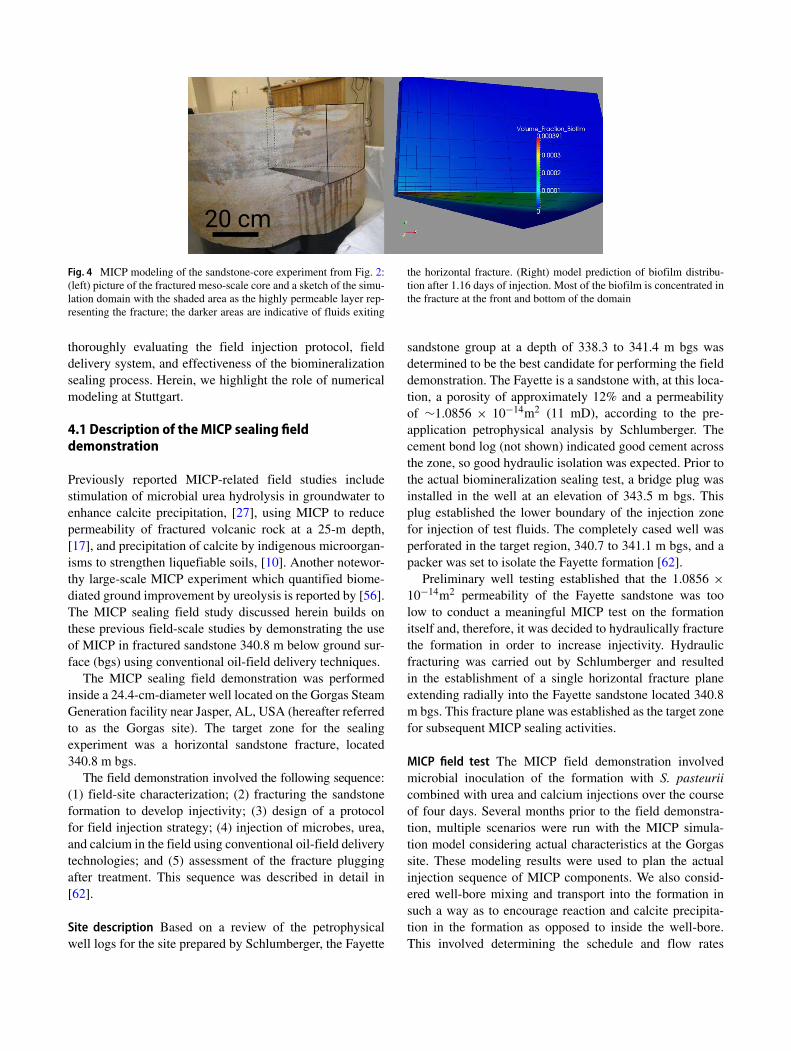
Fig. 4 MICP modeling of the sandstone-core experiment from Fig. 2:(left) picture of the fractured meso-scale core and a sketch of the simu-lation domain with the shaded area as the highly permeable layer rep-resenting the fracture; the darker areas are indicative of fluids exiting
the horizontal fracture. (Right) model prediction of biofilm distribu-tion after 1.16 days of injection. Most of the biofilm is concentrated inthe fracture at the front and bottom of the domain
thoroughly evaluating the field injection protocol, fielddelivery system, and effectiveness of the biomineralizationsealing process. Herein, we highlight the role of numericalmodeling at Stuttgart.
4.1 Description of theMICP sealing fielddemonstration
Previously reported MICP-related field studies includestimulation of microbial urea hydrolysis in groundwater toenhance calcite precipitation, [27], using MICP to reducepermeability of fractured volcanic rock at a 25-m depth,[17], and precipitation of calcite by indigenous microorgan-isms to strengthen liquefiable soils, [10]. Another notewor-thy large-scale MICP experiment which quantified biome-diated ground improvement by ureolysis is reported by [56].The MICP sealing field study discussed herein builds onthese previous field-scale studies by demonstrating the useof MICP in fractured sandstone 340.8 m below ground sur-face (bgs) using conventional oil-field delivery techniques.
The MICP sealing field demonstration was performedinside a 24.4-cm-diameter well located on the Gorgas SteamGeneration facility near Jasper, AL, USA (hereafter referredto as the Gorgas site). The target zone for the sealingexperiment was a horizontal sandstone fracture, located340.8 m bgs.
The field demonstration involved the following sequence:(1) field-site characterization; (2) fracturing the sandstoneformation to develop injectivity; (3) design of a protocolfor field injection strategy; (4) injection of microbes, urea,and calcium in the field using conventional oil-field deliverytechnologies; and (5) assessment of the fracture pluggingafter treatment. This sequence was described in detail in[62].
Site description Based on a review of the petrophysicalwell logs for the site prepared by Schlumberger, the Fayette
sandstone group at a depth of 338.3 to 341.4 m bgs wasdetermined to be the best candidate for performing the fielddemonstration. The Fayette is a sandstone with, at this loca-tion, a porosity of approximately 12% and a permeabilityof ∼1.0856 × 10⁻¹⁴m2 (11 mD), according to the pre-application petrophysical analysis by Schlumberger. Thecement bond log (not shown) indicated good cement acrossthe zone, so good hydraulic isolation was expected. Prior tothe actual biomineralization sealing test, a bridge plug wasinstalled in the well at an elevation of 343.5 m bgs. Thisplug established the lower boundary of the injection zonefor injection of test fluids. The completely cased well wasperforated in the target region, 340.7 to 341.1 m bgs, and apacker was set to isolate the Fayette formation [62].
Preliminary well testing established that the 1.0856 ×10⁻¹⁴m2 permeability of the Fayette sandstone was toolow to conduct a meaningful MICP test on the formationitself and, therefore, it was decided to hydraulically fracturethe formation in order to increase injectivity. Hydraulicfracturing was carried out by Schlumberger and resultedin the establishment of a single horizontal fracture planeextending radially into the Fayette sandstone located 340.8m bgs. This fracture plane was established as the target zonefor subsequent MICP sealing activities.
MICP field test The MICP field demonstration involvedmicrobial inoculation of the formation with S. pasteuriicombined with urea and calcium injections over the courseof four days. Several months prior to the field demonstra-tion, multiple scenarios were run with the MICP simula-tion model considering actual characteristics at the Gorgassite. These modeling results were used to plan the actualinjection sequence of MICP components. We also consid-ered well-bore mixing and transport into the formation insuch a way as to encourage reaction and calcite precipita-tion in the formation as opposed to inside the well-bore.This involved determining the schedule and flow rates
for injecting fluids both during and after bailer injectionof MICP components. We also needed assurance that thetime needed to develop the MICP seal of the fracturewould be no longer than 4 days. The MICP modeling sce-narios, together with pre-field-test laboratory experiments,provided an efficient process for screening alternativeswhich resulted in the “best predicted” field injection strat-egy. Based on these results, it was possible to estimatequantities of key components such as microbial inoculum,calcium, and urea needed for the field work. This a prioriMICP modeling/experimentation effort proved extremelyvaluable in successfully completing this MICP-based frac-ture sealing in the field.
During the actual field demonstration, a total of 24 cal-cium injections and six microbe injections were requiredover the 4-day period to achieve complete sealing. Conven-tional oil-field methods were used to deliver the biominer-alization components downhole by using an 11.4-l wirelinedump bailer combined with periodic pumping of a brinesolution into the fractured formation. The fractured regionwas considered completely sealed when it was no longerpossible to inject fluids into the formation without exceed-ing the initial formation fracture pressure. On day 3, around45 h after the first injections, a significant decrease in injec-tivity was observed and the flow rates had to be reducedduring the fourth day to avoid exceeding the formation’sfracture pressure. Sealing of the fracture with MICP wasassessed through (i) the reduction of injectivity, (ii) decreasein pressure decay after well shut in, and (iii) detection ofMICP byproducts including calcium carbonate (CaCO3) inside-wall cores retrieved from 1.8 m above the fracturezone. Detailed results of this MICP field demonstration arepresented in [62].
4.2 Model predictions and evaluation
In this section, two categories of modeling scenariosare discussed. The first category, identified as the 2014simulations, refers to the modeling done prior to andimmediately after the April 2014 field demonstration. Thesecond category, identified as the 2018 simulations, refersto recent modeling done after evaluating the results of thefield demonstration. The main difference of the simulations
are the sets of parameters used and that the 2018 simulationsconsider infinite-acting pressure boundary conditions at theouter radius of the simulation domain.
As the model recalibration discussed in [34] was notyet completed at the time of the first modeling study in2014, the values for some model input parameters differedfrom those published there. Those parameter values aregiven in Table 1. All other parameter values are identical tothose published in [34]. Thus, in addition to investigatingthe effect of an improved pressure boundary condition,the 2018 simulations were also aimed at highlighting theimpact of the changed set of parameters on the simulationresults. No parameters were fitted for the field-scalesimulations, as the 2014 simulations were conducted priorto and immediately after the field application, when nodata for recalibration were available. Also, for the 2018simulations, no parameters were fitted specifically for thefield-application setup due to the scarcity of field-scale data.
Simulation domains and geometry To address the uncer-tainty in the extent of the radial fracture, two scenarios wereinvestigated prior to the 2014 field application: the “small”2.4 m×2.4 m (height × radius) scenario with a radial frac-ture extent of 1.6 m and the “large” 8 m×8 m scenario witha radial fracture extent of 4 m. Both scenarios were sim-ulated assuming various injection strategies (not shown ordiscussed here) and the best injection strategy was chosento be used for the actual field test. For the recent simula-tions in 2018, the “large” scenario was extended to a radiusof 50 m. As the vertical extent of the MICP sealing intothe formation was part of the research question, it was nec-essary to use a 3D model and therefore not possible toreduce the domain to a 2D fracture plane. The simulationdomains were constructed assuming radial symmetry withthe domain height as well as the radial extent adjusted to theradial extent of the fracture, resulting in a height and radiusof 2.4 m for the small and 8 m for the large scenario (seeFig. 5). For each scenario, the fracture is approximated as a5-cm-thick highly permeable layer in the vertical center ofthe simulation domain. Within this layer and adjacent to it,the resolution in vertical direction is chosen to �z = 1 cm.
The representative fracture-layer permeability Kfrac =1.645 × 10⁻¹²m2 was estimated using the cubic law and
Table 1 Parameters used in the 2014 pre-application simulations which differ from the final calibration values published by [34]
Parameter ca,1 ca,2 ρbio kub
Units [1/s] [1/s] [kg/m3] [kgurease/kgbio]
Brief description Unspecific biomassattachment coefficient
Biomass attachment coef-ficient to existing biofilm
Biofilm dry density Urease content ofbiomass
2014 pre-application 1.5 × 10⁻⁵ 5 × 10⁻⁶ 10 1 × 10⁻²
[34] 8.3753 × 10⁻⁸ 8.5114 × 10⁻⁷ 6.9 3.81 × 10⁻⁴
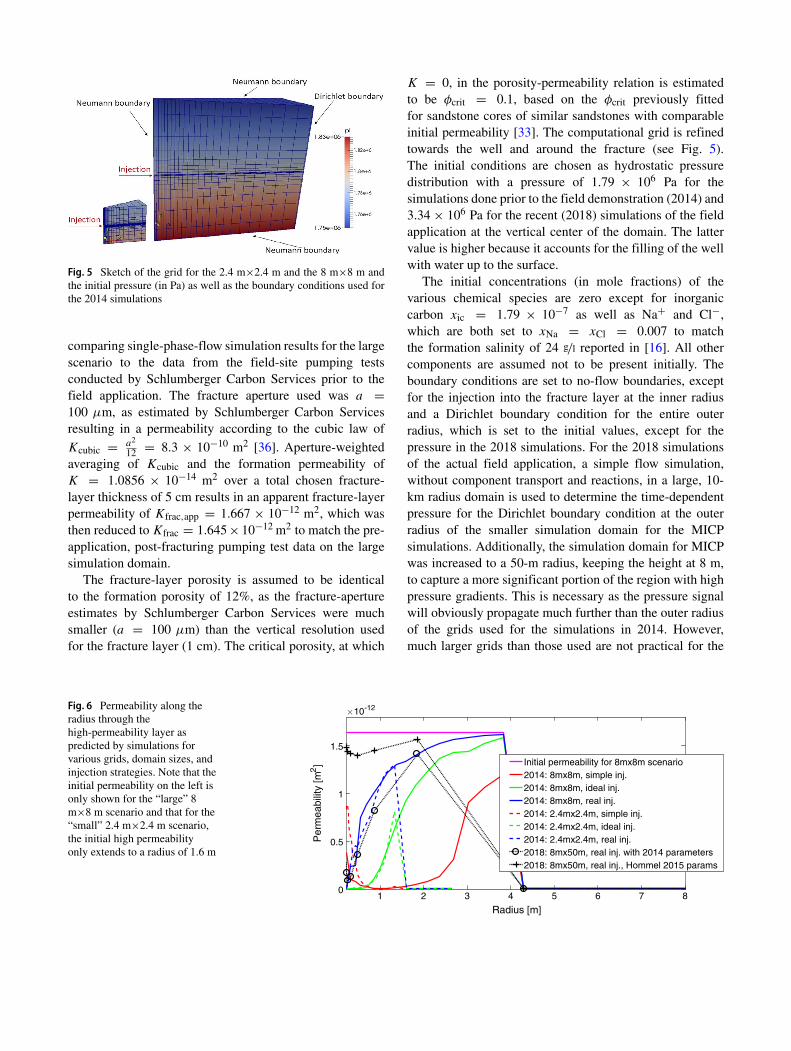
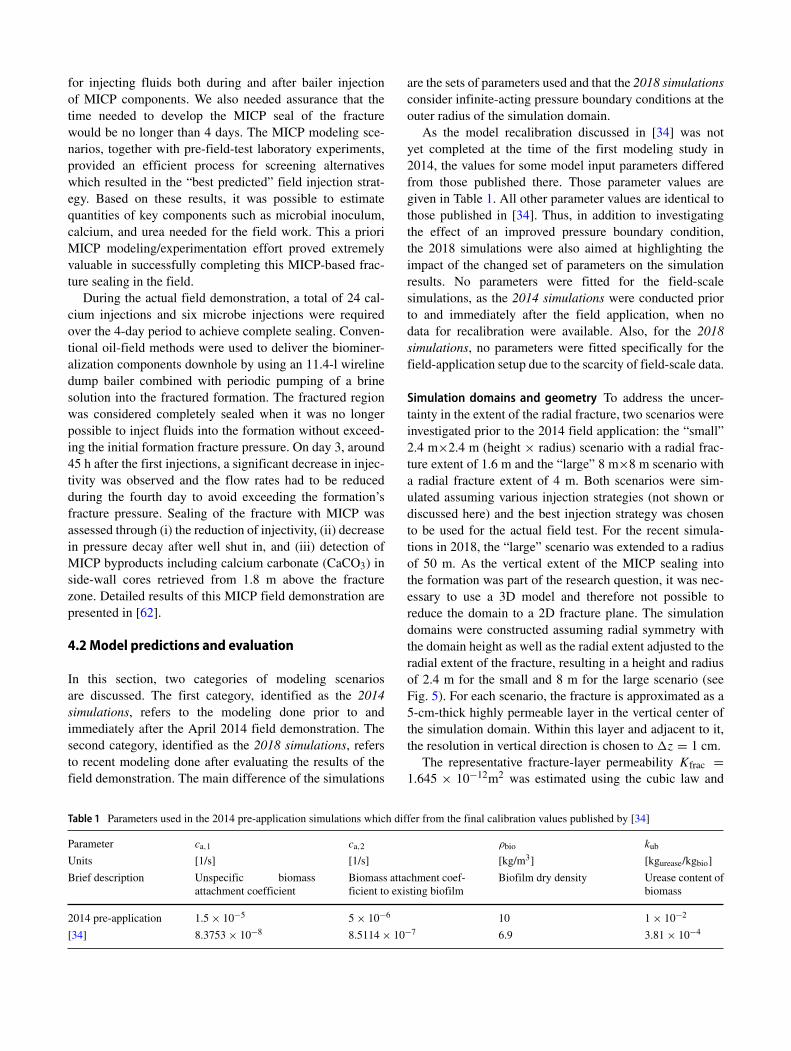
Fig. 5 Sketch of the grid for the 2.4 m×2.4 m and the 8 m×8 m andthe initial pressure (in Pa) as well as the boundary conditions used forthe 2014 simulations
comparing single-phase-flow simulation results for the largescenario to the data from the field-site pumping testsconducted by Schlumberger Carbon Services prior to thefield application. The fracture aperture used was a =100 μm, as estimated by Schlumberger Carbon Servicesresulting in a permeability according to the cubic law of
Kcubic = a2
12 = 8.3 × 10⁻¹⁰ m2 [36]. Aperture-weightedaveraging of Kcubic and the formation permeability ofK = 1.0856 × 10⁻¹⁴ m2 over a total chosen fracture-layer thickness of 5 cm results in an apparent fracture-layerpermeability of Kfrac,app = 1.667 × 10⁻¹² m2, which wasthen reduced to Kfrac = 1.645 × 10⁻¹² m2 to match the pre-application, post-fracturing pumping test data on the largesimulation domain.
The fracture-layer porosity is assumed to be identicalto the formation porosity of 12%, as the fracture-apertureestimates by Schlumberger Carbon Services were muchsmaller (a = 100 μm) than the vertical resolution usedfor the fracture layer (1 cm). The critical porosity, at which
K = 0, in the porosity-permeability relation is estimatedto be φcrit = 0.1, based on the φcrit previously fittedfor sandstone cores of similar sandstones with comparableinitial permeability [33]. The computational grid is refinedtowards the well and around the fracture (see Fig. 5).The initial conditions are chosen as hydrostatic pressuredistribution with a pressure of 1.79 × 10⁶ Pa for thesimulations done prior to the field demonstration (2014) and3.34 × 106 Pa for the recent (2018) simulations of the fieldapplication at the vertical center of the domain. The lattervalue is higher because it accounts for the filling of the wellwith water up to the surface.
The initial concentrations (in mole fractions) of thevarious chemical species are zero except for inorganiccarbon xic = 1.79 × 10⁻⁷ as well as Na+ and Cl−,which are both set to xNa = xCl = 0.007 to matchthe formation salinity of 24 g/l reported in [16]. All othercomponents are assumed not to be present initially. Theboundary conditions are set to no-flow boundaries, exceptfor the injection into the fracture layer at the inner radiusand a Dirichlet boundary condition for the entire outerradius, which is set to the initial values, except for thepressure in the 2018 simulations. For the 2018 simulationsof the actual field application, a simple flow simulation,without component transport and reactions, in a large, 10-km radius domain is used to determine the time-dependentpressure for the Dirichlet boundary condition at the outerradius of the smaller simulation domain for the MICPsimulations. Additionally, the simulation domain for MICPwas increased to a 50-m radius, keeping the height at 8 m,to capture a more significant portion of the region with highpressure gradients. This is necessary as the pressure signalwill obviously propagate much further than the outer radiusof the grids used for the simulations in 2014. However,much larger grids than those used are not practical for the
Fig. 6 Permeability along theradius through thehigh-permeability layer aspredicted by simulations forvarious grids, domain sizes, andinjection strategies. Note that theinitial permeability on the left isonly shown for the “large” 8m×8 m scenario and that for the“small” 2.4 m×2.4 m scenario,the initial high permeabilityonly extends to a radius of 1.6 m
1 2 3 4 5 6 7 8
Radius [m]
0
0.5
1
1.5
Per
mea
bilit
y [m
2]
10-12
Initial permeability for 8mx8m scenario2014: 8mx8m, simple inj.2014: 8mx8m, ideal inj.2014: 8mx8m, real inj.2014: 2.4mx2.4m, simple inj.2014: 2.4mx2.4m, ideal inj.2014: 2.4mx2.4m, real inj.2018: 8mx50m, real inj. with 2014 parameters2018: 8mx50m, real inj., Hommel 2015 params
MICP simulations due to the complexity and associatedcomputational time of the model, which would, on largergrids, result in impractically long simulation times.
Model predictions First, the modeled injection strategiesand the times of the simulations relative to the field experi-ment are discussed. We distinguish between the pre-experi-ment simulations, done in 2014, and the post-experimentsimulations, done in 2014 immediately after the field exper-iment and in 2018. The pre-experiment simulations exam-ined the influence of the injection strategies, “simple” and“ideal,” the size of the domain, “small” and “large,” andradial extent of the fracture, on the simulation results. Thepost-experiment simulations focused on reproducing thefield experiment using the exact (“real”) injection strategyand, additionally for the 2018 simulation, investigating theeffect of the model recalibration by [34] and the outer radiusDirichlet boundary condition on the results.
Two injection strategies were considered during the plan-ning of the 2014 field experiment, one with a low numberof injections of long duration each, referred to in the follow-ing as the “simple” injection strategy, and one with a highnumber of short injections, referred to in the following asthe “ideal” injection strategy. The latter injection strategyconsisted of 7 cell inoculation and 34 calcium-rich injections,alternating with no-flow periods after the injections allowingfor bacterial growth and attachment or reaction. Inocula-tions were done in the beginning and then prior to overnightno-flow periods and after five of the ten daily calcium-richinjections. Calcium- and cell-free media were injected fora short period before reinoculating to prevent clogging ofthe immediate vicinity of the well. This injection strategywas chosen to be applied in the field (see the descriptionin Section 4.1), as the model predictions suggested suffi-cient permeability reduction (see Fig. 6), and because themore frequent and faster injections would reduce the riskof unwanted precipitation within the well-bore. A slightlychanged strategy was actually applied in the field. This willbe referred to as the “real” injection strategy. It was mod-eled immediately after the field experiment in 2014 and,again, after analyzing the field measurements in 2018. Itis similar to the “ideal” strategy but includes sampling andtechnical problems encountered during the field demon-stration as well as decreasing injection rates towards theend of the test. The results for permeability predictions ofthe model for the three injection strategies simulated in2014 and the “real” injection strategy simulated in 2018 areshown in Fig. 6. The “simple” injection strategy results inalmost complete plugging of the high permeability region.For the “ideal” and “real” injection strategies, permeabilityis reduced mostly in the first 0.5 m to 1 m of the domain,
independent of the size of the domain used, when using the2014 parameter set (see Table 1). Using the best-fit valuespublished by [34] (Table 1) leads to much less permeabil-ity reduction, as much less precipitates are predicted to form(see Fig. 7).
The experimental data that can be compared to modelresults are limited to the recorded injection pressure and afew side-wall cores due to the depth of 340.8 m bgs. Thus,it is difficult to conclude which domain size, boundaryconditions, and parameter sets are most accurate. Thesensitivity of the model to the estimated formation porosityand permeability, to the assumed fracture-layer porosity andpermeability, and to the assumed critical porosity has notbeen investigated.
A comparison of the “small” and the “large” scenariosimulated in 2014 indicates that large simulation domainsmight only be necessary to investigate the uncertainty in theinitial geometry, e.g., extent of the high-permeability layer.Large domains might not be necessary to model MICP fora fixed geometry as the results of both scenarios are quitesimilar as long as the radius of the domain is smaller thanthe extent of the “small” scenario’s high-permeability layer(see Fig. 6), when using identical parameter sets. Equally,even when using the further increased domain (8 m×50m) and a dynamic pressure boundary condition in the 2018simulations, the results for the biomass (not shown) and cal-cite distribution do not change significantly compared tothe simulations of 2014 with a fixed equilibrium hydrostaticpressure boundary condition, when using identical parame-ters (see Fig. 7). This is a result of the source and sink termsin the model for MICP being almost independent of theabsolute value of the pressure. The pressure influences thereaction terms only indirectly by the minor pressure depen-dency of the apparent dissociation constants (see [34]). Onlythe pressure gradient has a significant influence on thedetachment rate of biomass, but as the injection is treated
-342 -341 -340 -339 -338 -337Depth [m]
0
0.005
0.01
0.015
0.02
Cal
cite
Vol
ume
Fra
ctio
n [-
]
2014: 2.4mx2.4m, real injection2014: 8mx8m, real injection2018: 8mx50m, real inj., 2014 parameters2018: 8mx50m, real inj., Hommel 2015 params.
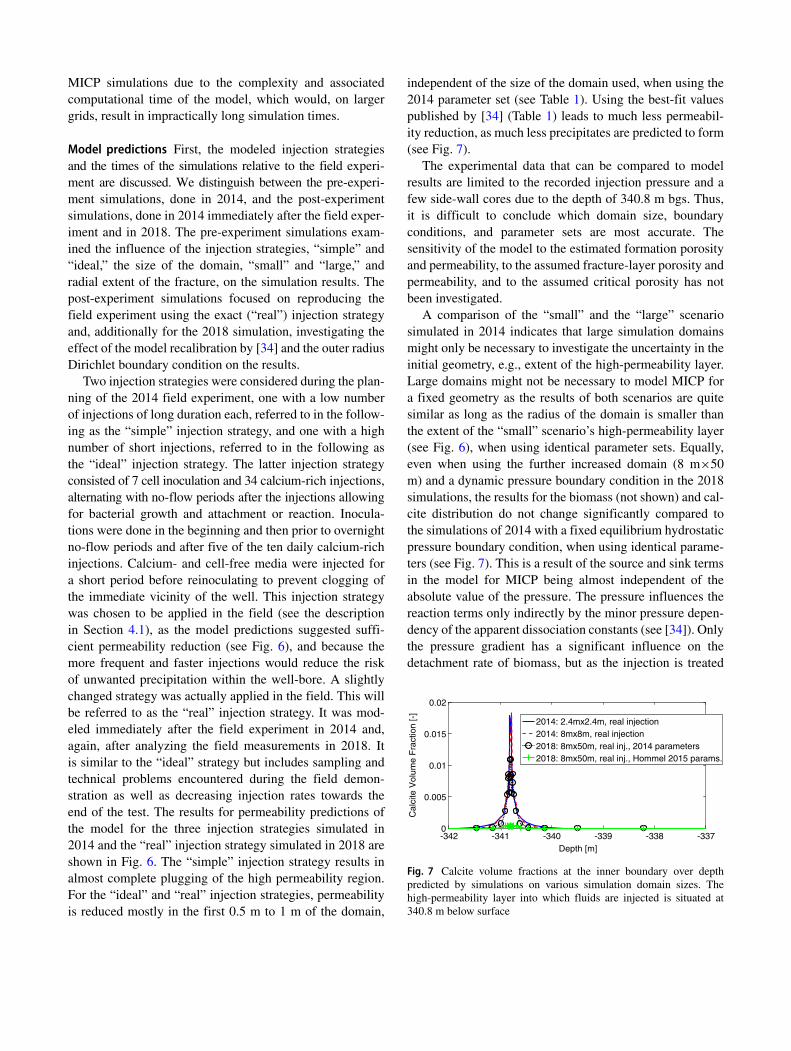
Fig. 7 Calcite volume fractions at the inner boundary over depthpredicted by simulations on various simulation domain sizes. Thehigh-permeability layer into which fluids are injected is situated at340.8 m below surface
as a Neumann boundary, the near-well-bore pressure gra-dients are independent of the absolute pressure values setat the Dirichlet boundary condition. The simulation resultsusing the planned (“ideal”) injection strategy match thefield-application results very well, as they predict pluggingafter 25 Ca2+-rich and 6 biomass injections, and also the“real” injection strategy results in a significant permeabilityreduction (see Fig. 6). Although both biofilm and calcite areassumed to be impermeable, most of the permeability reduc-tion is due to calcite, which, for the “real” injection strategyreaches higher volume fractions (φc,max ≈ 0.02) comparedto the small volume fraction of biofilm (φb,max ≈ 0.0006).However, we have to note that using the updated parametervalues from [34] that were the best to model the calibrationcolumn experiments did not improve the agreement betweenthe model results and the field-scale experiment. On thecontrary, biofilm and calcite volume fractions are reducedand no significant plugging is predicted by the model usingthis parameter set (see Figs. 6 and 7).
It is currently not possible to explicitly verify the sim-ulation results for permeability shown in Fig. 6 due tothe lack of data. However, side-wall cores, discussed inSection 4.1, collected a year after the field application 1.8 mabove the injection show biomineralized calcite. This com-pares quite well with the model results of CaCO3 reachingroughly 1 m above and below the fracture layer (see Fig. 7),especially, when considering that the scenarios investigatedassume, except for the high-permeability layer fracture layer,homogeneous initial porosity and permeability without anyvertical preferential flow paths. Similarly to calcite, mostbiomass (not shown here) is concentrated in the high-permeability layer, as in the medium-scale sandstone corein Fig. 4.
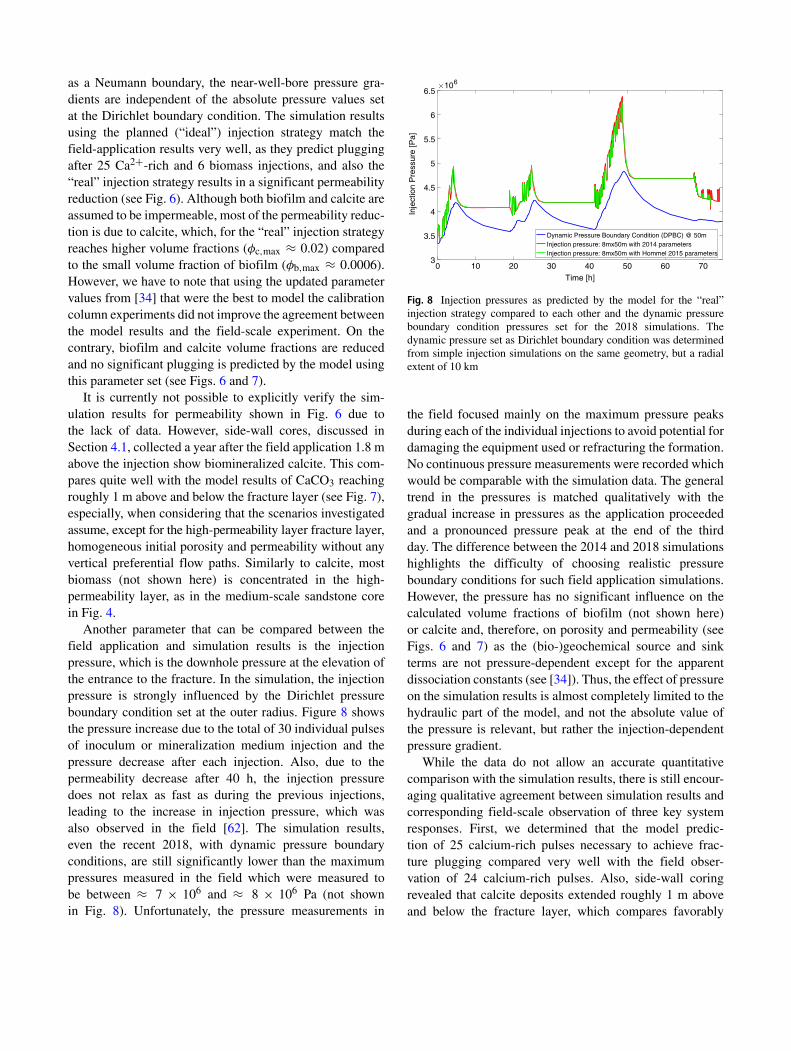
Another parameter that can be compared between thefield application and simulation results is the injectionpressure, which is the downhole pressure at the elevation ofthe entrance to the fracture. In the simulation, the injectionpressure is strongly influenced by the Dirichlet pressureboundary condition set at the outer radius. Figure 8 showsthe pressure increase due to the total of 30 individual pulsesof inoculum or mineralization medium injection and thepressure decrease after each injection. Also, due to thepermeability decrease after 40 h, the injection pressuredoes not relax as fast as during the previous injections,leading to the increase in injection pressure, which wasalso observed in the field [62]. The simulation results,even the recent 2018, with dynamic pressure boundaryconditions, are still significantly lower than the maximumpressures measured in the field which were measured tobe between ≈ 7 × 10⁶ and ≈ 8 × 10⁶ Pa (not shownin Fig. 8). Unfortunately, the pressure measurements in
0 10 20 30 40 50 60 70Time [h]
3
3.5
4
4.5
5
5.5
6
6.5
Inje
ctio
n P
ress
ure
[Pa]
106
Dynamic Pressure Boundary Condition (DPBC) @ 50mInjection pressure: 8mx50m with 2014 parametersInjection pressure: 8mx50m with Hommel 2015 parameters
Fig. 8 Injection pressures as predicted by the model for the “real”injection strategy compared to each other and the dynamic pressureboundary condition pressures set for the 2018 simulations. Thedynamic pressure set as Dirichlet boundary condition was determinedfrom simple injection simulations on the same geometry, but a radialextent of 10 km
the field focused mainly on the maximum pressure peaksduring each of the individual injections to avoid potential fordamaging the equipment used or refracturing the formation.No continuous pressure measurements were recorded whichwould be comparable with the simulation data. The generaltrend in the pressures is matched qualitatively with thegradual increase in pressures as the application proceededand a pronounced pressure peak at the end of the thirdday. The difference between the 2014 and 2018 simulationshighlights the difficulty of choosing realistic pressureboundary conditions for such field application simulations.However, the pressure has no significant influence on thecalculated volume fractions of biofilm (not shown here)or calcite and, therefore, on porosity and permeability (seeFigs. 6 and 7) as the (bio-)geochemical source and sinkterms are not pressure-dependent except for the apparentdissociation constants (see [34]). Thus, the effect of pressureon the simulation results is almost completely limited to thehydraulic part of the model, and not the absolute value ofthe pressure is relevant, but rather the injection-dependentpressure gradient.
While the data do not allow an accurate quantitativecomparison with the simulation results, there is still encour-aging qualitative agreement between simulation results andcorresponding field-scale observation of three key systemresponses. First, we determined that the model predic-tion of 25 calcium-rich pulses necessary to achieve frac-ture plugging compared very well with the field obser-vation of 24 calcium-rich pulses. Also, side-wall coringrevealed that calcite deposits extended roughly 1 m aboveand below the fracture layer, which compares favorably
with model results. In addition, the profile of simulateddownhole injection pressure compared favorably duringperiods where actual downhole pressure was measured,especially during the third day when clogging began tooccur in the field (Section 4.1).
5 Conclusions
5.1 The state of theMICPmodel so far
The long-term goal of this research is to develop bio-mineralization-based technologies for sealing preferentialflow pathways near well-bores and other applications ofpermeability modification in the subsurface. The history ofdevelopment of our MICP model clearly demonstrates that aclose synergy between laboratory experimentation at differ-ent scales and corresponding simulation model developmentis highly desirable to realize a successful application atthe field scale. Joint experimental investigations and modeldevelopment as discussed in [19] and [34] has now taken anenormous step towards real field applications. This bringsalong new challenges. One issue is that the best-fit param-eters from [34] result in only minor precipitation for thefield-test setup, while the estimated parameter values used inthe 2014 simulations (see Table 1), predict significant clog-ging. However, both the porous medium and the flow fieldare completely different between the field-test and the cali-bration setup of [34]. It is difficult to determine exactly whythe change in conditions results in another set of parametersseemingly better adapted than the laboratory best-fit parame-ters. However, it has to be noted that the values of the fittingparameters of the model are strongly correlated [34], whichwould require a whole set of well-controlled experiments inthe relevant porous media and at various scales with moremeasurements of different kinds, all tailored to fulfill thedemands of the model to identify a unique set of best-fitparameters. This is clearly our vision for future studies.
Inconsistencies between laboratory and field scale couldalso possibly arise from local, sub-REV-scale heterogeneitiesin the field which could result in apparently different kinet-ics at the modeled resolution as discussed in [11], orsuch discrepancies might be caused by processes, whichhave behavior at the laboratory scale that is different thanat the field scale, or different behaviors in different porousmedia. The effects from different porous media, e.g., fromdifferent pore-size distributions, different pore morpholo-gies, or chemical compositions, might be addressed byrigorous upscaling of MICP from the pore scale to largerscales. This could possibly lead to upscaled porous medium-dependent parameterizations of the processes for MICP
similar to the studies of, e.g., [7–9, 31, 43, 55, 58]. Nonethe-less, at the field scale, there will always be an insufficientamount of information for upscaling. Hence, some degree ofparameter fitting is always to be expected. Rigorous upscal-ing is important to obtain the appropriate functional form ofconstitutive relationships.
What we consider important for investigating the upscal-ing of MICP processes between the laboratory and the fieldscale is a close cooperation between experimentalists andmodelers, as demonstrated in this study and others, e.g.,by [51], and, very importantly, more well-controlled larger-scale experiments such as those conducted by [56]. A sec-ond, equally important, issue is that information on the setupis drastically reduced compared to well-controlled labora-tory work, thus complicating determination of correct initialand boundary conditions or other properties of the simu-lation setup such as the initial distribution of porosity andpermeability. Due to this uncertainty in the parameters, it isimportant to reduce the computational effort of the modelfor future applications to enable statistical assessment ofthe effects of the unknown porosity and permeability and,probably to some degree, their heterogeneous distribution.There are various means to achieve this, e.g., local gridrefinement, improving the time stepping [e.g., 12], reducingthe coupling between the mass balance equations of differ-ent components by improving, or changing the numericalscheme [e.g., 32, 41–43], the use of a multi-scale approach[e.g., 28, 38].
While the chosen size of the model domain and thecorresponding spatial resolution of the computational gridhave only minor influence on the calculated volumefractions of biofilm and precipitated calcite, and thus onthe change in porosity and permeability, this does not holdtrue for the predicted pressures. This study has shown thatthe absolute values of pressure due to the injections arestrongly influenced by the pressure boundary condition.The mathematical solution for the pressure in systems oflow compressibility behaves approximately elliptic; thus,pressure signals travel extremely fast and constant valuesof pressure at Dirichlet boundaries always limit it. Sucheffects are also discussed, e.g., by [6, 66] for CO2 storagein deep saline aquifers. Accordingly, the spatial scale ofthe pressure footprint due to injection is typically muchlarger than the spatial scale of the induced reactive transportduring MICP, which is the area of focus during sealing.The computationally expensive MICP model usually limitsthe size of the problem. However, it could be beneficialto employ a multi-physics approach, e.g., by coupling thenear-well region with MICP to an outer far-field regionwhere only the hydraulics are modeled with a flow model.Or one could apply an analytical solution, similar to the
multi-physics approach of, e.g., [20, 21] or the mortar-spaceupscaling by e.g. [57].
5.2 Future applications and plans for further modelimprovement
Research on MICP and related applications is continuingin our work groups, now focusing primarily on field-scalesealing of near-well-bore delaminations, fractures, voids,and other unrestricted flow channels through well-borecement. These preferential flow paths can result in lostzonal isolation leading to deleterious flow of fluids betweenzones or to the surface with multiple potential negativeimpacts including loss of resource production, reductionof sweep efficiency in EOR operations, and regulatorynon-compliance. Our next steps planned are to model well-bore cement sealing related to unconventional oil and gasrecovery and CO2 sequestration for projects which arecurrently underway.
For those applications, several further improvements ofthe model are crucial. First, the computational efficiency ofthe model should be increased whenever possible to enablethe use of larger simulation domains or more refined grids.Also a larger number of simulation runs, in the context ofanalyses of scenarios, parameter sensitivities, and uncertain-ties, is important on the field scale to address the inherentuncertainty related to the lack of information and data atthe field scale. Second, the model should be thoroughlyvalidated and, if necessary, re-calibrated to well-controlled,large-scale, full 3D, radial flow experiments to investigatethe apparent scale dependence of some model parameters.In particular, it should be investigated why the best-fitparameters for the quasi-1D sand column setups seem tounderestimate the precipitation of calcite in 3D radial setupsin sandstone. Third, the impact of MICP on the two-phaseflow properties needs to be included into the model, asthe mentioned common feature of the application is thepotential presence of two fluid phases, where relative per-meabilities and capillary pressures are essential to have forreliable description of flow. Fourth, the model should alsobe able to predict the increase in mechanical strength due toMICP, which has been shown in experiments, and could beused to increase the stability of cap rocks.
Dataavailability The numerical simulator DuMuX used in thisstudy can be obtained at http://www.dumux.org/download.php. The specific code used is available at https://git.iws.uni-stuttgart.de/dumux-pub/hommel2018a for the 2018simulations and https://git.iws.uni-stuttgart.de/dumux-pub/Shigorina2014a for the 2014 simulations.
Funding information The International Research Training GroupNUPUS, funded by the German Research Foundation (DFG), isacknowledged for enabling the model development through fundingbetween 2007 and 2016. Further, we acknowledge the DFG forfunding ongoing research related to this study in the grants HO6055/1-1 and within the Collaborative Research Center 1313. Funding forthe laboratory and field MICP experimental work was provided bytwo US Department of Energy grants DE-FE0004478, “AdvancedCO2 Leakage Mitigation using Engineered Biomineralization SealingTechnologies” and DE-FE000959, “Field Test and Evaluation ofEngineered Biomineralization Technology for Sealing Existing Wells”with matching support from Southern Company Generation and ShellInternational Exploration and Production B.V. Additional financialsupport was also provided by DOE DE-FG02-13ER86571 and NSFaward no. DMS0934696. Any opinions, findings, conclusions, orrecommendations expressed herein are those of the authors and do notnecessarily reflect the views of the Department of Energy (DOE).
Publisher’s Note Springer Nature remains neutral with regard tojurisdictional claims in published maps and institutional affiliations.
Appendix
This appendix provides the reactive source and sink termsin the model for MICP used in this study. In the followingtables, we refer to the components (water (w), inorganiccarbon (ic), sodium (Na), chloride (Cl), calcium (Ca), urea(u), ammonium/ammonia (a), substrate (s), oxygen (O2),and suspended biomass(sb)) and solid phase (biofilm (b)and calcite (c)) with the respective super- or subscripts.
Sodium and chloride do not take part in any of thereactions directly, which is why qNa = qCl = 0. However,they represent the effect of the presence of ions in theaqueous phase on the fluid properties density and viscosityaccording to the salinity dependent relations given in [5]and on the activity coefficients of the reacting componentscalculated using Pitzer equations according to [14, 48, 79],as discussed in detail in [19]. Also calcium is consideredto contribute to salinity and ionic strength. All ions areconsidered in the charge balance used to determine thepH and the dissociation of total inorganic carbon andammonia/ammonium.
Table 2 gives all reactive source and sink terms composedof the rates kinetics of the biogeochemical reactionsconsidered in the model. The parameters used to calculatedthe source and sink terms and rate kinetics are the following(see also Table 3 for their values): Mκ is the molar massof κ , Y the growth yield coefficient, F the ratio of oxygento substrate used for growth, kurease the maximum activityof urease, kub the mass ratio of urease to biofilm, ρb thedensity of biofilm, mκ the molality of κ calculated fromthe mole fraction xκ
w and the water-phase properties, Ku
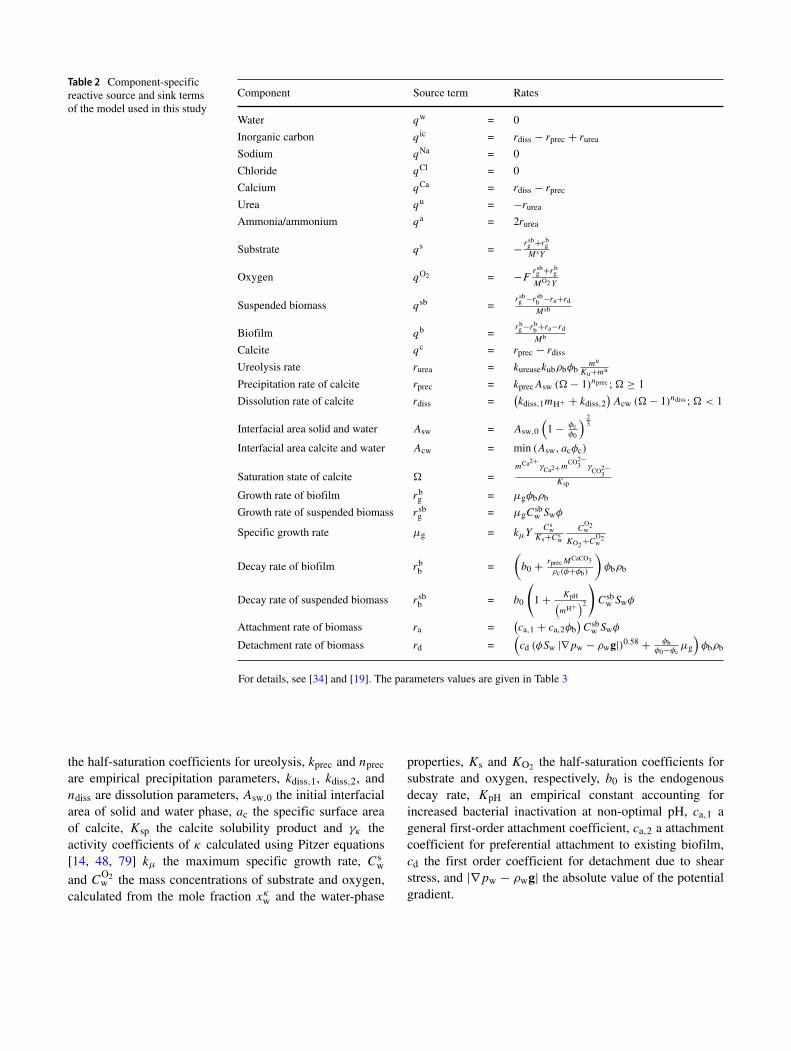
Table 2 Component-specificreactive source and sink termsof the model used in this study
Component Source term Rates
Water qw = 0
Inorganic carbon q ic = rdiss − rprec + rurea
Sodium qNa = 0
Chloride qCl = 0
Calcium qCa = rdiss − rprec
Urea qu = −rurea
Ammonia/ammonium qa = 2rurea
Substrate qs = − rsbg +rb
gMsY
Oxygen qO2 = −Frsbg +rb
g
MO2 Y
Suspended biomass qsb =rsbg −rsb
b −ra+rd
Msb
Biofilm qb =rbg −rb
b +ra−rd
Mb
Calcite qc = rprec − rdiss
Ureolysis rate rurea = kureasekubρbφbmu
Ku+mu
Precipitation rate of calcite rprec = kprecAsw ( − 1)nprec ; ≥ 1
Dissolution rate of calcite rdiss =(kdiss,1mH+ + kdiss,2
)Acw ( − 1)ndiss ; < 1
Interfacial area solid and water Asw = Asw,0
(1 − φc
φ0
) 23
Interfacial area calcite and water Acw = min (Asw, acφc)
Saturation state of calcite =mCa2+
γCa2+ mCO2−
3 γCO2−
3Ksp
Growth rate of biofilm rbg = μgφbρb
Growth rate of suspended biomass rsbg = μgC
sbw Swφ
Specific growth rate μg = kμYCs
wKs+Cs
w
CO2w
KO2 +CO2w
Decay rate of biofilm rbb =
(
b0 + rprecMCaCO3
ρc(φ+φb)
)
φbρb
Decay rate of suspended biomass rsbb = b0
(
1 + KpH(mH+ )2
)
Csbw Swφ
Attachment rate of biomass ra =(ca,1 + ca,2φb
)Csb
w Swφ
Detachment rate of biomass rd =(cd (φSw |∇pw − ρwg|)0.58 + φb
φ0−φcμg
)φbρb
For details, see [34] and [19]. The parameters values are given in Table 3
the half-saturation coefficients for ureolysis, kprec and nprec
are empirical precipitation parameters, kdiss,1, kdiss,2, andndiss are dissolution parameters, Asw,0 the initial interfacialarea of solid and water phase, ac the specific surface areaof calcite, Ksp the calcite solubility product and γκ theactivity coefficients of κ calculated using Pitzer equations[14, 48, 79] kμ the maximum specific growth rate, Cs
w
and CO2w the mass concentrations of substrate and oxygen,
calculated from the mole fraction xκw and the water-phase
properties, Ks and KO2 the half-saturation coefficients forsubstrate and oxygen, respectively, b0 is the endogenousdecay rate, KpH an empirical constant accounting forincreased bacterial inactivation at non-optimal pH, ca,1 ageneral first-order attachment coefficient, ca,2 a attachmentcoefficient for preferential attachment to existing biofilm,cd the first order coefficient for detachment due to shearstress, and |∇pw − ρwg| the absolute value of the potentialgradient.
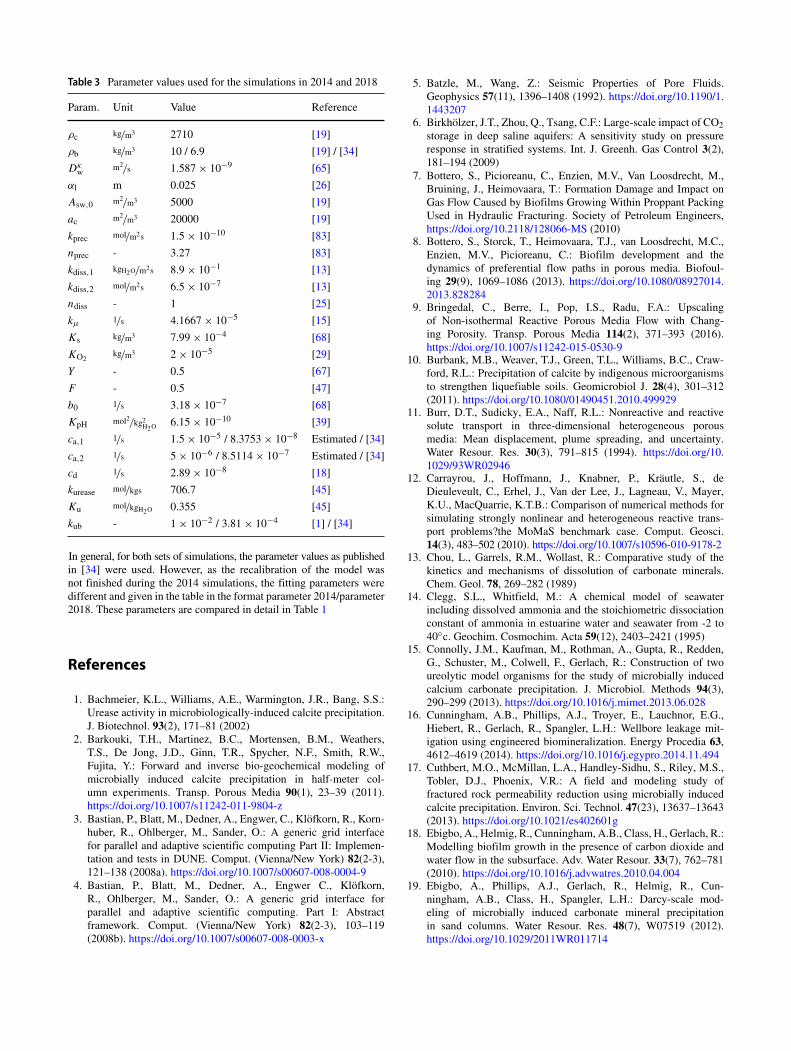
Table 3 Parameter values used for the simulations in 2014 and 2018
Param. Unit Value Reference
ρc kg/m3 2710 [19]
ρb kg/m3 10 / 6.9 [19] / [34]
Dκw
m2/s 1.587 × 10⁻⁹ [65]
αl m 0.025 [26]
Asw,0 m2/m3 5000 [19]
ac m2/m3 20000 [19]
kprec mol/m2s 1.5 × 10⁻¹⁰ [83]
nprec - 3.27 [83]
kdiss,1 kgH2O/m2s 8.9 × 10⁻¹ [13]
kdiss,2 mol/m2s 6.5 × 10⁻⁷ [13]
ndiss - 1 [25]
kμ 1/s 4.1667 × 10⁻⁵ [15]
Ks kg/m3 7.99 × 10⁻⁴ [68]
KO2kg/m3 2 × 10⁻⁵ [29]
Y - 0.5 [67]
F - 0.5 [47]
b0 1/s 3.18 × 10⁻⁷ [68]
KpH mol2/kg2H2O 6.15 × 10⁻¹⁰ [39]
ca,1 1/s 1.5 × 10⁻⁵ / 8.3753 × 10⁻⁸ Estimated / [34]
ca,2 1/s 5 × 10⁻⁶ / 8.5114 × 10⁻⁷ Estimated / [34]
cd 1/s 2.89 × 10⁻⁸ [18]
kurease mol/kgs 706.7 [45]
Ku mol/kgH2O 0.355 [45]
kub - 1 × 10⁻² / 3.81 × 10⁻⁴ [1] / [34]
In general, for both sets of simulations, the parameter values as publishedin [34] were used. However, as the recalibration of the model wasnot finished during the 2014 simulations, the fitting parameters weredifferent and given in the table in the format parameter 2014/parameter2018. These parameters are compared in detail in Table 1
References
1. Bachmeier, K.L., Williams, A.E., Warmington, J.R., Bang, S.S.:Urease activity in microbiologically-induced calcite precipitation.J. Biotechnol. 93(2), 171–81 (2002)
2. Barkouki, T.H., Martinez, B.C., Mortensen, B.M., Weathers,T.S., De Jong, J.D., Ginn, T.R., Spycher, N.F., Smith, R.W.,Fujita, Y.: Forward and inverse bio-geochemical modeling ofmicrobially induced calcite precipitation in half-meter col-umn experiments. Transp. Porous Media 90(1), 23–39 (2011).https://doi.org/10.1007/s11242-011-9804-z
3. Bastian, P., Blatt, M., Dedner, A., Engwer, C., Klofkorn, R., Korn-huber, R., Ohlberger, M., Sander, O.: A generic grid interfacefor parallel and adaptive scientific computing Part II: Implemen-tation and tests in DUNE. Comput. (Vienna/New York) 82(2-3),121–138 (2008a). https://doi.org/10.1007/s00607-008-0004-9
4. Bastian, P., Blatt, M., Dedner, A., Engwer C., Klofkorn,R., Ohlberger, M., Sander, O.: A generic grid interface forparallel and adaptive scientific computing. Part I: Abstractframework. Comput. (Vienna/New York) 82(2-3), 103–119(2008b). https://doi.org/10.1007/s00607-008-0003-x
5. Batzle, M., Wang, Z.: Seismic Properties of Pore Fluids.Geophysics 57(11), 1396–1408 (1992). https://doi.org/10.1190/1.1443207
6. Birkholzer, J.T., Zhou, Q., Tsang, C.F.: Large-scale impact of CO2storage in deep saline aquifers: A sensitivity study on pressureresponse in stratified systems. Int. J. Greenh. Gas Control 3(2),181–194 (2009)
7. Bottero, S., Picioreanu, C., Enzien, M.V., Van Loosdrecht, M.,Bruining, J., Heimovaara, T.: Formation Damage and Impact onGas Flow Caused by Biofilms Growing Within Proppant PackingUsed in Hydraulic Fracturing. Society of Petroleum Engineers,https://doi.org/10.2118/128066-MS (2010)
8. Bottero, S., Storck, T., Heimovaara, T.J., van Loosdrecht, M.C.,Enzien, M.V., Picioreanu, C.: Biofilm development and thedynamics of preferential flow paths in porous media. Biofoul-ing 29(9), 1069–1086 (2013). https://doi.org/10.1080/08927014.2013.828284
9. Bringedal, C., Berre, I., Pop, I.S., Radu, F.A.: Upscalingof Non-isothermal Reactive Porous Media Flow with Chang-ing Porosity. Transp. Porous Media 114(2), 371–393 (2016).https://doi.org/10.1007/s11242-015-0530-9
10. Burbank, M.B., Weaver, T.J., Green, T.L., Williams, B.C., Craw-ford, R.L.: Precipitation of calcite by indigenous microorganismsto strengthen liquefiable soils. Geomicrobiol J. 28(4), 301–312(2011). https://doi.org/10.1080/01490451.2010.499929
11. Burr, D.T., Sudicky, E.A., Naff, R.L.: Nonreactive and reactivesolute transport in three-dimensional heterogeneous porousmedia: Mean displacement, plume spreading, and uncertainty.Water Resour. Res. 30(3), 791–815 (1994). https://doi.org/10.1029/93WR02946
12. Carrayrou, J., Hoffmann, J., Knabner, P., Krautle, S., deDieuleveult, C., Erhel, J., Van der Lee, J., Lagneau, V., Mayer,K.U., MacQuarrie, K.T.B.: Comparison of numerical methods forsimulating strongly nonlinear and heterogeneous reactive trans-port problems?the MoMaS benchmark case. Comput. Geosci.14(3), 483–502 (2010). https://doi.org/10.1007/s10596-010-9178-2
13. Chou, L., Garrels, R.M., Wollast, R.: Comparative study of thekinetics and mechanisms of dissolution of carbonate minerals.Chem. Geol. 78, 269–282 (1989)
14. Clegg, S.L., Whitfield, M.: A chemical model of seawaterincluding dissolved ammonia and the stoichiometric dissociationconstant of ammonia in estuarine water and seawater from -2 to40◦c. Geochim. Cosmochim. Acta 59(12), 2403–2421 (1995)
15. Connolly, J.M., Kaufman, M., Rothman, A., Gupta, R., Redden,G., Schuster, M., Colwell, F., Gerlach, R.: Construction of twoureolytic model organisms for the study of microbially inducedcalcium carbonate precipitation. J. Microbiol. Methods 94(3),290–299 (2013). https://doi.org/10.1016/j.mimet.2013.06.028
16. Cunningham, A.B., Phillips, A.J., Troyer, E., Lauchnor, E.G.,Hiebert, R., Gerlach, R., Spangler, L.H.: Wellbore leakage mit-igation using engineered biomineralization. Energy Procedia 63,4612–4619 (2014). https://doi.org/10.1016/j.egypro.2014.11.494
17. Cuthbert, M.O., McMillan, L.A., Handley-Sidhu, S., Riley, M.S.,Tobler, D.J., Phoenix, V.R.: A field and modeling study offractured rock permeability reduction using microbially inducedcalcite precipitation. Environ. Sci. Technol. 47(23), 13637–13643(2013). https://doi.org/10.1021/es402601g
18. Ebigbo, A., Helmig, R., Cunningham, A.B., Class, H., Gerlach, R.:Modelling biofilm growth in the presence of carbon dioxide andwater flow in the subsurface. Adv. Water Resour. 33(7), 762–781(2010). https://doi.org/10.1016/j.advwatres.2010.04.004
19. Ebigbo, A., Phillips, A.J., Gerlach, R., Helmig, R., Cun-ningham, A.B., Class, H., Spangler, L.H.: Darcy-scale mod-eling of microbially induced carbonate mineral precipitationin sand columns. Water Resour. Res. 48(7), W07519 (2012).https://doi.org/10.1029/2011WR011714
20. Faigle, B., Helmig, R., Aavatsmark, I., Flemisch, B.: Effi-cient multiphysics modelling with adaptive grid refinementusing a MPFA method. Comput. Geosci. 18(5), 625–636.https://doi.org/10.1007/s10596-014-9407-1 (2014)
21. Faigle, B., Elfeel, M.A., Helmig, R., Becker, B., Flemisch, B.,Geiger, S.: Multi-physics modeling of non-isothermal composi-tional flow on adaptive grids. Comput. Methods Appl. Mech. Eng.292, 16–34 (2015). https://doi.org/10.1016/j.cma.2014.11.030
22. Ferris, F.G., Stehmeier, L.G., Kantzas, A., Mourits, F.M.:Bacteriogenic mineral plugging. J. Can. Pet. Technol. 35(8), 56–61 (1996). https://doi.org/10.2118/96-08-06
23. Fidaleo, M., Lavecchia, R.: Kinetic study of enzymatic ureahydrolysis in the pH range 4-9. Chem. Biochem. Eng. Q. 17,311–318 (2003)
24. Flemisch, B., Darcis, M., Erbertseder, K., Faigle, B., Lauser,A., Mosthaf, K., Muthing, S., Nuske, P., Tatomir, A., Wolff,M., Helmig, R.: DumuX: DUNE for multi-{phase,compo-nent,scale,physics,...} flow and transport in porous media. Adv.Water Resour. 34(9), 1102–1112 (2011). https://doi.org/10.1016/j.advwatres.2011.03.007
25. Flukiger, F., Bernard, D.: A new numerical model for pore scaledissolution of calcite due to CO2 saturated water flow in 3D real-istic geometry: Principles and first results. Chem. Geol. 265(1-2),171–180 (2009). https://doi.org/10.1016/j.chemgeo.2009.05.004
26. Frippiat, C.C., Perez, P.C., Holeyman, A.E.: Estimation oflaboratory-scale dispersivities using an annulus-and-core device.J. Hydrol. 362(1-2), 57–68 (2008). https://doi.org/10.1016/j.jhydrol.2008.08.007
27. Fujita, Y., Taylor, J.L., Gresham, T.L.T., Delwiche, M.E., Colwell,F.S., McLing, T.L., Petzke, L.M., Smith, R.W.: Stimulation ofmicrobial urea hydrolysis in groundwater to enhance calciteprecipitation. Environ. Sci. Technol. 42(8), 3025–3032 (2008)
28. Hajibeygi, H., Bonfigli, G., Hesse, M.A., Jenny, P.: Iterativemultiscale finite-volume method. J. Comput. Phys. 227(19),8604–8621 (2008). https://doi.org/10.1016/j.jcp.2008.06.013
29. Hao, O.J., Richard, M.G., Jenkins, D., Blanch, H.W.: The half-saturation coefficient for dissolved oxygen: a dynamic methodfor its determination and its effect on dual species competition.Biotechnol. Bioeng. 25(2), 403–16 (1983). https://doi.org/10.1002/bit.260250209
30. Helmig, R.: Multiphase Flow and Transport Processes in theSubsurface - A Contribution to the Modeling of Hydrosystems.Springer, Berlin (1997)
31. Heße, F., Radu, F., Thullner, M., Attinger, S.: Upscaling of theadvection-diffusion-reaction equation with Monod reaction. Adv.Water Resour. 32(8), 1336–1351 (2009). https://doi.org/10.1016/j.advwatres.2009.05.009
32. Hoffmann, J., Krautle, S., Knabner, P.: A general reductionscheme for reactive transport in porous media. Comput. Geosci.16(4), 1081–1099 (2012). https://doi.org/10.1007/s10596-012-9304-4
33. Hommel, J., Cunningham, A.B., Helmig, R., Ebigbo, A., Class,H.: Numerical investigation of microbially induced calcite precip-itation as a leakage mitigation technology. Energy Procedia 40C,392–397 (2013). https://doi.org/10.1016/j.egypro.2013.08.045
34. Hommel, J., Lauchnor, E.G., Phillips, A.J., Gerlach, R., Cunning-ham, A.B., Helmig, R., Ebigbo, A., Class, H.: A revised model formicrobially induced calcite precipitation: Improvements and newinsights based on recent experiments. Water Resour. Res. 51(5),3695–3715 (2015). https://doi.org/10.1002/2014WR016503
35. Hommel, J., Lauchnor, E.G., Gerlach, R., Cunningham, A.B.,Ebigbo, A., Helmig, R., Class, H.: Investigating the influence ofthe initial biomass distribution and injection strategies on Biofilm-Mediated calcite precipitation in porous media. Transp. PorousMedia 114(2), 557–579 (2016). https://doi.org/10.1007/s11242-015-0617-3
36. Hommel, J., Coltman, E., Class, H.: Porosity-PermeabilityRelations for Evolving Pore Space: A Review with a Focus on(Bio-)geochemically Altered Porous Media. Transport in PorousMedia, https://doi.org/10.1007/s11242-018-1086-2 (2018)
37. Jacques, D., Simunek, J., Mallants, D., van Genuchten, M.:Modelling coupled water flow, solute transport and geochemicalreactions affecting heavy metal migration in a podzol soil.Geoderma 145(3), 449–461 (2008). https://doi.org/10.1016/j.geoderma.2008.01.009
38. Jenny, P., Lee, S., Tchelepi, H.: Adaptive Multiscale finite-Volume Method for Multiphase Flow and Transport inPorous Media. Multiscale Model. Simul. 3(1), 50–64 (2005).https://doi.org/10.1137/030600795
39. Kim, D.S., Thomas, S., Fogler, H.S.: Effects of pH and traceminerals on long-term starvation of Leuconostoc mesenteroides.Appl. Environ. Microbiol. 66(3), 976–81 (2000)
40. Krajewska B.: Urease-aided calcium carbonate mineralizationfor engineering applications: A review. Journal of AdvancedResearch, https://doi.org/10.1016/j.jare.2017.10.009 (2017)
41. Krautle, S., Knabner, P.: A new numerical reduction schemefor fully coupled multicomponent transport-reaction problemsin porous media. Water Resour. Res. 41(9), W09414 (2005).https://doi.org/10.1029/2004WR003624
42. Krautle, S., Knabner, P.: A reduction scheme for cou-pled multicomponent transport-reaction problems in porousmedia: Generalization to problems with heterogeneous equi-librium reactions. Water Resour. Res. 43(3), W03429 (2007).https://doi.org/10.1029/2005WR004465
43. Kumar, K., van Noorden, T., Pop, I.: Effective dispersionequations for reactive flows involving free boundaries at themicroscale. Multiscale Model. Simul. 9(1), 29–58 (2011).https://doi.org/10.1137/100804553
44. Landa-Marban, D., Radu, F.A., Nordbotten, J.M.: Modelingand simulation of microbial enhanced oil recovery includinginterfacial area. Transp. Porous Media 120(2), 395–413 (2017).https://doi.org/10.1007/s11242-017-0929-6
45. Lauchnor, E.G., Topp, D.M., Parker, A.E., Gerlach, R.: Whole cellkinetics of ureolysis by Sporosarcina pasteurii. J. Appl. Microbiol.118(6), 1321–1332 (2015). https://doi.org/10.1111/jam.12804
46. Martinez, B., De Jong, J.T., Ginn, T.R.: Bio-geochemical reactivetransport modeling of microbial induced calcite precipitation topredict the treatment of sand in one-dimensional flow. Comput.Geotech. 58, 1–13 (2014). https://doi.org/10.1016/j.compgeo.2014.01.013
47. Mateles, R.I.: Calculation of the oxygen required for cell produc-tion. Biotechnol. Bioeng. 13(4), 581–582 (1971). https://doi.org/10.1002/bit.260130411
48. Millero, F.J., Milne, P.J., Thurmond, V.L.: The solubility of calcite,strontianite and witherite in NaCl solutions at 25◦c. Geochim.Cosmochim. Acta 48, 1141–1143 (1984). https://doi.org/10.1016/0016-7037(84)90205-9
49. Minto, J.M., Tan, Q., Lunn, R.J., Mountassir, G.E., Guo, H.,Cheng, X.: ‘Microbial mortar’-restoration of degraded marblestructures with microbially induced carbonate precipitation.Constr. Build. Mater. 180, 44–54 (2018). https://doi.org/10.1016/j.conbuildmat.2018.05.200
50. Mitchell, A.C., Phillips, A.J., Schultz, L., Parks, S., Spangler,L.H., Cunningham, A.B., Gerlach, R.: Microbial CaCO3 mineralformation and stability in an experimentally simulated highpressure saline aquifer with supercritical CO2. Int. J. Greenh. GasControl 15, 86–96 (2013). https://doi.org/10.1016/j.ijggc.2013.02.001
51. Nassar, M.K., Gurung, D., Bastani, M., Ginn, T.R., Shafei,B., Gomez, M.G., Graddy, C.M.R., Nelson, D.C., DeJong,J.T.: Large-Scale Experiments in microbially induced cal-cite precipitation (MICP): Reactive transport model develop-
ment and prediction. Water Resour. Res. 54, 480–500 (2018).https://doi.org/10.1002/2017WR021488
52. Nemati, M., Voordouw, G.: Modification of porous mediapermeability, using calcium carbonate produced enzymaticallyin situ. Enzyme Microb. Technol. 33(5), 635–642 (2003).https://doi.org/10.1016/S0141-0229(03)00191-1
53. Nielsen, S.M., Nesterov, I., Shapiro, A.A.: Simulations ofmicrobial-enhanced oil recovery: Adsorption and filtration.Transp. Porous Media 102(2), 227–259 (2014). https://doi.org/10.1007/s11242-014-0273-z
54. Nielsen, S.M., Nesterov, I., Shapiro, A.A.: Microbial enhancedoil recovery—a modeling study of the potential of spore-forming bacteria. Comput. Geosci. 20(3), 567–580 (2016).https://doi.org/10.1007/s10596-015-9526-3
55. van Noorden, T.L., Pop, I.S., Ebigbo, A., Helmig, R.: An upscaledmodel for biofilm growth in a thin strip. Water Resour. Res. 46(6),W06505 (2010). https://doi.org/10.1029/2009WR008217
56. van Paassen, L.A., Ghose, R., van der Linden, T.J.M., van derStar, W.R.L., van Loosdrecht, M.C.M.: Quantifying BiomediatedGround Improvement by Ureolysis: Large-Scale Biogrout Experi-ment. J. Geotechn. Geoenviron. Eng. 136(12), 1721–1728 (2010).https://doi.org/10.1061/(ASCE)GT.1943-5606.0000382
57. Peszynska, M., Wheeler, M.F., Yotov, I.: Mortar Upscaling forMultiphase Flow in Porous Media. Comput. Geosci. 6(1), 73–100(2002). https://doi.org/10.1023/A:1016529113809
58. Peszynska, M., Trykozko, A., Iltis, G., Schlueter, S., Wildenschild,D.: Biofilm growth in porous media: experiments, computationalmodeling at the porescale, and upscaling. Adv. Water Resour. 95,288–301 (2016). https://doi.org/10.1016/j.advwatres.2015.07.008
59. Phillips, A.J., Gerlach, R., Lauchnor, E.G., Mitchell, A.C.,Cunningham, A.B., Spangler, L.H.: Engineered applications ofureolytic biomineralization: a review. Biofouling 29(6), 715–733(2013a). https://doi.org/10.1080/08927014.2013.796550
60. Phillips, A.J., Lauchnor, E.G., Eldring, J.J., Esposito, R.,Mitchell, A.C., Gerlach, R., Cunningham, A.B., Spangler, L.H.:Potential CO2 leakage reduction through biofilm-induced calciumcarbonate precipitation. Environ. Sci. Technol. 47, 142–149(2013b). https://doi.org/10.1021/es301294q
61. Phillips, A.J., Eldring, J., Hiebert, R., Lauchnor, E.G., Mitchell,A.C., Cunningham, A.B., Spangler, L.H., Gerlach, R.: Design of ameso-scale high pressure vessel for the laboratory examination ofbiogeochemical subsurface processes. J. Pet. Sci. Eng. 126, 55–62(2015). https://doi.org/10.1016/j.petrol.2014.12.008
62. Phillips, A.J., Cunningham, A.B., Gerlach, R., Hiebert, R.,Hwang, C., Lomans, B.P., Westrich, J., Mantilla, C., Kirksey, J.,Esposito, R., Spangler, L.H.: Fracture sealing with Microbially-Induced calcium carbonate precipitation: a field study. Environ.Sci. Technol. 50, 4111–4117 (2016). https://doi.org/10.1021/acs.est.5b05559
63. Prommer, H., Grassi, M.E., Davis, A.C., Patterson, B.M.:Modeling of microbial dynamics and geochemical changes in ametal bioprecipitation experiment. Environ. Sci. Technol. 41(24),8433–8438 (2007). https://doi.org/10.1021/es071123n
64. Qin, C., Hassanizadeh, S.M., Ebigbo, A.: Pore-scale networkmodeling of microbially induced calcium carbonate precipita-tion: Insight into scale dependence of biogeochemical reac-tion rates. Water Resour. Res. 52(11), 8794–8810 (2016).https://doi.org/10.1002/2016WR019128
65. Riquelme, R., Lira, I., Perez-Lopez, C., Rayas, J.A., Rodrıguez-vera, R.: Interferometric measurement of a diffusion coef-ficient: comparison of two methods and uncertainty anal-ysis. J. Phys. D: Appl. Phys. 40(9), 2769–2776 (2007).https://doi.org/10.1088/0022-3727/40/9/015
66. Schafer, F., Walter, L., Class, H., Muller, C.: The regionalpressure impact of CO2 storage: a showcase study from the North
German Basin. Environ. Earth Sci. 65(7), 2037–2049 (2012).https://doi.org/10.1007/s12665-011-1184-8
67. Seto, M., Alexander, M.: Effect of bacterial density and substrateconcentration on yield coefficients. Appl. Environ. Microbiol.50(5), 1132–1136 (1985)
68. Taylor, S.W., Jaffe, P.R.: Substrate and biomass transport in aporous-medium. Water Resour. Res. 26(9), 2181–2194 (1990).https://doi.org/10.1029/WR026i009p02181
69. Tebes-Stevens, C., Valocchi, A.J., VanBriesen, J.M., Rittmann,B.E.: Multicomponent transport with coupled geochemical andmicrobiological reactions: model description and example simu-lations. J. Hydrol. 209(1), 8–26 (1998). https://doi.org/10.1016/S0022-1694(98)00104-8
70. Umar, M., Kassim, K.A., Chiet, K.T.P.: Biological pro-cess of soil improvement in civil engineering: a review.J. Rock Mechan. Geotechn. Eng. 8(5), 767–774 (2016).https://doi.org/10.1016/j.jrmge.2016.02.004
71. Verma, A., Pruess, K.: Thermohydrological conditions and silicaredistribution near high-level nuclear wastes emplaced in saturatedgeological formations. J. Geophys. Res. Solid Earth 93(B2),1159–1173 (1988). https://doi.org/10.1029/JB093iB02p01159
72. Vilcaez, J., Li, L., Wu, D., Hubbard, S.S.: Reactive transport mod-eling of induced selective plugging by leuconostoc mesenteroidesin carbonate formations. Geomicrobiol J. 30(9), 813–828 (2013).https://doi.org/10.1080/01490451.2013.774074
73. van der Vorst, H.A.: BI-CGSTAB: A fast and smoothy convergingvariant of BI-CG for the solution of nansymmetric linear systems.SIAM J. Sci. Comput. 13(2), 631–644 (1992)
74. Watson, I.a., Oswald, S.E., Mayer, K.U., Wu, Y., Banwart, S.a.:Modeling kinetic processes controlling hydrogen and acetate con-centrations in an aquifer-derived microcosm. Environ. Sci. Tech.37(17), 3910–3919 (2003). https://doi.org/10.1021/es020242u
75. Whiffin, V.S., La van, P., Harkes, M.P.: Microbial carbonateprecipitation as a soil improvement technique. Geomicrobiol. J.24(5), 417–423 (2007). https://doi.org/10.1080/01490450701436505
76. van Wijngaarden, W.K., Vermolen, F.J., Meurs, G.A.M., Vuik, C.:Modelling Biogrout: A new ground improvement method basedon microbial-induced carbonate precipitation. Transp. PorousMedia 87(2), 397–420 (2011). https://doi.org/10.1007/s11242-010-9691-8
77. van Wijngaarden, W.K., Vermolen, F.J., Meurs, G.A.M., Vuik,C.: A mathematical model for Biogrout. Comput. Geosci. 17(3),463–478 (2013). https://doi.org/10.1007/s10596-012-9316-0
78. van Wijngaarden, W.K., van Paassen, L.A., Vermolen, F.J., vanMeurs, G.A.M., Vuik, C.: A reactive transport model for biogroutcompared to experimental data. Transp. Porous Media 111(3),627–648 (2016). https://doi.org/10.1007/s11242-015-0615-5
79. Wolf, M., Breitkopf, O., Puk, R.: Solubility of calcite in differentelectrolytes at temperatures between 10 and 60◦C and at CO2partial pressures of about 1 kPa. Geochem. J. 76, 291–301 (1989)
80. Zhang, T., Klapper, I.: Mathematical model of biofilm inducedcalcite precipitation. Water Sci. Technol. 61(11), 2957 (2010).https://doi.org/10.2166/wst.2010.064
81. Zhang, T., Klapper, I.: Mathematical model of the effect ofelectrodiffusion on biomineralization. Int. J. Non-Linear Mech.46(4), 657–666 (2011). https://doi.org/10.1016/j.ijnonlinmec.2010.12.008
82. Zhang, T., Klapper, I.: Critical occlusion via biofilm inducedcalcite precipitation in porous media. J. Phys. 16(5), 055009(2014). https://doi.org/10.1088/1367-2630/16/5/055009
83. Zhong, S., Mucci, A.: Calcite and aragonite precipitation fromseawater solutions of various salinities: Precipitation rates andovergrowth compositions. Chem. Geol. 78, 283–299 (1989)


![Microbially MediatedFormation of Benzonaphthothiophenes from … · Microbially MediatedFormation ofBenzonaphthothiophenes from Benzo[b]thiophenes KEVING. ... as the growthsubstrate](https://img.pdfslide.us/doc/110x75/5ed934756714ca7f4769568d/microbially-mediatedformation-of-benzonaphthothiophenes-from-microbially-mediatedformation.jpg)