Embed Size (px)
Citation preview

F I E L D R E P O R T
R E C O N N A I S S A N C E SILT S A M P L I N G
T E L K W A PASS, B . C«
D. Arscott
Associated Geological Services L t d . ,
Vancouver, B . C .
June 19, 1969

T A B L E O F C O N T E N T S
Page
I N T R O D U C T I O N 1
L O C A T I O N A N D A C C E S S 1
G E O G R A P H Y 1
G E O L O G Y 1
SILT S A M P L I N G 2
1. Method 2
2. Description of Samples 2
DISCUSSION O F R E S U L T S 3
Distribution of Values
A N O M A L I E S 5
C O N C L U S I O N S 6
I L L U S T R A T I O N S
Photographs
Histograms
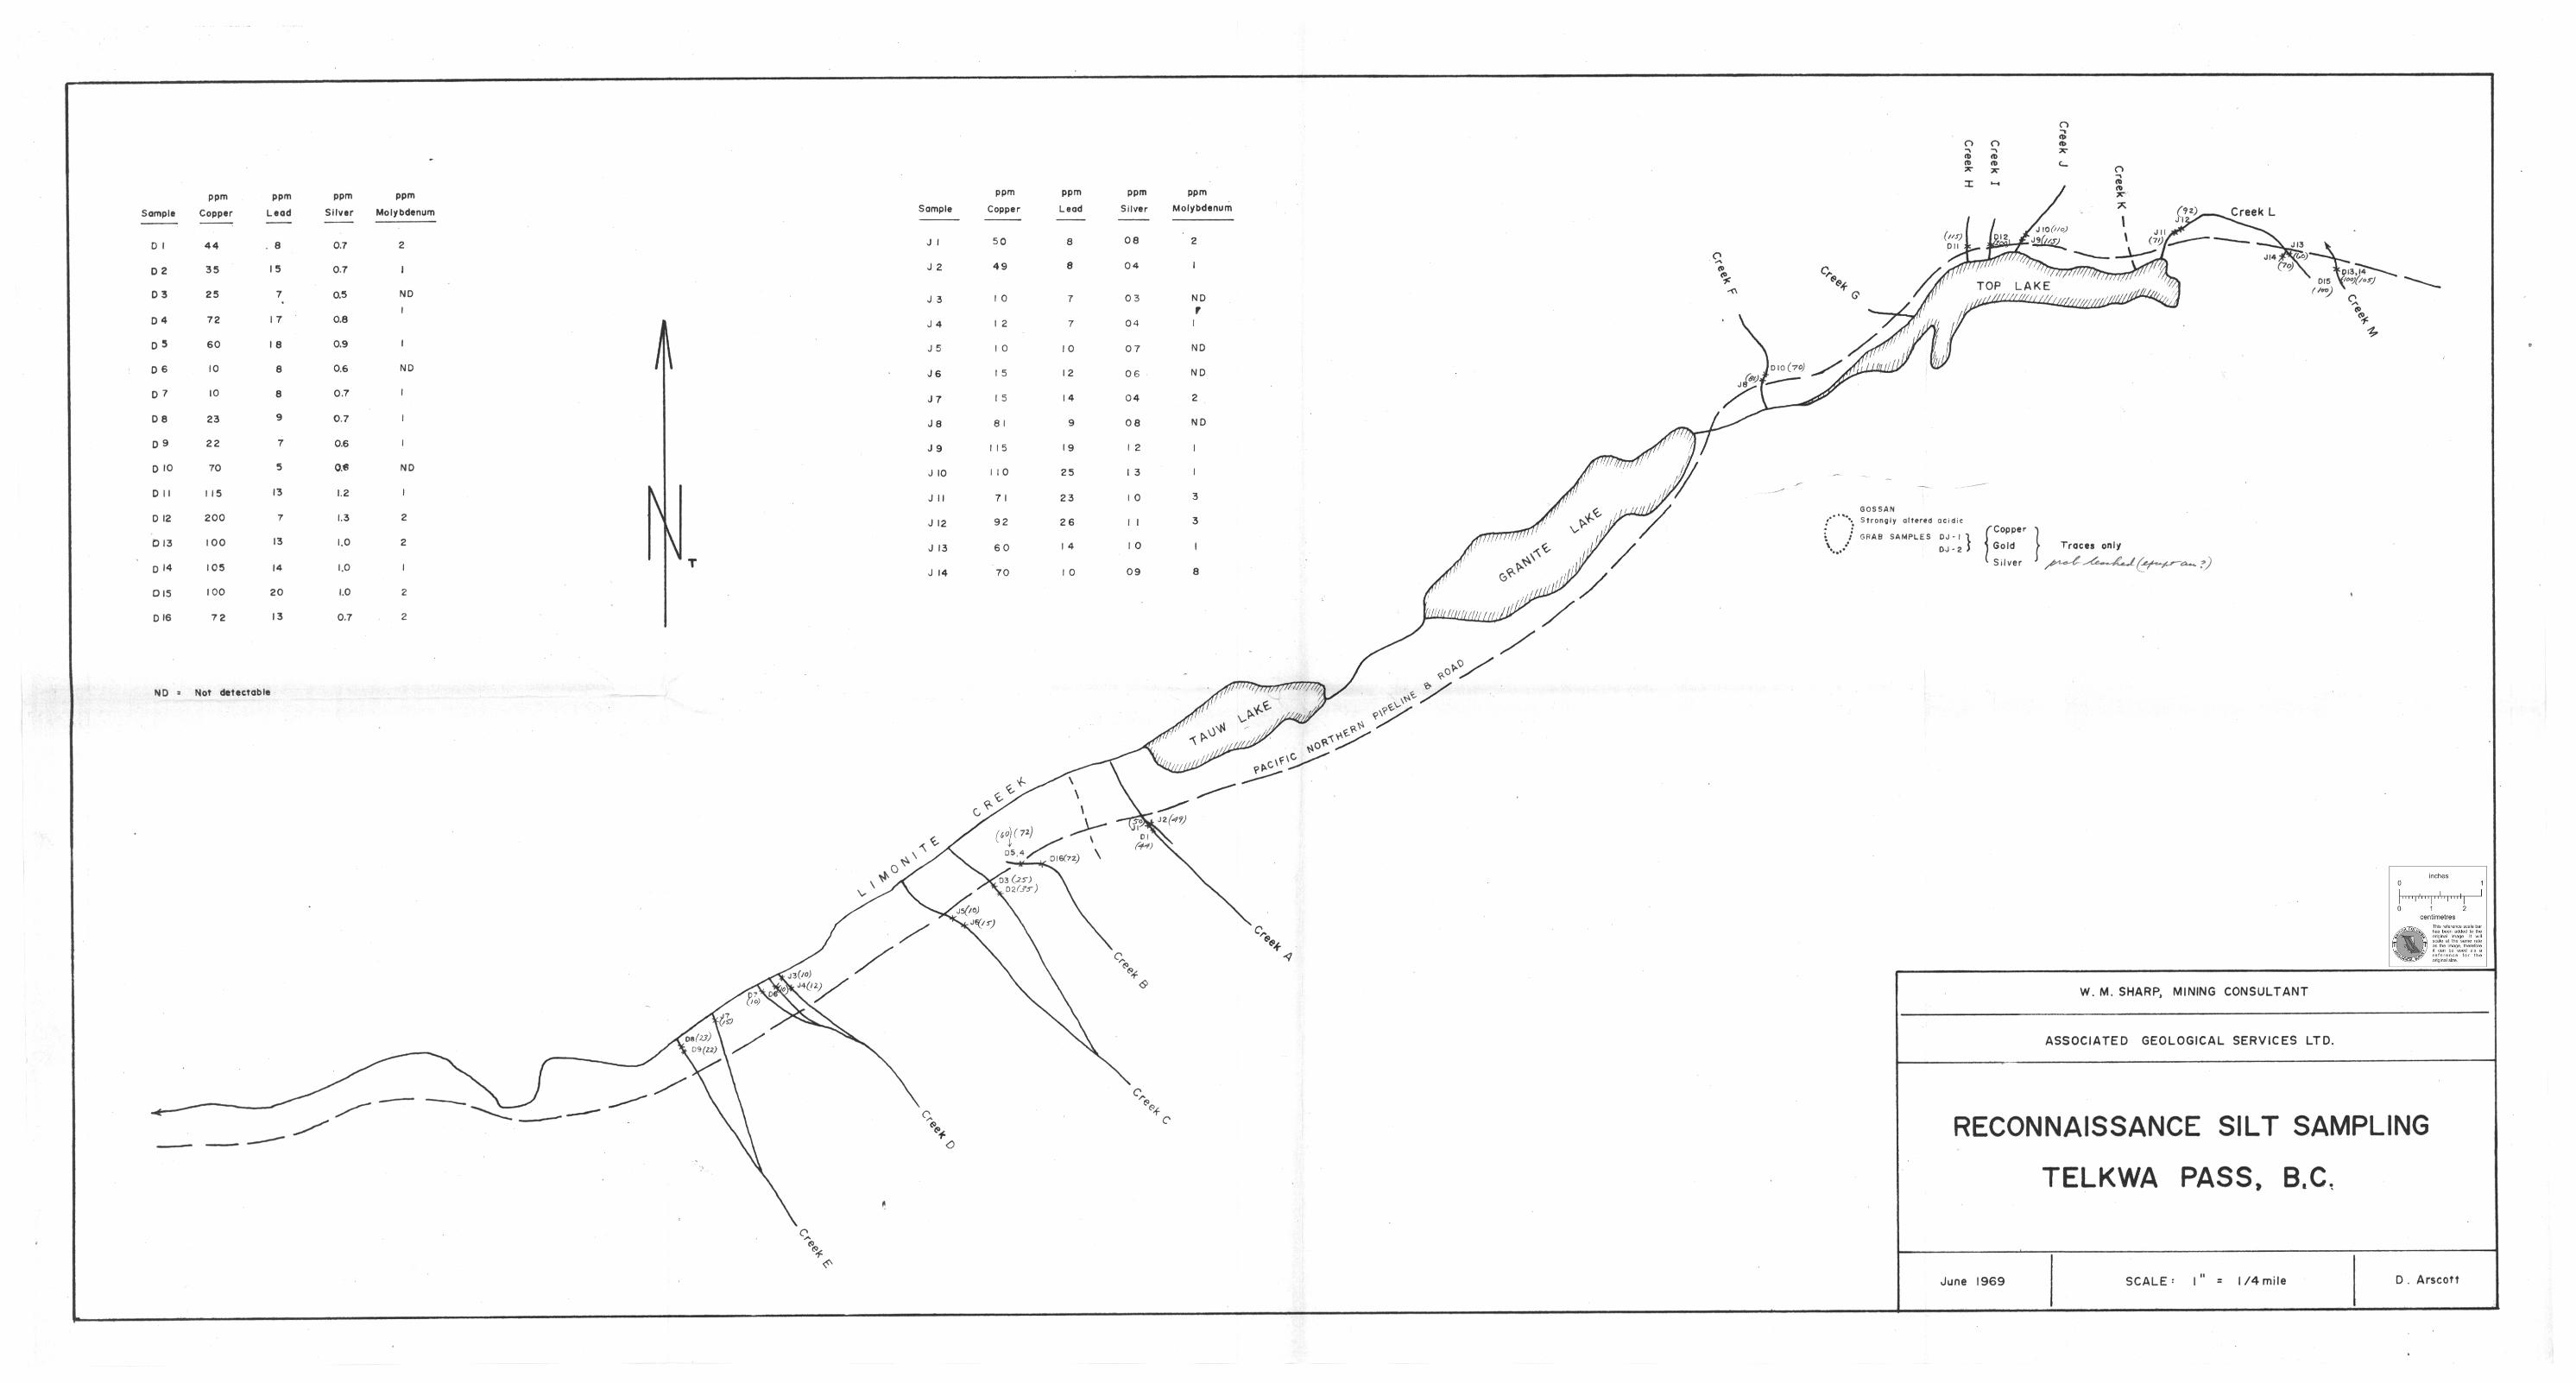
Plan of sample locations, 1" = 1/4 mile


I N T R O D U C T I O N
On the 4th June 1969 the writer and an assistant made a reconnaissance
silt sampling tr ip up Limonite Creek to the Telkwa Pass . The purpose was
to verify and expand the results of previous sampling, and to select targets
for more detailed examination.
L O C A T I O N A N D A C C E S S
The area is approximately 35 miles E N E of T e r r a c e , B . C . , at the west
end of the Telkwa Range.
A good gravel road follows the Zymoetz River to its junction with Limonite
Creek. F r o m there a rough tote road follows the Pacif ic Northern pipeline
up the creek, and might be negotiable by a 4-wheel drive winch, and chain
saw equipped vehicle up to the head of Granite L a k e . At this point the bridge
is washed out.
G E O G R A P H Y
Altitude: Telkwa Pass - 2500 feet
Relief: 5000 feet
Slopes: Lower slopes are mostly talus
Nearly vert ical cliffs support spectacular hanging glaciers
on the south side of the pass .
G E O L O G Y
V e r y little information is available. Most of the underlying bedrock appears
to be granite and tuff.
Iron, tungsten and l e a d - s i l v e r - g o l d deposits are known in the area .

2
Two rock samples (grab) were taken from a large area of gossan, about 200
feet by 300 feet and half a mile SSE of Granite L a k e . These consist of
disseminated pyrite in a strongly altered acidic rock, possibly granite.
SILT S A M P L I N G
1. Method
Silts and sandy silts were collected wherever possible in creeks
crossing the pipeline, the sample locations being marked with red flagging
tape* Wooden spoons were used to avoid contamination, and core was taken
to avoid soi l material slumped from stream banks. In two cases, a pair of
samples were taken within a few feet of each other to check for reproducibil ity
of assay results .
The samples were assayed by Bondar -Clegg and Company for trace
amounts of copper, molybdenum, lead and s i lver , using the Atomic
Absorption method.
2. Description of Samples
Acidity Possibi l i ty of Sample No: Sediment Type (pH ) sample representing
m^mmmmm0m^mm__mmm„ _ _ _ _ _ _ _ _ _ _ _ _ _ bank material
D 1 Slightly sandy silt grey None
D 2 Sandy silt, grey None
D 3 Sandy silt, grey None
D 4 Sandy silt, grey Unlikely
D 5 Sandy silt, grey None
D 6 Sandy silt , grey 7.0 None
D 7 Sandy silt, grey None
D 8 Slightly sandy silt grey 6. 3 None
D 9 Sand, grey None

3
Sample No:
D10
D l l
012
D13
014
015
016
Sediment Type Acidity ( p H )
6.9 Sandy silt , grey
Coarse sand, brown
Silty sand, dark brown 7. 2
Sand, grey
Sand, grey 6. 5
Sand, grey
Sandy silt , grey
Possibi l i ty of sample representing bank material
Slight
Good
Good
None
None
None
None
J i
J 2
J 3
J 4
J 5
J 6
J 7
J 8
J 9
J10
J l l
J12
J13
J14
Silty sand, grey
Sand, grey
Sand, grey
Sand, grey
Silty sand, grey
Sand, grey
Clay, grey
Sand, dark grey
Sandy silt , brown
Sandy silt , brown
Sand, dark brown
Silt, dark brown
Sandy silt , brown
Silt, brown
None
None
Slight
None
None
None
None
Slight
None
None
Slight
Slight
Slight
Good
r
DISCUSSION O F R E S U L T S
Distribution of Values :
The metal values determined during this survey were considerably
lower than those of the initial silt survey by M r . W. M . Sharp. The
difference may be attributed to seasonal variations in stream content.

r - H A l l samples
Non-organic" samples
W. SHARP, CONSULTANT
ASSOCIATED GEOLOGICAL SERVICES L TO
HISTOGRAMS
TELKWA SILT SURVEY
June 1969 D . Arscott

a £ o
o Z
SILVER DISTRIBUTION
o Z
13
12
1 1*
10¬
9¬
8
7+--
6
5
4
3¬
2¬
1-
2 3 4 5 6 7 8 9 1.0 1.1 1.2 1.3 1.4 1.5
Silver content , ppm
MOLYBDENUM DISTRIBUTION
1 2 3 4 5 6 7 8 9
Molybdenum content, ppm
i *> .—•* ! r - n
A l l samples
Non-organic" samples
W. SHARP, CONSULTANT
ASSOCIATED GEOLOGICAL SERVICES LTD.
HISTOGRAMS
TELKWA SILT SURVEY
June 1969 D. Arscott

4
Consistency of results for samples collected on the same creek were
excellent. F o r example, D4 and D5, which were 15 feet apart c a r r i e d
72 and 66 ppm Copper, 17 and 18 ppm lead, respectively.
To examine the distribution of values in detail, 4 histograms were
constructed, and despite the smal l total number of samples, it is felt
that their indications are val id . In each case two plots were made, one
for the total number of samples and one neglecting the eight dark samples
which have some organic content. The following facts are indicated:
1. Samples with organic content are somewhat higher
in metal content and should be viewed with a slightly
suspicious eye.
2. The histograms (non-organic) for si lver and molybdenum
have a normal distribution. No anomalous sources are
therefore indicated for these two metals.
3. The histograms (non-organic) for copper and lead
show two peaks each, indicative of two concentration
mechanisms for each element. Anomalous sources
for the secondary peaks seem l ikely . Any value above
12 parts per mi l l ion lead, and above 100 parts per mi l l ion copper
are considered anomalous. In addition, copper values
between 70 and 100 ppm are re ferred to as "moderately
anomalous. 1 1

5
A N O M A L I E S
The following creeks are placed in approximate order of importance:
Creek designation
Nature of metal content
Notes
M
Anomalous lead (17.18! 13 ppm) Moderately anomalous copper (72, 66, 72 ppm)
Anomalous copper (100, 105, 100 ppm) Anomalous lead (13, 14, 20 ppm)
Anomalous lead (14, 23, 26, 10 ppm) Moderately anomalous copper (71,92,60,70 ppm)
Moderately anomalous copper (81,70 ppm)
Anomalous copper (115, 110 ppm) Anomalous lead (19,25 ppm)
High copper anomaly indicated in previous survey by W. M . Sharp
No evidence in previous survey
May not be val id since some organic content in these samples
Not supported by previous survey
Copper values supported by previous survey, but some organic content in these samples
E
H , I
Anomalous lead (14 ppm) in one of 2 samples
Anomalous lead (15 ppm) in one of 4 samples
Strongly anomalous copper (115, 200 ppm)
Discounted since:* (a) samples have organic
content (b) not supported by
previous survey
A , D No anomalous values
G, K Not sampled Essential ly run off and seeps

CONCLUSIONS
Creeks B and M give good indications of anomalous copper and lead
sources upstream. Silver and molybdenum either do not occur in
the area in any quantity, or are not traceable with this exploration
method.
Cordia l ly submitted,
David Arscott
Vancouver, B . C .


BONDAR-CLEGG & COMPANY LTD. geologists • geocbemists • analysts
1500 PEMBERTON A V E N U E , NORTH VANCOUVER, B.C.
PHONE 988-5315
GEOCHEMICAL LAB REPORT N o : . . . . 2 9 . " 9 2
Associated Geological Services Extraction From
Atomic Absorption June 12 69
H N 0 3 -HC1
Method
Fraction Used. -80 mesh
Date
Analyst
19
D.M.
SAMPLE NO. Cu ppffl Pb
ppffl Ag ppm
Mo REMARKS
D 1 44 8 0.7 2 ND - NOT DETECTED 0 2 35 15 0.7 1 IS - INSUFFICIENT D 3 25 7 0.5 ND SAhPLE D 4 72 17 0.8 1 Project - Terrace D 5 66 18 0.9 1
D 6 10 8 0.6 ND D 7 10 8 0.7 1 D 8 23 9 0.7 1 D 9 22 7 0.6 1 D 10 70 5 0.6 ND D 11 115 13 1.2 1 D 12 200 7 1.3 2 D 13 100 13 1.0 2 D 14 105 14 1.0 1 D 15 100 20 1.0 2
D 16 72 13 0.7 2
J l 310 50 8 0.8 2
J2 340 49 8 0.4 1 J3 10 7 0.3 ND
J4 12 7 0.4 1 J5 10 10 0.7 ND J6 15 12 0.6 ND
J7 15 14 0.4 2
J8 81 9 0 .8 ND J9 115 19 1.2 1 J10 110 25 1.3 1 J l l 71 23 1.0 3
J12 92 26 1.1 3
J13 60 14 1.0 1 J14 70 10 0.9 8

T S A 8 8 A Y E R 8
CHEMISTS
GEOCHEMISTS
SAMPLE(S) F R O M
SAMPLE(S) O F
L 325 HOWE STREET - VANCOUVER 1, B.C.
T E L E P H O N E 6 8 8 - 3 5 0 4
C E R T I F I C A T E O F A N A L Y S I S
ASSOCIATED GEOLOGICAL SERVICES
ROCK Submitted on June 6, 1969
R E P O R T N O .
V-5924
Sample No.
DJ 1 DJ 2
Gold (Au)oz:ton
trace trace
S i l v e r ( A g)oz:ton
trace trace
Copper (Cu)%
trace trace
oz:ton - Troy ounces per 2,000 l b s .
SIGNED D A T E .Tnnp U ) , 1 9 6 9
P U L P A N D R E J E C T S D I S C A R D E D A F T E R 3 M O N T H S # D I V I S I O N O F T E C H N I C A L S E R V I C E L A B O R A T O R I E S