Embed Size (px)
Citation preview
U.S. Department of CommerceEconomics and Statistics Administration
U.S. CENSUS BUREAU
Field of Bachelor’s Degree in the United States: 2009American Community Survey Reports
By Julie Siebens and Camille L. Ryan
ACS-18
Issued February 2012
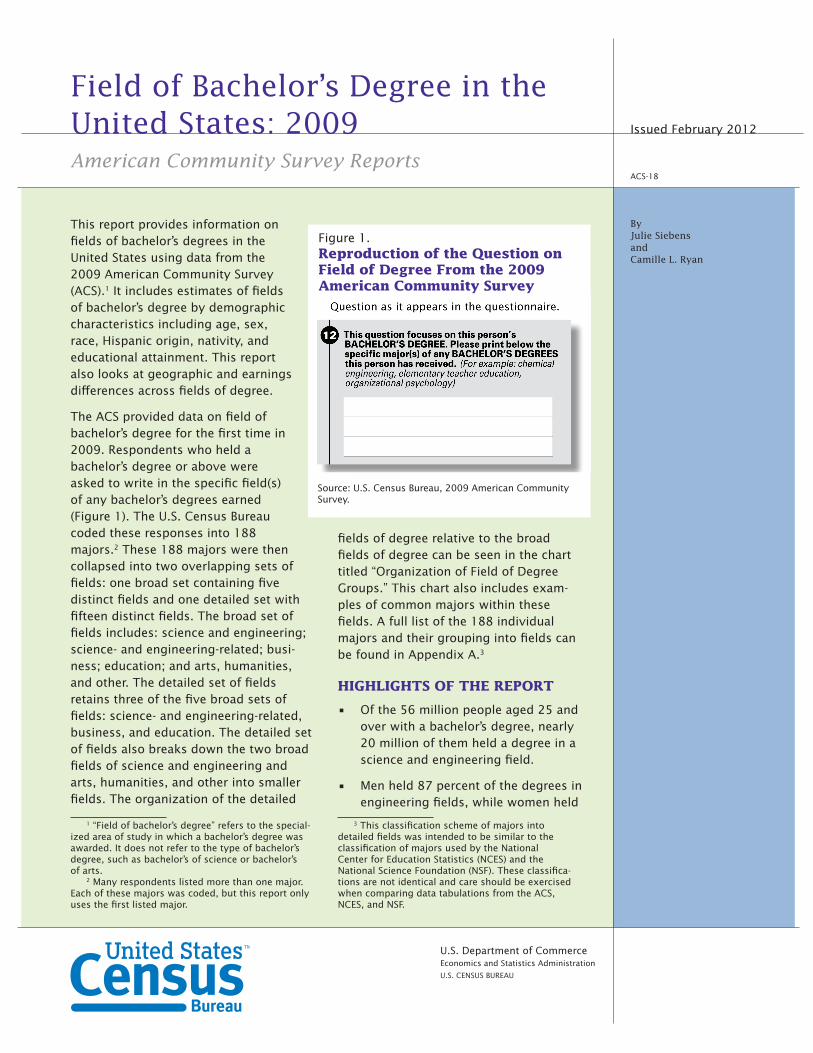
This report provides information on fields of bachelor’s degrees in the United States using data from the 2009 American Community Survey (ACS).1 It includes estimates of fields of bachelor’s degree by demographic characteristics including age, sex, race, Hispanic origin, nativity, and educational attainment. This report also looks at geographic and earnings differences across fields of degree.
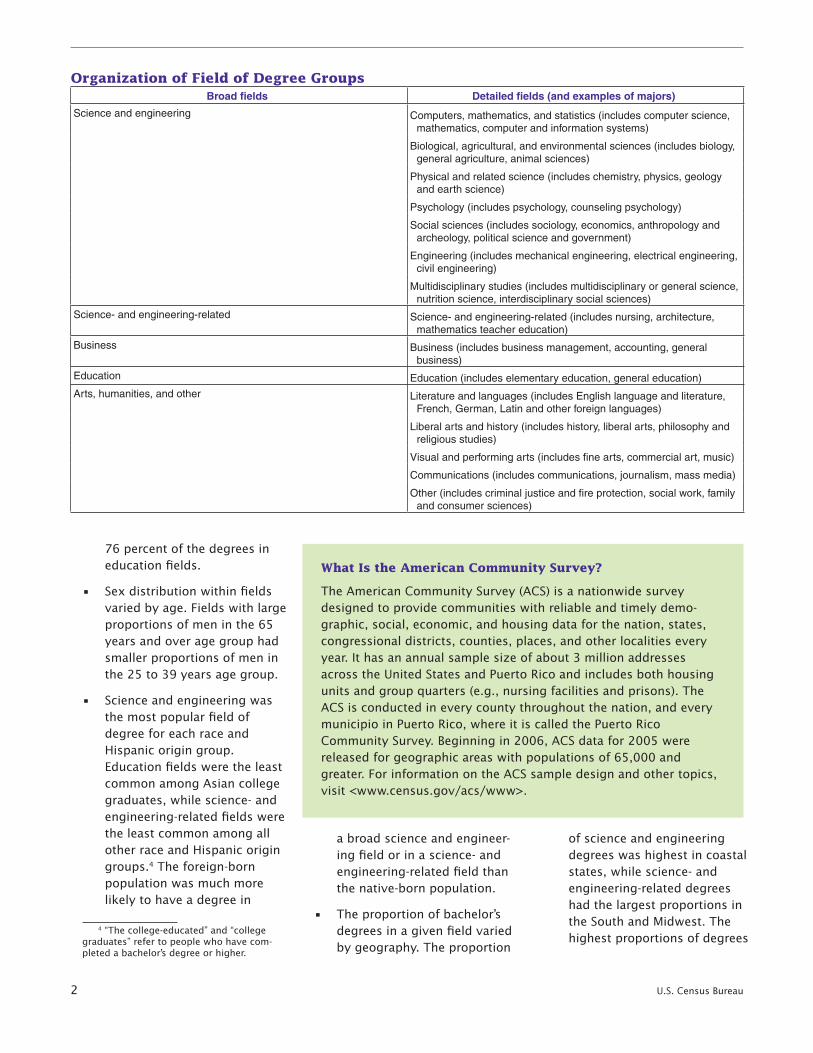
The ACS provided data on field of bachelor’s degree for the first time in 2009. Respondents who held a bachelor’s degree or above were asked to write in the specific field(s) of any bachelor’s degrees earned (Figure 1). The U.S. Census Bureau coded these responses into 188 majors.2 These 188 majors were then collapsed into two overlapping sets of fields: one broad set containing five distinct fields and one detailed set with fifteen distinct fields. The broad set of fields includes: science and engineering; science- and engineering-related; busi-ness; education; and arts, humanities, and other. The detailed set of fields retains three of the five broad sets of fields: science- and engineering-related, business, and education. The detailed set of fields also breaks down the two broad fields of science and engineering and arts, humanities, and other into smaller fields. The organization of the detailed
1 “Field of bachelor’s degree” refers to the special-ized area of study in which a bachelor’s degree was awarded. It does not refer to the type of bachelor’s degree, such as bachelor’s of science or bachelor’s of arts.
2 Many respondents listed more than one major. Each of these majors was coded, but this report only uses the first listed major.
fields of degree relative to the broad fields of degree can be seen in the chart titled “Organization of Field of Degree Groups.” This chart also includes exam-ples of common majors within these fields. A full list of the 188 individual majors and their grouping into fields can be found in Appendix A.3
HIGHLIGHTS OF THE REPORT
• Ofthe56millionpeopleaged25andover with a bachelor’s degree, nearly 20 million of them held a degree in a science and engineering field.
• Menheld87percentofthedegreesinengineering fields, while women held
3 This classification scheme of majors into detailed fields was intended to be similar to the classification of majors used by the National Center for Education Statistics (NCES) and the National Science Foundation (NSF). These classifica-tions are not identical and care should be exercised when comparing data tabulations from the ACS, NCES, and NSF.
Figure 1.Reproduction of the Question on Field of Degree From the 2009 American Community Survey
Source: U.S. Census Bureau, 2009 American Community Survey.
2 U.S. Census Bureau
76percentofthedegreesineducation fields.
• Sexdistributionwithinfieldsvaried by age. Fields with large proportionsofmeninthe65years and over age group had smaller proportions of men in the25to39yearsagegroup.
• Scienceandengineeringwasthe most popular field of degree for each race and Hispanic origin group. Education fields were the least common among Asian college graduates, while science- and engineering-related fields were the least common among all other race and Hispanic origin groups.4 The foreign-born population was much more likely to have a degree in
4 “The college-educated” and “college graduates” refer to people who have com-pleted a bachelor’s degree or higher.
a broad science and engineer-ing field or in a science- and engineering-related field than the native-born population.
• Theproportionofbachelor’sdegrees in a given field varied by geography. The proportion
of science and engineering degrees was highest in coastal states, while science- and engineering-related degrees had the largest proportions in the South and Midwest. The highest proportions of degrees
What Is the American Community Survey?
The American Community Survey (ACS) is a nationwide survey designed to provide communities with reliable and timely demo-graphic, social, economic, and housing data for the nation, states, congressional districts, counties, places, and other localities every year. It has an annual sample size of about 3 million addresses across the United States and Puerto Rico and includes both housing units and group quarters (e.g., nursing facilities and prisons). The ACS is conducted in every county throughout the nation, and every municipio in Puerto Rico, where it is called the Puerto Rico CommunitySurvey.Beginningin2006,ACSdatafor2005werereleasedforgeographicareaswithpopulationsof65,000andgreater. For information on the ACS sample design and other topics, visit <www.census.gov/acs/www>.
Organization of Field of Degree Groups Broad fields Detailed fields (and examples of majors)
Science and engineering
Computers, mathematics, and statistics (includes computer science, mathematics, computer and information systems)
Biological, agricultural, and environmental sciences (includes biology, general agriculture, animal sciences)
Physical and related science (includes chemistry, physics, geology and earth science)
Psychology (includes psychology, counseling psychology)
Social sciences (includes sociology, economics, anthropology and archeology, political science and government)
Engineering (includes mechanical engineering, electrical engineering, civil engineering)
Multidisciplinary studies (includes multidisciplinary or general science, nutrition science, interdisciplinary social sciences)
Science- and engineering-related Science- and engineering-related (includes nursing, architecture, mathematics teacher education)
Business Business (includes business management, accounting, general business)
Education Education (includes elementary education, general education)
Arts, humanities, and other
Literature and languages (includes English language and literature, French, German, Latin and other foreign languages)
Liberal arts and history (includes history, liberal arts, philosophy and religious studies)
Visual and performing arts (includes fine arts, commercial art, music)
Communications (includes communications, journalism, mass media)
Other (includes criminal justice and fire protection, social work, family and consumer sciences)
U.S. Census Bureau 3
in business were in the South, while education degrees were the most common in the Midwest. People in the New England states had the highest proportion of degrees in the arts, humanities, and other fields.
• Peoplewithanundergradu-ate degree in a physical and related sciences field were the most likely to hold an advanced degree. People with an under-graduate degree in a commu-nications field were the least likely to do so.
• Degreesinthefieldofscienceand engineering were associ-ated with the highest median earnings; degrees in an educa-tion field were associated with the lowest median earnings.
FIELD OF DEGREE BY DEMOGRAPHIC CHARACTERISTICS
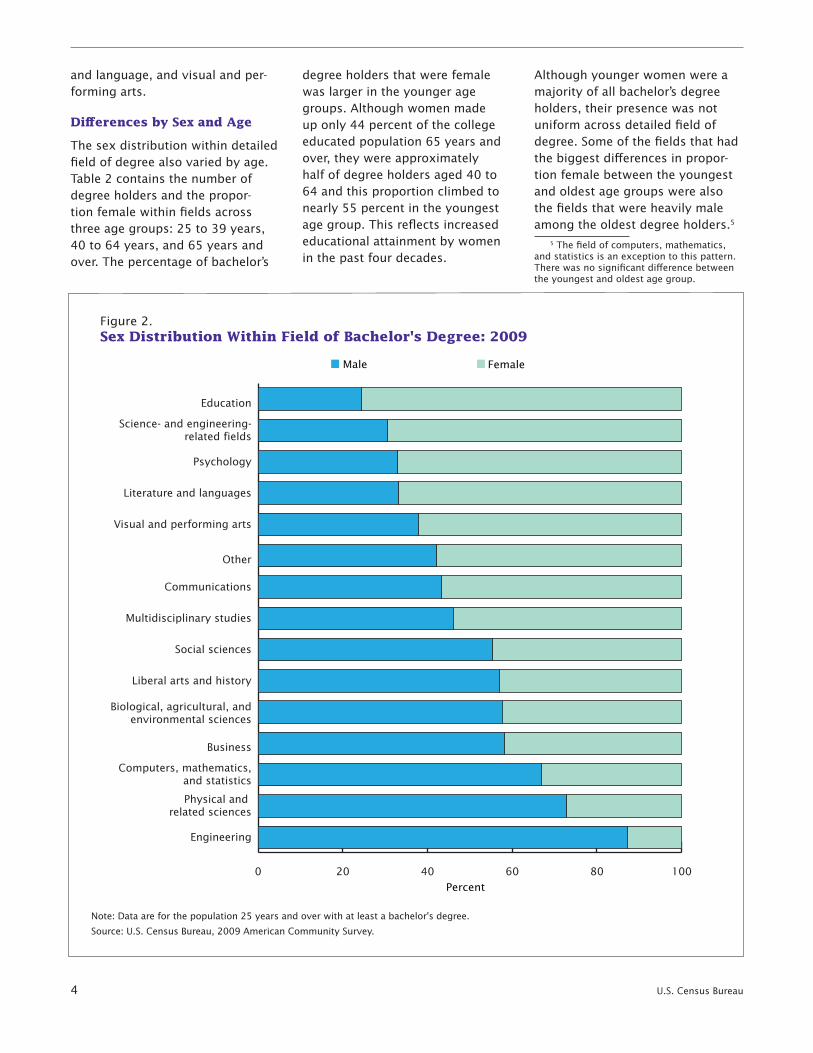
Fifty-six million people held bach-elor’s degrees in 2009 (Table 1). Nearly 20 million of these degrees were in the broad field of science and engineering. Most of these science and engineering degrees were in the detailed fields of social sciences (4 million); engineering (4 million); and biological, agricul-tural, and environmental sciences (3 million). Over 1 million people held a degree in multidisciplinary studies, making it the least com-mon detailed field among the sci-ence and engineering fields. Over 1in5college-educatedadults,or11 million people, held a bachelor’s degree in business. This total is larger than the number of people with education degrees (8 million), but smaller than the number of people with a degree in the arts, humanities, and other fields (13 million).
Sex Distribution Within Field of Degree
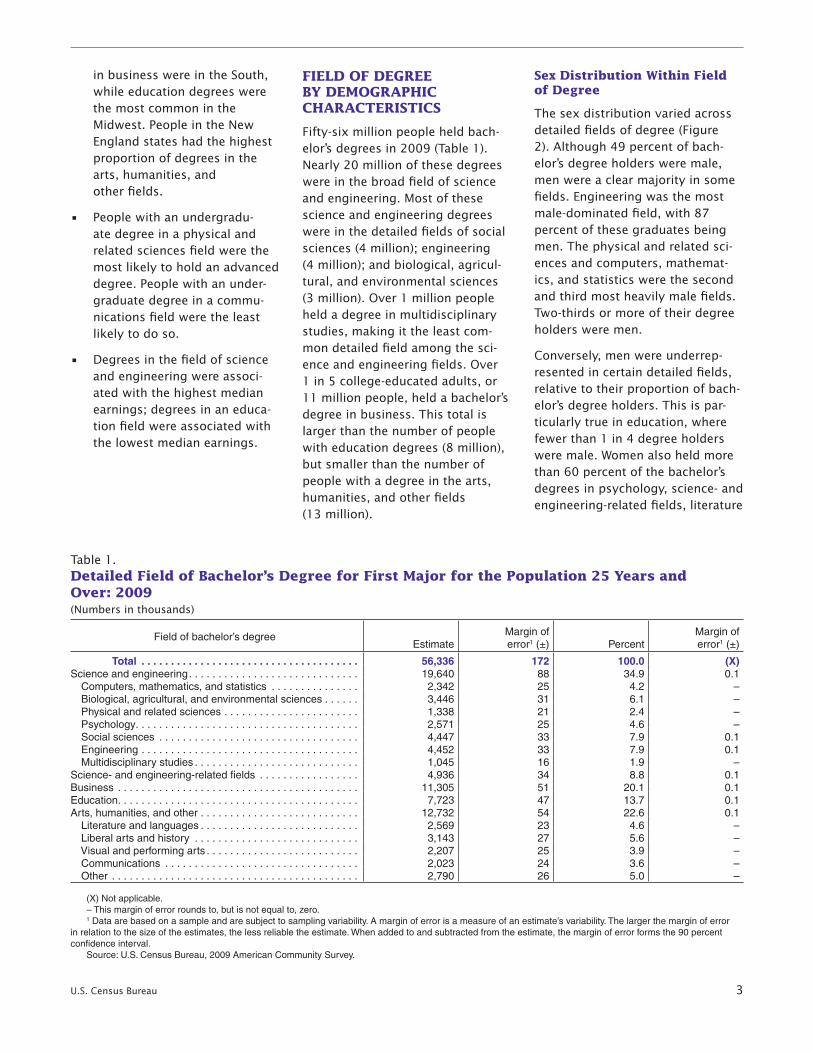
The sex distribution varied across detailed fields of degree (Figure 2). Although 49 percent of bach-elor’s degree holders were male, men were a clear majority in some fields. Engineering was the most male-dominatedfield,with87percent of these graduates being men. The physical and related sci-ences and computers, mathemat-ics, and statistics were the second and third most heavily male fields. Two-thirds or more of their degree holders were men.
Conversely, men were underrep-resented in certain detailed fields, relative to their proportion of bach-elor’s degree holders. This is par-ticularly true in education, where fewer than 1 in 4 degree holders were male. Women also held more than60percentofthebachelor’sdegrees in psychology, science- and engineering-related fields, literature
Table 1.Detailed Field of Bachelor’s Degree for First Major for the Population 25 Years and Over: 2009(Numbers in thousands)
Field of bachelor’s degreeEstimate
Margin of error1 (±) Percent
Margin of error1 (±)
Total . . . . . . . . . . . . . . . . . . . . . . . . . . . . . . . . . . . . . 56,336 172 100 .0 (X)Science and engineering . . . . . . . . . . . . . . . . . . . . . . . . . . . . . 19,640 88 34 .9 0 .1 Computers, mathematics, and statistics . . . . . . . . . . . . . . . 2,342 25 4 .2 – Biological, agricultural, and environmental sciences . . . . . . 3,446 31 6 .1 – Physical and related sciences . . . . . . . . . . . . . . . . . . . . . . . 1,338 21 2 .4 – Psychology . . . . . . . . . . . . . . . . . . . . . . . . . . . . . . . . . . . . . . 2,571 25 4 .6 – Social sciences . . . . . . . . . . . . . . . . . . . . . . . . . . . . . . . . . . 4,447 33 7 .9 0 .1 Engineering . . . . . . . . . . . . . . . . . . . . . . . . . . . . . . . . . . . . . 4,452 33 7 .9 0 .1 Multidisciplinary studies . . . . . . . . . . . . . . . . . . . . . . . . . . . . 1,045 16 1 .9 – Science- and engineering-related fields . . . . . . . . . . . . . . . . . 4,936 34 8 .8 0 .1Business . . . . . . . . . . . . . . . . . . . . . . . . . . . . . . . . . . . . . . . . . 11,305 51 20 .1 0 .1Education . . . . . . . . . . . . . . . . . . . . . . . . . . . . . . . . . . . . . . . . . 7,723 47 13 .7 0 .1Arts, humanities, and other . . . . . . . . . . . . . . . . . . . . . . . . . . . 12,732 54 22 .6 0 .1 Literature and languages . . . . . . . . . . . . . . . . . . . . . . . . . . . 2,569 23 4 .6 – Liberal arts and history . . . . . . . . . . . . . . . . . . . . . . . . . . . . 3,143 27 5 .6 – Visual and performing arts . . . . . . . . . . . . . . . . . . . . . . . . . . 2,207 25 3 .9 – Communications . . . . . . . . . . . . . . . . . . . . . . . . . . . . . . . . . 2,023 24 3 .6 – Other . . . . . . . . . . . . . . . . . . . . . . . . . . . . . . . . . . . . . . . . . . 2,790 26 5 .0 –
(X) Not applicable . – This margin of error rounds to, but is not equal to, zero .1 Data are based on a sample and are subject to sampling variability . A margin of error is a measure of an estimate’s variability . The larger the margin of error
in relation to the size of the estimates, the less reliable the estimate . When added to and subtracted from the estimate, the margin of error forms the 90 percent confidence interval .
Source: U .S . Census Bureau, 2009 American Community Survey .
4 U.S. Census Bureau
and language, and visual and per-forming arts.
Differences by Sex and Age
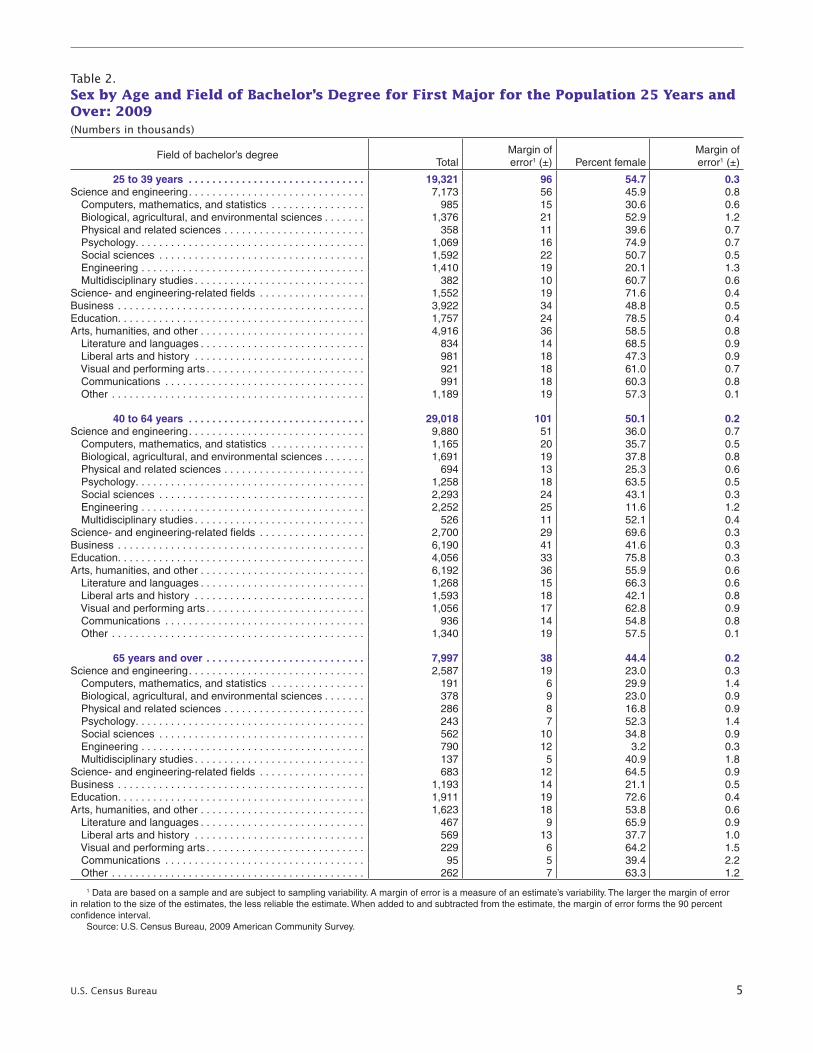
The sex distribution within detailed field of degree also varied by age. Table 2 contains the number of degree holders and the propor-tion female within fields across threeagegroups:25to39years,40to64years,and65yearsandover. The percentage of bachelor’s
degree holders that were female was larger in the younger age groups. Although women made up only 44 percent of the college educatedpopulation65yearsandover, they were approximately half of degree holders aged 40 to 64andthisproportionclimbedtonearly55percentintheyoungestage group. This reflects increased educational attainment by women in the past four decades.
Although younger women were a majority of all bachelor’s degree holders, their presence was not uniform across detailed field of degree. Some of the fields that had the biggest differences in propor-tion female between the youngest and oldest age groups were also the fields that were heavily male among the oldest degree holders.5
5 The field of computers, mathematics, and statistics is an exception to this pattern. There was no significant difference between the youngest and oldest age group.
Note: Data are for the population 25 years and over with at least a bachelor's degree.
Source: U.S. Census Bureau, 2009 American Community Survey.
Female
Figure 2. Sex Distribution Within Field of Bachelor's Degree: 2009
Percent0 20 40 60 80 100
Engineering
Physical and related sciences
Computers, mathematics, and statistics
Business
Biological, agricultural, and environmental sciences
Liberal arts and history
Social sciences
Multidisciplinary studies
Communications
Other
Visual and performing arts
Literature and languages
Psychology
Science- and engineering- related fields
Education
Male
U.S. Census Bureau 5
Table 2.Sex by Age and Field of Bachelor’s Degree for First Major for the Population 25 Years and Over: 2009 (Numbers in thousands)
Field of bachelor’s degreeTotal
Margin of error1 (±) Percent female
Margin of error1 (±)
25 to 39 years . . . . . . . . . . . . . . . . . . . . . . . . . . . . . . 19,321 96 54 .7 0 .3Science and engineering . . . . . . . . . . . . . . . . . . . . . . . . . . . . . . 7,173 56 45 .9 0 .8 Computers, mathematics, and statistics . . . . . . . . . . . . . . . . 985 15 30 .6 0 .6 Biological, agricultural, and environmental sciences . . . . . . . 1,376 21 52 .9 1 .2 Physical and related sciences . . . . . . . . . . . . . . . . . . . . . . . . 358 11 39 .6 0 .7 Psychology . . . . . . . . . . . . . . . . . . . . . . . . . . . . . . . . . . . . . . . 1,069 16 74 .9 0 .7 Social sciences . . . . . . . . . . . . . . . . . . . . . . . . . . . . . . . . . . . 1,592 22 50 .7 0 .5 Engineering . . . . . . . . . . . . . . . . . . . . . . . . . . . . . . . . . . . . . . 1,410 19 20 .1 1 .3 Multidisciplinary studies . . . . . . . . . . . . . . . . . . . . . . . . . . . . . 382 10 60 .7 0 .6Science- and engineering-related fields . . . . . . . . . . . . . . . . . . 1,552 19 71 .6 0 .4Business . . . . . . . . . . . . . . . . . . . . . . . . . . . . . . . . . . . . . . . . . . 3,922 34 48 .8 0 .5Education . . . . . . . . . . . . . . . . . . . . . . . . . . . . . . . . . . . . . . . . . . 1,757 24 78 .5 0 .4Arts, humanities, and other . . . . . . . . . . . . . . . . . . . . . . . . . . . . 4,916 36 58 .5 0 .8 Literature and languages . . . . . . . . . . . . . . . . . . . . . . . . . . . . 834 14 68 .5 0 .9 Liberal arts and history . . . . . . . . . . . . . . . . . . . . . . . . . . . . . 981 18 47 .3 0 .9 Visual and performing arts . . . . . . . . . . . . . . . . . . . . . . . . . . . 921 18 61 .0 0 .7 Communications . . . . . . . . . . . . . . . . . . . . . . . . . . . . . . . . . . 991 18 60 .3 0 .8 Other . . . . . . . . . . . . . . . . . . . . . . . . . . . . . . . . . . . . . . . . . . . 1,189 19 57 .3 0 .1
40 to 64 years . . . . . . . . . . . . . . . . . . . . . . . . . . . . . . 29,018 101 50 .1 0 .2Science and engineering . . . . . . . . . . . . . . . . . . . . . . . . . . . . . . 9,880 51 36 .0 0 .7 Computers, mathematics, and statistics . . . . . . . . . . . . . . . . 1,165 20 35 .7 0 .5 Biological, agricultural, and environmental sciences . . . . . . . 1,691 19 37 .8 0 .8 Physical and related sciences . . . . . . . . . . . . . . . . . . . . . . . . 694 13 25 .3 0 .6 Psychology . . . . . . . . . . . . . . . . . . . . . . . . . . . . . . . . . . . . . . . 1,258 18 63 .5 0 .5 Social sciences . . . . . . . . . . . . . . . . . . . . . . . . . . . . . . . . . . . 2,293 24 43 .1 0 .3 Engineering . . . . . . . . . . . . . . . . . . . . . . . . . . . . . . . . . . . . . . 2,252 25 11 .6 1 .2 Multidisciplinary studies . . . . . . . . . . . . . . . . . . . . . . . . . . . . . 526 11 52 .1 0 .4Science- and engineering-related fields . . . . . . . . . . . . . . . . . . 2,700 29 69 .6 0 .3Business . . . . . . . . . . . . . . . . . . . . . . . . . . . . . . . . . . . . . . . . . . 6,190 41 41 .6 0 .3Education . . . . . . . . . . . . . . . . . . . . . . . . . . . . . . . . . . . . . . . . . . 4,056 33 75 .8 0 .3Arts, humanities, and other . . . . . . . . . . . . . . . . . . . . . . . . . . . . 6,192 36 55 .9 0 .6 Literature and languages . . . . . . . . . . . . . . . . . . . . . . . . . . . . 1,268 15 66 .3 0 .6 Liberal arts and history . . . . . . . . . . . . . . . . . . . . . . . . . . . . . 1,593 18 42 .1 0 .8 Visual and performing arts . . . . . . . . . . . . . . . . . . . . . . . . . . . 1,056 17 62 .8 0 .9 Communications . . . . . . . . . . . . . . . . . . . . . . . . . . . . . . . . . . 936 14 54 .8 0 .8 Other . . . . . . . . . . . . . . . . . . . . . . . . . . . . . . . . . . . . . . . . . . . 1,340 19 57 .5 0 .1
65 years and over . . . . . . . . . . . . . . . . . . . . . . . . . . . 7,997 38 44 .4 0 .2Science and engineering . . . . . . . . . . . . . . . . . . . . . . . . . . . . . . 2,587 19 23 .0 0 .3 Computers, mathematics, and statistics . . . . . . . . . . . . . . . . 191 6 29 .9 1 .4 Biological, agricultural, and environmental sciences . . . . . . . 378 9 23 .0 0 .9 Physical and related sciences . . . . . . . . . . . . . . . . . . . . . . . . 286 8 16 .8 0 .9 Psychology . . . . . . . . . . . . . . . . . . . . . . . . . . . . . . . . . . . . . . . 243 7 52 .3 1 .4 Social sciences . . . . . . . . . . . . . . . . . . . . . . . . . . . . . . . . . . . 562 10 34 .8 0 .9 Engineering . . . . . . . . . . . . . . . . . . . . . . . . . . . . . . . . . . . . . . 790 12 3 .2 0 .3 Multidisciplinary studies . . . . . . . . . . . . . . . . . . . . . . . . . . . . . 137 5 40 .9 1 .8Science- and engineering-related fields . . . . . . . . . . . . . . . . . . 683 12 64 .5 0 .9Business . . . . . . . . . . . . . . . . . . . . . . . . . . . . . . . . . . . . . . . . . . 1,193 14 21 .1 0 .5Education . . . . . . . . . . . . . . . . . . . . . . . . . . . . . . . . . . . . . . . . . . 1,911 19 72 .6 0 .4Arts, humanities, and other . . . . . . . . . . . . . . . . . . . . . . . . . . . . 1,623 18 53 .8 0 .6 Literature and languages . . . . . . . . . . . . . . . . . . . . . . . . . . . . 467 9 65 .9 0 .9 Liberal arts and history . . . . . . . . . . . . . . . . . . . . . . . . . . . . . 569 13 37 .7 1 .0 Visual and performing arts . . . . . . . . . . . . . . . . . . . . . . . . . . . 229 6 64 .2 1 .5 Communications . . . . . . . . . . . . . . . . . . . . . . . . . . . . . . . . . . 95 5 39 .4 2 .2 Other . . . . . . . . . . . . . . . . . . . . . . . . . . . . . . . . . . . . . . . . . . . 262 7 63 .3 1 .2
1 Data are based on a sample and are subject to sampling variability . A margin of error is a measure of an estimate’s variability . The larger the margin of error in relation to the size of the estimates, the less reliable the estimate . When added to and subtracted from the estimate, the margin of error forms the 90 percent confidence interval .
Source: U .S . Census Bureau, 2009 American Community Survey .
6 U.S. Census Bureau
The four detailed fields of biologi-cal, agricultural, and environmen-tal sciences; physical and related sciences; engineering; and busi-ness had the lowest percentages of womeninthe65yearsandolderagegroup.Inthe25to39yearsage group, these same fields also had percentages female that were more than double the percentages femaleinthe65yearsandover age group.
The engineering field had the largest relative percent change across age groups.6 In this field, the percentage female in the youngest group was about six times larger than the percentage female in the oldest group. The fields of multidis-ciplinary studies and communica-tions were majority male among the65yearsandoveragegroup(bothapproximately60percentmale), but these sex distributions werereversedinthe25to39yearsage group (both fields approxi-mately60percentfemale).Fieldsthatwereheavilyfemaleinthe65years and over age group were also heavily female in the younger age groups, although two of these fields (visual and performing arts and other) had a smaller percent-ageofwomeninthe25to39yearsagegroupcomparedtothe65years and older age group.7
The proportion female within the two broad fields of science and engineering and arts, humani-ties, and other varied both across age groups and across detailed fields within the broad fields. The percentage female in the broad field of science and engineering
6 “Relative percent change” refers to the difference in percent female within fields across age groups.
7 The percent female in the visual and performingartsfieldforthe40to64yearsage group was not significantly different from thepercentfemalein65yearsandolderagegroup. The percent female in the other field forthe25to39yearsagegroupwasnotsignificantly different from the percent female inthe40to64yearsagegroup.
was23percentinthe65yearsand older age group but nearly 50percentinthe25to39yearsage group. Although the percent-age female in the detailed field of biological, agricultural, and envi-ronmental sciences differed by 30 percent between the youngest and oldest age groups, the detailed field of computers, mathematics, and statistics changed by only 1 percent across the same age groups.8 Within the broad field of arts, humanities, and other, the proportion of women differed by only5percentacrosstheyoung-est and oldest age groups. The biggest change was in the detailed field of biological, agricultural, and environmental sciences, where 23 percentofdegreeholders65yearsand over were female, but this percentagewas53inthe25to39years age group.
Race and Hispanic Origin
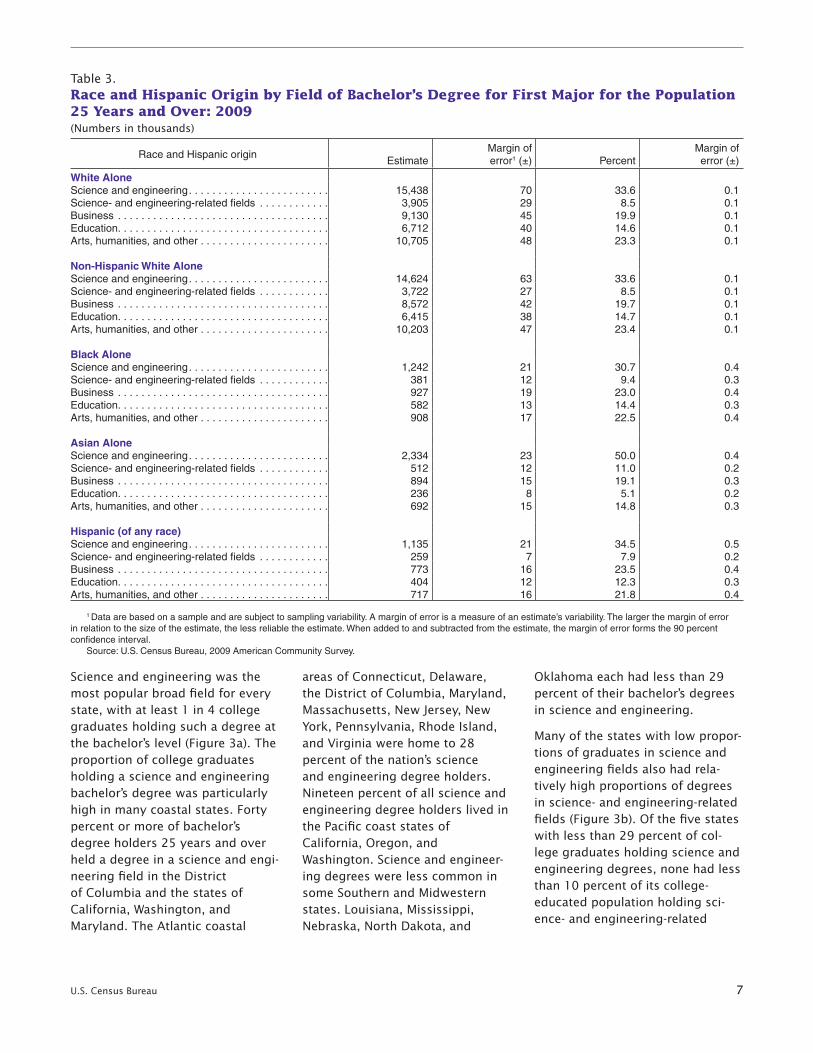
The distribution of broad fields of degree varied by race and Hispanic origin groups (Table 3). Science and engineering was the most common field in each group, ranging from 31 percent of bach-elor’s degrees among Blacks to 50percentamongAsians.Arts,humanities, and others was the second most common field among Whites and non-Hispanic Whites. Business was the second most common field for Asians and Hispanics. Among Blacks, business and arts, humanities, and other were the second and third most common fields, although the differ-ence between these two fields was not statistically significant. Science- and engineering-related fields were the least common among Whites and non-Hispanic Whites, Blacks, andHispanics.Only5percentofAsians held a degree in education,
8 The difference between these two age groups in the computers, mathematics, and statistics was not significant.
making it the least common field for that group.
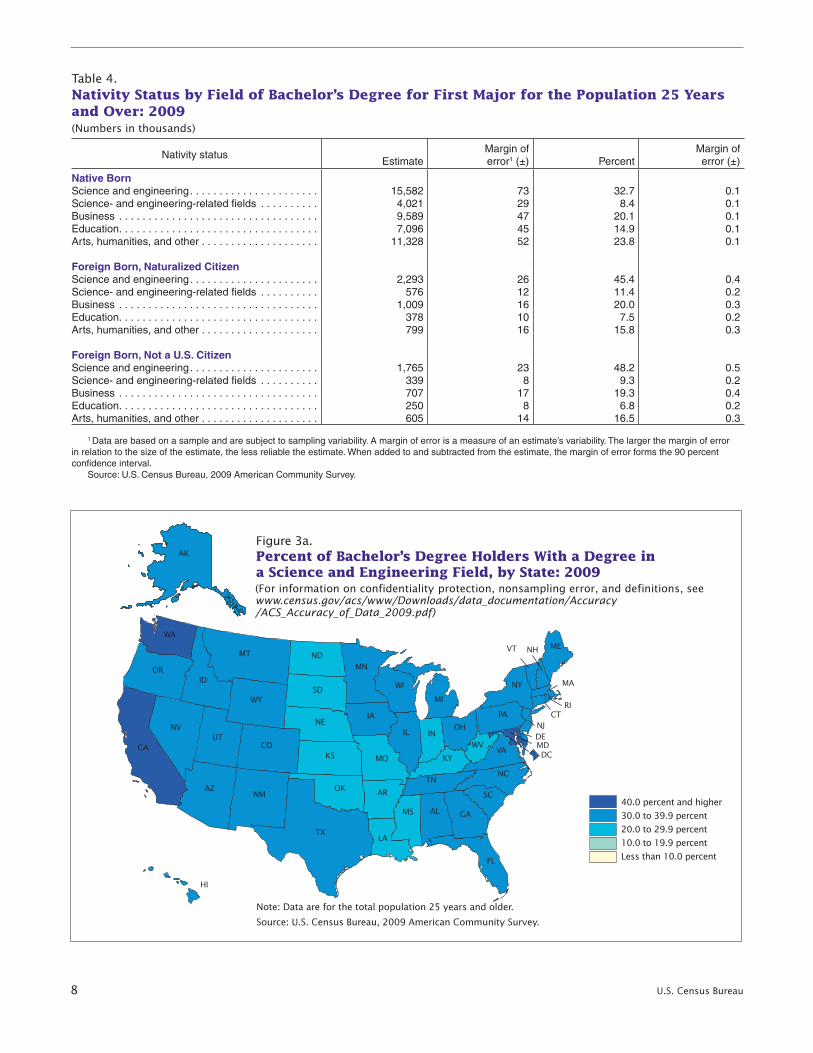
Nativity
Table 4 shows the frequency and percentage of broad fields of bach-elor’s degree within nativity groups. Although degrees in the science and engineering field were com-mon across all groups, the foreign born (both citizen and noncitizen) were much more likely to hold a degree in a science and engineering field or a science- and engineering-related field than the native-born population. The college-educated native born were about twice as likely as foreign-born, naturalized citizens and more than twice as likely as foreign-born noncitizens to have a degree in an education field. Degrees in business fields were more evenly distributed: 20 percent or more of the college-educated native-born and foreign-born, naturalized citizen population held such a degree, while only a smaller proportion (19 percent) of the foreign-born noncitizen did. Degrees from the arts, humanities, and others field were held by over 23 percent of the native-born popu-lation,comparedtoaround16per-cent of both foreign-born citizens and foreign-born noncitizens.
GEOGRAPHY AND FIELD OF DEGREE
State-Level Differences in Field of Degree
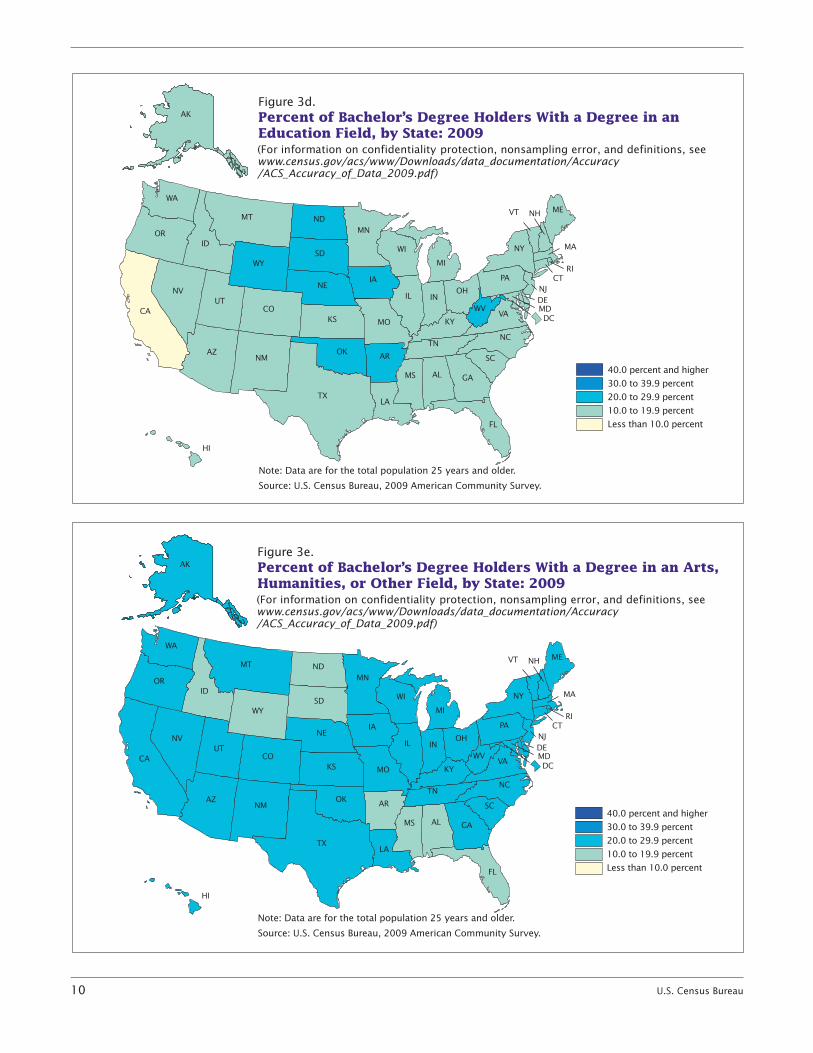
Figures 3a through 3e show the distribution of the five broad fields of degree for each state and the District of Columbia.9 The values represent the proportion of the college-educatedpopulation25years and over with a bachelor’s degree in a given field.
9 “State” and “metropolitan area” refer to the current residence of the respondent, not the location of the respondent’s undergradu-ate education.
U.S. Census Bureau 7
Science and engineering was the most popular broad field for every state, with at least 1 in 4 college graduates holding such a degree at the bachelor’s level (Figure 3a). The proportion of college graduates holding a science and engineering bachelor’s degree was particularly high in many coastal states. Forty percent or more of bachelor’s degreeholders25yearsandoverheld a degree in a science and engi-neering field in the District of Columbia and the states of California, Washington, and Maryland. The Atlantic coastal
areas of Connecticut, Delaware, the District of Columbia, Maryland, Massachusetts, New Jersey, New York, Pennsylvania, Rhode Island, and Virginia were home to 28 percent of the nation’s science and engineering degree holders. Nineteen percent of all science and engineering degree holders lived in the Pacific coast states of California, Oregon, and Washington. Science and engineer-ing degrees were less common in some Southern and Midwestern states. Louisiana, Mississippi, Nebraska, North Dakota, and
Oklahoma each had less than 29 percent of their bachelor’s degrees in science and engineering.
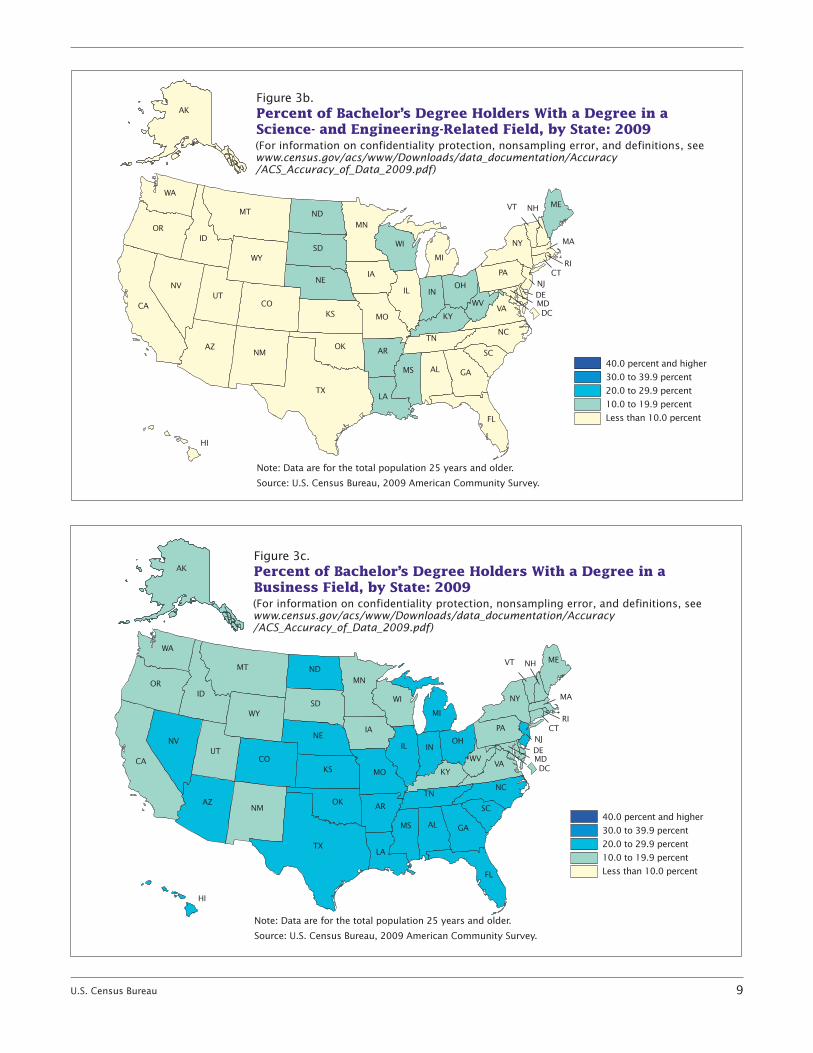
Many of the states with low propor-tions of graduates in science and engineering fields also had rela-tively high proportions of degrees in science- and engineering-related fields (Figure 3b). Of the five states with less than 29 percent of col-lege graduates holding science and engineering degrees, none had less than 10 percent of its college- educated population holding sci-ence- and engineering-related
Table 3. Race and Hispanic Origin by Field of Bachelor’s Degree for First Major for the Population 25 Years and Over: 2009(Numbers in thousands)
Race and Hispanic originEstimate
Margin of error1 (±) Percent
Margin of error (±)
White AloneScience and engineering . . . . . . . . . . . . . . . . . . . . . . . . 15,438 70 33 .6 0 .1Science- and engineering-related fields . . . . . . . . . . . . 3,905 29 8 .5 0 .1Business . . . . . . . . . . . . . . . . . . . . . . . . . . . . . . . . . . . . 9,130 45 19 .9 0 .1Education . . . . . . . . . . . . . . . . . . . . . . . . . . . . . . . . . . . . 6,712 40 14 .6 0 .1Arts, humanities, and other . . . . . . . . . . . . . . . . . . . . . . 10,705 48 23 .3 0 .1
Non-Hispanic White AloneScience and engineering . . . . . . . . . . . . . . . . . . . . . . . . 14,624 63 33 .6 0 .1Science- and engineering-related fields . . . . . . . . . . . . 3,722 27 8 .5 0 .1Business . . . . . . . . . . . . . . . . . . . . . . . . . . . . . . . . . . . . 8,572 42 19 .7 0 .1Education . . . . . . . . . . . . . . . . . . . . . . . . . . . . . . . . . . . . 6,415 38 14 .7 0 .1Arts, humanities, and other . . . . . . . . . . . . . . . . . . . . . . 10,203 47 23 .4 0 .1
Black AloneScience and engineering . . . . . . . . . . . . . . . . . . . . . . . . 1,242 21 30 .7 0 .4Science- and engineering-related fields . . . . . . . . . . . . 381 12 9 .4 0 .3Business . . . . . . . . . . . . . . . . . . . . . . . . . . . . . . . . . . . . 927 19 23 .0 0 .4Education . . . . . . . . . . . . . . . . . . . . . . . . . . . . . . . . . . . . 582 13 14 .4 0 .3Arts, humanities, and other . . . . . . . . . . . . . . . . . . . . . . 908 17 22 .5 0 .4
Asian AloneScience and engineering . . . . . . . . . . . . . . . . . . . . . . . . 2,334 23 50 .0 0 .4Science- and engineering-related fields . . . . . . . . . . . . 512 12 11 .0 0 .2Business . . . . . . . . . . . . . . . . . . . . . . . . . . . . . . . . . . . . 894 15 19 .1 0 .3Education . . . . . . . . . . . . . . . . . . . . . . . . . . . . . . . . . . . . 236 8 5 .1 0 .2Arts, humanities, and other . . . . . . . . . . . . . . . . . . . . . . 692 15 14 .8 0 .3
Hispanic (of any race)Science and engineering . . . . . . . . . . . . . . . . . . . . . . . . 1,135 21 34 .5 0 .5Science- and engineering-related fields . . . . . . . . . . . . 259 7 7 .9 0 .2Business . . . . . . . . . . . . . . . . . . . . . . . . . . . . . . . . . . . . 773 16 23 .5 0 .4Education . . . . . . . . . . . . . . . . . . . . . . . . . . . . . . . . . . . . 404 12 12 .3 0 .3Arts, humanities, and other . . . . . . . . . . . . . . . . . . . . . . 717 16 21 .8 0 .4
1 Data are based on a sample and are subject to sampling variability . A margin of error is a measure of an estimate’s variability . The larger the margin of error in relation to the size of the estimate, the less reliable the estimate . When added to and subtracted from the estimate, the margin of error forms the 90 percent confidence interval .
Source: U .S . Census Bureau, 2009 American Community Survey .
8 U.S. Census Bureau
MT
AK
NM
OR MN
KS
SD
ND
MO
WA
FL
IL IN
WI NY
PA
MI
OHIA
ME
MA
CT
AZ
HI
NV
TX
COCA
WY
UT
ID
NE
OK
GA
AR
AL
NC
MS
LA
TN
KYVA
SC
WV
RI
DE MD DC
NJ
Figure 3a.Percent of Bachelor’s Degree Holders With a Degree in a Science and Engineering Field, by State: 2009
VT NH
40.0 percent and higher
30.0 to 39.9 percent
20.0 to 29.9 percent
10.0 to 19.9 percent
Less than 10.0 percent
(For information on confidentiality protection, nonsampling error, and definitions, see www.census.gov/acs/www/Downloads/data_documentation/Accuracy/ACS_Accuracy_of_Data_2009.pdf)
Note: Data are for the total population 25 years and older.
Source: U.S. Census Bureau, 2009 American Community Survey.
Table 4. Nativity Status by Field of Bachelor’s Degree for First Major for the Population 25 Years and Over: 2009(Numbers in thousands)
Nativity statusEstimate
Margin of error1 (±) Percent
Margin of error (±)
Native BornScience and engineering . . . . . . . . . . . . . . . . . . . . . . 15,582 73 32 .7 0 .1Science- and engineering-related fields . . . . . . . . . . 4,021 29 8 .4 0 .1Business . . . . . . . . . . . . . . . . . . . . . . . . . . . . . . . . . . 9,589 47 20 .1 0 .1Education . . . . . . . . . . . . . . . . . . . . . . . . . . . . . . . . . . 7,096 45 14 .9 0 .1Arts, humanities, and other . . . . . . . . . . . . . . . . . . . . 11,328 52 23 .8 0 .1
Foreign Born, Naturalized CitizenScience and engineering . . . . . . . . . . . . . . . . . . . . . . 2,293 26 45 .4 0 .4Science- and engineering-related fields . . . . . . . . . . 576 12 11 .4 0 .2Business . . . . . . . . . . . . . . . . . . . . . . . . . . . . . . . . . . 1,009 16 20 .0 0 .3Education . . . . . . . . . . . . . . . . . . . . . . . . . . . . . . . . . . 378 10 7 .5 0 .2Arts, humanities, and other . . . . . . . . . . . . . . . . . . . . 799 16 15 .8 0 .3
Foreign Born, Not a U .S . CitizenScience and engineering . . . . . . . . . . . . . . . . . . . . . . 1,765 23 48 .2 0 .5Science- and engineering-related fields . . . . . . . . . . 339 8 9 .3 0 .2Business . . . . . . . . . . . . . . . . . . . . . . . . . . . . . . . . . . 707 17 19 .3 0 .4Education . . . . . . . . . . . . . . . . . . . . . . . . . . . . . . . . . . 250 8 6 .8 0 .2Arts, humanities, and other . . . . . . . . . . . . . . . . . . . . 605 14 16 .5 0 .3
1 Data are based on a sample and are subject to sampling variability . A margin of error is a measure of an estimate’s variability . The larger the margin of error in relation to the size of the estimate, the less reliable the estimate . When added to and subtracted from the estimate, the margin of error forms the 90 percent confidence interval .
Source: U .S . Census Bureau, 2009 American Community Survey .
U.S. Census Bureau 9
MT
AK
NM
OR MN
KS
SD
ND
MO
WA
FL
IL IN
WI NY
PA
MI
OHIA
ME
MA
CT
AZ
HI
NV
TX
COCA
WY
UT
ID
NE
OK
GA
AR
AL
NC
MS
LA
TN
KYVA
SC
WV
RI
DE MD DC
NJ
Figure 3b.Percent of Bachelor’s Degree Holders With a Degree in a Science- and Engineering-Related Field, by State: 2009
VT NH
(For information on confidentiality protection, nonsampling error, and definitions, see www.census.gov/acs/www/Downloads/data_documentation/Accuracy/ACS_Accuracy_of_Data_2009.pdf)
Note: Data are for the total population 25 years and older.
Source: U.S. Census Bureau, 2009 American Community Survey.
40.0 percent and higher
30.0 to 39.9 percent
20.0 to 29.9 percent
10.0 to 19.9 percent
Less than 10.0 percent
MT
AK
NM
OR MN
KS
SD
ND
MO
WA
FL
IL IN
WI NY
PA
MI
OHIA
ME
MA
CT
AZ
HI
NV
TX
COCA
WY
UT
ID
NE
OK
GA
AR
AL
NC
MS
LA
TN
KYVA
SC
WV
RI
DE MD DC
NJ
Figure 3c.Percent of Bachelor’s Degree Holders With a Degree in a Business Field, by State: 2009
VT NH
(For information on confidentiality protection, nonsampling error, and definitions, see www.census.gov/acs/www/Downloads/data_documentation/Accuracy/ACS_Accuracy_of_Data_2009.pdf)
Note: Data are for the total population 25 years and older.
Source: U.S. Census Bureau, 2009 American Community Survey.
40.0 percent and higher
30.0 to 39.9 percent
20.0 to 29.9 percent
10.0 to 19.9 percent
Less than 10.0 percent
10 U.S. Census Bureau
MT
AK
NM
OR MN
KS
SD
ND
MO
WA
FL
IL IN
WI NY
PA
MI
OHIA
ME
MA
CT
AZ
HI
NV
TX
COCA
WY
UT
ID
NE
OK
GA
AR
AL
NC
MS
LA
TN
KYVA
SC
WV
RI
DE MD DC
NJ
Figure 3d.Percent of Bachelor’s Degree Holders With a Degree in an Education Field, by State: 2009
VT NH
(For information on confidentiality protection, nonsampling error, and definitions, see www.census.gov/acs/www/Downloads/data_documentation/Accuracy/ACS_Accuracy_of_Data_2009.pdf)
Note: Data are for the total population 25 years and older.
Source: U.S. Census Bureau, 2009 American Community Survey.
40.0 percent and higher
30.0 to 39.9 percent
20.0 to 29.9 percent
10.0 to 19.9 percent
Less than 10.0 percent
MT
AK
NM
OR MN
KS
SD
ND
MO
WA
FL
IL IN
WI NY
PA
MI
OHIA
ME
MA
CT
AZ
HI
NV
TX
COCA
WY
UT
ID
NE
OK
GA
AR
AL
NC
MS
LA
TN
KYVA
SC
WV
RI
DE MD DC
NJ
Figure 3e.Percent of Bachelor’s Degree Holders With a Degree in an Arts, Humanities, or Other Field, by State: 2009
VT NH
(For information on confidentiality protection, nonsampling error, and definitions, see www.census.gov/acs/www/Downloads/data_documentation/Accuracy/ACS_Accuracy_of_Data_2009.pdf)
Note: Data are for the total population 25 years and older.
Source: U.S. Census Bureau, 2009 American Community Survey.
40.0 percent and higher
30.0 to 39.9 percent
20.0 to 29.9 percent
10.0 to 19.9 percent
Less than 10.0 percent
U.S. Census Bureau 11
020
0m
i
040
0km
030
0km
015
0m
i
030
0m
i
060
0km
40.0
per
cent
and
hig
her
30.0
to 3
9.9
perc
ent
20.0
to 2
9.9
perc
ent
10.0
to 1
9.9
perc
ent
Less
than
10.
0 pe
rcen
t
Figure
4a.
Perc
en
t of
Bach
elo
r’s
Degre
e H
old
ers
Wit
h a
Degre
e i
n a
Scie
nce a
nd
En
gin
eeri
ng F
ield
, b
y M
etr
op
oli
tan
Sta
tist
ical
Are
a: 2009
(For
info
rmat
ion o
n c
onfi
den
tial
ity p
rote
ctio
n,
non
sam
plin
g e
rror,
and d
efin
itio
ns,
see
w
ww
.cen
sus.
gov
/acs
/ww
w/D
ownlo
ads/
data
_doc
um
enta
tion
/Acc
ura
cy /
AC
S_A
ccura
cy_o
f_D
ata
_20
09
.pdf)
Note
: D
ata
are
for
the
tota
l popula
tion 2
5 y
ears
and o
lder
.
Sourc
e: U
.S. C
ensu
s Bu
reau
, 2009 A
mer
ican
Com
munit
y Su
rvey
.
12 U.S. Census Bureau
020
0m
i
040
0km
030
0km
015
0m
i
030
0m
i
060
0km
Figu
re 4
.
erce
nt o
f Ba
lor'
s eg
rees
Hld
ers W
ith a
Deg
ree
in
a Sc
ienc
e- a
nd E
ngin
ring
-Rel
ated
Fie
ld, b
y M
etro
polit
an
40.0
per
cent
and
hig
her
30.0
to 3
9.9
perc
ent
20.0
to 2
9.9
perc
ent
10.0
to 1
9.9
perc
ent
Less
than
10.
0 pe
rcen
t
Figure
4b.
Perc
en
t of
Bach
elo
r’s
Degre
e H
old
ers
Wit
h a
Degre
e i
n a
Scie
nce- an
d
En
gin
eeri
ng-R
ela
ted
Fie
ld, b
y M
etr
op
oli
tan
Sta
tist
ical
Are
a: 2009
(For
info
rmat
ion o
n c
onfi
den
tial
ity p
rote
ctio
n,
non
sam
plin
g e
rror,
and d
efin
itio
ns,
see
w
ww
.cen
sus.
gov
/acs
/ww
w/D
ownlo
ads/
data
_doc
um
enta
tion
/Acc
ura
cy /
AC
S_A
ccura
cy_o
f_D
ata
_20
09
.pdf)
Note
: D
ata
are
for
the
tota
l popula
tion 2
5 y
ears
and o
lder
.
Sourc
e: U
.S. C
ensu
s Bu
reau
, 2009 A
mer
ican
Com
munit
y Su
rvey
.
U.S. Census Bureau 13
020
0m
i
040
0km
030
0km
015
0m
i
030
0m
i
060
0km
Figu
re 4
c.
Perc
ent o
f Bac
helo
r's D
egre
es H
olde
rs W
ith a
Deg
ree
in
a B
usin
ess F
ield
, by
Met
ropo
litan
Sta
tistis
ical
Are
a: 2
009
40.0
per
cent
and
hig
her
30.0
to 3
9.9
perc
ent
20.0
to 2
9.9
perc
ent
10.0
to 1
9.9
perc
ent
Less
than
10.
0 pe
rcen
t
Figure
4c.
Perc
en
t of
Bach
elo
r’s
Degre
e H
old
ers
Wit
h a
Degre
e i
n a
Bu
sin
ess
Fie
ld,
by M
etr
op
oli
tan
Sta
tist
ical
Are
a: 2009
(For
info
rmat
ion o
n c
onfi
den
tial
ity p
rote
ctio
n,
non
sam
plin
g e
rror,
and d
efin
itio
ns,
see
w
ww
.cen
sus.
gov
/acs
/ww
w/D
ownlo
ads/
data
_doc
um
enta
tion
/Acc
ura
cy /
AC
S_A
ccura
cy_o
f_D
ata
_20
09
.pdf)
Note
: D
ata
are
for
the
tota
l popula
tion 2
5 y
ears
and o
lder
.
Sourc
e: U
.S. C
ensu
s Bu
reau
, 2009 A
mer
ican
Com
munit
y Su
rvey
.
14 U.S. Census Bureau
020
0m
i
040
0km
030
0km
015
0m
i
030
0m
i
060
0km
Figu
re 4
d.
Perc
ent o
f Bac
helo
r's D
egre
es H
olde
rs W
ith a
Deg
ree
in a
n E
duca
tion
Fiel
d, b
y M
etro
polit
an S
tatis
tisic
al A
rea:
200
9
40.0
per
cent
and
hig
her
30.0
to 3
9.9
perc
ent
20.0
to 2
9.9
perc
ent
10.0
to 1
9.9
perc
ent
Less
than
10.
0 pe
rcen
t
Figure
4d.
Perc
en
t of
Bach
elo
r’s
Degre
e H
old
ers
Wit
h a
Degre
e i
n a
n E
du
cati
on
Fie
ld,
by M
etr
op
oli
tan
Sta
tist
ical
Are
a: 2009
(For
info
rmat
ion o
n c
onfi
den
tial
ity p
rote
ctio
n,
non
sam
plin
g e
rror,
and d
efin
itio
ns,
see
w
ww
.cen
sus.
gov
/acs
/ww
w/D
ownlo
ads/
data
_doc
um
enta
tion
/Acc
ura
cy /
AC
S_A
ccura
cy_o
f_D
ata
_20
09
.pdf)
Note
: D
ata
are
for
the
tota
l popula
tion 2
5 y
ears
and o
lder
.
Sourc
e: U
.S. C
ensu
s Bu
reau
, 2009 A
mer
ican
Com
munit
y Su
rvey
.
U.S. Census Bureau 15
020
0m
i
040
0km
030
0km
015
0m
i
030
0m
i
060
0km
Figu
re 4
e.
Perc
ent o
f Bac
helo
r's D
egre
es H
olde
rs W
ith a
Deg
ree
in a
n A
rts,
Hum
aniti
es, o
r O
ther
Fie
ld, b
y M
etro
polit
an S
tatis
tisic
al A
rea:
200
9
40.0
per
cent
and
hig
her
30.0
to 3
9.9
perc
ent
20.0
to 2
9.9
perc
ent
10.0
to 1
9.9
perc
ent
Less
than
10.
0 pe
rcen
t
Figure
4e.
Perc
en
t of
Bach
elo
r’s
Degre
e H
old
ers
Wit
h a
Degre
e i
n a
n A
rts,
Hu
man
itit
es,
or
Oth
er
Fie
ld, b
y M
etr
op
oli
tan
Sta
tist
ical
Are
a: 2009
(For
info
rmat
ion o
n c
onfi
den
tial
ity p
rote
ctio
n,
non
sam
plin
g e
rror,
and d
efin
itio
ns,
see
w
ww
.cen
sus.
gov
/acs
/ww
w/D
ownlo
ads/
data
_doc
um
enta
tion
/Acc
ura
cy /
AC
S_A
ccura
cy_o
f_D
ata
_20
09
.pdf)
Note
: D
ata
are
for
the
tota
l popula
tion 2
5 y
ears
and o
lder
.
Sourc
e: U
.S. C
ensu
s Bu
reau
, 2009 A
mer
ican
Com
munit
y Su
rvey
.
16 U.S. Census Bureau
degrees.10 Of the eight states where science- and engineering-related fields were above 10 percent, only Maine and Wisconsin had propor-tions of science and engineering degrees above 30 percent.11
The proportion of the college-educated population with degrees in a business field was highest in the southern states of Florida and Georgia (Figure 3c).12 This propor-tion was among the lowest in the District of Columbia (11 percent)
10 These five states are Louisiana, Mississippi, Nebraska, North Dakota, and Oklahoma.
11 These eight states are Indiana, Kentucky, Louisiana, Maine, Mississippi, North Dakota, West Virginia, and Wisconsin.
12 The percentage of degrees in business in Georgia was not significantly different from Alabama. The percentage of degrees in busi-ness in Florida was not significantly different from Alabama and Nevada.
and Vermont (12 percent).13 Busi-ness fields made up more than 23 percent of bachelor’s degrees in Florida and Georgia, making that field nearly twice as common in those states as in the District of Columbia and Vermont.
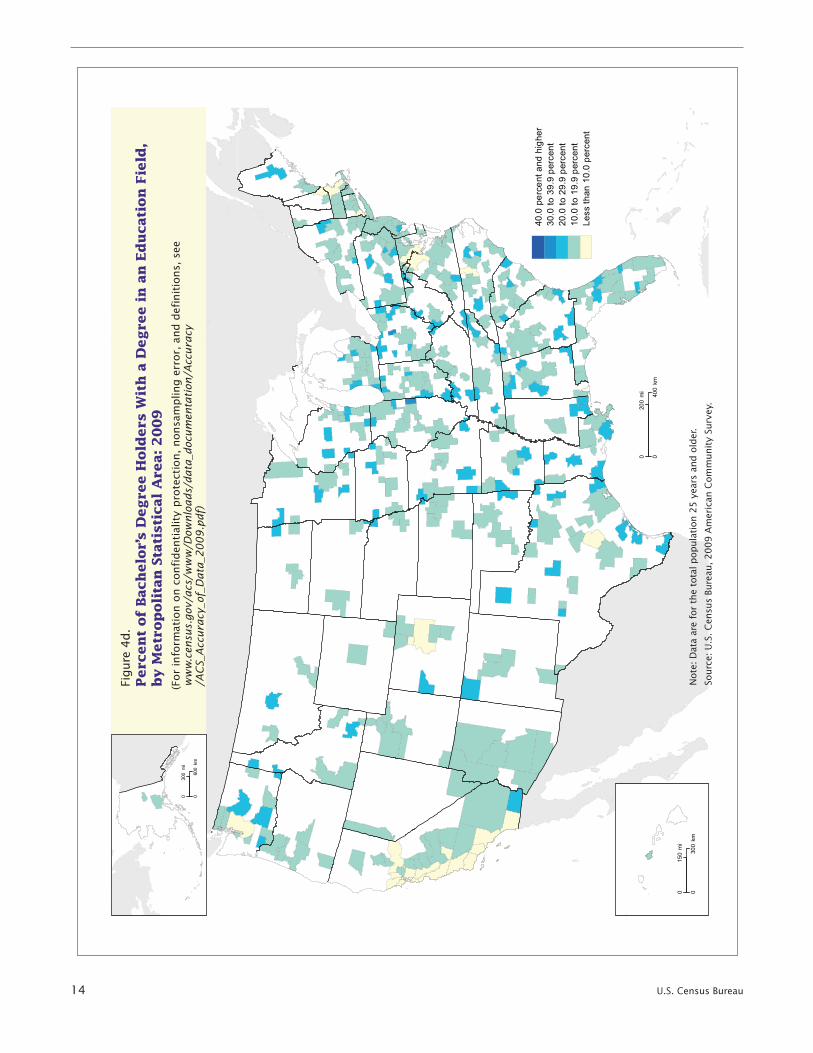
The proportion of bachelor’s degrees in an education field was 20 percent or more in some Mid-western and Southern states (Figure 3d). North Dakota was among the highest percentages (23 percent), making an education degree more than three times as common among college graduates there than in the area with the smallest percentage of degrees in an educa-tion field (the District of Columbia
13 The percentages of degrees in a busi-ness field in the District of Columbia and Vermont were not significantly different from the percentage of degrees in a business field in Alaska, and percentage of degrees in a business field in Vermont was not signifi-cantly different from Wyoming.
at6percent).Generallyspeaking,states with the lowest percentage of degrees in education fields were the same states that had the lowest percentage of degrees in science- and engineering-related fields. Of the ten states in the lowest quintile of degrees in an education field (California, Colorado, Connecticut, District of Columbia, Maryland, Massachusetts, New York, New Jersey, Virginia, and Washington), all but Maryland and New York were also in the lowest quintile of degrees in the science- and engineering-related fields.
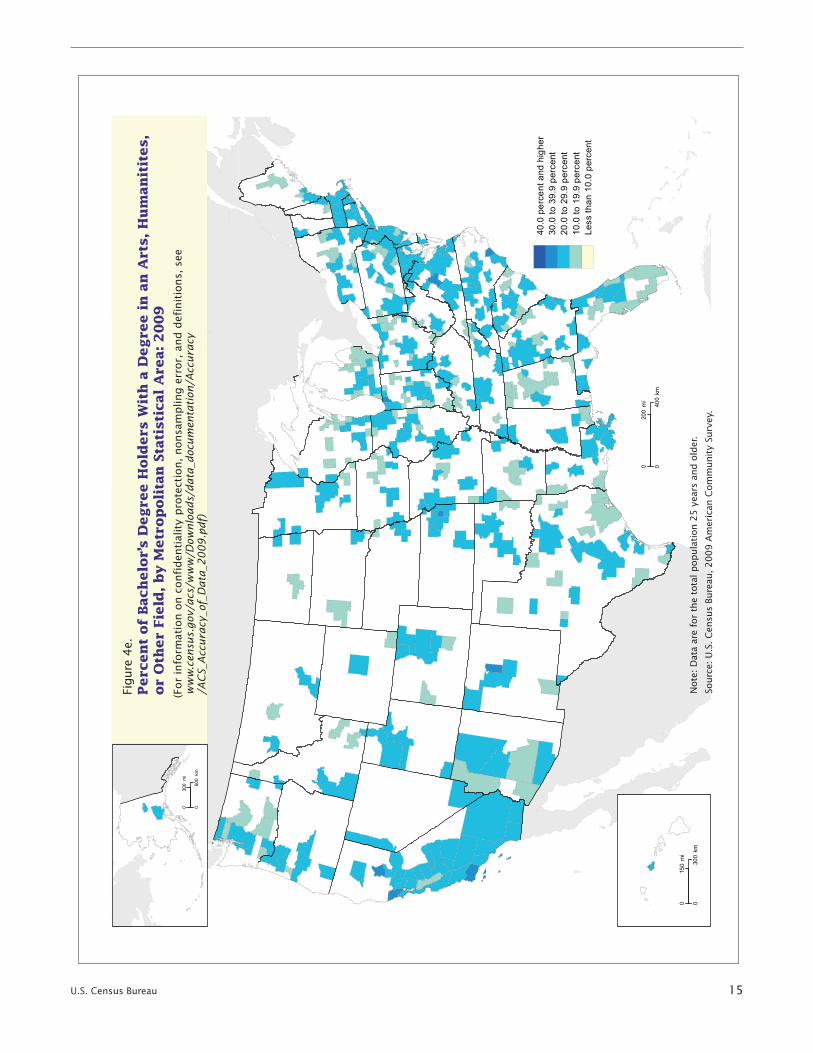
The arts, humanities, and other field, which includes such majors as history, public administration, literature, and philosophy, was most common in two Northeastern states, two Pacific states, and the District of Columbia (Figure 3e). In California, the District of Columbia,
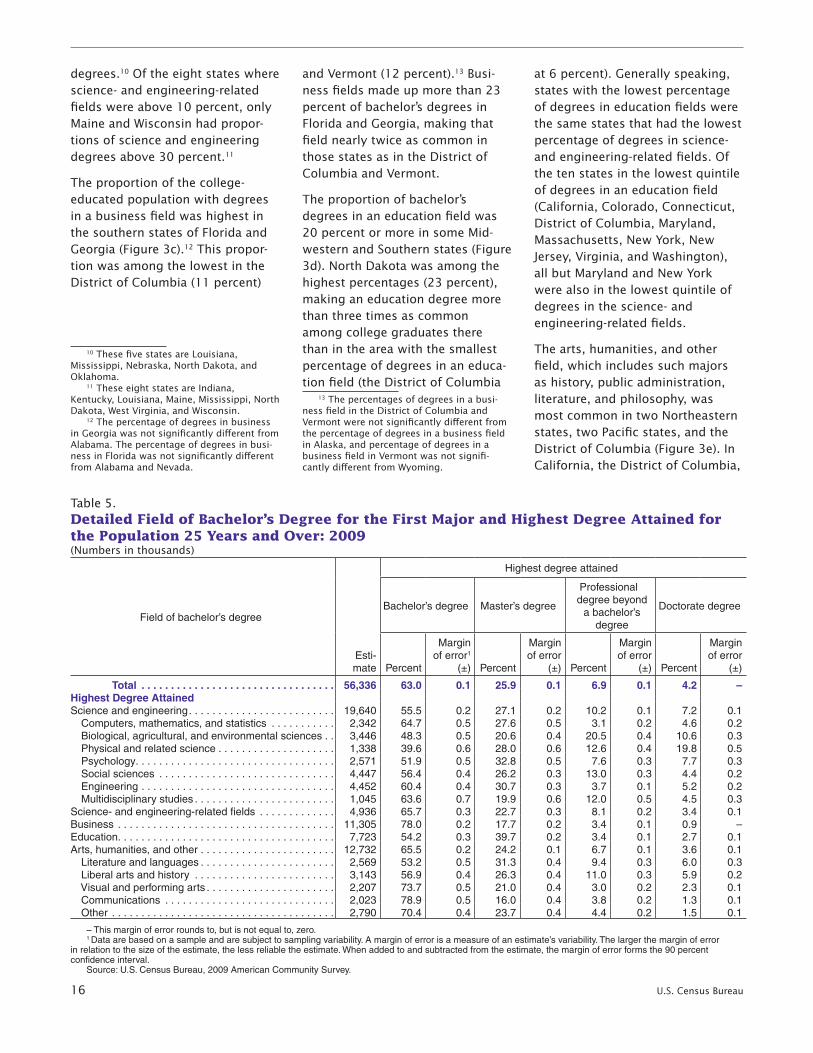
Table5.Detailed Field of Bachelor’s Degree for the First Major and Highest Degree Attained for the Population 25 Years and Over: 2009(Numbers in thousands)
Field of bachelor’s degree
Esti-mate
Highest degree attained
Bachelor’s degree Master’s degree
Professional degree beyond
a bachelor’s degree
Doctorate degree
Percent
Margin of error1
(±) Percent
Margin of error
(±) Percent
Margin of error
(±) Percent
Margin of error
(±)
Total . . . . . . . . . . . . . . . . . . . . . . . . . . . . . . . . . 56,336 63 .0 0 .1 25 .9 0 .1 6 .9 0 .1 4 .2 –Highest Degree Attained Science and engineering . . . . . . . . . . . . . . . . . . . . . . . . . 19,640 55 .5 0 .2 27 .1 0 .2 10 .2 0 .1 7 .2 0 .1 Computers, mathematics, and statistics . . . . . . . . . . . 2,342 64 .7 0 .5 27 .6 0 .5 3 .1 0 .2 4 .6 0 .2 Biological, agricultural, and environmental sciences . . 3,446 48 .3 0 .5 20 .6 0 .4 20 .5 0 .4 10 .6 0 .3 Physical and related science . . . . . . . . . . . . . . . . . . . . 1,338 39 .6 0 .6 28 .0 0 .6 12 .6 0 .4 19 .8 0 .5 Psychology . . . . . . . . . . . . . . . . . . . . . . . . . . . . . . . . . . 2,571 51 .9 0 .5 32 .8 0 .5 7 .6 0 .3 7 .7 0 .3 Social sciences . . . . . . . . . . . . . . . . . . . . . . . . . . . . . . 4,447 56 .4 0 .4 26 .2 0 .3 13 .0 0 .3 4 .4 0 .2 Engineering . . . . . . . . . . . . . . . . . . . . . . . . . . . . . . . . . 4,452 60 .4 0 .4 30 .7 0 .3 3 .7 0 .1 5 .2 0 .2 Multidisciplinary studies . . . . . . . . . . . . . . . . . . . . . . . . 1,045 63 .6 0 .7 19 .9 0 .6 12 .0 0 .5 4 .5 0 .3Science- and engineering-related fields . . . . . . . . . . . . . 4,936 65 .7 0 .3 22 .7 0 .3 8 .1 0 .2 3 .4 0 .1Business . . . . . . . . . . . . . . . . . . . . . . . . . . . . . . . . . . . . . 11,305 78 .0 0 .2 17 .7 0 .2 3 .4 0 .1 0 .9 –Education . . . . . . . . . . . . . . . . . . . . . . . . . . . . . . . . . . . . . 7,723 54 .2 0 .3 39 .7 0 .2 3 .4 0 .1 2 .7 0 .1Arts, humanities, and other . . . . . . . . . . . . . . . . . . . . . . . 12,732 65 .5 0 .2 24 .2 0 .1 6 .7 0 .1 3 .6 0 .1 Literature and languages . . . . . . . . . . . . . . . . . . . . . . . 2,569 53 .2 0 .5 31 .3 0 .4 9 .4 0 .3 6 .0 0 .3 Liberal arts and history . . . . . . . . . . . . . . . . . . . . . . . . 3,143 56 .9 0 .4 26 .3 0 .4 11 .0 0 .3 5 .9 0 .2 Visual and performing arts . . . . . . . . . . . . . . . . . . . . . . 2,207 73 .7 0 .5 21 .0 0 .4 3 .0 0 .2 2 .3 0 .1 Communications . . . . . . . . . . . . . . . . . . . . . . . . . . . . . 2,023 78 .9 0 .5 16 .0 0 .4 3 .8 0 .2 1 .3 0 .1 Other . . . . . . . . . . . . . . . . . . . . . . . . . . . . . . . . . . . . . . 2,790 70 .4 0 .4 23 .7 0 .4 4 .4 0 .2 1 .5 0 .1
– This margin of error rounds to, but is not equal to, zero .1 Data are based on a sample and are subject to sampling variability . A margin of error is a measure of an estimate’s variability . The larger the margin of error
in relation to the size of the estimate, the less reliable the estimate . When added to and subtracted from the estimate, the margin of error forms the 90 percent confidence interval .
Source: U .S . Census Bureau, 2009 American Community Survey .
U.S. Census Bureau 17
New York, Oregon, and Vermont, morethan25percentofcollege-educated adults held a degree in an arts, humanities, or other field.
Detailed fields of degree also varied across states (Appendix B). New York had the highest percentage of degrees in visual and performing arts(6percent),althoughthiswasnot significantly different from the District of Columbia. While Michigan had more than 10 percent of its bachelor’s degrees in engi-neering, Nebraska was among the lowest at only 4 percent. The District of Columbia was distin-guished by the highest presence of socialsciencedegrees,with26per-cent of all bachelor’s degrees being in that field. All other areas had a percentage of degrees in social sci-ence fields that ranged from 4 per-cent (Mississippi and North Dakota) to 11 percent (Virginia).
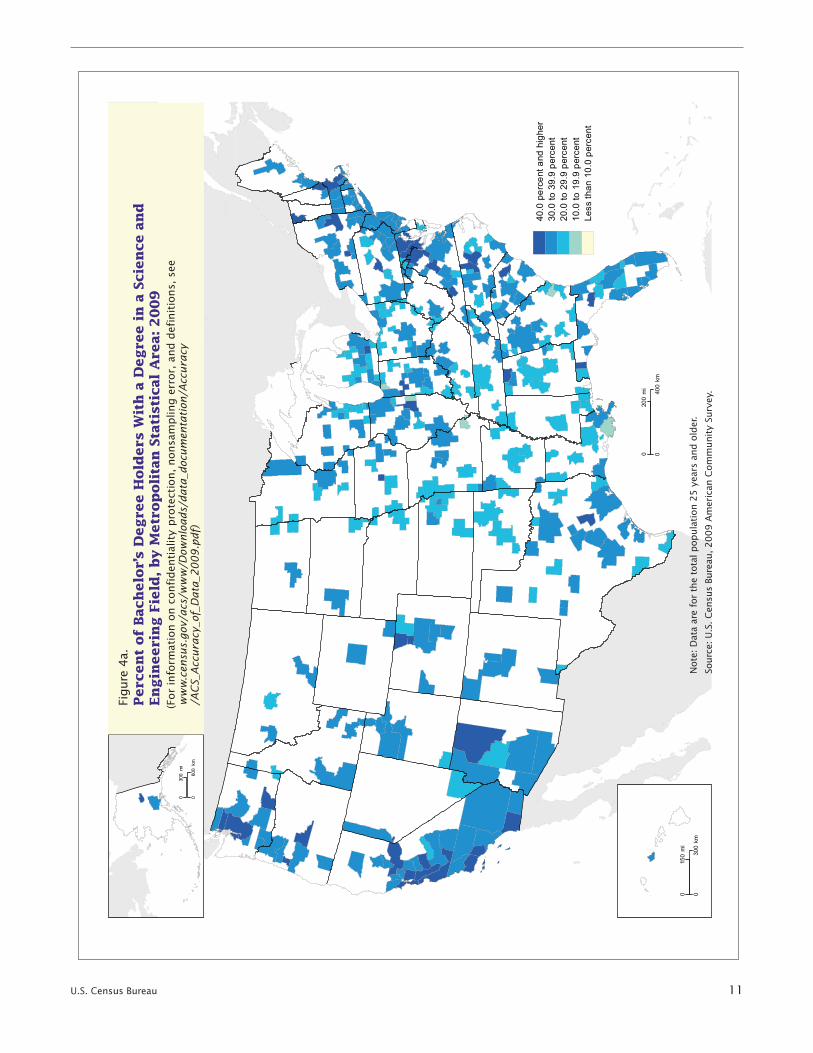
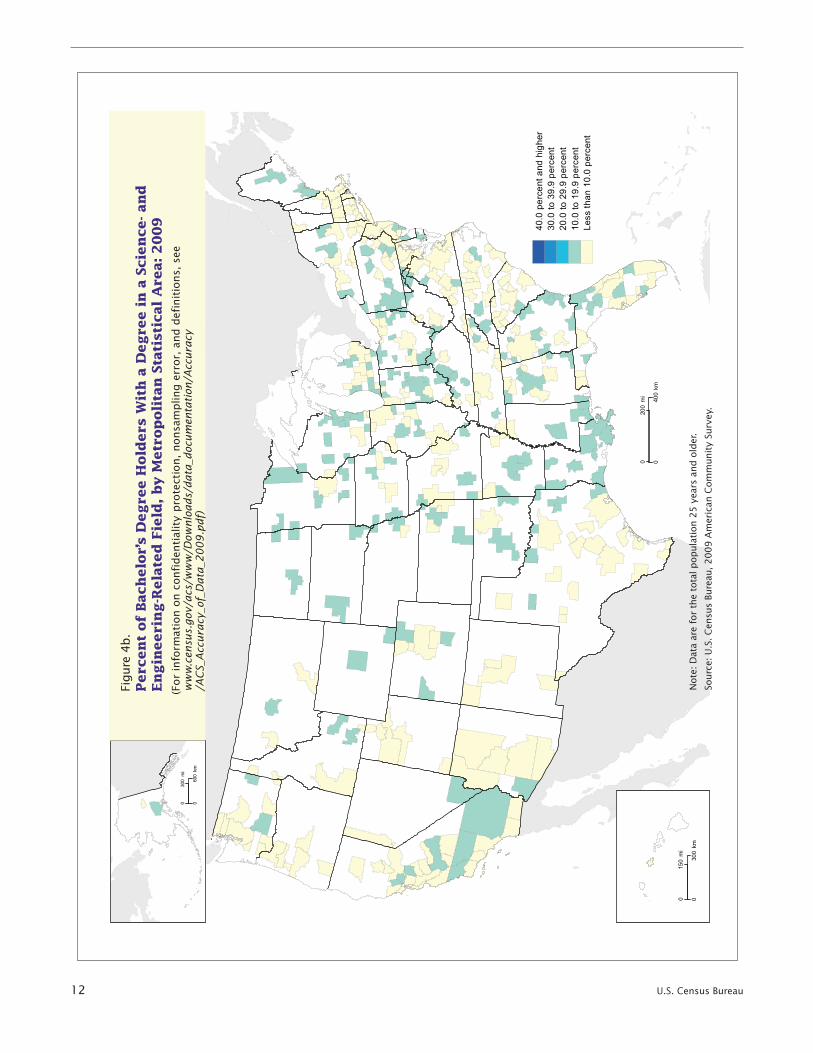
Metropolitan-Level Differences in Field of Degree
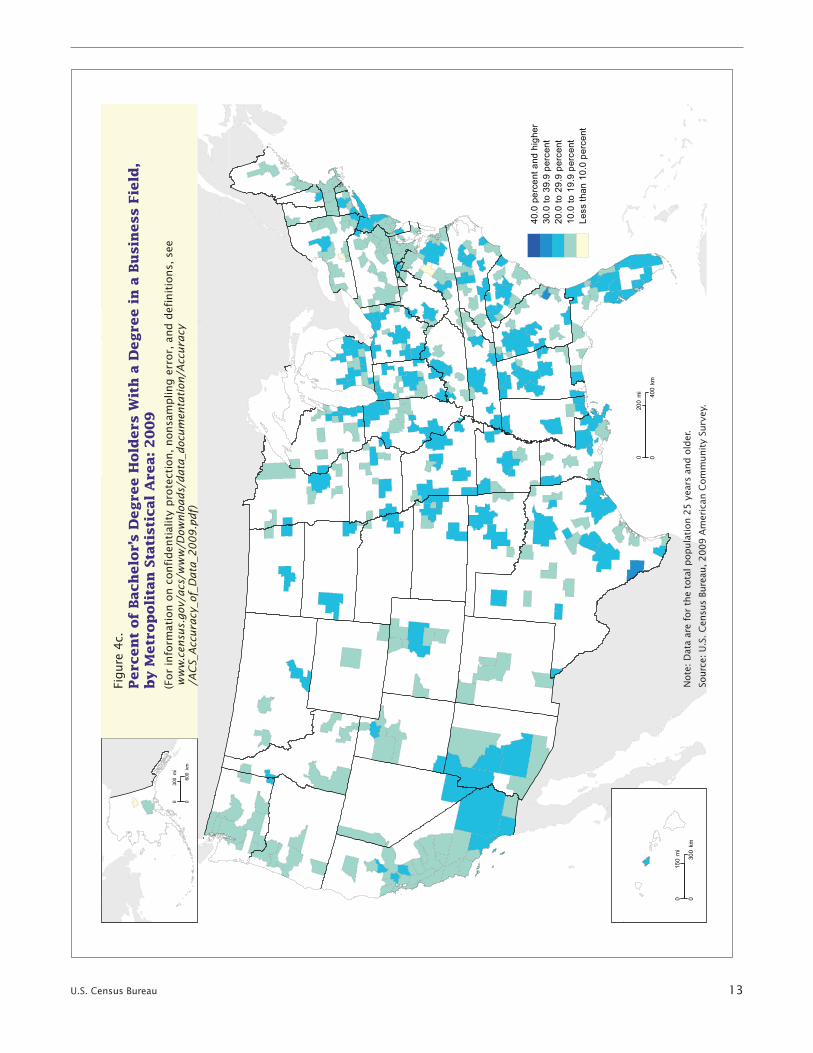
Figures 4a through 4e show the percentage of bachelor’s degrees in various broad fields within met-ropolitan statistical areas. These metropolitan-level maps can be compared to the state-level maps to illustrate the within-state varia-tion of field of degree. For example, although 33 percent of the bach-elor’s degrees in the state of Illinois were in a science and engineering field, this percentage was just 19 percent in Danville, Illinois, but was 42 percent in the Champaign-Urbana metropolitan area.
The percentage of degrees in a business field ranged from just 8 percent in Fairbanks, Alaska, and Charlotte, Virginia, to 32 percent in Hinesville-Fort Stewart, Georgia. The percentage of business degrees also varied widely within states. Just 12 percent of the bachelor’s degrees in Victoria, Texas, were in a business field, but that number
rose to 30 percent in nearby Lar-edo. Business fields made up 23 percent of bachelor’s degrees in Detroit-Warren-Livonia, Michigan. In the adjacent metropolitan area of Ann Arbor, business fields made up only 12 percent of the degrees.
Eight percent of the bachelor’s degrees in the state of California were in an education field, but this percentage was much higher (20 percent) in the El Centro metropoli-tan area. Nationally, the San Jose-Sunnyvale-Santa Clara metropolitan area had among the lowest percent-age of degrees in an education field at5percent.
FIELD OF DEGREE AND EDUCATIONAL ATTAINMENT
Although millions of people with bachelor’s degrees go on to earn higherdegrees(Table5),mostdo not. Sixty-three percent of the college-educated population did not hold an advanced degree.14 Over 1 in 4 of the college-educated population had a master’s degree as their highest degree. Far fewer people went on to obtain a pro-fessional(7percent)ordoctoraldegree (4 percent).
The probability of obtaining an advanced degree after earning a bachelor’s varied by detailed field of undergraduate degree. People with undergraduate degrees in the business and communications fields were the least likely to hold an advanced degree. Of the 2 mil-lion people with a bachelor’s degree inacommunicationsfield,79per-cent did not hold a higher degree. Similarly,78percentofthosewhoheld a bachelor’s degree in a busi-ness field did not hold a higher degree. This contrasted sharply with people holding an undergradu-ate degree in physical and related
14 “Advanced degree” includes master’s, professional, or doctoral degrees.
sciences,where3in5graduatesheld an advanced degree.
Physical and related sciences was also the field most likely to lead to a doctorate degree with 20 percent of its holders eventually earning that degree. A similar proportion of people with undergraduate degrees in biological, agricultural, and environmental sciences earned a professional degree. The field most likely to culminate in a master’s degree was education, with nearly 40 percent of its holders doing so.
FIELD OF DEGREE AND EARNINGS
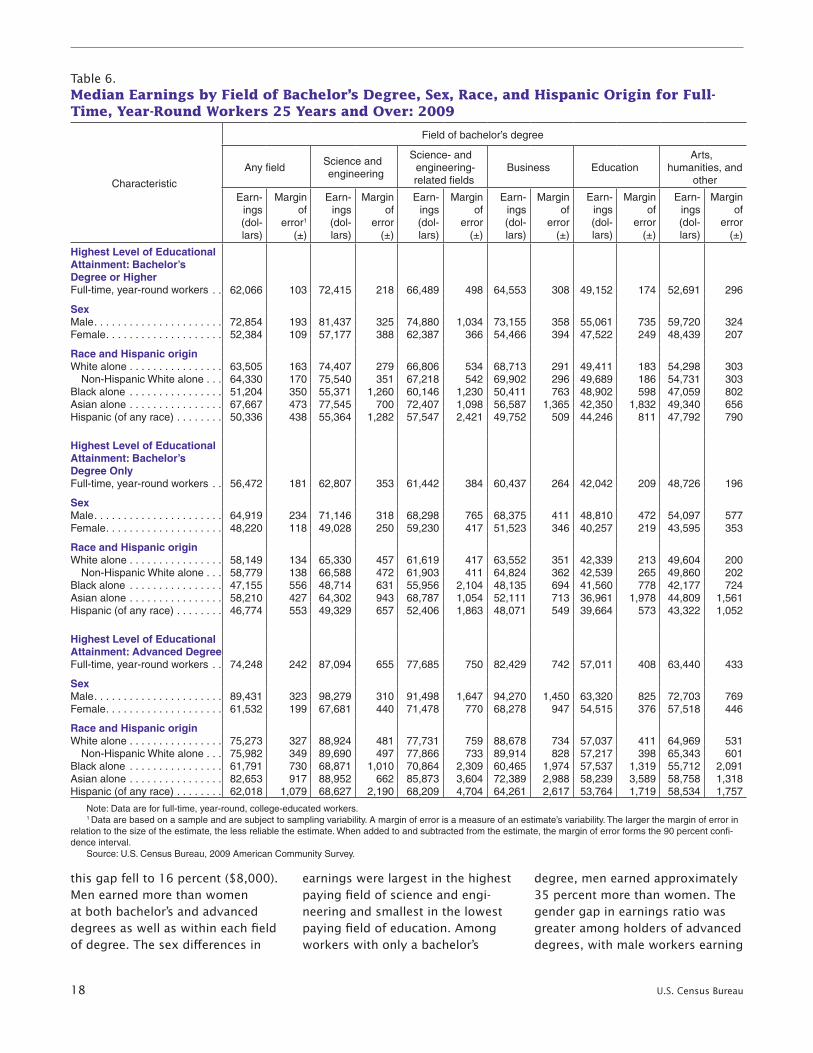
Table6showsthemedianearningsof full-time, year-round, college-educatedworkersaged25andoverby educational attainment, sex, race, and Hispanic origin. Earnings varied by broad field of bachelor’s degree and by whether or not a person also completed an advanced degree. The median earnings for workers with just a bachelor’s degreein2009was$56,000,whilepeople with an advanced degree earnedonaverage$74,000.Peoplewith only a bachelor’s degree in science and engineering tended to earn much more than people with only a bachelor’s degree in education($63,000comparedwith$42,000). This difference in earn-ings was more pronounced among advanced degree holders, with the science and engineering fields being associated with median earn-ings about $30,000 greater than the median earnings associated with the education fields.
Sex and Earnings by Field of Degree
Among all full-time, year-round workers with a bachelor’s degree or higher, men with a degree in a sci-ence and engineering field earned 43 percent more ($24,000) than women, but in the education field
18 U.S. Census Bureau
thisgapfellto16percent($8,000).Men earned more than women at both bachelor’s and advanced degrees as well as within each field of degree. The sex differences in
earnings were largest in the highest paying field of science and engi-neering and smallest in the lowest paying field of education. Among workers with only a bachelor’s
degree, men earned approximately 35percentmorethanwomen.Thegender gap in earnings ratio was greater among holders of advanced degrees, with male workers earning
Table6.Median Earnings by Field of Bachelor’s Degree, Sex, Race, and Hispanic Origin for Full-Time, Year-Round Workers 25 Years and Over: 2009
Characteristic
Field of bachelor’s degree
Any fieldScience and engineering
Science- and engineering-related fields
Business EducationArts,
humanities, and other
Earn-ings (dol-lars)
Margin of
error1
(±)
Earn-ings (dol-lars)
Margin of
error (±)
Earn-ings (dol-lars)
Margin of
error (±)
Earn-ings (dol-lars)
Margin of
error (±)
Earn-ings (dol-lars)
Margin of
error (±)
Earn-ings (dol-lars)
Margin of
error (±)
Highest Level of Educational Attainment: Bachelor’s Degree or HigherFull-time, year-round workers . . 62,066 103 72,415 218 66,489 498 64,553 308 49,152 174 52,691 296
SexMale . . . . . . . . . . . . . . . . . . . . . . 72,854 193 81,437 325 74,880 1,034 73,155 358 55,061 735 59,720 324Female . . . . . . . . . . . . . . . . . . . . 52,384 109 57,177 388 62,387 366 54,466 394 47,522 249 48,439 207
Race and Hispanic originWhite alone . . . . . . . . . . . . . . . . 63,505 163 74,407 279 66,806 534 68,713 291 49,411 183 54,298 303 Non-Hispanic White alone . . . 64,330 170 75,540 351 67,218 542 69,902 296 49,689 186 54,731 303Black alone . . . . . . . . . . . . . . . . 51,204 350 55,371 1,260 60,146 1,230 50,411 763 48,902 598 47,059 802Asian alone . . . . . . . . . . . . . . . . 67,667 473 77,545 700 72,407 1,098 56,587 1,365 42,350 1,832 49,340 656Hispanic (of any race) . . . . . . . . 50,336 438 55,364 1,282 57,547 2,421 49,752 509 44,246 811 47,792 790
Highest Level of Educational Attainment: Bachelor’s Degree OnlyFull-time, year-round workers . . 56,472 181 62,807 353 61,442 384 60,437 264 42,042 209 48,726 196
SexMale . . . . . . . . . . . . . . . . . . . . . . 64,919 234 71,146 318 68,298 765 68,375 411 48,810 472 54,097 577Female . . . . . . . . . . . . . . . . . . . . 48,220 118 49,028 250 59,230 417 51,523 346 40,257 219 43,595 353
Race and Hispanic originWhite alone . . . . . . . . . . . . . . . . 58,149 134 65,330 457 61,619 417 63,552 351 42,339 213 49,604 200 Non-Hispanic White alone . . . 58,779 138 66,588 472 61,903 411 64,824 362 42,539 265 49,860 202Black alone . . . . . . . . . . . . . . . . 47,155 556 48,714 631 55,956 2,104 48,135 694 41,560 778 42,177 724Asian alone . . . . . . . . . . . . . . . . 58,210 427 64,302 943 68,787 1,054 52,111 713 36,961 1,978 44,809 1,561Hispanic (of any race) . . . . . . . . 46,774 553 49,329 657 52,406 1,863 48,071 549 39,664 573 43,322 1,052
Highest Level of Educational Attainment: Advanced DegreeFull-time, year-round workers . . 74,248 242 87,094 655 77,685 750 82,429 742 57,011 408 63,440 433
SexMale . . . . . . . . . . . . . . . . . . . . . . 89,431 323 98,279 310 91,498 1,647 94,270 1,450 63,320 825 72,703 769Female . . . . . . . . . . . . . . . . . . . . 61,532 199 67,681 440 71,478 770 68,278 947 54,515 376 57,518 446
Race and Hispanic originWhite alone . . . . . . . . . . . . . . . . 75,273 327 88,924 481 77,731 759 88,678 734 57,037 411 64,969 531 Non-Hispanic White alone . . . 75,982 349 89,690 497 77,866 733 89,914 828 57,217 398 65,343 601Black alone . . . . . . . . . . . . . . . . 61,791 730 68,871 1,010 70,864 2,309 60,465 1,974 57,537 1,319 55,712 2,091Asian alone . . . . . . . . . . . . . . . . 82,653 917 88,952 662 85,873 3,604 72,389 2,988 58,239 3,589 58,758 1,318Hispanic (of any race) . . . . . . . . 62,018 1,079 68,627 2,190 68,209 4,704 64,261 2,617 53,764 1,719 58,534 1,757
Note: Data are for full-time, year-round, college-educated workers .1 Data are based on a sample and are subject to sampling variability . A margin of error is a measure of an estimate’s variability . The larger the margin of error in
relation to the size of the estimate, the less reliable the estimate . When added to and subtracted from the estimate, the margin of error forms the 90 percent confi-dence interval .
Source: U .S . Census Bureau, 2009 American Community Survey .
U.S. Census Bureau 19
45percentmorethansimilarlyeducated female workers.
Race and Hispanic Origin
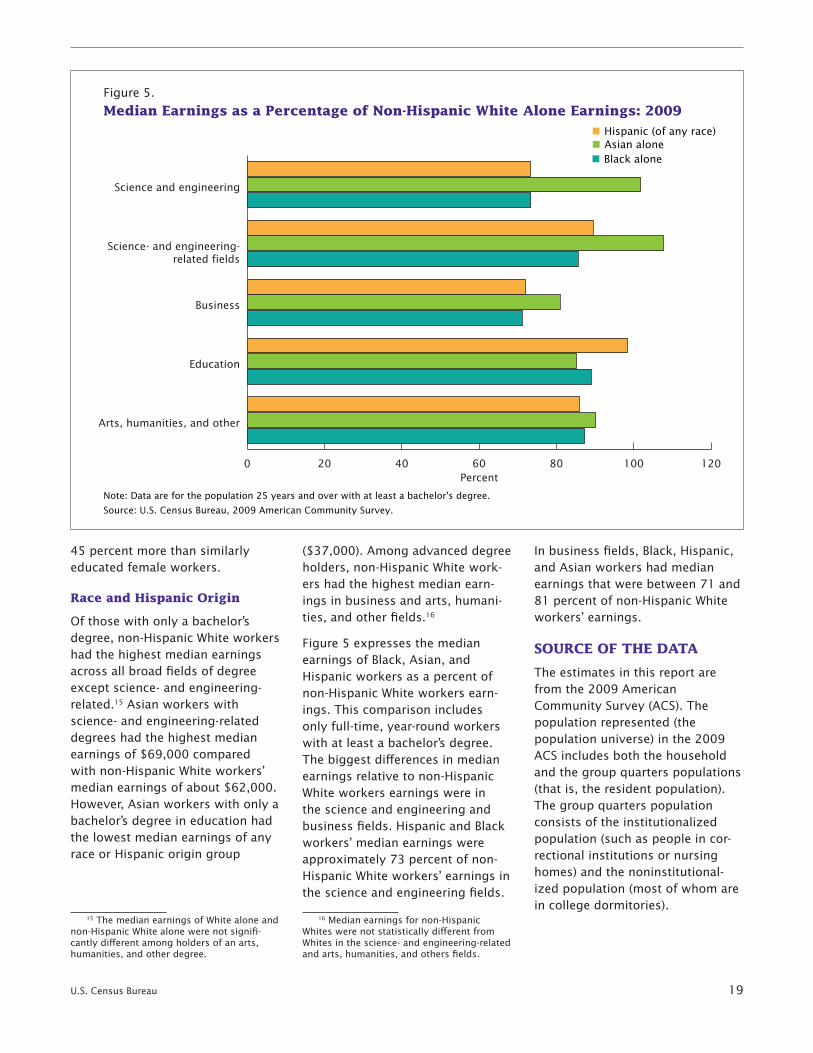
Of those with only a bachelor’s degree, non-Hispanic White workers had the highest median earnings across all broad fields of degree except science- and engineering-related.15 Asian workers with science- and engineering-related degrees had the highest median earningsof$69,000comparedwith non-Hispanic White workers’ medianearningsofabout$62,000.However, Asian workers with only a bachelor’s degree in education had the lowest median earnings of any race or Hispanic origin group
15 The median earnings of White alone and non-Hispanic White alone were not signifi-cantly different among holders of an arts, humanities, and other degree.
($37,000).Amongadvanceddegreeholders, non-Hispanic White work-ers had the highest median earn-ings in business and arts, humani-ties, and other fields.16
Figure5expressesthemedianearnings of Black, Asian, and Hispanic workers as a percent of non-Hispanic White workers earn-ings. This comparison includes only full-time, year-round workers with at least a bachelor’s degree. The biggest differences in median earnings relative to non-Hispanic White workers earnings were in the science and engineering and business fields. Hispanic and Black workers’ median earnings were approximately73percentofnon-Hispanic White workers’ earnings in the science and engineering fields.
16 Median earnings for non-Hispanic Whites were not statistically different from Whites in the science- and engineering-related and arts, humanities, and others fields.
In business fields, Black, Hispanic, and Asian workers had median earningsthatwerebetween71and81 percent of non-Hispanic White workers’ earnings.
SOURCE OF THE DATA
The estimates in this report are from the 2009 American Community Survey (ACS). The population represented (the population universe) in the 2009 ACS includes both the household and the group quarters populations (that is, the resident population). The group quarters population consists of the institutionalized population (such as people in cor-rectional institutions or nursing homes) and the noninstitutional-ized population (most of whom are in college dormitories).
Figure 5.
Median Earnings as a Percentage of Non-Hispanic White Alone Earnings: 2009
Note: Data are for the population 25 years and over with at least a bachelor's degree.
Source: U.S. Census Bureau, 2009 American Community Survey.
Asian aloneBlack alone
Hispanic (of any race)
0 20 40 60 80 100 120
Arts, humanities, and other
Education
Business
Science- and engineering-related fields
Science and engineering
Percent
20 U.S. Census Bureau
ACCURACY OF THE ESTIMATES
Statistics from sample surveys are subject to sampling error and nonsampling error. All comparisons presented in this report have taken sampling error into account and are significant at the 90 percent confidence level. This means the 90 percent confidence interval for the difference between estimates being compared does not include zero. Nonsampling error in surveys may be attributed to a variety of sources, such as how the survey was designed, how respondents interpret questions, how able and willing respondents are to provide correct answers, and how accu-rately answers are coded and clas-sified. To minimize these errors, the U.S. Census Bureau employs quality control procedures in sample
selection, the wording of questions, interviewing, coding, data process-ing, and data analysis.
The final ACS population estimates are adjusted in the weighting pro-cedure for coverage error by con-trolling specific survey estimates to independent population controls by sex, age, race, and Hispanic origin. This weighting partially corrects for bias due to over- or undercoverage, but biases may still be present, for example, when people who were missed differ from those inter-viewed in ways other than sex, age, race, and Hispanic origin. How this weighting procedure affects other variables in the survey is not pre-cisely known. All of these consid-erations affect comparisons across different surveys or data sources. For information on sampling and estimation methods, confidentiality
protection, and sampling and nonsampling errors, please see the “2009 ACS Accuracy of the Data” document located at <www.census .gov/acs/www/Downloads/data _documentation/Accuracy/ACS _Accuracy_of_Data_2009.pdf>.
MORE INFORMATION
Detailed tabulations, related infor-mation, and historic data are avail-able on the Internet at the Educational Attainment page on the Census Bureau’s Web site at <www.census.gov/hhes/socdemo /education/index.html>. For additional questions or comments, contact Julie Siebens or Camille L. Ryanat301-763-2464orviae-mailat <[email protected]> or <[email protected]>.
U.S. Census Bureau 21
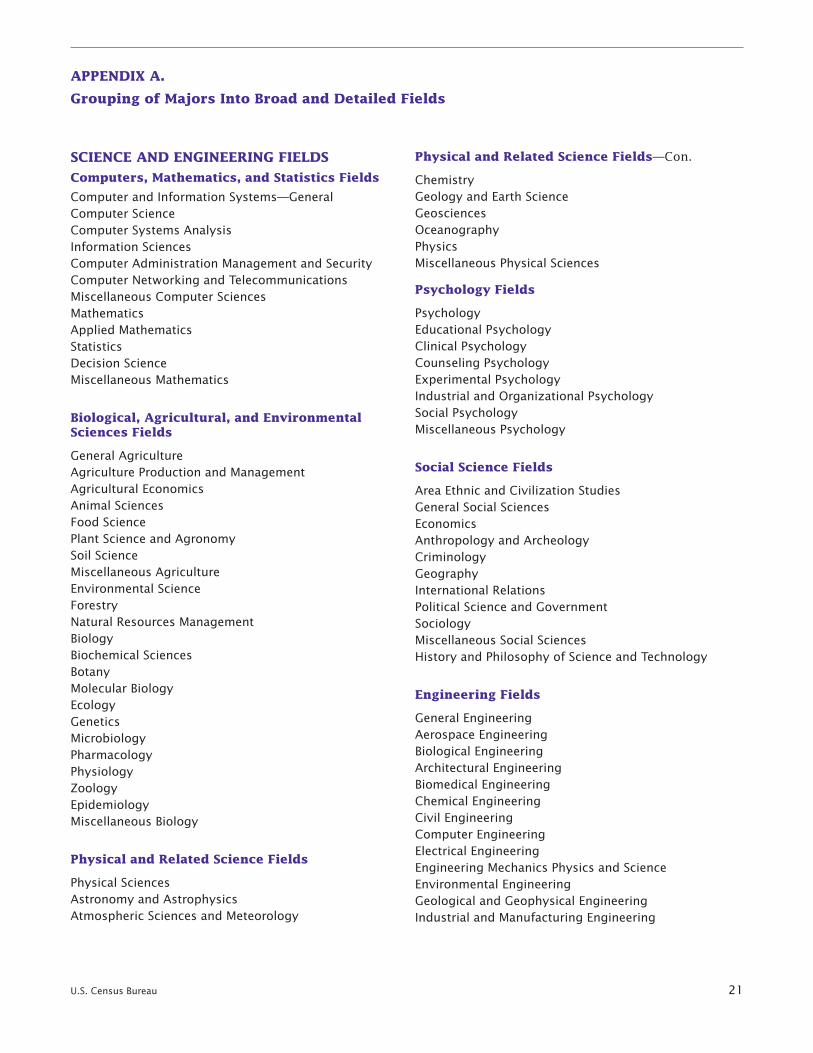
APPENDIX A.
Grouping of Majors Into Broad and Detailed Fields
SCIENCE AND ENGINEERING FIELDS
Computers, Mathematics, and Statistics Fields
Computer and Information Systems—GeneralComputer ScienceComputer Systems AnalysisInformation SciencesComputer Administration Management and SecurityComputer Networking and TelecommunicationsMiscellaneous Computer SciencesMathematicsApplied MathematicsStatisticsDecision ScienceMiscellaneous Mathematics
Biological, Agricultural, and Environmental Sciences Fields
General AgricultureAgriculture Production and ManagementAgricultural EconomicsAnimal SciencesFood SciencePlant Science and AgronomySoil ScienceMiscellaneous AgricultureEnvironmental ScienceForestryNatural Resources ManagementBiologyBiochemical SciencesBotanyMolecular BiologyEcologyGeneticsMicrobiologyPharmacologyPhysiologyZoologyEpidemiologyMiscellaneous Biology
Physical and Related Science Fields
Physical Sciences Astronomy and AstrophysicsAtmospheric Sciences and Meteorology
Physical and Related Science Fields—Con.
ChemistryGeology and Earth ScienceGeosciencesOceanographyPhysicsMiscellaneous Physical Sciences
Psychology Fields
PsychologyEducational PsychologyClinical PsychologyCounseling PsychologyExperimental PsychologyIndustrial and Organizational PsychologySocial PsychologyMiscellaneous Psychology
Social Science Fields
Area Ethnic and Civilization StudiesGeneral Social SciencesEconomicsAnthropology and ArcheologyCriminologyGeographyInternational RelationsPolitical Science and GovernmentSociologyMiscellaneous Social SciencesHistory and Philosophy of Science and Technology
Engineering Fields
General EngineeringAerospace EngineeringBiological EngineeringArchitectural EngineeringBiomedical EngineeringChemical EngineeringCivil EngineeringComputer EngineeringElectrical EngineeringEngineering Mechanics Physics and ScienceEnvironmental EngineeringGeological and Geophysical EngineeringIndustrial and Manufacturing Engineering
22 U.S. Census Bureau
Engineering Fields—Con.
Materials Engineering and Materials ScienceMechanical EngineeringMetallurgical EngineeringMining and Mineral EngineeringNaval Architecture and Marine EngineeringNuclear EngineeringPetroleum EngineeringOperations ResearchMiscellaneous Engineering
Multidisciplinary Studies Fields
Intercultural and International StudiesNutrition SciencesNeuroscienceAccounting and Computer ScienceMathematics and Computer ScienceCognitive Science and BiopsychologyInterdisciplinary Social SciencesMultidisciplinary or General Science
SCIENCE- AND ENGINEERING-RELATED FIELDS
Science- and Engineering-Related Fields
ArchitectureComputer ProgrammingData ProcessingComputer Teacher EducationMathematics Teacher EducationScience Teacher EducationEngineering TechnologiesEngineering and Industrial ManagementElectrical Engineering TechnologyIndustrial Production TechnologiesMechanical Engineering Related TechnologiesMiscellaneous Engineering TechnologiesApplied BiotechnologyNuclear and Industrial Radiology TechnologiesGeneral Medical and Health ServicesCommunication Disorders Sciences and ServicesHealth and Medical Administrative ServicesMedical Assisting ServicesMedical Technologies TechniciansHealth and Medical Preparatory ProgramsNursingPharmacy Pharmaceutical Sciences and AdministrationTreatment Therapy ProfessionsCommunity and Public HealthEnergy and Biologically Based TherapiesMiscellaneous Health Medical Professions
BUSINESS FIELDS
Business FieldsCourt ReportingMedical Office Assistance and AdministrationGeneral BusinessAccountingActuarial ScienceBusiness Management and AdministrationOperations Logistics and E-CommerceBusiness EconomicsMarketingFinanceMarketing ResearchHuman Resources and Personnel ManagementInternational BusinessHospitality ManagementManagement Information Systems and StatisticsMiscellaneous Business
EDUCATION FIELDS
Education Fields
General EducationEducational Administration and SupervisionSchool Student CounselingElementary EducationPhysical and Health Education TeachingEarly Childhood EducationSecondary Teacher EducationSpecial Needs EducationSocial Science or History Teacher EducationTeacher Education: Multiple LevelsLanguage and Drama EducationArt and Music EducationMiscellaneous Education
ARTS, HUMANITIES, AND OTHER FIELDS
Literature and Languages Fields
Linguistics and Comparative Language and LiteratureFrench, German, Latin, and Other Common Foreign Language StudiesOther Foreign LanguagesEnglish Language and LiteratureComposition and Speech
U.S. Census Bureau 23
Liberal Arts and History Fields
Liberal ArtsHumanitiesPhilosophy and Religious StudiesTheology and Religious VocationsHistoryU.S. History
Visual and Performing Arts
Fine ArtsDrama and Theater ArtsMusicVisual and Performing ArtsCommercial Art and Graphic DesignFilm Video and Photographic ArtsArt History and CriticismStudio ArtsMiscellaneous Fine Arts
Communications Fields
CommunicationsJournalismMass MediaAdvertising and Public RelationsCommunication Technologies
Other Fields
Cosmetology Services and Culinary ArtsFamily and Consumer SciencesTechnology Education Industrial ArtsPre-Law and Legal StudiesLibrary ScienceMilitary TechnologiesPhysical Fitness, Parks, Recreation, and LeisureCriminal Justice and Fire ProtectionPublic AdministrationPublic PolicyHuman Services and Community OrganizationSocial WorkConstruction ServicesElectrical and Mechanic Repairs and TechnologiesPrecision ProductionTransportation Sciences and Technologies
24 U.S. Census Bureau
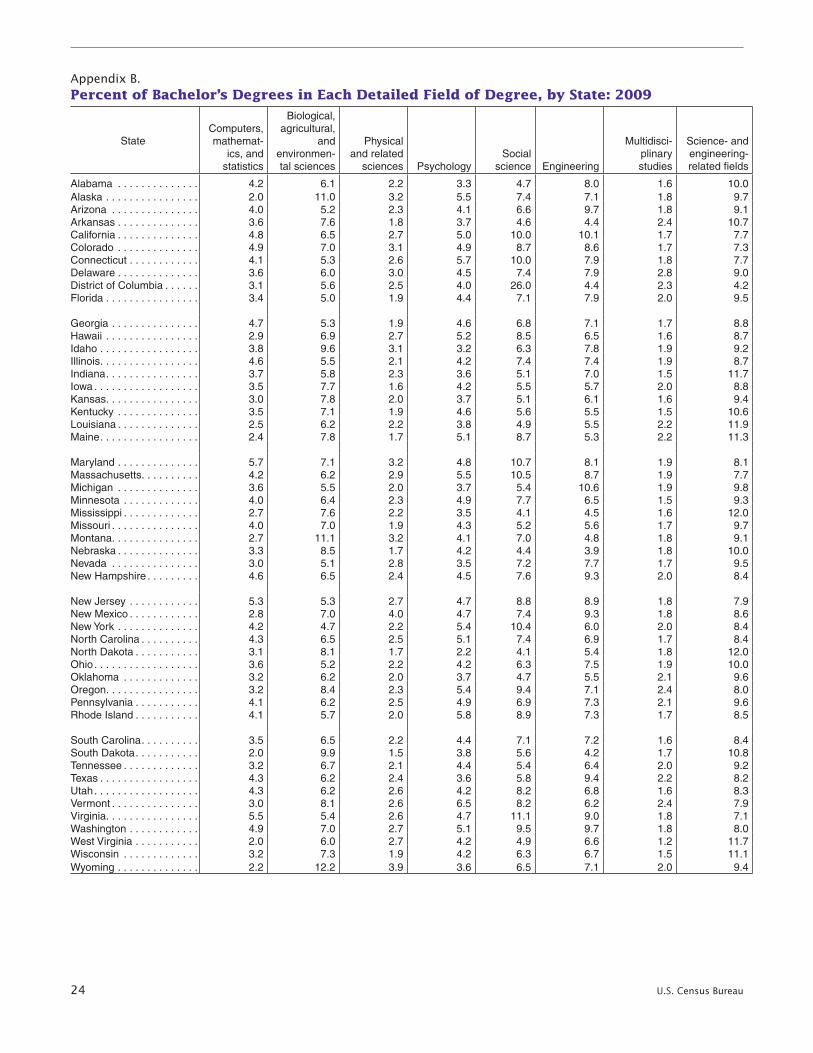
Appendix B. Percent of Bachelor’s Degrees in Each Detailed Field of Degree, by State: 2009
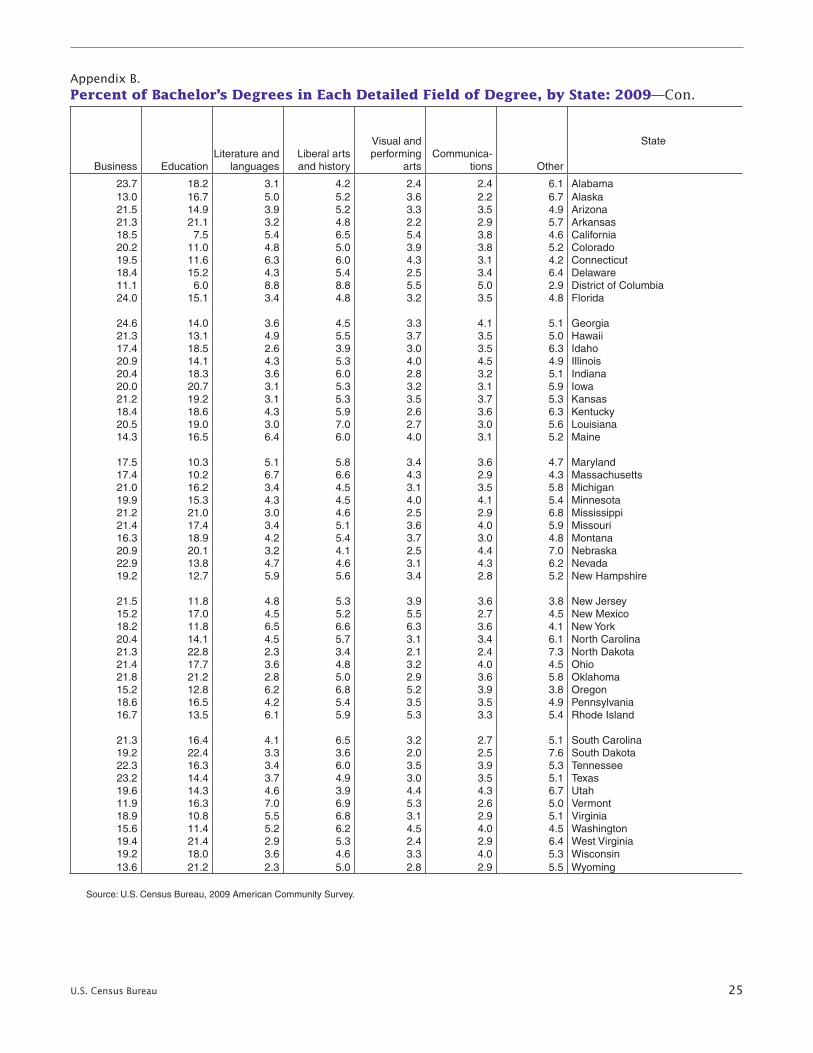
Appendix B. Percent of Bachelor’s Degrees in Each Detailed Field of Degree, by State: 2009—Con.
StateComputers, mathemat-
ics, and statistics
Biological, agricultural,
and environmen-tal sciences
Physical and related
sciences PsychologySocial
science Engineering
Multidisci-plinary studies
Science- and engineering-related fields Business Education
Literature and languages
Liberal arts and history
Visual and performing
artsCommunica-
tions Other
State
Alabama . . . . . . . . . . . . . . 4 .2 6 .1 2 .2 3 .3 4 .7 8 .0 1 .6 10 .0 23 .7 18 .2 3 .1 4 .2 2 .4 2 .4 6 .1 AlabamaAlaska . . . . . . . . . . . . . . . . 2 .0 11 .0 3 .2 5 .5 7 .4 7 .1 1 .8 9 .7 13 .0 16 .7 5 .0 5 .2 3 .6 2 .2 6 .7 AlaskaArizona . . . . . . . . . . . . . . . 4 .0 5 .2 2 .3 4 .1 6 .6 9 .7 1 .8 9 .1 21 .5 14 .9 3 .9 5 .2 3 .3 3 .5 4 .9 ArizonaArkansas . . . . . . . . . . . . . . 3 .6 7 .6 1 .8 3 .7 4 .6 4 .4 2 .4 10 .7 21 .3 21 .1 3 .2 4 .8 2 .2 2 .9 5 .7 ArkansasCalifornia . . . . . . . . . . . . . . 4 .8 6 .5 2 .7 5 .0 10 .0 10 .1 1 .7 7 .7 18 .5 7 .5 5 .4 6 .5 5 .4 3 .8 4 .6 CaliforniaColorado . . . . . . . . . . . . . . 4 .9 7 .0 3 .1 4 .9 8 .7 8 .6 1 .7 7 .3 20 .2 11 .0 4 .8 5 .0 3 .9 3 .8 5 .2 ColoradoConnecticut . . . . . . . . . . . . 4 .1 5 .3 2 .6 5 .7 10 .0 7 .9 1 .8 7 .7 19 .5 11 .6 6 .3 6 .0 4 .3 3 .1 4 .2 ConnecticutDelaware . . . . . . . . . . . . . . 3 .6 6 .0 3 .0 4 .5 7 .4 7 .9 2 .8 9 .0 18 .4 15 .2 4 .3 5 .4 2 .5 3 .4 6 .4 DelawareDistrict of Columbia . . . . . . 3 .1 5 .6 2 .5 4 .0 26 .0 4 .4 2 .3 4 .2 11 .1 6 .0 8 .8 8 .8 5 .5 5 .0 2 .9 District of ColumbiaFlorida . . . . . . . . . . . . . . . . 3 .4 5 .0 1 .9 4 .4 7 .1 7 .9 2 .0 9 .5 24 .0 15 .1 3 .4 4 .8 3 .2 3 .5 4 .8 Florida
Georgia . . . . . . . . . . . . . . . 4 .7 5 .3 1 .9 4 .6 6 .8 7 .1 1 .7 8 .8 24 .6 14 .0 3 .6 4 .5 3 .3 4 .1 5 .1 GeorgiaHawaii . . . . . . . . . . . . . . . . 2 .9 6 .9 2 .7 5 .2 8 .5 6 .5 1 .6 8 .7 21 .3 13 .1 4 .9 5 .5 3 .7 3 .5 5 .0 HawaiiIdaho . . . . . . . . . . . . . . . . . 3 .8 9 .6 3 .1 3 .2 6 .3 7 .8 1 .9 9 .2 17 .4 18 .5 2 .6 3 .9 3 .0 3 .5 6 .3 IdahoIllinois . . . . . . . . . . . . . . . . . 4 .6 5 .5 2 .1 4 .2 7 .4 7 .4 1 .9 8 .7 20 .9 14 .1 4 .3 5 .3 4 .0 4 .5 4 .9 IllinoisIndiana . . . . . . . . . . . . . . . . 3 .7 5 .8 2 .3 3 .6 5 .1 7 .0 1 .5 11 .7 20 .4 18 .3 3 .6 6 .0 2 .8 3 .2 5 .1 IndianaIowa . . . . . . . . . . . . . . . . . . 3 .5 7 .7 1 .6 4 .2 5 .5 5 .7 2 .0 8 .8 20 .0 20 .7 3 .1 5 .3 3 .2 3 .1 5 .9 IowaKansas . . . . . . . . . . . . . . . . 3 .0 7 .8 2 .0 3 .7 5 .1 6 .1 1 .6 9 .4 21 .2 19 .2 3 .1 5 .3 3 .5 3 .7 5 .3 KansasKentucky . . . . . . . . . . . . . . 3 .5 7 .1 1 .9 4 .6 5 .6 5 .5 1 .5 10 .6 18 .4 18 .6 4 .3 5 .9 2 .6 3 .6 6 .3 KentuckyLouisiana . . . . . . . . . . . . . . 2 .5 6 .2 2 .2 3 .8 4 .9 5 .5 2 .2 11 .9 20 .5 19 .0 3 .0 7 .0 2 .7 3 .0 5 .6 LouisianaMaine . . . . . . . . . . . . . . . . . 2 .4 7 .8 1 .7 5 .1 8 .7 5 .3 2 .2 11 .3 14 .3 16 .5 6 .4 6 .0 4 .0 3 .1 5 .2 Maine
Maryland . . . . . . . . . . . . . . 5 .7 7 .1 3 .2 4 .8 10 .7 8 .1 1 .9 8 .1 17 .5 10 .3 5 .1 5 .8 3 .4 3 .6 4 .7 MarylandMassachusetts . . . . . . . . . . 4 .2 6 .2 2 .9 5 .5 10 .5 8 .7 1 .9 7 .7 17 .4 10 .2 6 .7 6 .6 4 .3 2 .9 4 .3 MassachusettsMichigan . . . . . . . . . . . . . . 3 .6 5 .5 2 .0 3 .7 5 .4 10 .6 1 .9 9 .8 21 .0 16 .2 3 .4 4 .5 3 .1 3 .5 5 .8 MichiganMinnesota . . . . . . . . . . . . . 4 .0 6 .4 2 .3 4 .9 7 .7 6 .5 1 .5 9 .3 19 .9 15 .3 4 .3 4 .5 4 .0 4 .1 5 .4 MinnesotaMississippi . . . . . . . . . . . . . 2 .7 7 .6 2 .2 3 .5 4 .1 4 .5 1 .6 12 .0 21 .2 21 .0 3 .0 4 .6 2 .5 2 .9 6 .8 MississippiMissouri . . . . . . . . . . . . . . . 4 .0 7 .0 1 .9 4 .3 5 .2 5 .6 1 .7 9 .7 21 .4 17 .4 3 .4 5 .1 3 .6 4 .0 5 .9 MissouriMontana . . . . . . . . . . . . . . . 2 .7 11 .1 3 .2 4 .1 7 .0 4 .8 1 .8 9 .1 16 .3 18 .9 4 .2 5 .4 3 .7 3 .0 4 .8 MontanaNebraska . . . . . . . . . . . . . . 3 .3 8 .5 1 .7 4 .2 4 .4 3 .9 1 .8 10 .0 20 .9 20 .1 3 .2 4 .1 2 .5 4 .4 7 .0 NebraskaNevada . . . . . . . . . . . . . . . 3 .0 5 .1 2 .8 3 .5 7 .2 7 .7 1 .7 9 .5 22 .9 13 .8 4 .7 4 .6 3 .1 4 .3 6 .2 NevadaNew Hampshire . . . . . . . . . 4 .6 6 .5 2 .4 4 .5 7 .6 9 .3 2 .0 8 .4 19 .2 12 .7 5 .9 5 .6 3 .4 2 .8 5 .2 New Hampshire
New Jersey . . . . . . . . . . . . 5 .3 5 .3 2 .7 4 .7 8 .8 8 .9 1 .8 7 .9 21 .5 11 .8 4 .8 5 .3 3 .9 3 .6 3 .8 New JerseyNew Mexico . . . . . . . . . . . . 2 .8 7 .0 4 .0 4 .7 7 .4 9 .3 1 .8 8 .6 15 .2 17 .0 4 .5 5 .2 5 .5 2 .7 4 .5 New MexicoNew York . . . . . . . . . . . . . . 4 .2 4 .7 2 .2 5 .4 10 .4 6 .0 2 .0 8 .4 18 .2 11 .8 6 .5 6 .6 6 .3 3 .6 4 .1 New YorkNorth Carolina . . . . . . . . . . 4 .3 6 .5 2 .5 5 .1 7 .4 6 .9 1 .7 8 .4 20 .4 14 .1 4 .5 5 .7 3 .1 3 .4 6 .1 North CarolinaNorth Dakota . . . . . . . . . . . 3 .1 8 .1 1 .7 2 .2 4 .1 5 .4 1 .8 12 .0 21 .3 22 .8 2 .3 3 .4 2 .1 2 .4 7 .3 North DakotaOhio . . . . . . . . . . . . . . . . . . 3 .6 5 .2 2 .2 4 .2 6 .3 7 .5 1 .9 10 .0 21 .4 17 .7 3 .6 4 .8 3 .2 4 .0 4 .5 OhioOklahoma . . . . . . . . . . . . . 3 .2 6 .2 2 .0 3 .7 4 .7 5 .5 2 .1 9 .6 21 .8 21 .2 2 .8 5 .0 2 .9 3 .6 5 .8 OklahomaOregon . . . . . . . . . . . . . . . . 3 .2 8 .4 2 .3 5 .4 9 .4 7 .1 2 .4 8 .0 15 .2 12 .8 6 .2 6 .8 5 .2 3 .9 3 .8 OregonPennsylvania . . . . . . . . . . . 4 .1 6 .2 2 .5 4 .9 6 .9 7 .3 2 .1 9 .6 18 .6 16 .5 4 .2 5 .4 3 .5 3 .5 4 .9 PennsylvaniaRhode Island . . . . . . . . . . . 4 .1 5 .7 2 .0 5 .8 8 .9 7 .3 1 .7 8 .5 16 .7 13 .5 6 .1 5 .9 5 .3 3 .3 5 .4 Rhode Island
South Carolina . . . . . . . . . . 3 .5 6 .5 2 .2 4 .4 7 .1 7 .2 1 .6 8 .4 21 .3 16 .4 4 .1 6 .5 3 .2 2 .7 5 .1 South CarolinaSouth Dakota . . . . . . . . . . . 2 .0 9 .9 1 .5 3 .8 5 .6 4 .2 1 .7 10 .8 19 .2 22 .4 3 .3 3 .6 2 .0 2 .5 7 .6 South DakotaTennessee . . . . . . . . . . . . . 3 .2 6 .7 2 .1 4 .4 5 .4 6 .4 2 .0 9 .2 22 .3 16 .3 3 .4 6 .0 3 .5 3 .9 5 .3 TennesseeTexas . . . . . . . . . . . . . . . . . 4 .3 6 .2 2 .4 3 .6 5 .8 9 .4 2 .2 8 .2 23 .2 14 .4 3 .7 4 .9 3 .0 3 .5 5 .1 TexasUtah . . . . . . . . . . . . . . . . . . 4 .3 6 .2 2 .6 4 .2 8 .2 6 .8 1 .6 8 .3 19 .6 14 .3 4 .6 3 .9 4 .4 4 .3 6 .7 UtahVermont . . . . . . . . . . . . . . . 3 .0 8 .1 2 .6 6 .5 8 .2 6 .2 2 .4 7 .9 11 .9 16 .3 7 .0 6 .9 5 .3 2 .6 5 .0 VermontVirginia . . . . . . . . . . . . . . . . 5 .5 5 .4 2 .6 4 .7 11 .1 9 .0 1 .8 7 .1 18 .9 10 .8 5 .5 6 .8 3 .1 2 .9 5 .1 VirginiaWashington . . . . . . . . . . . . 4 .9 7 .0 2 .7 5 .1 9 .5 9 .7 1 .8 8 .0 15 .6 11 .4 5 .2 6 .2 4 .5 4 .0 4 .5 WashingtonWest Virginia . . . . . . . . . . . 2 .0 6 .0 2 .7 4 .2 4 .9 6 .6 1 .2 11 .7 19 .4 21 .4 2 .9 5 .3 2 .4 2 .9 6 .4 West VirginiaWisconsin . . . . . . . . . . . . . 3 .2 7 .3 1 .9 4 .2 6 .3 6 .7 1 .5 11 .1 19 .2 18 .0 3 .6 4 .6 3 .3 4 .0 5 .3 WisconsinWyoming . . . . . . . . . . . . . . 2 .2 12 .2 3 .9 3 .6 6 .5 7 .1 2 .0 9 .4 13 .6 21 .2 2 .3 5 .0 2 .8 2 .9 5 .5 Wyoming
Source: U .S . Census Bureau, 2009 American Community Survey .
U.S. Census Bureau 25
Appendix B. Percent of Bachelor’s Degrees in Each Detailed Field of Degree, by State: 2009
Appendix B. Percent of Bachelor’s Degrees in Each Detailed Field of Degree, by State: 2009—Con.
Business EducationLiterature and
languagesLiberal arts and history
Visual and performing
artsCommunica-
tions Other
State
23 .7 18 .2 3 .1 4 .2 2 .4 2 .4 6 .1 Alabama13 .0 16 .7 5 .0 5 .2 3 .6 2 .2 6 .7 Alaska21 .5 14 .9 3 .9 5 .2 3 .3 3 .5 4 .9 Arizona21 .3 21 .1 3 .2 4 .8 2 .2 2 .9 5 .7 Arkansas18 .5 7 .5 5 .4 6 .5 5 .4 3 .8 4 .6 California20 .2 11 .0 4 .8 5 .0 3 .9 3 .8 5 .2 Colorado19 .5 11 .6 6 .3 6 .0 4 .3 3 .1 4 .2 Connecticut18 .4 15 .2 4 .3 5 .4 2 .5 3 .4 6 .4 Delaware11 .1 6 .0 8 .8 8 .8 5 .5 5 .0 2 .9 District of Columbia24 .0 15 .1 3 .4 4 .8 3 .2 3 .5 4 .8 Florida
24 .6 14 .0 3 .6 4 .5 3 .3 4 .1 5 .1 Georgia21 .3 13 .1 4 .9 5 .5 3 .7 3 .5 5 .0 Hawaii17 .4 18 .5 2 .6 3 .9 3 .0 3 .5 6 .3 Idaho20 .9 14 .1 4 .3 5 .3 4 .0 4 .5 4 .9 Illinois20 .4 18 .3 3 .6 6 .0 2 .8 3 .2 5 .1 Indiana20 .0 20 .7 3 .1 5 .3 3 .2 3 .1 5 .9 Iowa21 .2 19 .2 3 .1 5 .3 3 .5 3 .7 5 .3 Kansas18 .4 18 .6 4 .3 5 .9 2 .6 3 .6 6 .3 Kentucky20 .5 19 .0 3 .0 7 .0 2 .7 3 .0 5 .6 Louisiana14 .3 16 .5 6 .4 6 .0 4 .0 3 .1 5 .2 Maine
17 .5 10 .3 5 .1 5 .8 3 .4 3 .6 4 .7 Maryland17 .4 10 .2 6 .7 6 .6 4 .3 2 .9 4 .3 Massachusetts21 .0 16 .2 3 .4 4 .5 3 .1 3 .5 5 .8 Michigan19 .9 15 .3 4 .3 4 .5 4 .0 4 .1 5 .4 Minnesota21 .2 21 .0 3 .0 4 .6 2 .5 2 .9 6 .8 Mississippi21 .4 17 .4 3 .4 5 .1 3 .6 4 .0 5 .9 Missouri16 .3 18 .9 4 .2 5 .4 3 .7 3 .0 4 .8 Montana20 .9 20 .1 3 .2 4 .1 2 .5 4 .4 7 .0 Nebraska22 .9 13 .8 4 .7 4 .6 3 .1 4 .3 6 .2 Nevada19 .2 12 .7 5 .9 5 .6 3 .4 2 .8 5 .2 New Hampshire
21 .5 11 .8 4 .8 5 .3 3 .9 3 .6 3 .8 New Jersey15 .2 17 .0 4 .5 5 .2 5 .5 2 .7 4 .5 New Mexico18 .2 11 .8 6 .5 6 .6 6 .3 3 .6 4 .1 New York20 .4 14 .1 4 .5 5 .7 3 .1 3 .4 6 .1 North Carolina21 .3 22 .8 2 .3 3 .4 2 .1 2 .4 7 .3 North Dakota21 .4 17 .7 3 .6 4 .8 3 .2 4 .0 4 .5 Ohio21 .8 21 .2 2 .8 5 .0 2 .9 3 .6 5 .8 Oklahoma15 .2 12 .8 6 .2 6 .8 5 .2 3 .9 3 .8 Oregon18 .6 16 .5 4 .2 5 .4 3 .5 3 .5 4 .9 Pennsylvania16 .7 13 .5 6 .1 5 .9 5 .3 3 .3 5 .4 Rhode Island
21 .3 16 .4 4 .1 6 .5 3 .2 2 .7 5 .1 South Carolina19 .2 22 .4 3 .3 3 .6 2 .0 2 .5 7 .6 South Dakota22 .3 16 .3 3 .4 6 .0 3 .5 3 .9 5 .3 Tennessee23 .2 14 .4 3 .7 4 .9 3 .0 3 .5 5 .1 Texas19 .6 14 .3 4 .6 3 .9 4 .4 4 .3 6 .7 Utah11 .9 16 .3 7 .0 6 .9 5 .3 2 .6 5 .0 Vermont18 .9 10 .8 5 .5 6 .8 3 .1 2 .9 5 .1 Virginia15 .6 11 .4 5 .2 6 .2 4 .5 4 .0 4 .5 Washington19 .4 21 .4 2 .9 5 .3 2 .4 2 .9 6 .4 West Virginia19 .2 18 .0 3 .6 4 .6 3 .3 4 .0 5 .3 Wisconsin13 .6 21 .2 2 .3 5 .0 2 .8 2 .9 5 .5 Wyoming
Source: U .S . Census Bureau, 2009 American Community Survey .
StateComputers, mathemat-
ics, and statistics
Biological, agricultural,
and environmen-tal sciences
Physical and related
sciences PsychologySocial
science Engineering
Multidisci-plinary studies
Science- and engineering-related fields
Alabama . . . . . . . . . . . . . . 4 .2 6 .1 2 .2 3 .3 4 .7 8 .0 1 .6 10 .0Alaska . . . . . . . . . . . . . . . . 2 .0 11 .0 3 .2 5 .5 7 .4 7 .1 1 .8 9 .7Arizona . . . . . . . . . . . . . . . 4 .0 5 .2 2 .3 4 .1 6 .6 9 .7 1 .8 9 .1Arkansas . . . . . . . . . . . . . . 3 .6 7 .6 1 .8 3 .7 4 .6 4 .4 2 .4 10 .7California . . . . . . . . . . . . . . 4 .8 6 .5 2 .7 5 .0 10 .0 10 .1 1 .7 7 .7Colorado . . . . . . . . . . . . . . 4 .9 7 .0 3 .1 4 .9 8 .7 8 .6 1 .7 7 .3Connecticut . . . . . . . . . . . . 4 .1 5 .3 2 .6 5 .7 10 .0 7 .9 1 .8 7 .7Delaware . . . . . . . . . . . . . . 3 .6 6 .0 3 .0 4 .5 7 .4 7 .9 2 .8 9 .0District of Columbia . . . . . . 3 .1 5 .6 2 .5 4 .0 26 .0 4 .4 2 .3 4 .2Florida . . . . . . . . . . . . . . . . 3 .4 5 .0 1 .9 4 .4 7 .1 7 .9 2 .0 9 .5
Georgia . . . . . . . . . . . . . . . 4 .7 5 .3 1 .9 4 .6 6 .8 7 .1 1 .7 8 .8Hawaii . . . . . . . . . . . . . . . . 2 .9 6 .9 2 .7 5 .2 8 .5 6 .5 1 .6 8 .7Idaho . . . . . . . . . . . . . . . . . 3 .8 9 .6 3 .1 3 .2 6 .3 7 .8 1 .9 9 .2Illinois . . . . . . . . . . . . . . . . . 4 .6 5 .5 2 .1 4 .2 7 .4 7 .4 1 .9 8 .7Indiana . . . . . . . . . . . . . . . . 3 .7 5 .8 2 .3 3 .6 5 .1 7 .0 1 .5 11 .7Iowa . . . . . . . . . . . . . . . . . . 3 .5 7 .7 1 .6 4 .2 5 .5 5 .7 2 .0 8 .8Kansas . . . . . . . . . . . . . . . . 3 .0 7 .8 2 .0 3 .7 5 .1 6 .1 1 .6 9 .4Kentucky . . . . . . . . . . . . . . 3 .5 7 .1 1 .9 4 .6 5 .6 5 .5 1 .5 10 .6Louisiana . . . . . . . . . . . . . . 2 .5 6 .2 2 .2 3 .8 4 .9 5 .5 2 .2 11 .9Maine . . . . . . . . . . . . . . . . . 2 .4 7 .8 1 .7 5 .1 8 .7 5 .3 2 .2 11 .3
Maryland . . . . . . . . . . . . . . 5 .7 7 .1 3 .2 4 .8 10 .7 8 .1 1 .9 8 .1Massachusetts . . . . . . . . . . 4 .2 6 .2 2 .9 5 .5 10 .5 8 .7 1 .9 7 .7Michigan . . . . . . . . . . . . . . 3 .6 5 .5 2 .0 3 .7 5 .4 10 .6 1 .9 9 .8Minnesota . . . . . . . . . . . . . 4 .0 6 .4 2 .3 4 .9 7 .7 6 .5 1 .5 9 .3Mississippi . . . . . . . . . . . . . 2 .7 7 .6 2 .2 3 .5 4 .1 4 .5 1 .6 12 .0Missouri . . . . . . . . . . . . . . . 4 .0 7 .0 1 .9 4 .3 5 .2 5 .6 1 .7 9 .7Montana . . . . . . . . . . . . . . . 2 .7 11 .1 3 .2 4 .1 7 .0 4 .8 1 .8 9 .1Nebraska . . . . . . . . . . . . . . 3 .3 8 .5 1 .7 4 .2 4 .4 3 .9 1 .8 10 .0Nevada . . . . . . . . . . . . . . . 3 .0 5 .1 2 .8 3 .5 7 .2 7 .7 1 .7 9 .5New Hampshire . . . . . . . . . 4 .6 6 .5 2 .4 4 .5 7 .6 9 .3 2 .0 8 .4
New Jersey . . . . . . . . . . . . 5 .3 5 .3 2 .7 4 .7 8 .8 8 .9 1 .8 7 .9New Mexico . . . . . . . . . . . . 2 .8 7 .0 4 .0 4 .7 7 .4 9 .3 1 .8 8 .6New York . . . . . . . . . . . . . . 4 .2 4 .7 2 .2 5 .4 10 .4 6 .0 2 .0 8 .4North Carolina . . . . . . . . . . 4 .3 6 .5 2 .5 5 .1 7 .4 6 .9 1 .7 8 .4North Dakota . . . . . . . . . . . 3 .1 8 .1 1 .7 2 .2 4 .1 5 .4 1 .8 12 .0Ohio . . . . . . . . . . . . . . . . . . 3 .6 5 .2 2 .2 4 .2 6 .3 7 .5 1 .9 10 .0Oklahoma . . . . . . . . . . . . . 3 .2 6 .2 2 .0 3 .7 4 .7 5 .5 2 .1 9 .6Oregon . . . . . . . . . . . . . . . . 3 .2 8 .4 2 .3 5 .4 9 .4 7 .1 2 .4 8 .0Pennsylvania . . . . . . . . . . . 4 .1 6 .2 2 .5 4 .9 6 .9 7 .3 2 .1 9 .6Rhode Island . . . . . . . . . . . 4 .1 5 .7 2 .0 5 .8 8 .9 7 .3 1 .7 8 .5
South Carolina . . . . . . . . . . 3 .5 6 .5 2 .2 4 .4 7 .1 7 .2 1 .6 8 .4South Dakota . . . . . . . . . . . 2 .0 9 .9 1 .5 3 .8 5 .6 4 .2 1 .7 10 .8Tennessee . . . . . . . . . . . . . 3 .2 6 .7 2 .1 4 .4 5 .4 6 .4 2 .0 9 .2Texas . . . . . . . . . . . . . . . . . 4 .3 6 .2 2 .4 3 .6 5 .8 9 .4 2 .2 8 .2Utah . . . . . . . . . . . . . . . . . . 4 .3 6 .2 2 .6 4 .2 8 .2 6 .8 1 .6 8 .3Vermont . . . . . . . . . . . . . . . 3 .0 8 .1 2 .6 6 .5 8 .2 6 .2 2 .4 7 .9Virginia . . . . . . . . . . . . . . . . 5 .5 5 .4 2 .6 4 .7 11 .1 9 .0 1 .8 7 .1Washington . . . . . . . . . . . . 4 .9 7 .0 2 .7 5 .1 9 .5 9 .7 1 .8 8 .0West Virginia . . . . . . . . . . . 2 .0 6 .0 2 .7 4 .2 4 .9 6 .6 1 .2 11 .7Wisconsin . . . . . . . . . . . . . 3 .2 7 .3 1 .9 4 .2 6 .3 6 .7 1 .5 11 .1Wyoming . . . . . . . . . . . . . . 2 .2 12 .2 3 .9 3 .6 6 .5 7 .1 2 .0 9 .4