Embed Size (px)
Citation preview

Nat. Hazards Earth Syst. Sci., 7, 177–183, 2007www.nat-hazards-earth-syst-sci.net/7/177/2007/© Author(s) 2007. This work is licensedunder a Creative Commons License.
Natural Hazardsand Earth
System Sciences
Field observations of the 17 July 2006 Tsunami in Java
F. Lavigne1, C. Gomez1, M. Giffo 1, P. Wassmer1, C. Hoebreck1, D. Mardiatno2, J. Prioyono2, and R. Paris3
1Laboratoire de Geographie Physique, UMR CNRS 8591, Meudon, France2Research Center for Disasters, University Gadjah Mada, Indonesia3Geolab UMR 6042 CNRS, Clermont-Ferrand, France
Received: 9 October 2006 – Revised: 19 January 2007 – Accepted: 19 January 2007 – Published: 9 February 2007
Abstract. The 17 July 2006, a tsunami struck the southerncoast of Java, Indonesia, causing over 730 casualties. Thetriggering earthquake located 225 km off the coast of Pan-gandaran (9.222◦ S, 107.320◦ E), occurred at 15:19 LT (UTC+7) with a 7.7 magnitude on the Richter scale (Harward Cen-ter and CEA/DAM). In order to calibrate numerical modelsand understand the phenomenon, we conducted a 6-weeksfield survey in July and August 2006 from Cimerak districtin West Java to Gunung Kidul district in Central Java. Datacollection involved measurements of wave height before itsbreaking, flow depth, run-up height, inundation depth, flowdirections and a detailed chronology of the tsunami.
Eyewitnesses accounted for three main waves. The max-imum height of the second wave ranged from 4.2 to 8.6 mbefore its breaking. Maximum flow depth after the wave’sbreaking reached 5 m, and maximum runup heights reached15.7 m. Our run-up values are about 1.5 higher than thoseobtained by the other field surveys carried out until present.They are also higher than the values computed through pre-liminary models.
The 17 July 2006 tsunami has been generated by a“tsunami earthquake”, i.e. an earthquake of low or mediumscale that triggers a tsunami of high magnitude. The run-upheights progressively decreased eastwards, which is consis-tent with a tsunami triggered by fault dislocation, as the onethat hit the Nicaragua’s coast with similar run-up heights onthe 2 September 1992. An earthquake with associated land-slides could also have generated the 17 July 2006 tsunami, asever observed in Papua-New-Guinea in 1998.
Correspondence to:F. Lavigne([email protected])
1 Introduction
A tsunami is an exceptional marine event characterised byhigh energy waves triggered by an earthquake, a volcaniceruption, or a submarine landslide (Fryer et al., 2003; Fineet al., 2004; Maramai et al., 2004; Tinti et al., 2005; An-drade et al., 2006). Around 75% of the Indonesian coastlineis under threat from tsunamis. According to the NOAA (Na-tional Oceanic and Atmospheric Administration), during thelast 450 years tsunamis have taken more than 470 000 livesworldwide. The 26 December 2004 tsunami itself caused230 000 casualties, including 170 000 in Indonesia.
The recent tsunami disaster struck the southern coastof Java on 17 July 2006 (Fig. 1a). At the begin-ning of August, the Indonesian Ministry of Health re-ported that approximately 668 people died, 65 weremissing and 9299 were in-treatment as a result ofthe disaster (http://www.searo.who.int/LinkFiles/Indonesia- EmergencySituationReportESR11 3 Aug-06.pdf). AtPangandaran, the tsunami’s intensity ranked 5 (very strong)on the Sieberg and Ambraseys’ scale (Ambraseys, 1962), andbetween IX and X (destructive to very destructive) on the Pa-padopoulos and Imamura’s scale (2001).
According to the USGS and the French CEA-DASE, thisevent was triggered by a 7.7 magnitude earthquake on theRichter scale that occurred at 8:19 GMT, 15:19 LT. The epi-centre (9.222◦ S, 107.320◦ E) was located 34 km deep belowthe South of Pangandaran coastal resort (USGS).
This study aims at reconstructing the tsunami dynamicsand phenomenology based on field measurements – waveand run-up heights, flow and inundation depth, flow direc-tions – and testimonies along the coast over 230 km fromCimerak to Gunung Kidul (Fig. 1b). Data were collected bya French-Indonesian team during a period of 6 weeks fieldsurvey started on 18 July 2006, one day after the event.
Published by Copernicus GmbH on behalf of the European Geosciences Union.
178 F. Lavigne et al.: Field observations of the 17 July 2006 Tsunami in Java
0
4
8
C
Indian Ocean
B
A
16h19
16h2016h18
16h30
8°S
7°S
6°S
5°S
9°S
107°E 109°E 111°E 113°E
024
6651
0224
019
Kebo
ngca
rik
024
5688
028
8131
Wid
ara
Payu
ng
032
2425
033
0502
0343
556
0398
353
0425
508
0406
612
026
6496
026
6373
0239
071
0236
545
YOGYAKARTA
KEBUMENPANGANDARAN CILACAP PURWOREJO
Gla
gah
Perm
isan
Cila
cap
city
Run
up h
eigh
t (m
a.s
.l)
0 1 2 km Kara
ngbo
long
Keta
wan
g
Con
got
Buge
lSa
mas
Kebu
ruha
n
Baro
nKu
kup
Krak
al04
5628
1
0450
304
0452
000
0418
958
0393
525
0380
163
030
8560
029
7234
Bunt
on
026
2066
025
2616
Longitude UTM49 (m)
0 20 40 km
0242
457
0241
405
0240
312
Kara
ngsa
ri
0 100 200 km
Village
033
1550
Purin
g
0378
139
Longitude UTM49 (m)
Earthquakelocation
(m = 7.7)
Direction of the tsunami wave propagation
Pertamina PLTU
12
16
Indian Ocean
Pangandaran BayPangandaran Pa
nanj
ung
Para
ngtri
tis
JAVA
16h19 Arrival time of the tsunami
Ayah
NusaKambangan
Bat
ukar
asKr
apya
k
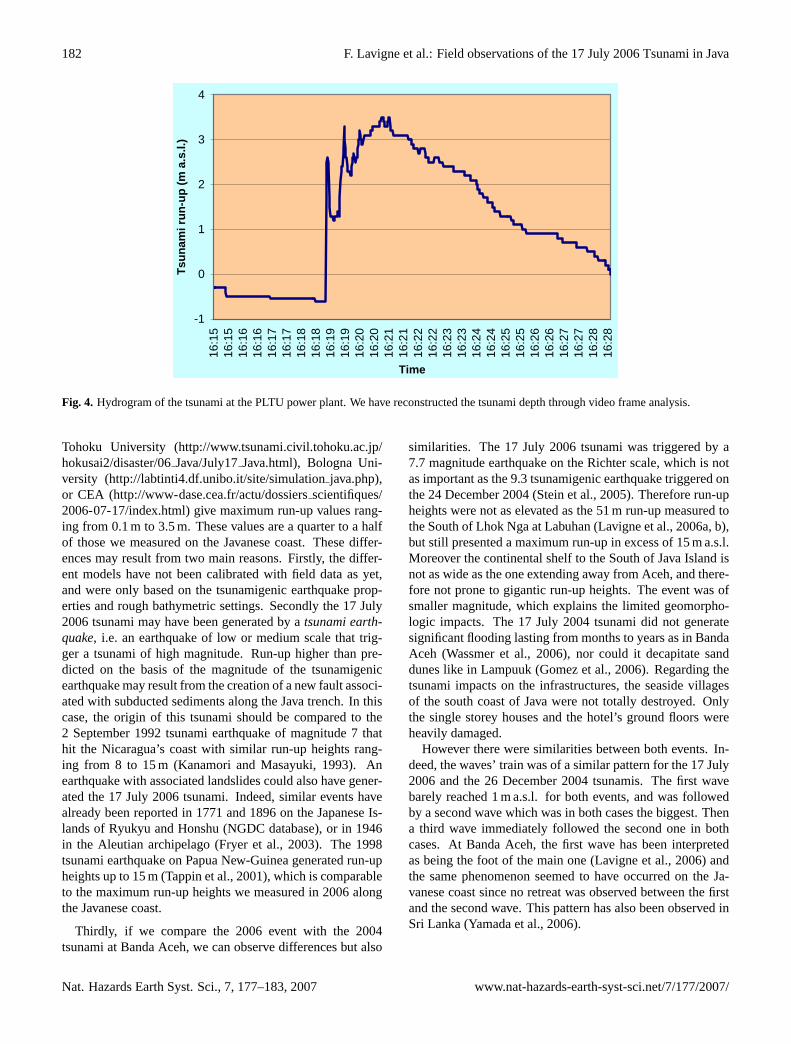
Fig. 1. Runup heights distribution of the 17 July 2006 tsunami along the south coast of Java.(A) Location of the field study in Java withindication of the 17 July 2004 earthquake epicentre.(B) Runup heights distribution and arrival time at selected spots along the Javanesecoastline.(C) Zoom at the Pangandaran district.
2 Methods
We carried out 152 measurements of wave height beforeits breaking (i.e. height of thetsunami bore), run-up heightand flow-depth distribution along the affected coastline (Sup-plement File: http://www.nat-hazards-earth-syst-sci.net/7/177/2007/nhess-7-177-2007-supplement.pdf). The run-upheight is defined as the maximum vertical elevation of a pointlocated on initially dry land that is inundated by the waves(Synolakis et al., 2005). The flow depth is measured from theground. Using a laser range finder (LaserAce 300), we mea-sured the highest marks on scorched trees – excluding palmtrees and coconut trees that can bent – and the upper limit ofdestruction traces and mud lines on buildings and hill slopes.For these measures, the bench mark calculated from astro-nomical tide tables is the mean sea level. We also collectedflow directions attested by tilted trunks, pillars, and debris us-ing compass and GPS. In selected locations, we measured theinundation depth, defined as the maximum horizontal pene-
tration of waves in the direction normal to the beach duringthe flooding (Synolakis et al., 2005).
On top of this data collection, we conducted interviewsamong local inhabitants in order to better understand theevent’s phenomenology. Questions included chronology,timing of the event, wave direction offshore, approximatevalues of the wave heights before their breaking and of theleading depression wave (i.e. the length of the sea reces-sion). The tsunami breaking lines and other measured datawere also confirmed through these interviews. The 17 Julytsunami’s witnesses are numerous and their testimonies areall in agreement. Furthermore, the surveys were carried outin the immediate aftermath of the disaster. Common prob-lems of forgetfulness or the influence of unreliable eyewit-nesses, influenced by an official version of the event weretherefore reduced.
Nat. Hazards Earth Syst. Sci., 7, 177–183, 2007 www.nat-hazards-earth-syst-sci.net/7/177/2007/
F. Lavigne et al.: Field observations of the 17 July 2006 Tsunami in Java 179
3 Results
3.1 Wave and run-up height, tsunami intensity and over-land flow depth
Along the south coast of Java between Batukaras and Baron(Fig. 1), the maximum height of the waves before theirbreaking ranged from 4.2 to 8.6 m, and the measured run-up heights (RU) ranged from less than 1 m to 15.7 m (Sup-plement File: http://www.nat-hazards-earth-syst-sci.net/7/177/2007/nhess-7-177-2007-supplement.pdf). The Fig. 1bclearly distinguishes two coastal regions based on the run-upheights of the tsunami: at Pangandaran district, wave heightsas well as run-up heights commonly exceeded 8 m, with anintensity of 2.5–3 on the Imamura and Ida’s scale (Ida, 1956).East from Cilacap, the run-up values were lower than 6 m andthe intensity less than 2.5.
We measured the maximum run-up of the 17 17 July 2006tsunami on Nusa Kambangan Island. Near the prison of Per-misan, a 5 m to 8 m-high wave broke on the beach (Fig. 1b).Then the overland flow inundated tens or hundreds of meters,due to high cliffs and coastal hillslopes. The run-up valuesmeasured on these cliffs ranged from 8.2 to 15.7 m (Supple-ment File: http://www.nat-hazards-earth-syst-sci.net/7/177/2007/nhess-7-177-2007-supplement.pdf).
The highest run-up heights on the island of Java were mea-sured at Batukaras (RU=10.4 m; Fig. 1b). In this area, thewave broke overland as far as 120 m from the shoreline, andthe inundation depth reached hundreds of meters. At Kebon-carik (Fig. 1c) and near Krapyak (RU=9.2 m at both sites),the wave broke on the beach and rapidly decreased landwardas far as a few hundred meters, due to a raise in the localtopography.
Other beaches were not so heavily affected by the tsunamiwaves. For example, the Pantai Timur (East Beach) of thePangandaran peninsula (Fig. 1c) suffered from limited waveheights and inundation depth due to the urbanization of thePantai Barat (West Beach). The high density of hotels alongthe seashore played the role of a barrier, so that the secondrange of hotel was not destroyed. The Pantai Timur wastherefore only affected by refracted and diffracted waves.Five kilometres eastward, however, the local effects due tothe peninsula are mitigated and the maximum run-up mea-sured at Karangsari exceeded 8 m again.
In Cilacap city, run-up heights did not exceed 3 m,barely reaching the beach ridge in front of the build-ings of Pertamina. Indeed, the city was protected bythe island of Nusa Kambangan. To the East of Cilacap,maximum run-up heights were measured at Pantai Ayah(6.7 m), where the tsunami wave broke on the wall alongthe beach. Then a progressive decrease of the run-upis observed along the coastline towards the East (Supple-ment File: http://www.nat-hazards-earth-syst-sci.net/7/177/2007/nhess-7-177-2007-supplement.pdf), until South of Yo-gyakarta city. Measured run-up in this area did not exceed
4 m, except in specific spots where the tsunami wave reachedthe top of the sand dunes up to 6.7 m a.s.l. (e.g. at Ketapangbeach).
3.2 Tsunami arrival time, chronology, velocity, and flow di-rections
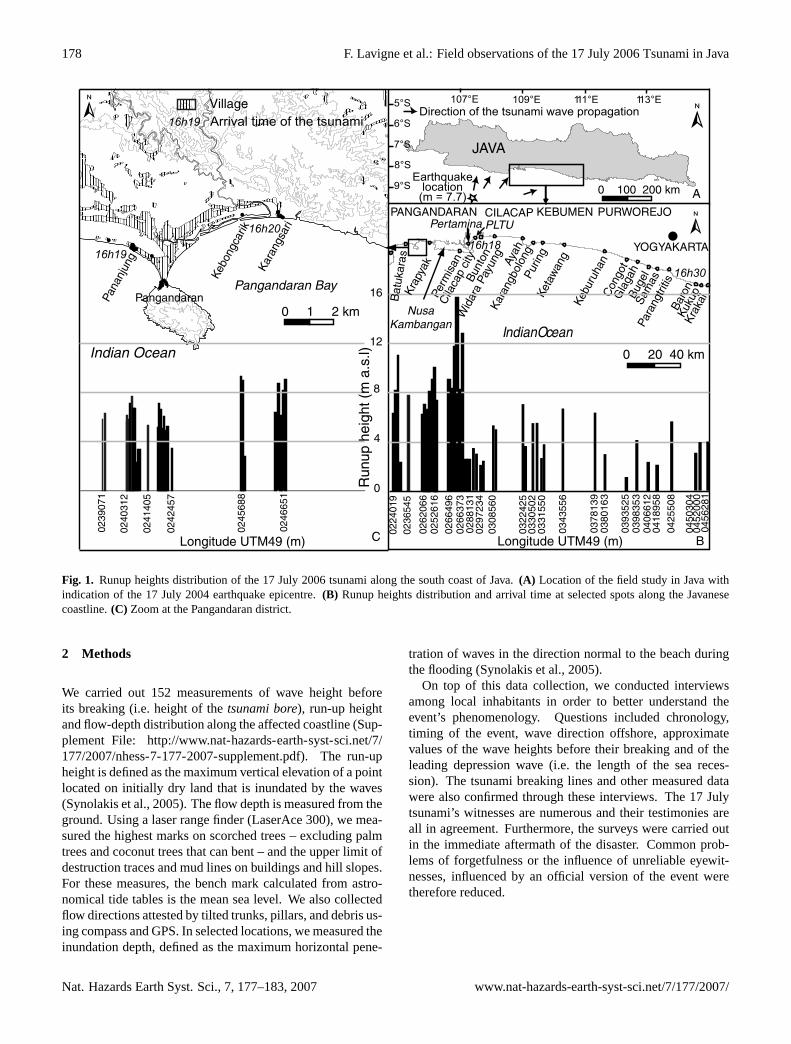
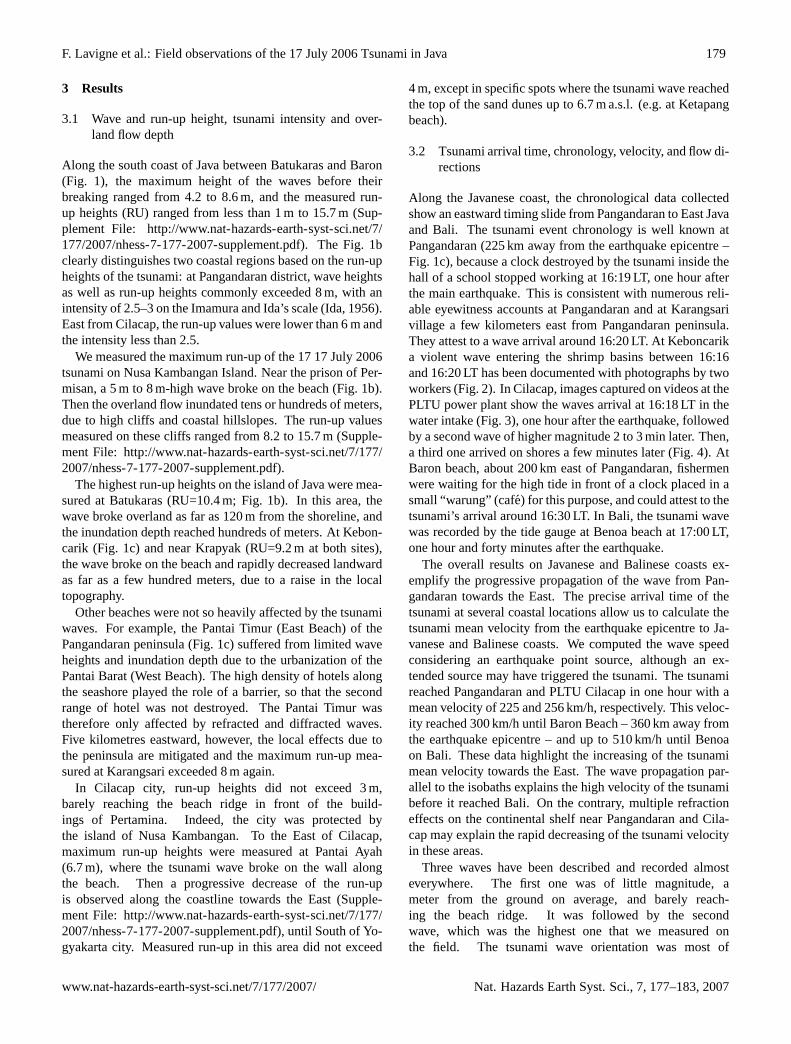
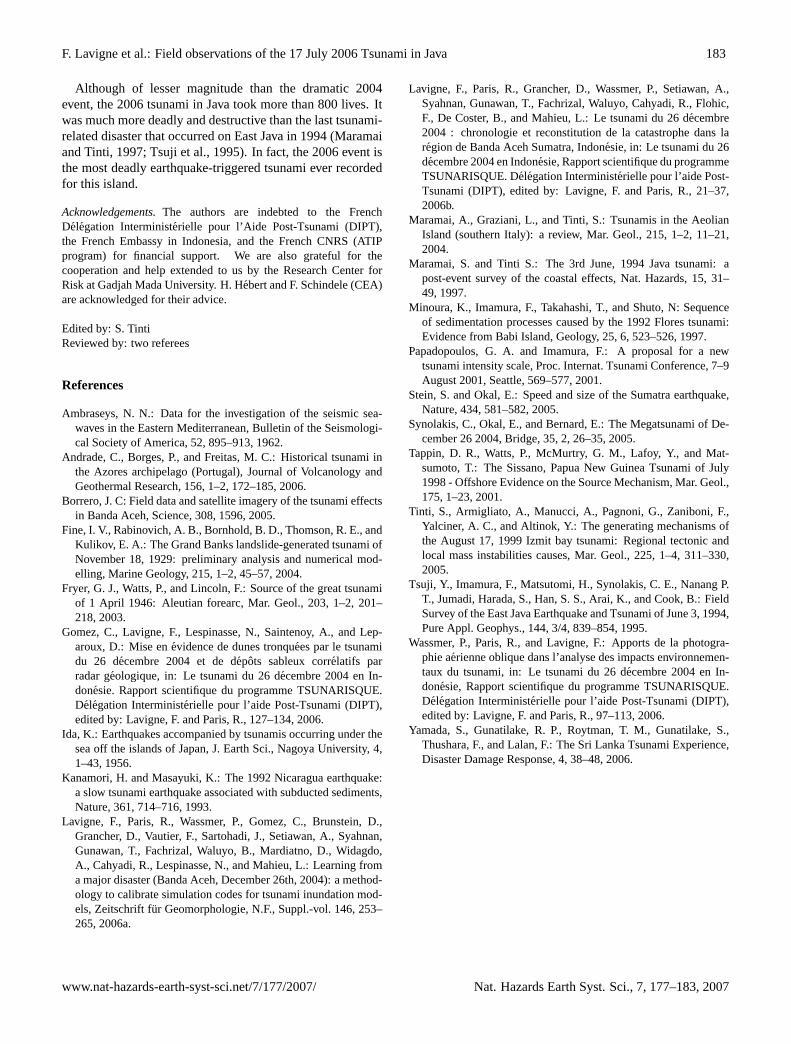
Along the Javanese coast, the chronological data collectedshow an eastward timing slide from Pangandaran to East Javaand Bali. The tsunami event chronology is well known atPangandaran (225 km away from the earthquake epicentre –Fig. 1c), because a clock destroyed by the tsunami inside thehall of a school stopped working at 16:19 LT, one hour afterthe main earthquake. This is consistent with numerous reli-able eyewitness accounts at Pangandaran and at Karangsarivillage a few kilometers east from Pangandaran peninsula.They attest to a wave arrival around 16:20 LT. At Keboncarika violent wave entering the shrimp basins between 16:16and 16:20 LT has been documented with photographs by twoworkers (Fig. 2). In Cilacap, images captured on videos at thePLTU power plant show the waves arrival at 16:18 LT in thewater intake (Fig. 3), one hour after the earthquake, followedby a second wave of higher magnitude 2 to 3 min later. Then,a third one arrived on shores a few minutes later (Fig. 4). AtBaron beach, about 200 km east of Pangandaran, fishermenwere waiting for the high tide in front of a clock placed in asmall “warung” (cafe) for this purpose, and could attest to thetsunami’s arrival around 16:30 LT. In Bali, the tsunami wavewas recorded by the tide gauge at Benoa beach at 17:00 LT,one hour and forty minutes after the earthquake.
The overall results on Javanese and Balinese coasts ex-emplify the progressive propagation of the wave from Pan-gandaran towards the East. The precise arrival time of thetsunami at several coastal locations allow us to calculate thetsunami mean velocity from the earthquake epicentre to Ja-vanese and Balinese coasts. We computed the wave speedconsidering an earthquake point source, although an ex-tended source may have triggered the tsunami. The tsunamireached Pangandaran and PLTU Cilacap in one hour with amean velocity of 225 and 256 km/h, respectively. This veloc-ity reached 300 km/h until Baron Beach – 360 km away fromthe earthquake epicentre – and up to 510 km/h until Benoaon Bali. These data highlight the increasing of the tsunamimean velocity towards the East. The wave propagation par-allel to the isobaths explains the high velocity of the tsunamibefore it reached Bali. On the contrary, multiple refractioneffects on the continental shelf near Pangandaran and Cila-cap may explain the rapid decreasing of the tsunami velocityin these areas.
Three waves have been described and recorded almosteverywhere. The first one was of little magnitude, ameter from the ground on average, and barely reach-ing the beach ridge. It was followed by the secondwave, which was the highest one that we measured onthe field. The tsunami wave orientation was most of
www.nat-hazards-earth-syst-sci.net/7/177/2007/ Nat. Hazards Earth Syst. Sci., 7, 177–183, 2007
180 F. Lavigne et al.: Field observations of the 17 July 2006 Tsunami in Java
Fig. 2. Tsunami wave entering a shrimp basin (tambak)at Kebon-carik between 16:16 and 16:20(B, C). View of the same basin onthe 30 August 2006. Photos: Pusat Studi Bencana(A, B) and F.Lavigne(C).
the time perpendicular to the coast, excepted for punctualvariations due to local topographic settings (SupplementFile: http://www.nat-hazards-earth-syst-sci.net/7/177/2007/nhess-7-177-2007-supplement.pdf). On some beaches, athird wave has been reported by eyewitnesses. Its directiondiffered from the preceding one, suggesting that it was gen-erated by reflection effects on the cliffs (e.g. at Keboncarikand Karangsari).
4 Discussion and conclusion
One and a half year after the megatsunami that destroyed theAceh coastal regions, a new tsunami damaged the Javanese
south coast on the 17 July 2006. This tsunami, which wastriggered by a 7.7 earthquake located 220 km off Java Is-land, travelled the Indian Ocean with a velocity ranging from225 km/h – as far as West Java coast – to 510 km/h as faras Bali. The tsunami propagation was faster than the one ofthe 2 September 1992 tsunami that hit the Nicaragua’s coast(180 km/h: Kanamori and Masayuki, 1993). The epicenterof the 1992 earthquake was located at only 60 km from thecoast. the velocity of the tsunami was therefore reduced byrefraction effects. On the contrary, the velocity of the July2006 tsunami wave was much lower than the one of the 26December 2004 tsunami. On the same distance of 255 km,the 2004 tsunami reached the coastline of Banda Aceh at600 km/h (Borrero, 2005), whereas the July 2006 reachedCilacap city at only 256 km/h, due to lesser ocean depth.
During the 17 July 2006 event, thedrawdownrelated to theleading depression wave was followed by two main waves.A third wave reported by testimonies in several sites resultedfrom wave reflexion which should have enhanced the localeffects of the tsunami, as reported on Babi Island on Floresin 1992 (Minoura et al., 1997).
The maximum wave height was 8.6 m and the maximumrun-up height reached 15.7 m a.s.l. Our results highlightthree main issues.
Firstly, our results are not consistent with the different re-sults presented until now on the internet by most of the othersurvey teams. Indeed, the other teams have underestimatedthe maximum run-up heights. For example, the team con-ducted by Widjo Kongko (BPPT) measured a maximum run-up height reaching only 3.6 m a.s.l (http://ioc3.unesco.org/itic/files/tsunami-java170706e.pdf). As for the team of theIndonesian Geological Survey, they measured a 3.3 m max-imum in Pangandaran (http://www.grdc.esdm.go.id), whichis less than half the values we measured. The closest valuesto ours were found by the team led by Prof. Tsuji, which re-ported run-up heights that are close to the one we have mea-sured, e.g. 7.7 m at Pangandaran (http://aeic.bmg.go.id/file/Pangadaranreporten.pdf).
These discrepencies may be explained by two factors. Ona first hand it is necessary to do a quick field survey beforethe tsunamis’ marks are erased, but several weeks of fieldsurveys are needed to get accurate data. It is necessary toconduct a long and cautious survey in order to collect themaximum data, since it can vary spatially. Indeed local to-pographical effects – e.g.wave traps– are numerous andgreatly influence the results. On the other hand, the otherfield survey teams focused on flow depth measurements anddid not take into account the tsunami height before the break-ing of the highest wave – i.e. thetsunami bore– on the beachor further inland. Yet, we observed great variations betweenboth types of data, which varied by as much as twice withina few meters on Ayah Beach. The highest wave broke on theprotection dyke scorching a few trees at more than 6 m a.s.l.At the back, all the other trees were scorched at less than
Nat. Hazards Earth Syst. Sci., 7, 177–183, 2007 www.nat-hazards-earth-syst-sci.net/7/177/2007/

F. Lavigne et al.: Field observations of the 17 July 2006 Tsunami in Java 181
Fig. 3. Tsunami waves at the PLTU power plant.(A) Tsunami bore of the first wave at 16:18:53 LT.(B) Drawdown following the first waveat 16:19:02 LT.(C) Second wave at 16:19:24 LT.(D) Maximum flow depth at 16:20:25 LT. See some PLTU staff carried by the tsunami wave.(E) Drawdown at 16:24:24 LT.(F) Normal sea level at 16:28:40 LT. Courtesy: Ir. Chandra Dwi Putra, MM, PLTU Cilacap.
3.5 m. This breaking line has been confirmed by eyewitnessaccounts.
Secondly, this tsunami was without any doubt bigger thanpredicted by theoretical models. Indeed, the measured run-
up heights are not consistent with the one predicted bytheoretical models presented on the ITIC-UNESCO web-site (International Tsunami Information Center:http://ioc3.unesco.org/itic/). Indeed, the preliminary models run at
www.nat-hazards-earth-syst-sci.net/7/177/2007/ Nat. Hazards Earth Syst. Sci., 7, 177–183, 2007
182 F. Lavigne et al.: Field observations of the 17 July 2006 Tsunami in Java
-1
0
1
2
3
4
16:1
516
:15
16:1
616
:16
16:1
716
:17
16:1
816
:18
16:1
916
:19
16:2
016
:20
16:2
116
:21
16:2
216
:22
16:2
316
:23
16:2
416
:24
16:2
516
:25
16:2
616
:26
16:2
716
:27
16:2
816
:28
Time
Tsun
ami r
un-u
p (m
a.s
.l.)
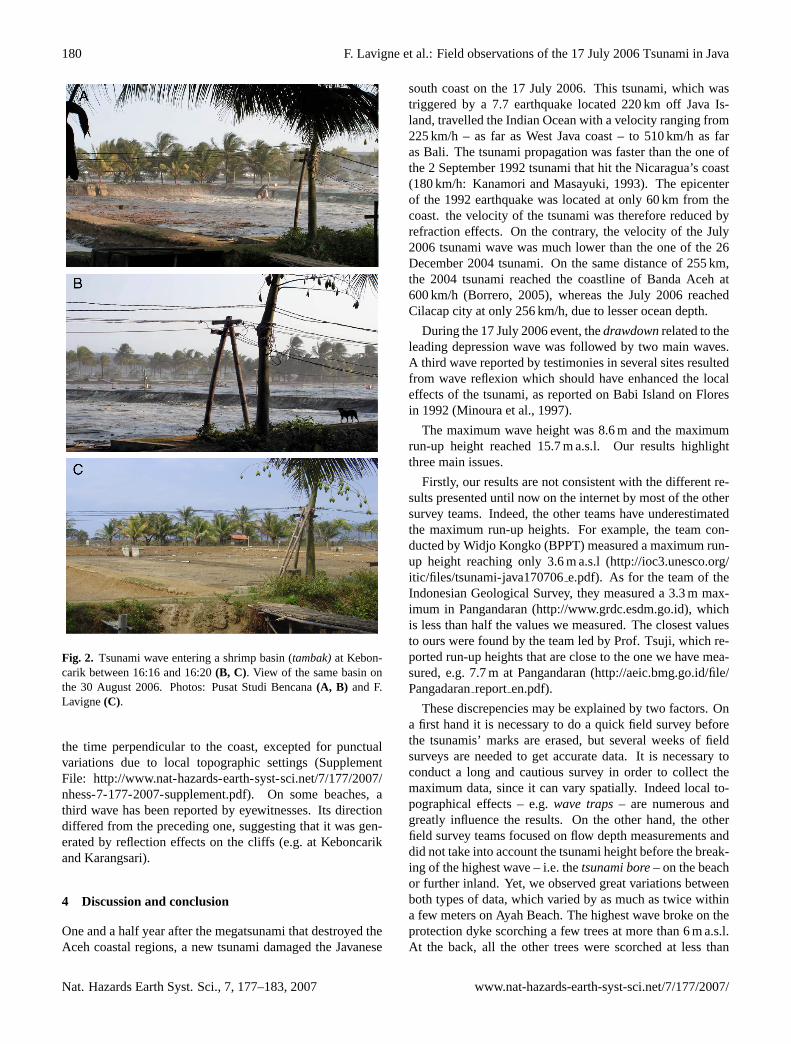
Fig. 4. Hydrogram of the tsunami at the PLTU power plant. We have reconstructed the tsunami depth through video frame analysis.
Tohoku University (http://www.tsunami.civil.tohoku.ac.jp/hokusai2/disaster/06Java/July17Java.html), Bologna Uni-versity (http://labtinti4.df.unibo.it/site/simulationjava.php),or CEA (http://www-dase.cea.fr/actu/dossiersscientifiques/2006-07-17/index.html) give maximum run-up values rang-ing from 0.1 m to 3.5 m. These values are a quarter to a halfof those we measured on the Javanese coast. These differ-ences may result from two main reasons. Firstly, the differ-ent models have not been calibrated with field data as yet,and were only based on the tsunamigenic earthquake prop-erties and rough bathymetric settings. Secondly the 17 July2006 tsunami may have been generated by atsunami earth-quake, i.e. an earthquake of low or medium scale that trig-ger a tsunami of high magnitude. Run-up higher than pre-dicted on the basis of the magnitude of the tsunamigenicearthquake may result from the creation of a new fault associ-ated with subducted sediments along the Java trench. In thiscase, the origin of this tsunami should be compared to the2 September 1992 tsunami earthquake of magnitude 7 thathit the Nicaragua’s coast with similar run-up heights rang-ing from 8 to 15 m (Kanamori and Masayuki, 1993). Anearthquake with associated landslides could also have gener-ated the 17 July 2006 tsunami. Indeed, similar events havealready been reported in 1771 and 1896 on the Japanese Is-lands of Ryukyu and Honshu (NGDC database), or in 1946in the Aleutian archipelago (Fryer et al., 2003). The 1998tsunami earthquake on Papua New-Guinea generated run-upheights up to 15 m (Tappin et al., 2001), which is comparableto the maximum run-up heights we measured in 2006 alongthe Javanese coast.
Thirdly, if we compare the 2006 event with the 2004tsunami at Banda Aceh, we can observe differences but also
similarities. The 17 July 2006 tsunami was triggered by a7.7 magnitude earthquake on the Richter scale, which is notas important as the 9.3 tsunamigenic earthquake triggered onthe 24 December 2004 (Stein et al., 2005). Therefore run-upheights were not as elevated as the 51 m run-up measured tothe South of Lhok Nga at Labuhan (Lavigne et al., 2006a, b),but still presented a maximum run-up in excess of 15 m a.s.l.Moreover the continental shelf to the South of Java Island isnot as wide as the one extending away from Aceh, and there-fore not prone to gigantic run-up heights. The event was ofsmaller magnitude, which explains the limited geomorpho-logic impacts. The 17 July 2004 tsunami did not generatesignificant flooding lasting from months to years as in BandaAceh (Wassmer et al., 2006), nor could it decapitate sanddunes like in Lampuuk (Gomez et al., 2006). Regarding thetsunami impacts on the infrastructures, the seaside villagesof the south coast of Java were not totally destroyed. Onlythe single storey houses and the hotel’s ground floors wereheavily damaged.
However there were similarities between both events. In-deed, the waves’ train was of a similar pattern for the 17 July2006 and the 26 December 2004 tsunamis. The first wavebarely reached 1 m a.s.l. for both events, and was followedby a second wave which was in both cases the biggest. Thena third wave immediately followed the second one in bothcases. At Banda Aceh, the first wave has been interpretedas being the foot of the main one (Lavigne et al., 2006) andthe same phenomenon seemed to have occurred on the Ja-vanese coast since no retreat was observed between the firstand the second wave. This pattern has also been observed inSri Lanka (Yamada et al., 2006).
Nat. Hazards Earth Syst. Sci., 7, 177–183, 2007 www.nat-hazards-earth-syst-sci.net/7/177/2007/
F. Lavigne et al.: Field observations of the 17 July 2006 Tsunami in Java 183
Although of lesser magnitude than the dramatic 2004event, the 2006 tsunami in Java took more than 800 lives. Itwas much more deadly and destructive than the last tsunami-related disaster that occurred on East Java in 1994 (Maramaiand Tinti, 1997; Tsuji et al., 1995). In fact, the 2006 event isthe most deadly earthquake-triggered tsunami ever recordedfor this island.
Acknowledgements.The authors are indebted to the FrenchDelegation Interministerielle pour l’Aide Post-Tsunami (DIPT),the French Embassy in Indonesia, and the French CNRS (ATIPprogram) for financial support. We are also grateful for thecooperation and help extended to us by the Research Center forRisk at Gadjah Mada University. H. Hebert and F. Schindele (CEA)are acknowledged for their advice.
Edited by: S. TintiReviewed by: two referees
References
Ambraseys, N. N.: Data for the investigation of the seismic sea-waves in the Eastern Mediterranean, Bulletin of the Seismologi-cal Society of America, 52, 895–913, 1962.
Andrade, C., Borges, P., and Freitas, M. C.: Historical tsunami inthe Azores archipelago (Portugal), Journal of Volcanology andGeothermal Research, 156, 1–2, 172–185, 2006.
Borrero, J. C: Field data and satellite imagery of the tsunami effectsin Banda Aceh, Science, 308, 1596, 2005.
Fine, I. V., Rabinovich, A. B., Bornhold, B. D., Thomson, R. E., andKulikov, E. A.: The Grand Banks landslide-generated tsunami ofNovember 18, 1929: preliminary analysis and numerical mod-elling, Marine Geology, 215, 1–2, 45–57, 2004.
Fryer, G. J., Watts, P., and Lincoln, F.: Source of the great tsunamiof 1 April 1946: Aleutian forearc, Mar. Geol., 203, 1–2, 201–218, 2003.
Gomez, C., Lavigne, F., Lespinasse, N., Saintenoy, A., and Lep-aroux, D.: Mise enevidence de dunes tronquees par le tsunamidu 26 decembre 2004 et de depots sableux correlatifs parradar geologique, in: Le tsunami du 26 decembre 2004 en In-donesie. Rapport scientifique du programme TSUNARISQUE.Delegation Interministerielle pour l’aide Post-Tsunami (DIPT),edited by: Lavigne, F. and Paris, R., 127–134, 2006.
Ida, K.: Earthquakes accompanied by tsunamis occurring under thesea off the islands of Japan, J. Earth Sci., Nagoya University, 4,1–43, 1956.
Kanamori, H. and Masayuki, K.: The 1992 Nicaragua earthquake:a slow tsunami earthquake associated with subducted sediments,Nature, 361, 714–716, 1993.
Lavigne, F., Paris, R., Wassmer, P., Gomez, C., Brunstein, D.,Grancher, D., Vautier, F., Sartohadi, J., Setiawan, A., Syahnan,Gunawan, T., Fachrizal, Waluyo, B., Mardiatno, D., Widagdo,A., Cahyadi, R., Lespinasse, N., and Mahieu, L.: Learning froma major disaster (Banda Aceh, December 26th, 2004): a method-ology to calibrate simulation codes for tsunami inundation mod-els, Zeitschrift fur Geomorphologie, N.F., Suppl.-vol. 146, 253–265, 2006a.
Lavigne, F., Paris, R., Grancher, D., Wassmer, P., Setiawan, A.,Syahnan, Gunawan, T., Fachrizal, Waluyo, Cahyadi, R., Flohic,F., De Coster, B., and Mahieu, L.: Le tsunami du 26 decembre2004 : chronologie et reconstitution de la catastrophe dans laregion de Banda Aceh Sumatra, Indonesie, in: Le tsunami du 26decembre 2004 en Indonesie, Rapport scientifique du programmeTSUNARISQUE. Delegation Interministerielle pour l’aide Post-Tsunami (DIPT), edited by: Lavigne, F. and Paris, R., 21–37,2006b.
Maramai, A., Graziani, L., and Tinti, S.: Tsunamis in the AeolianIsland (southern Italy): a review, Mar. Geol., 215, 1–2, 11–21,2004.
Maramai, S. and Tinti S.: The 3rd June, 1994 Java tsunami: apost-event survey of the coastal effects, Nat. Hazards, 15, 31–49, 1997.
Minoura, K., Imamura, F., Takahashi, T., and Shuto, N: Sequenceof sedimentation processes caused by the 1992 Flores tsunami:Evidence from Babi Island, Geology, 25, 6, 523–526, 1997.
Papadopoulos, G. A. and Imamura, F.: A proposal for a newtsunami intensity scale, Proc. Internat. Tsunami Conference, 7–9August 2001, Seattle, 569–577, 2001.
Stein, S. and Okal, E.: Speed and size of the Sumatra earthquake,Nature, 434, 581–582, 2005.
Synolakis, C., Okal, E., and Bernard, E.: The Megatsunami of De-cember 26 2004, Bridge, 35, 2, 26–35, 2005.
Tappin, D. R., Watts, P., McMurtry, G. M., Lafoy, Y., and Mat-sumoto, T.: The Sissano, Papua New Guinea Tsunami of July1998 - Offshore Evidence on the Source Mechanism, Mar. Geol.,175, 1–23, 2001.
Tinti, S., Armigliato, A., Manucci, A., Pagnoni, G., Zaniboni, F.,Yalciner, A. C., and Altinok, Y.: The generating mechanisms ofthe August 17, 1999 Izmit bay tsunami: Regional tectonic andlocal mass instabilities causes, Mar. Geol., 225, 1–4, 311–330,2005.
Tsuji, Y., Imamura, F., Matsutomi, H., Synolakis, C. E., Nanang P.T., Jumadi, Harada, S., Han, S. S., Arai, K., and Cook, B.: FieldSurvey of the East Java Earthquake and Tsunami of June 3, 1994,Pure Appl. Geophys., 144, 3/4, 839–854, 1995.
Wassmer, P., Paris, R., and Lavigne, F.: Apports de la photogra-phie aerienne oblique dans l’analyse des impacts environnemen-taux du tsunami, in: Le tsunami du 26 decembre 2004 en In-donesie, Rapport scientifique du programme TSUNARISQUE.Delegation Interministerielle pour l’aide Post-Tsunami (DIPT),edited by: Lavigne, F. and Paris, R., 97–113, 2006.
Yamada, S., Gunatilake, R. P., Roytman, T. M., Gunatilake, S.,Thushara, F., and Lalan, F.: The Sri Lanka Tsunami Experience,Disaster Damage Response, 4, 38–48, 2006.
www.nat-hazards-earth-syst-sci.net/7/177/2007/ Nat. Hazards Earth Syst. Sci., 7, 177–183, 2007


![[PPT]PowerPoint Presentation - NOAA Center for Tsunami …nctr.pmel.noaa.gov/.../RutgersTsunami.ppt · Web view2013/06/13 · SeaSonde and Tide Gauge Tsunami Observations New Jersey](https://img.pdfslide.us/doc/110x75/5ad66f4d7f8b9a6b668ba396/pptpowerpoint-presentation-noaa-center-for-tsunami-nctrpmelnoaagov.jpg)