Embed Size (px)
Citation preview

``
Field Evaluation of the Performance of the RTU Challenge Unit: Daikin Rebel March 2015
Prepared for the U.S. Department of Energy
By:
W Wang
S Katipamula
H Ngo
RM Underhill
Pacific Northwest National Laboratory

Field Evaluation of the Performance of the RTU Challenge Unit: Daikin Rebel Page 2
Disclaimer
This document was prepared as an account of work sponsored by the United States Government. While this
document is believed to contain correct information, neither the United States Government nor any agency
thereof, nor Pacific Northwest National Laboratory, nor any of their employees, makes any warranty, express or
implied, or assumes any legal responsibility for the accuracy, completeness, or usefulness of any information,
apparatus, product, or process disclosed, or represents that its use would not infringe privately owned rights.
Reference herein to any specific commercial product, process, or service by its trade name, trademark,
manufacturer, or otherwise, does not constitute or imply its endorsement, recommendation, or favoring by the
United States Government or any agency thereof, or Pacific Northwest National Laboratory. The views and
opinions of authors expressed herein do not necessarily state or reflect those of the United States Government
or any agency thereof or Pacific Northwest National Laboratory.
The work described in this report was funded by the U.S. Department of Energy under Contract No. DE-AC05-
76RL01830.

Field Evaluation of the Performance of the RTU Challenge Unit: Daikin Rebel Page 3
Acknowledgements
The authors would like to acknowledge the Buildings Technologies Office of the U.S. Department of Energy (DOE) Office of Energy Efficiency and Renewable Energy for supporting the research and development effort. The authors would also like to thank Charles Llenza, Technical Development Manager at DOE; Linda Sandahl (Program Manager at PNNL) for thoughtful comments and insights; Nick Fernandez for the technical review of the report; and Sue Arey for editorial support. We also want to thank Ken Hellewell and Danny Miller from Transformative Wave Technologies of Kent, WA for their help in installing and commissioning the metering and monitoring equipment on the two rooftop units. We also would like to thank Mike Faas and Randy Tremain from Publix for their cooperation and willingness to allow DOE and PNNL to monitor the rooftop units.
For more information contact:
Tech Demo Reports Mail Stop EE-5B US Department of Energy 1000 Independence Ave, SW Washington, DC 20585-0121 [email protected]

Field Evaluation of the Performance of the RTU Challenge Unit: Daikin Rebel Page 4
Executive Summary In 2011, the U.S. Department of Energy’s Building Technology Office (DOE’s BTO), with help from the Better
Buildings Alliance (BBA) members, developed a specification (RTU Challenge) for high performance rooftop air-
conditioning units (RTUs) with capacity ranges between 10 and 20 tons (DOE 2013). Daikin’s Rebel RTU was
recognized by DOE in May 2012 as first to meet the RTU Challenge specifications. This report documents the
testing of a Rebel unit and a standard reference unit in the field and compares the seasonal efficiency of the two
units.
The goal of the RTU Challenge demonstration was to estimate the seasonal performance of the RTU Challenge
unit and the annual savings that could be achieved by installing the challenge unit instead of an alternate
standard unit. The demonstration took place at two grocery stores located in New Smyrna Beach and Port
Orange, Florida. The Rebel unit was installed as a replacement of an existing unit in July 2013 at the New
Smyrna Beach store. The reference unit was an existing rooftop unit in the Port Orange store that is about 6
years old. The reference unit had two compressors for staged cooling and a constant-speed supply fan. Both
units had the same rated cooling capacity of 7.5 tons and served each store’s office spaces with similar
footprints.
A set of sensors were used to measure the dry-bulb temperature and the relative humidity for the outdoor-air,
the return-air, the mixed-air, and the supply-air. RTU total power consumption was also measured using a power
transducer. These sensor measurements, together with a number of control signals were monitored at 1-minute
intervals from August 2013 to September 2014.
The average daily energy efficiency ratio (EER) was computed for each unit using the monitored data. The ratio
of the average EER for the two units varied between 0.9 and 2.4. The Rebel unit had a higher daily EER than the
reference unit for almost all days. The EER ratio increased as the daily average outdoor-air temperature
decreased, as expected. This means that RTUs with variable-speed compressors and variable-speed fans, like
Rebel, had better part-load efficiencies than units using constant speed supply fans and ON/OFF controls for
compressors. The average of the daily EER ratio for all days was approximately 1.38, which means that on
average, the daily EER of the Rebel unit was 38% higher than that of the reference unit.
In addition to daily EER, the seasonal cooling efficiency was also calculated over the entire monitoring period.
Over the 12-month period, the reference unit and the Rebel unit had seasonal EERs of 8.3 and 10.9, respectively.
The Rebel unit’s seasonal EER was about 31% higher than the reference unit. This result was slightly lower than
the findings from our previous simulation work, which estimated that in hot and humid climates, Rebel would
consume about 40% less electricity than a RTU with a constant-speed supply fan and a single-stage mechanical
cooling. Possible reasons for this difference included: 1) the load that the two units in the field served were
different, while the two units in the simulation served the same load; and 2) the reference unit had higher
operating efficiency than the number used in the simulation runs.
The annual energy savings from the rooftop unit replacement with Rebel was about 16,000 kWh, which
translated to roughly 3.8 years in simple payback.
Field Evaluation of the Performance of the RTU Challenge Unit: Daikin Rebel Page 5
It was a challenge to find two units running in two different spaces that had served similar cooling loads.
Although two grocery stores with similar layouts were selected, the monitored data showed that they had
noticeably different load profiles. Therefore, absolute energy savings between the two units could not be
calculated. If the absolute savings measurement were desirable, then the existing RTU will have to be
monitored for 1 year, followed by a year of monitoring of the Rebel unit after it replaces the existing RTU.
Other issues related to the installation of the Rebel unit included:
The Rebel unit came with a different base footprint from the existing Lennox unit. Although a curb
adapter was provided, it left the unit suspended over the front side of the base, and was ultimately
supported by blocks.
Although the new Rebel unit was considerably heavier than the unit it replaced, no roof reinforcement
was needed.
The store that had the Rebel unit reported no comfort issues either positive or negative. The Rebel unit had a
Micro Tech III controller, which was not compatible with the existing Emerson E2 BX controller, or the Emerson
building automation system (BAS). Emerson had an application for the Micro Tech II controller but not for Micro
Tech III. Therefore, the store had to install an output board with a set of dry contacts to control the RTU indoor
fan. They also had to add an interface to monitor the indoor fan “On/Off” status and the supply/return
temperatures, but they could not control any cooling/heating/speed control functions. All operations were
controlled directly by the Micro Tech III controller in the unit with input from the zone temperature sensor.
The start-up and commissioning of the Rebel was challenging because the local Daikin distributor who installed
the unit had very little experience in installing these new units. In addition, the controller had many features
with a large instruction/operation manual, which made it difficult to properly configure. It took the distributor a
couple of trips to configure the unit correctly, but after it was configured, the unit, as well as its metering and
monitoring system worked as expected. Over the last 12-month period, maintenance requirements for this unit
were similar to the other units.
Field Evaluation of the Performance of the RTU Challenge Unit: Daikin Rebel Page 6
Contents
Executive Summary ..................................................................................................................................... 4
Acronyms .................................................................................................................................................... 9
I. Introduction ..................................................................................................................................... 10
II. Background ...................................................................................................................................... 11
A. Standard Reference RTU .......................................................................................................................... 11
B. Opportunity .............................................................................................................................................. 12
III. Measurement and Verification Project Plan ................................................................................... 14
A. Technical Objectives ................................................................................................................................. 14
B. Demonstration Project Plan ..................................................................................................................... 14
C. Technology Description – RTU Challenge Unit - Rebel ............................................................................ 15
IV. Measurement and Verification Evaluation Plan .............................................................................. 16
A. Description of the Demonstration Sites ................................................................................................... 16
B. Metering Plan ........................................................................................................................................... 16
C. Monitoring Plan ........................................................................................................................................ 18
D. Air Flow Characterization ......................................................................................................................... 19
E. Estimation of Seasonal Performance ....................................................................................................... 21
F. Evaluation Plan ......................................................................................................................................... 23
V. Results .............................................................................................................................................. 25
A. Verification of Rebel Controls .................................................................................................................. 25
B. Energy Efficiency Reductions ................................................................................................................... 27
C. Annual Energy and Cost Savings .............................................................................................................. 32
VI. Conclusions ...................................................................................................................................... 33
VII. References ....................................................................................................................................... 34
Field Evaluation of the Performance of the RTU Challenge Unit: Daikin Rebel Page 7
Figures Figure 1: Daikin Rebel Unit (Source: Daikin). Reprinted with permission from Daikin .......................................... 15
Figure 2: Schematic of tested RTU Configuration with Sensor Locations ............................................................... 17
Figure 3: Schematic of the RTU Monitoring ............................................................................................................ 19
Figure 4: Air Flow Measurement in the Field .......................................................................................................... 20
Figure 5: Correlation of Measured Air Flow as a Function of the Fan Speed for the Rebel Unit ............................ 21
Figure 6: Rebel Unit Profiles of Supply-fan Speed, Space Temperature and Operational Mode on a Typical Day
(10/16/2013) ........................................................................................................................................................... 26
Figure 7: Rebel Unit Profiles of Supply-air Temperature, Percentage Cooling, and Operational Mode on a Typical
Day (05/05/2014) .................................................................................................................................................... 27
Figure 8: Compressor and Fan Run Time for the Reference unit when the Unit is either in Cooling or Ventilation
Mode (but not heating mode) ................................................................................................................................. 28
Figure 9: Compressor and Fan Run Time for the Rebel Unit when the Unit is in either Cooling or Ventilation
Mode (but not heating mode) ................................................................................................................................. 28
Figure 10: Comparison of Energy Efficiency Ratio of the Reference Unit and the Rebel Unit ................................ 29
Figure 11: Comparison of Daily Energy Efficiency Ratio of the Reference Unit and the Rebel Unit as a Function of
Daily Average Outdoor-air Temperature for the Monitoring Period ...................................................................... 30
Figure 12: Ratio of Rebel EER and the Reference Unit as a Function of Daily Average Outdoor-air Temperature 31

Field Evaluation of the Performance of the RTU Challenge Unit: Daikin Rebel Page 8
Tables Table 1: Details of the Reference Unit and Rebel Unit ............................................................................................ 16
Table 2: List of Monitored Control Signals .............................................................................................................. 18
Table 3: Comparison of Seasonal EER between Rebel and the Reference Unit ...................................................... 32

Field Evaluation of the Performance of the RTU Challenge Unit: Daikin Rebel Page 9
Acronyms AHRI Air-Conditioning, Heating and Refrigeration Institute ARC advanced rooftop control ASHRAE American Society of Heating, Refrigeration and Air-Conditioning Engineers BAS building automation system BBA Better Building Alliance BTO Buildings Technologies Office CFM cubic feet per minute DOE U.S. Department of Energy ECM electronic commuted motor EER energy efficiency ratio EIA Energy Information Administration ERV energy recovery ventilator GPG Green Proving Ground GSA General Services Administration HVAC heating, ventilation and air conditioning IEER integrated energy efficiency ratio M&V measurement and verification RTU rooftop air-conditioning unit

Field Evaluation of the Performance of the RTU Challenge Unit: Daikin Rebel Page 10
I. Introduction Packaged rooftop air-conditioning units (RTUs) are used in 46% (2.1 million) of all commercial buildings, serving
over 60% (39 billion square feet) of the commercial building floor space in the U.S. (EIA 2003). The primary
energy consumption associated with RTUs is over 2.6 quads annually. Therefore, even a small improvement in
efficiency or part-load operation of these units can lead to significant reductions of energy use and carbon
emissions.
Starting in 2011, the U.S. Department of Energy’s Building Technology Office (DOE’s BTO) funded a series of
projects related to RTUs. Some projects were to improve the operating efficiency of the existing RTUs while
others were focused on improving the operating efficiency of new units. This report documents the testing of a
state-of-art RTU unit and a standard reference unit in the field and compares the seasonal efficiency of the two
units. Section III provides the background for the work. Section IV describes the measurement and verification
plan for the field tests. Section V describes the measurement and verification evaluation plan. The results are
described in Section VI. The lessons learned and recommendations for future work are described in Section VII.
A list of references is provided in Section VIII.

Field Evaluation of the Performance of the RTU Challenge Unit: Daikin Rebel Page 11
II. Background In 2011, the U.S. Department of Energy’s Building Technology Office (DOE’s BTO), with help from the Better
Buildings Alliance (BBA) members, developed a specification for high performance rooftop air-conditioning units
(also known as the RTU Challenge) with capacity ranges between 10 and 20 tons (DOE 2013). The goal of the
RTU Challenge was to spur the market introduction of cost-effective, high-performance commercial rooftop unit
air conditioners. Two manufacturers produced rooftop air-conditioning units (RTUs) – Daikin Rebel and Carrier
WeatherExpert - that met RTU Challenge specifications. These units were tested and rated at the standard
conditions by manufacturers and both had integrated energy efficiency ratio (IEER) of over 18. Because the
performance ratings at standard conditions do not necessarily represent the “true” seasonal energy efficiency,
field tests were needed to provide more realistic performance comparisons in “real” conditions. This report
provides results from comparing the seasonal field performance of a Rebel unit and a standard reference RTU.
A. Standard Reference RTU
The rated energy efficiency ratio (EER) of a reference unit in the field, depending on the vintage, can range from
a low of 8 to a high of 12. In addition to the EER, most reference RTUs in the field have the following
characteristics:
• Standard RTU typically has a constant-speed supply fan. When the RTU operates, its supply fan
always runs at full speed (100%) regardless of the operational modes (e.g., heating, cooling and
ventilation).
• Smaller RTUs that are less than 7.5 tons, usually have a single-stage cooling. A single-stage unit has
one constant-speed compressor cycling on and off to meet the space cooling loads. Units 7.5 tons
and larger usually have two or more stages of cooling. A multi-stage unit has two or more constant-
speed compressors of equal size. The switch from first stage to second (or higher) stage can be
based on either the space temperature deviation from the cooling set point or the time lag for not
reaching the cooling set point.
• Most RTUs in the field use a gas furnace for heating; some use electric resistance heat. The gas
furnace cycles on and off to meet the space heating loads.
• Most RTUs 7.5 tons or larger are required to have air-side economizers in most regions of the country. The only exceptions are smaller units (< 7.5 tons) and the units located in hot/humid climates (e.g. Florida, Texas, etc.).

Field Evaluation of the Performance of the RTU Challenge Unit: Daikin Rebel Page 12
B. Opportunity
Most reference RTUs in the field have constant-speed supply fans designed to provide ventilation at the design
rate at all times when the fan is operating. Although there are a number of hours during the day when a building
may not be fully occupied or the need for ventilation is lower than the maximum design rate, the ventilation
rate cannot be adjusted easily with a constant-speed fan. Supply fan energy savings can be achieved by
modulating the supply fan speed during the ventilation mode and potentially during mechanical heating/cooling,
if the unit has multiple stages of heating/cooling. When the building is occupied and the unit is in ventilation
mode, the role of the supply fan is to provide fresh air to maintain proper indoor air quality in the spaces that it
is serving.
Similarly, most RTUs in the field have constant-speed compressors that cannot modulate to provide the required
capacity; therefore, they are cycled on and off. Cycling creates inefficiencies. Significant savings are possible
with a unit that has a variable- or multi-speed fan and variable-speed compressors.
Wang and Katipamula (2013) conducted a detailed simulation of one RTU Challenge unit (Rebel) and compared
its performance to a number of reference units for a prototypical big-box retail store. The model used the new
performance curves along with detailed energy management control code to estimate the energy consumption
of the prototypical big-box retail store in three locations (Houston, Log Angeles and Chicago). The energy
consumption of the big-box store using the Rebel unit was then compared to a big-box store that used three
different reference units. The first reference unit (Reference 1) represented existing rooftop units (RTUs) in the
field, so it was considered as the baseline to estimate potential energy savings from other RTU replacement
options. The second reference unit (Reference 2) represented RTUs in the market that just meet the current
(2013) Federal regulations for commercial equipment standards. It was used as the baseline to estimate the
potential for energy savings from Rebel units in comparison with new RTUs that meet the minimum efficiency
requirements. The third reference unit (Reference 3) represented the latest ASHRAE 90.1-2010 requirements.
For RTUs with cooling capacity greater than 11,000 Btu/h, ASHRAE 90.1-2010 (ASHRAE 2010) requires two-speed
fan control or variable-speed fan control.
The following conclusions were drawn from the comparison of annual energy cost for RTU Challenge unit with
the three reference units:
• Using Reference 1 as the baseline, Rebel units led to about 45% lower heating, ventilation and air
conditioning (HVAC) energy costs (electricity and gas combined) in Houston and Los Angeles, and
33% lower cost in Chicago. The HVAC electricity cost savings was around 50% for all three locations.
• Using Reference 2 as the baseline, Rebel units led to about 37% lower HVAC energy costs in
Houston, 40% lower cost in Los Angeles, and 29% lower cost in Chicago. The HVAC electricity cost
savings was 40%, 42%, and 50%, respectively in those three locations.
• Using Reference 3 as the baseline, Rebel units led to about 27% lower HVAC energy costs in
Houston, 18% lower cost in Los Angeles, and 15% lower cost in Chicago. The HVAC electricity cost
savings was 30%, 19%, and 28%, respectively in those three locations.

Field Evaluation of the Performance of the RTU Challenge Unit: Daikin Rebel Page 13
Based on the simulation results, the Rebel RTU Challenge unit, if widely adopted, could lead to significant
energy, cost and emission reductions. Because the cost of these units was not available and because the costs
would be specific to a given installation, no attempt was made to estimate the potential payback periods
associated with any of the three reference scenarios. However, if the incremental cost for any of the three
reference cases is known, one can easily estimate a simple payback period.

Field Evaluation of the Performance of the RTU Challenge Unit: Daikin Rebel Page 14
III. Measurement and Verification Project Plan This section describes the measurement and verification project plan that addressed the technical objectives of
the field demonstration. This section describes the technical objectives, the plan to execute the technical
objectives and a description of the RTU Challenge unit.
A. Technical Objectives
The objective of this field demonstration was to quantify the seasonal energy efficiency of the RTU Challenge
unit and also to compare its seasonal performance with a standard reference unit in the field.
B. Demonstration Project Plan
The rated efficiency of the RTU Challenge unit was 50% above the current ASHRAE 90.1-2013 Standard. Because
the standard rated test and the IEER (integrated energy efficiency ratio) tests did not represent the “true”
seasonal energy efficiency, field tests and demonstrations were needed to show the potential savings of these
high performance units. The planned field demonstrations provided more realistic performance comparisons in
“real” conditions. The field demonstrations allowed for: 1) comparison of the annual performance of the RTU
Challenge unit to a standard unit it was replacing; 2) verification of the proper operation of RTU Challenge unit
controls, such as economizer controls and variable-speed fan controls; 3) identification of non-performance
related issues, such as maintenance requirements; and 4) capturing lessons learned.
Because only a limited number of field demonstrations could be done, the demonstrations needed to be
representative of the potential applications of RTU Challenge units. Packaged RTUs were more widely used in
retail and office type buildings. Considering that the Better Building Alliance (BBA) members were the driving
force of adopting RTU Challenge units, retail buildings were expected to be the predominant building type in
field demonstrations. Therefore, this demonstration focused on a retail building.
The goal of the RTU Challenge demonstration was to estimate the seasonal performance of the RTU Challenge
unit and the annual savings that could be achieved by installing the challenge unit instead of an alternate
standard unit. The standard unit (the unit that would have been installed if not for the RTU Challenge unit) was
metered and monitored over 9 months before the RTU Challenge unit was installed to establish both the
seasonal efficiency and annual energy consumption. However, this approach could have taken over 24 months
to complete the collection and the analysis of data. To reduce the field evaluation period to between 12 and 18
months, an alternate approach was devised.
The alternate approach relied on monitoring two units simultaneously: 1) standard unit and 2) RTU Challenge
unit. Because monitoring of the RTU Challenge unit and the standard unit was done simultaneously, the field
measurement and verification was completed within 12 months. This alternate approach worked because the
two monitored RTUs were the same size, had the same external pressure drop and served spaces with similar
load profiles. For this alternate approach, two identical retail facilities were selected in the same location with
RTUs that served identical spaces, with one facility having the standard unit and the other the RTU Challenge
unit. If this alternate approach was not feasible, then two similar spaces in the same building could also have
been used, with one space having a standard unit and other space having the RTU Challenge unit.

Field Evaluation of the Performance of the RTU Challenge Unit: Daikin Rebel Page 15
If the two spaces had similar loads, operating hours and space temperature set points, the alternate approach
provided reasonable results. However, if the space loads were different, the annual energy consumption
(required to estimate the annual savings) could have higher uncertainty. Irrespective of space load, the
comparison of seasonal efficiency between the two units was still valid.
C. Technology Description – RTU Challenge Unit - Rebel
The Daikin Rebel packaged rooftop system was the first unit to meet DOE’s RTU Challenge specification. The 10-
ton air-conditioner has two compressors with one variable-speed inverter-driven compressor, composite
condenser fan(s) with variable-speed ECM (electronic commuted motor) motors, MicroTech® III controls that
can be integrated with optional BACnet or LonMark building automation systems, and electronic expansion
valves (Figure 1). Unlike the conventional units, Rebel modulates the supply fan in response to the zone
conditions and modulates the compressor speed to maintain supply-air temperature set points.
Figure 1: Daikin Rebel Unit (Source: Daikin). Reprinted with permission from Daikin

Field Evaluation of the Performance of the RTU Challenge Unit: Daikin Rebel Page 16
IV. Measurement and Verification Evaluation Plan The measurement and verification (M&V) evaluation plan used to quantify the seasonal performance of the RTU
Challenge and the standard reference unit is described in this section.
A. Description of the Demonstration Sites
The demonstration took place at two grocery stores located in New Smyrna Beach and Port Orange, Florida.
Table 1 provides the details of the two units. The Rebel unit (Model# DPS007A) was installed as a replacement
of an existing unit in July 2013 at the New Smyrna Beach store. The reference unit (Lennox Model # LCA-090H4)
was an existing rooftop unit in the Port Orange store that had been in the field for about 6 years. The reference
unit had two compressors for staged cooling and a constant-speed supply fan. The two units had a rated cooling
capacity of 7.5 tons. The reference unit had electric resistance heating coils with a capacity of 22.5 kW while the
Rebel had 18-kW heating capacity. The two units served the store’s office spaces with similar footprints. These
two stores were 12 miles apart so the climate conditions were similar. They also had very similar operating
schedules: the New Smyrna Beach store operated from 7:00 a.m. to 10:00 p.m., Monday to Sunday; the Port
Orange store operated from 7:00 a.m. to 10:00 p.m., Monday to Saturday, and from 7:00 a.m. to 9:00 p.m. on
Sunday.
Table 1: Details of the Reference Unit and Rebel Unit
RTU Monitored Model Vintage
Rated Cooling Capacity (ton) Rated EER
Rated Heating Capacity (kW)
Design Air Flow Rate (CFM)
Reference Lennox Model # LCA-090H4 2008 7.5 11.1 22.5 2860
Rebel Daikin Model# DPS007A 2013 7.5 12.5 18 3530
B. Metering Plan
Both Rebel and the reference units in the field were similarly configured, as shown in Figure 2. The schematic
(Figure 2) also shows the locations of the sensors for the two units. Outdoor-air came from the energy recovery
ventilator (ERV) through the return-air ductwork. The ERV operation was interlocked with the RTU operations.
The ERV reduced the sensible cooling loads on the unit while meeting ventilation requirements (outdoor air).

Field Evaluation of the Performance of the RTU Challenge Unit: Daikin Rebel Page 17
Figure 2: Schematic of tested RTU Configuration with Sensor Locations
The following sensors were used in the field test:
For both units, a set of sensors were used to measure the dry-bulb temperature and the relative
humidity for the outdoor-air, the return-air, the air discharged from ERV, the mixed-air, and the supply-
air. The accuracy of the temperature sensor was ±0.36°F in the operating temperature range (40°F to
120°F). The accuracy of the relative humidity sensor was ±5% in the operating relative humidity range
(0% to 100%).
RTU total power consumption was measured using a power transducer with an accuracy of ±0.5% of
reading.
In addition to temperature, relative humidity and power measurements, a number of control signals were either
directly monitored from the RTU controller (for the reference unit) or through a BACnet protocol translator
device that is connected to the RTU controller (for the Rebel unit). Table 1 lists all control signals that were
monitored. Although Figure 2 does not show a supply-fan power measurement sensor, supply-fan power was
indirectly measured. It was computed using the total unit power measurement when the compressor was not
running for the standard unit with a constant-speed supply fan. For the variable-speed supply fan, the supply
fan power consumption was estimated based on the fan speed and fan affinity laws. Note that supply fan
power was not required for performance characterization or energy savings estimate.
Outdoor
Air
Supply
Air
Return Air
Hea
ting
Coi
l
DX
Coo
ling
C
oil
Fil
ter
Supply
Fan
ERV
temperature sensor
relative humidity sensor
KW power consumption
Sensor labels:
KW
total RTU power
Mixed
Air

Field Evaluation of the Performance of the RTU Challenge Unit: Daikin Rebel Page 18
Table 2: List of Monitored Control Signals
Control Signal Description Applicable RTUs
FanCall Fan signal from thermostat Reference
CoolCall1 1st stage cooling signal from thermostat Reference
CoolCall2 2nd stage cooling signal from thermostat Reference
HeatCall1 1st stage heating signal from thermostat Reference
HeatCall2 2nd stage heating signal from thermostat Reference
UnitState One of eight unit operating stages (1-8): 1 (off), 2
(startup), 3 (recirculation), 4 (fan only), 5 (minimum
supply-air temperature set point) , 6 (heating), 7
(economizer), and 8 (mechanical cooling)
Rebel
FanSpeed Speed of the variable-speed drive for the supply fan Rebel
ClgStatus Indication of whether or not mechanical cooling is
currently allowed. If cooling is disabled, the reason is
indicated (1 = enabled)
Rebel
ClgCapacity The percentage of the unit maximum cooling
capacity currently operating
Rebel
ControllerDown Indication of loss of communications for monitoring Rebel, Reference
C. Monitoring Plan
The monitoring plan consisted of collection of data at each RTU at 1-minute intervals, storing it locally on the
roof, and streaming the data in real time to the Cloud for analysis. The cellular network was used to upload data
from each site to the Cloud. In case of loss of communication between the site and Cloud, the logged data was
stored locally at each site with a maximum storage capacity of a few days. Figure 3 schematically shows the
entire monitoring process. Each of the two sites was configured with a Jace-202-XPR-24 (Java Application
Control Engine) device that was connected to the cellular network (via the wireless modem). The Jace provided
the interface to the Catalyst-371 controller and input/output device that was installed on each RTU and also
served as a data logger.

Field Evaluation of the Performance of the RTU Challenge Unit: Daikin Rebel Page 19
Figure 3: Schematic of the RTU Monitoring
D. Air Flow Characterization
Building owners and facility managers understand the concept of seasonal efficiency, but to calculate this
performance metric, supply-air flow measurements are required. Measurement of air flow on a continuous
basis is difficult in a RTU because of the physical constraints imposed by the shape and size of the RTU.
However, one-time air flow characterization is possible in the field using flow plates that can be inserted by
temporarily replacing the air filters. For the standard unit, the air flow was constant, so there was just one
measurement to make. For the RTU Challenge unit, the supply air flow varied with fan speed. Therefore, air
flow was measured at various fan speeds to create an air flow model as a function of fan speed.
To characterize the air flow rate, the correlation between the supply-fan speed and the air flow rate was derived
from a series of one-time field measurements of air flow rates at various fan speeds. Based on the correlation
and the monitored fan speed, the air flow rate was estimated as a function of fan speed.
Using calibrated circular flow plates in a rectangular housing that were inserted in the air filter rack, the air flow
was estimated. This device is designed to measure the velocity pressure (total pressure – static pressure)
reading, which is then converted to actual air flow. The air flow measuring device was placed in the air filter rack
after the removal of the air filters. Once the air flow measuring device was installed, any gaps were sealed with
cardboard and cellophane to ensure all air flow was routed through the measuring devices (see Figure 4 below).
The RTU access door was closed (but not shut tight) to ensure the pressure tubes were not pinched. A vendor
device with gages was connected to the air flow measuring device and readings were converted to CFM values.
Clear cellophane (seen in Figure 4) was used to cover all access door openings (top, bottom and sides) as well as
the door handles, to ensure a tight seal and minimize all air flow leakage around the pressure tubes. The flow
plates are designed so that the typical pressure drop across the measuring devices is less than or approximately
equal to that of a typical filtration device that would normally be installed at the same location.
The air flow measuring device was used to 1) measure the maximum air flow rate for the reference unit; and 2)
measure the air flow rates at different fan speeds for the Rebel unit. Because the standard reference unit had a
constant speed supply fan, only one reading was necessary. For the reference unit, after the flow plates were
installed and the access door’s gaps were sealed, a number of air flow readings were taken over a period of 30
minutes and averaged. The reference unit had a supply flow rate of 2,860 CFM.

Field Evaluation of the Performance of the RTU Challenge Unit: Daikin Rebel Page 20
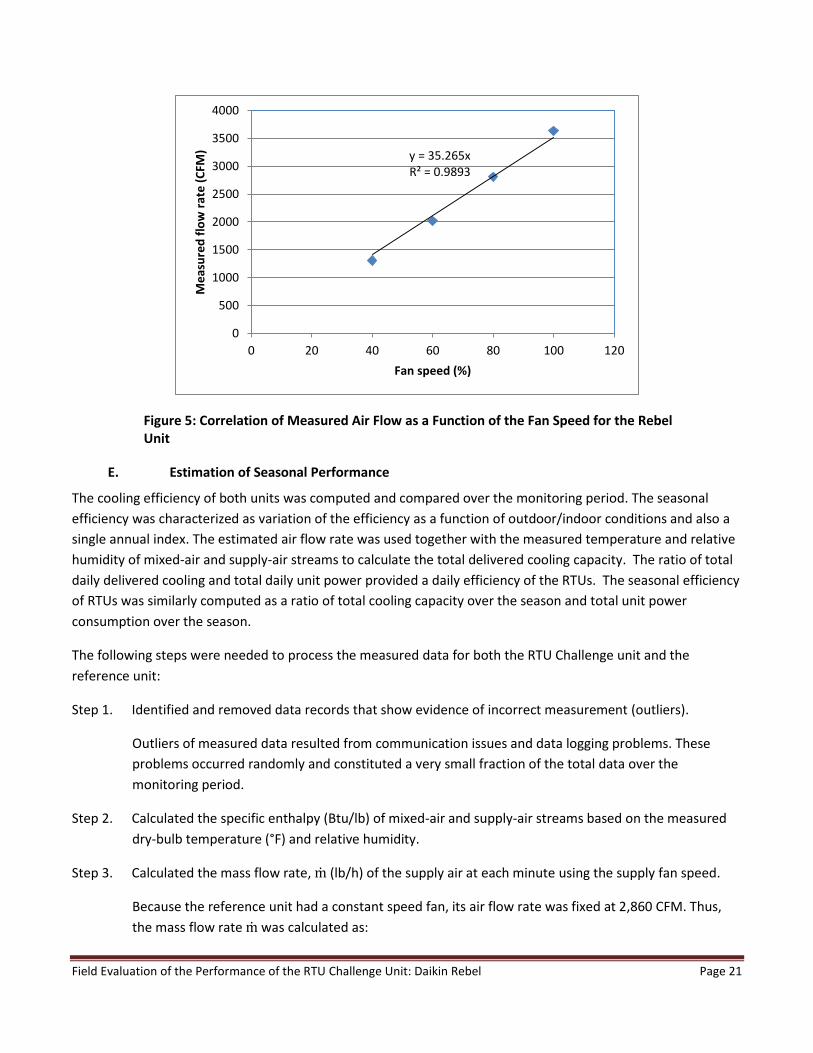
For the Rebel unit, a number of air flow readings between 40% and 100% supply fan speed were recorded after
the air flow plates were installed and the access door gaps sealed. The readings were taken once every 5 to 10
minutes over a 2-hour period at different fan speeds. Multiple readings were taken at each fan speed and the
readings were averaged to characterize the air flow as a function of fan speed. As shown in Figure 5, there is a
linear relationship between air flow rate and fan speed for the Rebel Unit as expected.
Figure 4: Air Flow Measurement in the Field
Air flow measuring
device
(tubes)
RTU access door
Cellophane sealant
Field Evaluation of the Performance of the RTU Challenge Unit: Daikin Rebel Page 21
Figure 5: Correlation of Measured Air Flow as a Function of the Fan Speed for the Rebel Unit
E. Estimation of Seasonal Performance
The cooling efficiency of both units was computed and compared over the monitoring period. The seasonal
efficiency was characterized as variation of the efficiency as a function of outdoor/indoor conditions and also a
single annual index. The estimated air flow rate was used together with the measured temperature and relative
humidity of mixed-air and supply-air streams to calculate the total delivered cooling capacity. The ratio of total
daily delivered cooling and total daily unit power provided a daily efficiency of the RTUs. The seasonal efficiency
of RTUs was similarly computed as a ratio of total cooling capacity over the season and total unit power
consumption over the season.
The following steps were needed to process the measured data for both the RTU Challenge unit and the
reference unit:
Step 1. Identified and removed data records that show evidence of incorrect measurement (outliers).
Outliers of measured data resulted from communication issues and data logging problems. These
problems occurred randomly and constituted a very small fraction of the total data over the
monitoring period.
Step 2. Calculated the specific enthalpy (Btu/lb) of mixed-air and supply-air streams based on the measured
dry-bulb temperature (°F) and relative humidity.
Step 3. Calculated the mass flow rate, m (lb/h) of the supply air at each minute using the supply fan speed.
Because the reference unit had a constant speed fan, its air flow rate was fixed at 2,860 CFM. Thus,
the mass flow rate m was calculated as:
y = 35.265xR² = 0.9893
0
500
1000
1500
2000
2500
3000
3500
4000
0 20 40 60 80 100 120
Me
asu
red
flo
w r
ate
(C
FM)
Fan speed (%)

Field Evaluation of the Performance of the RTU Challenge Unit: Daikin Rebel Page 22
𝑚𝑟𝑒𝑓 = {4.5
𝑙𝑏
𝑓𝑡3
𝑚𝑖𝑛
ℎ∗ 2,860
𝑓𝑡3
𝑚𝑖𝑛= 12,870
𝑙𝑏
ℎ (𝑖𝑓 𝐹𝑎𝑛𝐶𝑎𝑙𝑙 = 1)
0 (𝑖𝑓 𝐹𝑎𝑛𝐶𝑎𝑙𝑙 = 0) (1)
where, 𝐹𝑎𝑛𝐶𝑎𝑙𝑙 was a monitored control signal indicating whether the supply fan was running (see
Table 1).
Because the Rebel unit had a variable-speed supply fan, the air flow rate changed as a function of fan
speed. As discussed previously, the correlation between fan speed and air flow rate was obtained
using the one-time field measurements of fan speed and the corresponding air flow rate (Figure 5):
�� = 35.265𝑓𝑡3
min %∗ 𝐹𝑎𝑛𝑆𝑝𝑒𝑒𝑑 % (2)
where, V was the volume air flow rate in CFM, and FanSpeed was the speed of the variable-speed
drive for the supply fan. The above linear regression was developed for fan speeds greater than 40%,
which was the minimum setting for the Rebel unit.
The mass flow rate m (lb/h) for Rebel was calculated as:
��𝑅𝑒𝑏𝑒𝑙 = 4.5𝑙𝑏
𝑓𝑡3
𝑚𝑖𝑛
ℎ∗ ��
𝑓𝑡3
𝑚𝑖𝑛 (3)
Step 4. Calculated the cooling rate delivered at each minute:
�� = 𝑀𝐴𝑋{0, ��𝑙𝑏
ℎ∗ (ℎ𝑀𝐴 − ℎ𝑆𝐴)
𝐵𝑡𝑢
𝑙𝑏} (4)
where Q was the cooling rate in Btu/h, hMA and hDA were the specific enthalpy (Btu/lb) for the mixed
air and the supply air, respectively (from Step 2).
Because the supply air could be cooled for several minutes after the compressor was off, compressor
status was not used in Equation 4 to calculate the cooling rate. In addition, because the supply-air
temperature sensor was located downstream of the supply fan (see Figure 2), the cooling calculated
from Equation 4 was the air conditioner’s net cooling, including heat gain from the supply fan motor.
Step 5. Calculated the daily cooling energy.
Equation 5 below was used to calculate the daily cooling energy (DailyCooling, in kBtu) provided by
the reference unit and the Rebel unit.
𝐷𝑎𝑖𝑙𝑦𝐶𝑜𝑜𝑙𝑖𝑛𝑔 =∑ 𝑄𝑖𝑖
𝐵𝑡𝑢
ℎ
(601
ℎ∗1000
𝐵𝑡𝑢
𝑘𝐵𝑡𝑢) (5)
where, the subscript i indicated the monitored 1-minute record.
Step 6. Calculated the daily electricity consumption in the cooling mode.

Field Evaluation of the Performance of the RTU Challenge Unit: Daikin Rebel Page 23
For the reference unit, the compressor status could be determined by CoolCall1 and CoolCall2, which
were the two control signals indicating the 1st stage and 2nd stage DX (direct expansion) cooling
request from the thermostat. Equation 6 below was used to calculate the daily electricity
consumption (DailyRTUElec, in kWh) when the compressor was ON for cooling.
𝐷𝑎𝑖𝑙𝑦𝑅𝑇𝑈𝐸𝑙𝑒𝑐𝑅𝑒𝑓 = ∑ 𝑈𝑛𝑖𝑡𝑃𝑤𝑟𝑖 𝑖 (𝑖𝑓 𝐶𝑜𝑜𝑙𝐶𝑎𝑙𝑙1𝑖 = 1 𝑂𝑅 𝐶𝑜𝑜𝑙𝐶𝑎𝑙𝑙2𝑖 = 1) (6)
where, UnitPwr was the measured total RTU power in kW.
For the Rebel unit, the compressor status could be determined by UnitState and ClgStatus. As
described in Table 1, the compressor was ON for cooling when UnitState = 8 and ClgStatus = 1.
Thus, the following equation was used to calculate DailyRTUElec:
𝐷𝑎𝑖𝑙𝑦𝑅𝑇𝑈𝐸𝑙𝑒𝑐𝑅𝑒𝑏𝑒𝑙 = ∑ 𝑈𝑛𝑖𝑡𝑃𝑤𝑟𝑖 𝑖 (𝑖𝑓 𝑈𝑛𝑖𝑡𝑆𝑡𝑎𝑡𝑒𝑖 = 8 𝐴𝑁𝐷 𝐶𝑙𝑔𝑆𝑡𝑎𝑡𝑢𝑠𝑖 = 1) (7)
Step 7. Calculated the daily cooling efficiency.
Energy Efficiency Ratio (EER) was used as the metric to measure cooling efficiency. Thus, daily cooling
EER (kBtu/kWh) was calculated as:
𝐷𝑎𝑖𝑙𝑦𝐸𝐸𝑅 =𝐷𝑎𝑖𝑙𝑦𝐶𝑜𝑜𝑙𝑖𝑛𝑔
𝐷𝑎𝑖𝑙𝑦𝑅𝑇𝑈𝐸𝑙𝑒𝑐
𝑘𝐵𝑡𝑢
𝑘𝑊ℎ (8)
Step 8. Calculated the seasonal cooling efficiency during the entire monitoring period.
Seasonal EER was used to measure the seasonal cooling efficiency. It was calculated as:
𝑆𝐸𝐸𝑅 =∑ 𝐷𝑎𝑖𝑙𝑦𝐶𝑜𝑜𝑙𝑖𝑛𝑔𝑗𝑗
∑ 𝐷𝑎𝑖𝑙𝑦𝑅𝑇𝑈𝐸𝑙𝑒𝑐𝑗𝑗
𝑘𝐵𝑡𝑢
𝑘𝑊ℎ (9)
where the subscript 𝑗 indicated the number of calendar days over the entire monitoring period.
F. Evaluation Plan
The goal of RTU Challenge unit demonstration was to estimate the seasonal performance of the RTU Challenge
unit and the annual savings that could be achieved from using the RTU Challenge unit compared to a unit that
would have been used if not for the RTU Challenge unit. The reference unit (the unit that would have been used
if not for the RTU Challenge unit) needed to be metered and monitored over 9 months before the installation of
RTU Challenge unit to establish both the seasonal efficiency and annual energy consumption. However, this
approach could have taken over 24 months to complete the collection and the analysis of data. Because of time
constraints of completing the field evaluation within 12 to 18 months, an alternate approach was used.
The alternate approach relied on monitoring the reference unit and the RTU Challenge unit simultaneously at
two different but similar sites. Because of the simultaneous monitoring, the field measurement and verification
was completed within 12 months. This approach worked as long as the two monitored RTUs were of the same
size, had same external pressure drop and served spaces with similar load profiles. For example, if two identical

Field Evaluation of the Performance of the RTU Challenge Unit: Daikin Rebel Page 24
retail facilities in the same location were found, RTUs serving identical spaces could be monitored with one
facility having the reference unit and the other having the RTU Challenge unit. If such an option was not feasible,
two similar spaces in the same building could also be used, with one space served by the reference unit and
other by the RTU Challenge unit.
If the two spaces had similar loads, operating hours and space temperature set points, the alternate approach
could provide reasonable estimation of annual energy savings from RTU replacement. The methodology of
energy savings estimation can be found in Wang et al. (2013). If the two spaces had different load
characteristics, the regression model of RTU energy consumption developed for one space cannot be applied to
the other space. As such, annual energy savings cannot be estimated in a reliable manner. However, irrespective
of space load characteristics, the comparison of cooling efficiency between the two units is still valid for the
alternate approach. For this demonstration, two similar sites close to each other were found, as described
previously.

Field Evaluation of the Performance of the RTU Challenge Unit: Daikin Rebel Page 25
V. Results The results include two parts: 1) validation of the Rebel’s controls and 2) comparison of performance of Rebel
with standard reference unit.
A. Verification of Rebel Controls
In comparison with conventional packaged RTUs, the two major features of Rebel units included modulation of
the supply fan speed in response to the zone conditions and the modulation of the compressor speed to
maintain the supply-air temperature (Daikin 2013). These two features are verified in the following section using
1-minute interval monitored data.
Figure 6 shows the supply-fan speed, the space temperature, and the Rebel unit’s operational mode (i.e.,
UnitState) for 10/16/2013 (an example day). As discussed in Section V (Table 1), the Rebel unit operated in the
mechanical cooling mode when UnitState was equal to 8 and in the ventilation mode when UnitState was equal
to 4. This figure shows that:
The supply fan ran at 40% of its full speed in the ventilation mode.
The Rebel unit switched its operations modes between ventilation and mechanical cooling in the
following manner: if the Rebel unit was in the ventilation mode, this mode continued until the space
temperature rose above 72.9°F; if the Rebel unit was in the mechanical cooling mode, this mode
continued until the space temperature fell below 70.9°F. When the Rebel unit switched from ventilation
to mechanical cooling, the supply-fan speed gradually increased until the space temperature begain to
decrease. The supply fan then maintained at that speed. Once the space temperature reached 70.9°F,
the supply fan gradually reduced its speed to 40% and the Rebel unit switched to the ventilation mode
again.

Field Evaluation of the Performance of the RTU Challenge Unit: Daikin Rebel Page 26
Figure 6: Rebel Unit Profiles of Supply-fan Speed, Space Temperature and Operational Mode on a Typical Day (10/16/2013)
Figure 7 shows the change of supply-air temperature (DATemp), the percentage of cooling capacity
(ClgCapacity), and the operational mode (UnitState) on 05/05/2014. Because ClgCapacity represents the
percentage of the maximum cooling capacity that the Rebel unit is running on, it can be reasonably used to
indicate the compressor speed. This figure shows the following:
The discharge-air temperature was maintained at 55°F during the mechanical cooling mode.
During the mechanical cooling mode, the Rebel unit ran at different percentages of the maximum
cooling capacity to maintain the constant supply-air temperature. This indicated that the compressor
was modulating its speed to maintain supply-air temperature.
1
2
3
4
5
6
7
8
20
30
40
50
60
70
800
:00
0:4
7
1:3
4
2:2
1
3:0
8
3:5
5
4:4
2
5:2
9
6:1
6
7:0
3
7:5
0
8:3
7
9:2
4
10
:11
10
:58
11
:45
12
:32
13
:19
14
:06
14
:53
15
:40
16
:27
17
:14
18
:01
18
:48
19
:35
20
:22
21
:09
21
:56
22
:43
23
:30
Un
itSt
ate
Spee
d (
%)/
Tem
per
atu
re (
oF)
Time
Fan Speed
SpaceTemp
UnitState

Field Evaluation of the Performance of the RTU Challenge Unit: Daikin Rebel Page 27
Figure 7: Rebel Unit Profiles of Supply-air Temperature, Percentage Cooling, and Operational Mode on a Typical Day (05/05/2014)
Based on the analysis of data (Figure 6 and Figure 7) the Rebel unit appeared to be operating as expected for the
typical days chosen. Although data for only 2 days are presented, analysis of data from other days also
confirmed this pattern.
B. Energy Efficiency Reductions
Using the procedure outlined in Section V, the original 1-minute interval monitored data were processed to
obtain daily cooling, daily electricity, and daily EER. The period of analysis for the standard reference unit
included data from July 28, 2013 through September 6, 2014. For the Rebel unit, period of analysis included
data from August 29, 2013 through September 6, 2014. As noted earlier, some data were filtered out because
of problems with data logging and communication losses.
Although calculation of absolute energy savings was identified as one of the desired metrics, it was not possible
because the units (standard and Rebel) were serving different loads (Figure 8 and Figure 9). The fan run time in
these two figures included the times when the unit was in either cooling or ventilation modes, but excluded the
times when the units ran in heating mode. Thus, for a given day, the difference between the fan and the
compressor run times indicated the unit’s operation time in ventilation mode. Figure 8 shows that the reference
unit almost always operated in cooling mode except for some days in the heating season (from late November
to March). In comparison, Figure 9 shows that the Rebel unit runs in cooling mode partially for most days.
Because both units had the same rated cooling capacity, the difference in run time in cooling mode indicated
that the spaces they served have different load characteristics. Therefore, the results presented in this section
will focus on the comparison of cooling efficiency for these two units rather than the absolute energy savings.
0
1
2
3
4
5
6
7
8
9
0
10
20
30
40
50
60
70
80
90
100
0:0
0
0:4
5
1:3
0
2:1
5
3:0
0
3:4
5
4:3
0
5:1
5
6:0
0
6:4
57
:30
8:1
5
9:0
0
9:4
5
10
:30
11
:15
12
:00
12
:45
13
:30
14
:15
15
:00
15
:45
16
:30
17
:15
18
:00
18
:45
19
:30
20
:15
21
:00
21
:45
22
:30
23
:15
Un
itSt
ate
Dis
char
ge A
ir T
emp
erat
ure
(°F
),
Co
olin
g C
apac
ity
(%)
Time
DATemp
ClgCapacity
UnitState

Field Evaluation of the Performance of the RTU Challenge Unit: Daikin Rebel Page 28
Figure 8: Compressor and Fan Run Time for the Reference unit when the Unit is either in Cooling or Ventilation Mode (but not heating mode)
Figure 9: Compressor and Fan Run Time for the Rebel Unit when the Unit is in either Cooling or Ventilation Mode (but not heating mode)
Figure 10 compares the daily energy efficiency, expressed as energy efficiency ratio (EER), of the reference unit
and the Rebel unit for the entire monitoring period. The results are missing for some days (e.g., between
10/19/2013 and 10/29/2013) because at least one of the two units lost communication during that period. This
figure shows that the daily EER varies between 5 and 12 Btu/Wh for the reference unit and between 7 and 15
Btu/Wh for the Rebel unit.
0
5
10
15
20
25
30
8/29/13 9/29/13 10/29/13 11/29/13 12/29/13 1/29/14 2/28/14 3/31/14 4/30/14 5/31/14 6/30/14 7/31/14 8/31/14
Co
mp
ress
or
and
Fan
Ru
n T
ime
(H
ou
r)
Day
Compressor
Fan
0
5
10
15
20
25
30
8/29/13 9/29/13 10/29/13 11/29/13 12/29/13 1/29/14 2/28/14 3/31/14 4/30/14 5/31/14 6/30/14 7/31/14 8/31/14
Co
mp
ress
or
and
Fan
Ru
n T
ime
(H
ou
r)
Day
Compressor
Fan

Field Evaluation of the Performance of the RTU Challenge Unit: Daikin Rebel Page 29
Figure 10: Comparison of Energy Efficiency Ratio of the Reference Unit and the Rebel Unit
Figure 11 compares the daily EER as a function of daily outdoor-air temperature for the standard unit and Rebel
unit. In this figure, the daily average outdoor-air temperature is the average for those data records when the
compressor was ON. When the average outdoor-air temperature was lower than 55°F, no data were available
for the Rebel unit because that unit’s compressor was not on and therefore EER could not be calculated. Figure
11 shows that in general, EER increased as the outdoor-air temperature decreased for Rebel units, which was
expected. However, the relationship for the reference unit is not clear.
4
6
8
10
12
14
16
18
8/29/13 9/29/13 10/29/13 11/29/13 12/29/13 1/29/14 2/28/14 3/31/14 4/30/14 5/31/14 6/30/14 7/31/14 8/31/14
Ene
rgy
Effi
cie
ncy
Rat
io, E
ER (
Btu
/Wh
))
Day
Reference
Rebel

Field Evaluation of the Performance of the RTU Challenge Unit: Daikin Rebel Page 30
Figure 11: Comparison of Daily Energy Efficiency Ratio of the Reference Unit and the Rebel Unit as a Function of Daily Average Outdoor-air Temperature for the Monitoring Period
To compare the difference in daily efficiency (EER) between the two units, the ratio of EER of the Rebel and the
reference units were calculated for all days and plotted as a function of the daily average outdoor-air
temperature in Figure 12. The ratio of the EER for the two units ranged from 0.90 to 2.41. The Rebel unit had a
higher daily EER than the reference unit for all but 3 days (i.e., 11/17/2013, 5/01/2014, and 7/13/2014), when
the ratio of EER fell below 1.0. The EER ratio increased as the daily average outdoor-air temperature decreased.
This means that RTUs with variable-speed compressors and variable-speed fans, like Rebel, had better part-load
efficiencies than units that did not have variable-speed fans and use on/off controls for capacity modulation.
4
6
8
10
12
14
16
18
40 45 50 55 60 65 70 75 80 85 90
Ene
rgy
Effi
cie
ncy
Rat
io, E
ER (
Btu
/Wh
)
Daily Average Outdoor-Air Temperature (°F)
Reference
Rebel

Field Evaluation of the Performance of the RTU Challenge Unit: Daikin Rebel Page 31
Figure 12: Ratio of Rebel EER and the Reference Unit as a Function of Daily Average Outdoor-air Temperature
The average of the EER ratio for all days in Figure 12 was approximately 1.38, which means that on average, the
daily EER of the Rebel unit was 38% higher than that of the reference unit.
In addition to daily EER, the seasonal cooling efficiency was also calculated using Equation 9. Table 3 shows the
seasonal EER values computed over the entire monitoring period (the reference unit was from 7/28/2013 to
9/6/2014 and the Rebel unit was from 8/29/2013 to 9/6/2014). Over the 12-month period, the reference unit
and the Rebel unit had seasonal EERs of 8.3 and 10.9, respectively. The Rebel unit’s seasonal EER was about 31%
higher than the reference unit. This result was slightly lower than the findings from our previous simulation
work (Wang and Katipamula 2013), which predicted that in hot and humid climates, Rebel would consume
about 40% less electricity than an RTU with a constant-speed supply fan and a single-stage mechanical cooling.
The reasons for this difference were that the load that these units in the field were serving was different, while
the units in the simulation served the same load. In addition, the reference unit in the field had a higher rated
EER than the reference unit used in the simulation analysis. Also, as discussed previously (Figure 8 and Figure 9),
both the reference unit and the Rebel unit ran in the cooling mode for a significant fraction of the time. Thus,
the benefits of fan energy reduction in the ventilation mode did not exist. It is reasonable to anticipate that the
Rebel unit will perform even better than the reference unit if the units operate more time in ventilation mode.
It needs to be noted that the meaning of seasonal EER and daily EER in this work are slightly different from those
used in the performance rating standard for RTUs (AHRI 2007) in the following aspects: 1) the two units had
higher external static pressure than the rating standard requirement; and 2) the efficiency calculated in this
work included frequent mode changes and thus did not represent the steady-state efficiency used in the rating
standard.
0.5
0.7
0.9
1.1
1.3
1.5
1.7
1.9
2.1
2.3
2.5
50 55 60 65 70 75 80 85 90
EER
Rat
io b
etw
ee
n R
eb
el a
nd
Ref
ere
nce
Daily Average Outdoor-Air Temperature (°F)
Field Evaluation of the Performance of the RTU Challenge Unit: Daikin Rebel Page 32
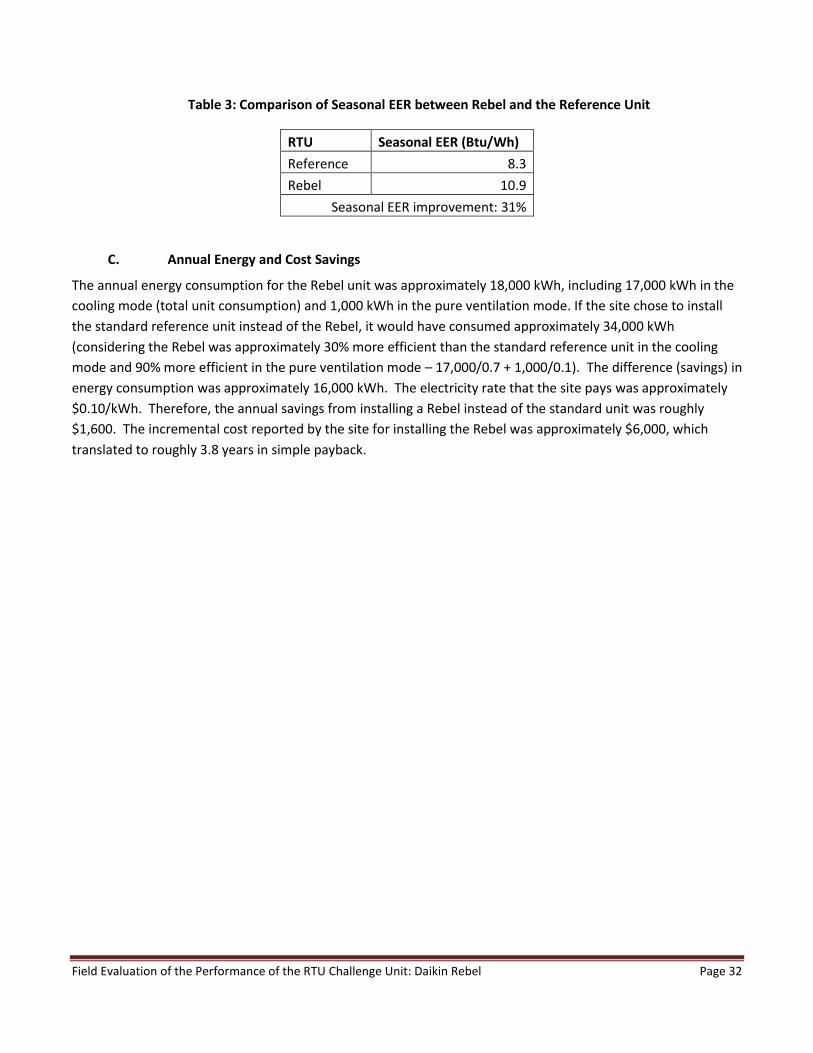
Table 3: Comparison of Seasonal EER between Rebel and the Reference Unit
RTU Seasonal EER (Btu/Wh)
Reference 8.3
Rebel 10.9
Seasonal EER improvement: 31%
C. Annual Energy and Cost Savings
The annual energy consumption for the Rebel unit was approximately 18,000 kWh, including 17,000 kWh in the
cooling mode (total unit consumption) and 1,000 kWh in the pure ventilation mode. If the site chose to install
the standard reference unit instead of the Rebel, it would have consumed approximately 34,000 kWh
(considering the Rebel was approximately 30% more efficient than the standard reference unit in the cooling
mode and 90% more efficient in the pure ventilation mode – 17,000/0.7 + 1,000/0.1). The difference (savings) in
energy consumption was approximately 16,000 kWh. The electricity rate that the site pays was approximately
$0.10/kWh. Therefore, the annual savings from installing a Rebel instead of the standard unit was roughly
$1,600. The incremental cost reported by the site for installing the Rebel was approximately $6,000, which
translated to roughly 3.8 years in simple payback.
Field Evaluation of the Performance of the RTU Challenge Unit: Daikin Rebel Page 33
VI. Conclusions It was a challenge to find two units running in two different spaces that served similar cooling loads. Although
two grocery stores with similar layouts were selected, the monitored data showed that they had noticeably
different load profiles. Therefore, absolute energy savings between the two units could not be calculated. If the
absolute savings measurement were desirable, then the existing RTU will have to be monitored for 1 year,
followed by 1 year of monitoring of the Rebel unit after it replaces the existing RTU.
Other issues related to the installation of the Rebel unit included:
The Rebel unit came with a different base footprint from the existing Lennox unit. Although a curb
adapter was provided, it left the unit suspended over the front side of the base, and was ultimately
supported by blocks.
Although the new Rebel unit was considerably heavier than the unit it replaced, no roof reinforcement
was needed.
The store that had the Rebel unit reported no comfort issues either positive or negative. The Rebel unit had a
Micro Tech III controller, which was not compatible with the existing Emerson E2 BX controller, or the Emerson
Building Automation System (BAS). Emerson had an application for the Micro Tech II controller but not for
Micro Tech III. Therefore, the store had to install an output board with a set of dry contacts to control the RTU
indoor fan. They also had to add an interface to monitor the indoor fan “On/Off” status and the supply/return
temperatures, but they could not control any cooling/heating/speed control functions. All operations were
controlled directly by the Micro Tech III controller in the unit with input from the zone temperature sensor.
The start-up and commissioning of the Rebel was challenging because the local Daikin distributor who installed
the unit had limited experience in installing these new units. In addition, the controller had many features with
a large instruction/operation manual, which made it difficult to properly configure. It took the distributor a
couple of trips to configure the unit correctly, but after it was configured, the unit, as well as its metering and
monitoring system worked as expected. Over the last 12-month period, maintenance requirements for this unit
were similar to the other units. Because the Rebel unit had a lot of variable-speed components and controls
(compared to the reference unit with standard parts), the energy manager speculated that using a Rebel unit
could lead to costly repairs if anything failed during its lifetime. Also, the energy manager speculated that the
Rebel unit may not be cost effective in coastal environments, where the equipment does not usually make the
expected life cycle because of corrosive (salt air) conditions.
As described previously, the field performance of the Rebel unit was compared with a reference RTU that had
been installed for about 6 years. Both units had a rated cooling capacity of 7.5 tons. The reference RTU had a
constant-speed supply fan and two-stage mechanical cooling. Based on the comparisons of performance
between the two units, Rebel had 30% higher seasonal EER compared to the reference unit. If the site installed
the standard reference unit instead of the Rebel, it would have consumed approximately 16,000 kWh more
annually leading to additional energy costs of roughly $1,600. The incremental cost reported by the site for
installing the Rebel was approximately $6,000, which translated to roughly 3.8 years in simple payback.

Field Evaluation of the Performance of the RTU Challenge Unit: Daikin Rebel Page 34
VII. References AHRI. 2007. ANSI/AHRI Standard 340/360-2007: Performance rating of commercial and industrial unitary air-
conditioning and heat pump equipment. Air-Conditioning, Heating, and Refrigeration Institute, Arlington, VA.
ASHRAE. 2010. ASHRAE Standard 90.1-2010: Energy Standard for Buildings Except Low-Rise Residential
Buildings. American Society of Heating, Refrigerating and Air-Conditioning Engineers Inc. Atlanta, GA.
Daikin. 2013. Rebel commercial rooftop systems. Retrieved in January 2013 from
http://www.daikinapplied.com/rooftop-rebel.php
DOE. 2013. High performance rooftop unit. Retrieved in January, 2013 from http://www1.eere.energy.gov/buildings/commercial/bba_rtu_spec.html
EIA (Energy Information Administration). 2003. Commercial Building Energy Consumption Survey. Retrieved in September 2013 from http://www.eia.gov/consumption/commercial/data/2003/.
Wang W, and S Katipamula. 2013. Part-Load Performance Characterization and Energy Savings Potential of the RTU Challenge Unit: Daikin Rebel. PNNL-22720, Pacific Northwest National Laboratory, Richland, WA.
Wang W, S Katipamula, H Ngo, RM Underhill, DJ Taasevigen, and RG Lutes. 2013. Advanced Rooftop Control (ARC) Retrofit: Field-Test Results. PNNL-22656, Pacific Northwest National Laboratory, Richland, WA.

Field Evaluation of the Performance of the RTU Challenge Unit: Daikin Rebel Page 35
PROGRAM NAME
Add program specific contact information here
Add program email address here DOE/GO-102012-XXXX • Month Year
Printed with a renewable-source ink on paper containing at least 50% wastepaper, including 10% post-consumer waste.