Embed Size (px)
Citation preview
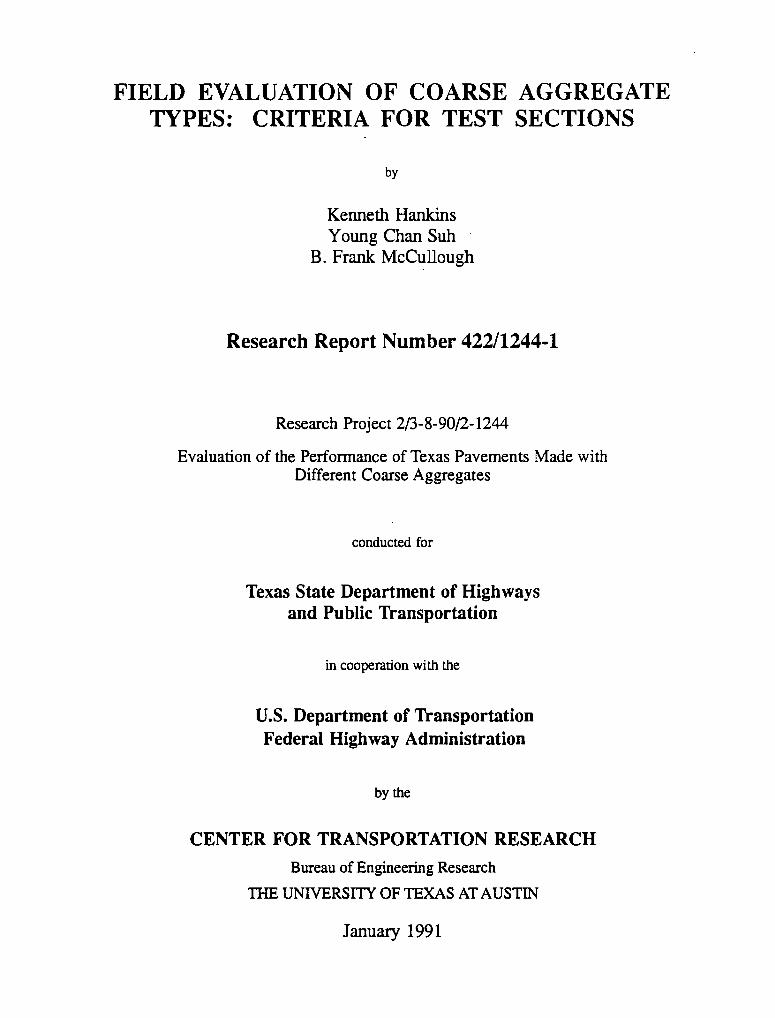
Technical Report Documentation Page
I 1. Report No.
. FHWA/TX-91+422/1244-1
! 2. Government Accessoon No.
I
3. Recipoent' s Catalog No.
4. Title and Subtitle • 5. Report Date
January 1991 FIELD EVALUATION OF COARSE AGGREGATE TYPES: CRITERIA FOR TEST SECTIONS
6. P l!rformong Organi zollon Code
h:--:--::--:~-:::--:--:-;--:::-:--:;-:------------------.J 8. Performing Organ• zoti on Report No. 7. Author's) Kenneth Hankins, · Young Chan Suh, and B. Frank McCullough . Research Report 422/1244-1 9. Performing Organization Nome and Address
Center for Transportation Research The University of Texas at Austin Austin, Texas 78712-1075
~~--------------~~--------------------------~ 12. Sponsoring Agency Name and Address
Texas Department of Transportation (formerly State Department of Highways and Public Transportation)
P. 0. Box 5051 Austin, Texas 78763-5051 l 5. Supplementary Notes
10. Worl. Unot No. (TRAIS)
11. Contract or Grant No.
Rsch. Study 2/3-8-90/2-1244 13. Type of Report and Period Covered
Interim
14. Sponsoring Agency Code
Study conducted in cooperation with the U. S. Department of Transportation, Federal Highway Administration. Research Study Title: "Evaluation of the Performance of Texas Pavements Made with Different Coarse Aggregates"
16. Abstract
Concrete pavements are subjected to a variety of stresses and, as a result, the pavement slab is in continuous motion. Some of the more significant stresses present are environmental loads, or those developed by the thermal and shrinkage movements of the paving material. When the environmental loads are combined with the wheel and gravity loads, conditions exist which control the ultimate life of the concrete pavement. The environmental stresses are a function not only of weather but also of the material properties of the pavement. Therefore, in pavement design, it becomes important to consider the material properties of the paving materials from an environmental viewpoint.
This report presents the background for studies concerning the effects of the concrete mix on the performance of continuously reinforced concrete (CRC) pavement. The initial work in this study resulted in a suggested design standard for CRC pavement wherein the longitudinal steel percentage was varied depending on the coarse aggregate type. The information for the standard was developed using theoretical models. Therefore, it was desirable to verify the design standard using empirical data from specially-prepared test sections. This report describes in detail the variables involved and the design of the experimental test sections. The report also suggests a monitoring plan and a technique for determining an empirical verification of the design standard.
17. Key Words
concrete, continuously reinforced concrete pavement (CRCP), steel percentage, steel/concrete bond area, coarse aggregate type, crushed limestone, siliceous gravel, thermal movement, test sections
18. Distribution StotHIMf
No restrictions. This document is available to the public through the National Technical Information Service, Springfield, Virginia 22161.
19. Security Clouif. (of thi • report)
Unclassified
20. Security Clonif. (of this page)
Unclassified
21· No. of Pages 22. Price
24
Form DOT F 1700.7 <B-721 Reproduction of completed poge authorized
I
I I I
FIELD EVALUATION OF COARSE AGGREGATE TYPES: CRITERIA FOR TEST SECTIONS
by
Kenneth Hankins Young Chan Suh
B. Frank McCullough
Research Report Number 422/1244-1
Research Project 2/3-8-90/2-1244
Evaluation of the Performance of Texas Pavements Made with Different Coarse Aggregates
conducted for
Texas State Department of Highways and Public Transportation
in cooperation with the
U.S. Department of Transportation Federal Highway Administration
by the
CENTER FOR TRANSPORTATION RESEARCH
Bureau of Engineering Research
THE UNIVERSITY OF TEXAS AT AUSTIN
January 1991

The contents of this report reflect the views of the authors, who are responsible for the facts and the accuracy of the data presented herein. The contents do not necessarily reflect the official views or policies of the Federal Highway Administration or the State Department of Highways and Public Transportation. This report does not constitute a standard, specification, or regulation.
ii
PREFACE
This report reviews the previous development of design information for continuously reinforced concrete pavement and describes the creation of a field moniroring program lO be used to verify the design information. The continuously reinforced concrete pavement design considered the type of coarse aggregate used in the concrete paving mix and varied the reinforcing steel percentages depending on the aggregate type. The field verification procedure recognized the long period of time involved in developing performance information and recommended both a short and a long observation period. The short period can be accommodated within the project time limits, and a longer observation period can then be employed if funding and time become available.
This work is a part of Research Project 2!3-8-90/2-1244, entitled "Evaluation of the Performance of Texas Pavements Made with Different Coarse Aggregates." The research was conducted using the resources and facilities at the Center for Transportation Research, The University of Texas at Austin. The project is conducted jointly with the Texas Transportation Institute at Texas A&M University at College Station, Texas, and is sponsored by the Texas State Department of Highways and
Public Transportation and the Federal Highway Administration.
The authors express thanks to personnel with the Texas State Department of Highways and Public Transportation, particularly Mr. James L. Brown, Pavement Design Section of the Highway Design Division, for contributing information which is a part of this report. The authors also express their appreciation to Mr. Andrew Wimsatt, Highway Design Division; to Mr. Gerald Lankes, Materials and Tests Division; and to Mr. John Finley, Construction Division, who were the project contact advisors. Thanks are given to the Center for Transportation Research personnel who processed and produced this report.
The construction of special test sections will, in this case, involve field changes lO existing projects under construction. The development of a field change is not an easy task, since agreements, additional funding, numerous phone calls, manifold calculations and labor of installation are involved. The authors wish to express their thanks, in advance, lO the State Department of Highways and Public Transportation and to the contractor personnel who will be involved in this activity.
LIST OF REPORTS
Research Report 422/1244-1, "Field Evaluation of Coarse Aggregate Types: Criteria for Test Sections," by Kenneth Hankins, Young Chan Sub, and B. Frank McCullough, explains the variables involved in and the design of the experimental test sections which are to be used in the verification of a design standard. The design standard is one of the first to incorporate various physical design features depending on the concrete mix properties. January 1991.
Research Report 422/1244-2, "Characterization of Concrete Properties with Age Using Laboratory Tests," by Terry Dossey, presents the results of a series of laboratory tests which are called "Phase II Tests." The Phase II tests were performed on concrete specimens cured in controlled conditions where the tests consisted of splitting tensile strength, compressive strength, and compressive modulus. Shrinkage and thermal coefficient
iii
information was also determined. The variable of the study was the coarse aggregate type and some six mixes were used. Characterization included chemical analysis and the development of models for the physical properties of the various mixes. The "Phase I" studies were performed in the parent study. Forthcoming in 1992.
Research Report 422/1244-3, "Development and Application of Randomness Index for Continuously Reinforced Concrete Pavement," by Young Chan Suh, B. F. McCullough, and Ken Hankins, describes the development of a randomness index which objectively quantifies the randomness of the shapes of transverse cracks on continuously reinforced concrete pavement. An example application was presented showing data collected on concrete pavements having different aggregate types. Forthcoming in 1992.
ABSTRACT
Concrete pavements are subjected to a variety of stresses and, as a result, the pavement slab is in continuous motion. Some of the more significant stresses present are environmental loads, or those developed by the thermal and shrinkage movements of the paving material. When the environmental loads are combined with the wheel and gravity loads, conditions exist which control the ultimate life of the concrete pavement. The environmental stresses are a function not only of weather but also of the material properties of the pavement. Therefore, in pavement design, it becomes important to consider the material properties of the paving materials from an environmental viewpoint.
This report presents the background for studies concerning the effects of the concrete mix on the performance of continuously reinforced concrete (CRC) pavement. The initial work in this study resulted in a
suggested design standard for CRC pavement wherein the longitudinal steel percentage was varied depending on the coarse aggregate type. The information for the standard was developed using theoretical models. Therefore, it was desirable to verify the design standard using empirical data from specially-prepared test sections. This report describes in detail the variables involved and the design of the experimental test sections. The report also suggests a monitoring plan and a technique for determining an empirical verification of the design standard.
KEY WORDS: concrete, continuously reinforced concrete pavement, steel percentage, steel/ concrete bond area, coarse aggregate type, crushed limestone aggregate, siliceous gravel, thermal movement, test sections
SUMMARY
This the third report from Research Project 2/3-8-90/2-1244, "Evaluation of the Performance of Texas Pavements Made with Different Coarse Aggregates." This report, entided "Field Evaluation of Coarse Aggregate Types: Criteria for Test Sections," develops design and layout plans for test sections to be constructed in order to obtain empirical data by which results from theoretical models may be verified. A technique for periodic monitoring of the performance of the test sections has been described.
Variables to be included in the test section construction are:
(1) pavement thickness-three each at 10, 11, and 15 inches;
(2) coarse aggregate material type-siliceous gravel, crushed limestone;
(3) reinforcing steel percentage-three each at 0.1 percent higher than optimum, optimum, and 0.1 percent lower than optimum; and
(4) concrete/reinforcing steel bond area - two each at optimum steel percentage with a #6 and a #7 bar.
Monitoring is to include both short-term (construction and one month after construction) and long-term observations.
IMPLEMENTATION STATEMENT
This report contains recommendations for the design of eight test sections each of which is to be constructed at four locations. Monitoring of the test sections provides data to verify or modify mechanistic techniques previously used in developing a design standard for continuously reinforced concrete pavement. The design standard
iv
permits the use of crushed limestone or siliceous gravel found in or near the state, but requires varying longitudinal steel percentages depending on the aggregate type. The implementation of recommendations from this report will result in the construction and monitoring of the test sections.
TABLE OF CONTENTS
PREFACE ••••••-•"'''' ... ''''"'"'"'""''""""''''""""""'""'"''""""'"'""'"""""'"""""""'''"''""'"''"'''''"'''''''""""''"'''"""''""""''"'"'''""""''''""'''''"'"''"""""""'''"'" Ill
LIST OF REPORTS ................................... ._ ............................................... _.......................................................................................................... iii
ABSTRACT ........ - ................ .-............ _ ......................... -........................................................................................................................................ iv
SUMMARY ................................................................................................... ,__.......................................................................................................... iv
IN1PLEMENTA TION STATEMENT ................................................................................................................................................................. IV
C~Rl. INTRODUCTION Ba::kgrclmd.. ............................................ .-.......................................... ._............................................................................................................ 1
Evaluation Needs. ....................................................... ._................................................................................................................................... 1 Need for Verification ........................................................................................................................... _........................................................ 2
Objective.............................................................................................................................................................................................................. 2
Sc:q)e...................................................................................................................................................................................................................... 2
C~R 2. DESIGN OF TEST SECTIONS Variables to Be Investigated...................................................................................................................................................................... 4
Crack Spacing........................................................................................................................................................................................... 4
Cr:l:k Width............................................................................................................................................................................................... 4 Spalling ........................................................................................................................................................................................................ 4 Punchouts .................................................................................................................................................................................................... 4
Patches ...... - ......................... ._.................................................................................................................................................................... 5
Test Section Design........................................................................................................................................................................................ 5 Laboratory Progrmn ......................................................................................................................................................................................... 6
Part Two--Coarse Aggregate Study........................................................................................................................................................ 6
C~R 3. MONITORING FIELD PERFORMANCE Plans for Monitoring ............................................ _.......................................................................................................................................... 10 Discussion ofParalneters.............................................................................................................................................................................. 10
Crack Spacing........................................................................................................................................................................................... 10 Crack Width............................................................................................................................................................................................... I 0 Slab Movement........................................................................................................................................................................................ 11 Air and COilCiete Temperall.!Ie.......................................................................................................................................................... 13 Solar Radial:ion......................................................................................................................................................................................... 13 Spalling, Punchouts, and Patches ................................................................................................................................................... 13 Deflecti.m .................................................. "'.............................................................................................................................................. 13
Monitoring of Pan Two-Coarse Aggregate ............................ _.................................................................................................... 13 Performance Concepts ....................................... _____ ,..................................................................................................................... 13 Measurements.................................................................................................................................................................................................... 14
Predictions ............................................................................... - ............... -................................................................................................... 15
Ca1ibralion Needs..,, .. , .... .,, .. ,.,.,,.,.,., .. ,.,."'"'"''"""''"""'""'"'' ... "-'"""'" ... ''"""'""'"'"'""'"'""'"'""'"'""''''""'"'"""""""""''""'"""'"'''''' ... ''"""'" 15 Long-Tenn Perfonnarx:e Predictions....................................................................................................................................................... 15
C~ 4. FlJIURE WORK. ....... """"'""'"""""""""'"""""'"'"'""'""""""""""'"'"'"""""""'""' ................................................................. 16
APPENDIX'"' ...................................................................................................................... "' ................................................................................ ,_... 17
v
CHAPTER 1. INTRODUCTION
BACKGROUND Continuously reinforced concrete (CRC) pavement
was first placed on Texas highways in the 1950's, primarily in conjunction with the Interstate Highway Program. The collection of construction records and pavement monitoring began almost from the inception of CRC paving. Manual logs were maintained of location, steel characteristics, and paving and subbase material properties. Later these logs :were incorporated into automated records and, in 1974, the first condition survey was added to the automated records. Since that time, several periodic condition surveys have been added to form a rigid pavement performance data base.
The Rigid Pavement Data Base (RPDB) has been subjected to a variety of uses, especially to studying those items thought to influence the life of CRC pavement. The performance of CRC pavement is directly related tD the events which occur during the early life of the pavement. Most of the transverse cracks occur soon after the pavement has been placed, while the concrete is still "green." If large thermal movements or shrinkages occur before the concrete has gained strength, large and often excessive numbers of transverse cracks develop. The spacing of these cracks will vary, but the smaller crack spacings tend to have poorer performance with a larger number of "punchout .. ·type failures. Longitudinal cracks often occur at an early age, particularly if joint sawing has been delayed. This type of crack forms a punchout and causes poor performance.
Most concrete mixes placed in Texas have used either a river gravel or a crushed limestone aggregate. In the 1970's, engineers began to compare the performance of CRC pavements using the two aggregate types. When pavements of equivalent age and traffic histories were compared, the CRC paving having crushed limestone in the concrete was found to be performing better than concretes with other aggregate types. During this period, building and street construction were booming; hence the demand for all aggregates was high. Also, a study of aggregate costs revealed very little difference in price between a crushed limestone and a river gravel as delivered at the job site. Therefore, several Texas State Department of Highways and Public Transportation (SDHPT) engineers decided to specify crushed limestone or crushed limestone and gravel blends. However, later in the 1980's, a reversal in the economy brought a slump to construction, and aggregate marketing intensified. These incidents brought about a need to evaluate aggregate materials used in concrete paving and to develop alternate solutions to provide equivalent performance.
1
EVALUATION NEEDS The initial effons of this project were directed to
ward a study of the physical properties of typical paving concretes using both river gravel and crushed limestone aggregates. An experiment was designed ID include laboratory curing conditions having a variety of humidities and temperatures. Typical river gravel and crushed limestone aggregate materials were obtained, concrete mixes prepared, and tests conducted to determine the physical properties of these concretes. The testing for physical properties included flexural strengths, splitting tensile strengths, flexural modulus, and shrinkage and thermal coefficients. The test results were then evaluated using the CRCP-4 computer program with mechanistic models to study the performance measures (crack spacing, crack width, and steel stress) of pavements using these materials. This work was part of the Phase I studies and was included in the first interim repon for this project.
The second phase for this project used the CRCP-4 program tD develop performance-based predictive models and design charts permitting the preparation of design details and specification guidelines by departmental personnel. This work suggested that CRC pavement performance could be improved if the steel percentages and bar sizes were varied depending on the type of aggregate used in the paving mixture. Further analysis of this information indicated that the most logical design item to consider would be the steel percentage. Therefore, the laboratory test data were used in the development of steel design algorithms based on aggregate type.
A variety of aggregate types are found in Texas. An assonment of materials can even be found in river gravels. River gravel deposits tend to contain a well-rounded product that varies from a vinually pure siliceous material (95 percent Si02) to one containing a considerable amount of calcarious material (45 percent CaO). Because several aggregate types are available for concrete paving in Texas, the laboratory studies were expanded to include additional aggregates. Aggregates from most of the sources available for concrete paving were obtained and concrete specimens were prepared using each of these sources. The specimen preparation and testing techniques were similar to those used in the flrst phase, except that laboratory curing was reduced to one humidity level (45 percent) and one temperature (75°F). In addition, mix designs were developed where only the coarse aggregate type varied. The sand, cement factor, and water factor were held constant to the extent that wa.S possible. Then, the physical properties of each of the concretes was deter· mined at various ages. Using the information from the
2
physical properties, equations were developed to predict that property with time. The chemical/mineralogical properties were also determined for the material from each source, and relationships between the chemical properties and the physical properties were studied. A second interim report was prepared which included these Phase II laboratory swdies.
The Pavement Design Section of the SDHPT began trial usage of this research by collecting and swdying the steel design algorithms and performance-based predictive models. This group then prepared design charts and began to develop bar size and spacing details based on the steel percentages suggested by the model for both the crushed limestone and the siliceous gravel. From this information, design standards and specification guidelines were prepared for field use in the SDHPT districts. CRCP(B)-89B resulted from this effort
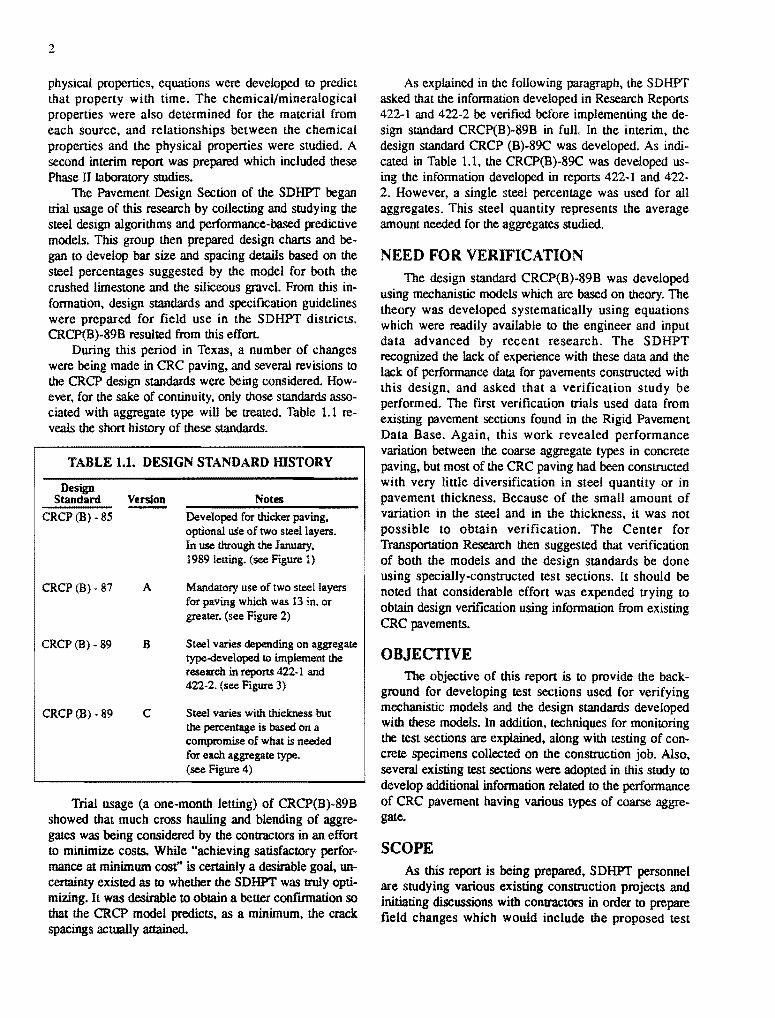
During this period in Texas, a number of changes were being made in CRC paving, and several revisions to the CRCP design standards were being considered. However, for the sake of continuity, only those standards associated with aggregate type will be treated. Table 1.1 reveals the short history of these standards.
TABLE 1.1. DESIGN STANDARD HISTORY
Design Standard Version
CRCP(B)- 85
CRCP (B) • 87 A
CRCP (B)- 89 B
CRCP (B)- 89 C
Notes
Developed for thicker paving, optional liSe of two steel layers. In use through the January, 1989 letting. (see Figure 1)
Mandatory use of two steel layers for paving which was 13 in. or greater. (see Figure 2)
Steel varies depending on aggregate type-developed 10 implement the research in reports 422-1 and 422-2. (see Figure 3)
Steel varies wirh thickness but the percentage is based on a compromise of what is needed for each aggregate type. (see Figure 4)
Trial usage (a one-month letting) of CRCP(B)-89B showed that much cross hauling and blending of aggregates was being considered by the contractors in an effort to minimize costs. While "achieving satisfactory performance at minimum cost" is certainly a desirable goal, uncertainty existed as to whether the SDHPT was truly optimizing. It was desirable to obtain a better confmnation so that the CRCP model predicts, as a minimum, the crack spacings actually attained.
As explained in the following paragraph, the SDHPT asked that the information developed in Research Reports 422-l and 422-2 be verified before implementing the design standard CRCP(B)-89B in full. In the interim, the design standard CRCP (B)-89C was developed. As indicated in Table 1.1, the CRCP(B)-89C was developed using the information developed in reports 422-1 and 422-2. However, a single steel percentage was used for all aggregates. This steel quantity represents the average amount needed for the aggregates studied.
NEED FOR VERIFICATION The design standard CRCP(B)-89B was developed
using mechanistic models which are based on theory. The theory was developed systematically using equations which were readily available to the engineer and input data advanced by recent research. The SDHPT recognized the lack of experience with these data and the lack of performance data for pavements constructed with this design, and asked that a verification study be performed. The first verification trials used data from existing pavement sections found in the Rigid Pavement Data Base. Again, this work revealed performance variation between the coarse aggregate types in concrete paving, but most of the CRC paving had been constructed with very little diversification in steel quantity or in pavement thickness. Because of the small amount of variation in the steel and in the thickness, it was not possible to obtain verification. The Center for Transportation Research then suggested that verification of both the models and the design standards be done using specially-constructed test sections. It should be noted that considerable effort was expended trying to
obtain design verification using information from existing CRC pavements.
OBJECTIVE The objective of this report is to provide the back
ground for developing test sections used for verifying mechanistic models and the design standards developed with these models. In addition, techniques for monitoring the test sections are explained, along with testing of concrete specimens collected on the construction job. Also, several existing test sections were adopted in this study to develop additional information related to the performance of CRC pavement having various types of coarse aggregate.
SCOPE As this report is being prepared, SDHPT personnel
are studying various existing construction projects and initiating discussions with contractors in order to prepare field changes which would include the proposed test

sections. The information in this report will assist the SDHPT, the contractors, and the researchers in the execution of this project.
Chapter 2 contains the layout and design of the proposed test sections in addition to the suggested laboratory program.
3
Chapter 3 presents the plan for monitoring the proposed test sections as well as existing sections which were constructed using various types of coarse aggregates.
Chapter 4 explains the significance of the test sections and suggests possible future activities.

CHAPTER 2. DESIGN OF TEST SECTIONS
At a meeting with the SDHPT on November 5, 1987, it was decided to construct a series of test sections at several locations. The test sections would be designed in such a manner so as to check or verify the models used in developing the design standards. Since the duration of the resean:h project was relatively short, observations should produce information for the early study of performance. These observations should be intense, with considerable detailed data. However, if possible, actual performance should be studied by observing the sections over a long time period. The reinforcing steel design and coarse aggregate types in the test sections would be varied in such a manner that subsequent performance measurements could be used to verify the design techniques used in developing CRCP(B)-89B. Therefore, the purpose of this chapter is to develop a "layout" of the test sections and to propose the design and materials parameters needed for verification.
Included as a second part of this report were three recently-constructed test locations of CRC paving. Each of these locations included a test section with a different coarse aggregate and a control or comparison section of crushed limestone. The purpose of including these locations was to provide the study with CRC pavements having a larger variety of coarse aggregates. Since these locations had previously been constructed, the observations and analysis techniques for these sections were to be different from those in the first part of the study.
VARIABLES TO BE INVESTIGATED In the first part of this study, the values of numerous
parameters are ftxed, thus providing an excellent opportunity to study the effect of selected variables on pavement behavior. The following discussion includes the parameters to be studied.
CRACK SPACING
Transverse cracking in CRC pavement is expected and thus is included in the design process. However, the eventuality of unplanned longitudinal and random cracking is of interest and will be studied. Of immediate interest is the time versus crack spacing or the time of crack occurrence, along with the number and condition of the cracks. In the past, mean transverse crack spacing was the primary parameter reported; however, the uniformity of the transverse crack spacings may be a better indicator of the pavement behavior. Statistically, the uniformity can be represented by the coeffiCient of variation (CV) of the crack spacing values. The time and condition of crack occurrence will also be of interest
4
CRACK WIDTH
A microscope capable of measuring crack openings to the closest 0.001 inch will be used for crack width measurements. Some of the variables to be considered that are believed to affect crack width are crack spacing, temperature, time of initiation, and location. Thermal coefficient and drying shrinkage of the concrete play an important role in crack width development. Since crack width is related to crack spacing, the associated magnitude of crack spacings should be recorded. The crack selected for the width study should be bounded by cracks such that the distance from the selected crack and the upstream crack would be about the same as that from the selected crack and the next downstream crack. Therefore the crack spacing should be approximately the same at both sides for the cracks selected for width study. When comparing test sections containing different coarse aggregates, the same crack spacing should be selected for crack width measurement
SPAUING
Spalling normally occurs at a crack or joint even though surface spalling has been noted occasionally. If surface spalling is found, observations should be recorded separately in the remarks area. For spalling along a crack, the severity levels can be either minor or severe. Minor spalling will be defmed as the loss of surface concrete in which the total width, from edge of spall to the crack, is 2 inches or less (from the edge of spall to edge of spall should be 4 inches or less). Severe spalling will have widths greater than 4 inches. The number of spalls at each severity level and the estimated average length will be recorded. There may be more than one spall along a crack, but only one lane width should be considered. This data item is more applicable in long-term monitoring.
PUNCHOUTS When a longitudinal crack traverses two transverse
cracks, a punchout occurs. If there is only one longitudinal crack between two transverse cracks, only one punchout will be noted; if two (parallel) longitudinal cracks are noted, two punchouts should be recorded, etc. If the block formed by the cracks does not move under traffic, the punchout will be considered minor. If the surrounding cracks are wide, the cracks are spalled, the block moves under traffic, and/or there are signs of pumping. the punchout will be considered severe. On many occasions, a transverse crack will "Y" or separate to become two or more cracks. Each location having this type of condition should be recorded under "Y cracks."
This item of data will also be more applicable in longterm monitoring.
PATCHES When the roadway has failed to the extent that sec
tions have been repaired, a record of these repairs is needed. When the repair consists of full depth replacement of paving material after removal of the failed areas in the existing pavement, the area will be considered as a patch. Asphaltic concrete repair and portland cement concrete repair patches are recorded separately. The condition of the patch is not noted; however, the size of the patch is recorded into one of three categories. These categories are related to the patch area-namely, 1 through 50, 51 through 100, and greater than 100 square feeL The numbers of patches falling into a given category will be recorded for each test section. This parameter will be considered in long-term monitoring.
TEST SECTION DESIGN Several criteria were established for the design of the
test sections in order to provide uniformity between sections, to permit the sections to be constructed as economically as possible, and to prevent the occurrence of extraneous variables. Some of these criteria are:
(1) The test sections could be relatively short but should be of length sufficient for obtaining usable data for empirical studies.
(2) The sections should be constructed such that the pavement thickness, the concrete coarse aggregate type, the steel percentage, and the bond area between the steel and concrete will be varied and will conform to a factorial design.
(3) The test sections should be approximately 300 feet from bridge ends to prevent cracking that is influenced by the terminal treatment at the bridge ends.
( 4) Transitions between sections should be established to provide for steel changes without bias between sections.
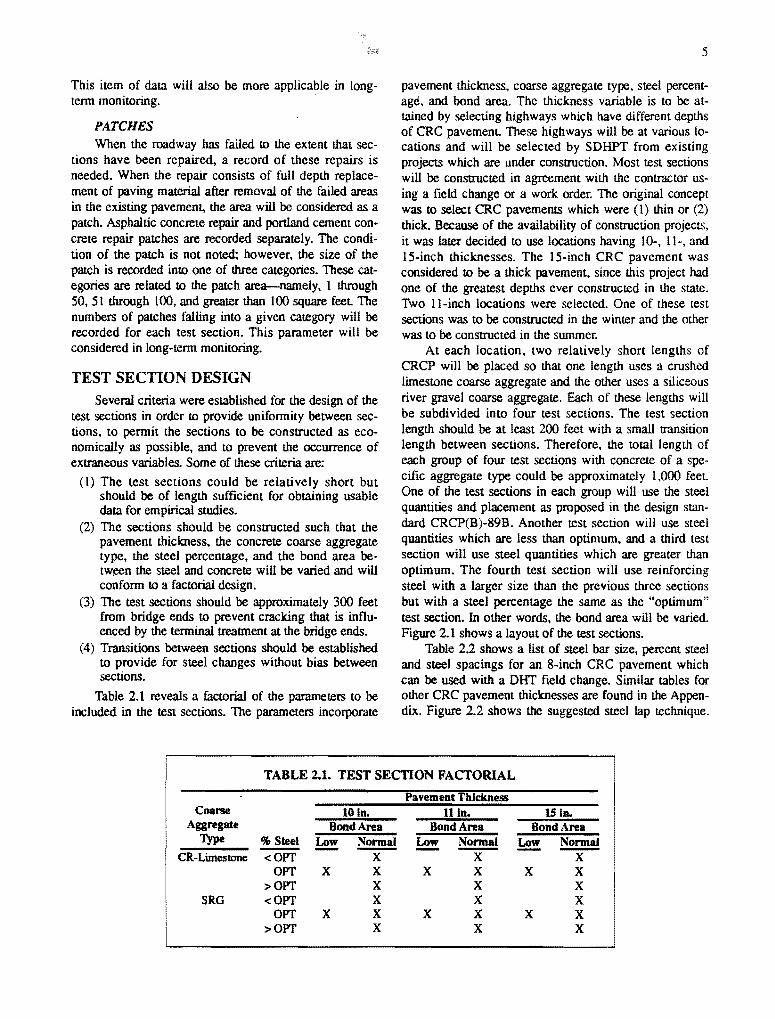
Table 2.1 reveals a factorial of the parameters to be included in the test sections. The parameters incorporate
5
pavement thickness, coarse aggregate type, steel percentage, and bond area. The thickness variable is to be attained by selecting highways which have different depths of CRC pavemenL These highways will be at various locations and will be selected by SDHPT from existing projects which are under construction. Most test sections will be constructed in agreement with the contractor using a field change or a work order. The original concept was to select CRC pavements which were (1) thin or (2) thick. Because of the availability of construction projects, it was later decided to use locations having 10-, 11-, and 15-inch thicknesses. The 15-inch CRC pavement was considered to be a thick pavement, since this project had one of the greatest depths ever constructed in the state. Two I l-inch locations were selected. One of these test sections was to be constructed in the winter and the other was to be constructed in the summer.
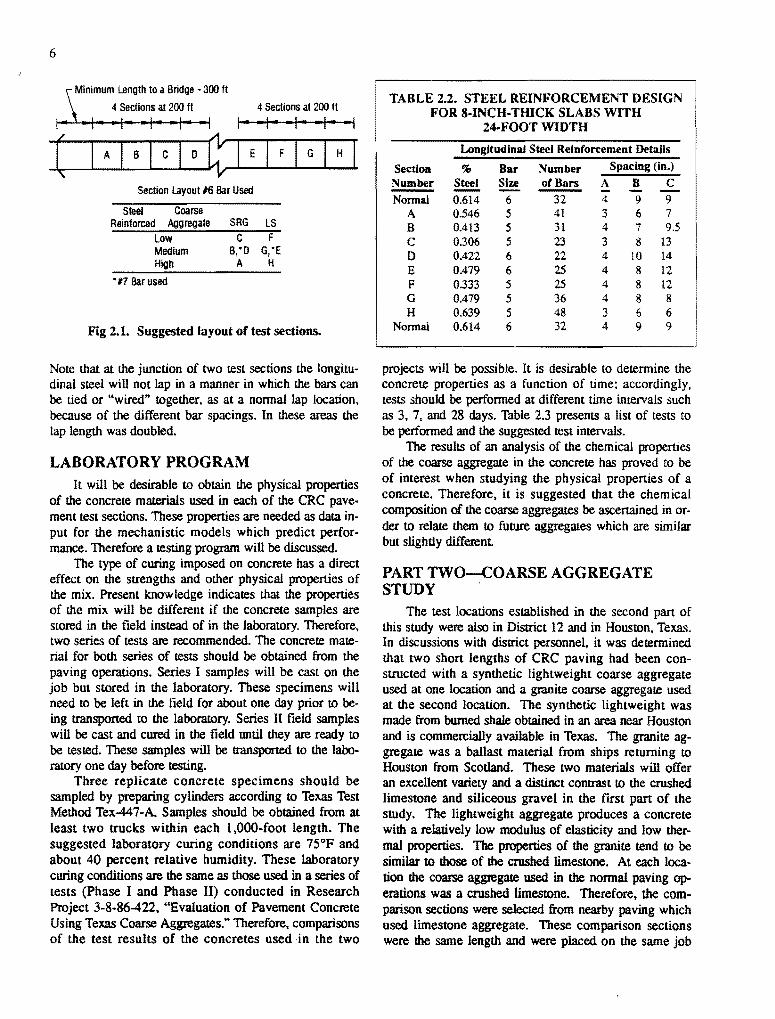
At each location, two relatively short lengths of CRCP will be placed so that one length uses a crushed limestone coarse aggregate and the other uses a siliceous river gravel coarse aggregate. Each of these lengths will be subdivided into four test sections. The test section length should be at least 200 feet with a small transition length between sections. Therefore, the total length of each group of four test sections with concrete of a specific aggregate type could be approximately 1,000 feet. One of the test sections in each group will use the steel quantities and placement as proposed in the design standard CRCP(B)-89B. Another test section will use steel quantities which are less than optimum, and a third test section will use steel quantities which are greater than optimum. The fourth test section will use reinforcing steel with a larger size than the previous three sections but with a steel percentage the same as the "optimum" test section. In other words, the bond area will be varied. Figure 2.1 shows a layout of the test sections.
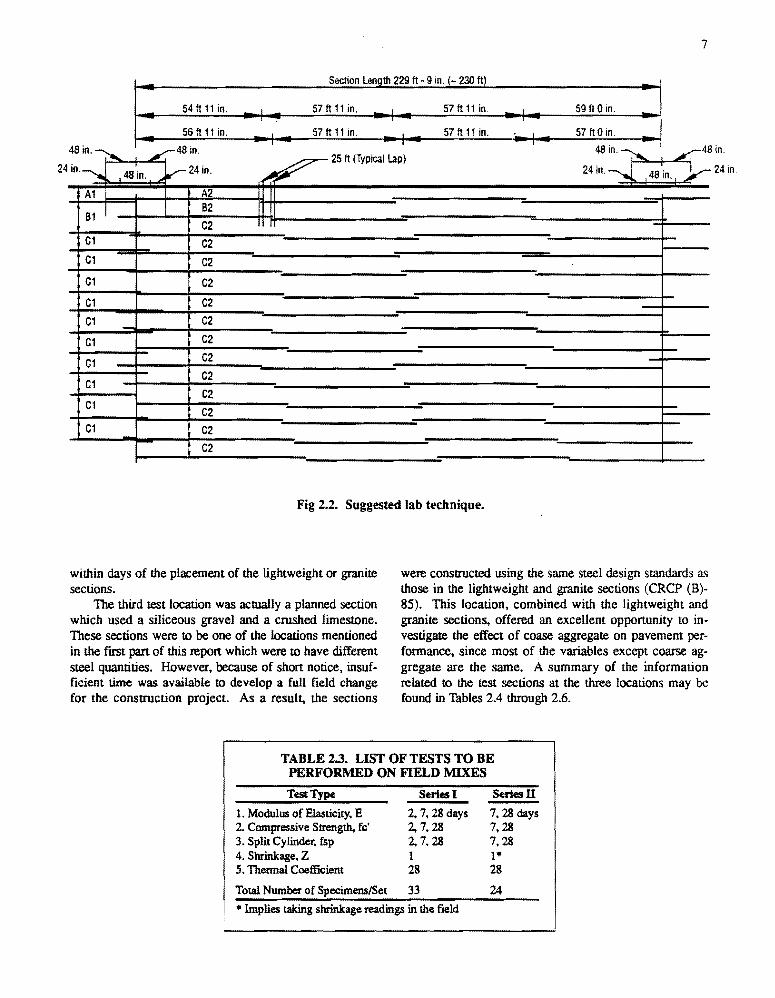
Table 2.2 shows a list of steel bar size, percent steel and steel spacings for an 8-inch CRC pavement which can be used with a DHT field change. Similar tables for other CRC pavement thicknesses are found in the Appendix. Figure 2.2 shows the suggested steel lap technique.
TABLE 2.1. TEST SECTION FACTORIAL
Pavement Thickness Coarse 10 ln. llln. IS ln.
Aggregate Bond Area Bond Area Bond Area Type %Steel 12!: Normal Low Normal Low Normal -CR-Limestone <OPT X X X
OPT X X X X X X >OPT X X X
SRG <:OPT X X X OPT X X X X X X
>OPT X X X
6
\Minimum Length to a Bridge • 300 ft
4 Sections at 200 ft 4 Sections at 200 ft
1-- •I• • I• ·I~ •I• ·I
Section Layout #6 Bar Used
Steel Coarse Reinforced Aggregate SRG LS
Low c F Medium B,"O G,'E High A H
"#7 Bar used
Fig 2.1. Suggested layout of test sections.
Note that at the junction of two test sections the longitu· dinal steel will not lap in a manner in which the bars can be tied or "wired" together, as at a normal lap location, because of the different bar spacings. In these areas the lap length was doubled.
LABORATORY PROGRAM It will be desirable to obtain the physical properties
of the concrete materials used in each of the CRC pavement test sections. These properties are needed as data input for the mechanistic models which predict performance. Therefore a testing program will be discussed.
The type of curing imposed on concrete has a direct effect on the strengths and other physical properties of the mix. Present knowledge indicates that the properties of the mix will be different if the concrete samples are stored in the field instead of in the laboratory. Therefore, two series of tests are recommended. The concrete material for both series of tests should be obtained from the paving operations. Series I samples will be cast on the job but stored in the laboratory. These specimens will need to be left in the field for about one day prior to being transported to the laboratory. Series II field samples will be cast and cured in the field until they are ready to be tested. These samples will be transported to the laboratory one day before testing.
Three replicate concrete specimens should be sampled by preparing cylinders according to Texas Test Method Tex-447-A. Samples should be obtained from at least two trucks within each 1 ,000-foot length. The suggested laboratory curing conditions are 75°F and about 40 percent relative humidity. These laboratory curing conditions are the same as those used in a series of tests (Phase I and Phase II) conducted in Research Project 3-8-86-422, "Evaluation of Pavement Concrete Using Texas Coarse Aggregates." Therefore, comparisons of the test results of the concretes used in the two
TABLE 2.2. STEEL REINFORCEMENT DESIGN FOR 8-INCH-THICK SLABS WITH
24-FOOT WIDTH
Longitudinal Steel Reinforcement Details
Section % Bar Number Spacing (ln.)
Number Steel Size of Bars A B c -Normal 0.614 6 32 4 9 9
A 0.546 5 41 3 6 7 B 0.413 5 31 4 7 9.5 c 0.306 5 23 3 8 13 D 0.422 6 22 4 10 14 E 0.479 6 25 4 8 12 F 0.333 5 25 4 8 12 G 0.479 5 36 4 8 8 H 0.639 5 48 3 6 6
Normal 0.614 6 32 4 9 9
projects will be possible. It is desirable to determine the concrete properties as a function of time; accordingly, tests should be performed at different time intervals such as 3, 7, and 28 days. Table 2.3 presents a list of tests to be performed and the suggested test intervals.
The results of an analysis of the chemical properties of the coarse aggregate in the concrete has proved to be of imerest when studying the physical properties of a concrete. Therefore, it is suggested that the chemical composition of the coarse aggregates be ascertained in or· der to relate them to future aggregates which are similar but slightly different
PART TWO-COARSE AGGREGATE STUDY
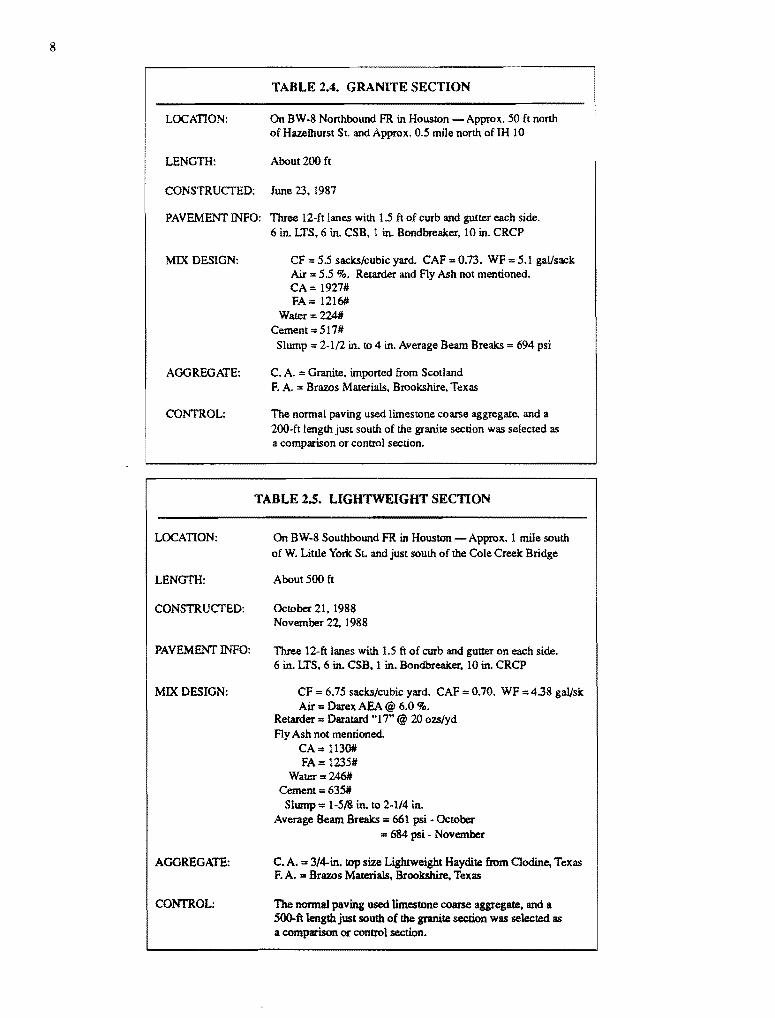
The test locations established in the second part of this study were also in District 12 and in Houston, Texas. In discussions with district personnel, it was determined that two short lengths of CRC paving had been constructed with a synthetic lightweight coarse aggregate used at one location and a granite coarse aggregate used at the second location. The synthetic lightweight was made from burned shale obtained in an area near Houston and is commercially available in Texas. The granite aggregate was a ballast material from ships returning to Houston from Scotland. These two materials will offer an excellent variety and a distinct contrast to the crushed limestone and siliceous gravel in the first part of the study. The lightweight aggregate produces a concrete with a relatively low modulus of elasticity and low thermal properties. The properties of the granite tend to be similar to those of the crushed limestone. At each location the coarse aggregate used in the normal paving operations was a crushed limestone. Therefore, the comparison sections were selected from nearby paving which used limestone aggregate. These comparison sections were the same length and were placed on the same job
24
7
Section length 229ft- 9 in. (-230ft)
54 It 11 in. 57 It 11 in. 57 It 11 in. 59ft 0 in.
56 It 11 in. 57 It 11 in. 57 It 11 in. 57ft0in. 48. 48
I 48. 10. 1n.;-,.... s.-· in.-.., 48in. ~24in.
~ 25 It (Typical Lap) 1n. ;-,....
24in.-J_ 48 in.
s.-· 48 in.
24 in.
A1 A2 82
81 C2
C1 C2 C1 C2
C1 C2
C1 C2 C1 C2
C1 C2
C1 C2
C1 C2 C2
C1 C2 C1 C2
C2
Fig 2.2. Suggested lab technique.
within days of the placement of the lightweight or granite sections.
The third test location was actually a planned section which used a siliceous gravel and a crushed limestone. These sections were to be one of the locations mentioned in the fJISt pan of this report which were to have different steel quantities. However, because of short notice, insufficient time was available to develop a full field change for the construction project. As a result, the sections
were constructed using the same steel design standards as those in the lightweight and granite sections (CRCP (B)-85). This location, combined with the lightweight and granite sections, offered an excellent opportunity to investigate the effect of coase aggregate on pavement performance, since most of the variables except coarse aggregate are the same. A summary of the information related to the test sections at the three locations may be found in Thbles 2.4 through 2.6.
TABLE 2.3. LIST OF TESTS TO BE PERFORMED ON FIELD MIXES
Test Type
1. Modulus of Elasticity, E 2. Compressive Strength. fc' 3. Split Cylinder, fsp 4. Shrinkage. Z 5. Thermal Coefficient
Total Number of Specimens/Set
Series I
2. 7, 28 days 2, 7, 28 2. 7, 28 1 28
33
"' Implies taking shrinkage readings in the field
Sertesll
7, 28 days 7,28 7,28 1"' 28
24
8
TABLE 2.4. GRANITE SECTION
LOCATION: On BW-8 Northbound FR in Houston -Approx. 50ft north of Hazelhurst St. and Approx. 0.5 mile north of IH 10
LENGTH: About 200 ft
CONSTRUCTED: June 23, 1987
PAVEMENT INFO: Three 12-ft lanes with 1.5 ft of curb and gutter each side. 6 in. LTS, 6 in. CSB, 1 in. Bondbreaker, 10 in. CRCP
MIX DESIGN:
AGGREGATE:
CONTROL:
CF = 5.5 sacks/cubic yard. CAF = 0.73. WF = 5.1 gaUsack Air= 5.5 %. Retarder and Fly Ash not mentioned. CA= 1927# FA= 1216#
Water= 224# Cement=517# Slump = 2-1/2 in. to 4 in. Average Beam Breaks = 694 psi
C. A. = Granite, imported from Scotland F. A.= Brazos Materials, Brookshire, Texas
The normal paving used limestone coarse aggregate, and a 200-ft length just south of the granite section was selected as a comparison or control section.
TABLE 2.5. LIGHTWEIGHT SECTION
LOCATION: On BW-8 Southbound FR in Houston-Approx. 1 mile south of W. Little York St. and just south of the Cole Creek Bridge
LENGTH: About 500 ft
CONSTRUCTED: October 21, 1988 November 22. 1988
PAVEMENT INFO: Three 12-ft lanes with 1.5 ft of curb and gutter on each side. 6 in. LTS, 6 in. CSB, 1 in. Bondbreaker, 10 in. CRCP
MIX DESIGN: CF = 6.75 sacks/cubic yard. CAF = 0.70. WF = 4.38 gal/sk Air= Darex AEA@ 6.0 %.
AGGREGATE:
CONTROL:
Retarder = Daratard "17"@ 20 ozs/yd Fly Ash not mentioned.
CA = 11301# FA= 1235#
Water=246# Cement = 635# Slump = 1-518 in. to 2-1/4 in.
Average Beam Breaks= 661 psi- October = 684 psi - November
C. A. = 3/4-in. top size Lightweight Haydite from Clodine, Texas F. A. = Brazos Materials, Brookshire, Texas
The normal paving used limestone coarse aggregate, and a 500-ft length just south of the granite section was selected as a comparison or control section.

TABLE 2.6. SILICEOUS SECTION
LOCATION: On U.S. 290 in Houston Approximately 1,000 ft south of Jones Road
LENGTH: About 1,000 ft
CONSTRUCTED:
PAVEMENT INFO: 6-l...ane Freeway with 12-ft lanes with AVL and a 12-ft outside shoulder on each side. 6-in. LTS, 6-in. CSB, l-in. Bondbreaker, 13-in. CRCP Section in AVL.
MIX DESIGN:
AGGREGATE:
CONTROL:
CF = 5.5 sacks/cubic yard. CAF = N.A. WF = 4.8 gal/sack Air= 5 %. Retarder not mentioned and 25%Ay Ash. CA= N.A. FA= N.A.
Water= N.A. Cement= N.A.# Slump= N.A. Average Beam Breaks = 694 psi
C. A. = Granite.. imported from Scotland F. A. = Brazos Materials, Brookshire, Texas
The normal paving used limestone coarse aggregate, and a 200-ft length just south of the granite section was selected as a comparison or control section.
9
CHAPTER 3. MONITORING FIELD PERFORMANCE
This chapter will suggest performance monitoring procedures for the test sections to be constructed and will then suggest data collection and recording sequences. In addition, the concepts of developing performance predictions will be presented, along with a discussion of performance calibration possibilities.
PLAN FOR MONITORING It has been suggested that both short-term and long
term monitoring be considered in this study. Short-term monitoring may be defined as a data collection period which begins immediately after construction and terminates after about one month. Data will be collected on several labor-intensive, closely-monitored items during this period. These data can be gathered without concern for traffic other than construction traffic. The long-term studies begin after the short-term. Again, data will be collected on several items, but longer periods between observations are proposed. It will be helpful to select data items which do not require lane closures during collection. The following outline shows the relationship between the short-term and the long-term studies:
A. SHORT-1ERM-EARLY AGE STUDY (1) Crack Spacing (2) Crack Width (3) Slab Movement ( 4) Air and Concrete Temperatures (5) Solar Radiation
B. LONG-TERM STUDY (1) Crack Spacing (2) Crack Width (3) Spalling (4) Punchouts (5) Patches (6) Deflection (using Dynaflect or FWD)
DISCUSSION OF PARAMETERS The following discussion presents more detailed in
formation about the parameters selected for study and their techniques of measurement. A number of measurements may be collected in the first several hours or days, followed by measurements taken over progressively longer periods.
CRACK SPACING
Crack spacing is of interest in both short-term and long-term collection periods. The distance between each crack will be measured to the nearest 0.1 foot and recorded for 200 feet, beginning 15 feet from a section
10
change. The 15 feet on each end of the section will be treated as a transition area. It is proposed that the observation date (or time in the short-term studies) of each newly-observed crack be recorded in ink on prepared forms.
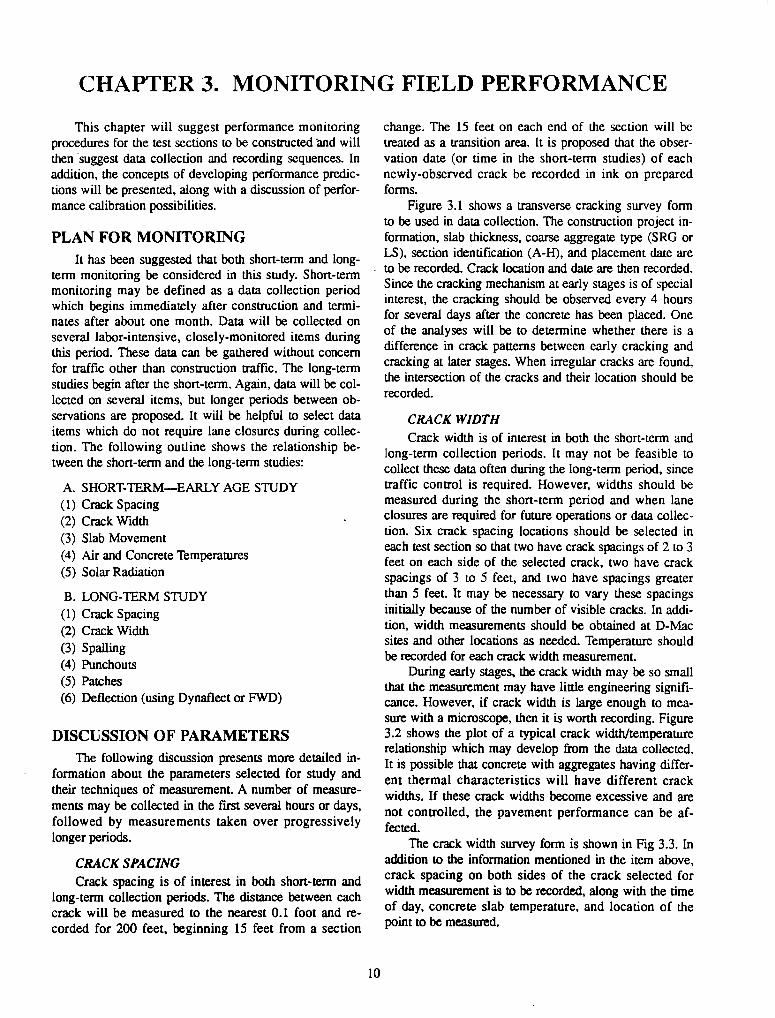
Figure 3.1 shows a transverse cracking survey form to be used in data collection. The construction project information, slab thickness, coarse aggregate type (SRG or LS), section identification (A-H), and placement date are to be recorded. Crack location and date are then recorded. Since the cracking mechanism at early stages is of special interest, the cracking should be observed every 4 hours for several days after the concrete has been placed. One of the analyses will be to determine whether there is a difference in crack patterns between early cracking and cracking at later stages. When irregular cracks are found, the intersection of the cracks and their location should be recorded.
CRACK WIDTH
Crack width is of interest in both the short-term and long-term collection periods. It may not be feasible to collect these data often during the long-term period, since traffic control is required. However, widths should be measured during the short-term period and when lane closures are required for future operations or data collection. Six crack spacing locations should be selected in each test section so that two have crack spacings of 2 to 3 feet on each side of the selected crack, two have crack spacings of 3 to 5 feet, and two have spacings greater than 5 feet. It may be necessary to vary these spacings initially because of the number of visible cracks. In addition, width measurements should be obtained at D-Mac sites and other locations as needed. Temperature should be recorded for each crack width measurement.
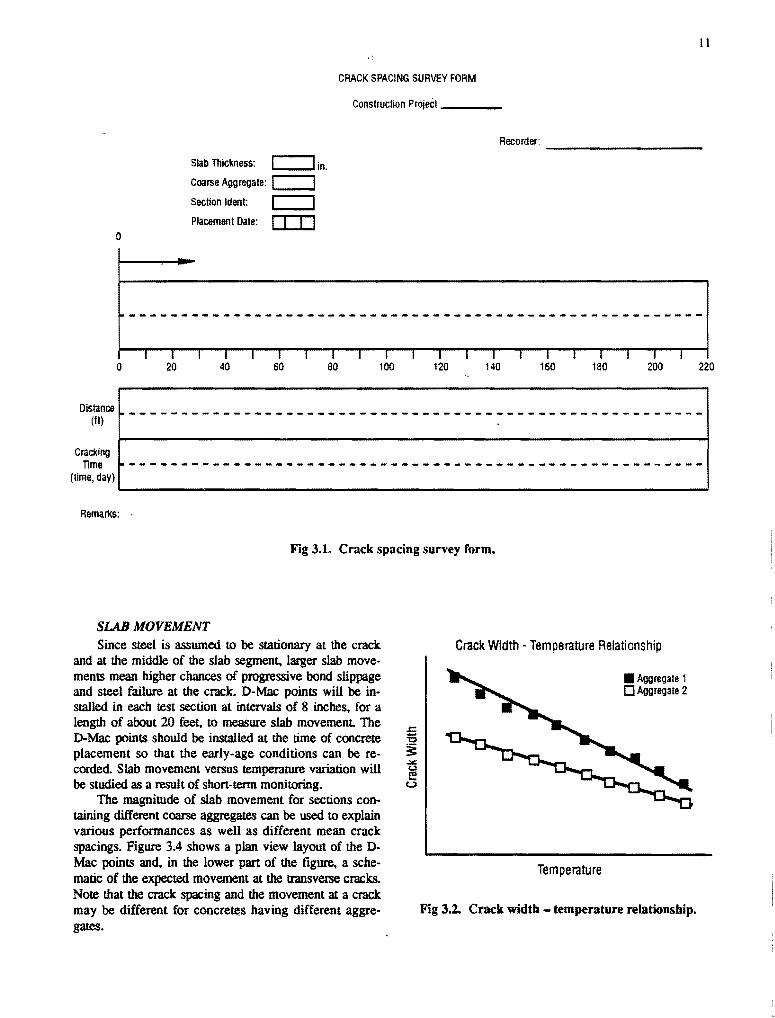
During early stages, the crack width may be so small that the measurement may have little engineering significance. However, if crack width is large enough to measure with a microscope, then it is worth recording. Figure 3.2 shows the plot of a typical crack width/temperature relationship which may develop from the data collected. It is possible that concrete with aggregates having different thermal characteristics will have different crack widths. If these crack widths become excessive and are not controlled, the pavement performance can be affected.
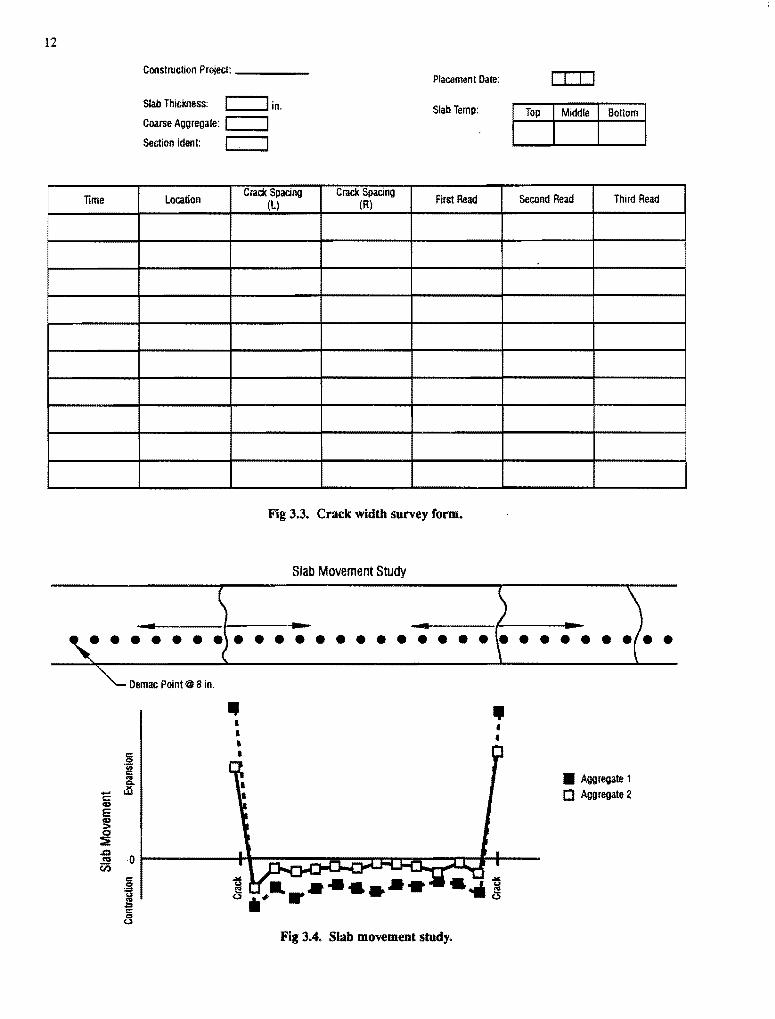
The crack width survey form is shown in Fig 3.3. In addition to the information mentioned in the item above, crack spacing on both sides of the crack selected for width measurement is to be recorded, along with the time of day, concrete slab temperature, and location of the point to be measured.
II
CRACK SPACING SURVEY FORM
Construction Project ___ _
Recorder: ----------
0
Slab Thickness: I in.
Coarse Aggregate: ::1 =~ Section ldent:
Placement Date:
~-------------------------------------------------------
I I I I I I I I I I I I I I I I I I I I I 0 20 40 60 80 100 120 140 160 180 200 220
Distance _______________________________________________________ _
~ .
Cracking
Time -------------------------------------------------------(time, day)
Remarks:
Fig 3.1. Crack spacing survey form.
SLAB MOVEMENT
Since steel is assumed to be stationary at the crack and at the middle of the slab segment. larger slab movements mean higher chances of progressive bond slippage and steel failure at the crack. D-Mac points will be installed in each test section at intervals of 8 inches, for a length of about 20 feet. to measure slab movement The D-Mac points should be installed at the time of concrete placement so that the early-age conditions can be recorded. Slab movement versus temperature variation will be studied as a result of short-term monitoring.
The magnitude of slab movement for sections containing different coarse aggregates can be used to explain various performances as well as different mean crack spacings. Figure 3.4 shows a plan view layout of the DMac points and, in the lower part of the figure, a schematic of the expected movement at the transverse cracks. Note that the crack spacing and the movement at a crack may be different for concre~s having different aggregates.
Crack Width- Temperature Relationship
Temperature
• Aggregate 1 0 Aggregate 2
Fig 3.2. Crack width - temperature relationship.
12
Time
Construction Project: -----Placement Date:
Slab Thickness: :==::::! in.
Coarse Aggregate: I I Slab Temp: Top Middle Bottom
Section ldent:
Location Crack Spacing Crack Spacing
First Read Second Read Third Read (l) (R)
Fig 3.3. Crack width survey form.
Slab Movement Study
--~-------~--------·---- .. Demac Point@ 8 in .
• • • • • • • • • • • • • • • • • •
.. I I I I
~ .. . ...... o Ill" r
Fig 3.4. Slab movement study.
' I I • Aggregate 1 [J Aggregate 2
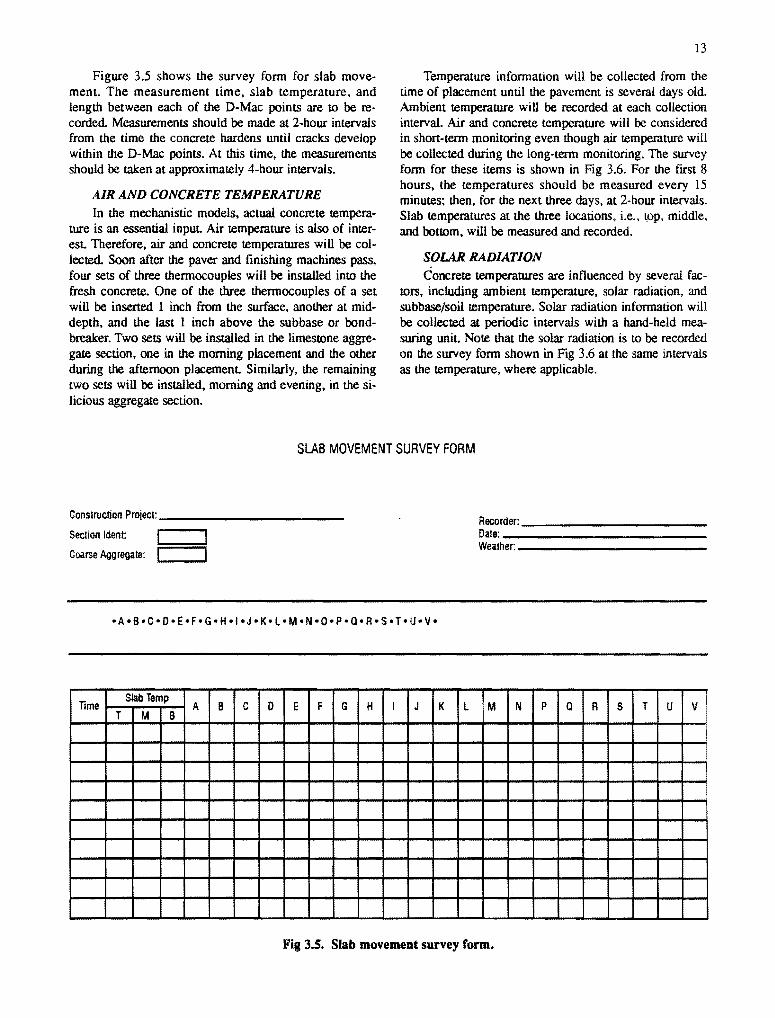
Figure 3.5 shows the survey form for slab movement. The measurement time, slab temperature, and length between each of the D-Mac points are to be recorded. Measurements should be made at 2-hour intervals from the time the concrete hardens until cracks develop within the D-Mac points. At this time, the measurements should be taken at approximately 4-hour intervals.
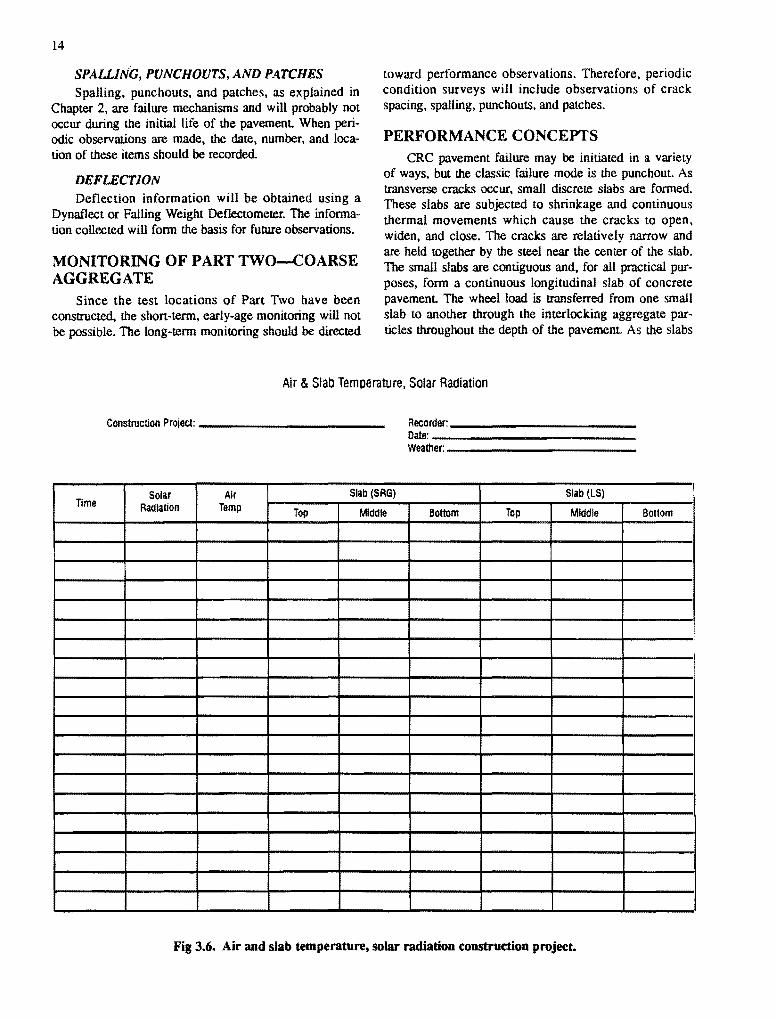
AIR AND CONCRETE TEMPERATURE
In the mechanistic models, actual concrete temperature is an essential input. Air temperature is also of interest. Therefore, air and concrete temperatures will be collected. Soon after the paver and finishing machines pass, four sets of three thermocouples will be installed into the fresh concrete. One of the three thermocouples of a set will be inserted I inch from the surface, another at middepth, and the last I inch above the subbase or bondbreaker. Two sets will be installed in the limestone aggregate section, one in the morning placement and the other during the afternoon placement. Similarly, the remaining two sets will be installed, morning and evening, in the silicious aggregate section.
13
Temperature information will be collected from the time of placement until the pavement is several days old. Ambient temperature will be recorded at each collection interval. Air and concrete temperature will be considered in shon-term monitoring even though air temperature will be collected during the long-term monitoring. The survey form for these items is shown in Fig 3.6. For the first 8 hours, the temperatures should be measured every 15 minutes; then, for the next three days, at 2-hour intervals. Slab temperatures at the three locations, i.e., top, middle, and bottom, will be measured and recorded.
SOLAR RADIATION Concrete temperatures are influenced by several fac
tors, including ambient temperature, solar radiation, and subbase/soil temperature. Solar radiation information will be collected at periodic intervals with a hand-held measuring unit. Note that the solar radiation is to be recorded on the survey form shown in Fig 3.6 at the same intervals as the temperature, where applicable.
SLAB MOVEMENT SURVEY FORM
Construction Project: ___________ _
Section ldent:
Coarse Aggregate:
Time Slab Temp
A 8 c D E F G H T M B
I J K l
Recorder: ___________ _
Date:------------Weather:------------
M N p a R s T u v i
I i
Fig 3.5. Slab movement survey form.
14
SPAUJNG, PUNCHOUTS, AND PATCHES Spalling, punchouts, and patches, as explained in
Chapter 2, are failure mechanisms and will probably not occur during the initial life of the pavemenL When periodic observations are made, the date, number, and location of these items should be recorded.
DEFLECTION Deflection information will be obtained using a
Dynaflect or Falling Weight Deflectometer. The information collected will form the basis for future observations.
MONITORING OF PART TWO-COARSE AGGREGATE
Since the test locations of Part Two have been constructed, the shon-term, early-age monitoring will not be possible. The long-term monitoring should be directed
toward performance observations. Therefore, periodic condition surveys will include observations of crack spacing, spalling, punchouts, and patches.
PERFORMANCE CONCEPTS CRC pavement failure may be initiated in a variety
of ways, but the classic failure mode is the punchout. As transverse cracks occur, small discrete slabs are formed. These slabs are subjected to shrinkage and continuous thermal movements which cause the cracks to open, widen, and close. The cracks are relatively narrow and are held together by the steel near the center of the slab. The small slabs are contiguous and, for all practical purposes, form a continuous longitudinal slab of concrete pavemenl The wheel load is transferred from one small slab to another through the interlocking aggregate particles throughout the depth of the pavement As the slabs
Air & Slab Temperature, Solar Radiation
Time
Construction Project:------------
Solar Air Slab (SRG) Radiation Temp Top Middle
Recorder: ___________ _
Date:------------Weather:------------
Slab (LS)
Bottom Top Middle
Fig 3.6. Air and slab temperature, solar radiation construction project.
Bottom
receive environmental and wheel loads, !.he deterioration process begins. The aggregate interlock begins to abrade and be crushed, with the greater damage occurring at wider cracks and heavier wheel loads. A localized loss of suppon !.hat results in relatively high slab deflections will deteriorate !.he aggregate interlock at a faster rate. When !.he aggregate interlock has abraded sufficiently, !.he small slabs are no longer contiguous but begin to act independently as small transverse beams. Under repeated wheel loads, longitudinal cracks are formed and punchouts occur.
Mechanistic models have been prepared to represent !.he above process as closely as possible. Concrete and steel propertieS are input into !.he models along with detailed environmental or weather information. This information, as well as location and structural information (thickness and steel quantities), permits !.he user to maintain bookkeeping and study various designs.
Derailed weather, materials strengl.h, l.hermal coefficients, and shrinkage data are difficult to obtain unless the data are collected on site during construction. However, if accurate input data can be obtained, accurate performance predictions result. The output of the program lists prediction of performance in terms of average crack spacing, crack width, and steel stress. With this information, concrete pavement designs (design standards) can and have been prepared.
Some of the more improved models permit the user to input curing time (the time from construction until wheel lmids are permitted) and !.he expected variance in material strengths. The material strength variance (coefficient of variation) should be developed from tests of the concrete paving material used on !.he length of roadway being considered. However, using this information, the models predict not only the average crack spacing but also the variation of !.he crack spacing. By applying fatigue loading models to !.he variously-sized slabs available from the crack spacing variance information, longitudinal cracks or punchout failures are predicted.
From the previous information, it may be noted !.hat the condition of a CRC pavement during its early life can be predicted if accurate and detailed environmental and materials information is available. Therefore, the newer models (CRCP-4 to CRCP-7) accept repetitive wheel load and curing time information in the fatigue model. This feature permits the user to predict the condition of the pavement at later time periods.
Therefore, the purpose of monitoring field performance is not only to acquire, compare, and repon the condition of the various pavement sections with time, but also to compare the early-age performance with the predicted performance. As this comparison is made, any deviation between the two is to be noted and corrections (calibration) or additions made to the models in the program. The revised program will then be used to predict long-term performance, with the design standards modified to reflect these conditions.
15
MEASUREMENTS Measurements of crack spacing and crack width will
be made at periodic time imervals. It is expected that cracking will occur frequently during the early ages and less frequently with increased age. Most of the initial cracking will probably be environmentally induced, but additional cracking may occur as both traffic loads and larger seasonal weather patterns occur. Variances in crack spacing are expected between the paving material types because of their different thermal and shrinkage properties. Variances in crack spacing are also expected between the test sections due to the different steel quantities. Similarly, crack widths will probably vary because of environmental conditions and material propenies. In addition, the width can be influenced by age and traffic.
PREDICTIONS Predictions of crack spacing and crack width will be
developed using the CRCP computer programs. CRCP-7 can be used to predict the average crack spacing and the crack spacing variation as well as average crack width. The following information should be used as inputs for the computer program:
(1) the laboratory test information of the propenies of the concrete used in the test sections, in addition to the steel properties information;
(2) the environmental and concrete temperature data to be collected during and after construction; and
(3) the design information for the various test sections such as thickness and steel quantity.
CALffiRATION NEEDS The prediction results available from the computer
runs will be compared with the actual measurements collected. From this comparison, calibration recommendations for the models will be made. This calibration may include adjustments to techniques or values within the models which will permit the program to produce more accurate predictions.
LONG-TERM PERFORMANCE PREDICTIONS
The output from the computer programs can be used to develop performance information by predicting crack spacing, crack width, and steel stress at various ages. The CRCP-7 progr.m uses the crack spacing and load information to produce estimates of the number of punchouts that will occur during the time period selected. By assuming the number of punchouts or failures per mile that will be permitted before reconstruction, the life-cycle time can be determined.
CHAPTER 4. FUTURE WORK
The previous chapter explained possible techniques whereby long-term performance can be estimated. Having determined the long-term performance, it will then be necessary to compare the differences in expected life between the various test sections to either verify the proposed design or determine those combinations of design factors which will provide equivalent life with maximum life cycles. The design procedure previously used to provide equivalent life cycles varied the steel quantities in order to provide comparable pavement life cycles. If calibration is needed to provide comparable performance, it may be possible to use the test section
16
information simply to adjust the steel quantttles. However, other design techniques, such as changes in concrete strength or the slab/subbase friction, may be needed.
Finally, the information available will provide input for revisions to the CRCP mechanistic programs if needed. As explained in previous chapters. the models within the programs may be modified by changing certain values or formats or by adding new elements so that the program may better predict performance. The models would then provide more accurate CRCP design procedures.

APPENDIX
TABLE A.l. STEEL REINFORCEMENT DESIGN WITH 24-FOOT WIDTH FOR
9-INCH· THICK SLABS
Longitudinal Steel Reinforcement Details
Section Bar Number Spacing (ln.)* Number % Size of Bars A 8 c Normal 0.615 6 36 4 8 8.0
A 0.529 5 44 4 7 6.5 8 0.432 5 36 4 8 8.0 c 0.324 5 27 4 8 11.0 D 0.426 6 25 3 9 12.0 E 0.529 6 31 3 8 9.5 F 0.432 5 36 4 8 8.0 G 0.529 5 44 4 7 6.5 H 0.589 5 49 3 3 6.0
Normal 0.615 6 36 4 8 8.0
TABLE A.2. STEEL REINFORCEMENT DESIGN WITH 24-FOOT WIDTH FOR
11-INCH-THICK SLABS
Longitudinal Steel Reinforcement Details
Section Bar Number Spacing (ln.)* Number % Size of Bars A B c Normal 0.573 6 41 4 7 7.0
A 0.629 6 45 3 4.5 6.5 B 0.531 6 38 4 9 7.5 c 0.418 6 30 3 6 10.0 D 0.533 7 28 3 3.5 11.0 E 0.629 7 33 3 6 9.0 F 0.516 6 37 3 5 8.0 G 0.615 6 44 4 7 6.5 H 0.685 6 49 3 3 6.0
Normal 0.573 6 41 4 7 7.0
TABLE A.3. STEEL REINFORCEMENT DESIGN WITH 24-FOOT WIDTH FOR
13-INCH-TIDCK SLABS
Longitudinal Steel Reinforcement Details
Section Bar Number Spacing (in.)* Number % Size of Bars A B c Normal 0.596 5 72 4 8 8
A 0.682 6 58 3.5 4 10.5 8 0.588 6 50 4 8 12 c 0.470 6 40 3.25 9 15.5 D 0.577 7 36 3 6 18 E 0.705 7 44 4 7 14 F 0.588 6 50 4 8 12 G 0.705 6 60 3 6 10 H 0.776 6 66 3 6 9
Normal 0.596 5 72 4 8 8
17

18
TABLE A.4. STEEL REINFORCEMENT DESIGN WITH 24-FOOT WIDTH FOR
14-INCH-THICK SLABS
Longitudinal Steel Reinforcement Details
Section Bar Number Spacing (ln.)•
Number % Size oCBars A B c Normal 0.634 5 82 4 7 7
A 0.725 6 66 4 6 9 B 0.637 6 58 3 9 10 c 0.549 6 50 4 8 12 D 0.629 7 42 4 6 15 E 0.719 7 48 3 4.5 13 F 0.615 6 56 3 3.5 11 G 0.703 6 64 4 9 9 H 0.814 6 74 3 5 8
Normal 0.634 5 82 4 7 7
TABLE A.S. STEEL REINFORCEMENT DESIGN FOR 12-INCH-THICK SLABS WITH
24-FOOT WIDTH
Longitudinal Steel Reinforcement DetaUs
Section Bar Sumber Spacing (In,)•
Number % Size or Bars A B c Normal 0.614 6 48 3 6 6
A 0.741 6 58 3 3.5 5 B 0.575 6 45 3 4.5 6.5 c 0.383 6 30 3 6 9 D 0.574 7 33 3 6 9 E 0.479 7 36 4 8 8 F 0.422 6 33 3 6 9 G 0.614 6 48 3 6 6 H 0.818 6 64 3 4 4.5
Normal 0.614 6 48 3 6 6