Embed Size (px)
Citation preview
Fidelity Emerging Markets Fund
Semi-Annual ReportSeptember 30, 2017
Notice to Readers The accompanying interim financial statements have not been reviewed by the external auditor of the Fund. The external auditor will be auditing the annual financial statements of the Fund in accordance with Canadian generally accepted auditing standards.
2Semi-Annual Reportport
See accompanying notes which are an integral part of the financial statements.
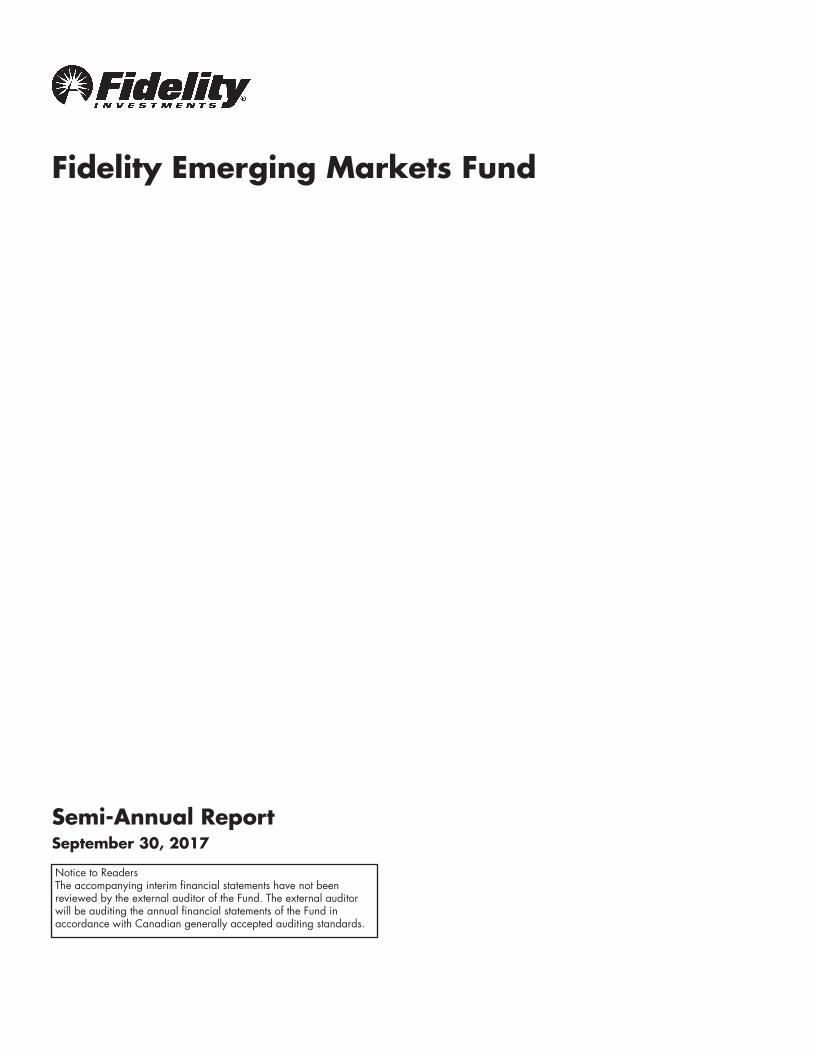
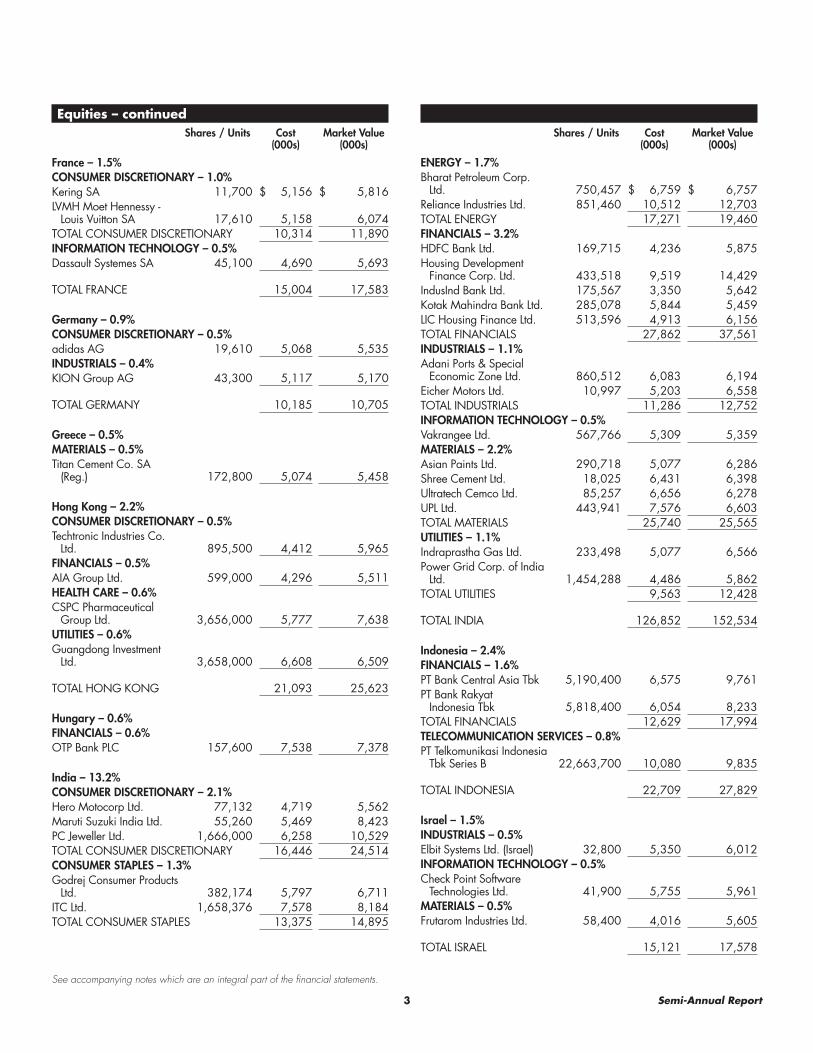
Equities – 99.0%Shares / Units Cost
(000s)Market Value
(000s)
Argentina – 1.0%FINANCIALS – 0.5%Banco Macro SA
sponsored ADR 43,004 $ 4,935 $ 6,297TELECOMMUNICATION SERVICES – 0.5%Telecom Argentina SA
Class B sponsored ADR 147,226 5,384 5,665
TOTAL ARGENTINA 10,319 11,962
Australia – 0.5%MATERIALS – 0.5%Amcor Ltd. 354,959 4,939 5,284
Bermuda – 0.8%FINANCIALS – 0.8%Credicorp Ltd. (United
States) 34,600 5,773 8,851
Brazil – 6.8%CONSUMER DISCRETIONARY – 2.3%Estacio Participacoes SA 524,900 3,033 6,409Kroton Educacional SA 1,004,100 4,524 7,931Lojas Renner SA 486,300 6,369 6,909Smiles SA 186,100 3,138 5,901TOTAL CONSUMER DISCRETIONARY 17,064 27,150CONSUMER STAPLES – 0.6%Drogasil SA 233,025 6,251 6,885FINANCIALS – 2.7%BM&F BOVESPA SA 1,005,500 8,392 9,487IRB Brasil Resseguros SA 491,800 5,393 5,861Itau Unibanco Holding SA 957,040 10,670 16,345TOTAL FINANCIALS 24,455 31,693HEALTH CARE – 0.6%Qualicorp SA 461,700 3,105 6,894UTILITIES – 0.6%Equatorial Energia SA 269,400 5,899 6,501
TOTAL BRAZIL 56,774 79,123
Cayman Islands – 16.6%CONSUMER DISCRETIONARY – 3.2%Ctrip.com International
Ltd. ADR 159,300 9,271 10,483Fu Shou Yuan International
Group Ltd. 135,000 110 111JD.com, Inc.
sponsored ADR 230,000 12,571 10,963New Oriental Education &
Technology Group, Inc. sponsored ADR 80,900 4,067 8,909
Shenzhou International Group Holdings Ltd. 682,000 4,944 6,667
TOTAL CONSUMER DISCRETIONARY 30,963 37,133INFORMATION TECHNOLOGY – 13.4%58.com, Inc. ADR 36,791 2,834 2,899
Fidelity Emerging Markets Fund
Schedule of Investments September 30, 2017 (Unaudited)Showing Percentage of Net Assets Attributable to Securityholders (Net Assets)
Shares / Units Cost
(000s)Market Value
(000s)
Alibaba Group Holding Ltd. sponsored ADR 234,900 $ 25,458 $ 50,621
Baidu.com, Inc. sponsored ADR 69,200 18,744 21,387
NetEase, Inc. ADR 31,430 8,980 10,346SINA Corp. 51,300 6,066 7,339Tencent Holdings Ltd. 1,141,700 28,433 62,283TOTAL INFORMATION TECHNOLOGY 90,515 154,875
TOTAL CAYMAN ISLANDS 121,478 192,008
China – 6.7%CONSUMER DISCRETIONARY – 1.5%Gree Electric Appliances,
Inc. of Zhuhai Class A 767,900 3,672 5,458Hangzhou Robam
Appliances Co. Ltd. Class A 751,890 6,128 5,958
Midea Group Co. Ltd. Class A 757,061 4,609 6,274
TOTAL CONSUMER DISCRETIONARY 14,409 17,690CONSUMER STAPLES – 2.2%Inner Mongoli Yili
Industries Co. Ltd. (A Shares) 1,327,996 4,143 6,849
Jiangsu Yanghe Brewery Joint‑Stock Co. Ltd. Class A 350,000 5,733 6,662
Kweichow Moutai Co. Ltd. (A Shares) 63,991 2,768 6,212
Wuliangye Yibin Co. Ltd. Class A 549,900 3,863 5,907
TOTAL CONSUMER STAPLES 16,507 25,630HEALTH CARE – 1.5%Jiangsu Hengrui Medicine
Co. Ltd. (A Shares) 543,294 3,347 6,106Tonghua Dongbao
Pharmaceutical Co. Ltd. Class A 1,417,100 5,061 5,129
Yunnan Baiyao Group Co. Ltd. 353,242 5,929 6,008
TOTAL HEALTH CARE 14,337 17,243INDUSTRIALS – 1.0%Shanghai International
Airport Co. Ltd. (A Shares) 762,965 4,307 5,434
Shenzhen Inovance Technology Co. Ltd. Class A 1,090,200 4,892 5,909
TOTAL INDUSTRIALS 9,199 11,343INFORMATION TECHNOLOGY – 0.5%Hangzhou Hikvision
Digital Technology Co. Ltd. Class A 957,100 3,713 5,744
TOTAL CHINA 58,165 77,650
3 Semi-Annual Report
See accompanying notes which are an integral part of the financial statements.
Equities – continuedShares / Units Cost
(000s)Market Value
(000s)
France – 1.5%CONSUMER DISCRETIONARY – 1.0%Kering SA 11,700 $ 5,156 $ 5,816LVMH Moet Hennessy ‑
Louis Vuitton SA 17,610 5,158 6,074TOTAL CONSUMER DISCRETIONARY 10,314 11,890INFORMATION TECHNOLOGY – 0.5%Dassault Systemes SA 45,100 4,690 5,693
TOTAL FRANCE 15,004 17,583
Germany – 0.9%CONSUMER DISCRETIONARY – 0.5%adidas AG 19,610 5,068 5,535INDUSTRIALS – 0.4%KION Group AG 43,300 5,117 5,170
TOTAL GERMANY 10,185 10,705
Greece – 0.5%MATERIALS – 0.5%Titan Cement Co. SA
(Reg.) 172,800 5,074 5,458
Hong Kong – 2.2%CONSUMER DISCRETIONARY – 0.5%Techtronic Industries Co.
Ltd. 895,500 4,412 5,965FINANCIALS – 0.5%AIA Group Ltd. 599,000 4,296 5,511HEALTH CARE – 0.6%CSPC Pharmaceutical
Group Ltd. 3,656,000 5,777 7,638UTILITIES – 0.6%Guangdong Investment
Ltd. 3,658,000 6,608 6,509
TOTAL HONG KONG 21,093 25,623
Hungary – 0.6%FINANCIALS – 0.6%OTP Bank PLC 157,600 7,538 7,378
India – 13.2%CONSUMER DISCRETIONARY – 2.1%Hero Motocorp Ltd. 77,132 4,719 5,562Maruti Suzuki India Ltd. 55,260 5,469 8,423PC Jeweller Ltd. 1,666,000 6,258 10,529TOTAL CONSUMER DISCRETIONARY 16,446 24,514CONSUMER STAPLES – 1.3%Godrej Consumer Products
Ltd. 382,174 5,797 6,711ITC Ltd. 1,658,376 7,578 8,184TOTAL CONSUMER STAPLES 13,375 14,895
Shares / Units Cost
(000s)Market Value
(000s)
ENERGY – 1.7%Bharat Petroleum Corp.
Ltd. 750,457 $ 6,759 $ 6,757Reliance Industries Ltd. 851,460 10,512 12,703TOTAL ENERGY 17,271 19,460FINANCIALS – 3.2%HDFC Bank Ltd. 169,715 4,236 5,875Housing Development
Finance Corp. Ltd. 433,518 9,519 14,429IndusInd Bank Ltd. 175,567 3,350 5,642Kotak Mahindra Bank Ltd. 285,078 5,844 5,459LIC Housing Finance Ltd. 513,596 4,913 6,156TOTAL FINANCIALS 27,862 37,561INDUSTRIALS – 1.1%Adani Ports & Special
Economic Zone Ltd. 860,512 6,083 6,194Eicher Motors Ltd. 10,997 5,203 6,558TOTAL INDUSTRIALS 11,286 12,752INFORMATION TECHNOLOGY – 0.5%Vakrangee Ltd. 567,766 5,309 5,359MATERIALS – 2.2%Asian Paints Ltd. 290,718 5,077 6,286Shree Cement Ltd. 18,025 6,431 6,398Ultratech Cemco Ltd. 85,257 6,656 6,278UPL Ltd. 443,941 7,576 6,603TOTAL MATERIALS 25,740 25,565UTILITIES – 1.1%Indraprastha Gas Ltd. 233,498 5,077 6,566Power Grid Corp. of India
Ltd. 1,454,288 4,486 5,862TOTAL UTILITIES 9,563 12,428
TOTAL INDIA 126,852 152,534
Indonesia – 2.4%FINANCIALS – 1.6%PT Bank Central Asia Tbk 5,190,400 6,575 9,761PT Bank Rakyat
Indonesia Tbk 5,818,400 6,054 8,233TOTAL FINANCIALS 12,629 17,994TELECOMMUNICATION SERVICES – 0.8%PT Telkomunikasi Indonesia
Tbk Series B 22,663,700 10,080 9,835
TOTAL INDONESIA 22,709 27,829
Israel – 1.5%INDUSTRIALS – 0.5%Elbit Systems Ltd. (Israel) 32,800 5,350 6,012INFORMATION TECHNOLOGY – 0.5%Check Point Software
Technologies Ltd. 41,900 5,755 5,961MATERIALS – 0.5%Frutarom Industries Ltd. 58,400 4,016 5,605
TOTAL ISRAEL 15,121 17,578
4Semi-Annual Reportport
See accompanying notes which are an integral part of the financial statements.
Fidelity Emerging Markets FundSchedule of Investments (Unaudited) – continued
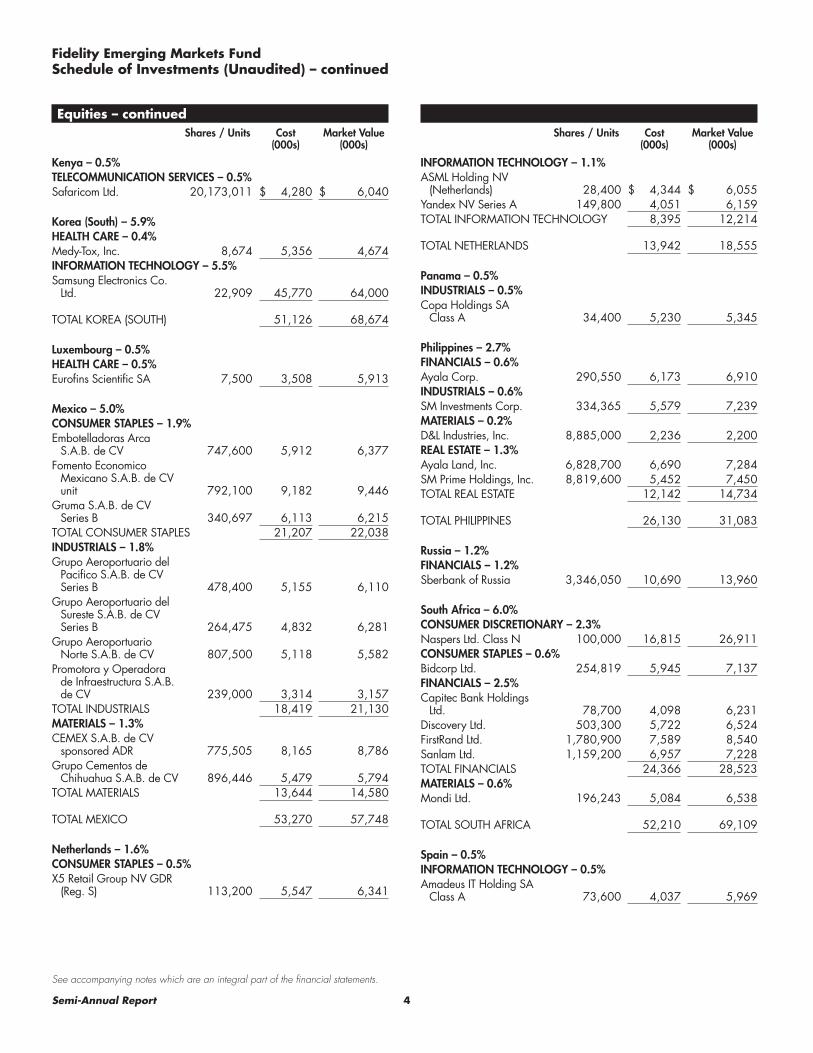
Equities – continuedShares / Units Cost
(000s)Market Value
(000s)
Kenya – 0.5%TELECOMMUNICATION SERVICES – 0.5%Safaricom Ltd. 20,173,011 $ 4,280 $ 6,040
Korea (South) – 5.9%HEALTH CARE – 0.4%Medy‑Tox, Inc. 8,674 5,356 4,674INFORMATION TECHNOLOGY – 5.5%Samsung Electronics Co.
Ltd. 22,909 45,770 64,000
TOTAL KOREA (SOUTH) 51,126 68,674
Luxembourg – 0.5%HEALTH CARE – 0.5%Eurofins Scientific SA 7,500 3,508 5,913
Mexico – 5.0%CONSUMER STAPLES – 1.9%Embotelladoras Arca
S.A.B. de CV 747,600 5,912 6,377Fomento Economico
Mexicano S.A.B. de CV unit 792,100 9,182 9,446
Gruma S.A.B. de CV Series B 340,697 6,113 6,215
TOTAL CONSUMER STAPLES 21,207 22,038INDUSTRIALS – 1.8%Grupo Aeroportuario del
Pacifico S.A.B. de CV Series B 478,400 5,155 6,110
Grupo Aeroportuario del Sureste S.A.B. de CV Series B 264,475 4,832 6,281
Grupo Aeroportuario Norte S.A.B. de CV 807,500 5,118 5,582
Promotora y Operadora de Infraestructura S.A.B. de CV 239,000 3,314 3,157
TOTAL INDUSTRIALS 18,419 21,130MATERIALS – 1.3%CEMEX S.A.B. de CV
sponsored ADR 775,505 8,165 8,786Grupo Cementos de
Chihuahua S.A.B. de CV 896,446 5,479 5,794TOTAL MATERIALS 13,644 14,580
TOTAL MEXICO 53,270 57,748
Netherlands – 1.6%CONSUMER STAPLES – 0.5%X5 Retail Group NV GDR
(Reg. S) 113,200 5,547 6,341
Shares / Units Cost
(000s)Market Value
(000s)
INFORMATION TECHNOLOGY – 1.1%ASML Holding NV
(Netherlands) 28,400 $ 4,344 $ 6,055Yandex NV Series A 149,800 4,051 6,159TOTAL INFORMATION TECHNOLOGY 8,395 12,214
TOTAL NETHERLANDS 13,942 18,555
Panama – 0.5%INDUSTRIALS – 0.5%Copa Holdings SA
Class A 34,400 5,230 5,345
Philippines – 2.7%FINANCIALS – 0.6%Ayala Corp. 290,550 6,173 6,910INDUSTRIALS – 0.6%SM Investments Corp. 334,365 5,579 7,239MATERIALS – 0.2%D&L Industries, Inc. 8,885,000 2,236 2,200REAL ESTATE – 1.3%Ayala Land, Inc. 6,828,700 6,690 7,284SM Prime Holdings, Inc. 8,819,600 5,452 7,450TOTAL REAL ESTATE 12,142 14,734
TOTAL PHILIPPINES 26,130 31,083
Russia – 1.2%FINANCIALS – 1.2%Sberbank of Russia 3,346,050 10,690 13,960
South Africa – 6.0%CONSUMER DISCRETIONARY – 2.3%Naspers Ltd. Class N 100,000 16,815 26,911CONSUMER STAPLES – 0.6%Bidcorp Ltd. 254,819 5,945 7,137FINANCIALS – 2.5%Capitec Bank Holdings
Ltd. 78,700 4,098 6,231Discovery Ltd. 503,300 5,722 6,524FirstRand Ltd. 1,780,900 7,589 8,540Sanlam Ltd. 1,159,200 6,957 7,228TOTAL FINANCIALS 24,366 28,523MATERIALS – 0.6%Mondi Ltd. 196,243 5,084 6,538
TOTAL SOUTH AFRICA 52,210 69,109
Spain – 0.5%INFORMATION TECHNOLOGY – 0.5%Amadeus IT Holding SA
Class A 73,600 4,037 5,969
5 Semi-Annual Report
See accompanying notes which are an integral part of the financial statements.
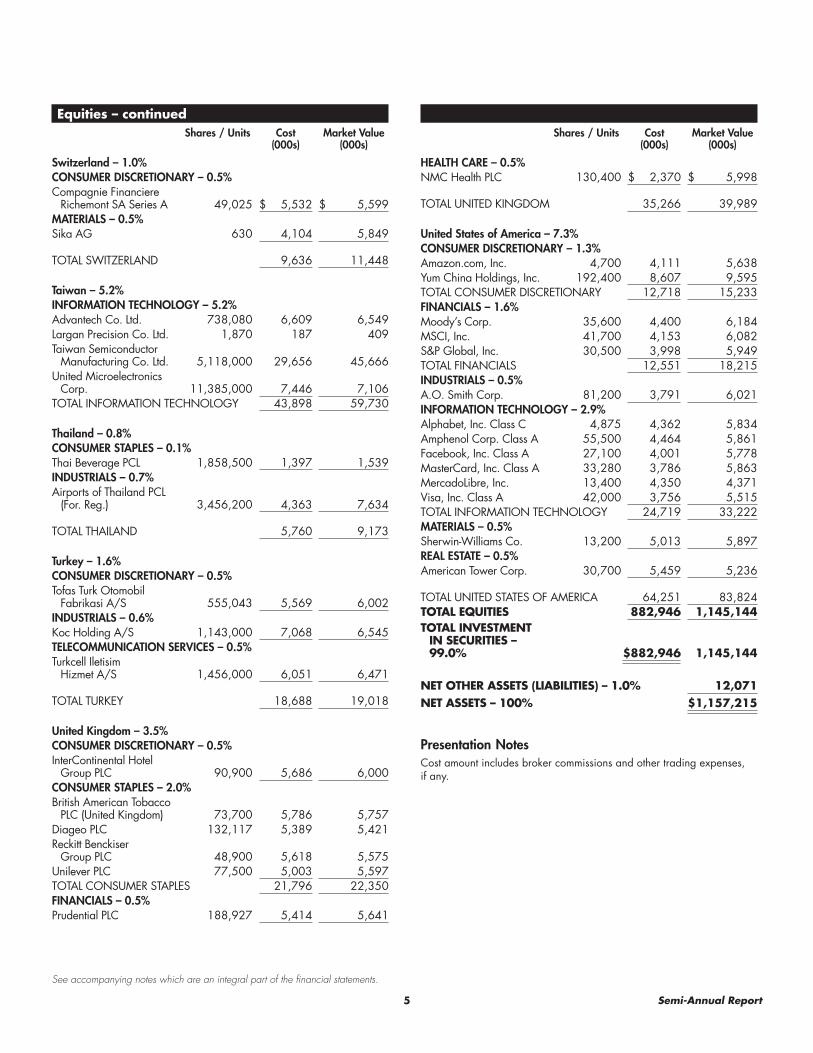
Equities – continuedShares / Units Cost
(000s)Market Value
(000s)
Switzerland – 1.0%CONSUMER DISCRETIONARY – 0.5%Compagnie Financiere
Richemont SA Series A 49,025 $ 5,532 $ 5,599MATERIALS – 0.5%Sika AG 630 4,104 5,849
TOTAL SWITZERLAND 9,636 11,448
Taiwan – 5.2%INFORMATION TECHNOLOGY – 5.2%Advantech Co. Ltd. 738,080 6,609 6,549Largan Precision Co. Ltd. 1,870 187 409Taiwan Semiconductor
Manufacturing Co. Ltd. 5,118,000 29,656 45,666United Microelectronics
Corp. 11,385,000 7,446 7,106TOTAL INFORMATION TECHNOLOGY 43,898 59,730
Thailand – 0.8%CONSUMER STAPLES – 0.1%Thai Beverage PCL 1,858,500 1,397 1,539INDUSTRIALS – 0.7%Airports of Thailand PCL
(For. Reg.) 3,456,200 4,363 7,634
TOTAL THAILAND 5,760 9,173
Turkey – 1.6%CONSUMER DISCRETIONARY – 0.5%Tofas Turk Otomobil
Fabrikasi A/S 555,043 5,569 6,002INDUSTRIALS – 0.6%Koc Holding A/S 1,143,000 7,068 6,545TELECOMMUNICATION SERVICES – 0.5%Turkcell Iletisim
Hizmet A/S 1,456,000 6,051 6,471
TOTAL TURKEY 18,688 19,018
United Kingdom – 3.5%CONSUMER DISCRETIONARY – 0.5%InterContinental Hotel
Group PLC 90,900 5,686 6,000CONSUMER STAPLES – 2.0%British American Tobacco
PLC (United Kingdom) 73,700 5,786 5,757Diageo PLC 132,117 5,389 5,421Reckitt Benckiser
Group PLC 48,900 5,618 5,575Unilever PLC 77,500 5,003 5,597TOTAL CONSUMER STAPLES 21,796 22,350FINANCIALS – 0.5%Prudential PLC 188,927 5,414 5,641
Shares / Units Cost
(000s)Market Value
(000s)
HEALTH CARE – 0.5%NMC Health PLC 130,400 $ 2,370 $ 5,998
TOTAL UNITED KINGDOM 35,266 39,989
United States of America – 7.3%CONSUMER DISCRETIONARY – 1.3%Amazon.com, Inc. 4,700 4,111 5,638Yum China Holdings, Inc. 192,400 8,607 9,595TOTAL CONSUMER DISCRETIONARY 12,718 15,233FINANCIALS – 1.6%Moody’s Corp. 35,600 4,400 6,184MSCI, Inc. 41,700 4,153 6,082S&P Global, Inc. 30,500 3,998 5,949TOTAL FINANCIALS 12,551 18,215INDUSTRIALS – 0.5%A.O. Smith Corp. 81,200 3,791 6,021INFORMATION TECHNOLOGY – 2.9%Alphabet, Inc. Class C 4,875 4,362 5,834Amphenol Corp. Class A 55,500 4,464 5,861Facebook, Inc. Class A 27,100 4,001 5,778MasterCard, Inc. Class A 33,280 3,786 5,863MercadoLibre, Inc. 13,400 4,350 4,371Visa, Inc. Class A 42,000 3,756 5,515TOTAL INFORMATION TECHNOLOGY 24,719 33,222MATERIALS – 0.5%Sherwin‑Williams Co. 13,200 5,013 5,897REAL ESTATE – 0.5%American Tower Corp. 30,700 5,459 5,236
TOTAL UNITED STATES OF AMERICA 64,251 83,824TOTAL EQUITIES 882,946 1,145,144TOTAL INVESTMENT
IN SECURITIES – 99.0% $882,946 1,145,144
NET OTHER ASSETS (LIABILITIES) – 1.0% 12,071NET ASSETS – 100% $ 1,157,215
Presentation Notes Cost amount includes broker commissions and other trading expenses, if any.
6Semi-Annual Reportport
See accompanying notes which are an integral part of the financial statements.
Fidelity Emerging Markets FundSchedule of Investments (Unaudited) – continued
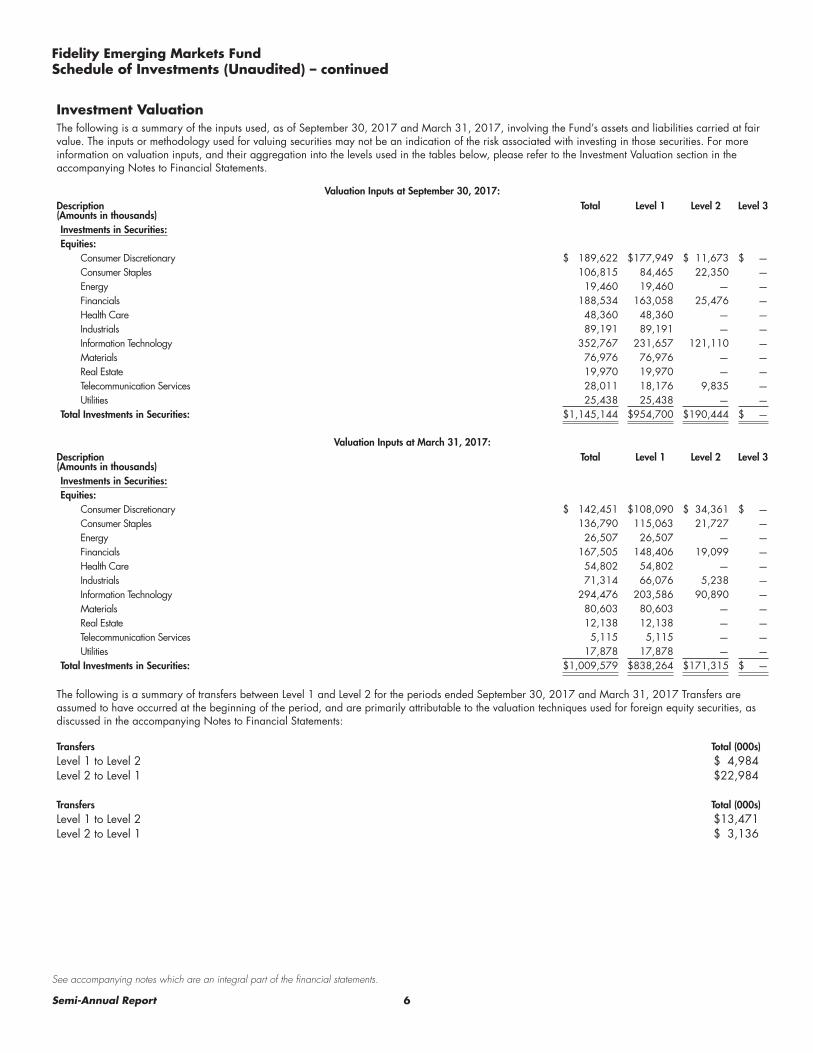
Investment ValuationThe following is a summary of the inputs used, as of September 30, 2017 and March 31, 2017, involving the Fund’s assets and liabilities carried at fair value. The inputs or methodology used for valuing securities may not be an indication of the risk associated with investing in those securities. For more information on valuation inputs, and their aggregation into the levels used in the tables below, please refer to the Investment Valuation section in the accompanying Notes to Financial Statements.
Valuation Inputs at September 30, 2017:Description Total Level 1 Level 2 Level 3(Amounts in thousands)Investments in Securities:Equities:
Consumer Discretionary $ 189,622 $ 177,949 $ 11,673 $ —Consumer Staples 106,815 84,465 22,350 —Energy 19,460 19,460 — —Financials 188,534 163,058 25,476 —Health Care 48,360 48,360 — —Industrials 89,191 89,191 — —Information Technology 352,767 231,657 121,110 —Materials 76,976 76,976 — —Real Estate 19,970 19,970 — —Telecommunication Services 28,011 18,176 9,835 —Utilities 25,438 25,438 — —
Total Investments in Securities: $ 1,145,144 $ 954,700 $ 190,444 $ —
Valuation Inputs at March 31, 2017:Description Total Level 1 Level 2 Level 3(Amounts in thousands)Investments in Securities:Equities:
Consumer Discretionary $ 142,451 $ 108,090 $ 34,361 $ —Consumer Staples 136,790 115,063 21,727 —Energy 26,507 26,507 — —Financials 167,505 148,406 19,099 —Health Care 54,802 54,802 — —Industrials 71,314 66,076 5,238 —Information Technology 294,476 203,586 90,890 —Materials 80,603 80,603 — —Real Estate 12,138 12,138 — —Telecommunication Services 5,115 5,115 — —Utilities 17,878 17,878 — —
Total Investments in Securities: $ 1,009,579 $ 838,264 $ 171,315 $ —
The following is a summary of transfers between Level 1 and Level 2 for the periods ended September 30, 2017 and March 31, 2017 Transfers are assumed to have occurred at the beginning of the period, and are primarily attributable to the valuation techniques used for foreign equity securities, as discussed in the accompanying Notes to Financial Statements:
Transfers Total (000s)Level 1 to Level 2 $ 4,984Level 2 to Level 1 $ 22,984
Transfers Total (000s)Level 1 to Level 2 $ 13,471Level 2 to Level 1 $ 3,136
7 Semi-Annual Report
See accompanying notes which are an integral part of the financial statements.
Financial Statements (Unaudited)
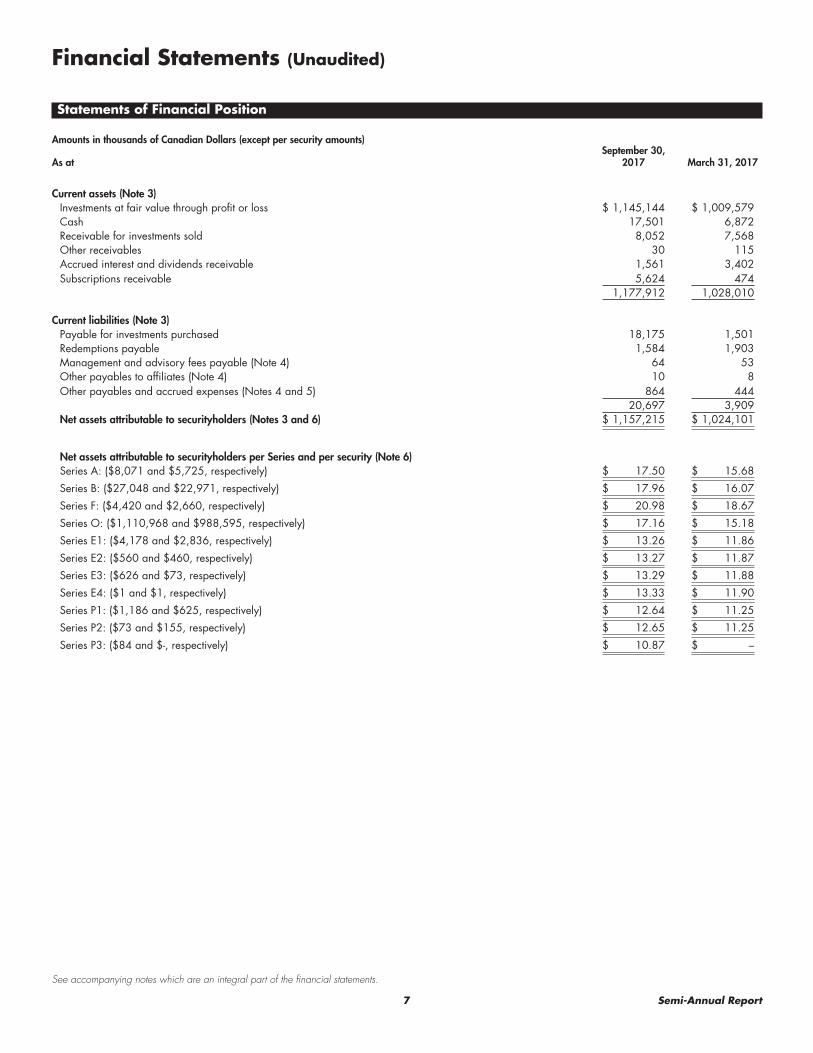
Statements of Financial Position
Amounts in thousands of Canadian Dollars (except per security amounts)
As atSeptember 30,
2017 March 31, 2017
Current assets (Note 3)Investments at fair value through profit or loss $ 1,145,144 $ 1,009,579Cash 17,501 6,872Receivable for investments sold 8,052 7,568Other receivables 30 115Accrued interest and dividends receivable 1,561 3,402Subscriptions receivable 5,624 474
1,177,912 1,028,010
Current liabilities (Note 3)Payable for investments purchased 18,175 1,501Redemptions payable 1,584 1,903Management and advisory fees payable (Note 4) 64 53Other payables to affiliates (Note 4) 10 8Other payables and accrued expenses (Notes 4 and 5) 864 444
20,697 3,909Net assets attributable to securityholders (Notes 3 and 6) $ 1,157,215 $ 1,024,101
Net assets attributable to securityholders per Series and per security (Note 6)Series A: ($8,071 and $5,725, respectively) $ 17.50 $ 15.68
Series B: ($27,048 and $22,971, respectively) $ 17.96 $ 16.07
Series F: ($4,420 and $2,660, respectively) $ 20.98 $ 18.67
Series O: ($1,110,968 and $988,595, respectively) $ 17.16 $ 15.18
Series E1: ($4,178 and $2,836, respectively) $ 13.26 $ 11.86
Series E2: ($560 and $460, respectively) $ 13.27 $ 11.87
Series E3: ($626 and $73, respectively) $ 13.29 $ 11.88
Series E4: ($1 and $1, respectively) $ 13.33 $ 11.90
Series P1: ($1,186 and $625, respectively) $ 12.64 $ 11.25
Series P2: ($73 and $155, respectively) $ 12.65 $ 11.25
Series P3: ($84 and $‑, respectively) $ 10.87 $ –
8Semi-Annual Reportport
See accompanying notes which are an integral part of the financial statements.
Financial Statements (Unaudited) – continued
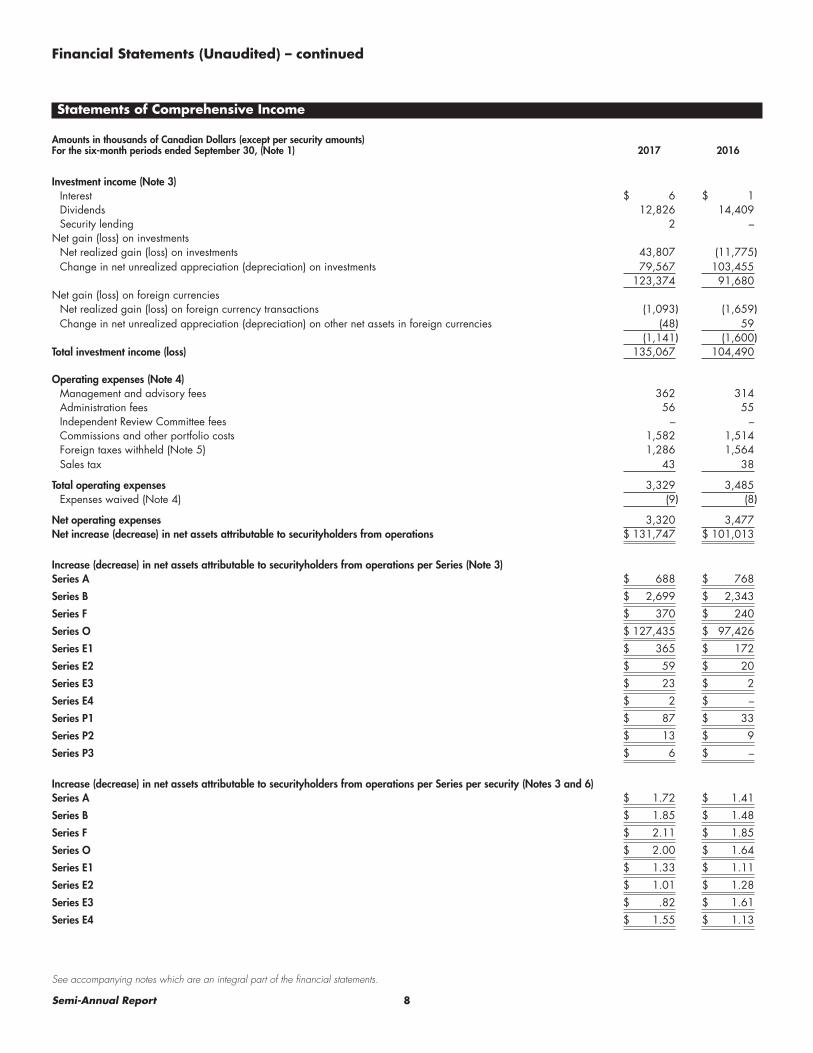
Statements of Comprehensive Income
Amounts in thousands of Canadian Dollars (except per security amounts)For the six-month periods ended September 30, (Note 1) 2017 2016
Investment income (Note 3)Interest $ 6 $ 1Dividends 12,826 14,409Security lending 2 –
Net gain (loss) on investments Net realized gain (loss) on investments 43,807 (11,775)Change in net unrealized appreciation (depreciation) on investments 79,567 103,455
123,374 91,680Net gain (loss) on foreign currencies
Net realized gain (loss) on foreign currency transactions (1,093) (1,659)Change in net unrealized appreciation (depreciation) on other net assets in foreign currencies (48) 59
(1,141) (1,600)Total investment income (loss) 135,067 104,490
Operating expenses (Note 4)Management and advisory fees 362 314Administration fees 56 55Independent Review Committee fees – –Commissions and other portfolio costs 1,582 1,514Foreign taxes withheld (Note 5) 1,286 1,564Sales tax 43 38
Total operating expenses 3,329 3,485Expenses waived (Note 4) (9) (8)
Net operating expenses 3,320 3,477Net increase (decrease) in net assets attributable to securityholders from operations $ 131,747 $ 101,013
Increase (decrease) in net assets attributable to securityholders from operations per Series (Note 3)Series A $ 688 $ 768
Series B $ 2,699 $ 2,343
Series F $ 370 $ 240
Series O $ 127,435 $ 97,426
Series E1 $ 365 $ 172
Series E2 $ 59 $ 20
Series E3 $ 23 $ 2
Series E4 $ 2 $ –
Series P1 $ 87 $ 33
Series P2 $ 13 $ 9
Series P3 $ 6 $ –
Increase (decrease) in net assets attributable to securityholders from operations per Series per security (Notes 3 and 6)Series A $ 1.72 $ 1.41
Series B $ 1.85 $ 1.48
Series F $ 2.11 $ 1.85
Series O $ 2.00 $ 1.64
Series E1 $ 1.33 $ 1.11
Series E2 $ 1.01 $ 1.28
Series E3 $ .82 $ 1.61
Series E4 $ 1.55 $ 1.13
9 Semi-Annual Report
See accompanying notes which are an integral part of the financial statements.
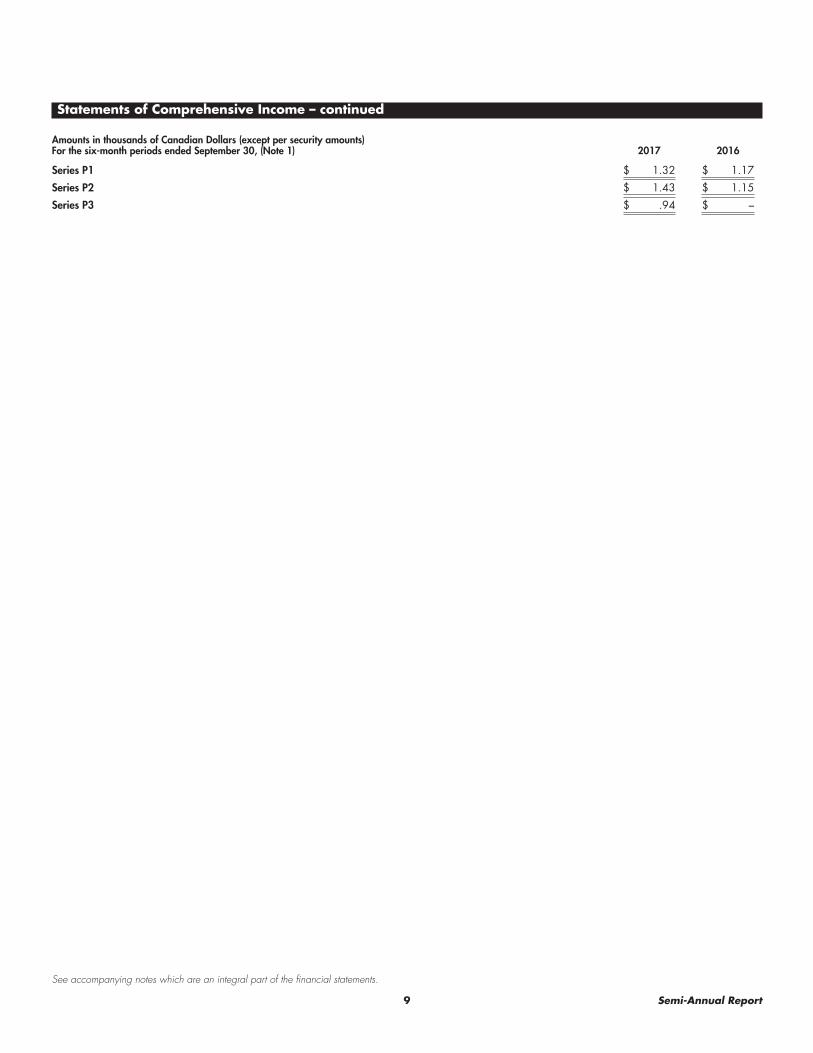
Statements of Comprehensive Income – continued
Amounts in thousands of Canadian Dollars (except per security amounts)For the six-month periods ended September 30, (Note 1) 2017 2016
Series P1 $ 1.32 $ 1.17
Series P2 $ 1.43 $ 1.15
Series P3 $ .94 $ –
10Semi-Annual Reportport
See accompanying notes which are an integral part of the financial statements.
Financial Statements (Unaudited) – continued
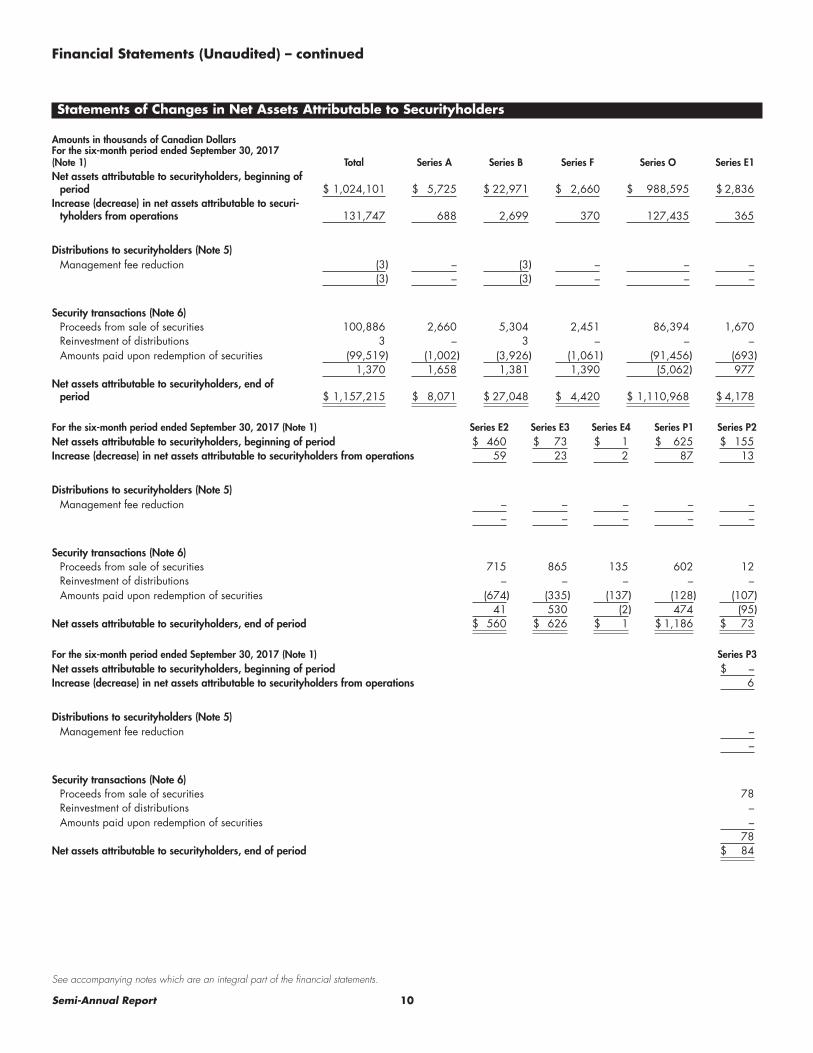
Statements of Changes in Net Assets Attributable to Securityholders
Amounts in thousands of Canadian DollarsFor the six-month period ended September 30, 2017 (Note 1) Total Series A Series B Series F Series O Series E1Net assets attributable to securityholders, beginning of
period $ 1,024,101 $ 5,725 $ 22,971 $ 2,660 $ 988,595 $ 2,836Increase (decrease) in net assets attributable to securi-
tyholders from operations 131,747 688 2,699 370 127,435 365
Distributions to securityholders (Note 5)Management fee reduction (3) – (3) – – –
(3) – (3) – – –
Security transactions (Note 6)Proceeds from sale of securities 100,886 2,660 5,304 2,451 86,394 1,670Reinvestment of distributions 3 – 3 – – –Amounts paid upon redemption of securities (99,519) (1,002) (3,926) (1,061) (91,456) (693)
1,370 1,658 1,381 1,390 (5,062) 977Net assets attributable to securityholders, end of
period $ 1,157,215 $ 8,071 $ 27,048 $ 4,420 $ 1,110,968 $ 4,178
For the six-month period ended September 30, 2017 (Note 1) Series E2 Series E3 Series E4 Series P1 Series P2Net assets attributable to securityholders, beginning of period $ 460 $ 73 $ 1 $ 625 $ 155Increase (decrease) in net assets attributable to securityholders from operations 59 23 2 87 13
Distributions to securityholders (Note 5)Management fee reduction – – – – –
– – – – –
Security transactions (Note 6)Proceeds from sale of securities 715 865 135 602 12Reinvestment of distributions – – – – –Amounts paid upon redemption of securities (674) (335) (137) (128) (107)
41 530 (2) 474 (95)Net assets attributable to securityholders, end of period $ 560 $ 626 $ 1 $ 1,186 $ 73
For the six-month period ended September 30, 2017 (Note 1) Series P3Net assets attributable to securityholders, beginning of period $ –Increase (decrease) in net assets attributable to securityholders from operations 6
Distributions to securityholders (Note 5)Management fee reduction –
–
Security transactions (Note 6)Proceeds from sale of securities 78Reinvestment of distributions –Amounts paid upon redemption of securities –
78Net assets attributable to securityholders, end of period $ 84

11 Semi-Annual Report
See accompanying notes which are an integral part of the financial statements.
Statements of Changes in Net Assets Attributable to Securityholders – continued
For the six-month period ended September 30, 2016 (Note 1) Total Series A Series B Series F Series O Series E1Net assets attributable to securityholders, beginning of
period $ 744,044 $ 7,883 $ 22,968 $ 1,935 $ 709,471 $ 1,375Increase (decrease) in net assets attributable to securityhold-
ers from operations 101,013 768 2,343 240 97,426 172
Distributions to securityholders (Note 5)Management fee reduction (3) – (3) – – –
(3) – (3) – – –
Security transactions (Note 6)Proceeds from sale of securities 169,465 291 1,413 674 165,759 1,085Reinvestment of distributions 3 – 3 – – –Amounts paid upon redemption of securities (46,976) (1,279) (3,598) (291) (41,432) (318)
122,492 (988) (2,182) 383 124,327 767Net assets attributable to securityholders, end of period $ 967,546 $ 7,663 $ 23,126 $ 2,558 $ 931,224 $ 2,314
For the six-month period ended September 30, 2016 (Note 1) Series E2 Series E3 Series E4 Series P1 Series P2Net assets attributable to securityholders, beginning of period $ 110 $ 1 $ 1 $ 232 $ 68Increase (decrease) in net assets attributable to securityholders from operations 20 2 – 33 9
Distributions to securityholders (Note 5)Management fee reduction – – – – –
– – – – –
Security transactions (Note 6)Proceeds from sale of securities 82 19 – 115 27Reinvestment of distributions – – – – –Amounts paid upon redemption of securities (11) – – (41) (6)
71 19 – 74 21Net assets attributable to securityholders, end of period $ 201 $ 22 $ 1 $ 339 $ 98
For the six-month period ended September 30, 2016 (Note 1) Series P3Net assets attributable to securityholders, beginning of period $ –Increase (decrease) in net assets attributable to securityholders from operations –
Distributions to securityholders (Note 5)Management fee reduction –
–
Security transactions (Note 6)Proceeds from sale of securities –Reinvestment of distributions –Amounts paid upon redemption of securities –
–Net assets attributable to securityholders, end of period $ –
12Semi-Annual Reportport
See accompanying notes which are an integral part of the financial statements.
Financial Statements (Unaudited) – continued
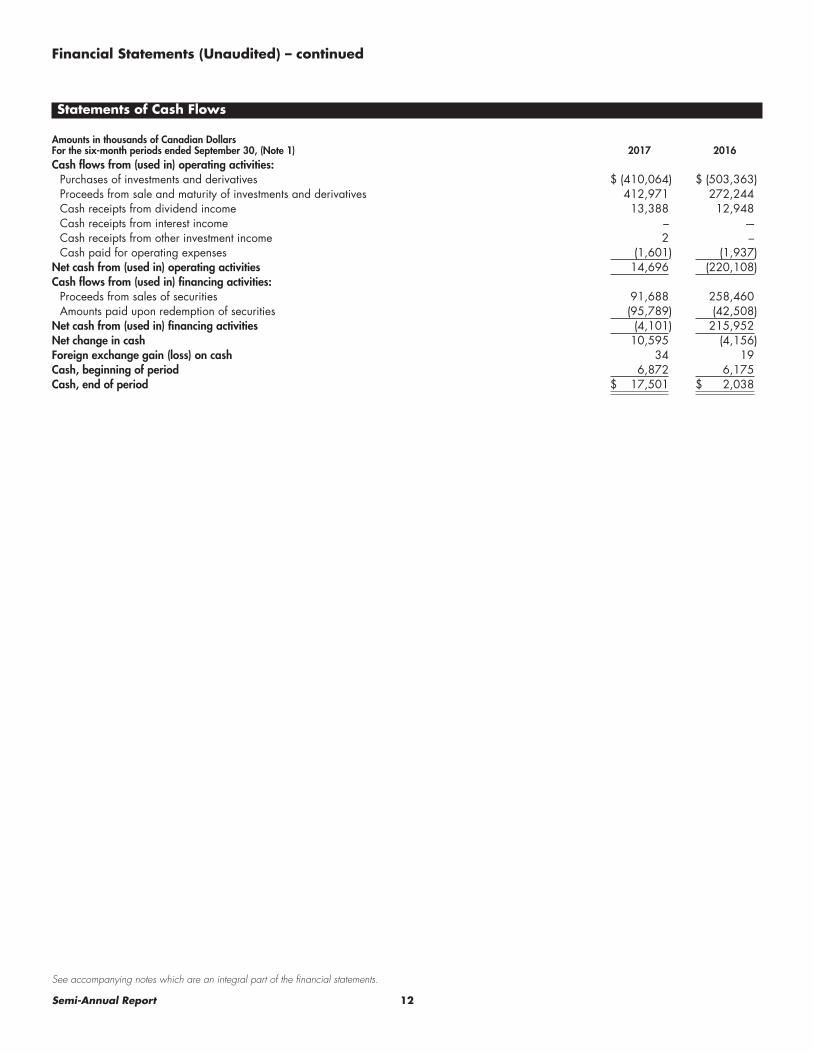
Statements of Cash Flows
Amounts in thousands of Canadian DollarsFor the six-month periods ended September 30, (Note 1) 2017 2016Cash flows from (used in) operating activities:
Purchases of investments and derivatives $ (410,064) $ (503,363)Proceeds from sale and maturity of investments and derivatives 412,971 272,244Cash receipts from dividend income 13,388 12,948Cash receipts from interest income – ‑–Cash receipts from other investment income 2 –Cash paid for operating expenses (1,601) (1,937)
Net cash from (used in) operating activities 14,696 (220,108)Cash flows from (used in) financing activities:
Proceeds from sales of securities 91,688 258,460Amounts paid upon redemption of securities (95,789) (42,508)
Net cash from (used in) financing activities (4,101) 215,952Net change in cash 10,595 (4,156)Foreign exchange gain (loss) on cash 34 19Cash, beginning of period 6,872 6,175Cash, end of period $ 17,501 $ 2,038
13 Semi-Annual Report
Notes to Financial Statements (Unaudited)For the period ended September 30, 2017(Amounts in thousands of Canadian dollars/thousands of securities (except per security amounts))
1. Formation of the Fund
Fidelity Emerging Markets Fund (Fund) is an open–end mutual fund trust formed under the laws of Ontario and governed by a Master Declaration of Trust dated October 31, 1994 (Inception Date), as amended thereafter from time to time. The Fund is authorized to issue an unlimited number of securities. Fidelity Investments Canada ULC (Fidelity), as manager and trustee of the Fund, is responsible for the day-to-day operations and provides all general management and administrative services. Fidelity, as the investment advisor, is responsible for the investment management of the Fund’s portfolio. On December 31, 2015, the investment advisor changed from FIAM LLC (formerly Pyramis Global Advisors, LLC) to Fidelity. The registered office of the Fund is located at 483 Bay Street, Suite 300, Toronto, Ontario, M5G 2N7.
Currently, Fidelity mutual funds are offered in the following Series: Series A, Series C, Series T5 and Series T8 securities are available to all investors in a deferred sales charge (DSC) option. Series A, Series T5 and Series T8 securities will be converted to lower management and advisory fee Series B, Series S5 and Series S8 securities, respectively, one year after completion of their redemption schedule. Series B, Series D, Series S5 and Series S8 securities are available to all investors in an initial sales charge (ISC) option. Series C and Series D securities are available to investors who have enrolled in the rebalancing service. Series F, Series F5 and Series F8 securities are usually only available to investors who have fee–based accounts with dealers who have signed an eligibility agreement with Fidelity. Series E1, Series E1T5, Series E2, Series E2T5, Series E3, Series E3T5, Series E4, Series E4T5, Series E5 and Series E5T5 securities are available only to investors who initially hold Series B and/or Series S5 securities and then become eligible to hold certain Series E securities. Series P1, Series P1T5, Series P2, Series P2T5, Series P3, Series P3T5, Series P4, Series P4T5, Series P5 and Series P5T5 securities are available only to investors who initially hold Series F and/or Series F5 securities and then become eligible to hold certain Series P securities. Series O securities are only available to other funds and accounts managed or advised by Fidelity and are not available for public purchase. Series I, Series I5 and Series I8 securities are available to all investors who have entered into a Series I Agreement with Fidelity and are available to all investors in an initial sales charge (ISC) option.
In addition, Series F5, Series F8, Series I5, Series I8, Series T5, Series T8, Series S5, Series S8, Series E1T5, Series E2T5, Series E3T5, Series E4T5, Series E5T5, Series P1T5, Series P2T5, Series P3T5, Series P4T5 and Series P5T5 securities distribute an amount comprised of net income and/or return of capital monthly, if available. The Fund commenced the offering of Series P3 securities on April 21, 2017.
The Fund meets the definition of an investment entity and its purpose is to provide investment management services to its securityholders by investing its net assets for capital growth and/or investment income and by measuring its investment performance on a fair value basis. Refer to the Financial Instruments Risk note below for the Fund’s investment objective.
2. Basis of Preparation
Statement of Compliance - These interim financial statements have been prepared in accordance with International Financial Reporting Standards (IFRS) as published by the International Accounting Standards Board (IASB) and as applicable to the preparation of interim finan-cial statements, including IAS 34 – Interim Financial Reporting. The accounting policies set out below have been applied consistently unless otherwise stated.
The policies applied in these interim financial statements are based on IFRS issued as of November 7, 2017, which is the date on which the interim financial statements were authorized for issue by Fidelity’s board of directors. Any subsequent changes to IFRS that are given effect in the Fund’s annual financial statements for the period ending March 31, 2018 could result in restatement of these interim financial statements.
Functional and Presentation Currency – These financial statements are presented in Canadian dollars, which is the Fund’s functional currency.
Comparative Figures - Per security comparative figures have been conformed to the current rounding presentation of two decimal places.
In addition, certain comparative figures in the Statements of Cash Flows have been revised to appropriately reflect the following non-cash items:
Amounts related to “Proceeds from sales of securities” and “Amounts paid upon redemption of securities” have been revised to exclude non-cash subscriptions and redemptions arising from switches between series within the Fund. There is no net impact on cash flows from financing activities.
3. Summary of Significant Accounting Policies
Basis of Measurement – These financial statements have been prepared on the historical cost basis except for investments which are mea-sured at fair value in the Statements of Financial Position.
Use of Estimates and Judgments – Under IFRS, management is required to make certain estimates and judgments at the date of the finan-cial statements. The principal financial statement components subject to significant accounting estimates and judgments include:
14Semi-Annual Reportport
Notes to Financial Statements (Unaudited) – continued(Amounts in thousands of Canadian dollars/thousands of securities (except per security amounts))
Fair value measurements -The Fund may invest in financial instruments that are not quoted in an active market. Where applicable, these instruments are categorized in Level 2 and Level 3 of the fair value hierarchy explained below. When current market prices or quotations are not readily available or reliable, valuation techniques will be applied in good faith and in accordance with procedures adopted by the manager. Factors used in determining fair value may include, but are not limited to, broker quotes from reputable pricing sources, market or secu-rity specific events, changes in interest rates and credit quality. Fair value models use observable data, to the extent practical; however, the manager is required from time to time to make estimates and assumptions that are based on the best information available at that particular time. Changes in these estimates could impact the fair values of the financial instruments, and the impact could be material. The aggregate fair value of investments measured by valuation techniques as at September 30, 2017 and March 31, 2017, is included at the end of the Fund’s Schedule of Investments.
Classification and measurement of financial instruments -The Fund has made significant judgments when determining the classification and measurement of its financial instruments under IAS 39, Financial Instruments – Recognition and Measurement (IAS 39). These judg-ments centre upon the determination that certain investments are held-for-trading and that the fair value measurement option can be applied to those that are not due to factors including performance evaluation and management of the Fund on a fair value basis.
Presentation of financial instruments -The Fund has made significant judgments when determining the classification of its redeemable securities as financial liabilities in accordance with IAS 32 – Financial Instruments – Presentation (IAS 32). These judgments centre upon the determination that the Fund’s redeemable securities do not have identical features and their entitlements include a contractual obligation to distribute any net income and net realized capital gains at least annually in cash (at the request of the securityholder). Therefore, the ongoing redemption feature is not the securities’ only contractual obligation.
Investment Valuation – Investments are designated at their fair value through profit or loss in accordance with IAS 39 and are carried at their fair value.
The Fund categorizes the inputs to valuation techniques used to fair value its investments into a disclosure hierarchy consisting of three levels as shown below:
Level 1 – quoted prices in active markets for identical investments
Level 2 – other significant observable inputs (including quoted prices for similar investments, interest rates, prepayment speeds, etc.)
Level 3 – unobservable inputs (including the Fund’s own assumptions based on the best information available)
Changes in valuation techniques may result in transfers in or out of an assigned level within the disclosure hierarchy. Information on transfers between Level 1 and Level 2 for the period ended September 30, 2017 and March 31, 2017, is included at the end of the Fund’s Schedule of Investments. The aggregate value of investments by input level, as at September 30, 2017 and March 31, 2017, as well as a roll forward of Level 3 securities, where applicable, is included at the end of the Fund’s Schedule of Investments.
Valuation techniques used to value the Fund’s investments by major category are as follows:
Equity securities, including restricted equity securities and Exchange-traded funds (ETFs) for which market quotations are readily available, are valued at the last sales price or official closing price as reported by an independent pricing service on the primary market or exchange on which they are traded and are categorized as Level 1 in the hierarchy. In the event that the last sales price or official closing price is not readily available, or is outside the bid-ask spread, the point within the bid–ask spread that is most representative of fair value based on specific facts and circumstances will be used. For foreign equity securities, when significant market or security specific events arise, comparisons to the valuation of American Depositary Receipts (ADRs), futures contracts, ETFs and certain indexes as well as quoted prices for similar securities are used and are categorized as Level 2 in the hierarchy in these circumstances. Utilizing these techniques may result in transfers between Level 1 and Level 2. For equity securities, including restricted equity securities, where observable inputs are limited, assumptions about market activity and risk are used and these securities may be categorized as Level 3 in the hierarchy.
Cash – Cash is comprised of cash on deposit and may include cash equivalents which are short-term debt instruments with terms to maturity of less than 90 days at acquisition which are held for the purpose of meeting short-term cash commitments. Foreign currencies are comprised of cash amounts denominated in currencies other than Canadian dollars, which are on deposit with the custodian to facilitate the settlement of foreign denominated security transactions. Cash is carried at amortized cost which approximates its fair value. The Fund did not hold any cash equivalents as at September 30, 2017 and March 31, 2017.
Impairment of Financial Assets – At each reporting date, the Fund assesses whether there is objective evidence that a financial asset carried at amortized cost is impaired. If such impairment exists, the Fund recognizes the difference between the amortized cost of the finan-cial assets and the present value of the estimated future cash flows, discounted using the instrument’s original effective interest rate as an impairment loss on the Statements of Comprehensive Income. Such impairment losses are reversed in subsequent periods in the Statements of Comprehensive Income if the conditions that lead to the initial recognition of the loss diminish or cease to exist.
15 Semi-Annual Report
Other Assets and Liabilities – Other assets and liabilities may include amounts due to or from the custodian, affiliates or other counterpar-ties for accrued income, investment transactions, Fund’s security transactions, accrued expenses and other unsettled transactions at period end. These amounts are classified as loans and receivables or financial liabilities and are carried at amortized cost, which approximates fair value due to their short-term nature.
Classification of redeemable securities issued by the Fund – In accordance with IAS 32, the Fund’s redeemable securities’ entitle-ments include a contractual obligation to distribute any net income and net realized capital gains at least annually in cash (at the request of the securityholder) and, therefore, the ongoing redemption feature is not the securities’ only contractual obligation. In addition, each series of redeemable securities are equally subordinated to each other, but have differing features as outlined in the notes below. Therefore, the Fund’s redeemable securities do not meet the criteria for classification as equity and have been classified as financial liabilities on the Statements of Financial Position. The Fund’s obligation for net assets attributable to securityholders is recorded at the redemption amount. As at September 30, 2017 and March 31, 2017, the Fund’s net asset value per Series per security may differ by less than $0.01 from its net assets attributable to securityholders per Series per securities calculated in accordance with IFRS as a result of normal reporting period end procedures to close off the books and records.
Investment Transactions, Income Recognition and Transaction Costs - Regular way purchases and sales of financial assets are recog-nized at their trade date. The cost of investments is determined on an average cost basis, excluding commissions and other portfolio transac-tion costs. Net realized gains and losses from the sale of investments (which may include proceeds received from litigation) and change in net unrealized appreciation (depreciation) on investments are calculated with reference to average cost of the related investment securities. Interest income is accrued as earned Dividend income, including income received from ETFs, is recognized on the ex-dividend date except for certain dividends from foreign securities where the ex-dividend date may have passed, which are recorded as soon as the ex-dividend date is known to Fidelity. Distributions received from investment trusts are recorded as income, capital gains or a return of capital based on the best information available. Due to the nature of these investments, actual allocations could vary from this information. Distributions from invest-ment trusts treated as a return of capital reduce the average cost of the underlying investment trust.
Transaction costs, such as brokerage commissions, incurred in the purchase and sale of investment securities by the Fund are recognized as “Commissions and other portfolio costs” in the Statements of Comprehensive Income.
Foreign Currency Translation – Securities and other assets and liabilities denominated in a foreign currency are translated into Canadian dollars at the period-end exchange rates. Purchases and sales of securities, income and expenses denominated in foreign currencies are trans-lated into Canadian dollars at the exchange rate on the date of the respective transaction. The effects of exchange rate fluctuations on invest-ments are included in the “Net realized gain (loss) and change in net unrealized appreciation (depreciation) on investments” and exchange rate fluctuations on other foreign currency transactions are included in the “Net realized gain (loss) on foreign currency transactions” and “Change in net unrealized appreciation (depreciation) on other net assets in foreign currencies” in the Statements of Comprehensive Income.
Securities Lending – The Fund lends portfolio securities from time to time in order to earn additional income. The Fund has entered into a securities lending program with its custodian, State Street Trust Company of Canada (SSB). The aggregate market value of all securities loaned under securities lending transactions or sold in repurchase transactions cannot exceed 50% of the net asset value of the Fund. SSB is entitled to receive payments out of the gross amount generated from the securities lending transactions of the Fund and bear all operational costs directly related to securities lending as well as the cost of borrower default indemnification. The following tables reconcile the gross amount of income generated from the Fund’s securities lending transactions to what is retained by the Fund and reported under “Security lending” in the Statements of Comprehensive Income.
Period endedTotal Income Earned ($)
Fund Income Earned ($)
SSB Income Earned ($)
Fund % of Total Income
Earned
SSB % of Total Income
EarnedSeptember 30, 2017 2 2 – 85 15September 30, 2016 – – – 85 15
The Fund receives collateral (in the form of obligations of, or guaranteed by, the Government of Canada, or a province thereof, or by the United States government or its agencies) against the loaned securities and maintains collateral in an amount of at least 105% of the market value of the loaned securities during the period of the loan. The market value of the loaned securities is determined daily at the close of business of the Fund and any additional required collateral is delivered to the Fund on the next business day. There were no security loans outstanding as at September 30, 2017 and March 31, 2017.
Valuation of Series – Separate net assets attributable to securityholders is calculated for each Series of securities of the Fund. The net assets attributable to securityholders of a Series is computed by calculating the Series’ proportionate share of the assets and liabilities of the Fund common to all Series, adjusted for the assets and liabilities of the Fund attributable only to that Series. Expenses directly attributable to a Series are charged to that Series. Investment income and operating expenses are allocated proportionately to each Series based upon the relative net assets attributable to securityholders of each Series, except for items that can be specifically attributed to one or more Series.
16Semi-Annual Reportport
Notes to Financial Statements (Unaudited) – continued(Amounts in thousands of Canadian dollars/thousands of securities (except per security amounts))
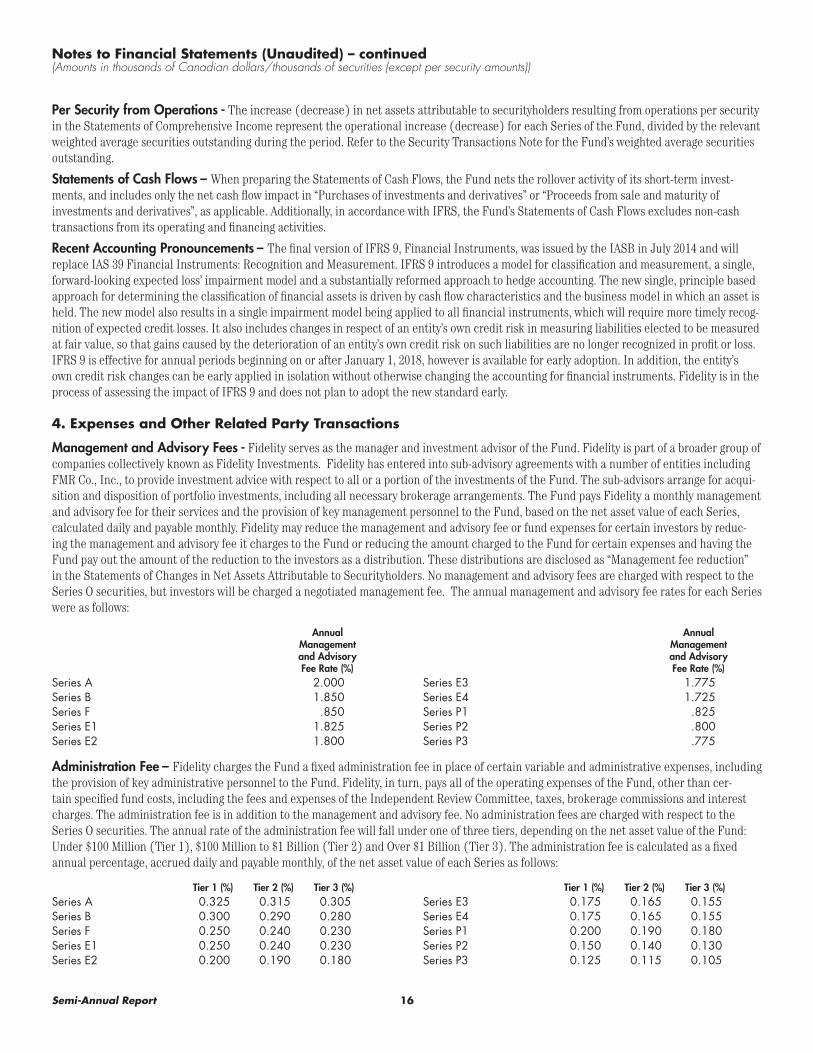
Per Security from Operations - The increase (decrease) in net assets attributable to securityholders resulting from operations per security in the Statements of Comprehensive Income represent the operational increase (decrease) for each Series of the Fund, divided by the relevant weighted average securities outstanding during the period. Refer to the Security Transactions Note for the Fund’s weighted average securities outstanding.
Statements of Cash Flows – When preparing the Statements of Cash Flows, the Fund nets the rollover activity of its short-term invest-ments, and includes only the net cash flow impact in “Purchases of investments and derivatives” or “Proceeds from sale and maturity of investments and derivatives”, as applicable. Additionally, in accordance with IFRS, the Fund’s Statements of Cash Flows excludes non-cash transactions from its operating and financing activities.
Recent Accounting Pronouncements – The final version of IFRS 9, Financial Instruments, was issued by the IASB in July 2014 and will replace IAS 39 Financial Instruments: Recognition and Measurement. IFRS 9 introduces a model for classification and measurement, a single, forward-looking expected loss’ impairment model and a substantially reformed approach to hedge accounting. The new single, principle based approach for determining the classification of financial assets is driven by cash flow characteristics and the business model in which an asset is held. The new model also results in a single impairment model being applied to all financial instruments, which will require more timely recog-nition of expected credit losses. It also includes changes in respect of an entity’s own credit risk in measuring liabilities elected to be measured at fair value, so that gains caused by the deterioration of an entity’s own credit risk on such liabilities are no longer recognized in profit or loss. IFRS 9 is effective for annual periods beginning on or after January 1, 2018, however is available for early adoption. In addition, the entity’s own credit risk changes can be early applied in isolation without otherwise changing the accounting for financial instruments. Fidelity is in the process of assessing the impact of IFRS 9 and does not plan to adopt the new standard early.
4. Expenses and Other Related Party Transactions
Management and Advisory Fees - Fidelity serves as the manager and investment advisor of the Fund. Fidelity is part of a broader group of companies collectively known as Fidelity Investments. Fidelity has entered into sub-advisory agreements with a number of entities including FMR Co., Inc., to provide investment advice with respect to all or a portion of the investments of the Fund. The sub-advisors arrange for acqui-sition and disposition of portfolio investments, including all necessary brokerage arrangements. The Fund pays Fidelity a monthly management and advisory fee for their services and the provision of key management personnel to the Fund, based on the net asset value of each Series, calculated daily and payable monthly. Fidelity may reduce the management and advisory fee or fund expenses for certain investors by reduc-ing the management and advisory fee it charges to the Fund or reducing the amount charged to the Fund for certain expenses and having the Fund pay out the amount of the reduction to the investors as a distribution. These distributions are disclosed as “Management fee reduction” in the Statements of Changes in Net Assets Attributable to Securityholders. No management and advisory fees are charged with respect to the Series O securities, but investors will be charged a negotiated management fee. The annual management and advisory fee rates for each Series were as follows:
Annual Management and Advisory Fee Rate (%)
Series A 2.000Series B 1.850Series F .850Series E1 1.825Series E2 1.800
Annual Management and Advisory Fee Rate (%)
Series E3 1.775Series E4 1.725Series P1 .825Series P2 .800Series P3 .775
Administration Fee – Fidelity charges the Fund a fixed administration fee in place of certain variable and administrative expenses, including the provision of key administrative personnel to the Fund. Fidelity, in turn, pays all of the operating expenses of the Fund, other than cer-tain specified fund costs, including the fees and expenses of the Independent Review Committee, taxes, brokerage commissions and interest charges. The administration fee is in addition to the management and advisory fee. No administration fees are charged with respect to the Series O securities. The annual rate of the administration fee will fall under one of three tiers, depending on the net asset value of the Fund: Under $100 Million (Tier 1), $100 Million to $1 Billion (Tier 2) and Over $1 Billion (Tier 3). The administration fee is calculated as a fixed annual percentage, accrued daily and payable monthly, of the net asset value of each Series as follows:
Tier 1 (%) Tier 2 (%) Tier 3 (%)Series A 0.325 0.315 0.305Series B 0.300 0.290 0.280Series F 0.250 0.240 0.230Series E1 0.250 0.240 0.230Series E2 0.200 0.190 0.180
Tier 1 (%) Tier 2 (%) Tier 3 (%)Series E3 0.175 0.165 0.155Series E4 0.175 0.165 0.155Series P1 0.200 0.190 0.180Series P2 0.150 0.140 0.130Series P3 0.125 0.115 0.105
17 Semi-Annual Report
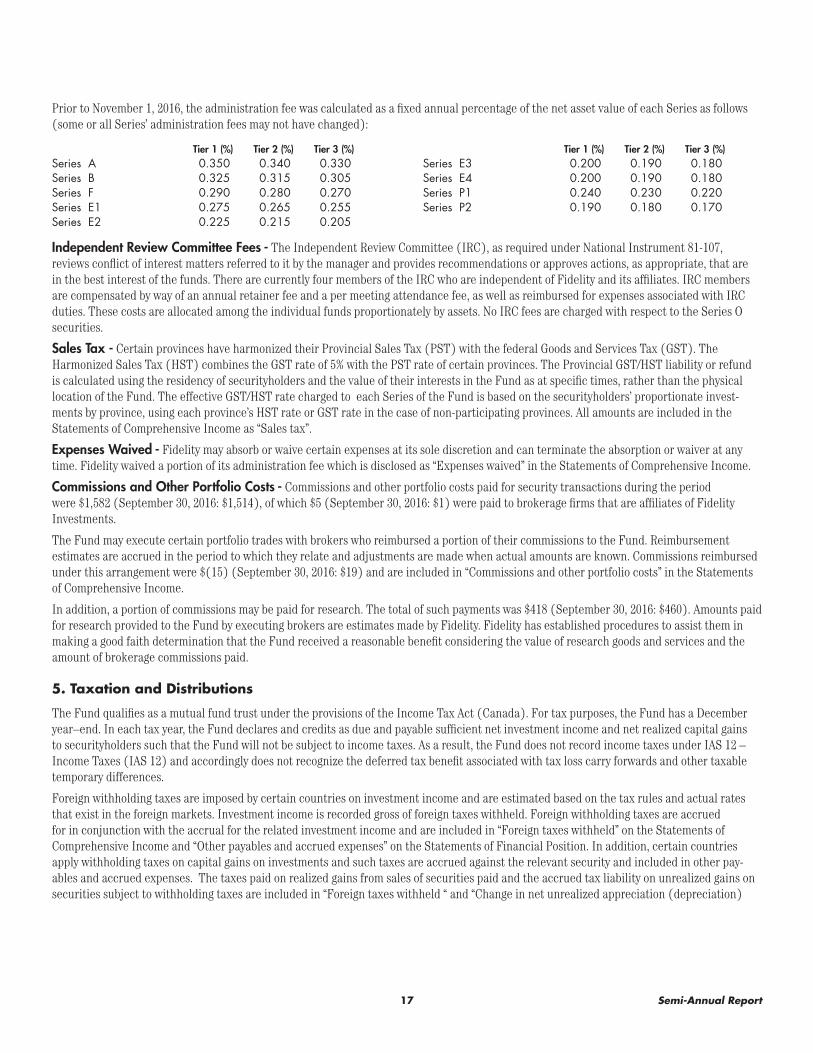
Prior to November 1, 2016, the administration fee was calculated as a fixed annual percentage of the net asset value of each Series as follows (some or all Series’ administration fees may not have changed):
Tier 1 (%) Tier 2 (%) Tier 3 (%)Series A 0.350 0.340 0.330Series B 0.325 0.315 0.305Series F 0.290 0.280 0.270Series E1 0.275 0.265 0.255Series E2 0.225 0.215 0.205
Tier 1 (%) Tier 2 (%) Tier 3 (%)Series E3 0.200 0.190 0.180Series E4 0.200 0.190 0.180Series P1 0.240 0.230 0.220Series P2 0.190 0.180 0.170
Independent Review Committee Fees - The Independent Review Committee (IRC), as required under National Instrument 81-107, reviews conflict of interest matters referred to it by the manager and provides recommendations or approves actions, as appropriate, that are in the best interest of the funds. There are currently four members of the IRC who are independent of Fidelity and its affiliates. IRC members are compensated by way of an annual retainer fee and a per meeting attendance fee, as well as reimbursed for expenses associated with IRC duties. These costs are allocated among the individual funds proportionately by assets. No IRC fees are charged with respect to the Series O securities.
Sales Tax - Certain provinces have harmonized their Provincial Sales Tax (PST) with the federal Goods and Services Tax (GST). The Harmonized Sales Tax (HST) combines the GST rate of 5% with the PST rate of certain provinces. The Provincial GST/HST liability or refund is calculated using the residency of securityholders and the value of their interests in the Fund as at specific times, rather than the physical location of the Fund. The effective GST/HST rate charged to each Series of the Fund is based on the securityholders’ proportionate invest-ments by province, using each province’s HST rate or GST rate in the case of non-participating provinces. All amounts are included in the Statements of Comprehensive Income as “Sales tax”.
Expenses Waived - Fidelity may absorb or waive certain expenses at its sole discretion and can terminate the absorption or waiver at any time. Fidelity waived a portion of its administration fee which is disclosed as “Expenses waived” in the Statements of Comprehensive Income.
Commissions and Other Portfolio Costs - Commissions and other portfolio costs paid for security transactions during the period were $1,582 (September 30, 2016: $1,514), of which $5 (September 30, 2016: $1) were paid to brokerage firms that are affiliates of Fidelity Investments.
The Fund may execute certain portfolio trades with brokers who reimbursed a portion of their commissions to the Fund. Reimbursement estimates are accrued in the period to which they relate and adjustments are made when actual amounts are known. Commissions reimbursed under this arrangement were $(15) (September 30, 2016: $19) and are included in “Commissions and other portfolio costs” in the Statements of Comprehensive Income.
In addition, a portion of commissions may be paid for research. The total of such payments was $418 (September 30, 2016: $460). Amounts paid for research provided to the Fund by executing brokers are estimates made by Fidelity. Fidelity has established procedures to assist them in making a good faith determination that the Fund received a reasonable benefit considering the value of research goods and services and the amount of brokerage commissions paid.
5. Taxation and Distributions
The Fund qualifies as a mutual fund trust under the provisions of the Income Tax Act (Canada). For tax purposes, the Fund has a December year–end. In each tax year, the Fund declares and credits as due and payable sufficient net investment income and net realized capital gains to securityholders such that the Fund will not be subject to income taxes. As a result, the Fund does not record income taxes under IAS 12 – Income Taxes (IAS 12) and accordingly does not recognize the deferred tax benefit associated with tax loss carry forwards and other taxable temporary differences.
Foreign withholding taxes are imposed by certain countries on investment income and are estimated based on the tax rules and actual rates that exist in the foreign markets. Investment income is recorded gross of foreign taxes withheld. Foreign withholding taxes are accrued for in conjunction with the accrual for the related investment income and are included in “Foreign taxes withheld” on the Statements of Comprehensive Income and “Other payables and accrued expenses” on the Statements of Financial Position. In addition, certain countries apply withholding taxes on capital gains on investments and such taxes are accrued against the relevant security and included in other pay-ables and accrued expenses. The taxes paid on realized gains from sales of securities paid and the accrued tax liability on unrealized gains on securities subject to withholding taxes are included in “Foreign taxes withheld “ and “Change in net unrealized appreciation (depreciation)
18Semi-Annual Reportport
Notes to Financial Statements (Unaudited) – continued(Amounts in thousands of Canadian dollars/thousands of securities (except per security amounts))
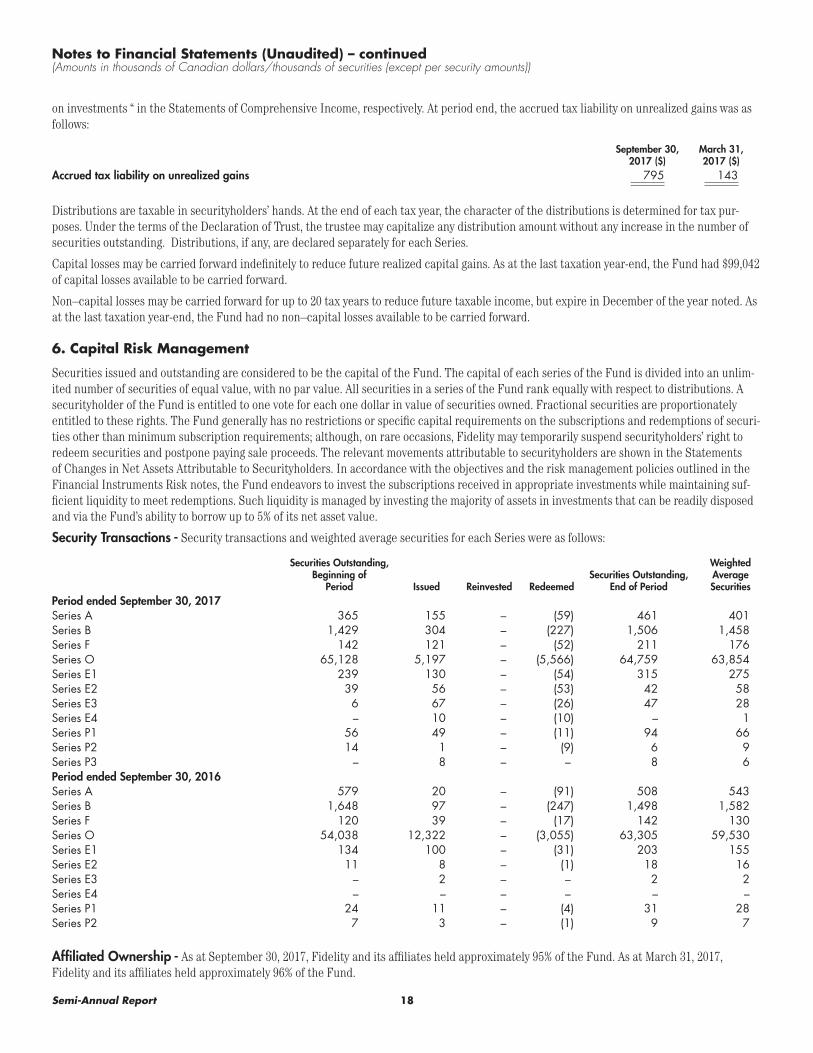
on investments “ in the Statements of Comprehensive Income, respectively. At period end, the accrued tax liability on unrealized gains was as follows:
September 30, 2017 ($)
March 31, 2017 ($)
Accrued tax liability on unrealized gains 795 143
Distributions are taxable in securityholders’ hands. At the end of each tax year, the character of the distributions is determined for tax pur-poses. Under the terms of the Declaration of Trust, the trustee may capitalize any distribution amount without any increase in the number of securities outstanding. Distributions, if any, are declared separately for each Series.
Capital losses may be carried forward indefinitely to reduce future realized capital gains. As at the last taxation year-end, the Fund had $99,042 of capital losses available to be carried forward.
Non–capital losses may be carried forward for up to 20 tax years to reduce future taxable income, but expire in December of the year noted. As at the last taxation year-end, the Fund had no non–capital losses available to be carried forward.
6. Capital Risk Management
Securities issued and outstanding are considered to be the capital of the Fund. The capital of each series of the Fund is divided into an unlim-ited number of securities of equal value, with no par value. All securities in a series of the Fund rank equally with respect to distributions. A securityholder of the Fund is entitled to one vote for each one dollar in value of securities owned. Fractional securities are proportionately entitled to these rights. The Fund generally has no restrictions or specific capital requirements on the subscriptions and redemptions of securi-ties other than minimum subscription requirements; although, on rare occasions, Fidelity may temporarily suspend securityholders’ right to redeem securities and postpone paying sale proceeds. The relevant movements attributable to securityholders are shown in the Statements of Changes in Net Assets Attributable to Securityholders. In accordance with the objectives and the risk management policies outlined in the Financial Instruments Risk notes, the Fund endeavors to invest the subscriptions received in appropriate investments while maintaining suf-ficient liquidity to meet redemptions. Such liquidity is managed by investing the majority of assets in investments that can be readily disposed and via the Fund’s ability to borrow up to 5% of its net asset value.
Security Transactions - Security transactions and weighted average securities for each Series were as follows:
Securities Outstanding, Beginning of
Period Issued Reinvested RedeemedSecurities Outstanding,
End of Period
Weighted Average Securities
Period ended September 30, 2017Series A 365 155 – (59) 461 401Series B 1,429 304 – (227) 1,506 1,458Series F 142 121 – (52) 211 176Series O 65,128 5,197 – (5,566) 64,759 63,854Series E1 239 130 – (54) 315 275Series E2 39 56 – (53) 42 58Series E3 6 67 – (26) 47 28Series E4 – 10 – (10) – 1Series P1 56 49 – (11) 94 66Series P2 14 1 – (9) 6 9Series P3 – 8 – – 8 6Period ended September 30, 2016Series A 579 20 – (91) 508 543Series B 1,648 97 – (247) 1,498 1,582Series F 120 39 – (17) 142 130Series O 54,038 12,322 – (3,055) 63,305 59,530Series E1 134 100 – (31) 203 155Series E2 11 8 – (1) 18 16Series E3 – 2 – – 2 2Series E4 – – – – – –Series P1 24 11 – (4) 31 28Series P2 7 3 – (1) 9 7
Affiliated Ownership - As at September 30, 2017, Fidelity and its affiliates held approximately 95% of the Fund. As at March 31, 2017, Fidelity and its affiliates held approximately 96% of the Fund.
19 Semi-Annual Report
7. Financial Instruments Risk
The Fund’s activities expose it to a variety of financial instruments risks: credit risk, liquidity risk, other price risk, interest rate risk and cur-rency risk. Fidelity seeks to minimize potential adverse effects of these performance risks by employing professional, experienced portfolio advisors, by daily monitoring of positions and market events, and by diversifying the investment portfolio within the constraints of the invest-ment mandate. Derivative financial instruments may be used to moderate certain risk exposures.
This Fund aims to achieve high total investment return by investing primarily in equity securities of companies in emerging market countries. The Fund’s benchmark is the MSCI Emerging Markets Index.
Portfolio risk is monitored daily and reviewed monthly by an investment compliance group. In addition, there is a formal quarterly review of each fund. The investment compliance group, portfolio managers and the senior analysts attend a quarterly portfolio review. Portfolios within each strategy are reviewed relative to each other and to their benchmark. Active industry and security allocations are analyzed.
Credit Risk - Credit risk is the risk that a counterparty to a financial instrument will fail to discharge an obligation or commitment that it has entered into with the Fund. The Fund’s own credit risk in the case of financial liabilities and a counterparty’s credit risk, both indirect and direct, are considered, where applicable, in determining the fair value of financial assets and financial liabilities. In addition, as part of its cash management, the Fund limits its direct exposure to credit loss by placing its cash with high credit quality financial institutions. The carrying amount of investments and other assets represents the maximum credit risk exposure as at September 30, 2017 and March 31, 2017.
Other than outlined above, there were no significant concentrations of credit risk to counterparties as at September 30, 2017 and March 31, 2017.
Concentration Risk - The Fund may be exposed to risk based on the concentration levels of its financial instruments in various sectors, geo-graphic regions, asset weightings and market capitalization, as applicable. Fidelity analyzes and monitors these concentration risks regularly. Refer to the Geographic Mix and Sector Mix tables in the “Summary of Investment Portfolio” of the Fund’s Semi-Annual Management Report of Fund Performance as at September 20, 2017, which summarize the investment concentration risks that are relevant for the Fund.
Liquidity Risk - Liquidity risk is defined as the risk that the Fund may not be able to settle or meet its obligations on time or at a reasonable price. The Fund is exposed to daily cash redemptions of its redeemable securities. Redeemable securities are redeemed on demand at the secu-rityholder’s option based on the Fund’s net asset value per security (NAVPS) at the time of redemption. The Fund may be exposed to indirect liquidity risk through its investments.
In accordance with securities regulations, investment funds must maintain at least 90% of assets in liquid investments; investments that are traded in an active market and can be readily disposed of. In addition, the Fund aims to retain sufficient cash and short-term investments to maintain liquidity, and has the ability to borrow up to 5% of its net asset value from the custodian for the purpose of funding redemptions. The liquidity position is monitored on a daily basis.
As at September 30, 2017 and March 31, 2017, the Fund did not have financial liabilities with maturities greater than 3 months.
Other Price Risk - Other price risk is the risk that the value of financial instruments will fluctuate as a result of changes in market prices (other than those arising from interest rate risk or currency risk on monetary instruments), whether caused by factors specific to an individual investment, its issuer, or other factors affecting all instruments traded in a market or market segment. All financial instruments present a risk of loss of capital. This risk is moderated through a careful selection of securities and other financial instruments within the parameters of the investment strategy. The maximum risk resulting from financial instruments is equivalent to their fair value except for possible losses from options written and futures contracts which can be unlimited. Investments and derivatives, if applicable, are susceptible to other price risk arising from uncertainties about future prices of the instruments.
In determining a Fund’s impact from exposure to other price risk, a beta may be used when applicable. Beta, a measure of the volatility of a security or a portfolio in comparison to the market as a whole, is derived from comparing 36 months of returns between the benchmark and a Fund. As such, beta inherently includes effects reflected in interest rate and currency risks. A beta of 1 indicates the security’s price will move with the market. A beta of less than 1 means the security will be less volatile than the market. A beta of greater than 1 indicates the security’s price will be more volatile than the market. For example, if a stock’s beta is 1.2, it’s theoretically 20% more volatile than the market. Beta may not be representative of future beta.
If the benchmark had increased or decreased by 5% on September 30, 2017 and March 31, 2017, with all other variables held constant, the net assets attributable to securityholders of the Fund would have increased or decreased by approximately $49,814 (March 31, 2017: $41,898). This change is estimated using the Fund’s beta which is calculated based on the historical correlation between the return of the Fund as compared to the return of the benchmark. In practice, the actual trading results may differ from this sensitivity analysis and the difference could be material.
20Semi-Annual Reportport
Notes to Financial Statements (Unaudited) – continued(Amounts in thousands of Canadian dollars/thousands of securities (except per security amounts))
Emerging Market Risk - The Fund’s exposure in countries with limited or developing capital markets may involve greater risks than invest-ments in more developed markets, and the prices of such investments may be volatile due to the consequences of political, social, or economic changes.
Interest Rate Risk - Interest rate risk arises on interest-bearing financial instruments held directly or indirectly in the investment portfolio such as bonds. The Fund is exposed to the risk that the fair value or the future cash flows of interest-bearing financial instruments will fluctu-ate due to changes in the prevailing levels of market interest rates. Any excess cash may be invested in short-term investments at market inter-est rates. The majority of the Fund’s financial instrument exposure is non-interest bearing. As a result, the Fund is not subject to significant amounts of risk due to fluctuations in the prevailing levels of market interest rates.
Currency Risk - Currency risk arises from financial instruments that are denominated in a currency other than Canadian dollar, which is the Fund’s functional currency.
The Fund is exposed to the risk that the value of financial instruments will fluctuate due to changes in exchange rates. Currency risk is not considered to arise from financial instruments that are non-monetary items such as equity investments, or forward foreign exchange contracts related to such non-monetary items. Foreign exchange exposure relating to non-monetary assets and liabilities is considered to be a component of other price risk, not foreign currency risk. As at September 30, 2017 and March 31, 2017, the majority of the Fund’s monetary assets and liabilities are denominated in Canadian dollars. As a result, the Fund is not subject to significant amounts of currency risk.

21 Semi-Annual Report

22Semi-Annual Reportport

23 Semi-Annual Report
Fidelity Investments Canada ULC483 Bay Street, Suite 300Toronto, Ontario M5G 2N7
Manager, Transfer Agent and RegistrarFidelity Investments Canada ULC483 Bay Street, Suite 300Toronto, Ontario M5G 2N7
Portfolio AdviserFidelity Investments Canada ULCToronto, Ontario
CustodianState Street Trust Company of CanadaToronto, Ontario
AuditorPricewaterhouseCoopers LLPToronto, Ontario
Visit us online atwww.fidelity.caor call Fidelity Client Servicesat 1-800-263-4077
Fidelity’s mutual funds are sold by registered Investment Professionals. Each Fund has a simplified prospectus, which contains important information on the Fund, including its investment objective, purchase options, and applicable charges. Please obtain a copy of the prospectus, read it carefully, and consult your Investment Professional before investing. As with any investment, there are risks to investing in mutual funds. There is no assurance that any Fund will achieve its investment objective, and its net asset value, yield, and investment return will fluctuate from time to time with market conditions. Investors may experience a gain or loss when they sell their securities in any Fidelity Fund. Fidelity Global Funds may be more volatile than other Fidelity Funds as they concentrate investments in one sector and in fewer issuers; no single Fund is intended to be a complete diversified investment program. Past performance is no assurance or indicator of future returns. There is no assurance that either Fidelity Canadian Money Market Fund or Fidelity U.S. Money Market Fund will be able to maintain its net asset value at a constant amount. The breakdown of Fund investments is presented to illustrate the way in which a Fund may invest, and may not be representative of a Fund’s current or future investments. A Fund’s investments may change at any time.
®Fidelity Investments is a registered trademark of Fidelity Investments Canada ULC.62.107466E 1.753313.116
FICL-EMP-SANN-1117