Embed Size (px)
Citation preview
1
Fidelity Capital Markets
Fidelity Capital Markets FCM Municipal Compendium 2022
The FCM Municipal Compendium is a compilation of statistics relevant to the municipal bond market. The data includes information on returns, relative value, credit, state tax revenues and debt, bond issuance, and demographics. The focus of the Compendium is on the fifty U.S. states, but also covers market-wide trends. Aggregate statistics are provided for municipal bond market volatility-adjusted returns and correlations versus other fixed income investments; yield comparisons to Treasury and corporate bonds; credit rating trends; fund balance trends; municipal securities holders; bond issuance trends; and state tax revenue trends. Individual state statistics are provided for state bond market returns; debt and pension obligations; fund balances; state tax revenues and tax burdens; tax base trends; and economic diversity. The individual state statistics are ranked and presented in tables by quintile.
By: Ilya Perlovsky, CFA® FCM Market Strategist
Thomas DeMarco, CFA® FCM Market Strategist
2
Fidelity Capital Markets
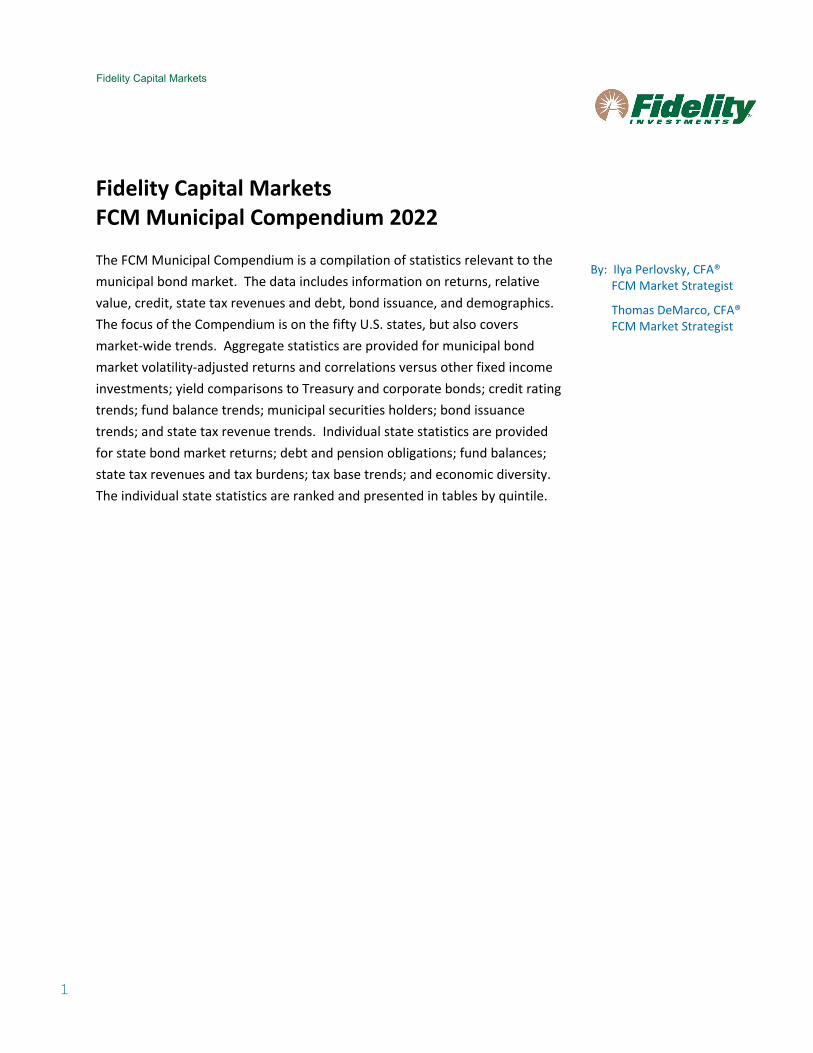
Total Returns, Volatility, and Correlations
-0.4
-0.2
0.0
0.2
0.4
0.6
0.8
1.0
1.2
1.4
Japa
nCa
nada
Aust
ralia
Germ
any
UK
Fran
ceSp
ain
Braz
ilTu
rkey
Italy
Mex
ico
Trea
surie
sTI
PSGl
obal
Cor
pIn
done
siaU
S Co
rpU
S Pr
efer
reds
Sout
h Ko
rea
Agen
cies
US
Mor
tgag
esU
S HY
US
ABS/
CMBS
Mun
isU
S Co
nver
tible
s
Fixed Income Return/Volatility Ratios10 Years
0.0
0.2
0.4
0.6
0.8
1.0
1.2
1.4
Japa
nGe
rman
yAu
stra
liaTu
rkey
Fran
ce UK
Cana
daIta
lySp
ain
Mex
ico
Braz
ilU
S Pr
efer
reds
Glob
al C
orp
US
HYTr
easu
ries
US
Corp
Sout
h Ko
rea
US
ABS/
CMBS
Mun
isIn
done
sia TIPS
Agen
cies
US
Mor
tgag
esU
S Co
nver
tible
s
Fixed Income Return/Volatility Ratios5 Years
-0.4-0.20.00.20.40.60.81.01.21.41.61.8
Japa
nGe
rman
yFr
ance
Spai
nAu
stra
liaTu
rkey UK
Italy
Braz
ilM
exic
oU
S Pr
efer
reds
Cana
daGl
obal
Cor
pM
unis
US
ABS/
CMBS
US
HYTr
easu
ries
US
Corp
Sout
h Ko
rea
Indo
nesia
Agen
cies
US
Conv
ertib
les
TIPS
US
Mor
tgag
es
Fixed Income Return/Volatility Ratios3 Years
-2.5-2.0-1.5-1.0-0.50.00.51.01.52.02.5
Japa
nFr
ance
Germ
any
Spai
nIta
lyAu
stra
liaGl
obal
Cor
pU
S M
ortg
ages UK
Braz
ilTr
easu
ries
Agen
cies
Turk
eyM
exic
oCa
nada
Sout
h Ko
rea
US
Corp
US
ABS/
CMBS
Indo
nesia
US
Conv
ertib
les
US
Pref
erre
dsM
unis
TIPS
US
HY
Fixed Income Return/Volatility Ratios1 Year
Source: ICE Data Indices, LLC, Bloomberg Finance LLP, FCM; Dec 31, 2021 Return: annual total return in USD; Volatility: annualized standard deviation of weekly total returns
3
Fidelity Capital Markets
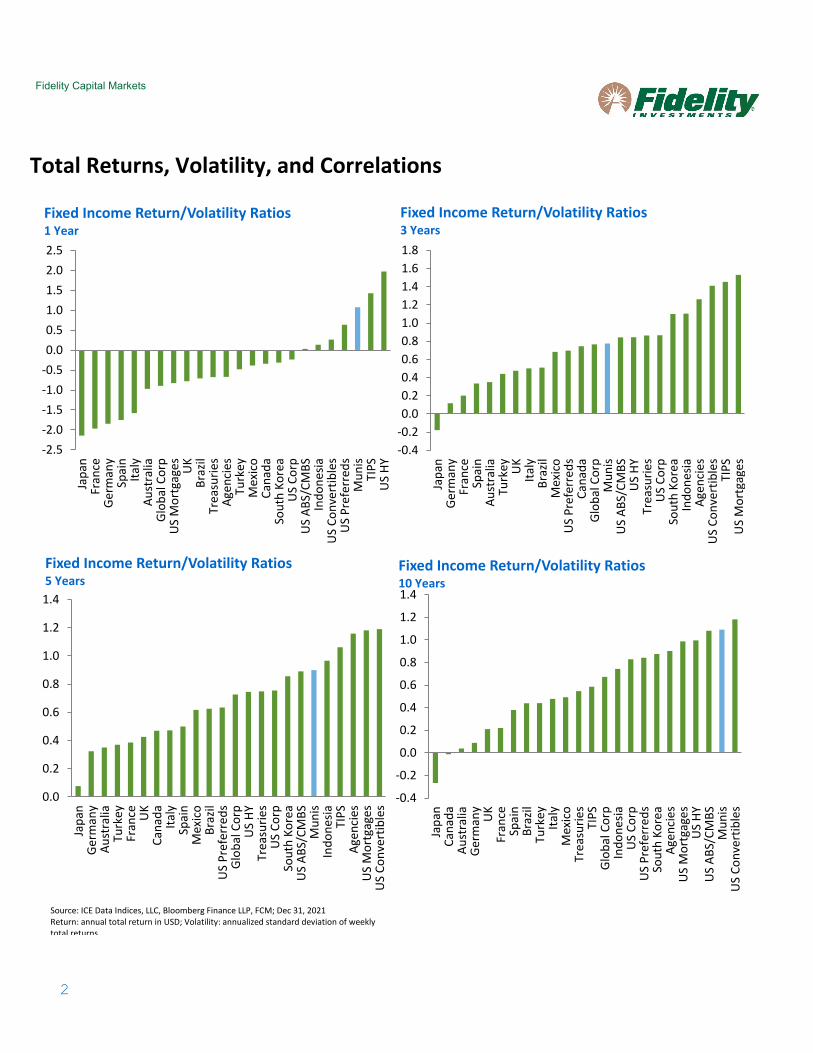
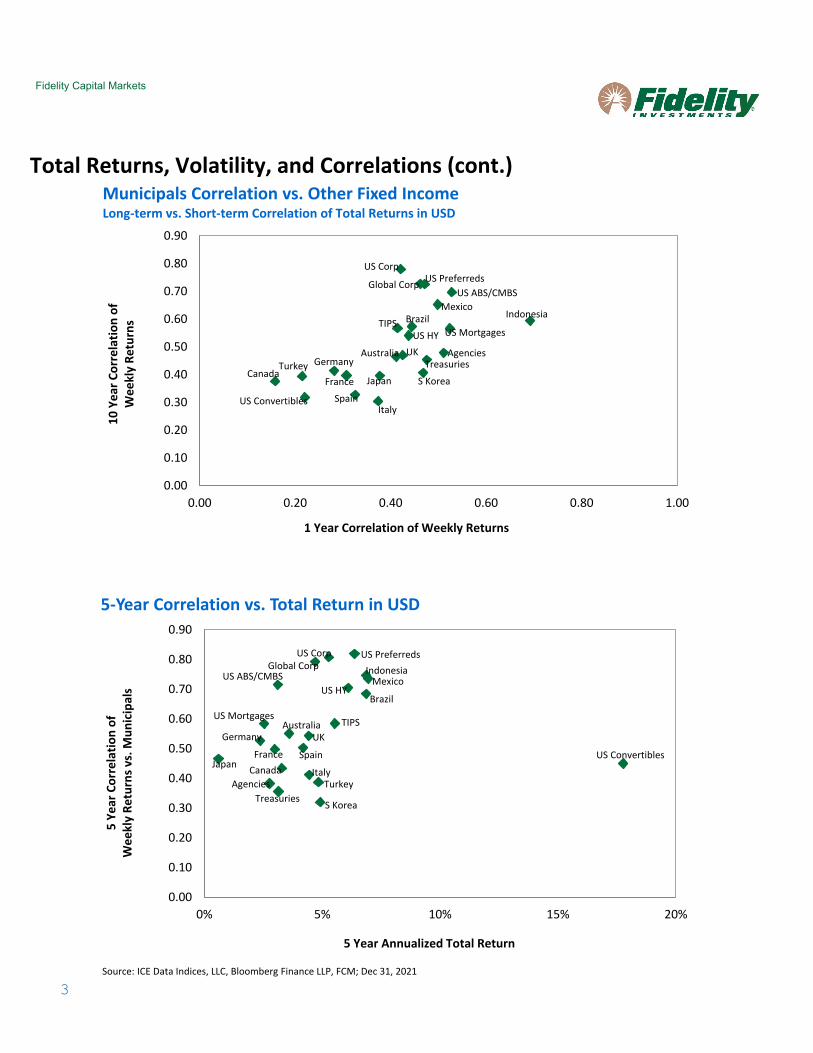
Total Returns, Volatility, and Correlations (cont.)
US Convertibles
IndonesiaBrazil
US Preferreds
Turkey
Mexico
Japan
Spain
US HY
US ABS/CMBS
Italy
Australia
S Korea
UK
US Mortgages
France
TIPS
GermanyCanada
AgenciesTreasuries
US Corp
Global Corp
0.00
0.10
0.20
0.30
0.40
0.50
0.60
0.70
0.80
0.90
0.00 0.20 0.40 0.60 0.80 1.00
10 Y
ear C
orre
latio
n of
Wee
kly
Retu
rns
1 Year Correlation of Weekly Returns
Municipals Correlation vs. Other Fixed IncomeLong-term vs. Short-term Correlation of Total Returns in USD
US Convertibles
Indonesia
Brazil
US Preferreds
Turkey
Mexico
JapanSpain
US HYUS ABS/CMBS
Italy
Australia
S Korea
UK
US Mortgages
France
TIPSGermany
CanadaAgencies
Treasuries
US CorpGlobal Corp
0.00
0.10
0.20
0.30
0.40
0.50
0.60
0.70
0.80
0.90
0% 5% 10% 15% 20%
5 Ye
ar C
orre
latio
n of
Wee
kly
Retu
rns v
s. M
unic
ipal
s
5 Year Annualized Total Return
5-Year Correlation vs. Total Return in USD
Source: ICE Data Indices, LLC, Bloomberg Finance LLP, FCM; Dec 31, 2021
4
Fidelity Capital Markets
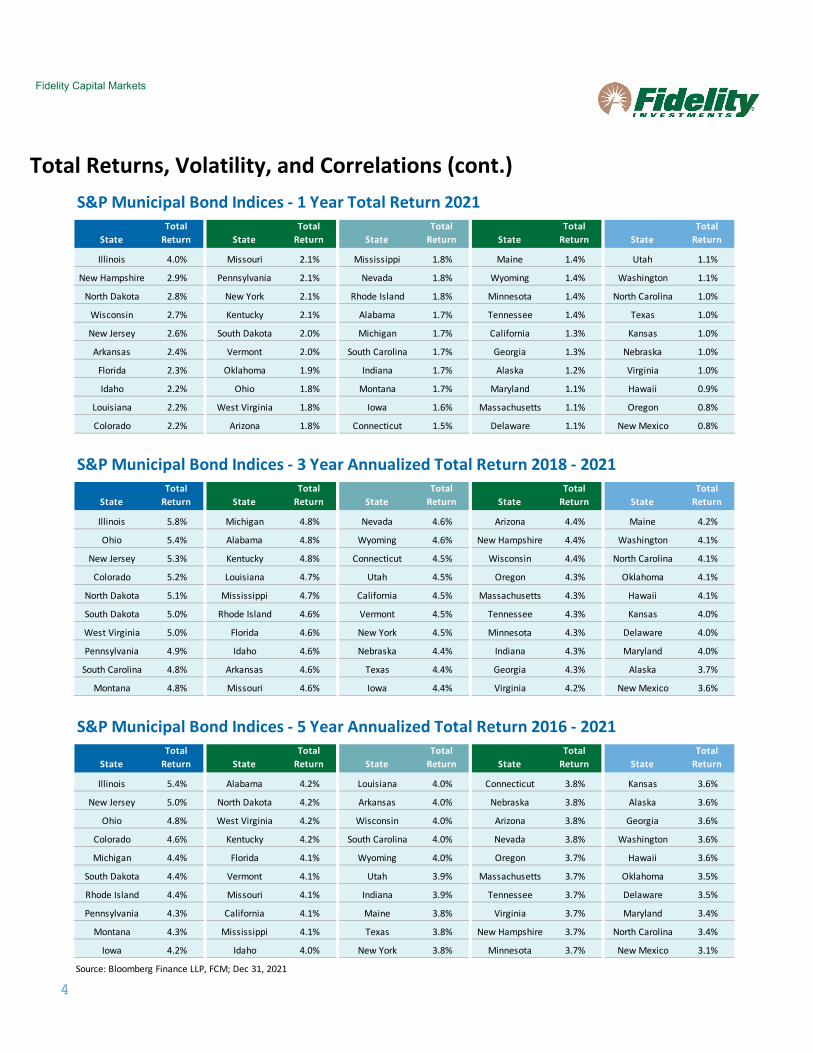
Total Returns, Volatility, and Correlations (cont.) S&P Municipal Bond Indices - 1 Year Total Return 2021
StateTotal
Return StateTotal
Return StateTotal
Return StateTotal
Return StateTotal
Return
Illinois 4.0% Missouri 2.1% Mississippi 1.8% Maine 1.4% Utah 1.1%
New Hampshire 2.9% Pennsylvania 2.1% Nevada 1.8% Wyoming 1.4% Washington 1.1%
North Dakota 2.8% New York 2.1% Rhode Island 1.8% Minnesota 1.4% North Carolina 1.0%
Wisconsin 2.7% Kentucky 2.1% Alabama 1.7% Tennessee 1.4% Texas 1.0%
New Jersey 2.6% South Dakota 2.0% Michigan 1.7% California 1.3% Kansas 1.0%
Arkansas 2.4% Vermont 2.0% South Carolina 1.7% Georgia 1.3% Nebraska 1.0%
Florida 2.3% Oklahoma 1.9% Indiana 1.7% Alaska 1.2% Virginia 1.0%
Idaho 2.2% Ohio 1.8% Montana 1.7% Maryland 1.1% Hawaii 0.9%
Louisiana 2.2% West Virginia 1.8% Iowa 1.6% Massachusetts 1.1% Oregon 0.8%
Colorado 2.2% Arizona 1.8% Connecticut 1.5% Delaware 1.1% New Mexico 0.8%
S&P Municipal Bond Indices - 3 Year Annualized Total Return 2018 - 2021
StateTotal
Return StateTotal
Return StateTotal
Return StateTotal
Return StateTotal
Return
Illinois 5.8% Michigan 4.8% Nevada 4.6% Arizona 4.4% Maine 4.2%
Ohio 5.4% Alabama 4.8% Wyoming 4.6% New Hampshire 4.4% Washington 4.1%
New Jersey 5.3% Kentucky 4.8% Connecticut 4.5% Wisconsin 4.4% North Carolina 4.1%
Colorado 5.2% Louisiana 4.7% Utah 4.5% Oregon 4.3% Oklahoma 4.1%
North Dakota 5.1% Mississippi 4.7% California 4.5% Massachusetts 4.3% Hawaii 4.1%
South Dakota 5.0% Rhode Island 4.6% Vermont 4.5% Tennessee 4.3% Kansas 4.0%
West Virginia 5.0% Florida 4.6% New York 4.5% Minnesota 4.3% Delaware 4.0%
Pennsylvania 4.9% Idaho 4.6% Nebraska 4.4% Indiana 4.3% Maryland 4.0%
South Carolina 4.8% Arkansas 4.6% Texas 4.4% Georgia 4.3% Alaska 3.7%
Montana 4.8% Missouri 4.6% Iowa 4.4% Virginia 4.2% New Mexico 3.6%
S&P Municipal Bond Indices - 5 Year Annualized Total Return 2016 - 2021
StateTotal
Return StateTotal
Return StateTotal
Return StateTotal
Return StateTotal
Return
Illinois 5.4% Alabama 4.2% Louisiana 4.0% Connecticut 3.8% Kansas 3.6%
New Jersey 5.0% North Dakota 4.2% Arkansas 4.0% Nebraska 3.8% Alaska 3.6%
Ohio 4.8% West Virginia 4.2% Wisconsin 4.0% Arizona 3.8% Georgia 3.6%
Colorado 4.6% Kentucky 4.2% South Carolina 4.0% Nevada 3.8% Washington 3.6%
Michigan 4.4% Florida 4.1% Wyoming 4.0% Oregon 3.7% Hawaii 3.6%
South Dakota 4.4% Vermont 4.1% Utah 3.9% Massachusetts 3.7% Oklahoma 3.5%
Rhode Island 4.4% Missouri 4.1% Indiana 3.9% Tennessee 3.7% Delaware 3.5%
Pennsylvania 4.3% California 4.1% Maine 3.8% Virginia 3.7% Maryland 3.4%
Montana 4.3% Mississippi 4.1% Texas 3.8% New Hampshire 3.7% North Carolina 3.4%
Iowa 4.2% Idaho 4.0% New York 3.8% Minnesota 3.7% New Mexico 3.1%
Source: Bloomberg Finance LLP, FCM; Dec 31, 2021
5
Fidelity Capital Markets
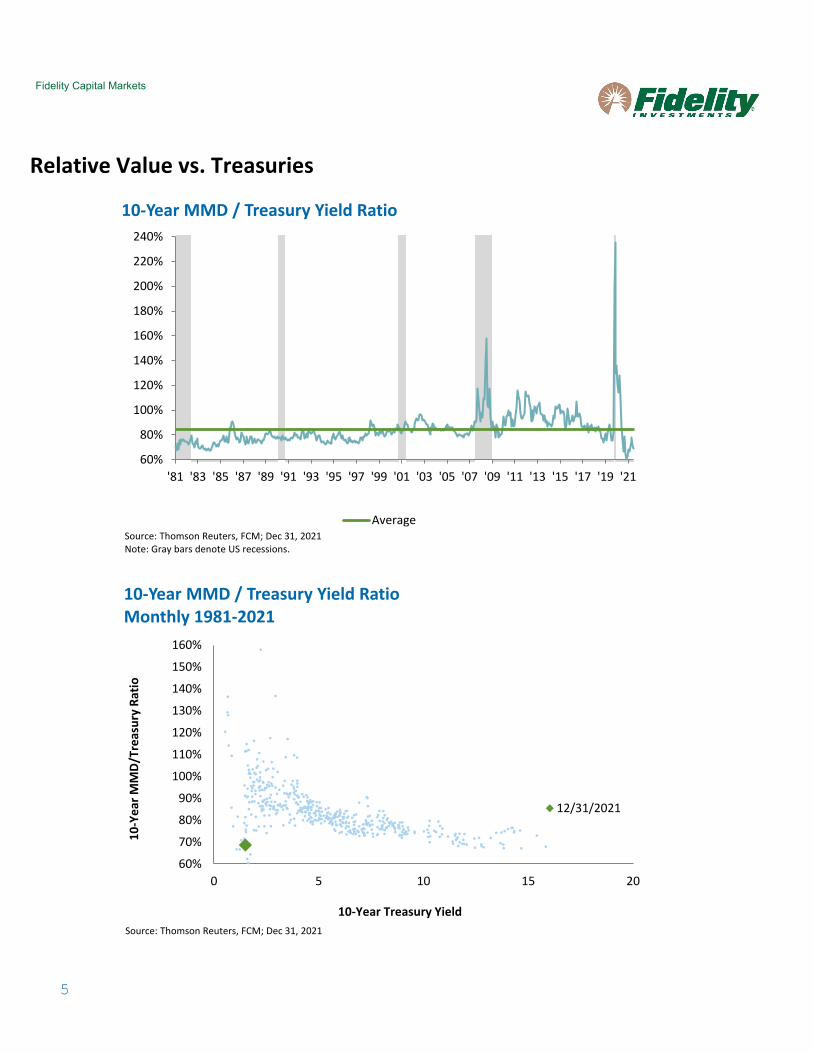
Relative Value vs. Treasuries
60%
80%
100%
120%
140%
160%
180%
200%
220%
240%
'81 '83 '85 '87 '89 '91 '93 '95 '97 '99 '01 '03 '05 '07 '09 '11 '13 '15 '17 '19 '21
10-Year MMD / Treasury Yield Ratio
AverageSource: Thomson Reuters, FCM; Dec 31, 2021Note: Gray bars denote US recessions.
60%
70%
80%
90%
100%
110%
120%
130%
140%
150%
160%
0 5 10 15 20
10-Y
ear M
MD/
Trea
sury
Rat
io
10-Year Treasury Yield
10-Year MMD / Treasury Yield RatioMonthly 1981-2021
12/31/2021
Source: Thomson Reuters, FCM; Dec 31, 2021
6
Fidelity Capital Markets
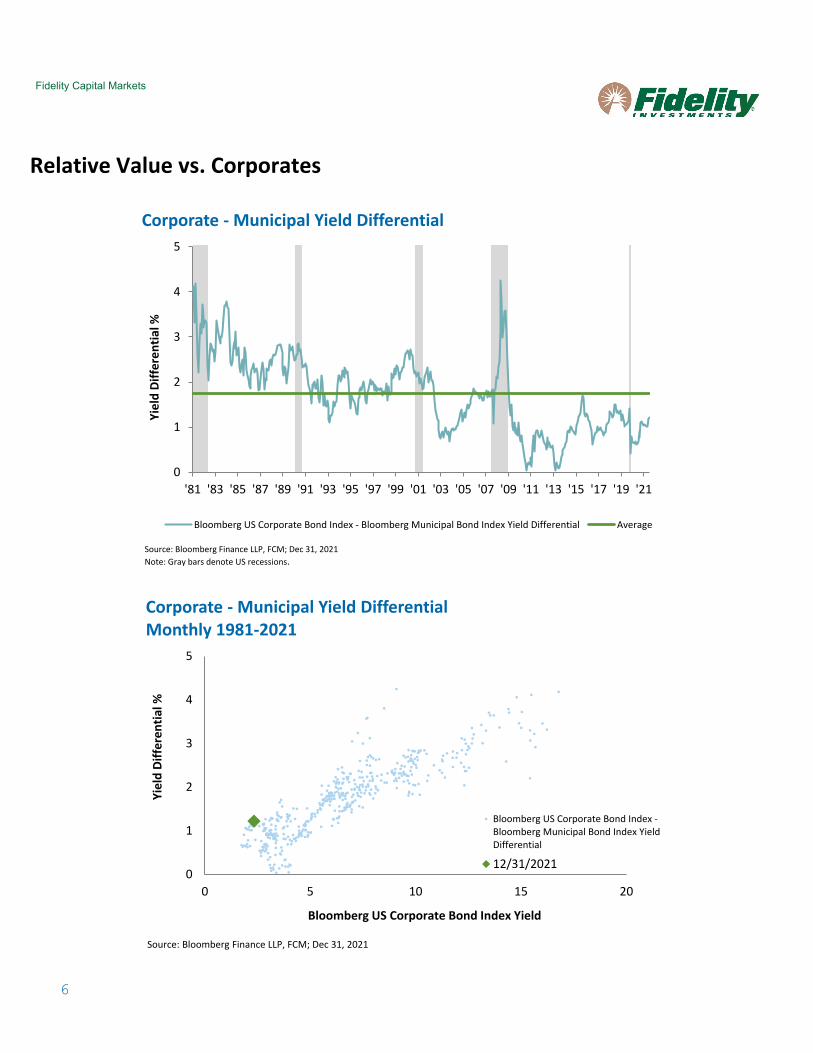
Relative Value vs. Corporates
0
1
2
3
4
5
'81 '83 '85 '87 '89 '91 '93 '95 '97 '99 '01 '03 '05 '07 '09 '11 '13 '15 '17 '19 '21
Yiel
d Di
ffer
entia
l %
Corporate - Municipal Yield Differential
Bloomberg US Corporate Bond Index - Bloomberg Municipal Bond Index Yield Differential Average
Source: Bloomberg Finance LLP, FCM; Dec 31, 2021Note: Gray bars denote US recessions.
0
1
2
3
4
5
0 5 10 15 20
Yiel
d Di
ffer
entia
l %
Bloomberg US Corporate Bond Index Yield
Corporate - Municipal Yield DifferentialMonthly 1981-2021
Bloomberg US Corporate Bond Index -Bloomberg Municipal Bond Index YieldDifferential
12/31/2021
Source: Bloomberg Finance LLP, FCM; Dec 31, 2021
7
Fidelity Capital Markets
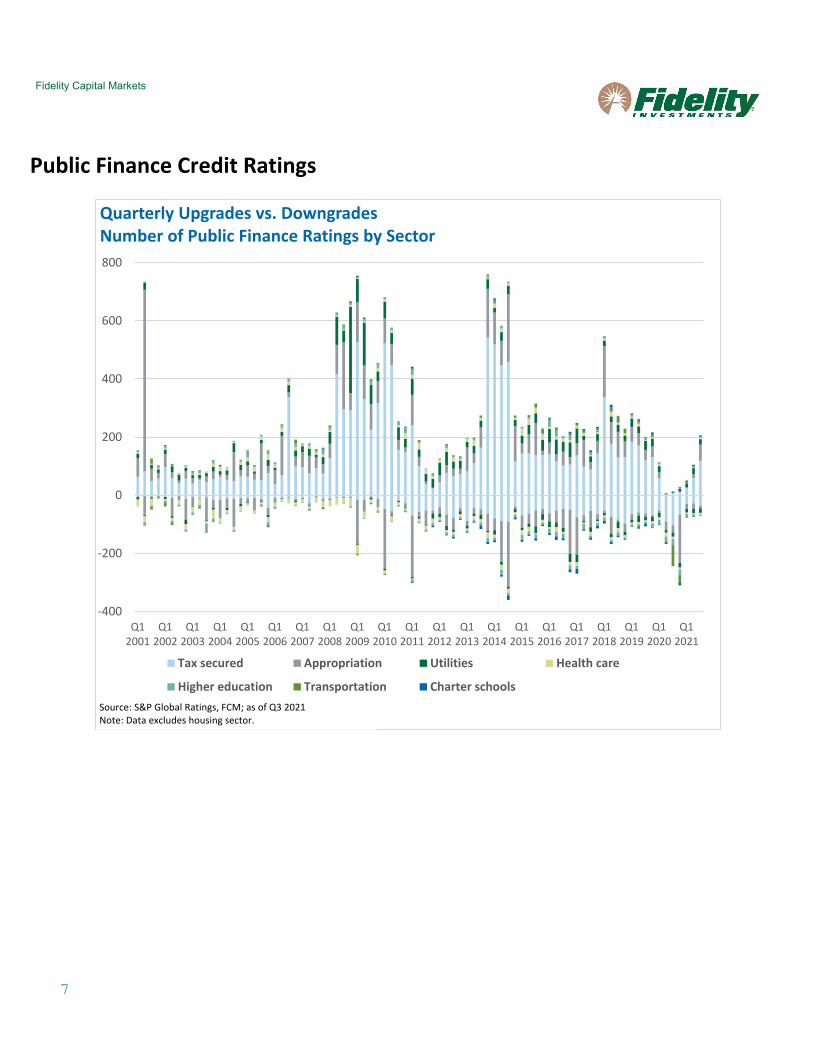
Public Finance Credit Ratings
-400
-200
0
200
400
600
800
Q12001
Q12002
Q12003
Q12004
Q12005
Q12006
Q12007
Q12008
Q12009
Q12010
Q12011
Q12012
Q12013
Q12014
Q12015
Q12016
Q12017
Q12018
Q12019
Q12020
Q12021
Quarterly Upgrades vs. DowngradesNumber of Public Finance Ratings by Sector
Tax secured Appropriation Utilities Health care
Higher education Transportation Charter schoolsSource: S&P Global Ratings, FCM; as of Q3 2021Note: Data excludes housing sector.
8
Fidelity Capital Markets
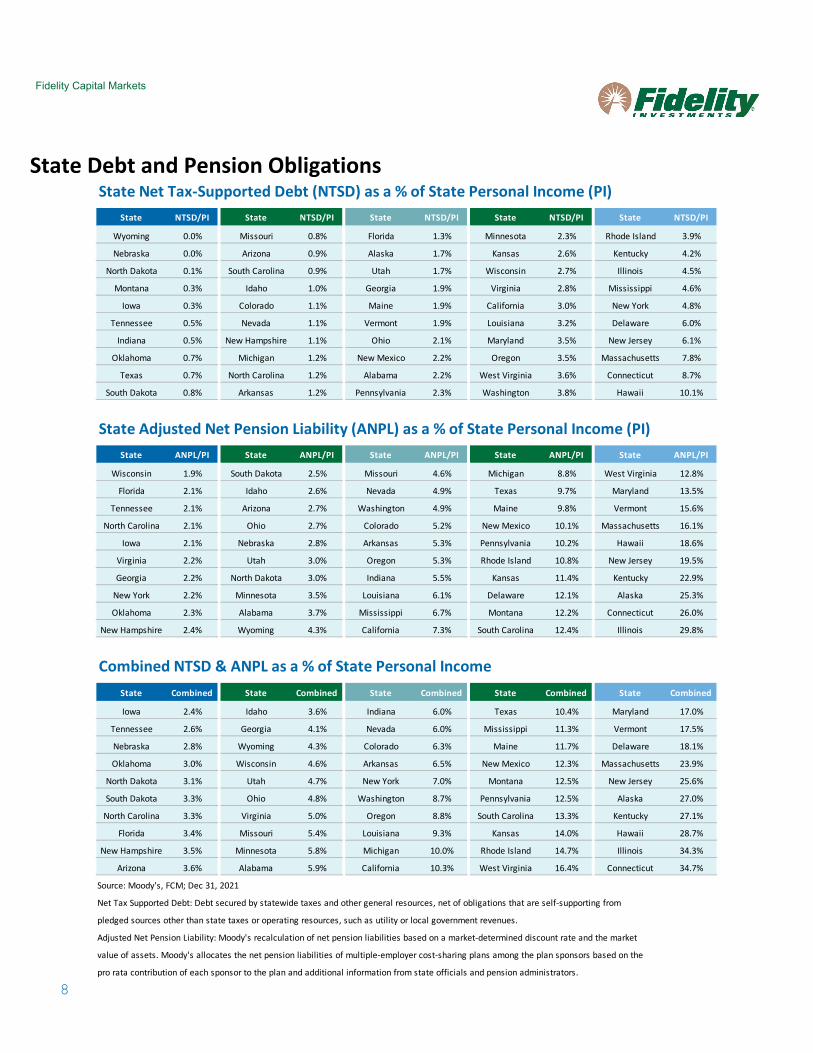
State Debt and Pension Obligations State Net Tax-Supported Debt (NTSD) as a % of State Personal Income (PI)
State NTSD/PI State NTSD/PI State NTSD/PI State NTSD/PI State NTSD/PI
Wyoming 0.0% Missouri 0.8% Florida 1.3% Minnesota 2.3% Rhode Island 3.9%
Nebraska 0.0% Arizona 0.9% Alaska 1.7% Kansas 2.6% Kentucky 4.2%
North Dakota 0.1% South Carolina 0.9% Utah 1.7% Wisconsin 2.7% Illinois 4.5%
Montana 0.3% Idaho 1.0% Georgia 1.9% Virginia 2.8% Mississippi 4.6%
Iowa 0.3% Colorado 1.1% Maine 1.9% California 3.0% New York 4.8%
Tennessee 0.5% Nevada 1.1% Vermont 1.9% Louisiana 3.2% Delaware 6.0%
Indiana 0.5% New Hampshire 1.1% Ohio 2.1% Maryland 3.5% New Jersey 6.1%
Oklahoma 0.7% Michigan 1.2% New Mexico 2.2% Oregon 3.5% Massachusetts 7.8%
Texas 0.7% North Carolina 1.2% Alabama 2.2% West Virginia 3.6% Connecticut 8.7%
South Dakota 0.8% Arkansas 1.2% Pennsylvania 2.3% Washington 3.8% Hawaii 10.1%
State Adjusted Net Pension Liability (ANPL) as a % of State Personal Income (PI)State ANPL/PI State ANPL/PI State ANPL/PI State ANPL/PI State ANPL/PI
Wisconsin 1.9% South Dakota 2.5% Missouri 4.6% Michigan 8.8% West Virginia 12.8%
Florida 2.1% Idaho 2.6% Nevada 4.9% Texas 9.7% Maryland 13.5%
Tennessee 2.1% Arizona 2.7% Washington 4.9% Maine 9.8% Vermont 15.6%
North Carolina 2.1% Ohio 2.7% Colorado 5.2% New Mexico 10.1% Massachusetts 16.1%
Iowa 2.1% Nebraska 2.8% Arkansas 5.3% Pennsylvania 10.2% Hawaii 18.6%
Virginia 2.2% Utah 3.0% Oregon 5.3% Rhode Island 10.8% New Jersey 19.5%
Georgia 2.2% North Dakota 3.0% Indiana 5.5% Kansas 11.4% Kentucky 22.9%
New York 2.2% Minnesota 3.5% Louisiana 6.1% Delaware 12.1% Alaska 25.3%
Oklahoma 2.3% Alabama 3.7% Mississippi 6.7% Montana 12.2% Connecticut 26.0%
New Hampshire 2.4% Wyoming 4.3% California 7.3% South Carolina 12.4% Illinois 29.8%
Combined NTSD & ANPL as a % of State Personal IncomeState Combined State Combined State Combined State Combined State Combined
Iowa 2.4% Idaho 3.6% Indiana 6.0% Texas 10.4% Maryland 17.0%
Tennessee 2.6% Georgia 4.1% Nevada 6.0% Mississippi 11.3% Vermont 17.5%
Nebraska 2.8% Wyoming 4.3% Colorado 6.3% Maine 11.7% Delaware 18.1%
Oklahoma 3.0% Wisconsin 4.6% Arkansas 6.5% New Mexico 12.3% Massachusetts 23.9%
North Dakota 3.1% Utah 4.7% New York 7.0% Montana 12.5% New Jersey 25.6%
South Dakota 3.3% Ohio 4.8% Washington 8.7% Pennsylvania 12.5% Alaska 27.0%
North Carolina 3.3% Virginia 5.0% Oregon 8.8% South Carolina 13.3% Kentucky 27.1%
Florida 3.4% Missouri 5.4% Louisiana 9.3% Kansas 14.0% Hawaii 28.7%
New Hampshire 3.5% Minnesota 5.8% Michigan 10.0% Rhode Island 14.7% Illinois 34.3%
Arizona 3.6% Alabama 5.9% California 10.3% West Virginia 16.4% Connecticut 34.7%
Source: Moody's, FCM; Dec 31, 2021
Net Tax Supported Debt: Debt secured by statewide taxes and other general resources, net of obligations that are self-supporting from
pledged sources other than state taxes or operating resources, such as utility or local government revenues.
Adjusted Net Pension Liability: Moody's recalculation of net pension liabilities based on a market-determined discount rate and the market
value of assets. Moody's allocates the net pension liabilities of multiple-employer cost-sharing plans among the plan sponsors based on the
pro rata contribution of each sponsor to the plan and additional information from state officials and pension administrators.
9
Fidelity Capital Markets
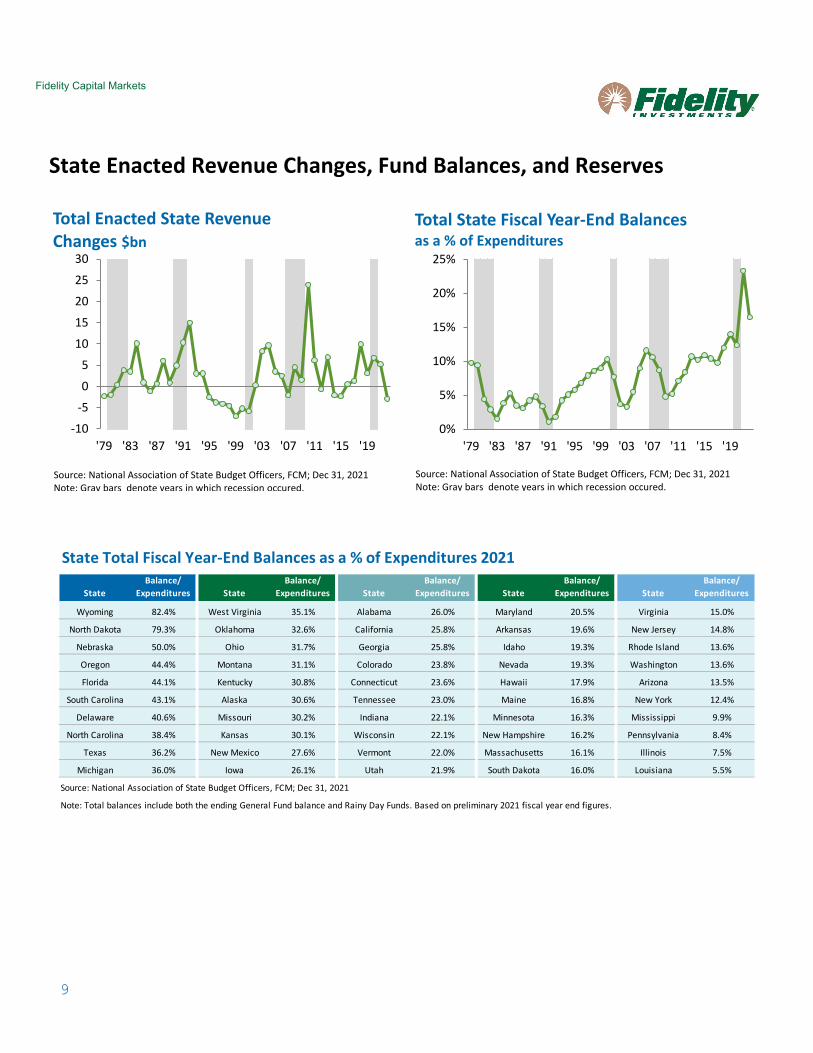
State Enacted Revenue Changes, Fund Balances, and Reserves
-10
-5
0
5
10
15
20
25
30
'79 '83 '87 '91 '95 '99 '03 '07 '11 '15 '19
Total Enacted State Revenue Changes $bn
Source: National Association of State Budget Officers, FCM; Dec 31, 2021Note: Gray bars denote years in which recession occured.
0%
5%
10%
15%
20%
25%
'79 '83 '87 '91 '95 '99 '03 '07 '11 '15 '19
Total State Fiscal Year-End Balances as a % of Expenditures
Source: National Association of State Budget Officers, FCM; Dec 31, 2021Note: Gray bars denote years in which recession occured.
State Total Fiscal Year-End Balances as a % of Expenditures 2021
StateBalance/
Expenditures StateBalance/
Expenditures StateBalance/
Expenditures StateBalance/
Expenditures StateBalance/
Expenditures
Wyoming 82.4% West Virginia 35.1% Alabama 26.0% Maryland 20.5% Virginia 15.0%
North Dakota 79.3% Oklahoma 32.6% California 25.8% Arkansas 19.6% New Jersey 14.8%
Nebraska 50.0% Ohio 31.7% Georgia 25.8% Idaho 19.3% Rhode Island 13.6%
Oregon 44.4% Montana 31.1% Colorado 23.8% Nevada 19.3% Washington 13.6%
Florida 44.1% Kentucky 30.8% Connecticut 23.6% Hawaii 17.9% Arizona 13.5%
South Carolina 43.1% Alaska 30.6% Tennessee 23.0% Maine 16.8% New York 12.4%
Delaware 40.6% Missouri 30.2% Indiana 22.1% Minnesota 16.3% Mississippi 9.9%
North Carolina 38.4% Kansas 30.1% Wisconsin 22.1% New Hampshire 16.2% Pennsylvania 8.4%
Texas 36.2% New Mexico 27.6% Vermont 22.0% Massachusetts 16.1% Illinois 7.5%
Michigan 36.0% Iowa 26.1% Utah 21.9% South Dakota 16.0% Louisiana 5.5%
Source: National Association of State Budget Officers, FCM; Dec 31, 2021
Note: Total balances include both the ending General Fund balance and Rainy Day Funds. Based on preliminary 2021 fiscal year end figures.
10
Fidelity Capital Markets
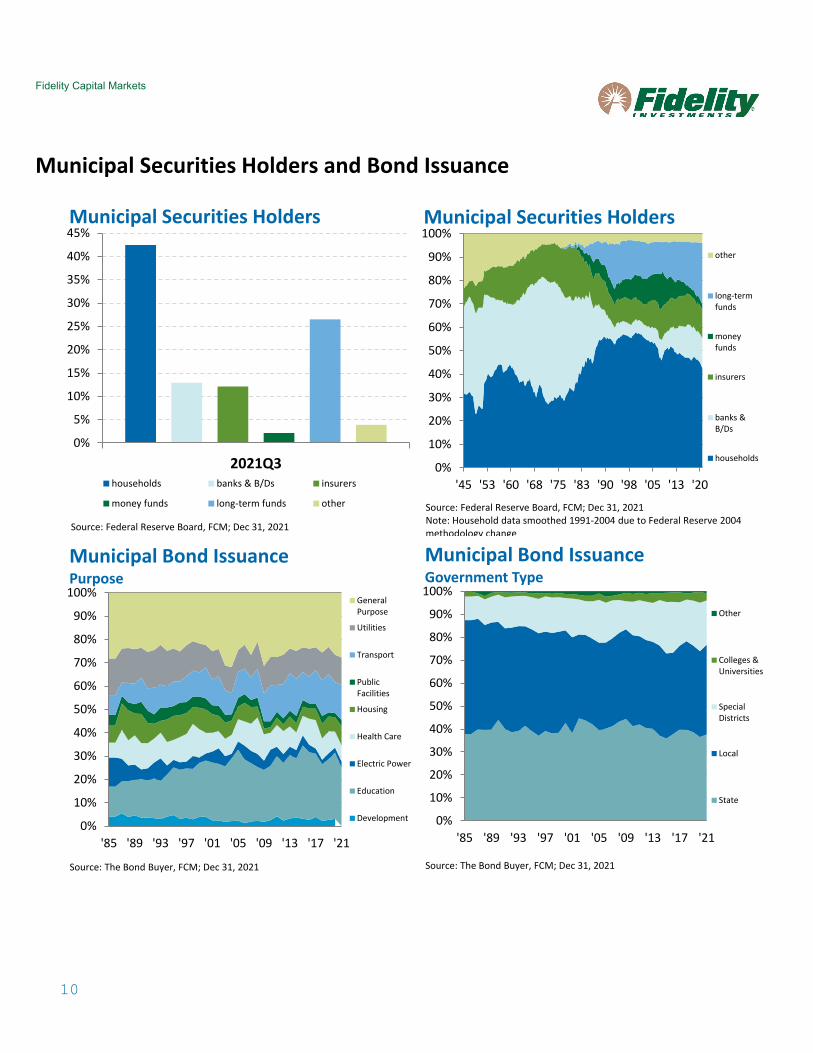
Municipal Securities Holders and Bond Issuance
0%
10%
20%
30%
40%
50%
60%
70%
80%
90%
100%
'45 '53 '60 '68 '75 '83 '90 '98 '05 '13 '20
Municipal Securities Holders
other
long-termfunds
moneyfunds
insurers
banks &B/Ds
households
Source: Federal Reserve Board, FCM; Dec 31, 2021Note: Household data smoothed 1991-2004 due to Federal Reserve 2004 methodology change
0%
5%
10%
15%
20%
25%
30%
35%
40%
45%
2021Q3
Municipal Securities Holders
households banks & B/Ds insurers
money funds long-term funds other
Source: Federal Reserve Board, FCM; Dec 31, 2021
0%
10%
20%
30%
40%
50%
60%
70%
80%
90%
100%
'85 '89 '93 '97 '01 '05 '09 '13 '17 '21
Municipal Bond IssuancePurpose
GeneralPurpose
Utilities
Transport
PublicFacilities
Housing
Health Care
Electric Power
Education
Development
Source: The Bond Buyer, FCM; Dec 31, 2021
0%
10%
20%
30%
40%
50%
60%
70%
80%
90%
100%
'85 '89 '93 '97 '01 '05 '09 '13 '17 '21
Municipal Bond IssuanceGovernment Type
Other
Colleges &Universities
SpecialDistricts
Local
State
Source: The Bond Buyer, FCM; Dec 31, 2021
11
Fidelity Capital Markets
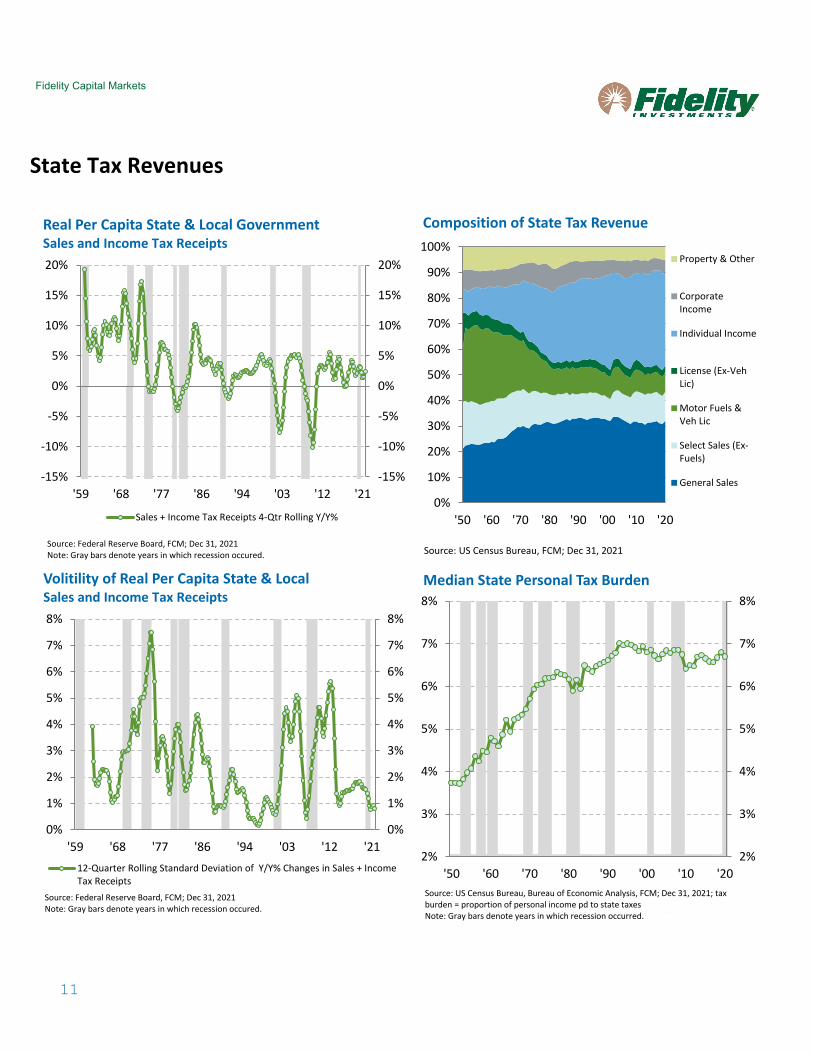
State Tax Revenues
0%
10%
20%
30%
40%
50%
60%
70%
80%
90%
100%
'50 '60 '70 '80 '90 '00 '10 '20
Composition of State Tax Revenue
Property & Other
CorporateIncome
Individual Income
License (Ex-VehLic)
Motor Fuels &Veh Lic
Select Sales (Ex-Fuels)
General Sales
Source: US Census Bureau, FCM; Dec 31, 2021
-15%
-10%
-5%
0%
5%
10%
15%
20%
-15%
-10%
-5%
0%
5%
10%
15%
20%
'59 '68 '77 '86 '94 '03 '12 '21
Real Per Capita State & Local GovernmentSales and Income Tax Receipts
Sales + Income Tax Receipts 4-Qtr Rolling Y/Y%
Source: Federal Reserve Board, FCM; Dec 31, 2021Note: Gray bars denote years in which recession occured.
0%
1%
2%
3%
4%
5%
6%
7%
8%
0%
1%
2%
3%
4%
5%
6%
7%
8%
'59 '68 '77 '86 '94 '03 '12 '21
Volitility of Real Per Capita State & Local Sales and Income Tax Receipts
12-Quarter Rolling Standard Deviation of Y/Y% Changes in Sales + IncomeTax Receipts
Source: Federal Reserve Board, FCM; Dec 31, 2021Note: Gray bars denote years in which recession occured.
2%
3%
4%
5%
6%
7%
8%
2%
3%
4%
5%
6%
7%
8%
'50 '60 '70 '80 '90 '00 '10 '20
Median State Personal Tax Burden
Source: US Census Bureau, Bureau of Economic Analysis, FCM; Dec 31, 2021; tax burden = proportion of personal income pd to state taxesNote: Gray bars denote years in which recession occurred. b d h h d
12
Fidelity Capital Markets
State Tax Revenues (cont.)
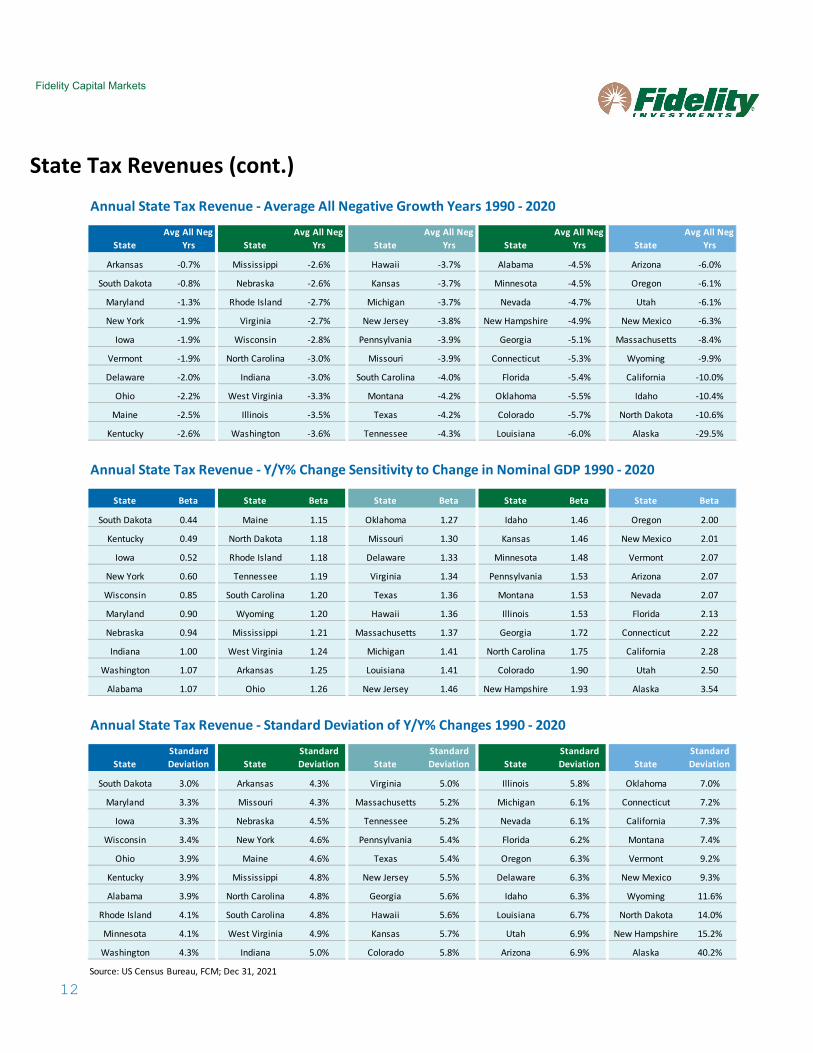
Annual State Tax Revenue - Average All Negative Growth Years 1990 - 2020
StateAvg All Neg
Yrs StateAvg All Neg
Yrs StateAvg All Neg
Yrs StateAvg All Neg
Yrs StateAvg All Neg
Yrs
Arkansas -0.7% Mississippi -2.6% Hawaii -3.7% Alabama -4.5% Arizona -6.0%
South Dakota -0.8% Nebraska -2.6% Kansas -3.7% Minnesota -4.5% Oregon -6.1%
Maryland -1.3% Rhode Island -2.7% Michigan -3.7% Nevada -4.7% Utah -6.1%
New York -1.9% Virginia -2.7% New Jersey -3.8% New Hampshire -4.9% New Mexico -6.3%
Iowa -1.9% Wisconsin -2.8% Pennsylvania -3.9% Georgia -5.1% Massachusetts -8.4%
Vermont -1.9% North Carolina -3.0% Missouri -3.9% Connecticut -5.3% Wyoming -9.9%
Delaware -2.0% Indiana -3.0% South Carolina -4.0% Florida -5.4% California -10.0%
Ohio -2.2% West Virginia -3.3% Montana -4.2% Oklahoma -5.5% Idaho -10.4%
Maine -2.5% Illinois -3.5% Texas -4.2% Colorado -5.7% North Dakota -10.6%
Kentucky -2.6% Washington -3.6% Tennessee -4.3% Louisiana -6.0% Alaska -29.5%
Annual State Tax Revenue - Y/Y% Change Sensitivity to Change in Nominal GDP 1990 - 2020
State Beta State Beta State Beta State Beta State Beta
South Dakota 0.44 Maine 1.15 Oklahoma 1.27 Idaho 1.46 Oregon 2.00
Kentucky 0.49 North Dakota 1.18 Missouri 1.30 Kansas 1.46 New Mexico 2.01
Iowa 0.52 Rhode Island 1.18 Delaware 1.33 Minnesota 1.48 Vermont 2.07
New York 0.60 Tennessee 1.19 Virginia 1.34 Pennsylvania 1.53 Arizona 2.07
Wisconsin 0.85 South Carolina 1.20 Texas 1.36 Montana 1.53 Nevada 2.07
Maryland 0.90 Wyoming 1.20 Hawaii 1.36 Illinois 1.53 Florida 2.13
Nebraska 0.94 Mississippi 1.21 Massachusetts 1.37 Georgia 1.72 Connecticut 2.22
Indiana 1.00 West Virginia 1.24 Michigan 1.41 North Carolina 1.75 California 2.28
Washington 1.07 Arkansas 1.25 Louisiana 1.41 Colorado 1.90 Utah 2.50
Alabama 1.07 Ohio 1.26 New Jersey 1.46 New Hampshire 1.93 Alaska 3.54
Annual State Tax Revenue - Standard Deviation of Y/Y% Changes 1990 - 2020
StateStandard Deviation State
Standard Deviation State
Standard Deviation State
Standard Deviation State
Standard Deviation
South Dakota 3.0% Arkansas 4.3% Virginia 5.0% Illinois 5.8% Oklahoma 7.0%
Maryland 3.3% Missouri 4.3% Massachusetts 5.2% Michigan 6.1% Connecticut 7.2%
Iowa 3.3% Nebraska 4.5% Tennessee 5.2% Nevada 6.1% California 7.3%
Wisconsin 3.4% New York 4.6% Pennsylvania 5.4% Florida 6.2% Montana 7.4%
Ohio 3.9% Maine 4.6% Texas 5.4% Oregon 6.3% Vermont 9.2%
Kentucky 3.9% Mississippi 4.8% New Jersey 5.5% Delaware 6.3% New Mexico 9.3%
Alabama 3.9% North Carolina 4.8% Georgia 5.6% Idaho 6.3% Wyoming 11.6%
Rhode Island 4.1% South Carolina 4.8% Hawaii 5.6% Louisiana 6.7% North Dakota 14.0%
Minnesota 4.1% West Virginia 4.9% Kansas 5.7% Utah 6.9% New Hampshire 15.2%
Washington 4.3% Indiana 5.0% Colorado 5.8% Arizona 6.9% Alaska 40.2%
Source: US Census Bureau, FCM; Dec 31, 2021
13
Fidelity Capital Markets
State Tax Revenues (cont.)
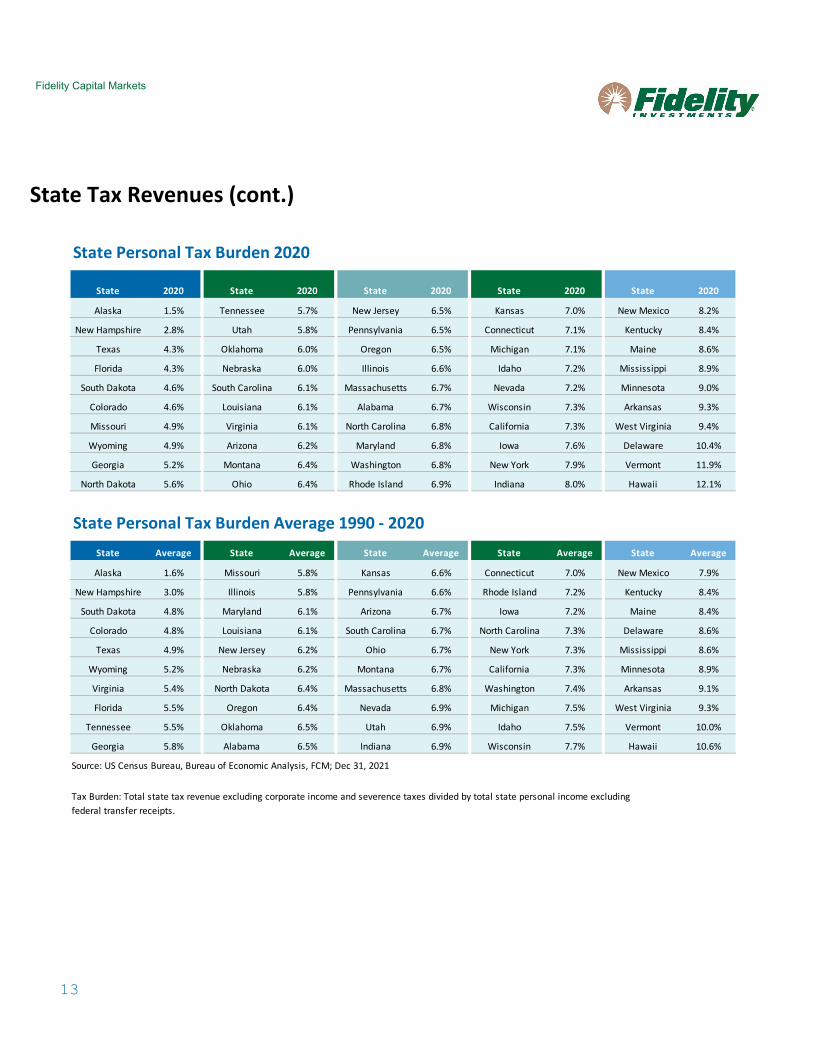
State Personal Tax Burden 2020
State 2020 State 2020 State 2020 State 2020 State 2020
Alaska 1.5% Tennessee 5.7% New Jersey 6.5% Kansas 7.0% New Mexico 8.2%
New Hampshire 2.8% Utah 5.8% Pennsylvania 6.5% Connecticut 7.1% Kentucky 8.4%
Texas 4.3% Oklahoma 6.0% Oregon 6.5% Michigan 7.1% Maine 8.6%
Florida 4.3% Nebraska 6.0% Illinois 6.6% Idaho 7.2% Mississippi 8.9%
South Dakota 4.6% South Carolina 6.1% Massachusetts 6.7% Nevada 7.2% Minnesota 9.0%
Colorado 4.6% Louisiana 6.1% Alabama 6.7% Wisconsin 7.3% Arkansas 9.3%
Missouri 4.9% Virginia 6.1% North Carolina 6.8% California 7.3% West Virginia 9.4%
Wyoming 4.9% Arizona 6.2% Maryland 6.8% Iowa 7.6% Delaware 10.4%
Georgia 5.2% Montana 6.4% Washington 6.8% New York 7.9% Vermont 11.9%
North Dakota 5.6% Ohio 6.4% Rhode Island 6.9% Indiana 8.0% Hawaii 12.1%
State Personal Tax Burden Average 1990 - 2020State Average State Average State Average State Average State Average
Alaska 1.6% Missouri 5.8% Kansas 6.6% Connecticut 7.0% New Mexico 7.9%
New Hampshire 3.0% Illinois 5.8% Pennsylvania 6.6% Rhode Island 7.2% Kentucky 8.4%
South Dakota 4.8% Maryland 6.1% Arizona 6.7% Iowa 7.2% Maine 8.4%
Colorado 4.8% Louisiana 6.1% South Carolina 6.7% North Carolina 7.3% Delaware 8.6%
Texas 4.9% New Jersey 6.2% Ohio 6.7% New York 7.3% Mississippi 8.6%
Wyoming 5.2% Nebraska 6.2% Montana 6.7% California 7.3% Minnesota 8.9%
Virginia 5.4% North Dakota 6.4% Massachusetts 6.8% Washington 7.4% Arkansas 9.1%
Florida 5.5% Oregon 6.4% Nevada 6.9% Michigan 7.5% West Virginia 9.3%
Tennessee 5.5% Oklahoma 6.5% Utah 6.9% Idaho 7.5% Vermont 10.0%
Georgia 5.8% Alabama 6.5% Indiana 6.9% Wisconsin 7.7% Hawaii 10.6%
Source: US Census Bureau, Bureau of Economic Analysis, FCM; Dec 31, 2021
Tax Burden: Total state tax revenue excluding corporate income and severence taxes divided by total state personal income excludingfederal transfer receipts.
14
Fidelity Capital Markets
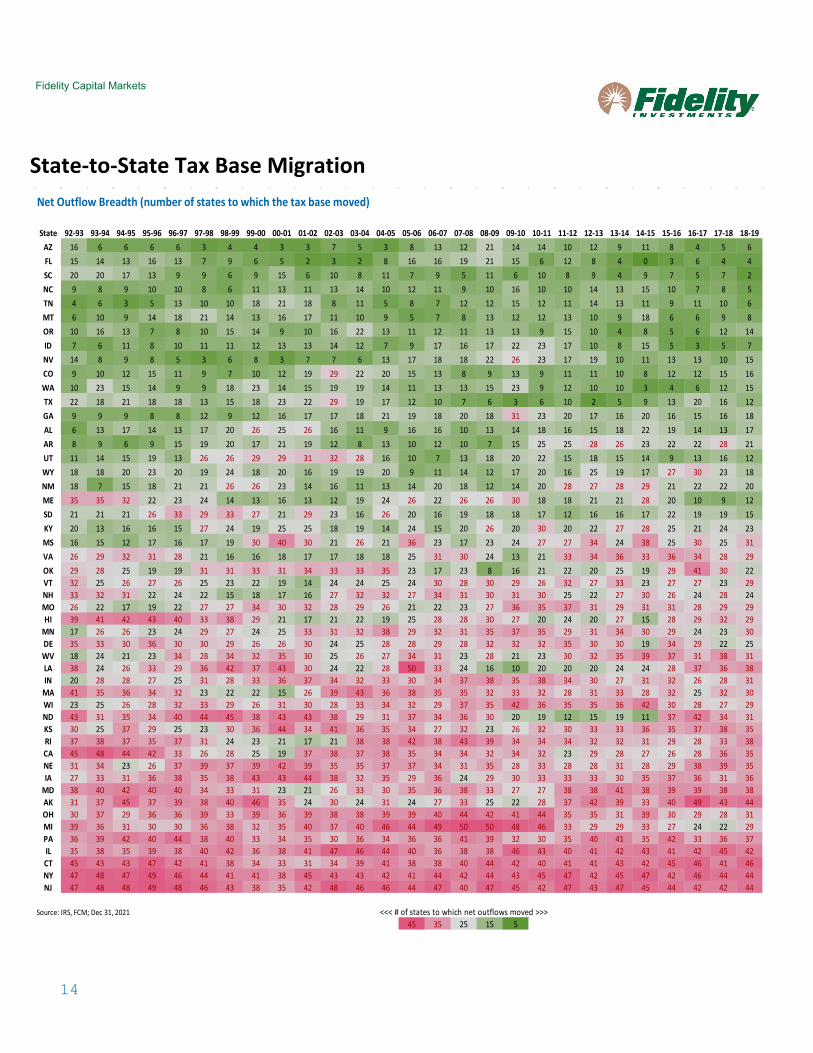
State-to-State Tax Base Migration Net Outflow Breadth (number of states to which the tax base moved)
1 2 3 4 5 6 7 8 9 10 11 12 13 14 15 16 17 18 19 20 21 22 23 24 25 26 27State 92-93 93-94 94-95 95-96 96-97 97-98 98-99 99-00 00-01 01-02 02-03 03-04 04-05 05-06 06-07 07-08 08-09 09-10 10-11 11-12 12-13 13-14 14-15 15-16 16-17 17-18 18-19
AZ 16 6 6 6 6 3 4 4 3 3 7 5 3 8 13 12 21 14 14 10 12 9 11 8 4 5 6FL 15 14 13 16 13 7 9 6 5 2 3 2 8 16 16 19 21 15 6 12 8 4 0 3 6 4 4SC 20 20 17 13 9 9 6 9 15 6 10 8 11 7 9 5 11 6 10 8 9 4 9 7 5 7 2NC 9 8 9 10 10 8 6 11 13 11 13 14 10 12 11 9 10 16 10 10 14 13 15 10 7 8 5TN 4 6 3 5 13 10 10 18 21 18 8 11 5 8 7 12 12 15 12 11 14 13 11 9 11 10 6MT 6 10 9 14 18 21 14 13 16 17 11 10 9 5 7 8 13 12 12 13 10 9 18 6 6 9 8OR 10 16 13 7 8 10 15 14 9 10 16 22 13 11 12 11 13 13 9 15 10 4 8 5 6 12 14ID 7 6 11 8 10 11 11 12 13 13 14 12 7 9 17 16 17 22 23 17 10 8 15 5 3 5 7NV 14 8 9 8 5 3 6 8 3 7 7 6 13 17 18 18 22 26 23 17 19 10 11 13 13 10 15CO 9 10 12 15 11 9 7 10 12 19 29 22 20 15 13 8 9 13 9 11 11 10 8 12 12 15 16WA 10 23 15 14 9 9 18 23 14 15 19 19 14 11 13 13 15 23 9 12 10 10 3 4 6 12 15TX 22 18 21 18 18 13 15 18 23 22 29 19 17 12 10 7 6 3 6 10 2 5 9 13 20 16 12GA 9 9 9 8 8 12 9 12 16 17 17 18 21 19 18 20 18 31 23 20 17 16 20 16 15 16 18AL 6 13 17 14 13 17 20 26 25 26 16 11 9 16 16 10 13 14 18 16 15 18 22 19 14 13 17AR 8 9 6 9 15 19 20 17 21 19 12 8 13 10 12 10 7 15 25 25 28 26 23 22 22 28 21UT 11 14 15 19 13 26 26 29 29 31 32 28 16 10 7 13 18 20 22 15 18 15 14 9 13 16 12WY 18 18 20 23 20 19 24 18 20 16 19 19 20 9 11 14 12 17 20 16 25 19 17 27 30 23 18NM 18 7 15 18 21 21 26 26 23 14 16 11 13 14 20 18 12 14 20 28 27 28 29 21 22 22 20ME 35 35 32 22 23 24 14 13 16 13 12 19 24 26 22 26 26 30 18 18 21 21 28 20 10 9 12SD 21 21 21 26 33 29 33 27 21 29 23 16 26 20 16 19 18 18 17 12 16 16 17 22 19 19 15KY 20 13 16 16 15 27 24 19 25 25 18 19 14 24 15 20 26 20 30 20 22 27 28 25 21 24 23MS 16 15 12 17 16 17 19 30 40 30 21 26 21 36 23 17 23 24 27 27 34 24 38 25 30 25 31VA 26 29 32 31 28 21 16 16 18 17 17 18 18 25 31 30 24 13 21 33 34 36 33 36 34 28 29OK 29 28 25 19 19 31 31 33 31 34 33 33 35 23 17 23 8 16 21 22 20 25 19 29 41 30 22VT 32 25 26 27 26 25 23 22 19 14 24 24 25 24 30 28 30 29 26 32 27 33 23 27 27 23 29NH 33 32 31 22 24 22 15 18 17 16 27 32 32 27 34 31 30 31 30 25 22 27 30 26 24 28 24MO 26 22 17 19 22 27 27 34 30 32 28 29 26 21 22 23 27 36 35 37 31 29 31 31 28 29 29HI 39 41 42 43 40 33 38 29 21 17 21 22 19 25 28 28 30 27 20 24 20 27 15 28 29 32 29
MN 17 26 26 23 24 29 27 24 25 33 31 32 38 29 32 31 35 37 35 29 31 34 30 29 24 23 30DE 35 33 30 36 30 30 29 26 26 30 24 25 28 28 29 28 32 32 32 35 30 30 19 34 29 22 25WV 18 24 21 23 34 28 34 32 35 30 25 26 27 34 31 23 28 21 23 30 32 35 39 37 31 38 31LA 38 24 26 33 29 36 42 37 43 30 24 22 28 50 33 24 16 10 20 20 20 24 24 28 37 36 38IN 20 28 28 27 25 31 28 33 36 37 34 32 33 30 34 37 38 35 38 34 30 27 31 32 26 28 31
MA 41 35 36 34 32 23 22 22 15 26 39 43 36 38 35 35 32 33 32 28 31 33 28 32 25 32 30WI 23 25 26 28 32 33 29 26 31 30 28 33 34 32 29 37 35 42 36 35 35 36 42 30 28 27 29ND 43 31 35 34 40 44 45 38 43 43 38 29 31 37 34 36 30 20 19 12 15 19 11 37 42 34 31KS 30 25 37 29 25 23 30 36 44 34 41 36 35 34 27 32 23 26 32 30 33 33 36 35 37 38 35RI 37 38 37 35 37 31 24 23 21 17 21 38 38 42 38 43 39 34 34 34 32 32 31 29 28 33 38CA 45 48 44 42 33 26 28 25 19 37 38 37 38 35 34 34 32 34 32 23 29 28 27 26 28 36 35NE 31 34 23 26 37 39 37 39 42 39 35 35 37 37 34 31 35 28 33 28 28 31 28 29 38 39 35IA 27 33 31 36 38 35 38 43 43 44 38 32 35 29 36 24 29 30 33 33 33 30 35 37 36 31 36
MD 38 40 42 40 40 34 33 31 23 21 26 33 30 35 36 38 33 27 27 38 38 41 38 39 39 38 38AK 31 37 45 37 39 38 40 46 35 24 30 24 31 24 27 33 25 22 28 37 42 39 33 40 49 43 44OH 30 37 29 36 36 39 33 39 36 39 38 38 39 39 40 44 42 41 44 35 35 31 39 30 29 28 31MI 39 36 31 30 30 36 38 32 35 40 37 40 46 44 49 50 50 48 46 33 29 29 33 27 24 22 29PA 36 39 42 40 44 38 40 33 34 35 30 36 34 36 36 41 39 32 30 35 40 41 35 42 33 36 37IL 35 38 35 39 38 40 42 36 38 41 47 46 44 40 36 38 38 46 43 40 41 42 43 41 42 45 42CT 45 43 43 47 42 41 38 34 33 31 34 39 41 38 38 40 44 42 40 41 41 43 42 45 46 41 46NY 47 48 47 49 46 44 41 41 38 45 43 43 42 41 44 42 44 43 45 47 42 45 47 42 46 44 44NJ 47 48 48 49 48 46 43 38 35 42 48 46 46 44 47 40 47 45 42 47 43 47 45 44 42 42 44
Source: IRS, FCM; Dec 31, 2021 <<< # of states to which net outflows moved >>>45 35 25 15 5
15
Fidelity Capital Markets
State-to-State Tax Base Migration (cont.)
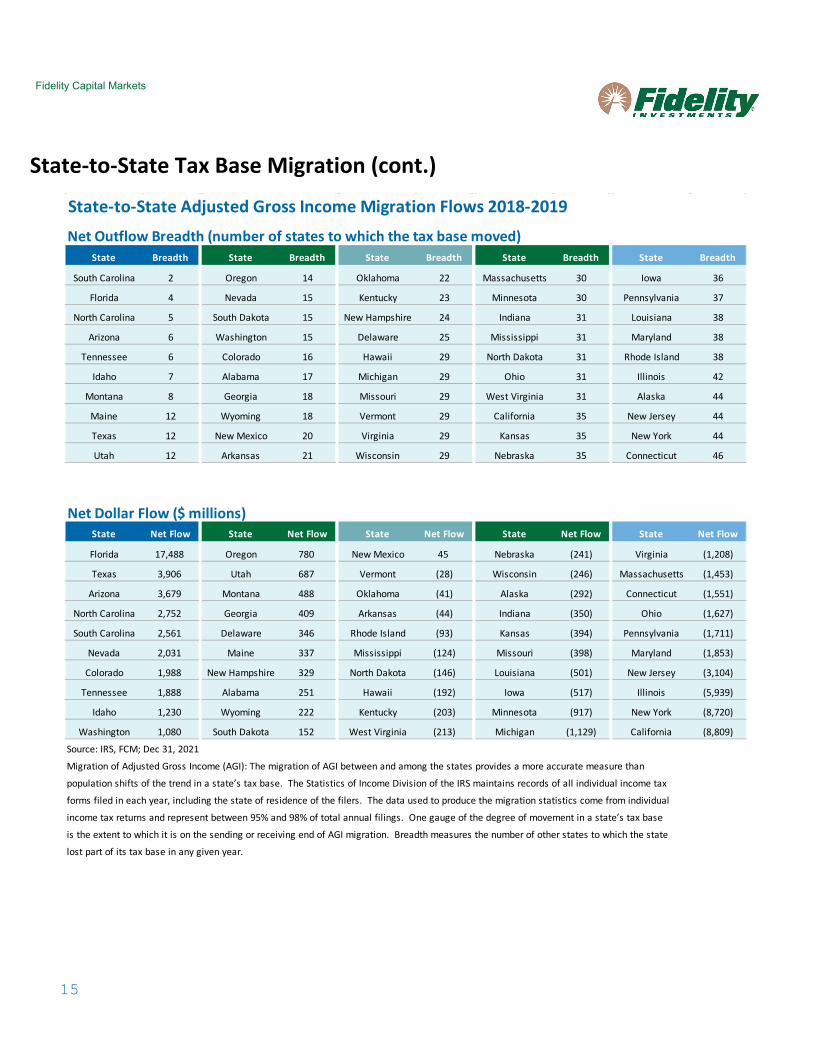
State-to-State Adjusted Gross Income Migration Flows 2018-2019Net Outflow Breadth (number of states to which the tax base moved)
State Breadth State Breadth State Breadth State Breadth State Breadth
South Carolina 2 Oregon 14 Oklahoma 22 Massachusetts 30 Iowa 36
Florida 4 Nevada 15 Kentucky 23 Minnesota 30 Pennsylvania 37
North Carolina 5 South Dakota 15 New Hampshire 24 Indiana 31 Louisiana 38
Arizona 6 Washington 15 Delaware 25 Mississippi 31 Maryland 38
Tennessee 6 Colorado 16 Hawaii 29 North Dakota 31 Rhode Island 38
Idaho 7 Alabama 17 Michigan 29 Ohio 31 Illinois 42
Montana 8 Georgia 18 Missouri 29 West Virginia 31 Alaska 44
Maine 12 Wyoming 18 Vermont 29 California 35 New Jersey 44
Texas 12 New Mexico 20 Virginia 29 Kansas 35 New York 44
Utah 12 Arkansas 21 Wisconsin 29 Nebraska 35 Connecticut 46
Net Dollar Flow ($ millions)State Net Flow State Net Flow State Net Flow State Net Flow State Net Flow
Florida 17,488 Oregon 780 New Mexico 45 Nebraska (241) Virginia (1,208)
Texas 3,906 Utah 687 Vermont (28) Wisconsin (246) Massachusetts (1,453)
Arizona 3,679 Montana 488 Oklahoma (41) Alaska (292) Connecticut (1,551)
North Carolina 2,752 Georgia 409 Arkansas (44) Indiana (350) Ohio (1,627)
South Carolina 2,561 Delaware 346 Rhode Island (93) Kansas (394) Pennsylvania (1,711)
Nevada 2,031 Maine 337 Mississippi (124) Missouri (398) Maryland (1,853)
Colorado 1,988 New Hampshire 329 North Dakota (146) Louisiana (501) New Jersey (3,104)
Tennessee 1,888 Alabama 251 Hawaii (192) Iowa (517) Illinois (5,939)
Idaho 1,230 Wyoming 222 Kentucky (203) Minnesota (917) New York (8,720)
Washington 1,080 South Dakota 152 West Virginia (213) Michigan (1,129) California (8,809)
Source: IRS, FCM; Dec 31, 2021
Migration of Adjusted Gross Income (AGI): The migration of AGI between and among the states provides a more accurate measure than
population shifts of the trend in a state’s tax base. The Statistics of Income Division of the IRS maintains records of all individual income tax
forms filed in each year, including the state of residence of the filers. The data used to produce the migration statistics come from individual
income tax returns and represent between 95% and 98% of total annual filings. One gauge of the degree of movement in a state’s tax base
is the extent to which it is on the sending or receiving end of AGI migration. Breadth measures the number of other states to which the state
lost part of its tax base in any given year.
16
Fidelity Capital Markets
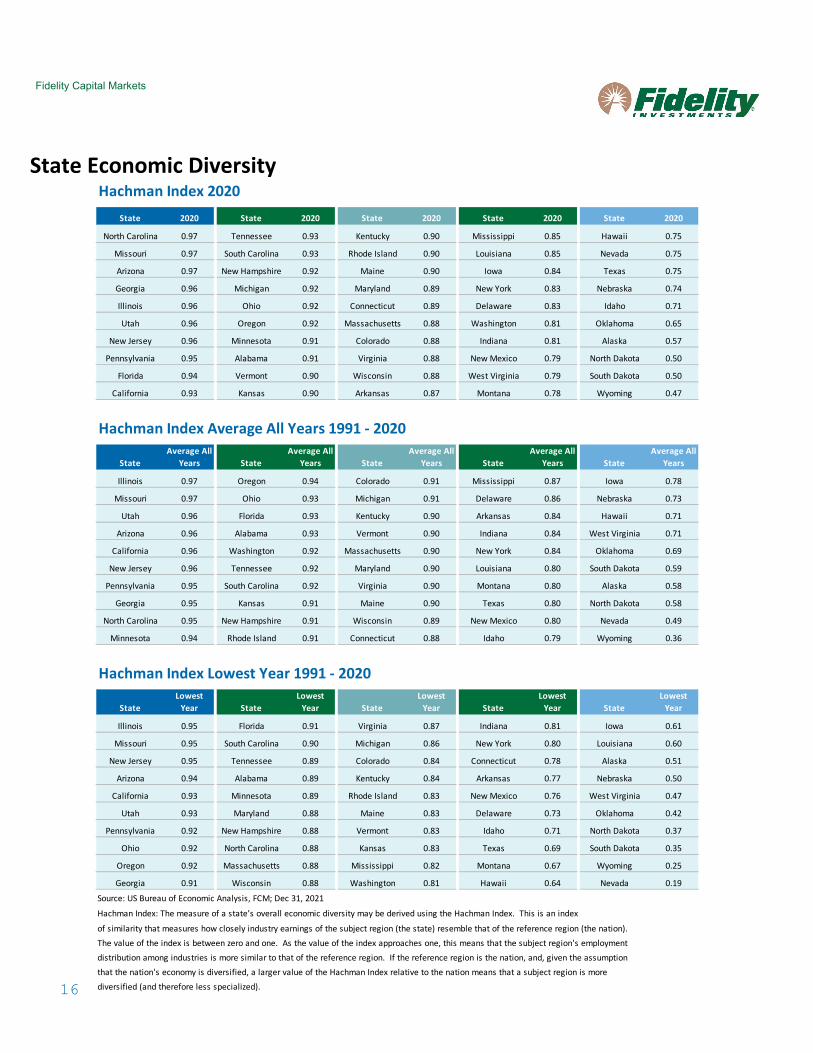
State Economic Diversity Hachman Index 2020
State 2020 State 2020 State 2020 State 2020 State 2020
North Carolina 0.97 Tennessee 0.93 Kentucky 0.90 Mississippi 0.85 Hawaii 0.75
Missouri 0.97 South Carolina 0.93 Rhode Island 0.90 Louisiana 0.85 Nevada 0.75
Arizona 0.97 New Hampshire 0.92 Maine 0.90 Iowa 0.84 Texas 0.75
Georgia 0.96 Michigan 0.92 Maryland 0.89 New York 0.83 Nebraska 0.74
Illinois 0.96 Ohio 0.92 Connecticut 0.89 Delaware 0.83 Idaho 0.71
Utah 0.96 Oregon 0.92 Massachusetts 0.88 Washington 0.81 Oklahoma 0.65
New Jersey 0.96 Minnesota 0.91 Colorado 0.88 Indiana 0.81 Alaska 0.57
Pennsylvania 0.95 Alabama 0.91 Virginia 0.88 New Mexico 0.79 North Dakota 0.50
Florida 0.94 Vermont 0.90 Wisconsin 0.88 West Virginia 0.79 South Dakota 0.50
California 0.93 Kansas 0.90 Arkansas 0.87 Montana 0.78 Wyoming 0.47
Hachman Index Average All Years 1991 - 2020
StateAverage All
Years StateAverage All
Years StateAverage All
Years StateAverage All
Years StateAverage All
Years
Illinois 0.97 Oregon 0.94 Colorado 0.91 Mississippi 0.87 Iowa 0.78
Missouri 0.97 Ohio 0.93 Michigan 0.91 Delaware 0.86 Nebraska 0.73
Utah 0.96 Florida 0.93 Kentucky 0.90 Arkansas 0.84 Hawaii 0.71
Arizona 0.96 Alabama 0.93 Vermont 0.90 Indiana 0.84 West Virginia 0.71
California 0.96 Washington 0.92 Massachusetts 0.90 New York 0.84 Oklahoma 0.69
New Jersey 0.96 Tennessee 0.92 Maryland 0.90 Louisiana 0.80 South Dakota 0.59
Pennsylvania 0.95 South Carolina 0.92 Virginia 0.90 Montana 0.80 Alaska 0.58
Georgia 0.95 Kansas 0.91 Maine 0.90 Texas 0.80 North Dakota 0.58
North Carolina 0.95 New Hampshire 0.91 Wisconsin 0.89 New Mexico 0.80 Nevada 0.49
Minnesota 0.94 Rhode Island 0.91 Connecticut 0.88 Idaho 0.79 Wyoming 0.36
Hachman Index Lowest Year 1991 - 2020
StateLowest
Year StateLowest
Year StateLowest
Year StateLowest
Year StateLowest
Year
Illinois 0.95 Florida 0.91 Virginia 0.87 Indiana 0.81 Iowa 0.61
Missouri 0.95 South Carolina 0.90 Michigan 0.86 New York 0.80 Louisiana 0.60
New Jersey 0.95 Tennessee 0.89 Colorado 0.84 Connecticut 0.78 Alaska 0.51
Arizona 0.94 Alabama 0.89 Kentucky 0.84 Arkansas 0.77 Nebraska 0.50
California 0.93 Minnesota 0.89 Rhode Island 0.83 New Mexico 0.76 West Virginia 0.47
Utah 0.93 Maryland 0.88 Maine 0.83 Delaware 0.73 Oklahoma 0.42
Pennsylvania 0.92 New Hampshire 0.88 Vermont 0.83 Idaho 0.71 North Dakota 0.37
Ohio 0.92 North Carolina 0.88 Kansas 0.83 Texas 0.69 South Dakota 0.35
Oregon 0.92 Massachusetts 0.88 Mississippi 0.82 Montana 0.67 Wyoming 0.25
Georgia 0.91 Wisconsin 0.88 Washington 0.81 Hawaii 0.64 Nevada 0.19
Source: US Bureau of Economic Analysis, FCM; Dec 31, 2021
Hachman Index: The measure of a state’s overall economic diversity may be derived using the Hachman Index. This is an index
of similarity that measures how closely industry earnings of the subject region (the state) resemble that of the reference region (the nation).The value of the index is between zero and one. As the value of the index approaches one, this means that the subject region's employmentdistribution among industries is more similar to that of the reference region. If the reference region is the nation, and, given the assumptionthat the nation's economy is diversified, a larger value of the Hachman Index relative to the nation means that a subject region is morediversified (and therefore less specialized).
17
Fidelity Capital Markets
U.S. Individual Income Tax Highest Tax Bracket
0.0
0.1
1.0
10.0
100.0
0
10
20
30
40
50
60
70
80
90
100
'13 '31 '49 '67 '85 '03 '21
Inco
me
Brac
ket $
mm
(log
scal
e)
Tax
Rate
%
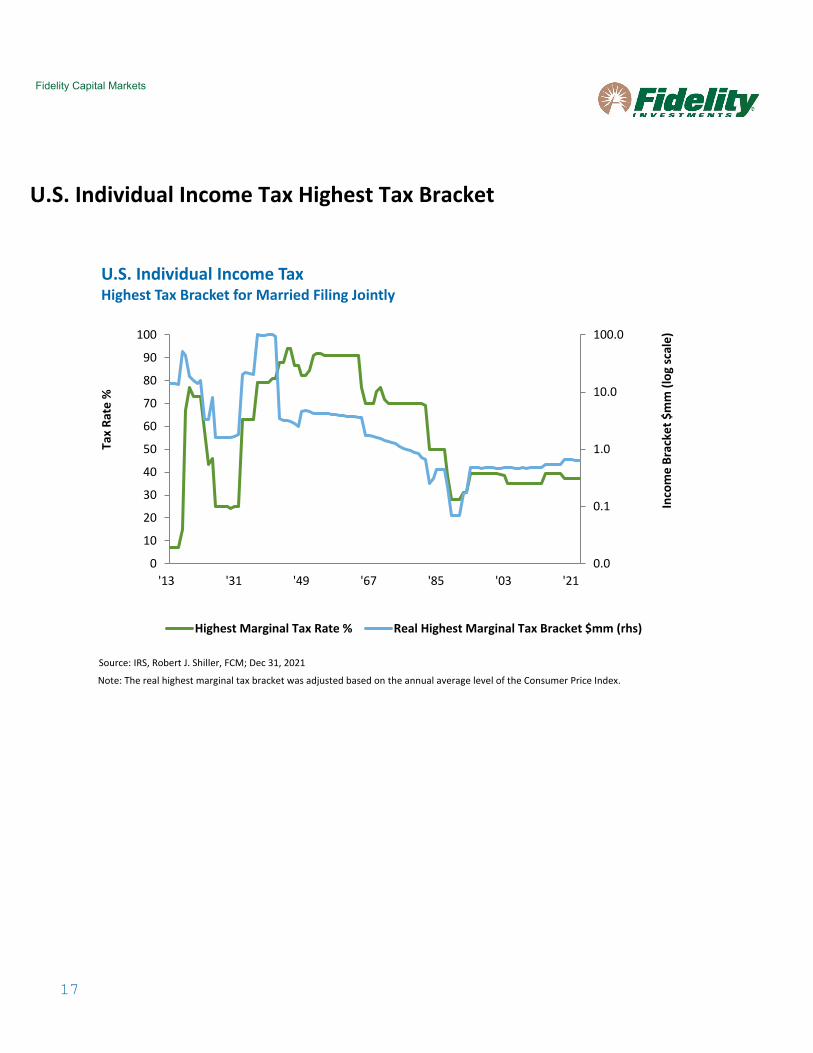
U.S. Individual Income TaxHighest Tax Bracket for Married Filing Jointly
Highest Marginal Tax Rate % Real Highest Marginal Tax Bracket $mm (rhs)
Source: IRS, Robert J. Shiller, FCM; Dec 31, 2021
Note: The real highest marginal tax bracket was adjusted based on the annual average level of the Consumer Price Index.
18
Fidelity Capital Markets
Index Definitions
ICE Data Indices
ICE BofA US Municipal Securities Index tracks the performance of US dollar denominated investment grade tax-exempt debt publicly issued by US states and territories, and their political subdivisions, in the US domestic market. Qualifying securities must have at least one year remaining term to final maturity, at least 18 months to final maturity at the time of issuance, a fixed coupon schedule and an investment grade rating (based on an average of Moody’s, S&P and Fitch). Minimum size requirements vary based on the initial term to final maturity at time of issuance. Securities with an initial term to final maturity greater than or equal to one year and less than five years must have a current amount outstanding of at least $10 million. Securities with an initial term to final maturity greater than or equal to five years and less than ten years must have a current amount outstanding of at least $15 million. Securities with an initial term to final maturity of ten years or more must have a current amount outstanding of at least $25 million. The call date on which a pre-refunded bond will be redeemed is used for purposes of determining qualification with respect to final maturity requirements. Mandatory put or mandatory tender securities and original issue zero coupon bonds are included in the Index. Limited offering securities only qualify for inclusion in the U.S. municipal indices after their first settlement date are also included in the index. All secondarily insured securities, taxable municipal securities, 144a securities, securities in legal default and securities issued under the Municipal Liquidity Facility or a municipal commercial paper program are excluded from the Index. Index constituents are market capitalization weighted. Accrued interest is calculated assuming next-day settlement. Cash flows from bond payments that are received during the month are retained in the index until the end of the month and then are removed as part of the rebalancing. Cash does not earn any reinvestment income while it is held in the index. Information concerning constituent bond prices, timing and conventions and index governance and administration is provided in the ICE BofA Bond Index Methodologies, which can be accessed on our public website (https://indices.theice.com), or by sending a request to [email protected]. The index is rebalanced on the last calendar day of the month, based on information available up to and including the third business day before the last business day of the month. New issues must settle on or before the following calendar month end in order to qualify for the coming month. No changes are made to constituent holdings other than on month end rebalancing dates. Inception date: December 31, 1988.
ICE BofA US Corporate Index: ICE BofA US Corporate Index tracks the performance of US dollar denominated investment grade corporate debt publicly issued in the US domestic market. Qualifying securities must have an investment grade rating (based on an average of Moody’s, S&P and Fitch), at least 18 months to final maturity at the time of issuance, at least one year remaining term to final maturity as of the rebalancing date, a fixed coupon schedule and a minimum amount outstanding of $250 million. Original issue zero coupon bonds, 144a securities (with and without registration rights), and pay-in-kind securities (including toggle notes) are included in the index. Callable perpetual securities are included provided they are at least one year from the first call date. Fixed-to-floating rate securities are included provided they are callable within the fixed rate period and are at least one year from the last call prior to the date the bond transitions from a fixed to a floating rate security. Contingent capital securities (“cocos”) are excluded, but capital securities where conversion can be mandated by a regulatory authority, but which have no specified trigger, are included. Other hybrid capital securities, such as those issues that potentially convert into preference shares, those with both cumulative and non-cumulative coupon deferral provisions, and those with alternative coupon satisfaction mechanisms, are also included in the index. Equity-linked securities, securities in legal default, hybrid securitized corporates, eurodollar bonds (USD securities not issued in the US domestic market), taxable and tax-exempt US municipal securities and $1000 par preferred and DRD-eligible securities are excluded from the index. Index constituents are market capitalization weighted. Accrued interest is calculated assuming next-day settlement. Cash flows from bond payments that are received during the month are retained in the index until the end of the month and then are removed as part of the rebalancing. Cash does not earn any reinvestment income while it is held in the index. Information concerning constituent bond prices, timing and conventions and index governance and administration is provided in the ICE BofA Bond Index Methodologies, which can be accessed on our public website (https://indices.theice.com), or by sending a request to [email protected]. The index is rebalanced on the last calendar day of the month, based on information available up to and including the third business day before the last business day of the month. New issues must settle on or before the following calendar month end in order to qualify for the coming month. No changes are made to constituent holdings other than on month end rebalancing dates. Inception date: December 31, 1972.
ICE BofA Global Corporate Index: ICE BofA Global Corporate Index tracks the performance of investment grade corporate debt publicly issued in the major domestic and eurobond markets. Qualifying securities must have an investment grade rating (based on an average of Moody’s, S&P and Fitch), at least 18 months to final maturity at the time of issuance, at least one year remaining term to final maturity as of the rebalancing date and a fixed coupon schedule. Qualifying currencies and their respective minimum size requirements (in local currency terms) are: AUD 100 million; CAD 100 million; CHK 100 million; DKK 1 billion; EUR 250 million; JPY 20 billion; GBP 100 million; and USD 250 million. Original issue zero coupon bonds and pay-in-kind securities, including toggle notes, also qualify for inclusion. Callable perpetual securities qualify provided they are at least one year from the first call date. Fixed-to-floating rate securities also qualify provided they are callable within the fixed rate period and are at least one year from the last call prior to the date the bond transitions from a fixed to a floating rate security. Contingent capital securities (“cocos”) are excluded, but capital securities where conversion can be mandated by a regulatory authority, but which have no specified trigger, are included.
19
Fidelity Capital Markets
Other hybrid capital securities, such as those issues that potentially convert into preference shares, those with both cumulative and non-cumulative coupon deferral provisions, and those with alternative coupon satisfaction mechanisms, are also included in the index. Equity-linked securities, securities in legal default, hybrid securitized corporates, taxable and tax-exempt US municipal securities and $1000 par preferred and DRD-eligible securities are excluded from the index. Index constituents are market capitalization weighted. Accrued interest is calculated assuming next-day settlement. Cash flows from bond payments that are received during the month are retained in the index until the end of the month and then are removed as part of the rebalancing. Cash does not earn any reinvestment income while it is held in the index. Information concerning constituent bond prices, timing and conventions and index governance and administration is provided in the ICE BofA Bond Index Methodologies, which can be accessed on our public website (https://indices.theice.com), or by sending a request to [email protected]. The index is rebalanced on the last calendar day of the month, based on information available up to and including the third business day before the last business day of the month. New issues must settle on or before the following calendar month end in order to qualify for the coming month. No changes are made to constituent holdings other than on month end rebalancing dates. Inception date: December 31, 1996.
ICE BofA US High Yield Index: ICE BofA US High Yield Index tracks the performance of US dollar denominated below investment grade corporate debt publicly issued in the US domestic market. Qualifying securities must have a below investment grade rating (based on an average of Moody’s, S&P and Fitch), at least 18 months to final maturity at the time of issuance, at least one year remaining term to final maturity as of the rebalancing date, a fixed coupon schedule and a minimum amount outstanding of $250 million. In addition, qualifying securities must have risk exposure to countries that are members of the FX-G10, Western Europe or territories of the US and Western Europe. The FX-G10 includes all Euro members, the US, Japan, the UK, Canada, Australia, New Zealand, Switzerland, Norway and Sweden. Original issue zero coupon bonds, 144a securities (both with and without registration rights), and pay-in-kind securities (including toggle notes) are included in the index. Callable perpetual securities are included provided they are at least one year from the first call date. Fixed-to-floating rate securities are included provided they are callable within the fixed rate period and are at least one year from the last call prior to the date the bond transitions from a fixed to a floating rate security. Contingent capital securities (“cocos”) are excluded, but capital securities where conversion can be mandated by a regulatory authority, but which have no specified trigger, are included. Other hybrid capital securities, such as those issues that potentially convert into preference shares, those with both cumulative and non-cumulative coupon deferral provisions, and those with alternative coupon satisfaction mechanisms, are also included in the index. Securities issued or marketed primarily to retail investors, equity-linked securities, securities in legal default, hybrid securitized corporates, eurodollar bonds (USD securities not issued in the US domestic market), taxable and tax-exempt US municipal securities and $1000 par preferred and DRD-eligible securities are excluded from the index. Index constituents are market capitalization weighted. Accrued interest is calculated assuming next-day settlement. Cash flows from bond payments that are received during the month are retained in the index until the end of the month and then are removed as part of the rebalancing. Cash does not earn any reinvestment income while it is held in the index. Information concerning constituent bond prices, timing and conventions and index governance and administration is provided in the ICE BofA Bond Index Methodologies, which can be accessed on our public website (https://indices.theice.com), or by sending a request to [email protected]. The index is rebalanced on the last calendar day of the month, based on information available up to and including the third business day before the last business day of the month. New issues must settle on or before the following calendar month end in order to qualify for the coming month. No changes are made to constituent holdings other than on month end rebalancing dates. Inception date: August 31, 1986.
ICE BofA Fixed Rate Preferred Securities Index: ICE BofA Fixed Rate Preferred Securities Index tracks the performance of fixed rate US dollar denominated preferred securities issued in the US domestic market. Qualifying securities must have an investment grade rating (based on an average of Moody’s, S&P and Fitch) and must have an investment grade rated country of risk (based on an average of Moody’s, S&P and Fitch foreign currency long term sovereign debt ratings). In addition, qualifying securities must be issued as public securities or through a 144a filing, must be issued in $25, $50, or $100 par/liquidation preference increments, must have a fixed coupon or dividend schedule and must have a minimum amount outstanding of $100 million. $1,000 par preferred securities and $1,000 par DRD eligible debt securities qualify for inclusion in the Index, provided their amount outstanding is at least $250 million. Fixed-to-floating rate securities also qualify provided they are callable within the fixed rate period and are at least one year from the last call prior to the date the bond transitions from a fixed to a floating rate security. The Index includes preference shares (perpetual preferred securities), American Depository Shares/Receipts (ADS/R), domestic and Yankee trust preferred securities having a minimum remaining term of at least one year, both DRD-eligible and non-DRD eligible preferred stock and senior and subordinated debt issued in $25, $50 or $100 par/liquidation increments. Auction market securities, convertibles, floaters, purchase units, purchase contracts, corporate pay-in-kind securities, securities issued by closed-end funds and derivative instruments such as repackaged securities and credit default swaps are excluded from the Index. Index constituents are market capitalization weighted. Accrued interest is calculated assuming next-day settlement. Cash flows from bond payments that are received during the month are retained in the index until the end of the month and then are removed as part of the rebalancing. Cash does not earn any reinvestment income while it is held in the index. Information concerning constituent bond prices, timing and conventions and index governance and administration is provided in the ICE BofA Bond Index Methodologies, which can be accessed on our public website (https://indices.theice.com), or by sending a request to [email protected]. The index is rebalanced on the last calendar day of the month, based on information available up to and including the third business day before the last business day of the month. New issues must settle on or before the following calendar month end in order to qualify for the coming month. No changes are made to constituent holdings other than on month end rebalancing dates. Inception date: February 28, 1989.
20
Fidelity Capital Markets
ICE BofA US Convertible Excluding Mandatory Index: ICE BofA US Convertible Excluding Mandatory Index tracks the performance of publicly issued US dollar denominated non-mandatory convertible securities of US companies. Qualifying securities must have at least $50 million face amount outstanding and at least one month remaining to the final conversion date. In order to qualify for inclusion in the index securities must pay at a fixed rate, which includes those with zero, step-up and rating-sensitive coupons. The underlying equity of qualifying securities must be exchange listed and actively trading, and have a US country of issue and a US country of risk. Convertible securities where the underlying is a basket of equities qualify for inclusion in the index, as do convertible preferred securities. Securities with mandatory conversion features and those in legal default are excluded from the index, as are synthetic and reverse convertibles, floating rate securities and securities with suspended or inactive underlying equities. Index constituents are market capitalization-weighted. Accrued interest is calculated assuming next-day settlement. Cash flows from bond payments that are received during the month are retained in the index until the end of the month and then are removed as part of the rebalancing. Cash does not earn any reinvestment income while it is held in the index. Information concerning constituent bond prices, timing and conventions and index governance and administration is provided in the ICE BofA Bond Index Methodologies, which can be accessed on our public website (https://indices.theice.com), or by sending a request to [email protected]. The index is rebalanced on the last calendar day of the month, based on information available up to and including the third business day before the last business day of the month. New issues must settle on or before the following calendar month end in order to qualify for the coming month. No changes are made to constituent holdings other than on month end rebalancing dates. Inception date: December 31, 1987.
ICE BofA US ABS & CMBS Index: ICE BofA US ABS & CMBS Index tracks the performance of US dollar denominated investment grade fixed and floating rate asset backed securities and fixed rate commercial mortgage backed securities publicly issued in the US domestic market. Qualifying securities must have an investment grade rating (based on an average of Moody’s, S&P and Fitch), at least one year remaining term to final stated maturity and at least one month to the last expected cash flow. 144a securities qualify for inclusion in the Index. Callable perpetual securities qualify provided they are at least one year from the first call date. Inverse floating rate, interest only and principal only tranches of qualifying deals are excluded from the Index as are all tranches of re-securitized deals. Qualifying asset backed securities must a fixed or floating rate coupon, an original deal size for the collateral group of at least $250 million, a current outstanding deal size for the collateral group greater than or equal to 10% of the original deal size and a minimum outstanding tranche size of $50 million for senior tranches and $10 million for mezzanine and subordinated tranches. Qualifying commercial mortgage backed securities must have a fixed coupon schedule, an original deal size for the collateral group of at least $250 million, a current outstanding deal size for the collateral group that is greater than or equal to 10% of the original deal size and at least $50 million current amount outstanding for senior tranches and $10 million current amount outstanding for mezzanine and subordinated tranches. U.S. agency securities qualify for inclusion. Fixed-to-floating rate securities qualify provided they are callable within the fixed rate period and are at least one year from the last call prior to the date the bond transitions from a fixed to a floating rate security. Floating rate securities are excluded. Index constituents are market capitalization weighted. Accrued interest is calculated assuming same-day settlement. Cash flows from bond payments that are received during the month are retained in the index until the end of the month and then are removed as part of the rebalancing. Cash does not earn any reinvestment income while it is held in the index. Information concerning constituent bond prices, timing and conventions and index governance and administration is provided in the ICE BofA Bond Index Methodologies, which can be accessed on our public website (https://indices.theice.com), or by sending a request to [email protected]. The index is rebalanced on the last calendar day of the month, based on information available up to and including the third business day before the last business day of the month. New issues must settle on or before the following calendar month end in order to qualify for the coming month. No changes are made to constituent holdings other than on month end rebalancing dates. Inception date: December 31, 1997.
ICE BofA US Mortgage Backed Securities Index: ICE BofA US Mortgage Backed Securities Index tracks the performance of US dollar denominated fixed rate residential mortgage pass-through securities publicly issued by US agencies in the US domestic market. 30-year, 20-year and 15-year fixed rate mortgage pools are included in the Index provided they have at least one year remaining term to final maturity and a minimum amount outstanding of at least $5 billion per generic coupon and $250 million per production year within each generic coupon. Hybrid, interest-only, balloon, mobile home, graduated payment and quarter coupon fixed rate mortgages are excluded from the index, as are all collateralized mortgage obligations. Index constituents are market capitalization weighted. Accrued interest is calculated assuming same-day settlement. Cash flows from bond payments that are received during the month are retained in the index until the end of the month and then are removed as part of the rebalancing. Cash does not earn any reinvestment income while it is held in the index. Information concerning constituent bond prices, timing and conventions and index governance and administration is provided in the ICE BofA Bond Index Methodologies, which can be accessed on our public website (https://indices.theice.com), or by sending a request to [email protected]. The index is rebalanced on the last calendar day of the month, based on information available up to and including the third business day before the last business day of the month. New issues must settle on or before the following calendar month end in order to qualify for the coming month. No changes are made to constituent holdings other than on month end rebalancing dates. Inception date: December 31, 1975.
ICE BofA US Treasury Index: ICE BofA US Treasury Index tracks the performance of US dollar denominated sovereign debt publicly issued by the US government in its domestic market. Qualifying securities must have at least one year remaining term to final maturity, a fixed coupon schedule and a minimum amount outstanding of $1 billion. Qualifying securities must have at least 18 months to final maturity at the time of issuance. Callable perpetual securities qualify provided they are at least one year from the first call date. Fixed-to-floating rate securities also qualify provided they are callable within the fixed rate period and are at least one
21
Fidelity Capital Markets
year from the last call prior to the date the bond transitions from a fixed to a floating rate security. Bills, inflation-linked debt and strips are excluded from the Index; however, original issue zero coupon bonds are included in the index and the amounts outstanding of qualifying coupon securities are not reduced by any portions that have been stripped. Securities issued or marketed primarily to retail investors do not qualify for inclusion in the index. Index constituents are market capitalization weighted. Accrued interest is calculated assuming next-day settlement. Cash flows from bond payments that are received during the month are retained in the index until the end of the month and then are removed as part of the rebalancing. Cash does not earn any reinvestment income while it is held in the index. Information concerning constituent bond prices, timing and conventions and index governance and administration is provided in the ICE BofA Bond Index Methodologies, which can be accessed on our public website (https://indices.theice.com), or by sending a request to [email protected]. The index is rebalanced on the last calendar day of the month, based on information available up to and including the third business day before the last business day of the month. New issues must settle on or before the following calendar month end in order to qualify for the coming month. No changes are made to constituent holdings other than on month end rebalancing dates. Inception date: December 31, 1977.
ICE BofA US Inflation-Linked Treasury Index: ICE BofA US Inflation-Linked Treasury Index tracks the performance of US dollar denominated inflation-linked sovereign debt publicly issued by the US government in its domestic market. Qualifying securities must have at least 18 months to maturity at point of issuance, at least one year remaining term to final maturity, interest and principal payments tied to inflation and a minimum amount outstanding of $1 billion. Strips are excluded from the Index; however, original issue zero coupon bonds are included in the Index and the amounts outstanding of qualifying coupon securities are not reduced by any portions that have been stripped. Securities issued or marketed primarily to retail investors do not qualify for inclusion in the index. Index constituents are market capitalization weighted. Accrued interest is calculated assuming next-day settlement. Cash flows from bond payments that are received during the month are retained in the index until the end of the month and then are removed as part of the rebalancing. Cash does not earn any reinvestment income while it is held in the index. Information concerning constituent bond prices, timing and conventions and index governance and administration is provided in the ICE BofA Bond Index Methodologies, which can be accessed on our public website (https://indices.theice.com), or by sending a request to [email protected]. The index is rebalanced on the last calendar day of the month, based on information available up to and including the third business day before the last business day of the month. New issues must settle on or before the following calendar month end in order to qualify for the coming month. No changes are made to constituent holdings other than on month end rebalancing dates. Inception date: February 28, 1997.
ICE BofA US Agency Index: ICE BofA US Agency Index tracks the performance of US dollar denominated US agency senior debt issued in the US domestic market. Qualifying securities must have an investment grade rating (based on an average of Moody’s, S&P and Fitch). In addition, qualifying securities must be unsubordinated, must have at least one year remaining term to final maturity, at least 18 months to final maturity at point of issuance, a fixed coupon schedule and a minimum amount outstanding of $250 million. "Global" securities (debt issued simultaneously in the eurobond and US domestic markets) qualify for inclusion in the Index. Callable perpetual securities qualify provided they are at least one year from the first call date. Fixed-to-floating rate securities also qualify provided they are callable within the fixed rate period and are at least one year from the last call prior to the date the bond transitions from a fixed to a floating rate security. Securities is legal default are excluded from the Index. Index constituents are market capitalization weighted. Accrued interest is calculated assuming next-day settlement. Cash flows from bond payments that are received during the month are retained in the index until the end of the month and then are removed as part of the rebalancing. Cash does not earn any reinvestment income while it is held in the index. Information concerning constituent bond prices, timing and conventions and index governance and administration is provided in the ICE BofA Bond Index Methodologies, which can be accessed on our public website (https://indices.theice.com), or by sending a request to [email protected]. The index is rebalanced on the last calendar day of the month, based on information available up to and including the third business day before the last business day of the month. New issues must settle on or before the following calendar month end in order to qualify for the coming month. No changes are made to constituent holdings other than on month end rebalancing dates. Inception date: December 31, 1977.
ICE BofA Japan Government Index: ICE BofA Japan Government Index tracks the performance of JPY denominated sovereign debt publicly issued by the Japanese government in its domestic market. Qualifying securities must have at least 18 months to maturity at point of issuance, at least one year remaining term to final maturity, a fixed coupon schedule and a minimum amount outstanding of JPY 200 billion. Callable perpetual securities qualify provided they are at least one year from the first call date. Fixed-to-floating rate securities also qualify provided they are callable within the fixed rate period and are at least one year from the last call prior to the date the bond transitions from a fixed to a floating rate security. Bills, inflation-linked debt and strips are excluded from the Index; however, original issue zero coupon bonds are included in the index and the amounts outstanding of qualifying coupon securities are not reduced by any portions that have been stripped. Securities issued or marketed primarily to retail investors do not qualify for inclusion in the index. Index constituents are market capitalization weighted. Accrued interest is calculated assuming next-day settlement. Cash flows from bond payments that are received during the month are retained in the index until the end of the month and then are removed as part of the rebalancing. Cash does not earn any reinvestment income while it is held in the index. Information concerning constituent bond prices, timing and conventions and index governance and administration is provided in the ICE BofA Bond Index Methodologies, which can be accessed on our public website (https://indices.theice.com), or by sending a request to [email protected]. The index is rebalanced on the last calendar day of the month, based on information available up to and including the third business day before the last business day of the month. New issues must settle on or before the
22
Fidelity Capital Markets
following calendar month end in order to qualify for the coming month. No changes are made to constituent holdings other than on month end rebalancing dates. Inception date: December 31, 1985.
ICE BofA Australia Government Index: ICE BofA Australia Government Index tracks the performance of AUD denominated sovereign debt publicly issued by the Australian government in its domestic market. Qualifying securities must have at least 18 months to maturity at point of issuance, at least one year remaining term to final maturity, a fixed coupon schedule and a minimum amount outstanding of AUD 1 billion. Callable perpetual securities qualify provided they are at least one year from the first call date. Fixed-to-floating rate securities also qualify provided they are callable within the fixed rate period and are at least one year from the last call prior to the date the bond transitions from a fixed to a floating rate security. Bills, inflation-linked debt and strips are excluded from the Index; however, original issue zero coupon bonds are included in the index and the amounts outstanding of qualifying coupon securities are not reduced by any portions that have been stripped. Securities issued or marketed primarily to retail investors do not qualify for inclusion in the index. Index constituents are market capitalization weighted. Accrued interest is calculated assuming next-day settlement. Cash flows from bond payments that are received during the month are retained in the index until the end of the month and then are removed as part of the rebalancing. Cash does not earn any reinvestment income while it is held in the index. Information concerning constituent bond prices, timing and conventions and index governance and administration is provided in the ICE BofA Bond Index Methodologies, which can be accessed on our public website (https://indices.theice.com), or by sending a request to [email protected]. The index is rebalanced on the last calendar day of the month, based on information available up to and including the third business day before the last business day of the month. New issues must settle on or before the following calendar month end in order to qualify for the coming month. No changes are made to constituent holdings other than on month end rebalancing dates. Inception date: December 31, 1985.
ICE BofA French Government Index: ICE BofA French Government Index tracks the performance of EUR denominated sovereign debt publicly issued by the French government in the French domestic or eurobond market. Qualifying securities must have at least 18 months to maturity at point of issuance, at least one year remaining term to final maturity, a fixed coupon schedule and a minimum amount outstanding of EUR 1 billion. Callable perpetual securities qualify provided they are at least one year from the first call date. Fixed-to-floating rate securities also qualify provided they are callable within the fixed rate period and are at least one year from the last call prior to the date the bond transitions from a fixed to a floating rate security. Bills, inflation-linked debt and strips are excluded from the Index; however, original issue zero coupon bonds are included in the index and the amounts outstanding of qualifying coupon securities are not reduced by any portions that have been stripped. Securities issued or marketed primarily to retail investors do not qualify for inclusion in the index. Index constituents are market capitalization weighted. Accrued interest is calculated assuming next-day settlement. Cash flows from bond payments that are received during the month are retained in the index until the end of the month and then are removed as part of the rebalancing. Cash does not earn any reinvestment income while it is held in the index. Information concerning constituent bond prices, timing and conventions and index governance and administration is provided in the ICE BofA Bond Index Methodologies, which can be accessed on our public website (https://indices.theice.com), or by sending a request to [email protected]. The index is rebalanced on the last calendar day of the month, based on information available up to and including the third business day before the last business day of the month. New issues must settle on or before the following calendar month end in order to qualify for the coming month. No changes are made to constituent holdings other than on month end rebalancing dates. Inception date: December 31, 1985.
ICE BofA German Government Index: ICE BofA German Government Index tracks the performance of EUR denominated sovereign debt publicly issued by the German government in the German domestic or eurobond market. Qualifying securities must have at least 18 months to maturity at point of issuance, at least one year remaining term to final maturity, a fixed coupon schedule and a minimum amount outstanding of EUR 1 billion. Callable perpetual securities qualify provided they are at least one year from the first call date. Fixed-to-floating rate securities also qualify provided they are callable within the fixed rate period and are at least one year from the last call prior to the date the bond transitions from a fixed to a floating rate security. Bills, inflation-linked debt and strips are excluded from the Index; however, original issue zero coupon bonds are included in the index and the amounts outstanding of qualifying coupon securities are not reduced by any portions that have been stripped. Securities issued or marketed primarily to retail investors do not qualify for inclusion in the index. Index constituents are market capitalization weighted. Accrued interest is calculated assuming next-day settlement. Cash flows from bond payments that are received during the month are retained in the index until the end of the month and then are removed as part of the rebalancing. Cash does not earn any reinvestment income while it is held in the index. Information concerning constituent bond prices, timing and conventions and index governance and administration is provided in the ICE BofA Bond Index Methodologies, which can be accessed on our public website (https://indices.theice.com), or by sending a request to [email protected]. The index is rebalanced on the last calendar day of the month, based on information available up to and including the third business day before the last business day of the month. New issues must settle on or before the following calendar month end in order to qualify for the coming month. No changes are made to constituent holdings other than on month end rebalancing dates. Inception date: December 31, 1985.
ICE BofA Italian Government Index: ICE BofA Italian Government Index tracks the performance of EUR denominated sovereign debt publicly issued by the Italian government in the Italian domestic or eurobond market. Qualifying securities must have at least 18 months to maturity at point of issuance, at least one year remaining term to final maturity, a fixed coupon schedule and a minimum amount outstanding of EUR 1 billion. Callable perpetual securities qualify provided they are at least one year from the first call date. Fixed-to-floating rate securities also qualify provided they are callable within the fixed rate period and are at least one year from the last call prior to the date the bond transitions from a fixed to a floating rate security. Bills, inflation-linked debt and strips are
23
Fidelity Capital Markets
excluded from the Index; however, original issue zero coupon bonds are included in the index and the amounts outstanding of qualifying coupon securities are not reduced by any portions that have been stripped. Securities issued or marketed primarily to retail investors do not qualify for inclusion in the index. Index constituents are market capitalization weighted. Accrued interest is calculated assuming next-day settlement. Cash flows from bond payments that are received during the month are retained in the index until the end of the month and then are removed as part of the rebalancing. Cash does not earn any reinvestment income while it is held in the index. Information concerning constituent bond prices, timing and conventions and index governance and administration is provided in the ICE BofA Bond Index Methodologies, which can be accessed on our public website (https://indices.theice.com), or by sending a request to [email protected]. The index is rebalanced on the last calendar day of the month, based on information available up to and including the third business day before the last business day of the month. New issues must settle on or before the following calendar month end in order to qualify for the coming month. No changes are made to constituent holdings other than on month end rebalancing dates. Inception date: November 30, 1987.
ICE BofA Spanish Government Index: ICE BofA Spanish Government Index tracks the performance of EUR denominated sovereign debt publicly issued by the Spanish government in the Spanish domestic or eurobond market. Qualifying securities must have at least 18 months to maturity at point of issuance, at least one year remaining term to final maturity, a fixed coupon schedule and a minimum amount outstanding of EUR 1 billion. Callable perpetual securities qualify provided they are at least one year from the first call date. Fixed-to-floating rate securities also qualify provided they are callable within the fixed rate period and are at least one year from the last call prior to the date the bond transitions from a fixed to a floating rate security. Bills, inflation-linked debt and strips are excluded from the Index; however, original issue zero coupon bonds are included in the index and the amounts outstanding of qualifying coupon securities are not reduced by any portions that have been stripped. Securities issued or marketed primarily to retail investors do not qualify for inclusion in the index. Index constituents are market capitalization weighted. Accrued interest is calculated assuming next-day settlement. Cash flows from bond payments that are received during the month are retained in the index until the end of the month and then are removed as part of the rebalancing. Cash does not earn any reinvestment income while it is held in the index. Information concerning constituent bond prices, timing and conventions and index governance and administration is provided in the ICE BofA Bond Index Methodologies, which can be accessed on our public website (https://indices.theice.com), or by sending a request to [email protected]. The index is rebalanced on the last calendar day of the month, based on information available up to and including the third business day before the last business day of the month. New issues must settle on or before the following calendar month end in order to qualify for the coming month. No changes are made to constituent holdings other than on month end rebalancing dates. Inception date: May 31, 1992.
ICE BofA UK Gilt Index tracks the performance of GBP denominated sovereign debt publicly issued by the UK government in its domestic market. Qualifying securities must have at least 18 months to maturity at point of issuance, at least one year remaining term to final maturity, a fixed coupon schedule and a minimum amount outstanding of GBP 500 million. Callable perpetual securities qualify provided they are at least one year from the first call date. Fixed-to-floating rate securities also qualify provided they are callable within the fixed rate period and are at least one year from the last call prior to the date the bond transitions from a fixed to a floating rate security. Bills, inflation-linked debt and strips are excluded from the Index; however, original issue zero coupon bonds are included in the index and the amounts outstanding of qualifying coupon securities are not reduced by any portions that have been stripped. Securities issued or marketed primarily to retail investors do not qualify for inclusion in the index. Index constituents are market capitalization weighted. Accrued interest is calculated assuming next-day settlement. Cash flows from bond payments that are received during the month are retained in the index until the end of the month and then are removed as part of the rebalancing. Cash does not earn any reinvestment income while it is held in the index. Information concerning constituent bond prices, timing and conventions and index governance and administration is provided in the ICE BofA Bond Index Methodologies, which can be accessed on our public website (https://indices.theice.com), or by sending a request to [email protected]. The index is rebalanced on the last calendar day of the month, based on information available up to and including the third business day before the last business day of the month. New issues must settle on or before the following calendar month end in order to qualify for the coming month. No changes are made to constituent holdings other than on month end rebalancing dates. Inception date: December 31, 1985.
ICE BofA Canada Government Index: ICE BofA Canada Government Index tracks the performance of CAD denominated sovereign debt publicly issued by the Canadian government in its domestic market. Qualifying securities must have at least 18 months to maturity at point of issuance, at least one year remaining term to final maturity, a fixed coupon schedule and a minimum amount outstanding of CAD 1 billion. Callable perpetual securities qualify provided they are at least one year from the first call date. Fixed-to-floating rate securities also qualify provided they are callable within the fixed rate period and are at least one year from the last call prior to the date the bond transitions from a fixed to a floating rate security. Bills, inflation-linked debt and strips are excluded from the Index; however, original issue zero coupon bonds are included in the index and the amounts outstanding of qualifying coupon securities are not reduced by any portions that have been stripped. Securities issued or marketed primarily to retail investors do not qualify for inclusion in the index. Index constituents are market capitalization weighted. Accrued interest is calculated assuming next-day settlement. Cash flows from bond payments that are received during the month are retained in the index until the end of the month and then are removed as part of the rebalancing. Cash does not earn any reinvestment income while it is held in the index. Information concerning constituent bond prices, timing and conventions and index governance and administration is provided in the ICE BofA Bond Index Methodologies, which can be accessed on our public website (https://indices.theice.com), or by sending a request to [email protected]. The index is rebalanced on the last calendar day of the month, based on information available up to and including the third business day before the last business day of the month.
24
Fidelity Capital Markets
New issues must settle on or before the following calendar month end in order to qualify for the coming month. No changes are made to constituent holdings other than on month end rebalancing dates. Inception date: December 31, 1985.
ICE BofA US Dollar South Korea Sovereign Index: ICE BofA US Dollar South Korea Sovereign Index is a subset of ICE BofA US Emerging Markets External Sovereign Index including all securities with South Korea as the country of risk. Inception date: April 30, 1998.
ICE BofA US Dollar Indonesia Sovereign Index: ICE BofA US Dollar Indonesia Sovereign Index is a subset of ICE BofA US Emerging Markets External Sovereign Index including all securities with an Indonesia country of risk. Inception date: December 31, 1996.
ICE BofA US Dollar Mexico Sovereign Index: ICE BofA US Dollar Mexico Sovereign Index is a subset of ICE BofA US Emerging Markets External Sovereign Index including all securities with a Mexico country of risk. Inception date: December 31, 1991.
ICE BofA US Dollar Brazil Sovereign Index: ICE BofA US Dollar Brazil Sovereign Index is a subset of ICE BofA US Emerging Markets External Sovereign Index including all securities with a Brazil country of risk. Inception date: December 31, 1991.
ICE BofA US Dollar Turkey Sovereign Index: ICE BofA US Dollar Turkey Sovereign Index is a subset of ICE BofA US Emerging Markets External Sovereign Index including all securities with a Turkey country of risk. Inception date: August 31, 1997.
ICE BofA US Emerging Markets External Sovereign Index: ICE BofA US Emerging Markets External Sovereign Index tracks the performance of US dollar emerging markets sovereign debt publicly issued in the US and eurobond markets. In order to qualify for inclusion in the Index an issuer must have risk exposure to countries other than members of the FX-G10, all Western European countries, and territories of the US and Western European countries. The FX-G10 includes all Euro members, the US, Japan, the UK, Canada, Australia, New Zealand, Switzerland, Norway and Sweden. Qualifying securities must have at least 18 months to final maturity at the time of issuance, at least one year remaining term to final maturity as of the rebalancing date, a fixed coupon schedule and a minimum amount outstanding of $250 million. Original issue zero coupon bonds, 144a securities (both with and without registration rights), and eurobonds are included in the index. Securities issued or marketed primarily to retail investors, or those in legal default are excluded from the index. Index constituents are market capitalization weighted. Accrued interest is calculated assuming next-day settlement. Cash flows from bond payments that are received during the month are retained in the index until the end of the month and then are removed as part of the rebalancing. Cash does not earn any reinvestment income while it is held in the index. Information concerning constituent bond prices, timing and conventions and index governance and administration is provided in the ICE BofA Bond Index Methodologies, which can be accessed on our public website (https://indices.theice.com), or by sending a request to [email protected]. The index is rebalanced on the last calendar day of the month, based on information available up to and including the third business day before the last business day of the month. New issues must settle on or before the following calendar month end in order to qualify for the coming month. No changes are made to constituent holdings other than on month end rebalancing dates. Inception date: December 31, 1991.
S&P Municipal Bond Indices
The S&P Municipal Bond Index is a broad, comprehensive, market value-weighted index. All bonds in the index are exempt from U.S. federal income taxes, but may be subject to alternative minimum tax (AMT). The bond issuer is a U.S. state (including the Commonwealth of Puerto Rico and U.S. territories) or local government or agency such that interest on the bond is exempt from U.S. federal income taxes, but may be subject to alternative minimum tax (AMT). The bond must have a dated date within three months of the rebalancing date to be considered eligible for a new addition to the index. The bond must be held by a mutual fund and Securities Evaluations | ICE Data Services must provide daily pricing on the bond. The bond must be denominated in U.S. dollars. The amount outstanding, or par amount, is used to determine the weight of the bond in the index. The bond must have a minimum par amount of US$ 2 million to be eligible for inclusion. As of the rebalancing date, the bond must have a minimum term to maturity greater than one calendar month. For any bond with an announced full call, the call date must be greater than one calendar month. Bonds are deleted from the index at the rebalancing for the following reasons: (1) bonds that are completely called or tendered during the course of the month, (2) defaulted bonds that have made a final distribution, (3), bonds that are scheduled to be completely called or redeemed during the course of the calendar month following the rebalancing date, (4) bonds where partial calls and redemptions have reduced the known outstanding amount to less than US$ 2 million during the course of the month, (5) bonds that have gone through a partial pre-refunding and have, consequently, had new CUSIPs assigned (if the “new” bonds are considered eligible for inclusion, the bonds are added to the index on a monthly rebalancing date accordingly), (6) bonds that are no longer priced by Securities Evaluations | ICE Data Services for more than five consecutive days. The state level municipal bond sub-indices consists of bonds in the S&P Municipal Bond Index that have been issued by municipalities or municipal authorities within the 50 states, the District of Columbia, Puerto Rico, Guam and the U.S. Virgin Islands.
Thomson Reuters / Municipal Market Data (MMD)
Municipal Market Data produces daily generic yield curves which reflect the offer-side of the municipal market determined from trading activity and primary markets. The MMD "AAA" curve represents non-AMT, tax-exempt yields on triple-A rated state general

25
Fidelity Capital Markets
obligation bonds. The MMD curve evaluates trades and primary market maturities of at least $2 million and assumes a 10-year par call for maturities longer than 10 years. Yields are reflective of coupon structures that are the general preference of institutional buyers and tend to be standard structures for primary issues. Currently, the coupon of preference is 5.00%, and maturities beyond 10 years are yield to call (callable in year 10), not yield to maturity. MMD is a Thomson Reuters product.
Bloomberg Indices
Bloomberg Municipal Bond Index The Bloomberg U.S. Municipal Index covers the USD-denominated long-term tax-exempt bond market. The index has four main sectors: state and local general obligation bonds, revenue bonds, insured bonds and prerefunded bonds.
Bloomberg US Corporate Bond Index
The Bloomberg US Corporate Bond Index measures the investment grade, fixed-rate, taxable corporate bond market. It includes USD denominated securities publicly issued by US and non-US industrial, utility and financial issuers.
26
Fidelity Capital Markets
Past performance is no guarantee of future results.
All indexes are unmanaged, and performance of the indexes includes reinvestment of dividends and interest income, unless otherwise noted. Indexes are not illustrative of any particular investment, and it is not possible to invest directly in an index.
This guide is for informational purposes only and should not be construed as a solicitation or an offer to buy or sell any security. The information presented in this guide has been obtained from sources believed to be reliable, but Fidelity Capital Markets (FCM) does not make any representation about the accuracy, completeness, or timeliness of this information. This guide is current only as of the date that it was published, and opinions, estimates, and other information may change without notice or publication. Prior to making an investment or other financial decision, please consult the financial, legal, and/or tax adviser of your choice. FCM shall not be liable for any person’s use of this guide. FCM does not give tax or legal advice.
In general the bond market is volatile, and fixed income securities carry interest rate risk. (As interest rates rise, bond prices usually fall, and vice versa. This effect is usually more pronounced for longer-term securities.) Fixed income securities also carry inflation risk, liquidity risk, call risk, and credit and default risks for both issuers and counterparties.
Any fixed income security sold or redeemed prior to maturity may be subject to a substantial gain or loss.
Diversification does not ensure a profit or guarantee against a loss. Interest income earned from tax-exempt municipal securities generally is exempt from federal income tax, and may also be exempt from state and local income taxes if you are a resident in the state of issuance. A portion of the income you receive may be subject to federal and state income taxes, including the federal alternative minimum tax. In addition, you may be subject to tax on amounts recognized in connection with the sale of municipal bonds, including capital gains and “market discount” taxed at ordinary income rates. “Market discount” arises when a bond is purchased on the secondary market for a price that is less than its stated redemption price by more than a statutory amount. Before making any investment, you should review the official statement for the relevant offering for additional tax and other considerations.
The municipal market can be adversely affected by tax, legislative or political changes and the financial condition of the issuers of municipal securities. Investing in municipal bonds for the purpose of generating tax-exempt income may not be appropriate for investors in all tax brackets or for all account types. Tax laws are subject to change and the preferential tax treatment of municipal bond interest income may be revoked or phased out for investors at certain income levels. You should consult your tax adviser regarding your specific situation.
Fidelity Brokerage Services LLC, Member NYSE, SIPC, 900 Salem Street, Smithfield, RI 02917
© 2022 FMR LLC. All rights reserved.
802200.1.5