Embed Size (px)
Citation preview
Fibration symmetries uncover the building blocksof biological networksFlaviano Moronea,b,1, Ian Leifera,b,1, and Hernan A. Maksea,b,1,2
aLevich Institute, City College of New York, New York, NY 10031; and bPhysics Department, City College of New York, New York, NY 10031
Edited by Terrence J. Sejnowski, Salk Institute for Biological Studies, La Jolla, CA, and approved February 18, 2020 (received for review August 22, 2019)
A major ambition of systems science is to uncover the build-ing blocks of any biological network to decipher how cellularfunction emerges from their interactions. Here, we introduce agraph representation of the information flow in these networksas a set of input trees, one for each node, which contains allpathways along which information can be transmitted in the net-work. In this representation, we find remarkable symmetries inthe input trees that deconstruct the network into functional build-ing blocks called fibers. Nodes in a fiber have isomorphic inputtrees and thus process equivalent dynamics and synchronize theiractivity. Each fiber can then be collapsed into a single representa-tive base node through an information-preserving transformationcalled “symmetry fibration,” introduced by Grothendieck in thecontext of algebraic geometry. We exemplify the symmetry fibra-tions in gene regulatory networks and then show that theyuniversally apply across species and domains from biology tosocial and infrastructure networks. The building blocks are clas-sified into topological classes of input trees characterized byinteger branching ratios and fractal golden ratios of Fibonaccisequences representing cycles of information. Thus, symmetryfibrations describe how complex networks are built from the bot-tom up to process information through the synchronization oftheir constitutive building blocks.
complex networks | fibration symmetry | statistical mechanics |biological networks
A central theme in systems science is to break down the sys-tem into its fundamental building blocks to then uncover the
principles by which complex collective behavior emerges fromtheir interactions (1–3). In number theory, every natural numbercan be represented by a unique product of primes. Thus, primenumbers are the building blocks of natural numbers. This mathe-matical notion of building blocks is extended to the more abstractnotion of group theory since finite groups can also be factoredinto simple subgroups (4). The latter example, entirely abstractas it may be, has important implications for natural systems dueto the fundamental relationship between group theory and thenotion of symmetry that has led to the discovery of the funda-mental building blocks of matter, such as quarks and leptons(3, 5). Here we ask whether similar principles of symmetry canuncover the fundamental building blocks of biological networks(1, 2, 6, 7). Primary examples of these networks are gene regu-latory networks that control gene expression in cells (2, 8–10);as well as metabolic networks, cellular processes and pathways,neural networks, and ecosystems; and, beyond biology, otherinformation-processing networks like social and infrastructurenetworks (7). Previous studies have identified building blocks or“network motifs” (2, 6, 8) by looking for patterns in the networkthat appear more often than they would by pure chance. Thecrux of the matter is to test whether the building blocks of thesenetworks obey a predictive principle that explains how the cellfunctions and whether such a principle can be expressed in thelanguage of symmetries.
We introduce the use of symmetries in biological networksby analyzing the transcriptional regulatory network of bacteriumEscherichia coli (11), since this is a well-characterized network.
We find that this network exhibits fibration symmetries (12–14),first introduced by Grothendieck (12) in the context of algebraicgeometry.
Symmetry fibrations are morphisms between networks thatidentify clusters of synchronized genes (called fibers) with iso-morphic input trees. Genes in a fiber are collapsed by a symmetryfibration into a single representative gene called the base. Thefibers are then the synchronized building blocks of the geneticnetwork and symmetry fibrations are transformations that pre-serve the dynamics of information flow in the network. We usethis symmetry principle to classify the building blocks into topo-logical classes of input trees characterized by integer branchingratios and complex topologies with golden ratios of Fibonaccisequences representing cycles in the network. We then show thatsymmetry fibrations explain synchronization patterns of genecoexpression in cells and universally apply to a range of complexnetworks across different species and domains beyond biology.
ResultsWe search for symmetries in the E. coli transcriptional regulatorynetwork [most updated compilation at RegulonDB (11)] wherenodes are genes and a directed link represents a transcriptionalregulation (SI Appendix, section III).
A directed link from a source gene i to a target gene j in atranscriptional regulatory network represents a direct interaction
Significance
The success of symmetries in explaining the physical world,from general relativity to the standard model of particlephysics and all phases of matter, raises the question of whythe same concept could not be equally applied to explainemergent properties of biological systems. In other words, weask—if life is an emergent property of physics—why the samesymmetry principles that explain physics could not explainthe organizing principle of life. Here we show that a particu-lar form of symmetry, called symmetry fibration, explains thebuilding blocks of biological networks and other social andinfrastructure networks. This result opens the way to under-stand how information-processing networks are assembledfrom the bottom up.
Author contributions: F.M., I.L., and H.A.M. designed research, performed research,analyzed data, and wrote the paper.y
The authors declare no competing interest.y
This article is a PNAS Direct Submission.y
This open access article is distributed under Creative Commons Attribution-NonCommercial-NoDerivatives License 4.0 (CC BY-NC-ND).y
Data deposition: Full details of each network and results can be accessedon GitHub at https://github.com/makselab/fibrationData/blob/master/datasets.xlsx. Thecodes to reproduce this analysis are on GitHub at https://github.com/makselab (SIAppendix, section V). The full datasets are on GitHub at https://github.com/makselab/fibrationData/blob/master/rawData.zip.y1 F.M., I.L., and H.A.M. contributed equally to this work.y2 To whom correspondence may be addressed. Email: [email protected]
This article contains supporting information online at https://www.pnas.org/lookup/suppl/doi:10.1073/pnas.1914628117/-/DCSupplemental.y
First published March 31, 2020.
8306–8314 | PNAS | April 14, 2020 | vol. 117 | no. 15 www.pnas.org/cgi/doi/10.1073/pnas.1914628117
Dow
nloa
ded
by g
uest
on
June
11,
202
0
APP
LIED
PHYS
ICA
LSC
IEN
CES
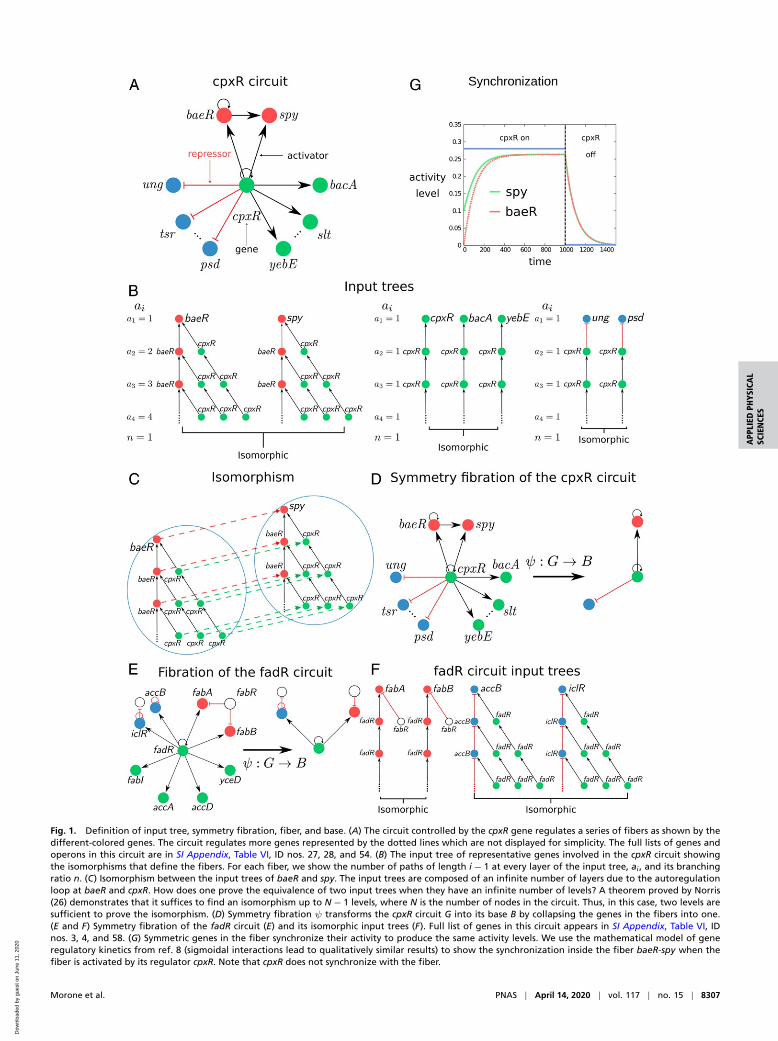
Fig. 1. Definition of input tree, symmetry fibration, fiber, and base. (A) The circuit controlled by the cpxR gene regulates a series of fibers as shown by thedifferent-colored genes. The circuit regulates more genes represented by the dotted lines which are not displayed for simplicity. The full lists of genes andoperons in this circuit are in SI Appendix, Table VI, ID nos. 27, 28, and 54. (B) The input tree of representative genes involved in the cpxR circuit showingthe isomorphisms that define the fibers. For each fiber, we show the number of paths of length i− 1 at every layer of the input tree, ai , and its branchingratio n. (C) Isomorphism between the input trees of baeR and spy. The input trees are composed of an infinite number of layers due to the autoregulationloop at baeR and cpxR. How does one prove the equivalence of two input trees when they have an infinite number of levels? A theorem proved by Norris(26) demonstrates that it suffices to find an isomorphism up to N− 1 levels, where N is the number of nodes in the circuit. Thus, in this case, two levels aresufficient to prove the isomorphism. (D) Symmetry fibration ψ transforms the cpxR circuit G into its base B by collapsing the genes in the fibers into one.(E and F) Symmetry fibration of the fadR circuit (E) and its isomorphic input trees (F). Full list of genes in this circuit appears in SI Appendix, Table VI, IDnos. 3, 4, and 58. (G) Symmetric genes in the fiber synchronize their activity to produce the same activity levels. We use the mathematical model of generegulatory kinetics from ref. 8 (sigmoidal interactions lead to qualitatively similar results) to show the synchronization inside the fiber baeR-spy when thefiber is activated by its regulator cpxR. Note that cpxR does not synchronize with the fiber.
Morone et al. PNAS | April 14, 2020 | vol. 117 | no. 15 | 8307
Dow
nloa
ded
by g
uest
on
June
11,
202
0
where gene i encodes for a transcription factor that binds tothe binding site of gene j to regulate (activate or repress) itsexpression. Such a link represents a regulatory “message” sentby the source to the target gene using the transcription factoras a “messenger.” This process defines the “information flow”in the system which is not restricted to two interacting genes,but it is transferred to different regions within the network thatare accessible through the connecting pathways. The informationarriving to a gene contains the entire history transmitted throughall pathways that reach this gene. We formalize this process ofcommunication between genes with the notion of “input tree”of the gene. In a network G = (NG ,EG) with NG nodes and EG
directed edges, for every gene i ∈NG there is a correspondinginput tree, denoted as Ti , which is the tree of all pathways of Gending at i . More precisely, Ti is a rooted tree with a selectednode i at the root, such that every other node j in the tree rep-resents the initial node of a path in the network ending at i .
Next, we analyze the input trees in the E. coli subcircuit shownin Fig. 1A regulated by gene cpxR which regulates its own expres-sion (via an autoregulation activator loop) and also regulatesother genes as shown in Fig. 1A. Gene cpxR is not regulated byany other transcription factor in the network, so we say that thisgene forms its own “strongly connected component”; see below.Therefore, it is an ideal simple circuit to explain the concept offibration.
Input Tree Representation. In practice, the input tree of a gene isconstructed as follows (SI Appendix, section IV.A). Consider thecircuit in Fig. 1A. The input tree of gene spy depicted in Fig. 1Bstarts with spy at the root (first layer). Since this gene is upregu-lated by baeR and cpxR, then the second layer of the input treecontains these two pathways of length 1 starting at both genes.Gene baeR is further upregulated by cpxR and by itself throughthe autoregulation loop and cpxR is also autoregulated. Thus, theinput tree continues to the third layer taking into account thesethree possible pathways of length 2 from the source gene to thespy gene. The procedure now continues, and since there are loopsin the circuit, the input tree has an infinite number of layers.
The input tree formalism is a powerful framework to searchfor symmetries in information-processing networks, in that itreplaces the canonical notion of a single trajectory with the setof all possible “histories” from an initial to a final state of thenetwork, and this makes, in practice, it reasonably straightfor-ward to “guess” a type of symmetry which is not apparent in theclassical network framework. Based on results from refs. 13–16,we show in Symmetry Fibration Leads to Synchronization that iftwo input trees have the same “shape,” then the genes at theroot of the input trees synchronize their activity (17–23), eventhough their input trees are made of different genes. This infor-mal notion of equivalence is formalized by isomorphisms. Anisomorphism between two input trees is a bijective map that pre-serves the topology of the input trees including the type of links.Specifically, a map τ :T→T ′ is an isomorphism if and only iffor any pair of nodes a and b of T connected by a link, the pairof nodes τ(a) and τ(b) of T ′ is connected by the same type oflink (SI Appendix, section IV.B). In practice, this means that iso-morphic input trees are “the same” except for the labeling ofthe nodes. Genes with isomorphic input trees are symmetric andsynchronous. We quantify this result, next, by introducing theconcept of symmetry fibration (13).
Symmetry Fibration of a Network. The set of all input tree iso-morphisms defines the symmetries of the network, which canbe described by a “Grothendieck fibration” (12). The origi-nal Grothendieck definition of fibration is between categories(12), so the passage to a definition of fibration between graphsrequires one to associate a category with a graph and rephraseGrothendieck’s definition in elementary terms. Different cate-
gories may be associated with a graph, giving rise to differentnotions of fibrations between graphs. The notion of fibration thatwe use henceforth has been introduced in computer science as a“surjective minimal graph fibration” (13, 15).
In general, a graph fibration G = (NG ,EG) is any morphism
ψ :G→B [1]
that maps G to a graph B = (NB ,EB ) (with NB nodes and EB
edges) called the “base” of the graph fibration ψ (SI Appendix,section IV.C). In this work we consider a surjective minimalgraph fibration (13) which is a graph fibration ψ that maps allnodes with isomorphic input trees, comprising a “fiber,” to asingle node in B , thus producing the minimal base of the net-work. In this case, the base B consists of a graph where all genesin a fiber have been collapsed into one representative node bythe minimal fibration. Thus, a surjective minimal graph fibra-tion, hereafter called symmetry fibration for the sake of lexicalconvenience, leads to a dimensional reduction of the networkinto its irreducible components. Crucially, a symmetry fibrationis a dimensional reduction that preserves the dynamics in thenetwork as we show next.
Symmetry Fibration Leads to Synchronization. Next, we explain theconnection between fibration and synchrony in a generality thatis needed to justify our results following refs. 15 and 16. Todescribe the dynamical state of each gene in the transcriptionalregulatory network, we first attach a phase space to each nodein G = (NG ,EG) by considering a map P :NG→M that assignseach node i ∈NG to the phase space of the node denoted bythe manifold M . For example, in a transcriptional regulatorynetwork we assign to each gene i ∈NG the phase space of realnumbers M =R. Then, the state of each gene is described byxi(t)∈R, representing the expression level of the gene i at timet , which is typically measured by mRNA concentration of geneproduct. We then obtain the total phase space of G as theproduct PG =
∏i∈NG
P(i).The fibers partition the graph G into unique and nonover-
lapping sets Π = {Π1, . . . , Πr}, such that Π1 ∪ · · · ∪Πr =G andΠk ∩Πl = ∅ if k 6=l (24). We denote i ∼Π j when the input treesof i and j are isomorphic and belong to the same fiber Πk . Thatis, ∃k | i , j ∈Πk and there exists a symmetry fibration that sendsboth nodes to the same node in the base, ψ(i) =ψ(j ). DeVilleand Lerman (15) showed that symmetry fibrations induce robustsynchronization in the system (theorem 4.3.1 in ref. 15). In par-ticular, it was shown that if ψ is a symmetry fibration, then—byproposition 2.1.12 in ref. 15—there exists a map Pψ :PB→PGthat maps the total phase space of the base B , named PB , to thetotal phase space of the graph G . This map creates a polysyn-chronous subspace of synchronized solutions in fibers: ∆Π ={x ∈PG | xi(t) = xj (t) whenever ψ(i) =ψ(j )}, where each setof synchronous components of this subspace corresponds to afiber in Π (lemma 5.1.1 in ref. 15; see also ref. 16). In other words,∆Π is a polysynchronous subspace of PG , such that componentsxi , xj ∈ x synchronize (i.e., xi(t) = xj (t)) whenever the symmetryfibration ψ sends them to the same node in B .
According to these results, we interpret synchronous genesto process the same information received through isomorphicpathways in the network, and, accordingly, we interpret a sym-metry fibration as a transformation that preserves the dynamicsof information flow since it collapses synchronous nodes in fibers(redundant from the point of view of dynamics) into a commonbase with identical dynamics to those of the fiber.
Synchronous nodes in a fiber induced by symmetry fibra-tion correspond to the “minimal balanced coloring” in ref. 14.A balanced coloring assigns two nodes the same color only iftheir inputs, self-consistently, receive the same content of col-ored nodes, whence the term “balanced.” Thus, the flow of
8308 | www.pnas.org/cgi/doi/10.1073/pnas.1914628117 Morone et al.
Dow
nloa
ded
by g
uest
on
June
11,
202
0

APP
LIED
PHYS
ICA
LSC
IEN
CES
information arriving to genes in a fiber is analogous to a processof assigning a color to each gene such that each gene “receives”the colors from adjacent genes via incoming links and “sends”its color to the adjacent genes via its outgoing links. The nodesin a fiber have the same color symbolizing the fact that theysynchronize. The nodes with the same color in the balanced col-oring partition (14) correspond to fibers induced by symmetryfibrations (15). We use the minimal balanced coloring algorithmproposed in ref. 25 for the computation of minimal bases (24) tofind fibers (SI Appendix, section V).
Strongly Connected Components of the E. coli Network. The inputtrees in the E. coli cpxR circuit are displayed in Fig. 1B. The inputtrees of baeR and spy are isomorphic and define the baeR-spy fiber(Fig. 1C). We call this circuit a feedforward fiber (FFF). The inputtree of cpxR is not isomorphic to either baeR or spy, and there-fore cpxR is not symmetric with these genes, but it is isomorphicto bacA, slt, and yebE forming another fiber. Likewise, genes ung,tsr, and psd are all isomorphic, composing another fiber (Fig. 1B).Fig. 1D shows the symmetry fibrationψ :G→B that collapses thegenes in the fibers to the base B . Fig. 1E shows another exam-ple (of many) of a single connected component, fadR, and itscorresponding isomorphic input trees (Fig. 1F), fibers, and base.
The dynamical state of a gene is encoded in the topology ofthe input tree. In turn, this topology is encoded by a sequence,ai , defined as the number of genes in each i th layer of theinput tree (Fig. 1B). The sequence ai represents the numberof paths of length i − 1 that reach the gene at the root. Thissequence is characterized by the branching ratio n of the inputtree defined as ai+1/ai −−−→
i→∞n , which represents the multiplica-
tive growth of the number of paths across the network reachingthe gene at the root. For instance, the input trees of genesbaeR-spy (Fig. 1B) encode a sequence ai = i with branching ration = 1 representing the single (n = 1) autoregulation loop insidethe fiber.
Beyond several single-gene strongly connected componentslike those shown in Fig. 1, we find that the E. coli networkhas other strongly connected components (in a strongly con-nected component, each gene is reachable from every othergene; SI Appendix, section VI), three in total, which regu-late more involved topologies of fibers. We find 1) a two-gene strongly connected component composed of master reg-ulators crp-fis involved in a myriad of functions like carbonutilization (Fig. 2 A, Top), 2) a five-gene strongly con-nected component involved in the stress response system (SIAppendix, Fig. S7), and 3) the largest strongly connected
Fig. 2. Strongly connected components of the genetic network and synchronization of gene coexpression in the fibers in E. coli. (A, Top) Two-geneconnected component of crp-fis. This component controls a rich set of fibers as shown. We also show the symmetry fibration collapsing the graph tothe base. We highlight the fiber uxuR-lgoR which sends information to its regulator exuR and forms a 2-Fibonacci fiber |ϕ2 = 1.6180.., `= 2〉, as wellas the double-layer composite |add− oxyS〉= |0, 1〉⊕ | 1, 1〉. (A, Bottom) Coexpression correlation matrix calculated from the Pearson coefficient betweenthe expression levels of each pair of genes in A, Top. Synchronization of the genes in the respective fibers is corroborated as the block structure of the matrix.(B) The core of the E. coli network is the strongly connected component formed by genes involved in the pH system as shown. This component supports twoFibonacci fibers: 3-FF and 4-FF and fibers as shown. Open colored circles indicate genes that are in fibers and also belong to the pH component.
Morone et al. PNAS | April 14, 2020 | vol. 117 | no. 15 | 8309
Dow
nloa
ded
by g
uest
on
June
11,
202
0
component at the core of the network which is composedof genes involved in the pH system that regulate hydrogenconcentration (Fig. 2B). Each of these three components reg-ulates a rich variety of fiber topologies which are collapsedinto the base by the symmetry fibration ψ :G→B , as shownin Fig. 2B.
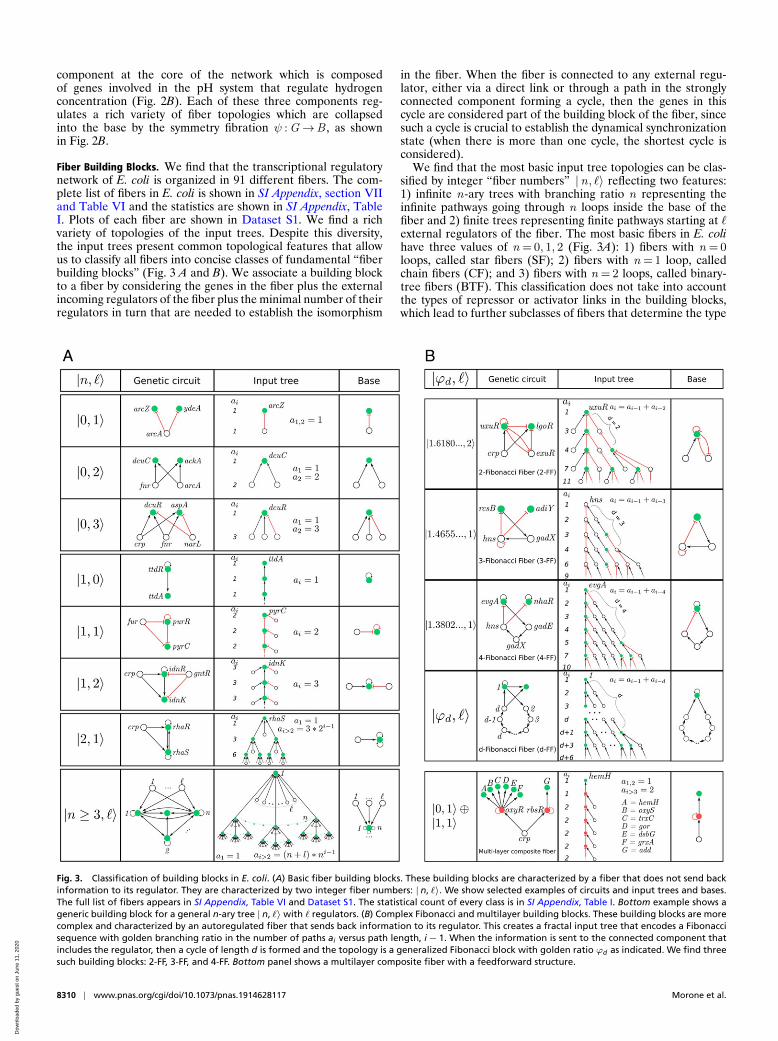
Fiber Building Blocks. We find that the transcriptional regulatorynetwork of E. coli is organized in 91 different fibers. The com-plete list of fibers in E. coli is shown in SI Appendix, section VIIand Table VI and the statistics are shown in SI Appendix, TableI. Plots of each fiber are shown in Dataset S1. We find a richvariety of topologies of the input trees. Despite this diversity,the input trees present common topological features that allowus to classify all fibers into concise classes of fundamental “fiberbuilding blocks” (Fig. 3 A and B). We associate a building blockto a fiber by considering the genes in the fiber plus the externalincoming regulators of the fiber plus the minimal number of theirregulators in turn that are needed to establish the isomorphism
in the fiber. When the fiber is connected to any external regu-lator, either via a direct link or through a path in the stronglyconnected component forming a cycle, then the genes in thiscycle are considered part of the building block of the fiber, sincesuch a cycle is crucial to establish the dynamical synchronizationstate (when there is more than one cycle, the shortest cycle isconsidered).
We find that the most basic input tree topologies can be clas-sified by integer “fiber numbers” |n, `〉 reflecting two features:1) infinite n-ary trees with branching ratio n representing theinfinite pathways going through n loops inside the base of thefiber and 2) finite trees representing finite pathways starting at `external regulators of the fiber. The most basic fibers in E. colihave three values of n = 0, 1, 2 (Fig. 3A): 1) fibers with n = 0loops, called star fibers (SF); 2) fibers with n = 1 loop, calledchain fibers (CF); and 3) fibers with n = 2 loops, called binary-tree fibers (BTF). This classification does not take into accountthe types of repressor or activator links in the building blocks,which lead to further subclasses of fibers that determine the type
Fig. 3. Classification of building blocks in E. coli. (A) Basic fiber building blocks. These building blocks are characterized by a fiber that does not send backinformation to its regulator. They are characterized by two integer fiber numbers: | n, `〉. We show selected examples of circuits and input trees and bases.The full list of fibers appears in SI Appendix, Table VI and Dataset S1. The statistical count of every class is in SI Appendix, Table I. Bottom example shows ageneric building block for a general n-ary tree | n, `〉 with ` regulators. (B) Complex Fibonacci and multilayer building blocks. These building blocks are morecomplex and characterized by an autoregulated fiber that sends back information to its regulator. This creates a fractal input tree that encodes a Fibonaccisequence with golden branching ratio in the number of paths ai versus path length, i− 1. When the information is sent to the connected component thatincludes the regulator, then a cycle of length d is formed and the topology is a generalized Fibonacci block with golden ratio ϕd as indicated. We find threesuch building blocks: 2-FF, 3-FF, and 4-FF. Bottom panel shows a multilayer composite fiber with a feedforward structure.
8310 | www.pnas.org/cgi/doi/10.1073/pnas.1914628117 Morone et al.
Dow
nloa
ded
by g
uest
on
June
11,
202
0
APP
LIED
PHYS
ICA
LSC
IEN
CES
of synchronization (fixed point, limit cycles, etc.) and thus thefunctionality of the fibers.
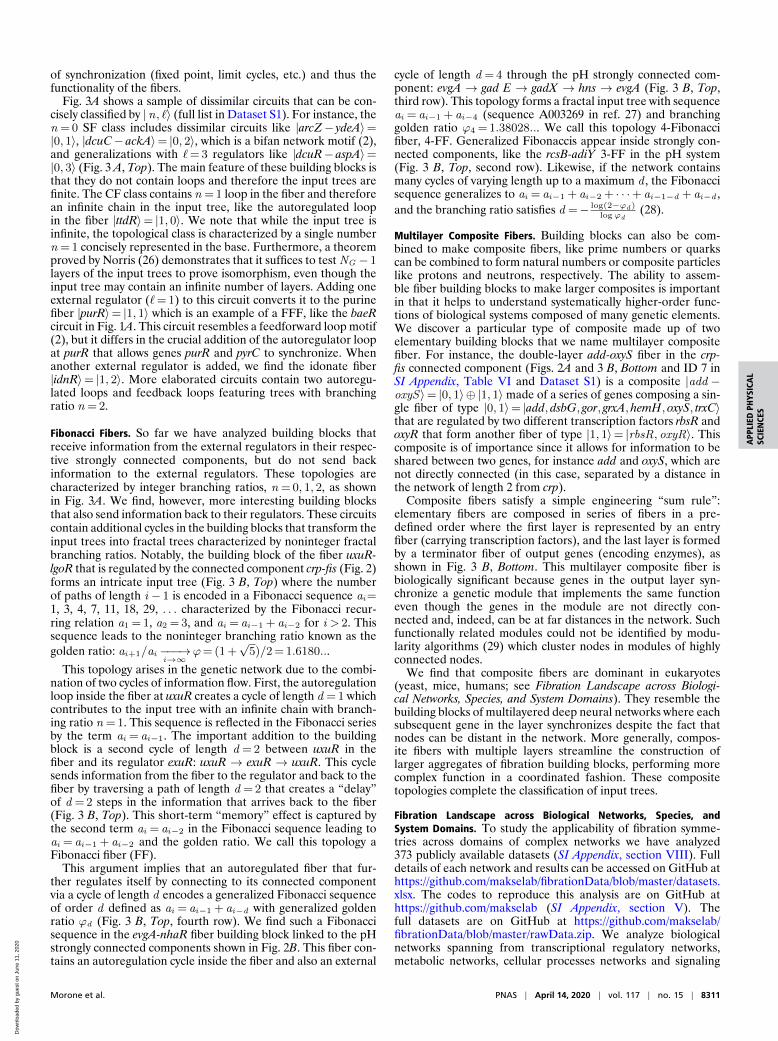
Fig. 3A shows a sample of dissimilar circuits that can be con-cisely classified by |n, `〉 (full list in Dataset S1). For instance, then = 0 SF class includes dissimilar circuits like |arcZ− ydeA〉=|0, 1〉, |dcuC− ackA〉= |0, 2〉, which is a bifan network motif (2),and generalizations with `= 3 regulators like |dcuR− aspA〉=|0, 3〉 (Fig. 3 A, Top). The main feature of these building blocks isthat they do not contain loops and therefore the input trees arefinite. The CF class contains n = 1 loop in the fiber and thereforean infinite chain in the input tree, like the autoregulated loopin the fiber |ttdR〉= |1, 0〉. We note that while the input tree isinfinite, the topological class is characterized by a single numbern = 1 concisely represented in the base. Furthermore, a theoremproved by Norris (26) demonstrates that it suffices to test NG − 1layers of the input trees to prove isomorphism, even though theinput tree may contain an infinite number of layers. Adding oneexternal regulator (`= 1) to this circuit converts it to the purinefiber |purR〉= |1, 1〉 which is an example of a FFF, like the baeRcircuit in Fig. 1A. This circuit resembles a feedforward loop motif(2), but it differs in the crucial addition of the autoregulator loopat purR that allows genes purR and pyrC to synchronize. Whenanother external regulator is added, we find the idonate fiber|idnR〉= |1, 2〉. More elaborated circuits contain two autoregu-lated loops and feedback loops featuring trees with branchingratio n = 2.
Fibonacci Fibers. So far we have analyzed building blocks thatreceive information from the external regulators in their respec-tive strongly connected components, but do not send backinformation to the external regulators. These topologies arecharacterized by integer branching ratios, n = 0, 1, 2, as shownin Fig. 3A. We find, however, more interesting building blocksthat also send information back to their regulators. These circuitscontain additional cycles in the building blocks that transform theinput trees into fractal trees characterized by noninteger fractalbranching ratios. Notably, the building block of the fiber uxuR-lgoR that is regulated by the connected component crp-fis (Fig. 2)forms an intricate input tree (Fig. 3 B, Top) where the numberof paths of length i − 1 is encoded in a Fibonacci sequence ai=1, 3, 4, 7, 11, 18, 29, . . . characterized by the Fibonacci recur-ring relation a1 = 1, a2 = 3, and ai = ai−1 + ai−2 for i > 2. Thissequence leads to the noninteger branching ratio known as thegolden ratio: ai+1/ai −−−→
i→∞ϕ= (1 +
√5)/2 = 1.6180...
This topology arises in the genetic network due to the combi-nation of two cycles of information flow. First, the autoregulationloop inside the fiber at uxuR creates a cycle of length d = 1 whichcontributes to the input tree with an infinite chain with branch-ing ratio n = 1. This sequence is reflected in the Fibonacci seriesby the term ai = ai−1. The important addition to the buildingblock is a second cycle of length d = 2 between uxuR in thefiber and its regulator exuR: uxuR → exuR → uxuR. This cyclesends information from the fiber to the regulator and back to thefiber by traversing a path of length d = 2 that creates a “delay”of d = 2 steps in the information that arrives back to the fiber(Fig. 3 B, Top). This short-term “memory” effect is captured bythe second term ai = ai−2 in the Fibonacci sequence leading toai = ai−1 + ai−2 and the golden ratio. We call this topology aFibonacci fiber (FF).
This argument implies that an autoregulated fiber that fur-ther regulates itself by connecting to its connected componentvia a cycle of length d encodes a generalized Fibonacci sequenceof order d defined as ai = ai−1 + ai−d with generalized goldenratio ϕd (Fig. 3 B, Top, fourth row). We find such a Fibonaccisequence in the evgA-nhaR fiber building block linked to the pHstrongly connected components shown in Fig. 2B. This fiber con-tains an autoregulation cycle inside the fiber and also an external
cycle of length d = 4 through the pH strongly connected com-ponent: evgA → gad E → gadX → hns → evgA (Fig. 3 B, Top,third row). This topology forms a fractal input tree with sequenceai = ai−1 + ai−4 (sequence A003269 in ref. 27) and branchinggolden ratio ϕ4 = 1.38028... We call this topology 4-Fibonaccifiber, 4-FF. Generalized Fibonaccis appear inside strongly con-nected components, like the rcsB-adiY 3-FF in the pH system(Fig. 3 B, Top, second row). Likewise, if the network containsmany cycles of varying length up to a maximum d , the Fibonaccisequence generalizes to ai = ai−1 + ai−2 + · · ·+ ai−1−d + ai−d ,and the branching ratio satisfies d =− log(2−ϕd )
logϕd(28).
Multilayer Composite Fibers. Building blocks can also be com-bined to make composite fibers, like prime numbers or quarkscan be combined to form natural numbers or composite particleslike protons and neutrons, respectively. The ability to assem-ble fiber building blocks to make larger composites is importantin that it helps to understand systematically higher-order func-tions of biological systems composed of many genetic elements.We discover a particular type of composite made up of twoelementary building blocks that we name multilayer compositefiber. For instance, the double-layer add-oxyS fiber in the crp-fis connected component (Figs. 2A and 3 B, Bottom and ID 7 inSI Appendix, Table VI and Dataset S1) is a composite |add −oxyS〉= |0, 1〉⊕ |1, 1〉made of a series of genes composing a sin-gle fiber of type |0, 1〉= |add, dsbG, gor, grxA, hemH, oxyS, trxC〉that are regulated by two different transcription factors rbsR andoxyR that form another fiber of type |1, 1〉= |rbsR, oxyR〉. Thiscomposite is of importance since it allows for information to beshared between two genes, for instance add and oxyS, which arenot directly connected (in this case, separated by a distance inthe network of length 2 from crp).
Composite fibers satisfy a simple engineering “sum rule”:elementary fibers are composed in series of fibers in a pre-defined order where the first layer is represented by an entryfiber (carrying transcription factors), and the last layer is formedby a terminator fiber of output genes (encoding enzymes), asshown in Fig. 3 B, Bottom. This multilayer composite fiber isbiologically significant because genes in the output layer syn-chronize a genetic module that implements the same functioneven though the genes in the module are not directly con-nected and, indeed, can be at far distances in the network. Suchfunctionally related modules could not be identified by modu-larity algorithms (29) which cluster nodes in modules of highlyconnected nodes.
We find that composite fibers are dominant in eukaryotes(yeast, mice, humans; see Fibration Landscape across Biologi-cal Networks, Species, and System Domains). They resemble thebuilding blocks of multilayered deep neural networks where eachsubsequent gene in the layer synchronizes despite the fact thatnodes can be distant in the network. More generally, compos-ite fibers with multiple layers streamline the construction oflarger aggregates of fibration building blocks, performing morecomplex function in a coordinated fashion. These compositetopologies complete the classification of input trees.
Fibration Landscape across Biological Networks, Species, andSystem Domains. To study the applicability of fibration symme-tries across domains of complex networks we have analyzed373 publicly available datasets (SI Appendix, section VIII). Fulldetails of each network and results can be accessed on GitHub athttps://github.com/makselab/fibrationData/blob/master/datasets.xlsx. The codes to reproduce this analysis are on GitHub athttps://github.com/makselab (SI Appendix, section V). Thefull datasets are on GitHub at https://github.com/makselab/fibrationData/blob/master/rawData.zip. We analyze biologicalnetworks spanning from transcriptional regulatory networks,metabolic networks, cellular processes networks and signaling
Morone et al. PNAS | April 14, 2020 | vol. 117 | no. 15 | 8311
Dow
nloa
ded
by g
uest
on
June
11,
202
0
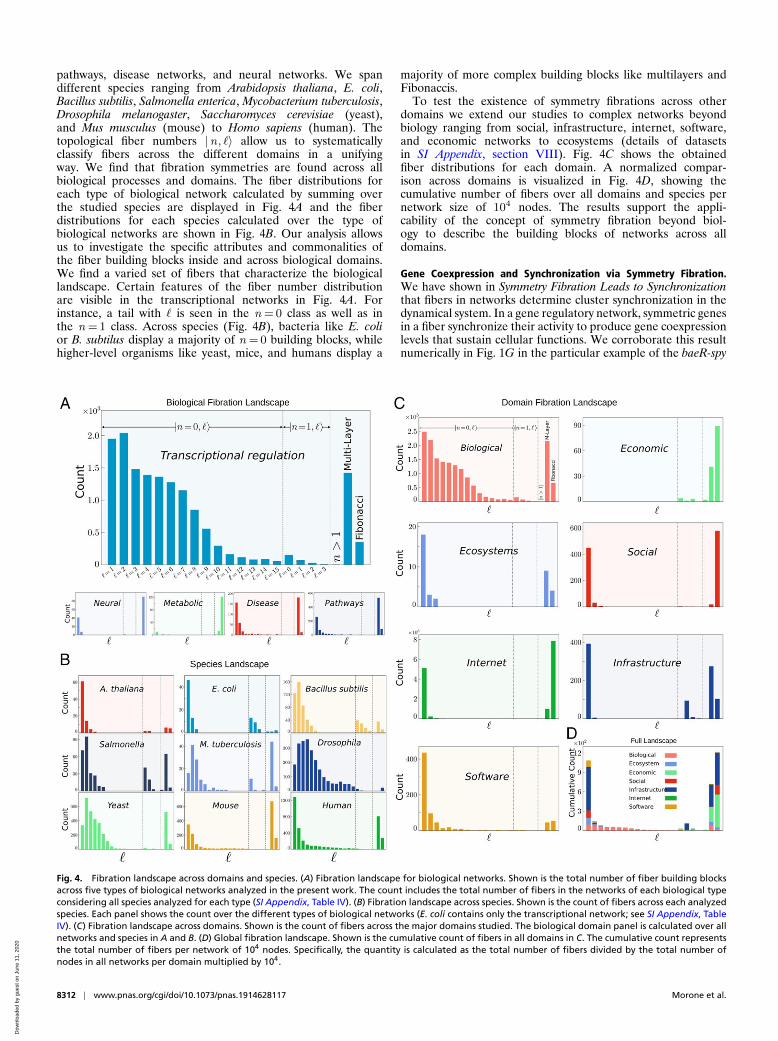
pathways, disease networks, and neural networks. We spandifferent species ranging from Arabidopsis thaliana, E. coli,Bacillus subtilis, Salmonella enterica, Mycobacterium tuberculosis,Drosophila melanogaster, Saccharomyces cerevisiae (yeast),and Mus musculus (mouse) to Homo sapiens (human). Thetopological fiber numbers |n, `〉 allow us to systematicallyclassify fibers across the different domains in a unifyingway. We find that fibration symmetries are found across allbiological processes and domains. The fiber distributions foreach type of biological network calculated by summing overthe studied species are displayed in Fig. 4A and the fiberdistributions for each species calculated over the type ofbiological networks are shown in Fig. 4B. Our analysis allowsus to investigate the specific attributes and commonalities ofthe fiber building blocks inside and across biological domains.We find a varied set of fibers that characterize the biologicallandscape. Certain features of the fiber number distributionare visible in the transcriptional networks in Fig. 4A. Forinstance, a tail with ` is seen in the n = 0 class as well as inthe n = 1 class. Across species (Fig. 4B), bacteria like E. colior B. subtilus display a majority of n = 0 building blocks, whilehigher-level organisms like yeast, mice, and humans display a
majority of more complex building blocks like multilayers andFibonaccis.
To test the existence of symmetry fibrations across otherdomains we extend our studies to complex networks beyondbiology ranging from social, infrastructure, internet, software,and economic networks to ecosystems (details of datasetsin SI Appendix, section VIII). Fig. 4C shows the obtainedfiber distributions for each domain. A normalized compar-ison across domains is visualized in Fig. 4D, showing thecumulative number of fibers over all domains and species pernetwork size of 104 nodes. The results support the appli-cability of the concept of symmetry fibration beyond biol-ogy to describe the building blocks of networks across alldomains.
Gene Coexpression and Synchronization via Symmetry Fibration.We have shown in Symmetry Fibration Leads to Synchronizationthat fibers in networks determine cluster synchronization in thedynamical system. In a gene regulatory network, symmetric genesin a fiber synchronize their activity to produce gene coexpressionlevels that sustain cellular functions. We corroborate this resultnumerically in Fig. 1G in the particular example of the baeR-spy
Fig. 4. Fibration landscape across domains and species. (A) Fibration landscape for biological networks. Shown is the total number of fiber building blocksacross five types of biological networks analyzed in the present work. The count includes the total number of fibers in the networks of each biological typeconsidering all species analyzed for each type (SI Appendix, Table IV). (B) Fibration landscape across species. Shown is the count of fibers across each analyzedspecies. Each panel shows the count over the different types of biological networks (E. coli contains only the transcriptional network; see SI Appendix, TableIV). (C) Fibration landscape across domains. Shown is the count of fibers across the major domains studied. The biological domain panel is calculated over allnetworks and species in A and B. (D) Global fibration landscape. Shown is the cumulative count of fibers in all domains in C. The cumulative count representsthe total number of fibers per network of 104 nodes. Specifically, the quantity is calculated as the total number of fibers divided by the total number ofnodes in all networks per domain multiplied by 104.
8312 | www.pnas.org/cgi/doi/10.1073/pnas.1914628117 Morone et al.
Dow
nloa
ded
by g
uest
on
June
11,
202
0
APP
LIED
PHYS
ICA
LSC
IEN
CES
FFF in E. coli, and this result applies to all fibers, irrespective ofthe dynamical system law.
To exemplify the synchronization in fibers, we consider thedynamics in the composite fiber |add − oxyS〉= |0, 1〉⊕ | 1, 1〉depicted in Figs. 2A and 3 B, Bottom, which is composed ofautoregulator 1 = crp, and two layers of fibers: 2 = rbsR, 3 =oxyR and 4 = add , 5 = oxyS (we consider here a reduced fiberfor simplicity, and we add the autoregulator to crp to the buildingblock for completeness). Graph G = {NG ,EG} consists of NG ={1, 2, 3, 4, 5}, EG = {1→ 1, 1→ 2, 1→ 3, 2a 2, 3a 3, 2→ 4, 3→5} (a refers to repressor and → to activation), and a five-dimensional total phase space PG =R5 with state vector X (t) ={x1(t), x2(t), x3(t), x4(t), x5(t)} describing the expression levelsof each gene’s product (e.g., mRNA concentration).
The symmetry fibration ψ :G→B collapses the graph Ginto the base B = {NB ,GB}, where NB = {a, b, c} and EB ={a→ a, a→ b, b a b, b→ c}. The symmetry fibration acts onthe nodes ψ(1) = a , ψ(2) =ψ(3) = b, and ψ(4) =ψ(5) = c andon the edges ψ(1→ 1) = a→ a , ψ(1→ 2) =ψ(1→ 3) = a→ b,ψ(2a 2) =ψ(3a 3) = b a b, and ψ(2→ 4) =ψ(3→ 5) = b→ c.Thus, the fibers partition the graph G as Π = {Πa , Πb , Πc},where Πa = {1}, Πb = {2, 3}, and Πc = {4, 5}.
We represent the dynamics by two functions k(x ) and g(x )modeling degradation and synthesis of gene product, respectively(9, 10). For example, k(x ) can be modeled as a linear degrada-tion term and gi(x ) as a Hill function (i =A,R, activation orrepression) (9). We consider that multiple inputs are combinedby multiplying functions g(x ), but any other way of combininginputs can be used. Then, the dynamics of the expression levelsof the genes in the circuit are described by ref. 14:
dx1dt
=−k(x1) + gA(x1)dx2dt
=−k(x2) + gA(x1) ∗ gR(x2)dx3dt
=−k(x3) + gA(x1) ∗ gR(x3)dx4dt
=−k(x4) + gA(x2)dx5dt
=−k(x5) + gA(x3).
[2]
The dynamics of the base are described by the state vector of thebase: (ya(t), yb(t), yc(t)) with dynamical equations (16):
dyadt
=−k(ya) + gA(ya)dybdt
=−k(yb) + gA(ya) ∗ gR(yb)dycdt
=−k(yc) + gA(yb).
[3]
If (ya(t), yb(t), yc(t)) is a solution for the base Eq. 3, then themap Pψ sends the phase space of this base to the phase space ofthe solutions in the graph G (16):
(x1(t), x2(t), x3(t), x4(t), x5(t))
=Pψ [ya(t), yb(t), yc(t)]= (ya(t), yb(t), yb(t), yc(t), yc(t)).[4]
Therefore, the graph G sustains a polysynchronous subspace (seefor instance motivating example 1.4 in ref. 15):
∆Π ={
(x1, x2, x3, x4, x5)∈R5 | x1(t), x2(t) = x3(t), x4(t)
= x5(t)}. [5]
This result can be corroborated by simply plugging(x1(t), x2(t), x3(t) = x2(t), x4(t), x5(t) = x4(t)) into Eq. 2to obtain a solution of the dynamics, implying the synchronyx2(t) = x3(t) in fiber Πb and x4(t) = x5(t) in fiber Πc . Wenote that the concept of sheaves and stacks might be usefulto generalize the symmetry fibration framework to multiplexnetworks.
We test this gene synchronization with publicly available tran-scription profile experiments available from the literature. Weuse gene expression data profiles in E. coli compiled at Ecomics:http://prokaryomics.com (30). This portal collects microarrayand RNA-seq experiments from different sources such as theNCBI Gene Expression Omnibus (GEO) public database (31)and ArrayExpress (32) under different experimental growth con-ditions. The data are also compiled at the Colombos web portal(33). The database contains transcriptome experiments measur-ing the expression level of 4,096 genes in E. coli strains over 3,579experimental conditions which are described as strain, medium,stress, and perturbation. Raw data are preprocessed to obtainexpression levels by using noise reduction and bias correction tonormalize data across different platforms (30).
E. coli can adapt its growth to the different conditions that itfinds in the medium. This adaptation is made by sensing extraand intracellular molecules and using them as effectors to acti-vate or repress transcription factors. This implies that the differ-ent fibers are activated by specific experimental conditions. TheEcomics portal allows one to obtain those experimental condi-tions where a set of genes has been significantly expressed undera particular set of conditions. We perform standard gene expres-sion analysis (http://colombos.net and ref. 33) of the expressionlevels in E. coli obtained under these conditions.
For a given set of genes in a fiber, we find the experimentalconditions for which the genes have been significantly expressedby comparing the expression samples over the 1,576 differentWT growth conditions. Following ref. 33, the experimental con-ditions are ranked with the inverse coefficient of variation (ICV)defined as ICVk = |µk |/σk , where µk is the average expressionlevel of the genes in the condition k and σk is the SD. Follow-ing ref. 33, we select those conditions with ICVk > 〈 ICVk 〉, i.e.,where the average expression levels in the particular conditionk are significantly higher than the SD. This score reflects thefact that, in a relevant condition, the genes show an incrementof their expression above the individual variations caused by ran-dom noise. Details on the expression analysis can be found in ref.33 and https://doi.org/10.1371/journal.pone.0020938.s001. Thus,we obtain expression levels organized by the relevant experimen-tal conditions which are labeled according to the GEO database(31). From these data, we calculate the coexpression matrix usingthe Pearson correlation coefficient between the expression lev-els of two genes i and j in the relevant conditions for genes ina fiber. For off-diagonal correlations between genes in differentfibers, we use the combined sets of conditions of both genes.
Results for the correlation matrix are shown in Fig. 2 A,Bottom for fibers regulated by the crp-fis strongly connected com-ponent. Gene expression is obtained for every gene, so we plotthe correlation matrix calculated over each pair of genes. Genesthat belong to the same operon are transcribed as a single unitby the same mRNA molecule, so these genes are expected totrivially synchronize (variations exist due to attenuators insidethe operon). Thus, we group together these genes as operonsin Fig. 2A to indicate this trivial synchronization. To test theexistence of fiber synchronization we compare gene coexpres-sion belonging to different operons. Fig. 2 A, Bottom showsthat expression levels of the genes that belong to a fiber arehighly correlated as predicted by the symmetry fibration. Genesthat belong to different fibers show no significant correlationsamong them. In particular, there is no significant correlationbetween the expression of genes in a given fiber and the twomaster regulators crp and fis. This result is consistent with thefibration symmetry and occurs despite the fact that both crpand fis directly regulate all genes in the studied fibers. We findsome off-diagonal weak correlations between fibers (e.g., malI),probably indicating missing links or missing regulatory processesthat produce extra synchronizations. Some genes present weakcorrelations inside fibers (e.g., cirA), indicating weak symmetry
Morone et al. PNAS | April 14, 2020 | vol. 117 | no. 15 | 8313
Dow
nloa
ded
by g
uest
on
June
11,
202
0
breaking probably from asymmetries in the strength of bindingrate of transcription factors or input functions, effects that arenot considered in the topological view of the input trees and canlead to desynchronization inside the fiber.
DiscussionFibration symmetries make sure that genes are turned on andoff at the right amount to ensure the synchronization of expres-sion levels in the fiber needed to execute cellular functions. Inthe fibration framework, network function can be pictured asan orchestra in which each instrument is a gene in the net-work. When the instruments play coherently, with structuredtemporal patterns, the network is functional. Here we have con-centrated on the simplest temporal organization, one in whichsome units (instruments) act synchronously in time, a ubiquitouspattern observed in all biological networks. Our findings iden-tify the symmetries that predict this synchronization and give riseto functionally related genes from the fibrations of the geneticnetwork.
Unlike network motifs which are identified by statistical over-representation (2), fibers in biology arise from principles of
symmetries following the tradition of how the building blocks ofelementary particles have being discovered in physics and geom-etry (5). Our first principle approach to identify building blocksis based on the circuit’s theoretical and practical (rather than sta-tistical) significance to serve minimal forms of coherent functionand logic computation.
Further results shown in ref. 34 indicate that symme-tries also describe the structure of neural connectomes andthese symmetries factorize according to function. Thus, sym-metries can be used to systematically organize biologicaldiversity into building blocks using invariances in the infor-mation flow encoded in the topologies of the input trees.Genes related by symmetries are coexpressed, thus provid-ing a functional rationale for the biological existence of thesesymmetries.
ACKNOWLEDGMENTS. Research was sponsored by Grants NIH-NationalInstitute of General Medical Sciences R01EB022720, NIH-National CancerInstitute U54CA137788/U54CA132378, NSF-Information and Intelligent Sys-tems 1515022, and NSF-Division of Materials Research 1308235. We thankL. Parra, W. Liebermeister, C. Ishida, M. Sanchez, and J. D. Farmer fordiscussions.
1. L. H. Hartwell, J. J. Hopfield, S. Leibler, A. W. Murray, From molecular to modular cellbiology. Nature 402, C47–C52 (1999).
2. U. Alon, An Introduction to Systems Biology: Design Principles of Biological Circuits(CRC Press, Boca Raton, FL, 2006).
3. M. Gell-Mann, The Quark and the Jaguar (Holt Paperbacks, New York, NY, 1994).4. J. D. Dixon, B. Mortimer, “Permutation groups” in Graduate Texts in Math-
ematics, S. Axler, K. Ribet, Eds. (Springer-Verlag, New York, NY, 1996),vol. 163.
5. S. Weinberg, The Quantum Theory of Fields (Cambridge University Press, Cambridge,UK, 2005).
6. R. Milo et al., Network motifs: Simple building blocks of complex networks. Science298, 824–827 (2002).
7. M. Buchanan, G. Caldarelli, P. De Los Rios, F. Rao, M. Vendruscolo, Eds.,Networks in Cell Biology (Cambridge University Press, Cambridge, UK,2010).
8. S. S. Shen-Orr, R. Milo, S. Mangan, U. Alon, Network motifs in the tran-scriptional regulation network of Escherichia coli. Nat. Genet. 31, 64–68(2002).
9. G. Karlebach, R. Shamir, Modeling and analysis of gene regulatory networks. Nat.Rev. Mol. Cell Biol. 9, 770–780 (2008).
10. E. Klipp, W. Liebermeister, C. Wierling, A. Kowald, Systems Biology (Wiley-VCH,Weinheim, Germany, 2016).
11. S. Gama-Castro et al., RegulonDB version 9.0: High-level integration of gene regu-lation, coexpression, motif clustering and beyond. Nucleic Acids Res. 44, D133–D143(2016).
12. A. Grothendieck, Technique de descente et theoremes d’existence en geometriealgebrique, I. Generalites. Descente par morphismes fidelement plats. Seminaire N.Bourbaki 5, 299–327 (1958–1960).
13. P. Boldi, S. Vigna, Fibrations of graphs. Discrete Math. 243, 21–66 (2001).14. M. Golubitsky, I. Stewart, Nonlinear dynamics of networks: The groupoid formalism.
Bull. Am. Math. Soc. 43, 305–364 (2006).15. L. DeVille, E. Lerman, Modular dynamical systems on networks. J. Eur. Math. Soc. 17,
2977–3013 (2015).16. E. Nijholt, B. Rink, J. Sanders, Graph fibrations and symmetries of network dynamics.
J. Differ. Equ. 261, 4861–4896 (2016).17. D. M. Abrams, L. M. Pecora, A. E. Motter, Focus issue: Patterns of network
synchronization. Chaos 26, 094601 (2016).
18. L. M. Pecora, F. Sorrentino, A. M. Hagerstrom, T. E. Murphy, R. Roy, Cluster synchro-nization and isolated desynchronization in complex networks with symmetries. Nat.Commun. 5, 4079 (2014).
19. F. Sorrentino, L. M. Pecora, A. M. Hagerstrom, T. E. Murphy, R. Roy, Complete charac-terization of the stability of cluster synchronization in complex dynamical networks.Sci. Adv. 2, e1501737 (2016).
20. I. Stewart, M. Golubitsky, M. Pivato, Symmetry groupoids and patterns of synchronyin coupled cell networks. SIAM J. Appl. Dyn. Syst. 2, 609–646 (2003).
21. A. Arenas, J. K. A. Dıaz-Guilera, Y. Moreno, C. Zhou, Synchronization in complexnetworks. Phys. Rep. 469, 93–153 (2008).
22. F. A. Rodrigues, T. K. Peron, P. Ji, J. Kurths, The Kuramoto model in complex networks.Phys. Rep. 610, 1–98 (2016).
23. S. Strogatz, Nonlinear Dynamics and Chaos: With Applications to Physics, Biology,Chemistry, and Engineering (Westview Press, Boulder, CO, 2000).
24. A. Cardon, M. Crochemore, Partitioning a graph in O(|A| log2 |V|). Theor. Comput.Sci. 19, 85–98 (1982).
25. H. Kamei, P. J. A. Cock, Computational of balanced relations and their lattice for acoupled cell network. SIAM J. Appl. Dyn. Syst. 12, 352–382 (2013).
26. N. Norris, Universal covers of graphs: Isomorphism to depth n - 1 implies isomorphismto all depths. Discrete Appl. Math. 56, 61–74 (1995).
27. OEIS Foundation Inc. (2020), The On-Line Encyclopedia of Integer Sequences.http://oeis.org/A003269. Accessed 6 March 2020.
28. M. Gardner, The Scientific American Book of Mathematical Puzzles and Diversions(Simon & Schuster, 1961), vol. II, p. 101.
29. M. Girvan, M. E. J. Newman, Community structure in social and biological networks.Proc. Natl. Acad. Sci. U.S.A. 99, 7821–7826 (2002).
30. M. Kim et al., Multi-omics integration accurately predicts cellular state in unexploredconditions for Escherichia coli. Nat. Commun. 7, 13090 (2016).
31. T. Barrett et al., NCBI GEO: Archive for functional genomics data sets– update. NucleicAcids Res. 41, D991–D995 (2016).
32. N. Kolesnikov et al., ArrayExpress update: Simplifying data submissions. Nucleic AcidsRes. 43, D1113–D1116 (2015).
33. M. Moretto et al., COLOMBOS v3.0: Leveraging gene expression compendia for cross-species analyses. Nucleic Acids Res. 44, D620–D623 (2016).
34. F. Morone, H. A. Makse, Symmetry group factorization reveals the structure-functionrelation in the neural connectome of Caenorhabditis elegans. Nat. Commun. 10, 4961(2019).
8314 | www.pnas.org/cgi/doi/10.1073/pnas.1914628117 Morone et al.
Dow
nloa
ded
by g
uest
on
June
11,
202
0