Embed Size (px)
Citation preview
www.PitNews.com
PitNews.com Magazine August 2012
Fibonacci Fan Fareby Gene Nowell
Basics of Spread Trading in the Futures Marketby Kent Kofoed
PitNews.com Magazine August 20122
Fiboncci an are
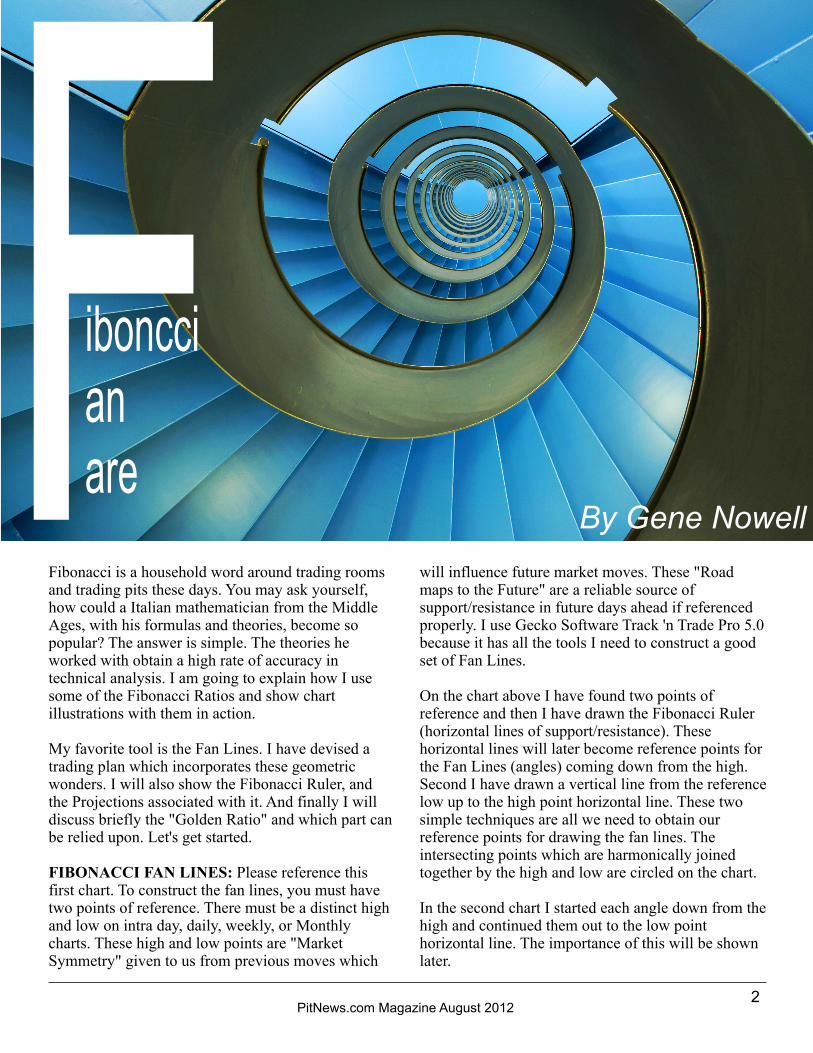
Fibonacci is a household word around trading rooms and trading pits these days. You may ask yourself, how could a Italian mathematician from the Middle Ages, with his formulas and theories, become so popular? The answer is simple. The theories he worked with obtain a high rate of accuracy in technical analysis. I am going to explain how I use some of the Fibonacci Ratios and show chart illustrations with them in action. My favorite tool is the Fan Lines. I have devised a trading plan which incorporates these geometric wonders. I will also show the Fibonacci Ruler, and the Projections associated with it. And finally I will discuss briefly the "Golden Ratio" and which part can be relied upon. Let's get started. FIBONACCI FAN LINES: Please reference this first chart. To construct the fan lines, you must have two points of reference. There must be a distinct high and low on intra day, daily, weekly, or Monthly charts. These high and low points are "Market Symmetry" given to us from previous moves which
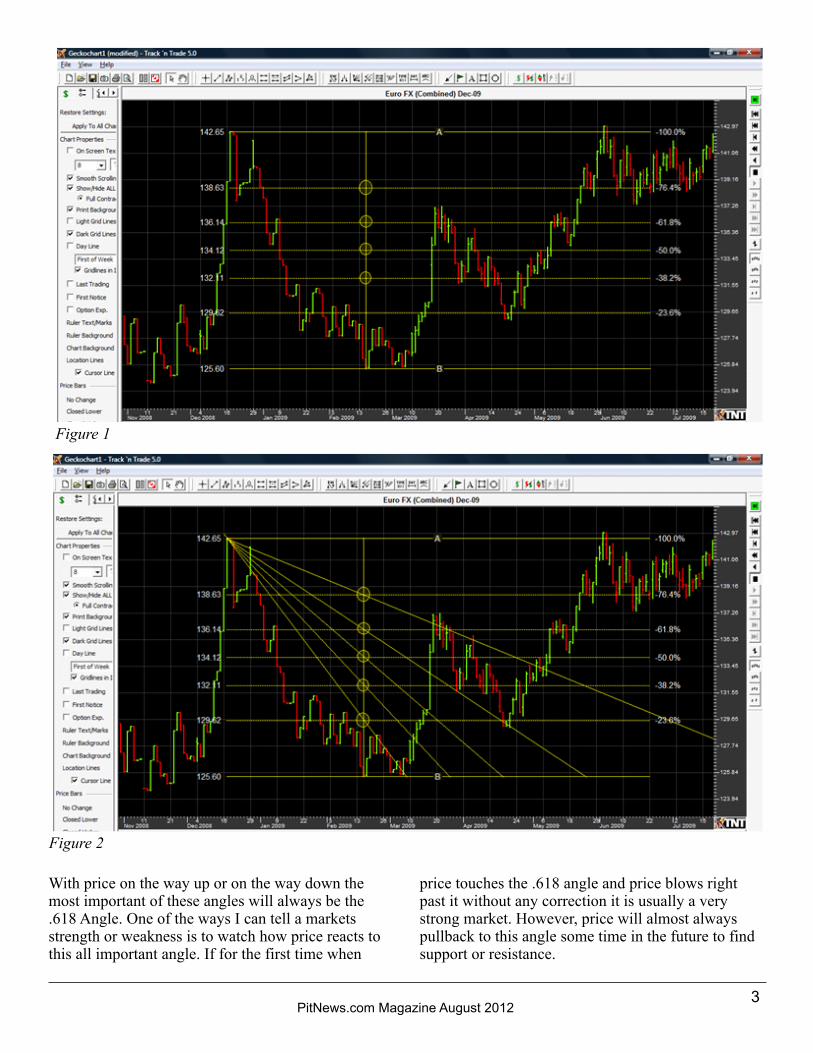
will influence future market moves. These "Road maps to the Future" are a reliable source of support/resistance in future days ahead if referenced properly. I use Gecko Software Track 'n Trade Pro 5.0 because it has all the tools I need to construct a good set of Fan Lines. On the chart above I have found two points of reference and then I have drawn the Fibonacci Ruler (horizontal lines of support/resistance). These horizontal lines will later become reference points for the Fan Lines (angles) coming down from the high. Second I have drawn a vertical line from the reference low up to the high point horizontal line. These two simple techniques are all we need to obtain our reference points for drawing the fan lines. The intersecting points which are harmonically joined together by the high and low are circled on the chart. In the second chart I started each angle down from the high and continued them out to the low point horizontal line. The importance of this will be shown later.
By Gene Nowell
PitNews.com Magazine August 20123
With price on the way up or on the way down the most important of these angles will always be the .618 Angle. One of the ways I can tell a markets strength or weakness is to watch how price reacts to this all important angle. If for the first time when
price touches the .618 angle and price blows right past it without any correction it is usually a very strong market. However, price will almost always pullback to this angle some time in the future to find support or resistance.
Figure 1
Figure 2
PitNews.com Magazine August 20124
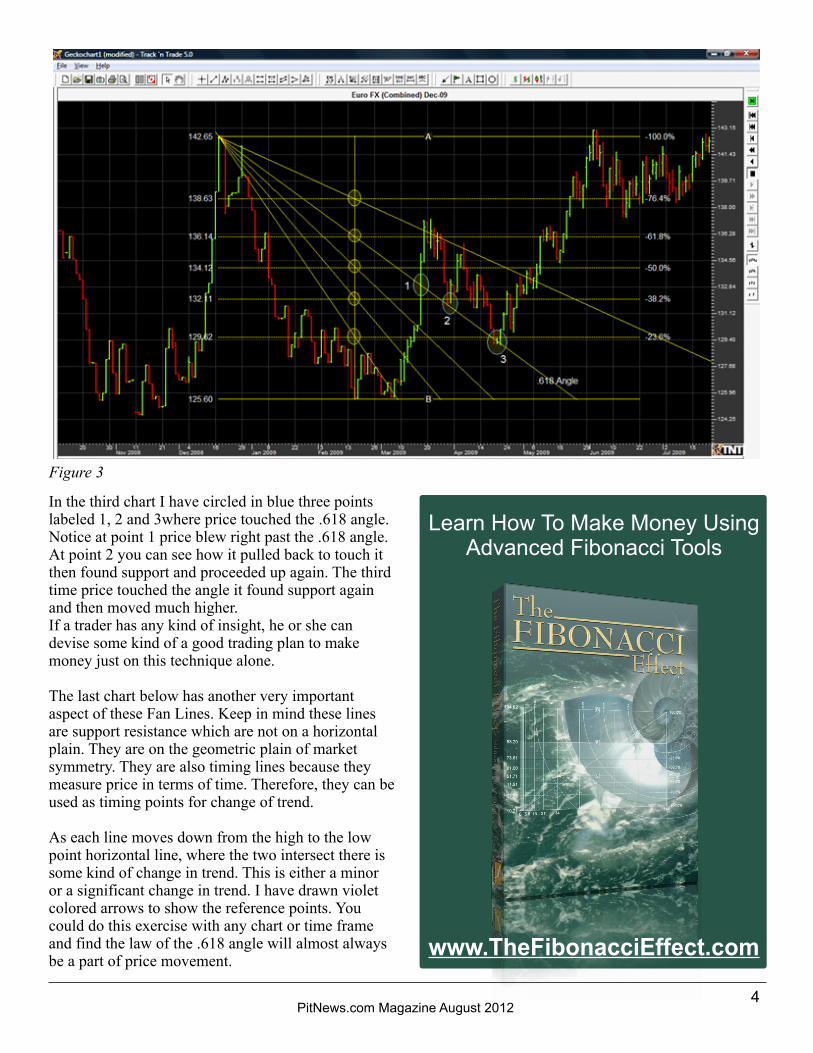
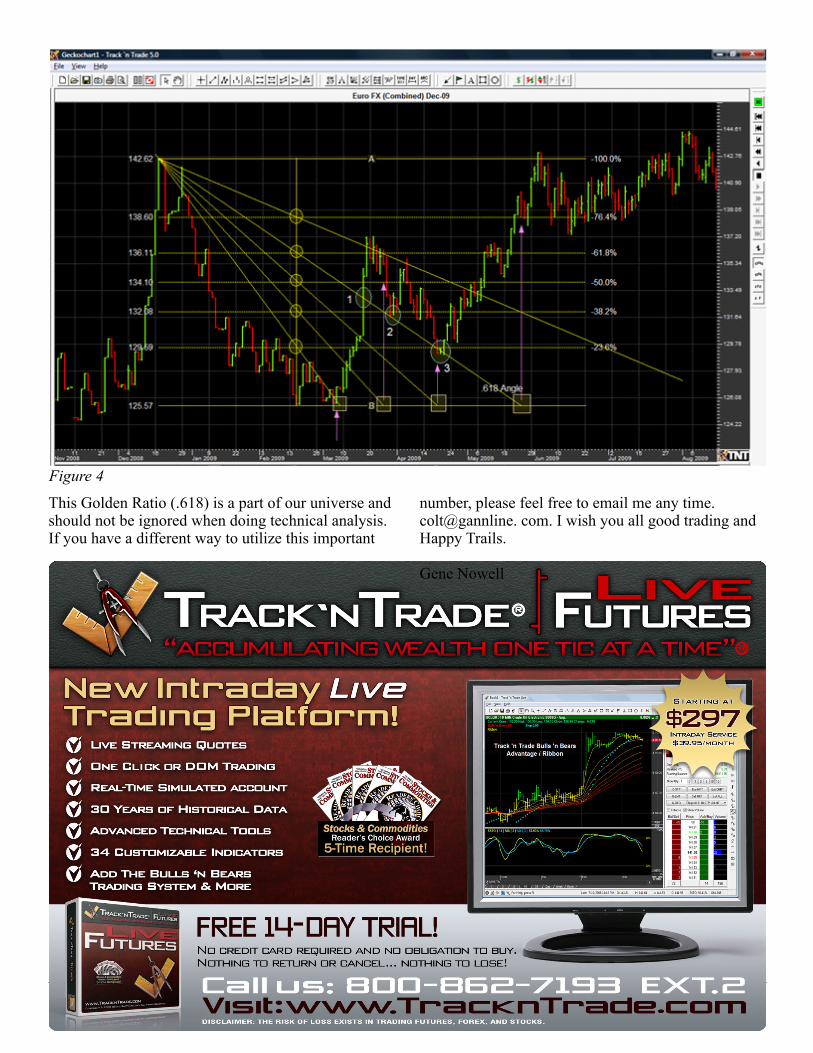
In the third chart I have circled in blue three points labeled 1, 2 and 3where price touched the .618 angle. Notice at point 1 price blew right past the .618 angle. At point 2 you can see how it pulled back to touch it then found support and proceeded up again. The third time price touched the angle it found support again and then moved much higher. If a trader has any kind of insight, he or she can devise some kind of a good trading plan to make money just on this technique alone. The last chart below has another very important aspect of these Fan Lines. Keep in mind these lines are support resistance which are not on a horizontal plain. They are on the geometric plain of market symmetry. They are also timing lines because they measure price in terms of time. Therefore, they can be used as timing points for change of trend. As each line moves down from the high to the low point horizontal line, where the two intersect there is some kind of change in trend. This is either a minor or a significant change in trend. I have drawn violet colored arrows to show the reference points. You could do this exercise with any chart or time frame and find the law of the .618 angle will almost always be a part of price movement.
Figure 3
Learn How To Make Money Using Advanced Fibonacci Tools
www.TheFibonacciEffect.com
PitNews.com Magazine August 20125
This Golden Ratio (.618) is a part of our universe and should not be ignored when doing technical analysis. If you have a different way to utilize this important
Figure 4
number, please feel free to email me any time. colt@gannline. com. I wish you all good trading and Happy Trails. Gene Nowell
PitNews.com Magazine August 20126
Basics of Spread Trading in the Futures Market: Futures spread trading is, essentially, the buying and selling of similar futures contracts, simultaneously, in order to profit off of the change in the difference in price (i.e., the "spread") between the contracts. The "spread," which is the price differential between the two contracts, can either converge (narrow) or diverge (widen), and depending on which type of spread the trader has "put on" this can be both a good and a bad thing. When the trader is "buying the spread," the trader will purchase the more expensive contract and sell the less expensive contract, and, therefore, the trader will want the spread to widen (i.e., the price of the long position increases relatively more than the short position, or the price of the short position decreases relatively more than the long position). Inversely, "selling the spread" is when the trader sells the more expensive contract and purchases the less expensive contract, and, therefore, the trader benefits when the spread narrows (i.e., the price of the short position declines relatively more than the long position, or the price of the long position increases relatively more than the short position). Lastly, since the trader is both long and short similar contracts, this type of trade is considered to be a "market-neutral" trade in the sense that the direction of the underlying market is more or less irrelevant to the trader and the gain (or loss) from the
trade comes from the change in the relative price between the contracts (i.e., the trader is assuming the risk of a change in the price differential between the two contracts). Spread Trading Characteristics: Since the trader who has put on a spread is both long and short a similar contract, the volatility of the spread is typically lower than the individual volatility of the individual contracts, and this is due to the fact that the overall fundamentals of the commodity (or asset) will typically affect both contracts in similar ways due to correlation. Since there is less volatility inherent in spread trades, typically, the margin requirements that are associated with spread trades will usually be lower, when compared to the margin requirements of the individual contracts that make up the trade (as a quick side note, when certain types of spreads have lower margin requirements they are called "exchange recognized spreads," and the contracts that make up the spread trade are called the "legs" of the trade). The relatively smaller margin requirement inherent in spread trades means that the position has a greater amount of leverage than it otherwise would; however, since spread trades typically have less volatility, the increase in the leverage should be, mostly, offset by the decrease in volatility.
Basics of Spread Trading in the Futures Market
By Kent Kofoed
PitNews.com Magazine August 20127
Spread trading strategies, additionally, are considered to be more "off the beaten path" due to the fact that relatively fewer traders trade this type of strategy, which means that there is less competition, less efficiency, and more opportunities to profit. One of the main reasons why spread trading is less popular, when compared to long- or short-only trades, is mostly due to the reduced volatility inherent in this type of strategy. Additionally, the potential payoff of a spread trade will typically be smaller (due to the lower risk) and this also has an impact on the number of traders implementing this type of strategy. Lastly, even though risk is typically lower, due to the correlation between the contracts, risk can also be magnified, if the contracts trade in the "wrong" direction (i.e., the spread converges when it is supposed to widen or the spread diverges when it is supposed to narrow). However, on the other hand, if both trades trade in the "right" direction then the gains will be in the trader's favor and could end up producing an enormous return.
Types of Spread Trades: There are three main types of spreads, depending on various factors, and these types include intra-market spreads, inter-market spreads, and inter-commodity spreads. Even though their names might be somewhat confusing, the different types of spreads are relatively intuitive and should be easy to remember, after you know the differences between them. An intra-market spread, which is also known as a calendar spread or an inter-delivery spread, is a spread where the trader goes long a futures contract that expires in a given month while going short a different futures contract that expires in a different month. For example, if a trader simultaneously goes long a July Wheat contract and short a December Wheat contract this would be considered an intra-market spread. Inter-market spreads, which are also known as inter-exchange spreads, is when a trader simultaneously goes long a contract that is traded on one exchange while going short a contract that is traded on a different exchange. For example, if a trader was to go long a July CBOT wheat contract
www.TracknTrade.com
•Easily generate an easy-to-read spread chart
• Place orders directly on the
spreads chart • Calculate your daily profits with
the Historical Trade Simulator
How Can Trading Spreads Reduce Risk?
PitNews.com Magazine August 20128
(the wheat contract that is traded on the Chicago Board of Trade) while, simultaneously, going short a July KCBT wheat contract (the wheat contract that is traded on the Kansas City Board of Trade), this would be considered an inter-market spread. Lastly, inter-commodity spreads are when traders simultaneously go long a futures contract on one commodity, while going short a futures contract on a different (related) commodity. For example, if a trader trades the differential between crude oil and either gasoline or heating oil (also known as the "crack" spread), or the differential between soybeans and either soybean meal or soybean oil (also known as the "crush" spread), these would be considered to be an inter-commodity spread. A good way to remember the difference between each of these types of spreads is to think about their names in relation to the definition of intra, for the intra-commodity spread, and the definition of inter, for the inter-market and inter-commodity spreads (inter is defined as "among" or "between," while intra is defined as "within" or "during"). So, an intra-market spread is traded within the same market but during different months, while an inter-market spread allows you to trade between two different markets and an inter-commodity spread allows you to trade between two different types of commodities. Remembering the difference between the definitions of intra and inter helps make things a little bit easier to remember; however, you can also call them calendar spreads, exchange spreads, and commodity spreads, as well. Example of a Spread Trade: In order to provide a spread trade example, I am going to look at an inter-market spread between July CBOT wheat and July KCBT wheat. There are two main types of wheat, which includes "winter" wheat and "spring" wheat, and both of these can be further broken down into hard red winter, hard red spring, hard white, soft red winter and soft white. Hard red winter wheat is traded at the Kansas City Board of Trade while soft red winter wheat is traded at the Chicago Board of Trade, and going long one of these contracts while shorting the other is, by definition, an inter-market spread (or inter-exchange spread). Depending on what the current price differential is, and the view that the trader has, the trader will either "buy the spread" or "sell the spread." Lastly, since Chicago wheat is used in cakes and pastries while KCBT wheat is used in bread, the supply and demand
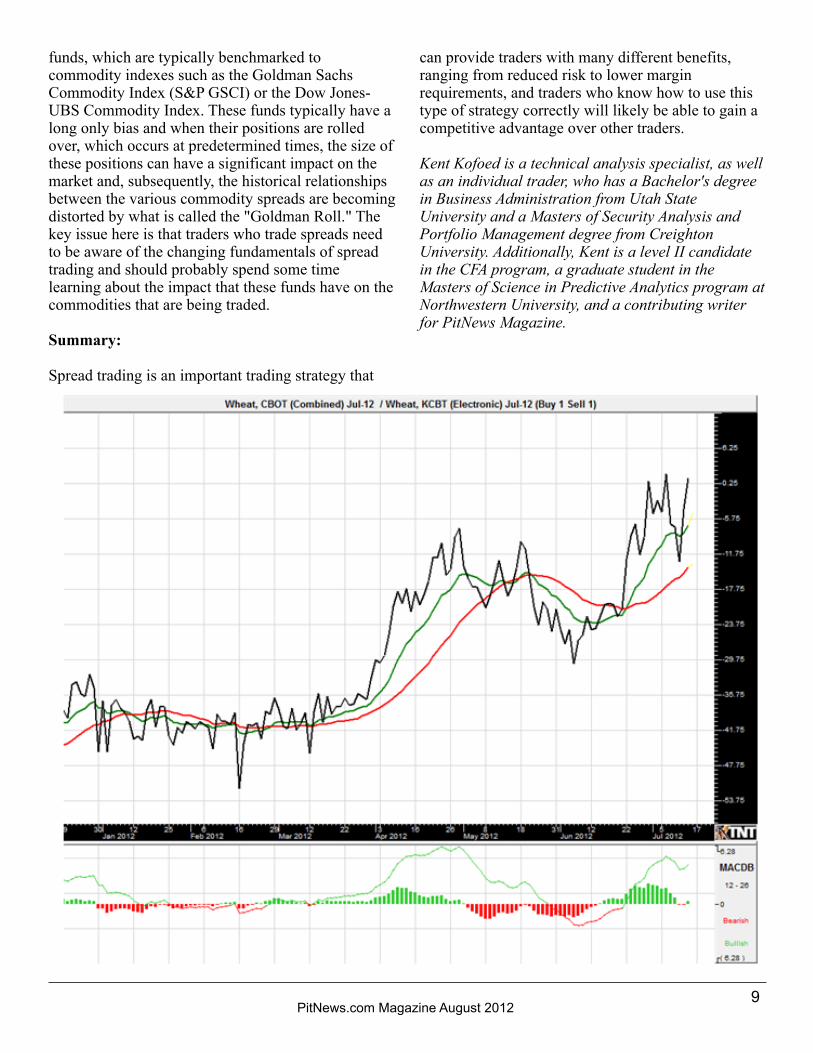
for those products can sometimes impact the prices of the different wheat contracts in different ways, so paying attention to the relationship between the fundamentals of each contract is imperative. Spread Trading Technicals & Fundamentals: The same technical analysis techniques that are used to trade outright futures contracts can also be used when trading spreads. The price differential (i.e., the spread) can, for the most part, be charted just like any other futures contract, but the main difference is that spread charts are typically line charts with daily time periods (as opposed to bar charts or candlestick charts with differing time periods). Most of the typical technical analysis tools, such as moving averages an7 the MACD indicator, can be used to analyze historical price action; however, some technical analysis tools, such as volume bars, are unable to be calculated due to their dependence on data that only comes from individual contracts. See Figure 1-1 for an example of a typical "spread" chart, which includes both the MACD indicator and the Advantage Lines indicator.The fundamentals of the underlying commodities, such as seasonals or various supply/demand issues, still apply when trading spreads; however, traders need to think about things a little bit differently. Instead of focusing on the fundamental issues related to the individual commodities, it is best to analyze things from the perspective of how a certain fundamental factor will impact the relationship between each of the commodities. For example, if a trader is trading the crack spread (i.e., the spread that consists of crude oil and, typically, either gas or heating oil), the trader will need to look at the seasonal price differentials between fuels that are used for heating (heating oil, kerosene, etc.) and fuels that are used for transportation (gasoline, diesel, etc.). Since all of these products are produced from crude oil, refineries will, sometimes, vary their production levels in order to meet changing demand, which will impact the various market prices differently. Lastly, as mentioned previously, the fundamentals of each of these commodities will need to be analyzed because the spread between the commodities determines the profit, not the direction of the overall market. The "Commodity Roll" and Changing Spread Fundamentals: Many of the fundamental assumptions of spread trading have been distorted by the various commodity
PitNews.com Magazine August 20129
funds, which are typically benchmarked to commodity indexes such as the Goldman Sachs Commodity Index (S&P GSCI) or the Dow Jones-UBS Commodity Index. These funds typically have a long only bias and when their positions are rolled over, which occurs at predetermined times, the size of these positions can have a significant impact on the market and, subsequently, the historical relationships between the various commodity spreads are becoming distorted by what is called the "Goldman Roll." The key issue here is that traders who trade spreads need to be aware of the changing fundamentals of spread trading and should probably spend some time learning about the impact that these funds have on the commodities that are being traded. Summary: Spread trading is an important trading strategy that
can provide traders with many different benefits, ranging from reduced risk to lower margin requirements, and traders who know how to use this type of strategy correctly will likely be able to gain a competitive advantage over other traders. Kent Kofoed is a technical analysis specialist, as well as an individual trader, who has a Bachelor's degree in Business Administration from Utah State University and a Masters of Security Analysis and Portfolio Management degree from Creighton University. Additionally, Kent is a level II candidate in the CFA program, a graduate student in the Masters of Science in Predictive Analytics program at Northwestern University, and a contributing writer for PitNews Magazine.
E-Store
E-Store
To sell an item in the PitNews.com estore contact us at 1.800.526.3019 or email [email protected]
Charting Software
Track ‘n Trade Forex Live
Trade the currency market with the best tools and the easiest order placement available! Free data for active traders.
Track ‘n Trade Futures Live
FREE 14 Day Trial Price: $297Data: $39.95/month
This amazing charting software package gives you the ability to analyze commodity markets technically with various tools, unique market calculators, and customizable indicators.
FREE 14 Day Trial Price: $297Data: Free (Active Traders)
Track ‘n Trade 5.0 Free 14 Day Trial Price: $197Data: $19.95/month *Get Advanced Tools Plug-in FREE when you buy TNT 5.0
This amazing charting software package gives you the ability to analyze commodity markets technically with various tools, unique market calculators and customizable indicators.
Charting Software
TNT High Finance FREE 14 Day Trial Price: $197
Data: $29.95/month
Trading Education It seems that we spend 90% of our time studying and trying to figure out the best timing techniques for market entry, but we spend very little time actually learning the techniques of exiting the market. Getting into a market is easy, but getting out of the market, with a profit, is the true test of a traders skill.
Learn how, and what to count, and how and what to measure, and how to read each new setup, and how to set up a trigger, then how to follow through with the final exit strategy. Stop watching your portfolio shrink, and start doing something about it? Learn what you can do, in the next 10 days, to protect your wealth!
Accurately identify trends and market cycles with TradeMiner! Get above average market returns with significantly lower average risk by only taking the highest probability trades!
Learn More
Learn More
Learn More
Learn More
Track ‘n Trade High Finance Stock Trading package allows a trader to monitor, track and chart the popular stock market, giving the trader intra day snapshots and price activity throughout the day.
Learn More
Learn More
Learn More
Welcome to the PitNews.com Estore. Below are products featured from the online store, click on them to learn more.

Classifieds
Classifieds
To place a classified ad contact PitNews.com at 1.800.526.3019 or email [email protected]
Welcome to the Classified Section of the PitNews.com Magazine. All listings below are “clickable”.
FX Trading Platform
Track ‘n Trade Forex Live
Company: Gecko SoftwareWebsite: www.TracknTrade.comMarket: Forex TradingPhone: (800) 862.7193 Trade the currency market with the best tools and the
easiest order placement available! Free data for active traders.
Click Here for a FREE 14 Day Trialwww.TracknTrade.com
Futures Software
Track ‘n Trade Futures Live
Company: Gecko SoftwareWebsite: www.TracknTrade.comMarket: Futures Phone: (800) 862.7193
This amazing charting software package gives you the ability to analyze commodity markets technically with various tools, unique market calculators, and customizable indicators.
Click Here for a FREE 14 Day Trialwww.TracknTrade.com
Educational Websites PerosnalInvestorsHr.com www.PersonalInvestorsHr.comPhone: (800) 862.7193Listen and learn from the best in the business!Click Here
ChartBook.comPhone: (800) 862.7193Free Forex Quotes and Charts online. Apply indicators easily, great charts, check it out! Click Here
PitNews.comPhone: (800) 862.7193Get all your current Forex, Futures and Stocks news in one Place! Click Here CommitmentofTraders.comPhone: (800) 862.7193Learn to apply Commitment of Traders reports to your trading. Examples using Track ‘n Trade. Click Here StockAnnual.comPhone: (800) 862.7193StockAnnual.com was designed to discover and exploit recurring historical market patterns.Click Here
TheWall.PitNews.comPhone: (800) 862.7193Open forum for traders, visit today to share your trading ideas and post charts. Click Here
ThePitMaster.comPhone: (800) 862.7193Great site for beginning futures and options traders. Free education on option strategies and more! Click Here
WhyTradeFutures.com Phone: (800) 862.7193Learn why you would want to trade futures market. Compare the Futures market to the Stock market. Click Here
Educational Websites
GeckoSoftware.comPhone: (800) 862.7193Six time winner of Stocks & Commodities Readers Choice Award. Take a FREE Trial! Click Here


![[Trading] Fibonacci Trader Gann Swing Chartist Dynamic Fibonacci Channels](https://img.pdfslide.us/doc/110x75/55cf9d87550346d033ae02c7/trading-fibonacci-trader-gann-swing-chartist-dynamic-fibonacci-channels.jpg)