Embed Size (px)
Citation preview

D
Fiber Sensing Based on New Structures and Post-Processing Enhancement Marta Sofia dos Anjos Ferreira
Physics Physics Department 2015 Supervisor Orlando José dos Reis Frazão, Invited Assistant Professor, FCUP Co-supervisor José Luís Campos de Oliveira Santos, Full Professor, FCUP


FACULDADE DE CIÊNCIAS DA UNIVERSIDADE DO PORTO
FIBER SENSING BASED ON NEW STRUCTURES
AND POST-PROCESSING ENHANCEMENT
Marta Sofia dos Anjos Ferreira
Thesis submitted to Faculdade de Ciências da Universidade do Porto in partial
fulfillment of the requirements for the degree of Ph.D. in Physics
This Thesis was conducted under the supervision of
Dr. Orlando José dos Reis Frazão
Invited Assistant Professor of Departamento de Física e Astronomia da
Faculdade de Ciências da Universidade do Porto
and
Prof. Dr. José Luís Campos de Oliveira Santos
Full Professor of Departamento de Física e Astronomia da Faculdade
de Ciências da Universidade do Porto


Bolsa de investigação da Fundação para a Ciência e a Tecnologia com a referência
SFRH/BD/76965/2011, financiada pelo POPH – QREN – Tipologia 4.1 – Formação
Avançada, comparticipada pelo Fundo Social Europeu e por fundos nacionais do
MCTES.


Dedicated to my Mom


FCUP
Fiber Sensing Based on New Structures and Post-Processing Enhancement
ix
ACKNOWLEDGMENTS
I would like to express my deepest gratitude to my supervisor, Dr. Orlando Frazão,
for challenging me to pursue the dream of performing investigation in a highly
technological field. His help, his knowledge and insight were decisive for the
development of this work. To my co-supervisor, Professor José Luís Santos, who was a
source of inspiration ever since I started working at INESC. His wise words and the
valuable discussions allowed me to grow not only as a physicist, but also as a human
being. Thank you, Professor.
Professor António Pereira Leite thank you for all the valuable help in reviewing this
Thesis.
I would also like to acknowledge all my colleagues at INESC, companions on this
journey, who gave me constant care and supported me right from start. Many thanks,
Ricardo Silva, Paula Tafulo, Luís Coelho, Raquel Queirós, Carlos Gouveia, Paulo Caldas,
João Moura, Ivo Nascimento, Rita Ribeiro, Susana Silva and Lídia Carvalho. Thank you,
Paulo Roriz and Ricardo André, for those wonderful days in the lab. A special hug for
you both! You rock!
Thanks to all the senior researchers at INESC for the constant support and attention.
To dearest Luísa, such an important figure in our inescian lives! Thank you all for the
kind words, the smiles, the help and patience.
Throughout this four-year journey, I was fortunate to travel and meet different
research groups. I would like to acknowledge Professor Kate Sugden, from the group of
Aston Institute of Photonic Technologies, in Birmingham, England. I would also like to
thank Dr. Graham Lee and Dr. Neil Gordon. It was such a pleasure to work with you! To
Dr. Kaiming Zhou, my deepest thanks for making the lab available for me. Finally, I
would like to thank Dr. Mykhaylo Dubov, for the cup of tea and the discussion that
changed the way I saw my research.
To my dearest German friends at the Leibnitz Institute of Photonic Technology, in
Jena, I am profoundly grateful. To Dr. Kay Schuster, who always welcomed and trusted
in me. Thanks to Dr. Jörg Bierlich, for all the nice moments, the conversations and

FCUP
Fiber Sensing Based on New Structures and Post-Processing Enhancement
x
knowledge sharing. Thanks to Dr. Jens Kobelke, for all the valuable discussions, and for
always trying to meet my requests. Thanks to Dr. Martin Becker, for helping in the
writing of the fiber Bragg gratings. My deepest thanks to Dr. Anka Schwuchow, to
Mathias, to Lara and Lena, for making me feel so welcome.
I would also like to acknowledge INESC TEC, namely the Center for Applied
Photonics for receiving me and providing the all the necessary work conditions.
This PhD would have not been possible to accomplish without the doctoral
fellowship from the Fundação para a Ciência e Tecnologia (SFRH/BD/76965/2011). The
collaborations with the foreign institutions, namely the short missions abroad, were
possible due to the support provided by the COST Action TD1001 (OFSeSa). Two of the
short missions at the IPHT-Jena were supported by the bilateral cooperation between the
Portuguese and the German academic exchange service funding agency (FCT/DAAD).
To my friends, who were present in the several stages of my life, there are no words
to express my gratitude. To my friend Teresa, who flew away to the Netherlands to
conquer her dreams, but it’s like she is still here. To André, even in Germany he is still
extremely present in my life. To Otílio, it’s hard for me to find the words to express how
much he means to me.
Lastly, I would like to thank my family, to my Dad and Luísa, to my brother and to
my sister-in-law. To my niece, Joana, who makes my life so much brighter. Finally, thank
you Mum for being there, supporting and advising me all the way!

FCUP
Fiber Sensing Based on New Structures and Post-Processing Enhancement
xi
RESUMO
O trabalho descrito nesta Tese de Doutoramento foca-se no pós-processamento de
fibra ótica e na sua otimização como elemento sensor. Uma vez que a maioria dos
sensores apresentados se baseia em interferómetros de Fabry-Perot, é apresentada uma
perspetiva histórica do desenvolvimento deste tipo de sensores em fibra. Esta revisão
contempla os trabalhos publicados desde os primeiros anos, no início da década de 1980,
até meados de 2015.
A incorporação de microcavidades na ponta de uma fibra monomodo foi alvo de
intenso estudo, particularmente para a medição de pressão de nitrogénio e metano no
estado gasoso. Essas cavidades foram fabricadas a partir de tubos de sílica ocos e de fibra
de cristal fotónico de núcleo oco. Seguindo uma abordagem diferente, fabricaram-se
microcavidades entre duas secções de fibra monomodo. Neste caso, destaca-se a baixa
sensibilidade à temperatura, que as torna altamente desejáveis para medição de
deformação a temperaturas elevadas.
Competências em técnicas de pós-processamento como o ataque químico e a escrita
de estruturas periódicas no núcleo da fibra por meio de laser de excímeros ou laser de
femtosegundo foram adquiridas e aprofundadas no decorrer do programa doutoral.
Um dos trabalhos consistiu no desenho e fabrico de uma fibra de bainha dupla, cujo
índice de refração da bainha interior é superior ao da bainha exterior e ao do núcleo.
Deste modo, inicialmente a luz era guiada pela bainha interior e não pelo núcleo. Após
efetuar pós-processamento através do ataque químico, a bainha interior foi removida e a
luz passou a propagar-se pelo núcleo. Duas aplicações foram encontradas para esta fibra,
como sensor de temperatura e como refratómetro ótico, cuja fase varia com o índice de
refração de um líquido.
Dois tipos de redes de Bragg em fibra ótica foram caracterizados em deformação e
temperatura. A primeira técnica consistiu na inscrição de estruturas sensoras na ponta
de uma fibra por meio de um laser de excímeros e recorrendo a uma máscara de fase.
Estes elementos foram posteriormente sujeitos a ataque químico. Obtiveram-se
extremidades de fibra com dimensões muito reduzidas, com uma sensibilidade à

FCUP
Fiber Sensing Based on New Structures and Post-Processing Enhancement
xii
deformação muito elevada. A outra técnica utilizada para o fabrico das redes de Bragg
foi a escrita ponto-a-ponto por meio de um laser de femtosegundo. Neste caso, estes
elementos sensores são muito estáveis a temperaturas elevadas e podem ser usados para
medir deformação em situações adversas.
A aplicação de lasers em fibra ótica como elementos sensores também foi
considerada nesta Tese. Foram estudados dois lasers, um baseado na configuração em
anel e outro baseado numa cavidade figura-de-oito. Destes trabalhos é de salientar a
qualidade da emissão laser, nomeadamente a sua razão sinal-ruido, a reduzida largura a
meia altura e a estabilidade do laser, o que permitiu fazer a medição de diferentes
parâmetros físicos como deformação, temperatura e torção.
Por fim, abordou-se a possibilidade de utilizar microesferas como dispositivos de
sensorização. Através do arco elétrico produzido pela máquina de fusão, é possível criar
microesferas na extremidade de uma fibra ótica. Inclusivamente, através da mesma
técnica, podem obter-se cadeias de microsferas, formando interferómetros do tipo Mach-
Zehnder, sensíveis a diferentes parâmetros físicos como deformação e temperatura. Os
resultados preliminares obtidos usando uma estrutura de suporte para microesferas de
sílica foram também apresentados. Neste caso, os sensores foram sujeitos a variações de
temperatura.
Todo o trabalho experimental foi conjugado com as respectivas considerações
teóricas. Muitas questões foram levantadas ao longo deste percurso, algumas ainda sem
resposta definitiva. Assim, novos caminhos de investigação poderão ser trilhados tendo
por base as configurações aqui apresentadas.

FCUP
Fiber Sensing Based on New Structures and Post-Processing Enhancement
xiii
ABSTRACT
The work described in this PhD Thesis focuses on the post-processing of optical
fibers and their enhancement as sensing element. Since the majority of sensors presented
are based in Fabry-Perot interferometers, an historical overview of this category of
optical fiber sensors is firstly presented. This review considers the works published since
the early years, in the beginning of the 1980s, until the middle of 2015.
The incorporation of microcavities at the tip of a single mode fiber was extensively
studied, particularly for the measurement of nitrogen and methane gas pressure. These
cavities were fabricated using hollow core silica tubes and a hollow core photonic crystal
fiber. Following a different approach, the microcavities were incorporated between two
sections of single mode fiber. In this case, the low sensitivity to temperature makes these
microcavities highly desirable for the measurement of strain at high temperatures.
Competences in post-processing techniques such as the chemical etching and the
writing of periodical structures in the fiber core by means of an excimer or a
femtosecond laser were also acquired in the course of the PhD programme.
One of the works consisted in the design and manufacturing of a double clad optical
fiber. The refractive index of the inner cladding was higher than the one of the outer
cladding and the core. Thus, light was guided in the inner cladding instead of
propagating in the core. This situation was overcome by applying chemical etching, thus
removing the inner cladding. The core, surrounded by air, was then able to guide light.
Two different applications were found for this fiber, as a temperature sensor and as an
optical refractometer. In the last, the optical phase changes with the liquid refractive
index.
Two different types of fiber Bragg gratings were characterized in strain and
temperature. Sensing structures obtained through the phase mask technique at the tip of
an optical fiber were subjected to chemical etching. In this case, an excimer laser was
used. Extremely thin fiber tips were obtained, with an ultra-high sensitivity to strain. The
other technique employed to fabricate the fiber Bragg gratings was the point-by-point

FCUP
Fiber Sensing Based on New Structures and Post-Processing Enhancement
xiv
femtosecond laser inscription. In this case, the sensing elements are very stable at high
temperatures and can be used to measure strain in harsh conditions.
The employment of optical fiber lasers as sensing elements was also considered in
this Thesis. Two laser cavities were studied, one based on the ring configuration and the
other based on a figure-of-eight configuration. From these works, the quality of the laser
emission, namely the signal-to-noise ratio, the reduced full-width at half maximum and
the stability should be highlighted. These characteristics allowed the measurement of
different physical parameters, such as strain, temperature and torsion.
Lastly, the possibility to use microspheres as sensing elements was considered.
Using the electric arc of a fusion splicer, it is possible to create microspheres at the tip of
an optical fiber. Furthermore, with this technique it is chains of microspheres can be
obtained, constituting Mach-Zehnder-type interferometers which are sensitive to
physical parameters like strain and temperature. The preliminary results obtained by
introducing silica microspheres in a support structure are also presented. In this case, the
sensors were subjected to temperature variations.
All the experimental work was combined with the respective theoretical
considerations. Many questions have been raised with the course of this PhD, and there
are still some without a definite answer. Thus, new research paths can be followed,
having their basis grounded in the configurations here presented.

FCUP
Fiber Sensing Based on New Structures and Post-Processing Enhancement
xv
TABLE OF CONTENTS
1 Introduction ................................................................................................................... 1
1.1 Introduction ................................................................................................................ 3
1.2 Motivation and Objectives ....................................................................................... 3
1.3 Structure of the Thesis .............................................................................................. 4
1.4 Main Contributions ................................................................................................... 5
1.5 List of Publications .................................................................................................... 6
1.5.1 Scientific Journals .............................................................................................. 6
1.5.2 Communications in National/International Conferences ............................ 7
2 Historical Overview of Fiber Sensors Based on Fabry-Perot Interferometry ... 9
2.1 Introduction .............................................................................................................. 11
2.2 Fabry-Perot Based Sensors: the Basic Characteristics ......................................... 11
2.3 The First Fabry-Perot Interferometer .................................................................... 13
2.4 Historical Perspective on Fabry-Perot based Optical Fiber Sensors ................ 14
3 Fabry-Perot Cavities Based on Hollow Core Interferometric Tips ................... 31
3.1 Introduction .............................................................................................................. 33
3.2 Theoretical Considerations ..................................................................................... 35
3.3 Fabry-Perot Cavity Based on a Silica Tube .......................................................... 39
3.3.1 Sensor Design and Spectral Characteristics ................................................. 40
3.3.2 Temperature Measurement ............................................................................ 44
3.3.3 Pressure Measurements .................................................................................. 44
3.4 Fabry-Perot Cavity Based on Hollow-Core Photonic Crystal Fiber ................. 47
3.4.1 Sensor Design and Spectral Characteristics ................................................. 48
3.4.2 Temperature Measurements .......................................................................... 49
3.4.3 Pressure Measurements .................................................................................. 51
3.4.4 Prototype for Biomedical Applications ........................................................ 52
3.5 Final Remarks ........................................................................................................... 54
4 Fabry-Perot Cavities Based on Post-Processed Interferometric Tips ................ 57
4.1 Introduction .............................................................................................................. 59
4.2 Design of the Double Clad Optical Fiber ............................................................. 61
4.3 Optical Fiber Tips Design ....................................................................................... 62
4.4 High Temperature Sensing Using a Diaphragm-Free Configuration .............. 65
4.5 Optical Phase Refractometer .................................................................................. 68
FCUP
Fiber Sensing Based on New Structures and Post-Processing Enhancement
xvi
4.5.1 Water Temperature and Refractive Index Relationship ............................ 71
4.5.2 Experimental Results ...................................................................................... 72
4.6 Final Remarks .......................................................................................................... 76
5 Sensing Structures Incorporated in Optical Fibers ............................................. 79
5.1 Introduction ............................................................................................................. 81
5.2 Controlling the Sensitivity of a Fabry-Perot Strain Sensor ............................... 82
5.2.1 Sensor Design and Spectral Characteristics ................................................ 83
5.2.2 Experimental Results ...................................................................................... 84
5.3 Measuring Strain at High Temperatures (Part I): Silica Tube ........................... 87
5.3.1 Sensor Design and Spectral Characteristics ................................................ 87
5.3.2 Experimental Results ...................................................................................... 89
5.4 Measuring Strain at High Temperatures (Part II): Fiber Bragg Gratings ........ 94
5.4.1 Sensor Design and Spectral Characteristics ................................................ 94
5.4.2 Experimental Results ...................................................................................... 95
5.5 Final Remarks .......................................................................................................... 99
6 Fiber Lasers for Sensing.......................................................................................... 101
6.1 Introduction ........................................................................................................... 103
6.2 Strain Sensor based on Post-Processed Fiber Bragg Grating .......................... 105
6.2.1 Theoretical Considerations .......................................................................... 105
6.2.2 Sensor Design and Spectral Characteristics .............................................. 108
6.2.3 Passive Configuration .................................................................................. 110
6.2.4 Active Configuration .................................................................................... 113
6.3 Torsion Sensor based on Figure-of-Eight Fiber Laser ...................................... 116
6.3.1 Working Principle ......................................................................................... 116
6.3.2 Sensor Design and Spectral Characteristics .............................................. 118
6.3.3 Experimental Results .................................................................................... 119
6.3.4 Final Remarks ................................................................................................ 121
7 Sensors Based on Microspheres ............................................................................ 123
7.1 Introduction ........................................................................................................... 125
7.2 Silica Microspheres Array Sensor ....................................................................... 127
7.2.1 Theoretical Considerations .......................................................................... 127
7.2.2 Sensor Design and Spectral Characteristics .............................................. 129
7.2.3 Experimental Results .................................................................................... 132

FCUP
Fiber Sensing Based on New Structures and Post-Processing Enhancement
xvii
7.3 Fabry-Perot based on Array of Soda-Lime Glass Microspheres ..................... 133
7.3.1 Theoretical Considerations ........................................................................... 133
7.3.2 Sensor Design and Spectral Characteristics ............................................... 134
7.3.3 Experimental Results..................................................................................... 137
7.4 Final Remarks ......................................................................................................... 139
8 Final Conclusions and Future Work ..................................................................... 141
9 Appendices ................................................................................................................ 147
Appendix I – Fabrication of a Double Clad Optical Fiber ........................................ 149
Appendix II - Point-by-Point Femtosecond Laser FBG Inscription ......................... 151
Appendix III - Interferometric Excimer Laser FBG inscription ................................ 153
10 References .................................................................................................................. 155


FCUP
Fiber Sensing Based on New Structures and Post-Processing Enhancement
xix
LIST OF FIGURES
Figure 2.1 – Schematic examples of fiber optic FP interferometers: a) and b) extrinsic
configurations, c) and d) intrinsic configurations. ................................................................................. 12
Figure 2.2 – First page of the paper published by Fabry and Perot in 1897 [11]. ............................... 13
Figure 2.3 – Fabry-Perot interferometer experimental setup. A stands for the optical source
(electric arc in the original), L, L’ and L’’ are lenses, A’ is a slit, E is the display and B corresponds
to the silvered glass [11]. ............................................................................................................................ 13
Figure 2.4 – (a) Configuration proposed in 1979 by Cielo [12]. L is the light source coupled to the
fiber, R corresponds to the reflectors, D is the photodetector, and S stands for the servo-control
electronics. (b) Spectral response of a single cavity [12]. ....................................................................... 14
Figure 2.5 – Experimental setup for the evaluation of multiplexed FP sensors [25]. ........................ 16
Figure 2.6 - Photograph of the 112 m long in-line fiber etalon proposed by Sirkis et al. in 1993
[41]. ............................................................................................................................................................... 18
Figure 2.7 – Structure of the fiber Bragg grating FP cavity proposed by Du et al. (adapted from
[57]). .............................................................................................................................................................. 19
Figure 2.8 – Structure of the FP temperature sensor proposed by Tsai et al. [63]. ............................. 20
Figure 2.9 – Configuration of an in-line hollow-core PCF etalon, proposed by Rao et al. [85]. ....... 22
Figure 2.10 – Diagram of the configuration proposed by Villatoro et al. [101]. FOC stands for fiber
optic circulator, LED is the light emitting diode and OSA corresponds to the optical spectrum
analyzer. ....................................................................................................................................................... 24
Figure 2.11 – Scanning electron microscope image of the FP cavity created using FIB [108] . ........ 24
Figure 2.12 – Microscope photograph of the first diaphragm-free FP cavity for gas pressure
sensing [122]. ............................................................................................................................................... 25
Figure 3.1 – Numerical curves obtained for the refractive index of N2 considering (a) the
dependence on wavelength, and (b) the dependence on pressure, at a temperature of 20 °C and a
constant wavelength of 1550 nm. RIU stands for refractive index units. ........................................... 39
Figure 3.2 – Microscope photograph of the silica tube cross-section. ................................................. 40
Figure 3.3 – Schematic of the procedures used to fabricate the FP cavity: (a) image from the
splicing machine display, evidencing the lateral offset, prior to splicing (SMF on the left and silica
tube on the right), (b) image after splicing, (c) device prior to cleaving, the arrows indicate where
the cleave should be done and (d) microscope image of a FP cavity produced with this method. 40
Figure 3.4 – Scheme of the experimental setup. ..................................................................................... 41
Figure 3.5 – Left: Scheme of the sensing head, highlighting the reflections occurring in the cavity.
Right: cross section photograph of one sample when illuminated with a He-Ne laser. ................... 41
Figure 3.6 – Spectra of four sensing heads with different FP cavity lengths. ..................................... 42
Figure 3.7 – Spatial frequency spectra for four different cavity lengths. ............................................ 42
Figure 3.8 – Free spectral range dependence on the cavity length, considering two adjacent peaks
with wavelengths close to 1550 nm. ......................................................................................................... 43
Figure 3.9 – Temperature response of the 141 m long sensing head. Inset 1 (top left): low
temperatures response; inset 2 (bottom right) high temperatures response. ..................................... 44
FCUP
Fiber Sensing Based on New Structures and Post-Processing Enhancement
xx
Figure 3.10 – Sensing heads response to the applied pressure. ............................................................ 45
Figure 3.11 – Sensing heads response to the N2 refractive index change. All measurements were
done at room temperature (~20 °C), and the monitored wavelength was around 1550 nm. ........... 46
Figure 3.12 - Sensing heads response to the N2 (a) pressure and (b) refractive index change. All
measurements were done at room temperature (~20 °C), and the monitored wavelength was
around 1550 nm. The hollow core silica tube presented an inner diameter of ~60 m. .................... 47
Figure 3.13 – Photographs of the hollow core ring fiber cross-section (a) at the scanning electron
microscope (SEM) and (b) when illuminated with a He-Ne laser. ...................................................... 48
Figure 3.14 – Spectra of three sensing heads based on the HCR-PCF FP cavity. ............................... 49
Figure 3.15 – Temperature response of the 360 m long sensing head. .............................................. 50
Figure 3.16 – Sensing head response to the applied pressure, (a) atmosphere of N2, different FP
cavity lengths and (b) different gas atmospheres for a cavity length of 360 m. .............................. 51
Figure 3.17 – Schematic drawing of the sensor proposed for low-pressure measurements [208]. .. 52
Figure 3.18 – Spectral response of the sensing head. Also shown the spectral shift when
hydrostatic pressure is applied (step of 37.5 mmHg). ........................................................................... 53
Figure 3.19 – Sensor response to hydrostatic pressure variation. ........................................................ 54
Figure 4.1 – Schematic designs of some of the double clad optical fibers reported in the literature.
....................................................................................................................................................................... 59
Figure 4.2 – (a) Cross section of the P-doped double clad optical fiber. (b) Refractive index profile
measured using a short section of the preform. ..................................................................................... 62
Figure 4.3 – Left: Microscope photos of fiber tip formation after an etching time of a) ~9 s, b) ~27 s,
c) ~46 s and d) ~65 s. Right: Cavity length formation vs. time. Inset: SEM image of the etched
cavity cross-section. .................................................................................................................................... 63
Figure 4.4 – Scheme of the optical fiber tip design fabrication steps. The red arrows indicate the
steps to produce the diaphragm-free configuration and the blue ones are related to the
configuration with diaphragm. ................................................................................................................. 64
Figure 4.5 – Scheme of the experimental setup. ..................................................................................... 64
Figure 4.6 – (a) Scheme of the FP cavity for high temperature measurement and (b) photograph of
the sensing head when illuminated with a He-Ne laser. ...................................................................... 65
Figure 4.7 – Experimental (black line) and theoretical (green dashed line) spectra of the sensing
head reflection response. ........................................................................................................................... 67
Figure 4.8 – Wavelength dependence on temperature. ......................................................................... 67
Figure 4.9 – FP microcavity evidencing the interface reflections. ........................................................ 68
Figure 4.10 – Scheme of the resultant wave phase variation with the amplitude of E3; E2 remains
constant. ....................................................................................................................................................... 70
Figure 4.11 – Simulated spectra of the FP micro-cavity in different media. The inset shows the
phase variation of the spectrum. .............................................................................................................. 71
Figure 4.12 – (a) Dependence of the refractive index of water on the operation wavelength for
different temperatures and (b) refractive index of water as a function of temperature, for a
wavelength of 1550 nm. ............................................................................................................................. 72

FCUP
Fiber Sensing Based on New Structures and Post-Processing Enhancement
xxi
Figure 4.13 – Spectra of the FP micro-cavity when the external medium is air (black line) and
water (blue line). (a) Sensor with a thin diaphragm. (b) Sensor with a thick diaphragm. ............... 73
Figure 4.14 – Wavelength shift dependence of the sensor response with a diaphragm of 43 µm on
the applied temperature, in two different media. .................................................................................. 74
Figure 4.15 – Wavelength shift dependence on temperature: (a) sensing head exposed to air (black
circles) and when immersed in water (blue circles) and (b) calculated water contribution. ........... 75
Figure 4.16 – Wavelength shift variation with the water refractive index.......................................... 76
Figure 5.1 – Microscope images of (a) the HCR-PCF cross-section and (b) the 207 m long sample.
....................................................................................................................................................................... 83
Figure 5.2 – Scheme of the experimental setup. OSA stands for optical spectrum analyzer and FP
cavity corresponds to the Fabry-Perot cavity. ........................................................................................ 83
Figure 5.3 – Spectra of the four samples, with different FP cavity lengths. The spectrum shift with
the applied strain is also shown for each sample. .................................................................................. 84
Figure 5.4 – Identification of the lengths considered in the strain analysis. ....................................... 84
Figure 5.5 – (a) Sensors response to the applied strain. (b) Sensitivity dependence on the FP cavity
length. Inset: microscope photograph of the 13 m long sensing head. ............................................. 85
Figure 5.6 - (a) Response of the 207 m long sensor cavity to strain, considering three different
gauge lengths. (b) Sensitivity dependence on the gauge length (purple dots) and tendency curve
(gray line). .................................................................................................................................................... 86
Figure 5.7 – Wavelength dependence on temperature for the 207 m long sensing head. .............. 86
Figure 5.8 – Cross section images of the silica tube varying the pressure during fiber drawing: (a)
p = 1000 Pa, (b) p = 2300 Pa and (c) p = 3000 Pa. ...................................................................................... 87
Figure 5.9 – Photograph of one FP cavity based on the new hollow core silica tube design. .......... 88
Figure 5.10 – Spectra of the four FP cavity sensors. ............................................................................... 88
Figure 5.11 – (a) FP cavity sensors response to the applied strain. (b) Response of the 198 m long
sensor to temperature. ............................................................................................................................... 89
Figure 5.12 – Response of the 70 m long FP cavity to the applied strain at different temperatures.
Up and down stand for increasing and decreasing the applied strain, respectively. ....................... 90
Figure 5.13 – Wavelength shift of the 51 µm long FP cavity for an annealing temperature of
900 °C............................................................................................................................................................ 91
Figure 5.14 – Response of the 51 m long FP cavity to strain at different temperatures, after 7
hours of annealing, at 900 °C. Up and down stand for increasing and decreasing the applied
strain, respectively. ..................................................................................................................................... 92
Figure 5.15 – Dependence of the strain sensitivity at different temperatures: (a) without annealing
and (b) with annealing. .............................................................................................................................. 92
Figure 5.16 – Sensors response to the applied strain until rupture. The insets show the cross-
section photographs of the silica tube used as sensing element in each case..................................... 93
Figure 5.17 – Microscope photograph of a fiber Bragg grating written using the point-by-point
femtosecond laser technique. .................................................................................................................... 94
Figure 5.18 – Scheme of the experimental setup. OSA refers to the optical spectrum analyzer and
FBG is the fiber Bragg grating (the scheme is not to scale). .................................................................. 95

FCUP
Fiber Sensing Based on New Structures and Post-Processing Enhancement
xxii
Figure 5.19 – Initial transmission spectra of the two fiber Bragg gratings (FBGs)............................. 95
Figure 5.20 – FBG1 response to temperature. ......................................................................................... 96
Figure 5.21 – FBG1 response to an annealing temperature of 900 °C. (a) Bragg wavelength shift
with time and (b) Reflectivity variation with time. ................................................................................ 97
Figure 5.22 – Strain sensitivity variation with temperature (a) after annealing at 900 °C, FBG1, and
(b) without annealing, FBG2. .................................................................................................................... 98
Figure 5.23 – Transmission spectra of (a) FBG1, before annealing (dotted curve), after annealing
(dashed curve) and after strain at high temperatures (solid curve) and (b) FBG2, before (dotted
curve) and after (solid curve) being subjected to strain at high temperatures. .................................. 98
Figure 6.1 – Scheme of a tapered FBG without strain applied (top) and under strain (bottom).
Adapted from [268]. ................................................................................................................................. 105
Figure 6.2 – Numerical simulation of an etched FBG, considering three values of initial strain. (a)
variation of the pitch with the length and (b) strain variation along the grating length. ............... 107
Figure 6.3 – (a) Cladding diameter variation with the chemical etching time. Also shown
microscope images of the fiber tip after etching times of (b) ~30 min, (c) ~55 min and (d) ~61 min.
..................................................................................................................................................................... 109
Figure 6.4 – Reflection spectra of the FBG at different etching times. ............................................... 110
Figure 6.5 – Scheme of the experimental setup. ................................................................................... 110
Figure 6.6 – Spectra of the etched FBG tip when no strain is applied (blue line) and with 93
(pink line). .................................................................................................................................................. 111
Figure 6.7 – Response of the etched FBG tip to the applied strain by monitoring (a) the
wavelength at 3 dB (solid black dots) and the peak P1 wavelength (green dots) and (b) the full-
width at half-maximum (FWHM). ......................................................................................................... 112
Figure 6.8 – Sensor response to temperature. ....................................................................................... 113
Figure 6.9 – Scheme of the experimental setup. EDFA is the erbium doped fiber amplifier and
FBG stands for fiber Bragg grating. ........................................................................................................ 113
Figure 6.10 – Laser output power as a function of the pump power. The laser stability for a
constant pump power of 50 mW, over 60 min is also shown (purple line). ..................................... 114
Figure 6.11 – Response of the laser to the applied strain, regarding (a) the spectral variation and
(b) the wavelength shift. The inset represents the integrated power as a function of the applied
strain. .......................................................................................................................................................... 115
Figure 6.12 – Step technique to estimate the resolution of the fiber laser strain sensor. ................. 116
Figure 6.13 – Scheme of the figure-of-eight fiber laser. WDM stands for wavelength division
multiplexer, PC is the polarization controller and OSA corresponds to the optical spectrum
analyzer. ..................................................................................................................................................... 117
Figure 6.14 – (a) Microscopic photograph of the polarization-maintaining photonic crystal fiber
used as sensing element. (b) Transmission spectrum of the sensor. ................................................. 118
Figure 6.15 – Optical power variations with the drive-in current. ................................................... 119
Figure 6.16 – (a) Variation of the laser emission with the applied torsion and (b) interferometric
filter spectrum (blue line) and laser spectrum (pink line). .................................................................. 120

FCUP
Fiber Sensing Based on New Structures and Post-Processing Enhancement
xxiii
Figure 6.17 – Laser peak wavelength dependence on the applied (a) torsion angle and (b) strain.
..................................................................................................................................................................... 120
Figure 7.1 – Microspheres array sensors modeling using ZEMAX SE, considering (a) 2
microspheres, (b) 3 microspheres, (c) 4 microspheres and (d) 5 microspheres. The focal points f1, f2
and f3 for each configuration are also shown (when applicable). ...................................................... 128
Figure 7.2 – Microphotographs of the microspheres manufactured using the splicing machine.
Each photo was taken after one electric arc discharge. ....................................................................... 129
Figure 7.3 – Dependence of the sphere diameter on the number of electric arc discharges. ......... 130
Figure 7.4 – Channeled spectra of light that exits the sensing heads with (a) 2 microspheres, (b) 3
microspheres, (c) 4 microspheres and (d) 5 microspheres. ................................................................. 131
Figure 7.5 – Sensors response to applied strain. ................................................................................... 132
Figure 7.6 – Response of the 3-microspheres sample to temperature variation. ............................. 133
Figure 7.7 – Scheme of the ray tracing through a ball lens. Adapted from [311]. ............................ 134
Figure 7.8 – Scheme of the experimental setup. ................................................................................... 135
Figure 7.9 – (left) Spectra of the sensing heads tested. (right) Microphotographs of the
characterized sensors. .............................................................................................................................. 136
Figure 7.10 – Dependence of the spectral visibility on the number of microspheres. Inset:
Microphotograph of the 4-microspheres sample when illuminated with a He-Ne laser. .............. 137
Figure 7.11 – Wavelength variation with temperature. ....................................................................... 137
Figure 9.1 – Preform fabrication using the MCVD technique, evidencing (a) the burner that moves
along the tube when the layers are being deposited and (b) when the structure is being collapsed
at extremely high temperatures. ............................................................................................................. 149
Figure 9.2 – Fiber drawing components: (a) the drawing furnace with the preform, (b) the UV
curing lamp and (c) capstan and drum winder. ................................................................................... 150
Figure 9.3 – Experimental setup for the femtosecond laser system used to inscribe the fiber Bragg
gratings. CCD stands for charged coupled device. Adapted from [317]. ......................................... 151
Figure 9.4 – Scheme of the interferometric KrF excimer laser setup. Adapted from [318]. ............ 153


FCUP
Fiber Sensing Based on New Structures and Post-Processing Enhancement
xxv
LIST OF TABLES
Table 2.1 - Different fiber optic intrinsic FP sensors, with the respective characteristics, from 2009-
2015. .............................................................................................................................................................. 28
Table 3.1 - Different fiber optic gas pressure sensors based on FP configurations, with the
respective characteristics. .......................................................................................................................... 34
Table 3.2 – Sensitivity of the different sensing heads to N2 pressure and to refractive index. ........ 46
Table 5.1 – Parameters of the FBGs at room temperature. The values were obtained through the
optical transmission spectra, prior to any measurements (initial values), after 7 hours thermal
annealing at 900 °C and after applying strain at different temperatures (final values). The total
wavelength shift is relative to the beginning and end of the measurements. .................................... 99
Table 6.1 – Properties of the interferometric filter................................................................................ 119
Table 7.1 – Strain sensitivity obtained for each sensor. ....................................................................... 132
Table 7.2 – Temperature sensitivity obtained for each sensor. corresponds to the wavelength, in
nm, and T to the temperature, in °C. The correlation coefficient, r2 is also shown. ........................ 138


FCUP
Fiber Sensing Based on New Structures and Post-Processing Enhancement
xxvii
LIST OF ACRONYMS
CCD Charge coupled device
DBR Distributed Bragg reflector
DCF Double clad optical fiber
DFB Distributed feedback
EDFA Erbium-doped fiber amplifier
FBG Fiber Bragg grating
FFT Fast Fourier transform
FIB Focused ion beam
FP Fabry-Perot
FSR Free spectral range
FWHM Full width at half maximum
GIF Graded index fiber
HCR-PCF Hollow-core ring photonic crystal fiber
HF Hydrofluoric acid
LED Light emitting diode
LPG Long period grating
MCVD Modified chemical vapor deposition
MMF Multimode fiber
NIM Nanojet induced mode
OSA Optical spectrum analyzer
PC Polarization controller
PCF Photonic crystal fiber
PM PCF Polarization maintaining photonic crystal fiber
PZT Piezoelectric transducer
RI Refractive index
RIU Refractive index units
SEM Scanning electron microscope
SMF Single mode fiber
SNR Signal-to-noise ratio
UV Ultraviolet
VIS Visible
WDM Wavelength division multiplexer
WGM Whispering gallery mode


CHAPTER ONE
1 Introduction


FCUP
Fiber Sensing Based on New Structures and Post-Processing Enhancement
3
1.1 Introduction
Optical fiber sensors present several features that make them extremely attractive to
be used in several fields, such as electrical engineering, mechanical
sciences and engineering, civil engineering, chemical engineering, material science,
biology, chemistry, physics, and optics [1]. Living in a highly technological society, the
demand for detecting environmental changes, by means of physical, chemical or
biological parameters has grown intensely over the last decades. Fiber-based sensors
need to be reliable, robust, highly sensitive, and cost-effective to compete with more
conventional approaches. The amount of possibilities is immense, depending on the
configuration, the measurand and the application for which they are designed.
The post-processing of optical fiber, in the context of the Thesis, corresponds to the
physical modifications made to an optical fiber after its production. The ways to achieve
it can be by chemical etching, by using a laser to write periodic patterns, such as the fiber
Bragg grating, or even to perform micromachining. The fusion splicer can also be used to
post-process an optical fiber, by changing its shape. These are the methods explored in
this Thesis.
This Chapter gives an overview on the motivation and objectives of this work,
followed by a description of the Thesis structure. Finally, the main contributions to the
field are presented, as well as the list of publications that resulted from this PhD.
1.2 Motivation and Objectives
The motivation for the work developed in the framework of the PhD programme
relied on performing an original study about the development of new structures based
on the post-processing of optical fibers and in their enhancement as a sensing element.
Besides, this work resulted from the desire to give a contribution to the field, studying
and developing different configurations for the measurement of physical parameters.
Certainly, another major motivation was to learn new concepts and provide solutions to
the different challenges that appeared as the research advanced.

FCUP
Fiber Sensing Based on New Structures and Post-Processing Enhancement
4
The main objectives relied on:
the study of diaphragm-free microcavities for gas pressure sensing;
characterization of sensors based on the post-processing of a purpose-
designed double clad optical fiber;
study of strain measurement in harsh environments, such as in high
temperatures;
development of fiber laser sensors and their respective characterization;
manufacturing and characterization of interferometric structures based on
microspheres.
1.3 Structure of the Thesis
This Thesis is divided in eight Chapters, of which five are relative to experimental
work developed in the PhD framework.
Chapter 1 gives an overview of the Thesis structure and its framing within the fiber
sensing field. It also contains the main contributions and the list of works published
during the PhD.
Chapter 2 provides an historical overview on Fabry-Perot based optical fiber sensors.
This review results from the fact most of the sensors described in the Thesis are within
this field. The emphasis is done on the cavities configurations, the measurands and the
sensitivities achieved so far.
Chapter 3 proposes two different Fabry-Perot cavities for the measurement of gas
pressure. The devices are based on a hollow core silica tube and a hollow core ring
photonic crystal fiber. The former was the first diaphragm-free Fabry-Perot sensor used
in such application reported in the literature. Still in the third Chapter, a prototype for
biomedical applications is addressed.
In the Chapter 4, two distinct Fabry-Perot configurations based on the post-
processing of a double clad optical fiber are described. The inner cladding, doped with
phosphorus, is removed through chemical etching and a tip, protected by the outer

FCUP
Fiber Sensing Based on New Structures and Post-Processing Enhancement
5
cladding, is formed. The diaphragm free configuration is characterized in high
temperature. By introducing a diaphragm in the post-processed structure, an optical-
phase refractometer is obtained.
The Chapter 5 is dedicated to the measurement of strain. In a first approach, the
control of strain sensitivity is proposed using a hollow core ring photonic crystal fiber
Fabry-Perot cavity. Smaller cavities, combined with large lengths over which the strain is
applied, result in more sensitive devices. The measurement of strain at high
temperatures is studied for the case of a Fabry-Perot cavity and when using a fiber Bragg
grating. In both cases the influence of annealing is addressed, in order to achieve better
responses to strain.
On the 6th Chapter, the matter of using fiber lasers as active sensors is explored.
Besides the characterization of the laser cavities, the sensing elements are subjected to
variations of torsion and strain. One of the active sensors, a post-processed fiber Bragg
grating, is also studied in a passive configuration, for comparison purposes. An ultra-
high sensitivity to strain is achieved with this device.
The sensors described in Chapter 7 are based on microspheres. Two different
configurations are explored. One consists of an array of microspheres obtained by post-
processing single mode fiber by means of fusion splicing. The second configuration is a
Fabry-Perot cavity obtained by placing the soda-lime microspheres inside a hollow core
silica tube, which acts as a support structure.
The Chapter 8 presents some lines summarizing the main results achieved during
the PhD and describes the opportunities of future work that this investigation has
created.
1.4 Main Contributions
From the works presented in this Thesis, it is the author opinion that three of them
stand out as main contributions to the field. The first was the use of a Fabry-Perot
configuration for gas pressure sensing that did not require a diaphragm. Two different
hollow core fibers were successfully used in this context, a silica tube and a photonic

FCUP
Fiber Sensing Based on New Structures and Post-Processing Enhancement
6
crystal fiber. The second contribution was the optical phase refractometer based on a
post-processed Fabry-Perot cavity. With such configuration it was possible to detect
spectral phase variations with the refractive index. Finally, the new sensing structures
based on an array of microspheres that were tested to strain and temperature. The
response to strain was dependent on the number of microspheres that constituted the
array.
1.5 List of Publications
From the activity developed in the framework of this PhD, a total of 10 articles were
published as first author in scientific journals, one of them being an invited paper, and
another was a review paper published in the Optical Fiber Technology Journal. Besides,
three papers were published as co-author, as a result of collaborations outside the scope
of this Thesis. A total of 8 communications in national/international conferences were
published during the PhD. The list of works published as first author is presented next.
1.5.1 Scientific Journals
1. M. S. Ferreira, P. Roriz, J. Bierlich, J. Kobelke, K. Wondraczek, C. Aichele, K.
Schuster, J. L. Santos, O. Frazão, Fabry-Perot cavity based on silica tube for strain
sensing at high temperatures, Opt. Express, vol. 23, no. 12, 2015.
2. M. S. Ferreira, J. L. Santos, O. Frazão, Silica microspheres array sensor, Opt. Letters,
vol. 39, no. 20, 2014.
3. M. S. Ferreira, J. Bierlich, S. Unger, K. Schuster, J. L. Santos, O. Frazão, Optical
phase refractometer based on post-processed interferometric tip sensors, J. Light.
Technol., vol. 32, no. 17, 2014.
4. M. S. Ferreira, J. Bierlich, M. Becker, K. Schuster, J. L. Santos, O. Frazão, Ultra-high
sensitive strain sensor based on post-processed optical fiber Bragg grating, MDPI Fibers,
vol.2, pp.142-149, 2014. Invited Paper
5. M. S. Ferreira, P. R. Oliveira, S. Oliveira Silva, J. L. Santos, O. Frazão, Next
generation of Fabry-Perot sensors for high-temperature, Opt. Fiber Technol., vol.19,
2013. Review Paper

FCUP
Fiber Sensing Based on New Structures and Post-Processing Enhancement
7
6. M. S. Ferreira, J. Bierlich, S. Unger, K. Schuster, J. L. Santos, O. Frazão, Post-
processing of Fabry-Pérot microcavity tip sensor, IEEE Photonic. Tech. L., vol.25,
no.16, pp.1593-1596, 2013.
7. M. S. Ferreira, J. L. Santos, P. Mergo, O. Frazão, Torsion sensor based on a figure-of-
eight cavity fibre laser, Laser Phys. Lett., vol.10, no. 4, 2013.
8. M. S. Ferreira, J. Bierlich, J. Kobelke, , J. L. Santos, O. Frazão, Fabry-Pérot cavity
based on hollow core ring photonic crystal fiber for pressure sensing, IEEE Photonic.
Tech. L., vol.24, no.23, pp.2122-2124, 2012.
9. M. S. Ferreira, J. Bierlich, J. Kobelke, K. Schuster, J. L. Santos, O. Frazão, Towards
the control of highly sensitive Fabry-Pérot strain sensor based on hollow-core ring
photonic crystal fiber, Opt. Express, vol.20, no.20, pp.21946-21952, 2012.
10. M. S. Ferreira, L. C. Coelho, K. Schuster, J. Kobelke, J. L. Santos, O. Frazão, Fabry-
Pérot cavity based on a diaphragm free hollow core silica tube, Opt. Letters, vol.36,
no.20, pp.4029-4031, 2011.
1.5.2 Communications in National/International Conferences
1. M. S. Ferreira, P. Roriz, J. Bierlich, J. Kobelke, K. Wondraczek, C. Aichele, K.
Schuster, J. L. Santos, O. Frazão, Measuring strain at extreme temperatures with a
Fabry-Perot optical fiber sensor, OFS24, Curitiba, Brazil, 2015.
2. M. S. Ferreira, G. Lee, J. L. Santos, K. Sugden, O. Frazão, Phase-shifted fiber Bragg
grating for strain measurement at extreme conditions, OSA Meeting 2014, Barcelona,
Spain, 2014.
3. M. S. Ferreira, J. L. Santos, O. Frazão, New silica microspheres array sensor, OFS23,
Santander, Spain, 2014.
4. M. S. Ferreira, J. Bierlich, J. Kobelke, K. Wondraczek, C. Aichele, K. Schuster, J. L.
Santos, and O. Frazão, Fabry-Pérot microcavity strains sensor based on advanced silica
tube, AOP2014 - II International Conference on Applications of Optics and
Photonics, Aveiro, Portugal, 2014.
5. M. S. Ferreira, J. L. Santos, P. Mergo and O. Frazão, Figure-of-eight cavity fiber laser
based torsion sensor, RIAO/OPTILAS 2013, Porto, Portugal.

FCUP
Fiber Sensing Based on New Structures and Post-Processing Enhancement
8
6. M. S. Ferreira, J. Bierlich, S. Unger, K. Schuster, J. L. Santos, O. Frazão, Post-
Processed Fabry-Pérot microcavity tip sensors for temperature measurement, WSOF-
2013 - workshop on specialty optical fibers , Sigtuna, Sweden, 2013.
7. M. S. Ferreira, J. Bierlich, K. Schuster, J. L. Santos, O. Frazão, Fabry-Pérot
microcavity tip temperature sensor based on post-processing, EWOFS 2013 - 5th
European Workshop on Optical Fibre Sensors, Kraków, Poland, 2013.
8. M. S. Ferreira, K. Schuster, J. Kobelke, J. L. Santos, O. Frazão, Fabry-Pérot cavity
based on large hollow core photonic crystal fiber for nitrogen pressure measurements,
SEON 2012 – VIII Symposium on Enabling Optical Networks and Sensors,
Aveiro, Portugal, 2012.

CHAPTER TWO
2 Historical Overview of Fiber Sensors Based
on Fabry-Perot Interferometry


FCUP
Fiber Sensing Based on New Structures and Post-Processing Enhancement
11
2.1 Introduction
Fiber optic sensors based on interferometry have been widely explored over the last
five decades. From the most basic configurations, the Mach-Zehnder, the Michelson, the
Sagnac and the low-finesse Fabry-Perot (FP) interferometers stand out [2]. Regarding the
FP interferometer, it is usually composed by two parallel reflecting surfaces with a small
separation between them. Light reaching the cavity with near normal incidence, will
suffer several internal reflections at the interfaces, resulting in a multiple beam
interferometer. This translates in a higher interaction of the measurand with the guided
light, and consequently, in a higher sensitivity. Besides, this interferometer offers unique
advantages, such as the compactness, reliability and the fact that it does not require the
presence of an extra fiber to serve as a reference arm, since the interference occurs within
a single fiber [3].
In this Chapter, the most common fiber optic configurations based on Fabry-Perot
interferometry are described, followed by an historical overview of the development of
these structures since the first papers were published, in the 1980s.
2.2 Fabry-Perot Based Sensors: the Basic Characteristics
Since the first fiber optic FP-based sensor proof of concept, that took place in the
early 1980s, there has been a great evolution in this field. In the 1980s two different
categories of optical fiber sensors based on FP interferometry arose, the extrinsic and the
intrinsic configurations. In the former, the cavity, which acts as the sensing element, is
located outside the fiber and the two mirrors required to form the cavity can be two fiber
tips placed close enough to ensure interference (Fig. 2.1 (a)) or one fiber tip and a
reflective element (Fig. 2.1 (b)). In order to keep the structure stable, it can be placed
inside a capillary tube, as represented in the example in Fig. 2.1 (a).
When the FP cavity is contained within the optical fiber, the configuration is
considered to be intrinsic. One way to produce this type of configuration can be by

FCUP
Fiber Sensing Based on New Structures and Post-Processing Enhancement
12
splicing a hollow core fiber between two single mode fibers, as represented in Fig. 2.1 (c),
or by creating two in-line partial mirrors, as in Fig. 2.1 (d).
Figure 2.1 – Schematic examples of fiber optic FP interferometers: a) and b) extrinsic configurations, c) and d)
intrinsic configurations.
From 1990 to 2005, the focus of research was mainly on the signal acquisition
systems and on the interrogation techniques. In that period, a major evolution of
extrinsic FP-based sensors occurred. However, with the arising of sensors based on fiber
Bragg gratings (FBGs) in 1990 [4] and the photonic crystal fibers (PCFs) in 1996 [5], the
number of papers about intrinsic FP sensors slowly began to rise.
From the year 2005 until 2015, the majority of works are on intrinsic FP
interferometers and the focus of research turned into the cavity designs. New
configurations based on the fusion splicing of special optical fibers [6], the chemical
etching [7], femtosecond laser micromachining [8], excimer laser micromachining [9]
and, more recently, on the focused ion beam (FIB) micromachining [10] have been
investigated. These new sensor devices, besides being easy to produce and reproducible,
are reliable and have low dimensions, which can be of the order of a few micrometers.
In order to provide an overview of the evolution in optical fiber FP cavity sensors, a
thorough description is performed next. The focus was both on the cavities design
evolution that occurred throughout the years and on the sensing measurands. A Table is
presented at the end of this overview, with some of the most important configurations
reported from 2009 to 2015. Besides the configuration, the measurands and respective
sensitivities are considered.

FCUP
Fiber Sensing Based on New Structures and Post-Processing Enhancement
13
2.3 The First Fabry-Perot Interferometer
The Fabry-Perot (FP) interferometer was firstly published in 1897 by Charles Fabry
and Alfred Perot, in the Annales de Chimie et de Physique [11]. Figure 2.2 presents the first
page of one of the most important papers published by the two researchers, entitled Sur
les franges des lames minces argentées et leur application à la measure de petites épaisseurs d’air.
Figure 2.2 – First page of the paper published by Fabry and Perot in 1897 [11].
The simple configuration, depicted in Fig. 2.3, set the basis of one of the
interferometers most widely used currently in optics and photonics. Light from the
electric arc optical source (A) propagates through a system of lenses (L, L’) and will
suffer multiple interferences at the silvered glass (B). At the third lens (L’’), the
transmitted light will be focused and the interference pattern will appear on the display
E.
Figure 2.3 – Fabry-Perot interferometer experimental setup. A stands for the optical source (electric arc in the
original), L, L’ and L’’ are lenses, A’ is a slit, E is the display and B corresponds to the silvered glass [11].

FCUP
Fiber Sensing Based on New Structures and Post-Processing Enhancement
14
2.4 Historical Perspective on Fabry-Perot based Optical Fiber Sensors
In 1979, a double-cavity single-fiber configuration was proposed as a hydrophone
element by Cielo [12]. The reference cavity was situated on the surface, close to the
electronics apparatus, whereas the sensing element was placed under water. Each cavity
was formed by bounding the fiber ends with a reflector and coiling it around a cylinder,
as can be seen of Fig. 2.4 (a), where the proposed configuration is depicted. The spectral
response of a single cavity is shown in Fig. 2.4 (b).
Figure 2.4 – (a) Configuration proposed in 1979 by Cielo [12]. L is the light source coupled to the fiber, R
corresponds to the reflectors, D is the photodetector, and S stands for the servo-control electronics. (b)
Spectral response of a single cavity [12].
In 1981, Yoshino et al. presented a FP-based fiber temperature sensor on the Third
International Conference on Integrated Optics and Optical Fiber Communications [13].
In the same year, Petuchowski et al. proposed a high-finesse and highly sensitive to
phase-shifts fiber optic FP interferometer [14]. A single mode fiber (SMF) with the ends
coated with dielectric partial mirrors constituted the FP cavity. In the same year,
Franzen et al. used a long section of a fiber FP to perform metrology of single frequency
laser sources [15]. They took advantage from the fact that the free spectral range of a FP
cavity is inversely proportional to the cavity length and that using a cavity with high
finesse there is an increase in the frequency resolution of the sensor.
In 1982, Yoshino et al. studied the basic properties of a fiber optic FP interferometer,
namely the finesse, polarization and thermal responses. Besides, the devices were also
characterized in temperature, mechanical vibration, acoustic wave detection, ac voltage,
as well as ac and dc magnetic fields [16]. On the same year, Otsuka performed a
a
)
b
)
a) b)

FCUP
Fiber Sensing Based on New Structures and Post-Processing Enhancement
15
theoretical study on the temporal effects of a light-source on a fiber optic FP
interferometer [17].
The use of uncoated cleaved fiber ends as FP cavity mirrors was proposed in 1983 by
Kersey et al. [3]. The sensor was used in an accelerometer configuration, where it
exhibited high sensitivity and good linearity. In the same year, Kist et al. proposed the
use of FP resonators as temperature-tuned optical spectrum analyzers for the first
time [18].
In 1984, Leilabady et al. used a SMF in a FP configuration to measure the flow
velocity. The operating principle relied on the fiber oscillations induced by the vortex
shedding. In this case, the FP cavity mirrors were formed by one normally cleaved input
and one silvered end. The readings were done in reflection and a linear response was
attained [19].
In 1985, a remote displacement sensor based on an extrinsic FP interferometer was
proposed [20]. Using a two interferometer system, the sensing cavity modulated the
spectrum of the light emitting diode (LED) as a function of the cavity length. Even
though there was a breakthrough with this work, where they used a broadband optical
source and a novel signal processing scheme, the optical fiber was only used to launch
light and collect the interference pattern that resulted from the bulk FP cavity. Following
this sensing concept, a couple of works have been published later to measure pressure
variations [21, 22].
In 1986, the precise measurement of the optical length using a FP interferometer was
proposed [23]. The two mirrors of the FP cavity were formed by the polished, uncoated
ends of a SMF section. The sensor was subjected to temperature measurements, where it
exhibited high sensitivity.
In February 1988, Tseng et al. proposed a temperature sensor that was able to discern
temperature rise from temperature drop [24]. The FP cavity mirrors were created by the
deposition of aluminum mirrors on the fiber ends. In the same month, a major
breakthrough occurred in the field. The ability to produce the dielectric mirrors inside
the optical fiber, by means of splicing, was achieved by Lee et al. [25]. The configuration,

FCUP
Fiber Sensing Based on New Structures and Post-Processing Enhancement
16
shown in Fig. 2.5, allowed the multiplexing of several sensors. The devices were tested to
temperature in a range between 20 °C and 600 °C. This work opened up a new category
of FP based sensors, the intrinsic FP cavities. In a different approach, the use of a short
coherence optical source (LED) to illuminate a multiplexed system with two FP
interferometers was proposed by Farahi et al. in March 1988 [26]. Even though the LED
had had already been used as an optical source in a FP sensor cavity [20], this was the
first time it was employed in a fiber optic extrinsic FP sensing system. The sensor was
tested to temperature. Gerges et al. proposed a miniature hemispherical air cavity FP
interferometer [2]. One of the mirrors was formed by the end face of the optical fiber,
whereas the other mirror was composed by hemispherical reflecting surface. The sensor
was subjected to a small range of temperature variations (40 – 55 °C), where a sensitivity
of 2.155 rad/K was attained. Finally, in that same year and using a configuration similar
to the one previously described [25], Lee et al. proposed a temperature sensor that was
subjected to a temperature variation from -200 °C to 1050 °C, the widest range that had
been reported until that time [27]. Besides, the FP cavity length was very small, of only
1.5 mm. The sensor could be thus considered a point sensor in several applications.
Figure 2.5 – Experimental setup for the evaluation of multiplexed FP sensors [25].
In 1989, Kersey et al. proposed a different way to produce the mirrors of in-line FP
sensors. Fiber ring reflectors were used as low-reflectivity elements [28]. The cross-talk in
an array of four sensors was investigated. In the same year, the application of a FP cavity
shaped as a single-turn helix was proposed as a magneto-optic current sensor [29]. Lee et
al. embedded an intrinsic FP sensor in a graphite-epoxy composite material for the first
time [30]. The sensor was tested to temperature variations from 20 °C to 200 °C.

FCUP
Fiber Sensing Based on New Structures and Post-Processing Enhancement
17
In 1990, a short length all-fiber FP cavity was tested to strain [31]. The sensors were
adhered to the surface of a cantilever beam. Farahi et al. demonstrated an interferometric
technique that allowed the simultaneous measurement of strain and temperature in a
cavity formed in highly birefringent fiber [32]. This was the first work regarding the
simultaneous discrimination of two physical parameters using a FP cavity sensor. In the
same year, Alcoz et al. proposed an ultrasound fiber sensor embedded in plastic and
graphite composite materials [33]. The FP cavity was formed between two dielectric
internal mirrors. Each mirror was fabricated by splicing a fiber coated with a TiO2 film at
one end to an uncoated fiber.
In 1991, Lee et al. proposed an interferometric fiber optic temperature sensor
illuminated with a LED [34]. Two FP intrinsic interferometers with similar cavity lengths
were disposed in series, where one acted as sensor whilst the other was used as a
reference. Still in 1991, a quadrature phase-shifted, extrinsic FP sensor was proposed to
perform dynamic strain measurements [35].
In 1992, the same group proposed an extrinsic FP sensor for the measurement of
strain and crack opening displacement in ceramic materials [36]. The device operated as
strain sensor in a temperature between -200 °C of 900 °C. Santos et al. compared both
theoretically and experimentally the transfer function of low-finesse extrinsic FP sensors
with the typical two-wave interferometer [37]. Also in 1992, Wang et al. proposed a
sapphire optical fiber intrinsic FP sensor for the measurement of high temperature [38].
The FP cavity was formed by splicing a section of sapphire multimode optical fiber to
silica SMF.
In 1993, an extrinsic FP strain sensor based on white-light interferometry was
proposed by Belleville et al. [39]. In the same year, a FP cavity was used as a wavelength
filter for detecting the wavelength shift of a FBG [40]. Finally, Sirkis et al. developed a
new FP-based configuration to be used as strain sensor [41]. A hollow core fiber was
manufactured with the same outer diameter as the SMF. A short section of this fiber was
spliced between two sections of SMF, forming an in-line fiber etalon, as can be seen in
Fig. 2.6.

FCUP
Fiber Sensing Based on New Structures and Post-Processing Enhancement
18
Figure 2.6 - Photograph of the 112 m long in-line fiber etalon proposed by Sirkis et al. in 1993 [41].
In 1994, the design of a FP pressure sensor was proposed for internal combustion
engines [42]. Also in that year, a microlaser based on Er:Yb phosphate-glass fiber within
an extrinsic FP cavity was reported [43]. The cavity was only 100 m long and presented
a continuous wavelength tuning range over 4.52 nm. By using a three-mirror cavity
configuration, single mode operation was achieved.
In 1995, a temperature sensor array was described using low-coherence reflectometry
[44]. The sensor array was composed by several standard FC-PC connectors. Dorighi et
al. proposed a new configuration to stabilize an intrinsic fiber optic FP interferometer
[45]. The sensor was embedded in a solid material in order to detect ultrasound. In the
same year, a new digital signal processing scheme was proposed for the measurement of
pressure in an internal combustion engine [46].
In 1996, a four-wavelength technique was employed to interrogate a low-finesse fiber
optic extrinsic FP interferometer [47]. The device was characterized in vibration and
temperature. The detection of ultrasound using a polymer thin film as a low finesse FP
was proposed by Beard et al. [48]. The ultrasound propagated in a water filled cavity,
which was located between the end face of a multimode fiber (MMF) and the transparent
polymeric film. In the same year, an intrinsic FP pressure sensor was suggested by Kao et
al. [49]. In this configuration, the motion of an epoxy-based diaphragm produced strain
in the FP sensor. Still in 1996, a load sensor based on an extrinsic FP interferometer was
also suggested [50].
In 1997, a low-finesse FP sensor was embedded both in water and epoxy to detect
ultrasound [51]. Chang et al. proposed the employment of a low-finesse readout FP
interferometer to scan a high-finesse FP sensor cavity length [52]. In this case, the sensor
was subjected to static strain measurements. In the same year, an extrinsic FP
interferometer was developed to measure magnetic fields [53]. The cavity was formed

FCUP
Fiber Sensing Based on New Structures and Post-Processing Enhancement
19
between the end face of a SMF section and a Metglas (Fe77.5B15Si7.5) wire-based
magnetostrictive transducer.
In 1998, a high precision displacement sensor was proposed by Wang et al. [54]. The
extrinsic FP cavity was formed between the SMF end and the front surface of a reflective
film, which was glued to a piezoelectric transducer (PZT). The displacement resolution
of the sensor was of 0.005 nm. An intrinsic FP sensor was used to measure the liquid
flow velocity in a pipe [55]. Later that year, an extrinsic FP interferometer was employed
to determine the residual stresses in fiber-reinforced composite materials [56].
In 1999, Du et al. presented for the first time a FP cavity whose mirrors were FBGs,
with the configuration similar to the one presented Fig. 2.7 [57]. The sensor was glued to
an aluminum tube and tested to strain and temperature, where sensitivities of
1.19 pm/ and 14.35 pm/°C were respectively obtained. Also in that year, a three-wave
extrinsic FP interferometer was developed to measure strain and vibration, using digital
phase demodulation [58]. Arregui et al. proposed a humidity sensor based on a nano-FP
cavity [59]. The structure was formed by ionic self-assembly method.
Figure 2.7 – Structure of the fiber Bragg grating FP cavity proposed by Du et al. (adapted from [57]).
In 2000, a new frequency multiplexing method was developed for addressing low
finesse FP sensors using a white light source and a charge-coupled device (CCD) based
monochromator [60]. Three extrinsic FP sensors were multiplexed and tested to strain
and displacement, with accuracy better than 0.01 m. In the same year, Katsumata et al.
reported a FP pressure sensor with a diameter of 125 m for catheter [61]. The silicon-
based sensing element was fabricated through micromachining and attached to the end
of an optical fiber.

FCUP
Fiber Sensing Based on New Structures and Post-Processing Enhancement
20
In 2001, a new extrinsic FP configuration was proposed by Jiang et al. [62]. The end
section of an optical fiber was polished at 45° and placed close to a polymer film on a
steel plate. The sensor was tested to strain and temperature. In the same year, a new
concept of FP interferometer-based temperature sensors was presented by Tsai et al. [63].
The structure, depicted in Fig. 2.8, was obtained by fusion splicing two fibers with
different core diameters. One of the reflective mirrors was produced at the interface
between the fibers, whilst the other was obtained at the fiber/air interface. Finally,
Dahlem et al. proposed the use of FBGs to interrogate low-finesse extrinsic FP cavities,
when subjected to displacement and temperature variations [64].
Figure 2.8 – Structure of the FP temperature sensor proposed by Tsai et al. [63].
In 2002, Chen et al. proposed the use of a white-light interferometry system based on
a scanned Michelson interferometer to interrogate intrinsic FP temperature sensors [65].
The rather complex scheme yielded a resolution of 0.013 °C.
In 2003, a pressure sensor based on an extrinsic FP interferometer was reported [66].
The cavity was formed between a copper diaphragm and the end face of a SMF. The
sensor was embedded in epoxy and applied in the aerodynamic field. The detection of
weak acoustic waves was a subject of study by Yu et al. [67]. Using an extrinsic FP
configuration, these sensors became an alternative to conventional acoustic sensors for
the detection of partial discharges in power transformers.
In 2004, the use of extrinsic FP interferometers to measure nano-displacement, with a
minimum displacement of 10 nm was reported [68]. Other parameters were also
analyzed in similar configurations, such as pressure and temperature [69, 70]. In the
same year, Shen et al. fabricated an intrinsic FP cavity by exposing the photosensitive
fiber to UV radiation [71]. Using a metallic mask, they locally produced the Fresnel

FCUP
Fiber Sensing Based on New Structures and Post-Processing Enhancement
21
reflectors, using the point-by-point technique. The device was subjected to temperature,
strain and pressure variations.
In 2005, Xiao et al. developed an extrinsic FP device for gas sensing [72]. The cavity,
formed between two ferrules, was able to measure the N2 refractive index variation with
a resolution greater than 10-5. A different extrinsic FP cavity was proposed by Xu et al., to
measure pressure and acoustic waves [73]. On the same year, Cibula et al. developed a
new type of miniature intrinsic FP sensors [7, 74]. A hollow structure with ~125 m was
obtained by wet chemical etching a MMF. In a first approach, a thin polymer diaphragm
was positioned inside the hollow structure [74]. Later that year, the same group
developed an all-silica FP cavity [7]. Both devices were tested in pressure of liquids. The
combination of different structures was also a matter of study in 2005, being further
developed since then. For example, Huang et al. proposed the splicing of a MMF section
between two sections of SMF [6]. The sensor was tested to temperatures up to 600 °C and
to strain up to 400 . The simultaneous measurement of the refractive index of liquids
and of temperature was proposed by Kim et al. [75]. In this case, a long period grating
(LPG) was spliced in series to an intrinsic FP cavity whose mirrors were created by
chemically etching a SMF.
In 2006, Zhu et al. proposed a N2 pressure sensor for high temperature [76]. The
sensor was obtained by chemically etching a MMF and using a fused silica diaphragm.
Wang et al. also reported a pressure and temperature sensor based on a SMF/hollow
fiber/SMF diaphragm structure [77]. In this case, pressure measurements were done with
the sensor submerged in water and the device was subjected to temperatures below
600 °C. Watson et al. fabricated the FP cavities using ArF excimer laser ablation [9]. An
aluminized membrane was used as diaphragm and dynamic N2 pressure measurements
were performed. Dynamic strain/bend measurements were done by Cranch et al., using a
multicore fiber FP with FBGs as mirrors [78]. Other strain sensors have been proposed,
whose cavities were created by etching the fibers [79, 80].
In 2007, the etching of optical fibers to produce FP cavities attracted a lot of attention.
Machavaram et al. reported the etching of two SMF sections that formed the intrinsic FP

FCUP
Fiber Sensing Based on New Structures and Post-Processing Enhancement
22
interferometer when spliced together [81]. The sensors were tested in strain and a cavity
length variation of 0.5 nm/ was attained. On the other hand, Cibula et al. produced a
strain sensor by splicing an etched MMF section between two sections of SMF [82].
Zhang et al. proposed a microgap cavity formed by wet etching and splicing SMFs [83].
The multiplexing of two FP cavities enabled the temperature compensation of a
biosensor. The micromachining of cavities in PCFs using a 157 nm excimer laser [84] or
femtosecond laser [8] for strain and temperature measurement were also reported. In
both cases the devices presented low sensitivity to temperature but high sensitivity to
strain. In a different approach, Rao et al. presented, for the first time, a FP cavity based
on a hollow-core PCF section spliced between two SMFs, whose configuration is shown
in Fig. 2.9 [85]. In order to increase the reflectivity, a Ti2O3 film was coated on the lead-
out SMF before splicing. The cavity length was a couple millimeters long and it was
tested to strain. The multiplexing of up to fifty FP cavity sensors was demonstrated by
Wang et al. [86]. Two FBGs constituted the FP cavity interfaces and the devices were
tested to strain and temperature.
Figure 2.9 – Configuration of an in-line hollow-core PCF etalon, proposed by Rao et al. [85].
In 2008, the post-processing of optical fibers by means of laser micromachining
continued to be developed [87-89]. On the one hand, the micromachining exposes the
fiber core region and the FP cavities produced in this way are very sensitive to the
external medium. On the other hand, the sensors are temperature independent. A
different structure was proposed by Rao et al. for refractive index measurements [90]. In
this case, the FP cavity was formed by fusion splicing a section of endlessly single mode
PCF between two sections of SMF. The use of different fiber geometries spliced in series
with SMF and/or PCF enabled high temperature [91] as well as strain [92] sensing. An
humidity sensor was presented by Corres et al. [93]. The device consisted of a tip of SMF

FCUP
Fiber Sensing Based on New Structures and Post-Processing Enhancement
23
coated with a SiO2 super hydrophilic nanofilm. An extrinsic FP temperature and strain
sensors was developed by Jiang et al., by curing epoxy droplets at the end of SMF
sections in order to produce micro-lenses [94].
In 2009, Liu et al. proposed a gas sensor based on a silver layer and a vapor sensitive
polymer layer that were sequentially deposited at the cleaved end tip of a SMF [95]. The
device was able to detect methanol vapor with a sensitivity of 3.5 pm/ppm. A pressure
sensor was described by Cibula et al., whose cavity was obtained by fusion splicing a
SMF to an etched Ge-doped fiber [96]. Morris et al. presented a temperature and acoustic
pressure sensor, constituted by a polymer deposited at the end tip of an optical fiber [97].
Higher fringe visibility was attained through the deposition of two gold mirrors at the
polymer interfaces. Two different configurations were proposed to measure refractive
index variations. The first configuration was a microcavity formed near the fiber end tip
by 157 nm laser micromachining [98]. Two thin films were deposited in the cavity
mirrors and a microchannel was created on the fiber end, enabling the interaction
between the external medium and the microcavity. A sensitivity of 1130 nm/RIU was
attained with this thermal-insensitive device. The second configuration was a
suspended-core fiber spliced between two sections of SMF [99], whose response was
characterized in the spatial frequency domain. The same authors proposed the splice in
series of a suspended core fiber (with three or four holes) and a hollow-core PCF to SMF
[100]. A novel strain and temperature sensor was fabricated and characterized by
Villatoro et al. [101]. An air bubble was created by fusion splicing a PCF and a SMF, as
can be seen in Fig. 2.10. Strain and temperature sensitivities of 2.7 pm/ and 0.95 pm/°C
were respectively achieved. In the same year, Gong et al. proposed a different FP based
interferometer . The device, obtained by splicing an etched Er-doped fiber with
SMF, translated in a sensor with low thermal sensitivity (~0.65 pm/°C) but with good
response to strain, of 3.15 pm/. A hollow-core photonic bandgap fiber spliced between
two sections of SMF was reported by Rao et al. for measurement of temperature below
600 °C [103].

FCUP
Fiber Sensing Based on New Structures and Post-Processing Enhancement
24
Figure 2.10 – Diagram of the configuration proposed by Villatoro et al. [101]. FOC stands for fiber optic
circulator, LED is the light emitting diode and OSA corresponds to the optical spectrum analyzer.
In 2010, several works were related to the measurement of refractive index and
temperature. The use of a dual cavity based on a small section of hollow core fiber
between a MMF and a SMF [104], an etched graded index fiber (GIF) spliced to SMF
[105, 106], or even a hybrid Michelson/FP structure were proposed to measure these
parameters simultaneously [107]. Kou et al. reported for the first time the direct
fabrication of a FP cavity in a fiber taper [10, 108]. The device, shown in Fig. 2.11, was
created using a focused ion beam (FIB) and subjected to liquid refractive index [108] and
high temperature [10] variations. Still in that year, two other configurations were
proposed to measure refractive index. On the one hand, Deng et al. were able to measure
the N2 refractive index using a SMF/hollow core fiber/PCF structure, with sensitivity of
1639 nm/RIU [109]. On the other hand, by coating a SMF tip with an epoxy-based
polymer, Zhao et al. were able to measure the water refractive index variation, with a
sensitivity of ~205 dB/RIU [110]. A temperature sensor based on a short section of all-
silica PCF spliced to SMF was demonstrated [111]. Also to measure temperature, a dual
wavelength Raman fiber laser was employed to interrogate a suspended core fiber based
cavity [112]. An accelerometer based on a hollow-core PCF cantilever structure was
presented by Ke et al. [113]. Finally, a pressure sensor based on an etched optical fiber
with a silica diaphragm was also proposed [114].
Figure 2.11 – Scanning electron microscope image of the FP cavity created using FIB [108] .
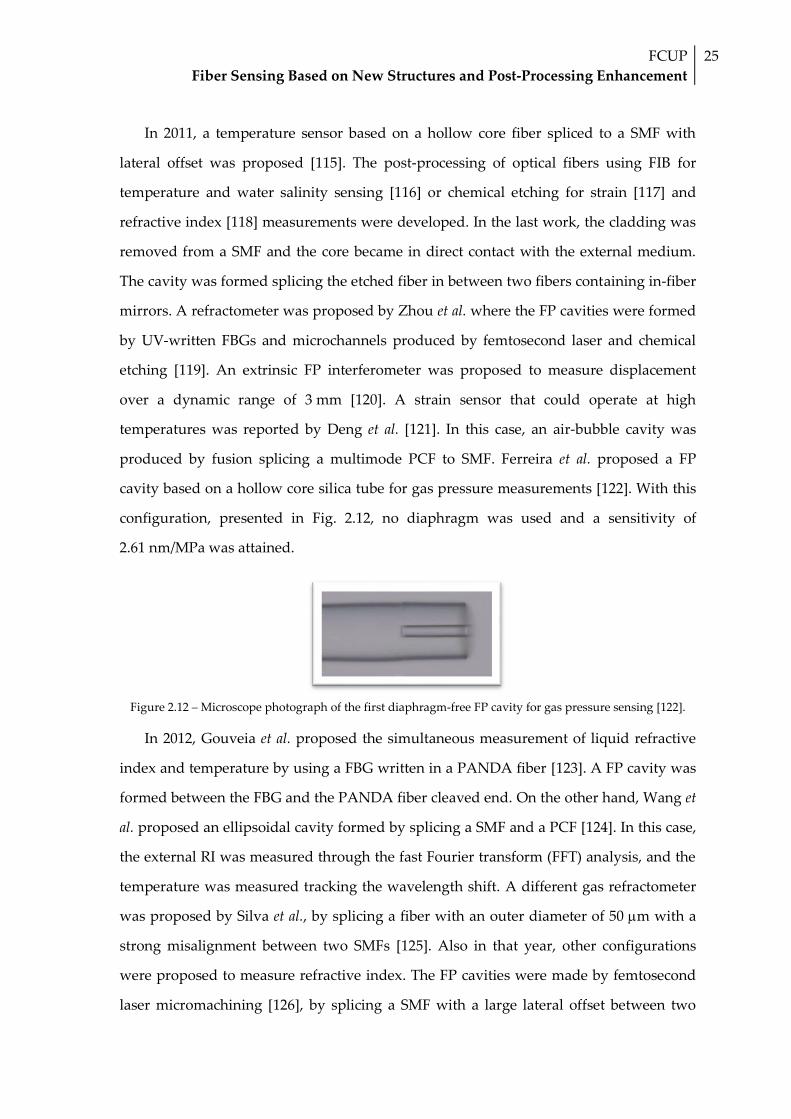
FCUP
Fiber Sensing Based on New Structures and Post-Processing Enhancement
25
In 2011, a temperature sensor based on a hollow core fiber spliced to a SMF with
lateral offset was proposed [115]. The post-processing of optical fibers using FIB for
temperature and water salinity sensing [116] or chemical etching for strain [117] and
refractive index [118] measurements were developed. In the last work, the cladding was
removed from a SMF and the core became in direct contact with the external medium.
The cavity was formed splicing the etched fiber in between two fibers containing in-fiber
mirrors. A refractometer was proposed by Zhou et al. where the FP cavities were formed
by UV-written FBGs and microchannels produced by femtosecond laser and chemical
etching [119]. An extrinsic FP interferometer was proposed to measure displacement
over a dynamic range of 3 mm [120]. A strain sensor that could operate at high
temperatures was reported by Deng et al. [121]. In this case, an air-bubble cavity was
produced by fusion splicing a multimode PCF to SMF. Ferreira et al. proposed a FP
cavity based on a hollow core silica tube for gas pressure measurements [122]. With this
configuration, presented in Fig. 2.12, no diaphragm was used and a sensitivity of
2.61 nm/MPa was attained.
Figure 2.12 – Microscope photograph of the first diaphragm-free FP cavity for gas pressure sensing [122].
In 2012, Gouveia et al. proposed the simultaneous measurement of liquid refractive
index and temperature by using a FBG written in a PANDA fiber [123]. A FP cavity was
formed between the FBG and the PANDA fiber cleaved end. On the other hand, Wang et
al. proposed an ellipsoidal cavity formed by splicing a SMF and a PCF [124]. In this case,
the external RI was measured through the fast Fourier transform (FFT) analysis, and the
temperature was measured tracking the wavelength shift. A different gas refractometer
was proposed by Silva et al., by splicing a fiber with an outer diameter of 50 m with a
strong misalignment between two SMFs [125]. Also in that year, other configurations
were proposed to measure refractive index. The FP cavities were made by femtosecond
laser micromachining [126], by splicing a SMF with a large lateral offset between two

FCUP
Fiber Sensing Based on New Structures and Post-Processing Enhancement
26
SMFs [127], by splicing an etched GIF with a SMF [128], or even using a hollow core fiber
ended with a hollow core silica sphere tip [129]. In the same year, several configurations
were developed to measure strain. For example, spheroidal cavities were formed by
splicing a PCF and a SMF [130, 131], or by splicing one section of cleaved flat tip SMF
and an arc fusion induced hemispherical tip [132]. The splice of a hollow-core ring PCF
fiber between two SMFs was also proposed to measure strain and temperature [133].
Tafulo et al. proposed the use of FP cavities based on chemical etching of multimode
GIFs to produce sensors for high temperature and strain [134, 135]. Zhang et al. proposed
a FP cavity based on a polarization maintaining PCF to measure temperatures up to
600 °C [136]. A FP device based on an endlessly single mode PCF was also characterized
in extreme temperatures, as high as 1100 °C [137]. In order to perform simultaneous
measurement of gas pressure and temperature, Pevec et al. proposed two low finesse FP
resonators created at the tip of an optical fiber [138]. Ferreira et al. used a short section of
hollow core ring PCF spliced to a SMF to measure methane pressure variations. Two
different applications were also considered in 2012. Using an extrinsic FP interferometer,
Lai et al. proposed a liquid level and specific gravity sensor [139]. Wang et al. measured
high intensity focused ultrasound fields by using a silica capillary tube spliced between
two sections of SMF [140].
In 2013, the main focus of research was on refractive index FP sensors. For instance,
by splicing a simplified hollow-core PCF between two SMFs and drilling microchannels
with femtosecond laser, Wang et al. obtained a sensor with a sensitivity of ~851.3 nm/RIU
that was insensitive to temperature [141]. On the other hand, Sun et al. proposed a
hybrid FP/Michelson interferometer to simultaneously measure refractive index and
temperature [142]. Zhang et al. fabricated a cavity by taper-drawing a microfiber at the
center of a uniform FBG [143]. A FP sensor based on an ultra-thin film of gold embedded
in a SMF end face was investigated for refractive index and high temperature
measurements [144]. A couple of structures were also developed for temperature
sensing, such as cavities based on the post-processing of a double cladding optical fiber
[145] and extrinsic FP interferometers [146]. Finally, the splicing of different structures
like the hollow-core microstructured fiber in between two SMFs [147], or an etched MMF

FCUP
Fiber Sensing Based on New Structures and Post-Processing Enhancement
27
between a SMF and a silicon dioxide diaphragm were proposed for pressure sensing
[148].
In 2014, the fabrication of air cavities, or micro-bubbles, inside the optical fiber was
subject of extensive study [149-151]. These FP cavities were mainly applied in strain and
temperature sensing, and astonishing sensitivities were achieved, as can be seen in
Table 2.1. The post-processing of optical fibers, by means of chemical etching [152, 153],
FIB micromachining [154], or tapering [155], also translated in new sensing FP
configurations with good responses. A high speed interrogation scheme was developed
for high temperature measurements [156]. A miniature configuration based on a double-
core PCF spliced to SMF was subjected to temperatures below 900 °C [157]. Liao et al.
presented a sub-micron silica diaphragm based fiber tip FP interferometer that presented
a response of ~1036 pm/MPa to gas pressure changes [158]. Also in this year, a novel
type of sensor based on an extrinsic FP interferometer and a magnetic fluid was
reported. It was observed that the refractive index of the magnetic fluid changes with the
increase of the magnetic field, enabling a magnetic field sensitivity of 0.0431 nm/Gs.
Until June 2015, several works were published concerning FP-based fiber sensors.
Eom et al. proposed an extrinsic FP configuration constituted by a lensed fiber and a
polymeric diaphragm [159]. The sensor was tested in low pressure range and was
proposed for the medical field. Lee et al. reported on the measurement of the thermo-
optic coefficient of liquids using a structure composed by two hollow core fibers with
different diameters [160]. Besides, Sun et al. designed a FP interferometer for the
simultaneous measurement of pressure and temperature [161]. The sensor head was
based on a polymer capped on the end face of a SMF. The simultaneous measurement of
refractive index and temperature was studied by Wu et al., by using a cavity based on a
multimode PCF with collapsed ends to create thin films [162]. A FP cavity based on the
deposition of a magnetostrictive material in the fiber, between two FBGs, was proposed
as a magnetic sensor by Li et al. [163]. The measurement of dynamic displacement was
addressed by Pullteap et al. [164]. An extrinsic FP interferometer was used, where a
birefringent element was introduced between the fiber and the vibration target. Also in
2015, a strain sensor based on a rectangular air bubble was proposed by Liu et al. [165].

FCUP
Fiber Sensing Based on New Structures and Post-Processing Enhancement
28
The bubble was created by splicing two sections of SMF and tapering the splicing joint.
For an air bubble of ~61 m, a sensitivity to strain of 43 pm/ was achieved. Chen et al.
proposed an ultraweak intrinsic FP cavity array for distributed temperature sensing
[166]. An high-resolution and fast-response temperature sensor based on a silicon FP
cavity was also described [167]. A FP temperature sensor based on differential pressure
resulting from thermal expansion of sealed air was developed by Liu et al. [168]. A
salinity sensor was obtained by using a FP cavity with a polyimide diaphragm. With
such configuration, a maximum sensitivity of 0.45 nm/(mol/L) was achieved [169].
The main characteristics of the different intrinsic FP sensors reported since 2009 until
2015 are gathered in Table 2.1. Multiple configurations have been explored in these
years. The reduced dimensions of the cavities stand out, since most of them are in the
order of a few hundred micrometers. Notice also the different measurands and the
ranges over which the sensors were tested. The most popular ones seem to be strain and
temperature, and the highest measurement range achieved was of 5000 for the former
and ~950 °C for the last. Depending on the configuration, it is possible to obtain sensor
with very good sensitivity to temperature (for example, -6.71 nm/°C [149]) or with
extremely low sensitivity to this parameter, thus enabling the measurement of different
parameters with low cross-sensitivity (as in the case of [142], for example, where the
sensitivity to temperature is only 0.27 pm/°C). The wide variety of possible
configurations and the high versatility of these kinds of structures are an indication that
there is still room for research and development in this field, even though the first steps
were taken 36 years ago.
Table 2.1 - Different fiber optic intrinsic FP sensors, with the respective characteristics, from 2009-2015.
Year Configuration Length
(m) Measurand Range Sensitivity Ref.
2009 Air bubble between PCF
and SMF
58
22
Strain
Temp.
0-5000
23-500 °C
2.7 pm/
0.95 pm/°C [101]
2009
SMF + 3 holes suspended
core + hollow core PCF ~840
Strain
Temp.
0-1000
23-90 °C
1.32 pm/
7.65 pm/°C [100]
SMF + 4 holes suspended
core + hollow core PCF ~1000
Strain
Temp.
0-1000
23-90 °C
1.16 pm/
8.89 pm/°C
2009 SMF + etched Er-doped fiber 27 Strain
Temp.
0-800
23-80 °C
~3.15 pm/
~0.65 pm/°C [102]

FCUP
Fiber Sensing Based on New Structures and Post-Processing Enhancement
29
2009
157 nm laser
micromachining cavity +
microchannel + mirrors
coated with thin film
25 Liquid RI
Temp.
1.33-1.405 RIU
0-70 °C
~1130 nm/RIU
~0.8 pm/°C [98]
2010 SMF + etched GIF (hybrid
structure) 505
Liquid RI
Temp.
1.32-1.45 RIU
15-90 °C
~160 dB/RIU
~10.4 pm/°C [106]
2010 SMF + etched GIF (hybrid
structure)
25
515
Liquid RI
Temp.
1.32-1.47 RIU
15-90 °C
~45.05 dB/RIU
~11.5 pm/°C [105]
2010 Fiber taper + FIB
micromachining 4.4 Temp. 19-520 °C ~20 pm/°C [10]
2010 Fiber taper + FIB
micromachining 3.5 Liquid RI 1.355-1.375 RIU 110 nm/RIU [108]
2010
SMF + microstructured fiber
with dual core (hybrid
structure)
~11500 Strain
Temp.
0-1000
0-60 °C
0.89 pm/
14.22 pm/°C [107]
2010 SMF tip coated with
polymer thin film 29.9 Liquid RI 1.314-1.365 RIU ~250 dB/RIU [110]
2011
Two UV-written FBGs +
microchannels inscribed by
fs-laser
1000 Liquid RI 1.43-1.49 RIU 9 nm/RIU [119]
2011 Air bubble between SMF +
MM PCF 44.9
Strain
Temp.
0-1850
23-750 °C
2.78 pm/
pm/°C [121]
2011 SMF + hollow core silica
tube 141
Gas
Pressure
Temp.
0-1.0 MPa
23-950 °C
2.61 nm/MPa
8.11 pm/°C [122]
2012 Spheroidal cavity between
SMF and PCF 10 Strain 0-1000 10.3 pm/ [130]
2012
Microbubble between flat
tip SMF + hemispherical tip
SMF
~100 Strain
Temp.
0-1000
100-1000 °C
4 pm/
0.9 pm/°C [132]
2012 SMF + hollow core ring PCF 508
CH4
Pressure
Temp.
0-0.8 MPa
23-500 °C
0.82 nm/MPa
3.77 pm/°C [170]
2012 SMF + PM-PCF with lateral
offset ~100 Temp. 33-600 °C 13.8 pm/°C [136]
2012 SMF + large lateral offset
SMF + SMF 416 Gas RI
1.0002-1.0025
RIU 1540 nm/RIU [127]
2012 Ellipsoidal cavity between
SMF + PCF ~14
Liquid RI
Temp.
1.332-1.45 RIU
24-95 °C
~61.74 dB/RIU
15 pm/°C [124]
2012 SMF + hollow core ring PCF
+ SMF ~13 Strain 0-1000 15.4 pm/ [133]
2012 SMF + 50 m diameter fiber
+ SMF 2000
Gas RI
Temp.
1.000-1.003 RIU
0-300 °C
-1375 nm/RIU
25.6 pm/°C [125]
2012
SMF + etched GIF625 105 Strain
Temp.
100-1200
23-400 °C
6.99 pm/
0.95 pm/°C [134]
SMF + etched GIF50 43 Strain
Temp.
100-1200
23-400 °C
4.06 pm/
-0.84 pm/°C
2013 SMF + hollow core PC+SMF
+ fs laser drilled channels 48
Liquid RI
Temp.
1.322-1.334 RIU
100-900 °C
851.3 nm/RIU
0.27 pm/°C [141]

FCUP
Fiber Sensing Based on New Structures and Post-Processing Enhancement
30
2013 SMF + gold ultra-thin film +
SMF 55
Liquid RI
Temp.
1.3-1.46 RIU
23-800 °C
-19.8 dB/RIU
13 pm/°C [144]
2013 SMF + etched double clad
optical fiber ~130 Temp. 150-900 °C 14.6 pm/°C [145]
2014 Air cavity between 2 SMFs 46 Strain
Temp.
0-1100
100-600 °C
6.0 pm/
1.1 pm/°C [150]
2014
Air bubble and liquid in
hollow core fiber, with taper
plug
31 Temp. 25-39 °C -6.71 nm/°C [149]
2014
SMF + etched P-doped fiber
+ coreless all silica MMF and
FIB post-processing
172 Temp. 100-300 °C 11.5 pm/K [154]
2014 SMF + microfiber + SMF 21 Strain
Liquid RI
0.05-0.35 N
1.326-1.336 RIU
~200 pm/
1330.8nm/RIU [155]
2014
Silica cavity &
spheroidal cavity,
both formed in a hollow
annular core fiber
392 Strain
Temp.
0-1500
23-500 °C
1.1 pm/
13 pm/°C [151]
50 Strain
Temp.
0-1500
23-500 °C
5.2 pm/
1.3 pm/°C
2014 SMF + double-core PCF ~72.3 Temp. 30-900 °C 13.9 pm/°C [157]
2014 Air bubble in SMF with sub-
micron silica diaphragm
~0.5
(diaph.)
Gas
pressure 0-2.0 MPa ~1036pm/MPa [158]
2014
SMF + etched double clad
optical fiber + SMF-based
diaphragm
~80
Temp. air
Temp.
water
23-85 °C 13.5 pm/°C
9.4 pm/°C [152]
2015 SMF + dual hollow core
fibers 33.84
Temp. in
liquids 20-60 °C -0.4810 nm/°C [160]
2015 Polymer capped on the end
face of SMF 35.1
Pressure
Temp.
0-2.8 MPa
40-90 °C
1.13 nm/MPa
0.249 nm/°C [161]
2015 Rectangular air bubble
between SMFs ~61
Strain
Temp.
0-500
25-100 °C
43 pm/
2.0 pm/°C [165]
2015 SMF + silicon pillar 200 Temp. 20-100 °C 84.6 pm/°C [167]
2015 MMF + Pyrex glass + silicon
diaphragm ~32 Temp. -50-100 °C 6.07 nm/°C [168]
2015 SMF + hollow core fiber +
polyimide diaphragm 170 Salinity
0-5.47
nm/(mol/L)
0.45
nm/(mol/L) [169]

CHAPTER THREE
3 Fabry-Perot Cavities Based on Hollow Core
Interferometric Tips


FCUP
Fiber Sensing Based on New Structures and Post-Processing Enhancement
33
3.1 Introduction
Hollow core structures, such as the silica tube or the hollow core photonic crystal
fiber (PCF), have been widely explored by the scientific community over the last two
decades. The first sensor based on a hollow core silica tube was proposed in 1993 by
Sirkis et al. [41] and it was used for strain sensing. Since then, this simple structure was
applied in a wide variety of configurations and found different applications such as in
humidity sensing [171], microfluidic refractive index sensing [172], in the measurement
of the thermo-optic coefficient of liquids [160], temperature [91, 149, 173], refractive
index [104] and pressure sensing [77]. A hollow core silica tube was also used as a spatial
optical filter and it was characterized in strain, temperature and refractive index [174].
On the other hand, the hollow core PCF is extremely attractive for biological [175]
and chemical applications. Considering the latter case, the detection of molecules in
liquid media [176-180] or gas sensing [181-183] have been proposed. The structure is
highly suitable for such applications due to the strong interaction of light with the
analyte, provided by the large hollow area where light propagates. Zhao et al. proposed
the filling of a hollow core PCF with magnetic fluid for the measurement of magnetic
fields [184]. Strain and temperature measurements were also addressed by incorporating
the hollow core PCF in a Fabry-Perot (FP) configuration [85], in a modal interferometer
[185] and in a Sagnac interferometer [186].
The measurement of pressure in liquid or gas media using optical fiber sensors has
been the subject of extensive research. There are many possible direct applications in
industry, namely in hazardous environments, where high resolution gas pressure
sensors are required. On the other hand, given the biocompatibility of silica, and the
reduced dimensions of these sensors, they become attractive solutions for liquid low-
pressure measurements, in the range of physiological activity pressures. Many different
types of gas sensors have been proposed over the last years. For instance, Kao et al.
reported the use of a FP cavity with internal mirrors bonded at one end to a stainless-
steel diaphragm that was subjected to air pressure variations [49]. In 2004, the use of an

FCUP
Fiber Sensing Based on New Structures and Post-Processing Enhancement
34
extrinsic FP interferometer was proposed to measure nitrogen (N2) pressure [69, 72].
From the relationship between pressure and refractive index of N2, it was possible to
monitor the changes in the gas refractive index.
The development of gas pressure sensing structures at the tip of the optical fiber
usually comprises the use of a hollow core section and a thin diaphragm. The hollow
section can be obtained by using, for example, a hollow core silica tube [77, 109, 187],
etched multimode fibers [138, 188, 189] or even UV-molded polymers [190]. Regarding
the diaphragm, it can be made of a polymeric material [74], of a polymer-metal
composite [190, 191], or it can be constituted of fused silica [7, 114]. A FP cavity based on
a polymer droplet at the tip of a fiber has also been proposed [161]. Long period gratings
written in PCFs were also tested for the measurement of argon (Ar) pressure [192]. Duan
et al. spliced a short section of single mode fiber (SMF) in between two sections of SMF
with a large lateral offset and tested it under air pressure variations [127]. Silva et al.
spliced a 50 m diameter optical fiber between two sections of SMF and tested it in a N2
atmosphere with variable pressure [125]. Table 3.1 collects sensitivities attained by
several groups for the measurement of gas pressure.
Table 3.1 - Different fiber optic gas pressure sensors based on FP configurations, with the respective
characteristics.
Year Configuration Gas Sensitivity Comments Ref.
2005 Air gap between two
SMFs in ferrule N2 4.17 nm/MPa Extrinsic configuration [72]
2005 SMF + step index +
etched GIF + step index N2 -39.21 nm/MPa Air gap variation [188]
2011 SMF + hollow core
silica tube N2 2.61 nm/MPa Diaphragm-free [122]
2012 FBG + UV molding
polymer FP cavity air 1537.4 nm/MPa Cavity length variation [190]
2012 SMF + etched GIF +
hollow core silica tube
O2
CO2
3.6 nm/MPa
6.4 nm/MPa
Two different cavities;
maximum sensitivities [189]
2012 SMF + hollow core ring
PCF N2 3.04 nm/MPa Diaphragm-free [170]
2014 SMF + air bubble with
thin diaphragm air ~1.036 nm/MPa
All-silica, ultra-thin
diaphragm [158]
2015 SMF + pendant polymer
droplet air 1.130 nm/MPa Polymer cavity [161]

FCUP
Fiber Sensing Based on New Structures and Post-Processing Enhancement
35
In this Chapter, two different configurations are proposed for the measurement of
pressure in a gas atmosphere. The first device is a diaphragm-free FP interferometer
based on a hollow-core silica tube, whereas the second device is based on a diaphragm-
free hollow core ring PCF. Both sensors are also characterized in temperature. The
simplicity of fabrication and the reproducibility of the results make the former device a
good alternative to other optical fiber pressure sensors. The second configuration, on the
other hand, due to its physical characteristics, translates into a robust, reliable and easy
to produce device, which presents higher sensitivity to N2 pressure than the one based
on the hollow core silica tube. Finally, a different application of the hollow core ring PCF
is addressed. In this case, the FP cavity has a polymeric diaphragm, which is tested in a
liquid environment where it is possible to monitor pressure changes in the range of the
intravascular pressure variations.
3.2 Theoretical Considerations
The measurement of the refractive index of gases has been a challenge for the
scientific community. The behavior of a gas in a sealed container is highly complex due
to the extremely large amount of particles involved and the degrees of freedom they can
show. The treatment of such system is, therefore, of a statistical nature. Instead of
looking at the movement of a single particle, it is more suitable to study the macroscopic
quantities that come as a result of the interactions of all particles contained in the closed
system, such as energy, pressure or temperature [193]. Statistical physics indicates that in
a sealed chamber the refractive index of a gas, related to its density, depends on three
different parameters, as will be shown later: wavelength of operation, pressure and
temperature.
The sensors described in this Chapter were subjected to N2 and methane (CH4) gas
pressure changes, starting from low vacuum (~10-3 MPa) up to 1 MPa. Considering, for
simplicity, a FP cavity with low reflectivity mirrors, it can be approximated by a two-
wave interferometer. In such case, the reflection spectrum is essentially determined by
the phase difference, , between the waves generated in the two reflections [147]:

FCUP
Fiber Sensing Based on New Structures and Post-Processing Enhancement
36
4
,eff FP
n L
(3.1)
where neff is the effective refractive index of light travelling within the cavity, LFP is the
cavity length and corresponds to the operation wavelength. When 2m , where m
is an integer, the reflection spectrum reaches a maximum, which happens for the
wavelengths:
2
.eff FP
n L
m (3.2)
If there is an external perturbation to the cavity, both neff and FPL can be affected,
translating into a phase change which affects the cavity channeled spectrum. When the
external perturbation is caused by pressure changes (p), the sensitivity of the cavity can
be determined by differentiating Eq. 3.2:
.eff FP
eff FP
n Ld
dp n p L p
(3.3)
Since
22
,effFP
eff FP
nL
n m L m
(3.4)
by substituting Eqs. 3.4 into Eq. 3.3, it comes that
22
.eff effFP FP
n nL Ld
dp m p m p
(3.5)
Dividing orderly Eq. 3.5 by Eq. 3.2, the wavelength dependence on the applied
pressure is given by
1 1
.eff FP
eff FP
n Ld
dp n p L p
(3.6)
Thus, the sensor interferometric spectral response to the applied pressure, which
corresponds to a phase variation, is the result of two contributions: the dependence of
the effective refractive index on pressure and the change of the FP cavity length with this

FCUP
Fiber Sensing Based on New Structures and Post-Processing Enhancement
37
parameter. However, for the silica based sensors presented in this Chapter, the variation
of the cavity length with pressure is extremely small and can be ignored. Thus, the
dominant effect here is the change of the neff with the applied pressure.
On the other hand, the refractive index of a gas is dependent on three different
parameters: wavelength, temperature and pressure, as previously mentioned. There are
several equations in the literature for the calculation of the gas refractive index [194-198].
However, the ranges of validity are extremely limited. Regarding the measurement of N2
with optical fiber sensors, several authors used the updated Édlen’s equation for air as a
first approximation [194]. Besides the fact that this equation is only valid for
wavelengths between 350 nm and 650 nm, and for low pressure (close to atmospheric
pressure), air is constituted by several components: 78.09% N2, 20.95% O2, 0.93% Ar,
0.03% CO2 [194, 199].
Recently, Zhang et al. reported precision measurements for the refractive index of N2,
among other gases [200]. A Mach-Zehnder interferometer setup was used, where the
light source was a frequency comb. The derived equations were based on the works of
Édlen [194], Birch et al. [199, 201], and Bönsch et al. [202], and were compared with the
results of Peck et al. [203]. Here are summarized the main results, which set the basis for
the conversion of pressure into refractive index variations for N2. According to Édlen, the
refractive index of a gas can be determined by
( 1) ( 1) ,Tp
Tp S
S
Dn n
D (3.7)
where (n-1)Tp depends on temperature, T (in °C), and pressure, p (in Pa), and (n-1)s is
obtained for the refractive index under standard conditions (101325 Pa and 15 °C), and
only depends on the wavelength (in m). DTp is the density factor and DS is the density
factor for standard gas conditions. In order to determine DTp, it is necessary to estimate
first the compressibility factor, Z. Using the equation of state as defined by Édlen [194] ,
,pV
ZRT
(3.8)
FCUP
Fiber Sensing Based on New Structures and Post-Processing Enhancement
38
the dependence of Z on temperature at 101325 Pa (1 atm) can be obtained from the tables
reported in the literature. In this Eq. Zhang and co-workers used the ones from NIST
[204]. There is also an older publication [205] where these values can be found. Anyway,
according to Zhang et al.,
2 81 101325 0.449805 0.01177 0.00006 10 .Z T T (3.9)
Édlen also stated that Z is a function of pressure and temperature, according to
1T
Z p , where T is a parameter that depends linearly on temperature. Combining
this relation with Eq. 3.8, Tp can be estimated and substituted in Eq. 3.10 for the density
factor, which is then given by [202]
1 1 / 6
,1
T
Tp
p nD p
T
(3.10)
where 11 273.15 ,K and ( 1) K / (1 )n p T
is a correction factor, given by the
mean values of temperature and pressure considered. K is determined through the
refractive index of N2 at standard conditions. The density factor is then
2 81 0.498526 0.0119484 0.00006 10
.1 0.0036610Tp
p T TD p
T
(3.11)
Thus, the relationship between the refractive index term dependent on the temperature
and pressure and the refractive index term dependent on the wavelength is given by
( 1) ( 1) ,94439.27
Tp
Tp S
Dn n (3.12)
where
8
2
3073864.9( 1) 10 6497.378
144 1S
n
(3.13)
is the dispersion curve given by Peck et al. for a temperature of 15 °C [203]. The reason
why this equation has been adopted is because it is valid from ~470 nm to ~2060 nm,
being in better agreement with our experimental conditions than the one proposed by
Zhang and co-workers. Fig. 3.1 (a) shows the numerical curve obtained for the variation

FCUP
Fiber Sensing Based on New Structures and Post-Processing Enhancement
39
of (n-1)S with wavelength. Figure 3.1 (b) shows the value of (n-1)Tp at a constant
temperature of 20 °C and a constant wavelength of 1550 nm, as a function of pressure.
0.0 0.4 0.8 1.2 1.6 2.02.75
2.85
2.95
3.05
3.15
3.25
(n-1
) s 1
0-4(R
IU)
(m)
a)
0.0 0.2 0.4 0.6 0.8 1.01.0000
1.0005
1.0010
1.0015
1.0020
1.0025
1.0030
b)
nT
p (
RIU
)p (MPa)
Figure 3.1 – Numerical curves obtained for the refractive index of N2 considering (a) the dependence on
wavelength, and (b) the dependence on pressure, at a temperature of 20 °C and a constant wavelength of
1550 nm. RIU stands for refractive index units.
The refractive index dependence on the wavelength is nonlinear, decreasing as this
parameter increases. However, over the operation wavelength range used in this work,
the variation is very small, of the order of 10-7 RIU, and can thus be considered constant.
Regarding the variation with pressure, the behavior is linear and the change is more
significant, as shown in Fig. 3.1 (b).
In this Section, a method to infer the variation of the refractive index of a gas with
the applied pressure was described. Using the previous equations, it is possible to
determine indirectly the response of a sensor to this parameter. This matter will be
discussed in Section 3.3.3.
3.3 Fabry-Perot Cavity Based on a Silica Tube
The Fabry-Perot (FP) cavity developed in this work was based on a hollow-core silica
tube, which was produced at the Leibniz Institute of Photonic Technology (IPHT – Jena).
The silica tube was made of pure silica and presented an outer diameter of (125 ± 5) µm
and an inner diameter of (20 ± 5) µm. The cross-section photograph of this structure is
shown in Fig. 3.2.
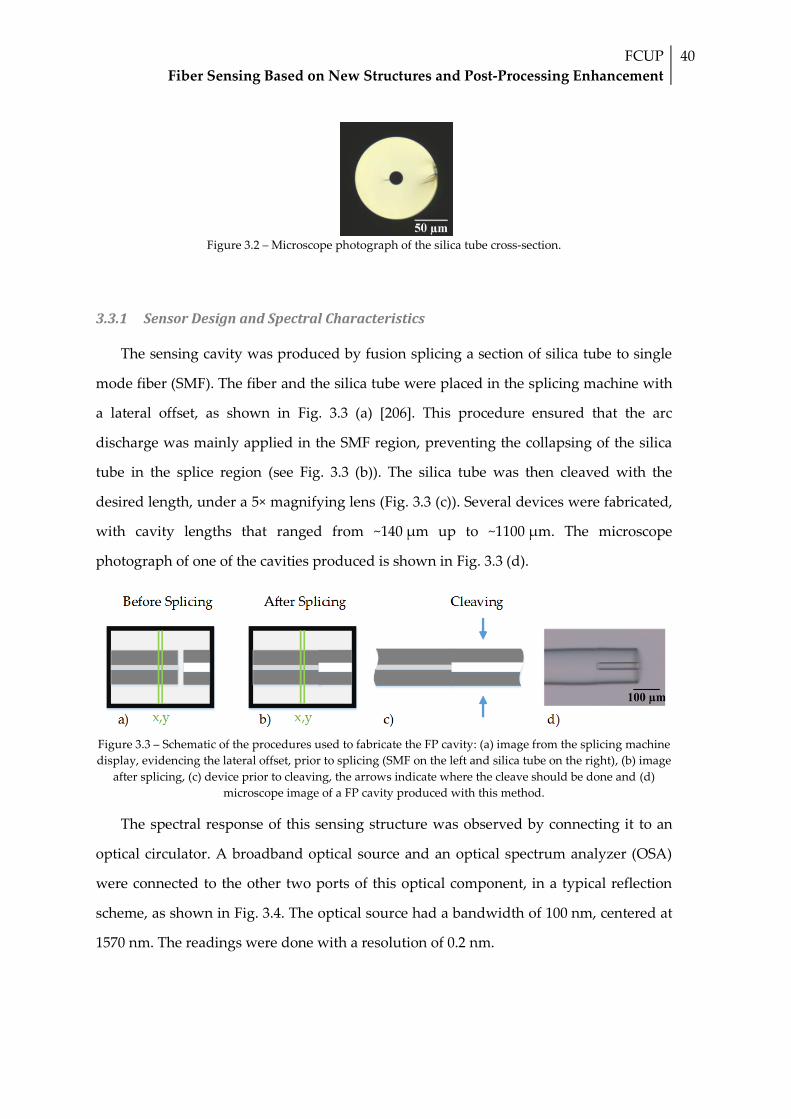
FCUP
Fiber Sensing Based on New Structures and Post-Processing Enhancement
40
Figure 3.2 – Microscope photograph of the silica tube cross-section.
3.3.1 Sensor Design and Spectral Characteristics
The sensing cavity was produced by fusion splicing a section of silica tube to single
mode fiber (SMF). The fiber and the silica tube were placed in the splicing machine with
a lateral offset, as shown in Fig. 3.3 (a) [206]. This procedure ensured that the arc
discharge was mainly applied in the SMF region, preventing the collapsing of the silica
tube in the splice region (see Fig. 3.3 (b)). The silica tube was then cleaved with the
desired length, under a 5× magnifying lens (Fig. 3.3 (c)). Several devices were fabricated,
with cavity lengths that ranged from ~140 µm up to ~1100 µm. The microscope
photograph of one of the cavities produced is shown in Fig. 3.3 (d).
Figure 3.3 – Schematic of the procedures used to fabricate the FP cavity: (a) image from the splicing machine
display, evidencing the lateral offset, prior to splicing (SMF on the left and silica tube on the right), (b) image
after splicing, (c) device prior to cleaving, the arrows indicate where the cleave should be done and (d)
microscope image of a FP cavity produced with this method.
The spectral response of this sensing structure was observed by connecting it to an
optical circulator. A broadband optical source and an optical spectrum analyzer (OSA)
were connected to the other two ports of this optical component, in a typical reflection
scheme, as shown in Fig. 3.4. The optical source had a bandwidth of 100 nm, centered at
1570 nm. The readings were done with a resolution of 0.2 nm.

FCUP
Fiber Sensing Based on New Structures and Post-Processing Enhancement
41
Optical Source Optical Circulator
FP cavity
Splice
OSA
Figure 3.4 – Scheme of the experimental setup.
When the broadband optical source is used in such a reflection scheme, light
travelling in the SMF will be reflected at the SMF/silica tube interface. However, a
fraction of light is also transmitted onto the walls of the hollow core silica tube. When the
light reaches the end face of the silica tube, Fresnel reflection takes place and a fraction of
this light is recoupled once again into the SMF (see Fig. 3.5). Also shown in Fig. 3.5 is the
photograph of one sample with a large length of silica tube (of the order of centimeters),
when illuminated with a He-Ne laser. The reason why such a cavity length was used
was to diminish the intensity of light that would travel in the hollow core region, thus
enabling the clear observation of light propagating in the silica tube wall.
Figure 3.5 – Left: Scheme of the sensing head, highlighting the reflections occurring in the cavity. Right: cross
section photograph of one sample when illuminated with a He-Ne laser.
The spectral behavior of four different samples is shown in Fig. 3.6. The spectrum of
Fig. 3.6 (a), which corresponds to a cavity length of (141 ± 5) m, can be approximated to
a two-wave interferometer. The increase of the cavity length translates into an excitation
of more cladding modes, giving rise to one beat (Fig. 3.6 (b)) or even two different beats,
as evidenced in Figs. 3.6 (c - d).

FCUP
Fiber Sensing Based on New Structures and Post-Processing Enhancement
42
1540 1550 1560 1570 1580 1590-28.0
-27.0
-26.0
-25.0
-24.0
d)c)
b)O
pti
cal
Po
wer
(d
B)
Wavelength (nm)
LFP
= 141 ma)
1540 1550 1560 1570 1580 1590-25.0
-24.0
-23.0
-22.0
-21.0
-20.0
Op
tica
l P
ow
er (
dB
)
Wavelength (nm)
LFP
= 456 m
1540 1550 1560 1570 1580 1590-23.4
-23.2
-23.0
-22.8
-22.6
-22.4
-22.2
Op
tica
l P
ow
er (
dB
)
Wavelength (nm)
LFP
= 670 m
1540 1550 1560 1570 1580 1590-26.0
-24.0
-22.0
-20.0
-18.0
-16.0
Op
tica
l P
ow
er (
dB
)
Wavelength (nm)
LFP
= 1100 m
Figure 3.6 – Spectra of four sensing heads with different FP cavity lengths.
This effect can also be observed in the spatial frequency spectra presented in Fig. 3.7.
In the case of the shorter cavity, although several modes are excited in the silica tube,
only one is recoupled in the SMF, translating into the strong mode observed in
Fig. 3.7 (a). For the other samples strong cladding modes, as well as weak ones are
excited and involved in the interference. The interference peak with lowest spatial
frequency, present in all cases, is related to the optical source.
0.0 0.2 0.4 0.6 0.8 1.0 1.2 1.4 1.6 1.8 2.00.0
0.1
0.2
0.3
0.4
0.5
d)c)
b)
Strong modes
Strong modes
Strong modes
Am
pli
tud
e (a
.u.)
Number of Fringes / nm
LFP
= 141 mStrong mode
a)
0.0 0.2 0.4 0.6 0.8 1.0 1.2 1.4 1.6 1.8 2.00.0
0.1
0.2
0.3
0.4
0.5
Am
pli
tud
e (a
.u.)
Number of Fringes / nm
LFP
= 456 m
0.0 0.2 0.4 0.6 0.8 1.0 1.2 1.4 1.6 1.8 2.00.0
0.1
0.2
0.3
0.4
0.5
Weak modes
Weak modes
Am
pli
tud
e (a
.u.)
Number of Fringes / nm
LFP
= 670 m
0.0 0.3 0.6 0.9 1.2 1.5 1.8 2.1 2.4 2.7 3.00.0
0.1
0.2
0.3
0.4
0.5
Am
pli
tud
e (a
.u.)
Number of Fringes / nm
LFP
= 1100 m
Figure 3.7 – Spatial frequency spectra for four different cavity lengths.

FCUP
Fiber Sensing Based on New Structures and Post-Processing Enhancement
43
The spectral behavior of the cavity, and consequently, the spatial frequency spectra,
are intimately related to the quality of the splices and the end face cleave. Sensors with
poor quality present lower spectral visibility and the number of modes that propagate in
the cavity can be reduced, as in the case of the sensor with a length of (670 ± 5) m (Figs.
3.6 (c) and 3.7 (c)).
The subtraction of the wavelengths of two adjacent peaks,2 1
, corresponds
to the free spectral range (FSR). This parameter is related to the length of the cavity, LFP,
by the equation
1 2 .
2eff FP
n L
(3.14)
where it was considered that 1 2, so that the effective refractive index, neff(), was
constant. Thus, from this relationship it is possible to estimate the neff within the cavity.
The length of each sensing device was measured through the microscope photographs,
whereas the two adjacent peak wavelengths were obtained from the sensing heads
spectral response. The relationship between and LFP is shown in Fig. 3.8. From the
fitting tendency curve, the neff was estimated to be (1.32 ± 0.03) RIU. The value obtained is
closer to the refractive index of silica than the refractive index of air, which indicates that
a significant fraction of light propagates inside the silica tube walls.
100 200 300 400 500 600 700 800 900 1000 1100 12000
1
2
3
4
5
6
7
Fre
e S
pec
tra
l R
an
ge
(nm
)
Cavity Length (m)
Figure 3.8 – Free spectral range dependence on the cavity length, considering two adjacent peaks with
wavelengths close to 1550 nm.

FCUP
Fiber Sensing Based on New Structures and Post-Processing Enhancement
44
3.3.2 Temperature Measurement
The 141 m long sensing device was placed inside a tubular oven, in a centered
position. The temperature was increased in steps of 50 °C, with an equipment resolution
of 0.1 °C. The range of temperatures was between room temperature (~23 °C) and 950 °C.
The wavelength shift with the applied temperature was determined by tracking the
1556.6 nm peak, and it is shown in Fig. 3.9. The experimental results were well adjusted
by the second order polynomial
6 2 31.2 0.2 10 6.5 0.3 10 1556.3 0.1 ,T T (3.15)
where λ is the wavelength, in nm, and T corresponds to the temperature, in °C. It is
reasonable to divide the temperature range into two different regions: low temperatures,
between room temperature and 500 °C, and high temperatures, between 550 °C and
950 °C. According to the insets in Fig. 3.9, a linear behavior is observed in both cases. The
sensitivities obtained were (7.1 ± 0.2) pm/°C and (8.1 ± 0.2) pm/°C, respectively.
0 100 200 300 400 500 600 700 800 900 10001556
1557
1558
1559
1560
1561
1562
1563
1564
Wa
vel
eng
th (
nm
)
Temperature (C)
0 100 200 300 400 500 6001556
1557
1558
1559
1560
1561
Wa
vel
eng
th (
nm
)
Temperature (C)
500 600 700 800 900 10001560
1561
1562
1563
1564
Wa
vel
eng
th (
nm
)
Temperature (C)
Figure 3.9 – Temperature response of the 141 m long sensing head. Inset 1 (top left): low temperatures
response; inset 2 (bottom right) high temperatures response.
3.3.3 Pressure Measurements
Pressure measurements were carried out on four different samples, one with
(170 ± 5) m cavity length, which still presented the two wave interferometer behavior,
and the remaining three were the ones presented in Fig. 3.6 (b-d). The sensors were
placed inside a sealed chamber, with a gas input and a low-vacuum purge output

FCUP
Fiber Sensing Based on New Structures and Post-Processing Enhancement
45
(p ~ 10-3 MPa). The gas under test was N2 and all experiments were done at room
temperature (~20 °C). The wavelength shift dependence on pressure, for all samples, is
shown in Fig. 3.10. The shift was determined by following the peak near 1550 nm. The
behavior is approximately linear in all cases, and the sensitivities are reunited in Table
3.2.
0.0 0.1 0.2 0.3 0.4 0.5 0.6 0.7 0.8 0.9 1.0 1.1
0.0
0.4
0.8
1.2
1.6
2.0
2.4
2.8 L
FP=170 m
LFP
=456 m
LFP
=670 m
LFP
=1100 m
Wav
elen
gth
Sh
ift
(nm
)
Pressure (MPa) Figure 3.10 – Sensing heads response to the applied pressure.
Besides the relatively high sensitivity to pressure obtained with this simple
diaphragm-free structure, the decrease of the sensitivity with the increase of the cavity
length was somehow surprising. From the analysis of Eq. 3.6 this behavior seems
explained, however, the influence of the cavity length change with pressure was
considered to be very small, in agreement with [187]. Therefore, the effect of the second
term in Eq. 3.6 is negligible. Thus, the sensitivity to pressure had its origin on the
dependence of the gas refractive index on pressure. When pressure increases, there is a
higher density of gas inside the sealed chamber, translating into a higher refractive
index. Thus, there will be higher interaction between the evanescent field of light
travelling in the FP cavity and the gas, which means an increase of the pressure
sensitivity with the cavity length, contrary to what is observed. This points out the
presence of more complex effects, a matter that will be discussed in the next Section,
where a FP structure based on a photonic crystal fiber is subjected to different gases.
By converting the pressure shifts to refractive index variations, according to the
Eq. 3.12, the four sensors response regarding this parameter was determined. The

FCUP
Fiber Sensing Based on New Structures and Post-Processing Enhancement
46
results, shown in Fig. 3.11, also exhibit linear behavior, whose sensitivities are presented
in Table 3.2.
1.0000 1.0005 1.0010 1.0015 1.0020 1.0025 1.0030
0.0
0.4
0.8
1.2
1.6
2.0
2.4
2.8
LFP
= 170 m
LFP
= 456 m
LFP
= 670 m
LFP
= 1100 m
Wav
elen
gth
Sh
ift
(nm
)
Refractive Index (RIU) Figure 3.11 – Sensing heads response to the N2 refractive index change. All measurements were done at
room temperature (~20 °C), and the monitored wavelength was around 1550 nm.
Table 3.2 – Sensitivity of the different sensing heads to N2 pressure and to refractive index.
Hollow core
diameter (m)
FP cavity length
(m)
Pressure sensitivity
(nm/MPa)
Refractive index sensitivity
(nm/RIU)
20 ± 5
170 ± 5 2.61 ± 0.02 943.8 ± 8.3
456 ± 5 2.32 ± 0.01 841.7 ± 3.2
670 ± 5 2.19 ± 0.01 794.7 ± 2.1
1100 ± 10 1.82 ± 0.01 659.2 ± 1.4
60 ± 5 187 ± 5 2.97 ± 0.01 1074.3 ± 4.8
680 ± 5 2.26 ± 0.04 818.8 ± 3.4
The influence of the hollow core diameter was studied by using a second hollow-
core silica tube with an inner diameter of (60 ± 2) m. Two sensors were fabricated
following the procedures described in Section 3.3.1 and tested to pressure, using the
same experimental setup and experimental conditions as previously described. The
shorter sensing device had a length of (187 ± 5) m and the effective refractive index,
determined through Eq. 3.14, was of (1.13 ± 0.02) RIU. The longer sensing head presented
a length of (680 ± 5) m and an effective refractive index of (1.25 ± 0.02) RIU. In both
cases the effective refractive index is lower than in the sensors previously studied. This
difference arises from the higher interaction of light with the external medium when it
exits the SMF, prior to being recoupled to the silica wall. Besides, the distance between

FCUP
Fiber Sensing Based on New Structures and Post-Processing Enhancement
47
these two regions increases significantly for the larger hollow core, meaning that the
path where light travels inside the silica tube wall is reduced, when compared with the
silica tube with an inner diameter of 20 m. The decrease in the effective refractive index
of light translates into a higher sensitivity to pressure, and consequently, to the refractive
index variation, as it is observed in the sensors response shown in Fig. 3.12. The
sensitivities of the two samples are shown in Table 2.2, for an easier comparison with the
previous results.
0.0 0.2 0.4 0.6 0.8 1.0 1.2
0.0
0.5
1.0
1.5
2.0
2.5
3.0
3.5
b)
Wav
elen
gth
Sh
ift
(nm
)
Pressure (MPa)
LFP
= 187 m
LFP
= 680 m
a)
1.0000 1.0005 1.0010 1.0015 1.0020 1.0025 1.0030
0.0
0.5
1.0
1.5
2.0
2.5
3.0
3.5
Wav
elen
gth
Sh
ift
(nm
)
Refractive Index (RIU)
LFP
= 187 m
LFP
= 680 m
Figure 3.12 - Sensing heads response to the N2 (a) pressure and (b) refractive index change. All
measurements were done at room temperature (~20 °C), and the monitored wavelength was around
1550 nm. The hollow core silica tube presented an inner diameter of ~60 m.
Even though the variation of the cavity length with the applied pressure is reduced,
its physical dimensions (length and the cross section area) are of the utmost importance
for the performance of this sensing device. A compromise must be assumed in order to
achieve the highest sensitivity possible: a large hollow-core area, but not so large that the
silica tube becomes easily damaged when handled; and a small cavity length, although
long enough to guarantee that light is coupled to the silica walls and is reflected at the
end face, creating the FP cavity.
3.4 Fabry-Perot Cavity Based on Hollow-Core Photonic Crystal Fiber
The FP cavity tested in this work was based on a hollow-core ring photonic crystal
fiber (HCR-PCF) produced at the IPHT–Jena. Figure 3.13 (a) shows the cross-section
image of the HCR-PCF when observed with a scanning electron microscope (SEM). This
fiber presented a large hollow-core, with a diameter of (44.4 ± 0.2) m, and 18 petal

FCUP
Fiber Sensing Based on New Structures and Post-Processing Enhancement
48
shaped holes with an azimuthal diameter of (24.4 ± 0.2) m. In between these two hollow
structures there was a silica ring with a thickness of (3.1 ± 0.2) m.
b)a)
Figure 3.13 – Photographs of the hollow core ring fiber cross-section (a) at the scanning electron microscope
(SEM) and (b) when illuminated with a He-Ne laser.
3.4.1 Sensor Design and Spectral Characteristics
The FP cavities were obtained by fusion splicing the HCR-PCF to the SMF, using the
same method presented in Section 3.3.1. Several samples were fabricated with different
cavity lengths. The light travelling from the SMF end face excites the HCR-PCF ring.
Afterwards, it is reflected at the cleaved end face of the HCR-PCF and recoupled once
again to the SMF. Figure 3.13 (b) shows the cleaved end face of a HCR-PCF section when
illuminated with a He-Ne laser, where it is possible to clearly see the illuminated ring. If
the length of the FP cavity is lower than ~160 m, the optical path is very small and the
ring is not excited. In such case, the numerical aperture (0.14 for SMF) is out of the cavity
length. However, when the length of the FP cavity is larger than 160 m, the ring is
excited and interference is generated.
The experimental setup used in the experiments was similar to the one described in
Section 3.3.1. All measurements, of pressure and temperature, were carried out with an
OSA resolution of 0.1 nm.
The spectral behavior of three different FP cavities is shown in Fig. 3.14. The smaller
sensing device, with a cavity length of (360 ± 3) m, presented a spectral response that
can be approximated to that of a two-wave interferometer. In this case, the FSR was of
(5.7 ± 0.1) nm. The FSR calculated for the (506 ± 3) m and (1070 ± 5) m long sensing

FCUP
Fiber Sensing Based on New Structures and Post-Processing Enhancement
49
heads was of (2.2 ± 0.1) nm and (0.9 ± 0.1) nm, respectively. The operation wavelength
considered was ~1555 nm.
For the longer sensing heads, the interferometric patterns show some beating,
suggesting that the interference of more than two waves is occurring. This means that
the guidance in the silica ring is multimode. However, the small beating effect together
with the reduced thickness of the ring indicate that few modes are guided by the
structure.
1530 1535 1540 1545 1550 1555 1560-21.0
-20.5
-20.0
-19.5
-19.0
-18.5
-18.0
-17.5
-17.0
Op
tica
l P
ow
er (
dB
m)
Wavelength (nm)
LFP
= 360 m
LFP
= 506 m
LFP
= 1070 m
Figure 3.14 – Spectra of three sensing heads based on the HCR-PCF FP cavity.
The group effective refractive index associated with the light propagation can be
determined by Eq. 3.14. The values of (1.13 ± 0.01) RIU, (1.17 ± 0.01) RIU and
(1.28 ± 0.02) RIU were respectively obtained for the 360 m, 506 m and 1070 m long
samples. These values come from the combination of three contributions: the
propagation of light in the air, when it exits the SMF core up to the silica ring; the
propagation in the silica ring and the evanescent field in air of the light that propagates
in this region. The first contribution is more significant for smaller devices, translating
into a lower effective group refractive index.
3.4.2 Temperature Measurements
The 360 m long FP cavity was placed inside a tubular oven and subjected to
temperature variations between room temperature (~23 °C) and 500 °C with a resolution
of 0.1 °C. A highly non-linear behavior was observed, as can be seen in Fig. 3.15.

FCUP
Fiber Sensing Based on New Structures and Post-Processing Enhancement
50
0 50 100 150 200 250 300 350 400 450 500 5501551.5
1552.0
1552.5
1553.0
1553.5
1554.0
1554.5
1555.0
Wav
elen
gth
(n
m)
Temperature (C)
Figure 3.15 – Temperature response of the 360 m long sensing head.
The experimental data was well adjusted to the second order polynomial
6 2 36.9 0.5 10 2.5 0.3 10 1551.8 0.1 ,T T (3.16)
where the wavelength comes in nm and the temperature in °C. The range of
temperatures can be divided into two different linear regions, for lower and higher
temperatures. Below 200 °C the sensitivity was (3.8 ± 0.3) pm/°C, whereas for
temperatures above 200 °C, the sensitivity was (7.5 ± 0.3) pm/°C. The values arise from a
combination between the thermal expansion and the thermo-optic effects. Similarly to
the variation of pressure, when the temperature changes the interferometric spectrum
also shifts. In this case, the variation is given by Eq. 3.17, which can be obtained using the
same line of thought as for Eq. 3.6:
1 1
.eff FP
eff FP
n Ld
dT n T L T
(3.17)
In this equation,eff
n T is the thermo-optic coefficient, which depends on the
effective refractive index, and has a value of ~8.6×10⁻⁶ /°C [207]; and FP
L T corresponds
to the thermal expansion coefficient of the fiber material, ~0.55×10⁻⁶ /°C [126]. Dividing
the sensitivity obtained for the high temperatures region by the wavelength (1552.8 nm
at 250 °C), we obtain 4.84 × 10⁻⁶ /°C, a value relatively close to the thermo-optic

FCUP
Fiber Sensing Based on New Structures and Post-Processing Enhancement
51
coefficient. This result indicates that this parameter is dominant over the thermal
expansion coefficient for this sensing device.
3.4.3 Pressure Measurements
The physical characteristics of this HCR-PCF, namely the very thin silica ring
surrounded by the petal shaped holes and the large hollow core, make this structure a
good candidate to perform gas pressure sensing. To test this hypothesis, two devices
were placed in the same sealed chamber as the one described in Section 3.3.3 and were
subjected to the variation of pressure in an atmosphere of N2. The experimental results,
shown in Fig. 3.16 (a), were adjusted to a linear function and sensitivities of
(3.07 ± 0.03) nm/MPa and (2.46 ± 0.02) nm/MPa were respectively obtained for the
380 m and 510 m long FP cavities. There is a clear improvement on the sensitivity for
smaller sensing devices, as observed in the previous silica tube configuration.
0.0 0.1 0.2 0.3 0.4 0.5 0.6 0.7 0.8 0.9
0.0
0.5
1.0
1.5
2.0
2.5
3.0
b)
Wav
elen
gth
Sh
ift
(nm
)
Pressure (MPa)
LFP
= 380 m
LFP
= 510 m
a)
0.0 0.1 0.2 0.3 0.4 0.5 0.6 0.7 0.8 0.9
0.0
0.5
1.0
1.5
2.0
2.5
3.0
Wav
elen
gth
Sh
ift
(nm
)
Pressure (MPa)
100% N2
50% N2+ 50% CH
4
Figure 3.16 – Sensing head response to the applied pressure, (a) atmosphere of N2, different FP cavity
lengths and (b) different gas atmospheres for a cavity length of 360 m.
The smaller sensing head was also subjected to pressure variations in an atmosphere
of 50% N2 and 50% methane (CH4). The results are shown in Fig. 3.16 (b), along with the
ones obtained for an atmosphere of 100% N2. By introducing a gas with a different
refractive index (higher than the refractive index of N2), the sensitivity of the device
increased from (3.07 ± 0.03) nm/MPa to (3.69 ± 0.05) nm/MPa. This behavior indicates
that with a proper calibration, this sensing head can be used to identify the gas present

FCUP
Fiber Sensing Based on New Structures and Post-Processing Enhancement
52
in the interferometric cavity, by analyzing the response of the sensor to pressure
changes.
The results presented here and in the previous Section indicate, for the fiber
structures studied, that the sensitivity to pressure decreased with the increase of the
sensing head length. At this stage it is not clear what the reasons behind such behavior
are, which requires further studies.
3.4.4 Prototype for Biomedical Applications
The FP cavity based on the HCR-PCF was further investigated by our group for
application in low pressure measurements, creating a prototype suitable to be used in
the medical or biomechanical field [208]. This Section describes briefly the sensor and the
main results obtained.
A sample with a cavity length of ~125 m was fabricated using the same procedures
as the ones described in Section 3.3.1. At the end face of the HCR-PCF a silicone
diaphragm was deposited, by repeatedly placing the tip of the sample in direct contact
with a small portion of silicone. After multiple controlled steps, the silicone was cured at
room temperature for 72 h. The silicone polymer used was a biocompatible commercial
one, Silastic® medical adhesive silicone, type A, from Dow Corning. With the deposition
method used to create the sensing device, it was not possible to control the diaphragm
geometry, which can have influence on the spectral response. A scheme of the sensor
design is shown in Fig. 3.17.
Figure 3.17 – Schematic drawing of the sensor proposed for low-pressure measurements [208].
When illuminated with a broadband optical source, with the same reflection setup as
shown in Fig. 3.4, light travelling from the SMF will be reflected at the interface between
the HCR-PCF and the silicone capsule, creating a two-wave FP interferometer. In this

FCUP
Fiber Sensing Based on New Structures and Post-Processing Enhancement
53
case, light will travel in the hollow core, and the effective refractive index is ~1.00 RIU.
The spectral behavior of this interferometer is shown in Fig. 3.18. The use of a
diaphragm, which will act as one of the FP cavity mirrors, translates into a higher
spectrum visibility, when compared to the diaphragm free configuration (whose FP
mirror is the 3.1 m thick silica ring).
1565 1570 1575 1580 1585-18.0
-17.5
-17.0
-16.5
-16.0
-15.5
-15.0
-14.5
-14.0
Op
tica
l P
ow
er (
dB
)
Wavelength (nm)
Pressure increase
Figure 3.18 – Spectral response of the sensing head. Also shown the spectral shift when hydrostatic pressure
is applied (step of 37.5 mmHg).
The visibility of an interferometric cavity can be determined by Eq. 3.18 [209]:
max min
max min
,P P
VP P
(3.18)
where Pmax and Pmin are the optical powers of two adjacent maximum and minimum of
the interference signal, respectively. The diaphragm free configuration presented a
visibility of ~3 %, whereas in this case its value was ~33 %.
The sensor was then placed inside a hydrostatic pressure device, and pressure
measurements in a range between 0 mmHg and 337.5 mmHg were carried out, with a
pressure step of ~37.5 mmHg. The spectrum shifted towards shorter wavelengths (blue
shift) as pressure increased (see Fig. 3.18). The sensor response was approximately linear,
as shown in Fig. 3.19, and a sensitivity of (-87.0 ± 0.4) pm/mmHg was achieved, which
corresponds to a sensitivity of (-652.2 ± 3.3) nm/MPa in SI pressure units. This negative
response was due to the change in the cavity length, caused by the silicone diaphragm
compression with the applied pressure.

FCUP
Fiber Sensing Based on New Structures and Post-Processing Enhancement
54
0 50 100 150 200 250 300 3501560
1564
1568
1572
1576
1580
1584
1588
1592
Wav
elen
gth
(n
m)
Pressure (mmHg)
Figure 3.19 – Sensor response to hydrostatic pressure variation.
This sensor proved to be suitable for low pressure applications, exhibiting high
sensitivity and good reproducibility. There are several physiological pressures in this
range, such as blood pressure, intracranial and intra-articular pressures [208]. However,
the use of the silicone capsule brings also higher thermal sensitivity, due to the high
thermal expansion coefficient of this material. The typical value of this parameter is
342.0 × 10⁻⁶ /°C [208], which is more than 600 times largerr than that of silica
(~0.55 × 10⁻⁶ /°C [126]). Thus, in practical applications, the sensor should be used in a
controlled environment or a reference sensor should be used, to reduce the cross-
sensitivity effects.
3.5 Final Remarks
In this Chapter, two different gas pressure sensors based on the Fabry-Perot (FP)
configuration were proposed. The sensor based on a hollow core silica tube was the first
reported in the literature to measure gas pressure without the use of a diaphragm. Its
simplicity and the somehow surprising good response to the measurand translated into
a different approach for gas sensing using micro-cavities. Different samples were
analyzed, with different FP cavity lengths and also with two different hollow core
diameters. In order to take the best advantage of this configuration, a compromise must
be accepted: on the one hand, small cavities ensure higher sensitivity, although they

FCUP
Fiber Sensing Based on New Structures and Post-Processing Enhancement
55
should be long enough to ensure the coupling of light in the hollow core structure; on
the other hand, larger hollow core diameters are preferred. However, large enough so
they remain easy to handle and mechanically robust.
Regarding the sensor based on the hollow core ring photonic crystal fiber described
in the second part of this Chapter, it proved to be more sensitive than the first
configuration. This occurs due to the thin thickness of the silica ring, where light travels
after it exits the single mode fiber. Thus, the evanescent field in this cavity is stronger,
and its interaction with the external medium is larger, translating into improved
sensitivity to gas measurements. The cavity was subjected not only to nitrogen pressure
variations, but also to those of a mixture of nitrogen and methane, exhibiting different
sensitivities. Using a model reported in the literature, the pressure measurements were
converted to the gas refractive index variations, and the analysis was also done
regarding this parameter. Finally, both cavities presented a non-linear behavior when
subjected to temperature.
The sensor based on the hollow core photonic crystal fiber was further investigated
by depositing a capsule of a biocompatible silicone at the end of the sensing tip. When
subjected to hydrostatic pressure, in the range of physiological activity, the diaphragm
deflected, causing a phase shift in the interferometric spectrum. This new prototype can
be further explored to be used in low-pressure applications, such as in biomechanics or
medicine.


CHAPTER FOUR
4 Fabry-Perot Cavities Based on Post-
Processed Interferometric Tips


FCUP
Fiber Sensing Based on New Structures and Post-Processing Enhancement
59
4.1 Introduction
In 1974, Kawakami et al. developed a new type of fiber, with one core and two
claddings [210, 211]. This fiber was called double clad fiber (DCF)1 and in the first work,
the inner cladding presented the lowest index, followed by the index of the outer
cladding. The core presented the highest refractive index. This fiber was proposed to
compensate the glass dispersion, since it presented an anomalous waveguide dispersion.
In this case, the parameter 2 2d d , related to the signal distortion, is negative, whilst
for the standard single mode fiber (SMF), this parameter is positive. Figure 4.1 (a) shows
the cross-section scheme of this new type of fiber. In 1978, a new geometry was proposed
for the inner cladding [212]. The fiber, birefringent and polarization maintaining,
included an elliptical cladding, shown in Fig. 4.1 (c). Until the 1990s, these fibers were
mainly applied for dispersion compensation.
Figure 4.1 – Schematic designs of some of the double clad optical fibers reported in the literature.
In 1988, the use of this kind of fibers in fiber laser configurations was proposed for
the first time. For this application, the refractive index of the inner cladding needs to be
higher than the one of the outer cladding, ensuring that the pump light is confined in
this region. Snitzer et al. used a double clad fiber with an offset core doped with
neodymium (Nd) [213]. The scheme of the fiber used is shown in Fig. 4.1 (b). Light was
focused onto the inner cladding and absorbed by the Nd doped core as it proceeded
1 The acronym DCF is usually attributed, in the literature, to the dispersion compensating fiber.
However, several authors also used it to designate the double clad fiber. In the works described in this thesis
the dispersion compensating fiber was not used, and thus the DCF acronym is only relative to the double
clad fiber.

FCUP
Fiber Sensing Based on New Structures and Post-Processing Enhancement
60
along the fiber. By exploiting different geometries for the inner cladding, especially
when the circular geometry was broken, high power lasers with outstanding efficiencies
were obtained. For instance, Jeong et al. proposed the use of a D-shaped fiber, as the one
presented in Fig. 4.1 (d), to obtain a 1.36 kW continuous wave output power with a
launch power just over 1.6 kW [214]. In this case, a slope efficiency of 83 % and a
quantum efficiency of 95 % were attained2. Figs. 4.1 (e-h) present several popular
configurations, like the “flower”-type [216], the squared [217], rectangular [218], and
hexagonal shaped [219]. The difference between the refractive indices of the layers was
often attained by doping the core with lanthanide ions, thus increasing the refractive
index, and using a low refractive index polymer as the outer cladding [217-219].
The employment of this kind of fibers for sensing has been recently proposed, in
different configurations, and for diverse applications. For instance, in 2006, Fu et al.
proposed the use of a double clad photonic crystal fiber (PCF) in a scheme to perform
nonlinear optical endoscopy measurements [220]. Han et al. spliced a DCF section to
SMF and wrote a long period grating (LPG) in both fibers [221]. The sensor was able to
simultaneously measure refractive index and temperature. A band rejection filter was
obtained by Pang et al. by splicing a DCF section between two SMFs [222]. The sensor
was applied in refractive index measurements of liquids. The concatenation of two
sensing structures was proposed by Liu et al. [223]. The sensor was constituted by two
different DCFs. One presented an inner cladding doped with fluorine, whereas the other
was doped with boron. The device was employed in temperature and refractive index
measurements. Baiad et al. proposed the use of a double clad fiber coupler to capture
cladding modes which were generated by a gold-coated fiber with a tilted fiber Bragg
grating (FBG) [224] or by an etched FBG [225]. All these structures presented an inner
cladding with a refractive index lower than the core and the outer cladding indices.
It is possible to obtain an inner cladding with higher refractive index by doping it
with elements such as germanium or phosphorous. In such case, the fiber needs to be
2The slope efficiency of a fiber laser is obtained through the relationship between the absorbed pump
power and the emitted laser output power, above threshold. Regarding the quantum efficiency, it is the ratio
between the pump and laser photon energies [215].

FCUP
Fiber Sensing Based on New Structures and Post-Processing Enhancement
61
post-processed, for example by means of chemical etching, in order to guide light in its
core. In 2011, Pevec et al. proposed the chemical etching of a phosphorous doped DCF to
obtain a FP cavity [117]. The sensor was used to measure strain and temperature. Three
years later, André et al. developed a temperature and vibration sensor based on post-
processing of a P2O5 doped DCF [154]. Besides wet chemical etching, the structure was
post-processed using the focused ion beam (FIB) technique.
In this Chapter, a phosphorus doped DCF subjected to chemical etching is described.
Two different configurations are considered, one for measurement of extreme
temperatures, and the other to be used as an optical phase refractometer. Some
fabrication characteristics are pointed out, as well as the development of the sensing
structures. Finally, some theoretical considerations are given and the experimental
results are discussed.
4.2 Design of the Double Clad Optical Fiber
The phosphorus-doped double clad optical fiber (P-doped DCF) was fabricated at
the Leibniz Institute of Photonic Technology (IPHT Jena), in Germany, during a short
mission in the framework of COST Action TD1001. The fabrication details are provided
in Appendix I. The fiber cross-section is shown in Fig. 4.2 (a). The doped region has an
elliptical shape instead of being circular. This unexpected feature was a consequence of
the preform fabrication (see Appendix I). The pure silica core and the outer cladding
have mean diameter dimensions of (18 ± 3) m and (122 ± 3) m, respectively. In
between these two regions, the layer of P-doped glass presents a thickness of (15 ± 3) m,
considering the major axis of the ellipse, and (10 ± 3) m in the minor axis. This region
presents a refractive index variation, n ~ 1.1 × 10⁻² RIU, when compared to the undoped
ones, as shown in Fig. 4.2 (b). Notice that the experimental value of the refractive index is
slightly different from the expected (theoretical) one. This is mostly due to the fact that
the inner cladding is not perfectly circular.
Even though the inner cladding shape influences the results, as will be seen later, the
fiber was successfully used in two different applications: as a sensor for extreme

FCUP
Fiber Sensing Based on New Structures and Post-Processing Enhancement
62
temperatures and as an optical phase refractometer. All the details of these two works
will be fully given in the next Sections.
-0.8 -0.6 -0.4 -0.2 0.0 0.2 0.4 0.6 0.80
2
4
6
8
10
12
14
10-3
n (
RIU
)
Preform position (mm)
Experimental
Theoretical
b)
Figure 4.2 – (a) Cross section of the P-doped double clad optical fiber. (b) Refractive index profile measured
using a short section of the preform.
4.3 Optical Fiber Tips Design
The optical fiber tips were created by fusion splicing of a section of P-doped DCF
with a SMF, using the automatic program of the splicing machine. Afterwards, the P-
doped DCF region was cleaved under a 5× magnifying lens. In this way it was possible
to obtain cavities with the desired length of a few hundred micrometers. As discussed
earlier, the presence of phosphorus in the inner cladding increases the refractive index of
this layer when compared to the undoped regions. Thus, light that is guided by the SMF
will be deviated from the core and will travel in the doped region of the DCF. Therefore,
no interference pattern was initially observed. To overcome this issue, and ensure that
the light travels in the fiber core, the samples were subjected to wet chemical etching
using a 48 % hydrofluoric acid (HF) solution. Due to the presence of the dopant, the
inner cladding was expected to be removed faster than the undoped regions. A
preliminary study was then carried out to observe the etching behavior and the
formation of the cavities. In order to increase the etching rate, and thus obtain a structure
with a nearly constant core diameter over its length, the HF solution was placed inside
an ultrasound bath at room temperature. The chemical reactions involved in this liquid
phase etching process are [81, 226]:
a)

FCUP
Fiber Sensing Based on New Structures and Post-Processing Enhancement
63
2 5 3 2
6 2 3 ,P O HF POF H O (4.1)
2 2 6 2
6 2 .SiO HF H SiF H O (4.2)
The formation of the cavity was observed by submerging the sample in liquid HF for
a few seconds, quickly removing it from the solution and cleaning it thoroughly with
ethanol. A microscope photo was taken, as shown in Fig. 4.3 (a). The sample was once
again placed in the etching solution for a few additional seconds and the process was
repeated. Figures 4.3 (a-d) show the sample at different processing times.
a) b)
c) d)
5 10 15 20 25 30 35 40 45 50 55 60 65 7040
60
80
100
120
140
160
180
200
220
240
Cav
ity
Len
gth
(
m)
Time (seconds) Figure 4.3 – Left: Microscope photos of fiber tip formation after an etching time of a) ~9 s, b) ~27 s, c) ~46 s
and d) ~65 s. Right: Cavity length formation vs. time. Inset: SEM image of the etched cavity cross-section.
By measuring the length of the cavity at each time, a linear etching behavior was
observed, as depicted in Fig. 4.3 (on the right). From the linear fitting, an etching rate of
(3.1 ± 0.1) m/s was estimated. Thus, in less than one minute it is possible to attain a
cavity with a length of ~200 m. On the inset of Fig. 4.3 the scanning electron microscope
(SEM) photograph of the etched cavity top is shown.
Two different sensing structures were created using a short section of this fiber. The
steps performed to produce each type of sensor are shown in Fig. 4.4. Following the red
arrows, the diaphragm-free configuration, tested for extreme temperatures, is obtained.
On the other hand, the blue arrows indicate the procedure used to obtain the cavity with
diaphragm, tested as an optical phase refractometer. The first step is to splice a section of
DCF with a SMF. Afterwards, the DCF section is cleaved under a magnifying lens, as
explained earlier. The third step (and the final one for the first configuration) is to
perform wet chemical etching for ~1 min. The fourth and fifth steps are only relative to

FCUP
Fiber Sensing Based on New Structures and Post-Processing Enhancement
64
the second configuration, and consist of splicing the etched fiber with SMF. In this case,
the splice is done in the manual program of the splicing machine and the fibers are
positioned with a lateral offset. Thus, as the electric arc discharge is mainly applied to
the SMF region, it will prevent the collapse of the etched structure. Finally, the SMF
region is cleaved once again, this time with a thickness on the order of ten to twenty
micrometers. The thickness of the diaphragm will have a strong influence on the sensors
behavior, as discussed later.
Automatic Splice Cleave
Manual Splice
Cleave
Etching (48%-HF)
1. 2.
4.
5.
3.
1st Configuration
2nd Configuration Figure 4.4 – Scheme of the optical fiber tip design fabrication steps. The red arrows indicate the steps to
produce the diaphragm-free configuration and the blue ones are related to the configuration with
diaphragm.
All measurements done with this configuration were performed in a reflection
scheme (see Fig. 4.5). A broadband optical source, the sensing device and an optical
spectrum analyzer (OSA) were connected to an optical circulator. The optical source had
a bandwidth of 100 nm, centered at 1570 nm. The readings were done with a resolution
of 0.1 nm.
Optical Source Optical Circulator
OSA
FP cavitySplice
Figure 4.5 – Scheme of the experimental setup.

FCUP
Fiber Sensing Based on New Structures and Post-Processing Enhancement
65
4.4 High Temperature Sensing Using a Diaphragm-Free Configuration
The sensing head used in this work had a length of (143 ± 5) m and the core
diameter, after etching, was (6.0 ± 0.2) m. The scheme of the proposed sensor is shown
in Fig. 4.6 (a). The first reflection (R1) occurs at the SMF/DCF interface, whilst the second
one (R2) is originated at the DCF/air interface. The parameters 1 and 2 are the intensity
attenuation factors at each interface, being equal to 1 if there is no transmission loss, and
it is 0 if no light is transmitted. Besides, these factors should, in principle, depend on the
operation wavelength. Since most of the transmission occurs essentially from the SMF
section to the DCF fiber, the parameter 2 is considered to be negligible. A sample,
shown in Fig. 4.6 (b), was illuminated with a He-Ne laser and the two reflection
interfaces of this FP cavity can be distinguished.
Figure 4.6 – (a) Scheme of the FP cavity for high temperature measurement and (b) photograph of the
sensing head when illuminated with a He-Ne laser.
The response of this two-wave interferometer was simulated using a simple model
based on [138], taking into consideration that there are only two reflective interfaces. The
reflection coefficients of this cavity are given by
2
1SMF DCF
SMF DCF
n nR
n n
,
2
2,DCF air
DCF air
n nR
n n
(4.3)
where nSMF, nDCF and nair are the refractive indices associated with the propagating waves
on each medium. The refractive index of SMF was considered to be 1.4504 at 1550 nm.
The refractive index of the DCF, estimated to be 1.3259, was determined through the
experimental spectrum, according to
1 2
2 1
.2DCF
FP
nL
(4.4)
In this equation, 1 and 2 are the wavelengths of two adjacent spectral maxima and
LFP is the cavity length. The round-trip propagation phase shift is given by

FCUP
Fiber Sensing Based on New Structures and Post-Processing Enhancement
66
4
.DCF FPn L
(4.5)
Considering that there is a high transmission loss due to the mode mismatch
between the two fibers, which translates into an estimated transmission coefficient
10.01 , the total reflected electric field, resulting from the superposition of the
reflected fields from the two interfaces, can be determined by
0 1 1 1 21 .j
rE E R R R e
(4.6)
The normalized total reflective intensity, IRtotal, is given by Eq. 4.7:
2
1 1 1 2 1 1 1 2
0
1 1 .j jrRtotal
EI R R R e R R R e
E
(4.7)
After some straightforward algebraic manipulation, the following expression is
attained:
22
1 1 1 2 1 2 1 11 2 1 cos .
RtotalI R R R R R R (4.8)
The total optical power calculated through this theoretical model is shown in Fig. 4.7.
(green dashed line) along with the experimental spectrum (black line). Notice that an
exponential term was introduced in the simulations to take into account the losses of the
cavity with the wavelength. The values considered for R1, R2 and 1 were, respectively,
0.002, 0.020 and 0.01. The difference observed in the visibility of the spectra is related to
the fact that the coherence effects were not taken into account in the simulation. In this
case, the geometric path imbalance of the cavity is 2 × 143 m, which is higher than the
coherence length of the optical source.
The sensing head was placed inside a tubular oven which can operate at
temperatures up to 1000 °C, with a resolution of 0.1 °C. Starting from 150 °C until 900 °C,
the temperature was slowly increased in steps of 50 °C. The wavelength shift of the FP
cavity was measured at each temperature step. Figure 4.8 shows the sensor response to
this parameter.

FCUP
Fiber Sensing Based on New Structures and Post-Processing Enhancement
67
1530 1535 1540 1545 1550 1555 1560 1565 1570-27.0
-26.5
-26.0
-25.5
-25.0
-24.5
-24.0
-23.5
-23.0
Op
tica
l P
ow
er (
dB
)
Wavelength (nm)
Simulation
Experimental
Figure 4.7 – Experimental (black line) and theoretical (green dashed line) spectra of the sensing head
reflection response.
The behavior was successfully adjusted to the second order polynomial
6 2 32.9 0.1 10 11.7 0.1 10 1550.5 0.1 ,T T (4.9)
where the wavelength, , comes in nm and the temperature, T, is in °C. Considering a
linear function, the coefficient of determination decreases slightly (from 0.9999 to 0.9984)
but it is still close to the unity. In such case, a linear sensitivity of (14.6 ± 0.2) pm/°C was
estimated. The high sensitivity to temperature results from the combination between the
variation of the FP cavity length, due to the silica thermal expansion, and the effective
refractive index variation, due to the silica thermo-optic effect.
100 200 300 400 500 600 700 800 900 10001551
1553
1555
1557
1559
1561
1563
1565
Wav
elen
gth
(n
m)
Temperature (C) Figure 4.8 – Wavelength dependence on temperature.

FCUP
Fiber Sensing Based on New Structures and Post-Processing Enhancement
68
4.5 Optical Phase Refractometer
Using the second configuration presented in Fig. 4.4, the core of the DCF is no longer
directly exposed to the external medium, which translates into a more robust cavity. The
reflections that can occur in the structure are shown in the scheme of Fig. 4.9. Thus, in
this situation, the interferometric behavior will be associated with the interference of
three waves: one at the SMF/DCF interface (E1), due to the mismatch between the
effective refractive indices on each side; the second one, caused by the same effect, will
occur at the DCF/SMF interface (E2); finally, E3 corresponds to the reflection occurring at
the SMF diaphragm/external medium interface. The first two waves do not change their
amplitudes or their phases with the external medium index. However, E3 presents an
amplitude that depends on the refractive index of the external medium.
Figure 4.9 – FP microcavity evidencing the interface reflections.
Considering that E1 has a phase 1 when generated at the interface, the phase
difference with E2 is
22 1
4,e C
n L
(4.10)
where ne2 is the effective refractive index inside the DCF cavity, LC corresponds to the
cavity length and is the wavelength. Similarly, the phase difference between the waves
E3 and E2 is
13 2
4,e D
n L
(4.11)
where LD is the diaphragm length and ne1 is the SMF effective refractive index. This
reflection at the external interface, of ~4% when the surrounding medium is air, is
substantially stronger than the second one, so the interferometric behavior in this case is
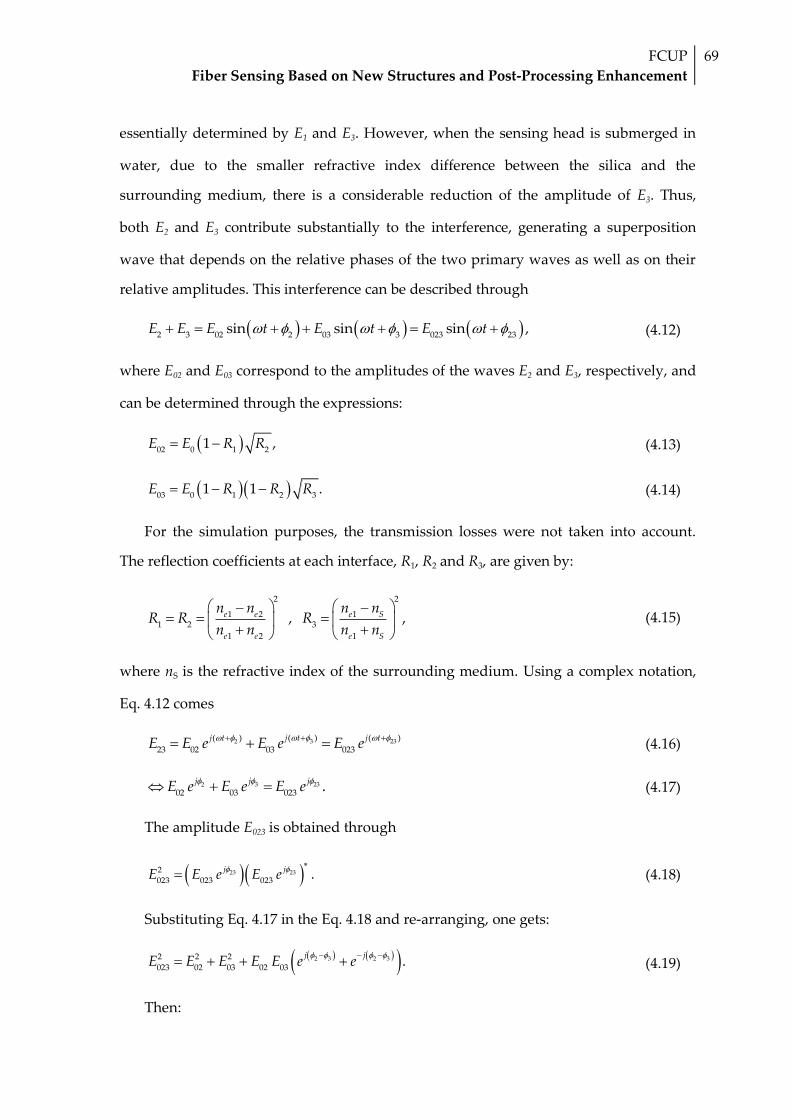
FCUP
Fiber Sensing Based on New Structures and Post-Processing Enhancement
69
essentially determined by E1 and E3. However, when the sensing head is submerged in
water, due to the smaller refractive index difference between the silica and the
surrounding medium, there is a considerable reduction of the amplitude of E3. Thus,
both E2 and E3 contribute substantially to the interference, generating a superposition
wave that depends on the relative phases of the two primary waves as well as on their
relative amplitudes. This interference can be described through
2 3 02 2 03 3 023 23sin sin sin ,E E E t E t E t (4.12)
where E02 and E03 correspond to the amplitudes of the waves E2 and E3, respectively, and
can be determined through the expressions:
02 0 1 21 ,E E R R (4.13)
03 0 1 2 31 1 .E E R R R (4.14)
For the simulation purposes, the transmission losses were not taken into account.
The reflection coefficients at each interface, R1, R2 and R3, are given by:
2
1 21 2
1 2
e e
e e
n nR R
n n
,
2
13
1
,e S
e S
n nR
n n
(4.15)
where nS is the refractive index of the surrounding medium. Using a complex notation,
Eq. 4.12 comes
3 232 ( ) ( )( )
23 02 03 023
j t j tj tE E e E e E e (4.16)
3 232
02 03 023.j jjE e E e E e
(4.17)
The amplitude E023 is obtained through
23 232
023 023 023.j jE E e E e
(4.18)
Substituting Eq. 4.17 in the Eq. 4.18 and re-arranging, one gets:
2 3 2 32 2 2
023 02 03 02 03.
j jE E E E E e e
(4.19)
Then:
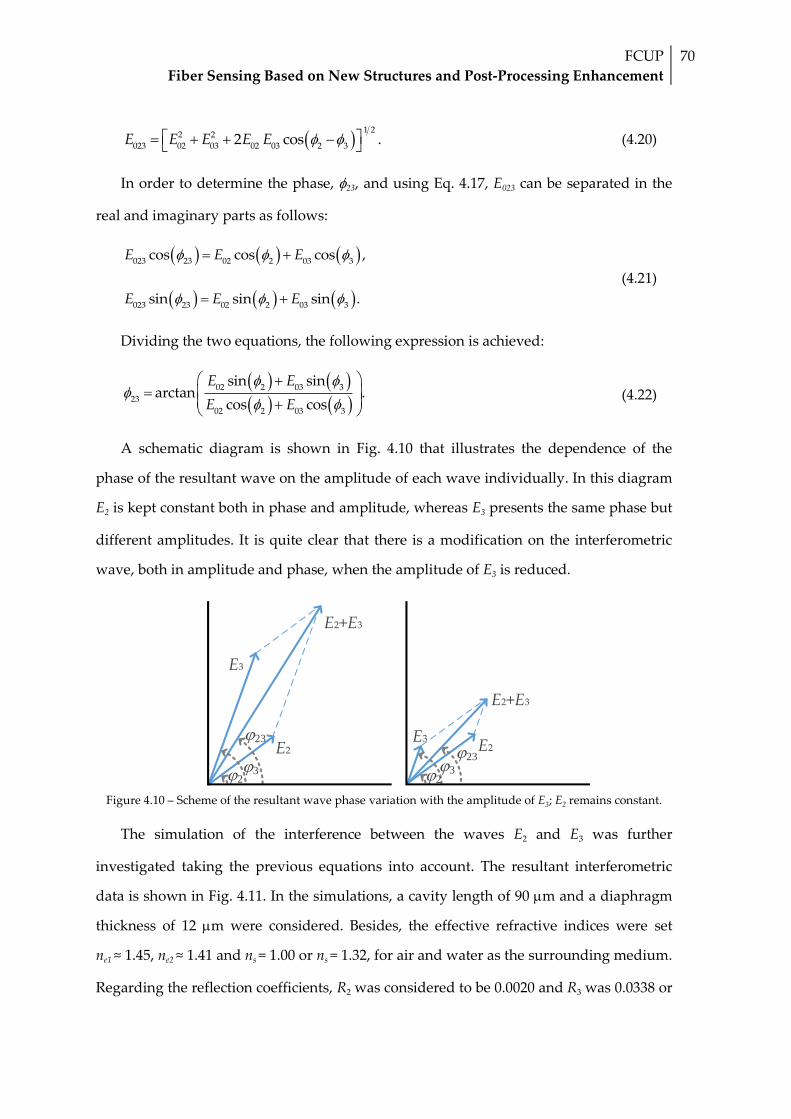
FCUP
Fiber Sensing Based on New Structures and Post-Processing Enhancement
70
1 2
2 2
023 02 03 02 03 2 32 cos .E E E E E
(4.20)
In order to determine the phase, 23, and using Eq. 4.17, E023 can be separated in the
real and imaginary parts as follows:
023 23 02 2 03 3cos cos cos ,E E E
023 23 02 2 03 3sin sin sin .E E E
(4.21)
Dividing the two equations, the following expression is achieved:
02 2 03 3
23
02 2 03 3
sin sinarctan .
cos cos
E E
E E
(4.22)
A schematic diagram is shown in Fig. 4.10 that illustrates the dependence of the
phase of the resultant wave on the amplitude of each wave individually. In this diagram
E2 is kept constant both in phase and amplitude, whereas E3 presents the same phase but
different amplitudes. It is quite clear that there is a modification on the interferometric
wave, both in amplitude and phase, when the amplitude of E3 is reduced.
j2j3
j23E2
E3
E2+E3
j2j3
j23E2
E3
E2+E3
Figure 4.10 – Scheme of the resultant wave phase variation with the amplitude of E3; E2 remains constant.
The simulation of the interference between the waves E2 and E3 was further
investigated taking the previous equations into account. The resultant interferometric
data is shown in Fig. 4.11. In the simulations, a cavity length of 90 m and a diaphragm
thickness of 12 m were considered. Besides, the effective refractive indices were set
ne1 ≈ 1.45, ne2 ≈ 1.41 and ns = 1.00 or ns = 1.32, for air and water as the surrounding medium.
Regarding the reflection coefficients, R2 was considered to be 0.0020 and R3 was 0.0338 or

FCUP
Fiber Sensing Based on New Structures and Post-Processing Enhancement
71
0.0023, when the surrounding medium was air and water, respectively. In addition to the
clear variation in amplitude, the inset in Fig. 4.11 shows the shift that occurs when the
external medium changes from air to water.
1530 1540 1550 1560 1570 1580 1590 1600 1610-100
-80
-60
-40
-20
0
20
|E23
/E0|2 (
dB
m)
Wavelength (nm)
air
water
1545 1546 1547 1548 1549 1550-150
-100
-50
0
|E23
/E0|2 (
dB
m)
Wavelength (nm)
Figure 4.11 – Simulated spectra of the FP micro-cavity in different media. The inset shows the phase
variation of the spectrum.
If the liquid medium is subjected to temperature variations, its refractive index will
also change. This variation originates a change of the silica-water reflectivity coefficient
and a shift in the E23 wave phase is to be expected. The phase of the resulting interference
between this wave and E1 will also be affected by the variation of the water refractive
index. Therefore, with this configuration, the principle of the amplitude-phase
conversion is achieved in the optical domain, i.e., the phase of the net interferometric
optical signal becomes a function of the amplitude of one of the interfering waves (E3 in
this case).
4.5.1 Water Temperature and Refractive Index Relationship
The relationship between the refractive index of water and its temperature has been
described in several works [227-230]. However, the water refractive index depends not
only on the temperature, but also on other parameters, such as the density and the
operation wavelength [230]. Tables were found in the literature for three different
wavelengths: 430, 600 and 660 nm. The wavelength dependence can be described by the
Sellmeier equation,

FCUP
Fiber Sensing Based on New Structures and Post-Processing Enhancement
72
2 4...,
B Cn A
(4.23)
where only the first three terms were taken into account. A tendency curve was adjusted
for the three wavelengths, and the parameters A, B and C were estimated. Using these
values, it is possible to determine the refractive index of water at 1550 nm. This
procedure was done for temperatures ranging from 10 °C to 80 °C, in steps of 10 °C,
considering the values presented in [230]. This information is gathered in Fig. 4.12 (a).
Notice that there is a different tendency curve for each temperature.
300 450 600 750 900 1050120013501500165018001.314
1.318
1.322
1.326
1.330
1.334
1.338
1.342
1.346
Ref
ract
ive
Ind
ex (
RIU
)
Wavelength (nm)
Tem
per
atu
re
a)
0 10 20 30 40 50 60 70 80 901.314
1.316
1.318
1.320
1.322
1.324
1.326
1.328R
efra
ctiv
e In
dex
(R
IU)
Temperature (C)
b)
Figure 4.12 – (a) Dependence of the refractive index of water on the operation wavelength for different
temperatures and (b) refractive index of water as a function of temperature, for a wavelength of 1550 nm.
Figure 4.12 (b) shows the relationship between the water refractive index and the
temperature, for an operation wavelength of 1550 nm. The refractive index diminishes as
temperature increases, and the data can be well adjusted to the second order polynomial:
6 2 51.073 10 5.982 10 1.327.n T T T (4.24)
By converting the water temperature change into its refractive index variation, it is
possible to infer the sensing head response towards this parameter. This approach is
only valid when the device under study exhibits a response where the different
contributions to its sensitivity can be discriminated.
4.5.2 Experimental Results
The experimental reflection spectra of two different cavities are shown in Fig. 4.13,
for two different external media. The first cavity had a length of (80 ± 3) m and a

FCUP
Fiber Sensing Based on New Structures and Post-Processing Enhancement
73
(13 ± 3) m thick diaphragm. Regarding the second sensor, it presented a FP cavity
length of (95 ± 3) m and a diaphragm with a thickness of (43 ± 3) m. This data is in
good agreement with the simulation results presented in Fig. 4.11. When the sensor is
placed in water, there is an increase in the losses and the visibility diminishes. This
behavior is highly dependent on the diaphragm thickness. If the thickness of the
diaphragm is larger than 40 m, there is an increase of the losses, but the visibility
remains nearly the same, as can be seen in Fig. 4.13 (b).
1530 1540 1550 1560 1570 1580 1590-48
-44
-40
-36
-32
-28
-24
-20
-16
b)
Air
Water
Op
tica
l P
ow
er (
dB
)
Wavelength (nm)
a)
1530 1540 1550 1560 1570 1580 1590-48
-44
-40
-36
-32
-28
-24
-20
-16
Air
Water
Op
tica
l P
ow
er (
dB
)
Wavelength (nm)
Figure 4.13 – Spectra of the FP micro-cavity when the external medium is air (black line) and water (blue
line). (a) Sensor with a thin diaphragm. (b) Sensor with a thick diaphragm.
The sensing heads were subjected to temperature measurements in air and in water.
In the first case, the sensor was placed inside a tubular oven and measurements were
done in a range between room temperature (~23 °C) and 85 °C. Afterwards, the device
was submerged in hot water (~85 °C), which was let to cool down until room
temperature. In both cases, the temperature resolution was of 0.1 °C.
Regarding the response of the sensor with a thick diaphragm, shown in Fig. 4.14, it is
independent of the external media. The linear sensitivities obtained were of
(9.6 ± 0.1) pm/°C and (9.7 ± 0.1) pm/°C when the surrounding medium was air and
water, respectively. This means independence of the sensitivity from the surrounding
medium. Such result, which is also visible looking at Fig. 4.13 (b) where essentially the
channeled spectrum does not depend of having either air or water outside, indicates that
the amplitude of E3 is residual in both situations. This points out to significant extra
optical loss when the diaphragm thickness increases from ~13 m to ~43 m, probably

FCUP
Fiber Sensing Based on New Structures and Post-Processing Enhancement
74
introduced due to a mismatch of the fabrication conditions from the established
procedure.
0 10 20 30 40 50 60 700.0
0.1
0.2
0.3
0.4
0.5
0.6
0.7
Air
Water
(n
m)
T (C)
Figure 4.14 – Wavelength shift dependence of the sensor response with a diaphragm of 43 µm on the applied
temperature, in two different media.
The sensing device with the thinner diaphragm (of ~13 m) was subjected to the
same external conditions, and the results are shown in Fig. 4.15 (a). The sensor response,
in this case, is affected by the external medium, and its sensitivity is lower when
submerged in water (blue hollow circles) than when in air (black solid circles). In the
former situation, a sensitivity of (9.4 ± 0.1) pm/°C was obtained, whereas in the last one
the sensitivity was of (13.5 ± 0.1) pm/°C. The difference between these values is an
indication that the refractive index variation of water induced by the temperature has an
impact on the sensor response.
Thus, considering that 1 corresponds to the wavelength shift of the cavity optical
spectrum when the external medium is air, we can write
1 1,
Tk T (4.25)
where 1T
k stands for the temperature sensitivity. If, on the other hand, the external
medium is water, the wavelength shift can be separated into two different components:
one related to the diaphragm silica thermal expansion ( 1Tk ), which was previously
measured in air, and the other attributed to the water refractive index variation ( 2Tk ).

FCUP
Fiber Sensing Based on New Structures and Post-Processing Enhancement
75
Therefore, the wavelength shift measured in this situation is related to temperature
according to the expression
2 1 2.
T Tk k T (4.26)
Subtracting Eq. 4.26 and Eq. 4.25, the following relationship is attained:
2 1 2.
Tk T (4.27)
The calculated wavelength shift due to the water contribution is shown in Fig. 4.15 (b). In
this case the sensitivity is negative, with a value of (-5.8 ± 0.2) pm/°C.
0 10 20 30 40 50 60 70-0.5
-0.4
-0.3
-0.2
-0.1
0.0
2-
1
(
nm
)
T (C)
b)
0 10 20 30 40 50 60 70
0.0
0.2
0.4
0.6
0.8
1.0
1(air)
2(water)
(n
m)
T (C)
a)
Figure 4.15 – Wavelength shift dependence on temperature: (a) sensing head exposed to air (black circles)
and when immersed in water (blue circles) and (b) calculated water contribution.
The sensing head response to the variation of the external medium refractive index
can be estimated by applying the relationship between the water refractive index and the
temperature, which was described in Section 4.5.1. By diminishing temperature, the
refractive index increases, and with it, there is a wavelength shift of the interferometric
cavity towards red, as can be seen in Fig. 4.16. This variation was adjusted to the
following second order polynomial,
2( ) 1758.7 560.7 4608.8 1484.1 3018.9 982.0 ,n n n (4.28)
where the wavelength, , is in nm, and n corresponds to the refractive index, and comes
in RIU. It is possible to extrapolate two different linear regions from Fig. 4.16, one for

FCUP
Fiber Sensing Based on New Structures and Post-Processing Enhancement
76
lower refractive indices, between 1.319 RIU and 1.324 RIU, and another for higher
refractive indices, from 1.325 RIU to 1.327 RIU. A sensitivity of (38.7 ± 2.5) nm/RIU was
attained for the former, whilst a sensitivity of (56.7 ± 4.2) nm/RIU was obtained for the
last region. Although the sensitivities obtained are lower than the ones reported in the
literature, with this configuration there is no fiber core exposition to the external
medium. It is only the interaction between the reflection of the third wave at the end of
the fiber tip and the environment that ensures the spectrum variation.
1.319 1.320 1.321 1.322 1.323 1.324 1.325 1.326 1.327 1.328-0.40
-0.35
-0.30
-0.25
-0.20
-0.15
-0.10
-0.05
0.00
(n
m)
Refractive Index (RIU)
Temperature
Figure 4.16 – Wavelength shift variation with the water refractive index.
Besides the variation in the spectrum with the water temperature, a change in the
visibility of the spectrum was also noticed. This is also an effect of the variation of the
refractive index of water, as already mentioned. Therefore, a different kind of analysis
could also have been done with this sensing head, in complement to the approach
described above.
4.6 Final Remarks
In this Chapter, two different sensing configurations were proposed based on post-
processing of a double clad optical fiber. The fiber did not guide light in its core, due to
the higher refractive index in the P-doped inner cladding. However, after applying wet
chemical etching, this layer was removed and light started to propagate in the core. In
the first configuration, the micro-cavity was only constituted by a short section of such

FCUP
Fiber Sensing Based on New Structures and Post-Processing Enhancement
77
etched fiber spliced to a SMF. The device was successfully tested to extreme
temperatures and revealed to be more sensitive than more conventional fiber structures,
such as the fiber Bragg grating (FBG) [231] or the hollow core silica tube [122]. In the first
case, the structure was ~1.1 times more sensitive than the FBG, whereas in the last, the
sensitivity was ~2 times higher. However, when the structure is placed in a liquid
medium, this liquid will surround the suspended core, causing instability in the spectral
response. A different configuration was then developed. In this case, a thin diaphragm
was applied to the first structure by fusion splicing. This translated into a more stable
device that presented different responses to temperature when the external medium was
air or water. This behavior was due to the fact that the sensing head was measuring,
besides the silica thermal expansion, the water refractive index variation with
temperature. Thus, this sensor is an interesting design to be used in aqueous
environments, namely, in biochemistry. Furthermore, if used in a multiplexed
configuration, it can allow temperature compensation or even measurement of different
parameters.


CHAPTER FIVE
5 Sensing Structures Incorporated in Optical
Fibers


FCUP
Fiber Sensing Based on New Structures and Post-Processing Enhancement
81
5.1 Introduction
The measurement of strain and temperature using fiber optic-based configurations
has been a subject of extensive research since the first steps in the field were taken. With
the rapid technological evolution occurring currently in our society, the industry seeks
sensors easy to manufacture, to implement and to control. The lifespan must be high; the
devices have to be reliable, stable and highly sensitive. There are already commercial
solutions based on fiber optic sensors, such as the fiber Bragg grating (FBG). However,
there is still room for research, exploiting different configurations or trying to achieve
even better sensitivities and resolutions.
Intrinsic Fabry-Perot (FP) cavities formed between two sections of fiber present low
sensitivity to temperature, being a good alternative for the measurement of strain
without the need to compensate the temperature effects. The structures can be formed by
splicing a short section of hollow core photonic crystal fiber (PCF) [85] or a chemically
etched multimode fiber section [135] between two sections of single mode fiber (SMF).
Another possibility is to form an air cavity, like a bubble or a spheroidal cavity, inside
the fiber. There are different ways to fabricate the structures through splicing. For
example, the splice of two sections of SMF [130, 150], SMF spliced to index guiding
PCF [101] or splicing a flat and hemispherical tip of SMF [132]. The sensors proposed in
these works were characterized to strain and temperature separately.
Even though there are several reported works concerning strain and temperature
measurements, such as the ones previously mentioned, the measurement of strain at
high temperatures has not been fully explored, in particular, when temperatures exceed
750 °C. Ran et al. proposed the use of a FP cavity to measure strain at temperatures as
high as 800 °C [84]. The cavity was created using 157 nm laser micromachining. The
fabrication of an air bubble cavity by splicing a multimode PCF to a SMF has also been
proposed [121]. In this case, the FP cavity was subjected to strain measurements up to
1850 , at temperatures between 100 °C and 750 °C. Rao et al. reported on the annealing
behaviors of a long period grating fabricated in a PCF using a high-frequency CO2 laser
[232]. The sensor was tested in strain at temperatures as high as 650 °C.

FCUP
Fiber Sensing Based on New Structures and Post-Processing Enhancement
82
In its turn, the FBG is probably one of the most popular structures for monitoring
strain and/or temperature, both in academic research and in industrial applications. The
most common fabrication technique is based on UV-laser irradiation and relies on the
photosensitivity of the fiber to produce the periodic index modulation [233]. However,
these devices present poor stability for temperatures above 500 °C, being completely
erased at 700 °C [234]. In 2004, Martinez et al. reported a method for direct writing of
FBGs, using a point-by-point femtosecond laser technique [235]. With this method the
change in the refractive index is produced locally and there is no need for phase-masks
or even photosensitive fibers. Besides, these structures exhibit an excellent stability
above 1000 °C [234].
In this Chapter, the measurement of strain is addressed from two different
perspectives. The first is relative to the control of the sensitivity of a FP sensor structure,
simply by varying the cavity length. The second perspective is related to the
measurement of strain at high temperatures, considering the response of a sensor based
on a FP cavity and the response of a FBG. In this case, both are subjected to strain at
different temperatures, which can be as high as 900 °C and the influence of thermal
annealing is also addressed, to stabilize the sensor response and improve its
performance at high temperatures. These types of measurements can be used in the
monitoring of crack development or propagation in the civil engineering field, or in
advanced turbine engines or even space plane engines, among other situations where
high temperatures are involved and strain or stress needs to be monitored [233, 236].
5.2 Controlling the Sensitivity of a Fabry-Perot Strain Sensor
In this Section, a Fabry-Perot (FP) strain sensor is described. The sensing element is
based on a small section of hollow core ring photonic crystal fiber (HCR-PCF). The
ability to manufacture samples with short lengths enables the control of the strain
sensitivity, which can be more than 15 times the strain sensitivity of a fiber Bragg grating
(~1.2 pm/ at 1550 nm [231]).

FCUP
Fiber Sensing Based on New Structures and Post-Processing Enhancement
83
5.2.1 Sensor Design and Spectral Characteristics
The HCR-PCF used to create the FP cavity, and whose cross-section is shown in
Fig. 5.1 (a), is the same as the one described in Section 3.4. The cavity was obtained by
fusion splicing a section of this fiber between two single mode fibers (SMFs), following
the procedures described in Section 3.3.1. The microscope photograph of one of the
samples characterized in this work is shown in Fig. 5.1 (b).
Figure 5.1 – Microscope images of (a) the HCR-PCF cross-section and (b) the 207 m long sample.
The scheme of the experimental setup is shown in Fig. 5.2. It was constituted by a
broadband optical source, with a bandwidth of 100 nm and centered at 1570 nm, an
optical spectrum analyzer (OSA), with a resolution of 0.1 nm and an optical circulator.
Optical Source
Optical Circulator
FP cavity
Splices
OSA
Figure 5.2 – Scheme of the experimental setup. OSA stands for optical spectrum analyzer and FP cavity
corresponds to the Fabry-Perot cavity.
Four different devices, with different FP cavity lengths, were fabricated and
characterized in strain. The spectral behavior of each sample, shown in Fig. 5.3, is similar
to a two-wave interferometer. The period of the FP fringes, , depends on the FP cavity
length (LFP) according to1 2
2eff FP
n L , where 1 and 2 are the wavelengths of two
adjacent fringes and neff is the effective refractive index of the fundamental mode
propagating in the HCR-PCF. The average refractive index was estimated to be
(1.02 ± 0.01) RIU for an operation wavelength of 1550 nm, which means that most of light
travels inside the hollow core. The interferometric period was estimated to be
a) b)

FCUP
Fiber Sensing Based on New Structures and Post-Processing Enhancement
84
(35.3 ± 0.1) nm, (6.0 ± 0.1) nm and (1.3 ± 0.1) nm for the (35 ± 2) m, (207 ± 2) m and
(906 ± 5) m long FP cavities, respectively. The smaller FP cavity, which had a length of
(13 ± 2) m, only presents one interference peak in the spectral range considered, thus it
was not possible to estimate the interferometric period from the spectral response in
Fig. 5.3.
1560 1570 1580 1590 1600 1610 1620-40
-35
-30
-25
-20
LFP
=13m
d)
a)
c)
b)
StrainStrain
Op
tica
l P
ow
er (
dB
)
Wavelength (nm)
Strain
1540 1550 1560 1570 1580 1590 1600 1610-24
-23
-22
-21
-20
-19
-18
LFP
=35m
Strain
Op
tica
l P
ow
er (
dB
)
Wavelength (nm)
1540 1544 1548 1552 1556 1560-27
-25
-23
-21
-19
-17
LFP
=207m
Op
tica
l P
ow
er (
dB
)
Wavelength (nm)1548 1549 1550 1551 1552
-25
-23
-21
-19
-17
-15
LFP
=906mOp
tica
l P
ow
er (
dB
)
Wavelength (nm) Figure 5.3 – Spectra of the four samples, with different FP cavity lengths. The spectrum shift with the
applied strain is also shown for each sample.
5.2.2 Experimental Results
The devices were characterized in strain, at room temperature, being under the same
test conditions. Thus, the fiber was attached to a translation stage with a resolution of
0.01 mm. The total length of fiber over which strain was applied, composed by the SMF
sections and the HCR-PCF, was of (700 ± 5) mm. This length, defined as LT, is identified
in Fig. 5.4, along with the other dimensions considered in this work.
Fixed point
FP cavitySMF SMF
LSMF/2 LSMF/2LFP
LT
Translation stage
Figure 5.4 – Identification of the lengths considered in the strain analysis.

FCUP
Fiber Sensing Based on New Structures and Post-Processing Enhancement
85
The interferometric spectrum shifts towards longer wavelengths (red shift) as strain
is applied, which means that the optical path increased with strain (see Fig. 5.3). The
wavelength shift dependence on strain of each sensor is shown in Fig. 5.5 (a). There is a
clear influence of the FP cavity length in the sensitivity to strain. In fact, the smaller the
sensing head, the higher the sensitivity. Furthermore, the response is linear in all cases.
For the 906 m long device, a sensitivity of (3.12 ± 0.01) pm/ was attained, whereas for
the 207 m long sample, the sensitivity was of (3.79 ± 0.01) pm/. Decreasing the length
to 35 m translated into a sensor with a doubled sensitivity, of (6.16 ± 0.01) pm/.
Decreasing the length furthermore, to 13 m, resulted in a sensitivity of
(15.43 ± 0.01) pm/. This means that by choosing the appropriate FP cavity length, it is
possible to tailor the sensitivity most suitable for the desired application. Figure 5.5 (b)
presents the estimated sensitivities as a function of the FP cavity length along with the
tendency curve. The non-linear behavior shows the rapid increase of the sensitivity for
smaller FP cavities, following the same tendency as observed in other configurations
[237].
0 100 200 300 400 500 600 700 800 90010000
2
4
6
8
10
12
14
16b)
Wav
elen
gth
Sh
ift
(nm
)
Strain ()
LFP
= 13m
LFP
= 35m
LFP
= 207m
LFP
= 906m
a)
0 100 200 300 400 500 600 700 800 90010002
4
6
8
10
12
14
16
18
Sen
siti
vit
y (
pm
/)
Fabry-Perot Cavity Length (m)
Figure 5.5 – (a) Sensors response to the applied strain. (b) Sensitivity dependence on the FP cavity length.
Inset: microscope photograph of the 13 m long sensing head.
Further investigations were carried out to understand the influence of the total
length over which strain was applied (LT). The FP cavity with a length of 207 m was
subjected to strain, considering three different total gauge lengths: of 706 mm, 342 mm
and 170 mm. The behavior, shown in Fig. 5.6 (a), is linear in all situations and the
sensitivities are quite close to each other: (3.79 ± 0.01) pm/, (3.75 ± 0.01) pm/ and
(3.67 ± 0.01) pm/, for the gauge length of (706 ± 5) mm, (342 ± 5) mm and (170 ± 5) mm,

FCUP
Fiber Sensing Based on New Structures and Post-Processing Enhancement
86
respectively. Figure 5.6 (b) shows the strain sensitivity as a function of the total gauge
length, where it is explicit that as the total length increases, the sensitivity is enhanced.
However, the variation is of only 0.12 pm/ for a total length increase of ~540 mm.
Thus, even though there is an improvement in the sensitivity, this is not the dominant
parameter for this matter.
0 100 200 300 400 500 600 700 800 9001000
0.0
0.5
1.0
1.5
2.0
2.5
3.0
3.5
4.0
b)
Wav
elen
gth
Sh
ift
(nm
)
Strain ()
LT= 706 mm
LT= 342 mm
LT= 170 mm
a)
100 200 300 400 500 600 700 8003.64
3.66
3.68
3.70
3.72
3.74
3.76
3.78
3.80
3.82
Sen
siti
vit
y (
pm
/)
Total Length (mm) Figure 5.6 - (a) Response of the 207 m long sensor cavity to strain, considering three different gauge
lengths. (b) Sensitivity dependence on the gauge length (purple dots) and tendency curve (gray line).
The temperature response of the proposed sensor was analyzed by placing the same
sample inside a tubular oven. The temperature was changed from room temperature to
85 °C, with a resolution of 0.1 °C. The wavelength dependence towards this parameter is
shown in Fig. 5.7.
30 35 40 45 50 55 60 65 70 75 80 851548.40
1548.45
1548.50
1548.55
1548.60
1548.65
1548.70
1548.75
1548.80
Wav
elen
gth
(n
m)
Temperature (C)
Figure 5.7 – Wavelength dependence on temperature for the 207 m long sensing head.

FCUP
Fiber Sensing Based on New Structures and Post-Processing Enhancement
87
The sensitivity attained was of only (0.85 ± 0.06) pm/°C. This indicates that, in most
situations, the sensing device can be used to perform strain measurements without
requiring temperature compensation, since the cross-sensitivity is of only 0.21 /°C [32].
5.3 Measuring Strain at High Temperatures (Part I): Silica Tube
This Section describes the characterization of a Fabry-Perot cavity based on a silica
tube with a special design. Strain measurements are performed at different
temperatures, which can be as high as 900 °C. The annealing effects are also addressed.
5.3.1 Sensor Design and Spectral Characteristics
The silica tube used in this work was fabricated at the IPHT-Jena. All components of
the silica tube were manufactured from high purity silica Heraeus Suprasil® F300. Four
rods, with a diameter of 1.2 mm were placed inside the cladding tube, which had an
inner diameter of 4 mm and an outer diameter of 6 mm, in exact orthogonal positions,
and were sintered using the modified chemical vapor deposition (MCVD) method. The
preform was drawn to the final fiber by pressurized drawing at constant temperature.
The pressure inside the preform changed from 1000 Pa to 3000 Pa above atmospheric
pressure. Higher pressure translated into larger silica tube hollow core area. This effect
can be seen in Fig. 5.8. The final outer diameter was of 125 m and the silica tube was
coated with a single layer of ultraviolet cured acrylate.
Figure 5.8 – Cross section images of the silica tube varying the pressure during fiber drawing: (a) p = 1000 Pa,
(b) p = 2300 Pa and (c) p = 3000 Pa.
The silica tube shown in Fig. 5.8 (b) was selected to be used as a sensing element, in a
FP configuration. It presented a cladding with a thickness of (14 ± 2) m, a hollow core

FCUP
Fiber Sensing Based on New Structures and Post-Processing Enhancement
88
and the four small rods presented a diameter of (20 ± 2) m each. The presence of the
four rods will have a reinforcement effect in the structure. This matter will be discussed
further ahead.
The FP cavity, shown in Fig. 5.9, was obtained by fusion splicing a short section of
silica tube between two sections of SMF, following the same procedures as described in
Section 3.3.1. The sensor was interrogated in a reflection scheme similar to the one
presented in Fig. 5.2. The OSA resolution was, in this case, of 0.02 nm.
Figure 5.9 – Photograph of one FP cavity based on the new hollow core silica tube design.
Four different sensors were produced, with different cavity lengths. The spectrum of
each sensor, presented in Fig. 5.10, is the result of a two wave interferometer. The mean
effective refractive index was estimated to be ~1.00 RIU, meaning that almost all light
travels inside the hollow core.
1520 1535 1550 1565 1580 1595 1610-42
-38
-34
-30
-26
-22
d)
b)
c)
Op
tica
l P
ow
er (
dB
)
Wavelength (nm)
L=17ma)
1540 1550 1560 1570 1580 1590-38
-34
-30
-26
-22
Op
tica
l P
ow
er (
dB
)
Wavelength (nm)
L=51m
1535 1545 1555 1565 1575 1585-44
-40
-36
-32
-28
-24
-20
Op
tica
l P
ow
er (
dB
)
Wavelength (nm)
L=70m
1535 1540 1545 1550 1555 1560 1565 1570-17
-16
-15
-14
-13
-12
-11
Op
tica
l P
ow
er (
dB
)
Wavelength (nm)
L=198m
Figure 5.10 – Spectra of the four FP cavity sensors.

FCUP
Fiber Sensing Based on New Structures and Post-Processing Enhancement
89
5.3.2 Experimental Results
In a first stage, the samples were attached to a translation stage with a resolution of
0.01 mm and strain measurements were carried out at room temperature. The total
length over which strain was applied was kept constant throughout the experiments,
with a value of (735 ± 5) mm. The FP cavities response towards the applied strain is
linear, as shown in Fig. 5.11 (a). Besides, the sensitivity depends on the FP cavity length.
Sensitivities of (13.9 ± 0.1) pm/, (6.0 ± 0.1) pm/, (4.6 ± 0.1) pm/ and (3.5 ± 0.1) pm/
were respectively attained for the 17 m, 51 m, 70 m and 198 m long samples,
following the same trend as in the previous configuration. The cavity lengths were
determined through the microscope images, with an associated uncertainty of ± 2 m.
0 100 200 300 400 500 600 700 800 900 10000
2
4
6
8
10
12
14
L=17m
L=51m
L=70m
L=198m
Wav
elen
gth
Sh
ift
(nm
)
Strain ()
a)
0 100 200 300 400 500 600 700 800 900 1000
0.0
0.1
0.2
0.3
0.4
0.5
0.6
0.7
0.8
Wav
elen
gth
Sh
ift
(nm
)
Temperature (C)
b)
Figure 5.11 – (a) FP cavity sensors response to the applied strain. (b) Response of the 198 m long sensor to
temperature.
The 198 m long sensor was placed inside a tubular oven, with the FP cavity placed
at its center. The fiber was kept straight but loose, without any tension applied. The
sensor was then subjected to a temperature variation of ~900 °C. The interferometric
spectrum shifted towards longer wavelengths with the increase of temperature (red
shift), as can be seen in Fig. 5.11 (b). The experimental data was well adjusted to a linear
fitting and a sensitivity of (0.85 ± 0.01) pm/°C was attained, which indicates that this
sensor presented a cross-sensitivity of ~0.24 /°C. Considering the round-trip
propagation phase shift 2 4eff FP
m n L , where m is the interference peak order,
after some straightforward algebraic manipulation, it is possible to re-write the equation
as 2 /eff FP
d n dL m . Combining the two equations, one gets for the thermal sensitivity of
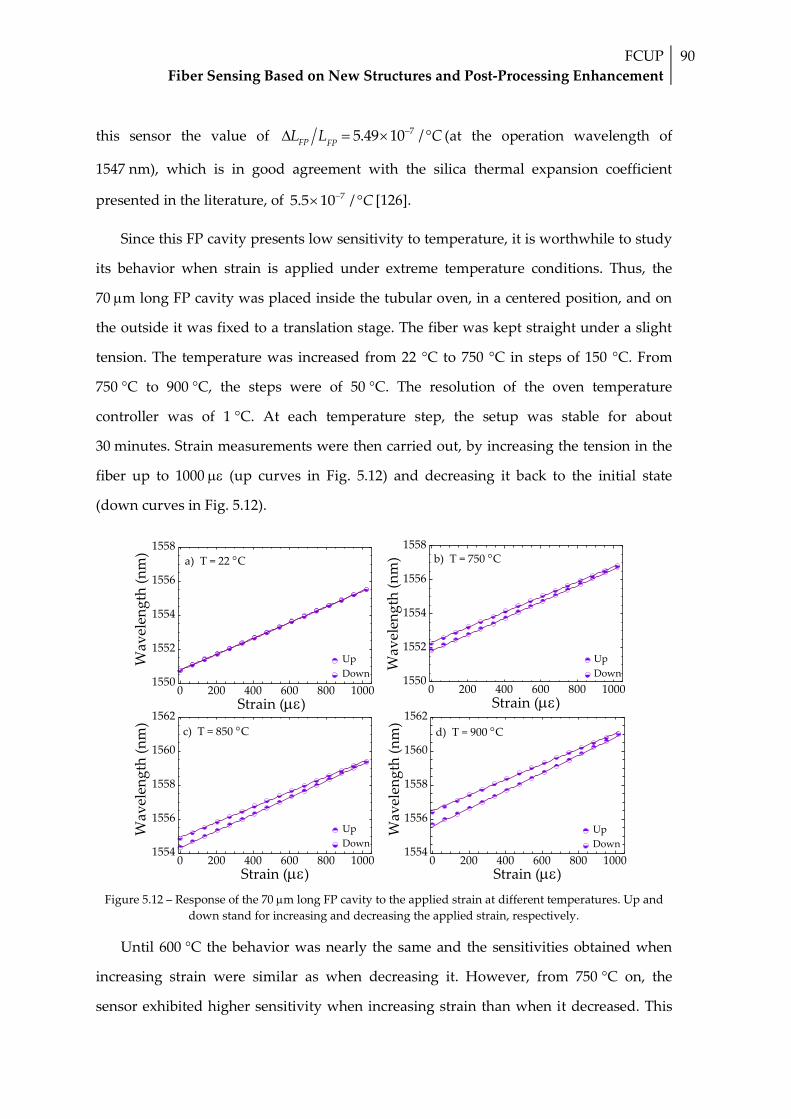
FCUP
Fiber Sensing Based on New Structures and Post-Processing Enhancement
90
this sensor the value of 75.49 10 /FP FP
L L C (at the operation wavelength of
1547 nm), which is in good agreement with the silica thermal expansion coefficient
presented in the literature, of 75.5 10 / C [126].
Since this FP cavity presents low sensitivity to temperature, it is worthwhile to study
its behavior when strain is applied under extreme temperature conditions. Thus, the
70 m long FP cavity was placed inside the tubular oven, in a centered position, and on
the outside it was fixed to a translation stage. The fiber was kept straight under a slight
tension. The temperature was increased from 22 °C to 750 °C in steps of 150 °C. From
750 °C to 900 °C, the steps were of 50 °C. The resolution of the oven temperature
controller was of 1 °C. At each temperature step, the setup was stable for about
30 minutes. Strain measurements were then carried out, by increasing the tension in the
fiber up to 1000 (up curves in Fig. 5.12) and decreasing it back to the initial state
(down curves in Fig. 5.12).
0 200 400 600 800 10001550
1552
1554
1556
1558
Wav
elen
gth
(n
m)
Strain ()
Up
Down
a) T = 22 C
0 200 400 600 800 10001550
1552
1554
1556
1558b) T = 750 C
Wav
elen
gth
(n
m)
Strain ()
Up
Down
0 200 400 600 800 10001554
1556
1558
1560
1562
d) T = 900 Cc) T = 850 C
Wav
elen
gth
(n
m)
Strain ()
Up
Down
0 200 400 600 800 10001554
1556
1558
1560
1562
Wav
elen
gth
(n
m)
Strain ()
Up
Down
Figure 5.12 – Response of the 70 m long FP cavity to the applied strain at different temperatures. Up and
down stand for increasing and decreasing the applied strain, respectively.
Until 600 °C the behavior was nearly the same and the sensitivities obtained when
increasing strain were similar as when decreasing it. However, from 750 °C on, the
sensor exhibited higher sensitivity when increasing strain than when it decreased. This
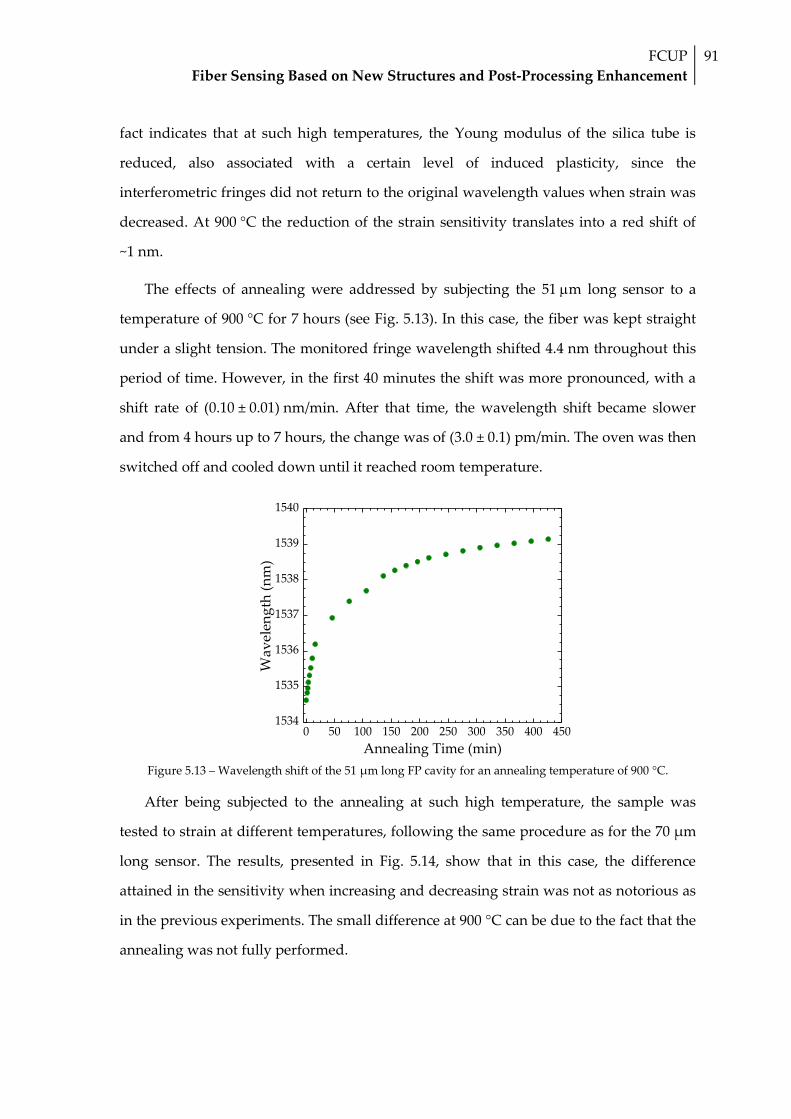
FCUP
Fiber Sensing Based on New Structures and Post-Processing Enhancement
91
fact indicates that at such high temperatures, the Young modulus of the silica tube is
reduced, also associated with a certain level of induced plasticity, since the
interferometric fringes did not return to the original wavelength values when strain was
decreased. At 900 °C the reduction of the strain sensitivity translates into a red shift of
~1 nm.
The effects of annealing were addressed by subjecting the 51 m long sensor to a
temperature of 900 °C for 7 hours (see Fig. 5.13). In this case, the fiber was kept straight
under a slight tension. The monitored fringe wavelength shifted 4.4 nm throughout this
period of time. However, in the first 40 minutes the shift was more pronounced, with a
shift rate of (0.10 ± 0.01) nm/min. After that time, the wavelength shift became slower
and from 4 hours up to 7 hours, the change was of (3.0 ± 0.1) pm/min. The oven was then
switched off and cooled down until it reached room temperature.
0 50 100 150 200 250 300 350 400 4501534
1535
1536
1537
1538
1539
1540
Wav
elen
gth
(n
m)
Annealing Time (min)
Figure 5.13 – Wavelength shift of the 51 µm long FP cavity for an annealing temperature of 900 °C.
After being subjected to the annealing at such high temperature, the sample was
tested to strain at different temperatures, following the same procedure as for the 70 µm
long sensor. The results, presented in Fig. 5.14, show that in this case, the difference
attained in the sensitivity when increasing and decreasing strain was not as notorious as
in the previous experiments. The small difference at 900 °C can be due to the fact that the
annealing was not fully performed.

FCUP
Fiber Sensing Based on New Structures and Post-Processing Enhancement
92
0 200 400 600 800 10001550
1552
1554
1556
1558W
avel
eng
th (
nm
)
Strain ()
Up
Down
0 200 400 600 800 10001550
1552
1554
1556
1558
Wav
elen
gth
(n
m)
Strain ()
Up
Down
0 200 400 600 800 10001550
1552
1554
1556
1558
Wav
elen
gth
(n
m)
Strain ()
Up
Down
a) T = 22 C b) T = 750 C
c) T = 850 C d) T = 900 C
0 200 400 600 800 10001550
1552
1554
1556
1558
Wav
elen
gth
(n
m)
Strain ()
Up
Down
Figure 5.14 – Response of the 51 m long FP cavity to strain at different temperatures, after 7 hours of
annealing, at 900 °C. Up and down stand for increasing and decreasing the applied strain, respectively.
The sensitivities to strain at different temperatures are gathered in Fig. 5.15. In both
sensors, regardless of having been annealed, the strain sensitivity decreased as
temperature increased up to 600 °C, increasing once again afterwards. This effect can be
attributed to two reasons: the non-linear variation of the silica thermal expansion as
temperature arises [238], as well as the dependence of the photoelastic constant on
temperature. The photoelastic constant is essentially determined by the Pockels
coefficient, p12, which exhibits a maximum at 600 °C [239], translating into a minimum in
the strain sensitivity. Nevertheless, the difference between applying strain and reducing
it is much more significant when no annealing occurred.
0 200 400 600 800 10004.2
4.4
4.6
4.8
5.0
5.2
5.4b)
Stra
in S
ensi
tiv
ity
(p
m/)
Temperature (C)
Strain up
Strain down
a)
0 200 400 600 800 10005.4
5.6
5.8
6.0
6.2
6.4
6.6
Stra
in S
ensi
tiv
ity
(p
m/)
Temperature (C)
Strain up
Strain down
Figure 5.15 – Dependence of the strain sensitivity at different temperatures: (a) without annealing and (b)
with annealing.

FCUP
Fiber Sensing Based on New Structures and Post-Processing Enhancement
93
The mechanical stability of this new silica tube design was compared to the one of a
conventional silica tube by applying strain until rupture. Both cavities were fabricated
under the same conditions. The conventional silica tube, whose cross-section is shown
on the inset of Fig. 5.16, had a hollow core diameter of (57 ± 2) m, and a total cross-
section area of ~2550 m2. Regarding the new design, with the four rods, its hollow
cross-section area was of ~5980 m2. Two sensors were fabricated with a length of
~750 m. The sensor based on the silica tube without rods was able to measure strain up
to 1500 , with a linear sensitivity of (1.95 ± 0.01) pm/(see Fig. 5.16). Regarding the
sensor with the new silica tube design, it was possible to measure strain up to ~2500 ,
with a linear sensitivity of (3.39 ± 0.01) pm/.
0 300 600 900 1200 1500 1800 2100 2400 27000
1
2
3
4
5
6
7
8
9
10
Wav
elen
gth
Sh
ift
(nm
)
Strain ()
Figure 5.16 – Sensors response to the applied strain until rupture. The insets show the cross-section
photographs of the silica tube used as sensing element in each case.
The size of the hollow core area plays an important role in the sensitivity, along with
the FP cavity length. Large hollow core areas and short cavity lengths translate into an
enhancement of the sensitivity. This occurs due to a much reduced effective Young
modulus of the hollow core structure associated with the smaller fraction of silica
material in its cross-section. Therefore, most of the deformation occurs in the tube region
and with a spatial rate that increases with the reduction of the tube length, therefore
increasing the strain sensitivity. Besides, the presence of the four rods constitute a
reinforcement to the new structure, which shows favorable sensing properties both in

FCUP
Fiber Sensing Based on New Structures and Post-Processing Enhancement
94
what concerns strain sensitivity and mechanical resilience, indicating its adequacy for
application in harsh environments.
5.4 Measuring Strain at High Temperatures (Part II): Fiber Bragg Gratings
In this Section, a fiber Bragg grating (FBG) written in standard single mode fiber
(SMF) is characterized in strain at different temperatures. The influence of the thermal
annealing in the sensor response is also investigated.
5.4.1 Sensor Design and Spectral Characteristics
The FBGs used in this work were written in standard SMF using the point-by-point
femtosecond laser technique. The devices were fabricated at the Aston Institute of
Photonic Technology, in Birmingham, England. With such inscription technique, the
laser beam is focused in the fiber core and due to its high power and very high repetition
rate, as it moves along the fiber a local change in the core refractive index is induced (see
Fig. 5.17). These structures are highly stable thermally, and can withstand temperatures
above 1000 °C [234, 240]. The details regarding the inscription are included in the
Appendix II.
Figure 5.17 – Microscope photograph of a fiber Bragg grating written using the point-by-point femtosecond
laser technique.
The experimental setup used to characterize the devices, shown in Fig. 5.18, was
constituted by a broadband optical source (bandwidth of 100 nm, centered at 1570 nm)
and an optical spectrum analyzer (OSA), with a resolution of 0.01 nm. All readings were
performed in transmission.

FCUP
Fiber Sensing Based on New Structures and Post-Processing Enhancement
95
Optical Source
OSA
FBG
Figure 5.18 – Scheme of the experimental setup. OSA refers to the optical spectrum analyzer and FBG is the
fiber Bragg grating (the scheme is not to scale).
The two FBGs characterized in this work had a length of 5.7 mm. The FBG1
presented a reflectivity of 94.23 %, a Bragg wavelength of 1550.42 nm and a full-width at
half-maximum (FWHM) of ~0.33 nm. In its turn, the FBG2 had a reflectivity of 99.96%,
the Bragg wavelength was of 1550.31 nm and the FWHM was of ~0.82 nm. The
transmission spectra of both samples are shown in Fig. 5.19.
1548 1549 1550 1551 1552 1553 15540.0
0.2
0.4
0.6
0.8
1.0
Op
tica
l P
ow
er (
W)
Wavelength (nm)
FBG1
FBG2
Figure 5.19 – Initial transmission spectra of the two fiber Bragg gratings (FBGs).
5.4.2 Experimental Results
The sensors were tested to strain at high temperatures as in the case of the FP cavity
previously described. One sample, FBG1, was subjected to an annealing treatment prior
to the strain measurements, while the other, FBG2, was tested without annealing. The
FBG1 was placed inside a tubular oven, in a centered position and on the outside it was
fixed to a supporting structure on one end and to a translation stage on the other end.

FCUP
Fiber Sensing Based on New Structures and Post-Processing Enhancement
96
0 100 200 300 400 500 600 700 800 900 10001551
1553
1555
1557
1559
1561
1563
1565
Wav
elen
gth
(n
m)
Temperature (C)
Figure 5.20 – FBG1 response to temperature.
At this stage of the experiment, the fiber was kept straight but loose, without any
tension applied. Temperature was increased up to 900 °C and the Bragg wavelength shift
was measured as the oven heated. The response, shown in Fig. 5.20, exhibits a nonlinear
behavior that can be approximated to the second order equation:
6 2 3( ) 3.5 0.1 10 11.5 0.1 10 1550.9 0.1 ,T T T (5.1)
where is the wavelength, in nm, and T corresponds to the temperature, in °C.
Once the oven reached 900 °C, it was kept at that temperature for ~7 hours,
performing thermal annealing to the structure. The wavelength shift with time is
presented in Fig. 5.21 (a). There is a higher increase in the Bragg wavelength in the first
40 minutes, with a rate of (12.4 ± 0.1) pm/min. After the first two hours, this variation
was smoother, and the shift rate decreased to (0.9 ± 0.1) pm/min. However, after 7 hours
the wavelength did not stabilize, which might have influenced the results that followed.
Besides the wavelength shift, the reflectivity of the FBG1 also changed during the
annealing process. The behavior is shown in Fig. 5.21 (b). There was a higher decrease in
the reflectivity in the first 40 minutes than from that moment on. However, the
reflectivity only decreased 3.1% during the thermal annealing, a consequence of the
thermally ultra-stable defects that arise from the interaction between the high intensity
laser pulses and the glass matrix of the fiber core [241]. After an annealing time of
7 hours, the oven was switched off and cooled down until it reached room temperature.

FCUP
Fiber Sensing Based on New Structures and Post-Processing Enhancement
97
0 50 100 150 200 250 300 350 400 4501562.8
1563.0
1563.2
1563.4
1563.6
1563.8
1564.0
b)Bra
gg
wav
elen
gth
(n
m)
Time (min)
a)
0 50 100 150 200 250 300 350 400 45085.5
86.0
86.5
87.0
87.5
88.0
88.5
89.0
89.5
Ref
lect
ivit
y (
%)
Time (min) Figure 5.21 – FBG1 response to an annealing temperature of 900 °C. (a) Bragg wavelength shift with time and
(b) Reflectivity variation with time.
The sample was once again subjected to temperature variations in the same range.
However, now the temperature increase was set to steps of 150 °C until 750 °C and of
50 °C from 750 °C to 900 °C. At each temperature step the system was stabilized for
~30 minutes and strain measurements were carried out, by increasing strain up to
1000 and decreasing it back to its initial state. Figure 5.22 (a) shows the variation of
the FBG1 strain sensitivity with temperature. The up curves are relative to the strain
increase whereas the down curves correspond to the sensitivities obtained when
decreasing strain. The sensor response was always linear, although the sensitivity
changed slightly with temperature, as can be seen in Fig. 5.22 (a). For temperatures
below 600 °C the sensitivity obtained when increasing and decreasing strain was nearly
the same, of (1.2 ± 0.1) pm/. The small increase in the strain sensitivity observed at
temperatures higher than 750 °C can be due to the fact the annealing has not been fully
performed yet. In order to infer about the response of the grating structure without a
prior thermal treatment, the FBG2 was also subjected to measurement of strain at high
temperatures. The response, depicted in Fig. 5.22 (b) shows that at temperatures above
750 °C the sensitivity had a pronounced increase when tension was applied (up curves).
Besides, at this temperature range, the sensor response became non-linear, a
consequence of the joint effect of annealing and the applied strain. However, when the
strain was diminished (down curves), the sensor response was linear and nearly
constant. This effect was also observed in the FP configuration, and is due to the change
of the Young modulus, as well as the induced plasticity in the fiber at such high
temperatures.

FCUP
Fiber Sensing Based on New Structures and Post-Processing Enhancement
98
0 200 400 600 800 10001.1
1.2
1.3
1.4
1.5
1.6
1.7
1.8
1.9S
trai
n S
ensi
tiv
ity
(p
m/)
Temperature (C)
Up
Down
a)
0 200 400 600 800 10001.1
1.2
1.3
1.4
1.5
1.6
1.7
1.8
1.9b)
Str
ain
Sen
siti
vit
y (
pm
/)
Temperature (C)
Up
Down
Figure 5.22 – Strain sensitivity variation with temperature (a) after annealing at 900 °C, FBG1, and (b)
without annealing, FBG2.
With this sensing structure it is possible to clearly observe the effects of subjecting
the fiber to high temperatures, when compared to the FP configuration, since in this case
there is only a peak to track, opposite to the interferometric behavior of the previous
sensor. Figure 5.23 shows the evolution of the FBGs spectra, acquired at room
temperature. There is the initial spectrum, taken before beginning the experiments
(dotted curves), after annealing (only in the case of FBG1, the dashed curves) and after
all measurements were performed (final spectrum, solid curve). The main parameters
are also listed on Table 5.1, for a clear comparison between the results. In the case of
FBG1 (Fig. 5.23 (a)), the major wavelength shift occurred during the annealing
procedure. In this case, the wavelength shift was of 0.72 nm. The effect of applying strain
at high temperatures after the thermal treatment induced a variation of 0.17 nm,
translating into a total Bragg wavelength shift of 0.89 nm.
1549 1550 1551 1552 1553 15540.00
0.02
0.04
0.06
0.08
0.10
0.12
0.14
0.16
0.18
Op
tica
l P
ow
er (
W)
Wavelength (nm)
Initial spectrum
After annealing
Final spectrum
a)
1549 1550 1551 1552 1553 1554
0.00
0.02
0.04
0.06
0.08
0.10
0.12
0.14
0.16
0.18
Op
tica
l P
ow
er (
W)
Wavelength (nm)
Initial spectrum
Final spectrum
b)
Figure 5.23 – Transmission spectra of (a) FBG1, before annealing (dotted curve), after annealing (dashed
curve) and after strain at high temperatures (solid curve) and (b) FBG2, before (dotted curve) and after (solid
curve) being subjected to strain at high temperatures.

FCUP
Fiber Sensing Based on New Structures and Post-Processing Enhancement
99
On the other hand, the direct measurement of strain at high temperatures without
any previous thermal treatment originated a Bragg wavelength shift of 1.24 nm. When
strain and/or temperature are applied to a FBG, not only the grating period changes, but
also the mean refractive index. However, the dominant parameter in the case of strain is
the change in the grating period, whereas for temperature, it is the change in the
refractive index. Without the previous thermal treatment, the structure is not so stable
(which was evidenced by the non-linear response to strain), translating into a higher
shift in the transmission spectrum. The FWHM diminishes in both cases, being more
pronounced when no thermal annealing was performed. Besides, the reflectivity also
diminished slightly.
Table 5.1 – Parameters of the FBGs at room temperature. The values were obtained through the optical
transmission spectra, prior to any measurements (initial values), after 7 hours thermal annealing at 900 °C
and after applying strain at different temperatures (final values). The total wavelength shift is relative to the
beginning and end of the measurements.
Parameter FBG1 FBG2
Initial values
R (%) 94.23 99.96
FWHM (nm) 0.33 0.82
B1 (nm) 1550.42 1550.31
After annealing
R (%) 89.63
No annealing FWHM (nm) 0.31
B2 (nm) 1551.14
Final values
R (%) 89.40 99.84
FWHM (nm) 0.29 0.65
B3 (nm) 1551.31 1551.54
Total wavelength
shift =B3-B1 (nm) 0.89 1.24
5.5 Final Remarks
In this Chapter, three different configurations were proposed, one for the
measurement of strain at room temperature and the other two for the measurement of
strain at high temperatures. The first configuration was a Fabry-Perot (FP) cavity based
on a hollow core photonic crystal fiber spliced between two sections of single mode fiber.
The dependence of the strain sensitivity on the cavity length and with the total length
was explored. It was found that smaller cavities and longer total lengths exhibit higher

FCUP
Fiber Sensing Based on New Structures and Post-Processing Enhancement
100
sensitivities to strain. This configuration presented low sensitivity to temperature. This
study was further developed by considering a different sensing element, based on a
silica tube spliced between two sections of single mode fiber. Several samples were
characterized in strain, and it was confirmed that the smaller the FP cavity length, the
higher the sensitivity. The sensor showed low sensitivity to temperature, thus being a
good candidate to perform strain measurements in high temperature environments.
However, when strain was applied at temperatures higher than 750 °C, the sensitivity
increased as the fiber was tensioned. When the fiber returned to its initial state, without
strain applied, the sensitivity decreased to a value similar to the one found at lower
temperatures. This difference was reduced through thermal annealing before subjecting
the sensing head to strain at extreme conditions. Furthermore, the strain sensitivity
decreased as temperature increased up to 600 °C, increasing once again for higher
temperatures. This configuration was also compared to a FP cavity based on a
conventional silica tube and presented not only higher strain sensitivity, but also better
mechanical resilience.
Fiber Bragg gratings written in standard single mode fiber were also characterized in
strain at high temperatures. The fabrication process was determinant for the high
thermal stability of the device, as it was produced using the point-by-point femtosecond
laser technique. The Bragg wavelength shifted towards longer wavelengths and the
reflectivity decreased slightly, independently of the annealing treatment. However, the
sensor response became more stable after the annealing treatment, following the same
trend as in the FP configuration.

CHAPTER SIX
6 Fiber Lasers for Sensing


FCUP
Fiber Sensing Based on New Structures and Post-Processing Enhancement
103
6.1 Introduction
The first works on optical fiber lasers were published in the 1960s by E. Snitzer [242].
However, it was only in 1993 that Kim et al. presented the first optical fiber laser as
sensor with frequency read-out [243]. The Nd3+-doped fiber, used as the cavity active
medium, was subjected to lateral stress variations that modified the fiber birefringence,
thus changing the modal beat frequency. In the proposed configuration, two dichroic
mirrors were employed to create the cavity. The employment of a Faraday rotating
mirror was proposed by Park et al., for the measurement of magnetic-fields [244]. The
use of such reflective element ensured the laser stability to strain and temperature
variations.
In the meantime, with the development of the fiber Bragg grating (FBG), the
quintessentially wavelength filter, the external bulk mirrors fell into disuse. The FBGs
were not only used as reflective elements, but also as sensing devices, thus combining
the advantages of the fiber laser (such as high signal-to-noise ratio (SNR) and reduced
linewidth) with the ability to perform active sensing, by exposing one mirror, or even the
whole cavity, to the environmental changes to be measured.
The most simple fiber laser sensor, and the one most explored by the scientific
community, is the linear cavity, where the active medium (usually Er3+-doped fiber) is
placed between two FBGs, constituting the distributed Bragg reflector (DBR) laser. The
presence of a wavelength division multiplexer (WDM) enables the coupling of the
980 nm pump light to the cavity [245]. This kind of configuration has been used to
measure dynamic strain [246], temperature [247], ultrasound [248], liquid refractive
index [249], gas pressure [250] and twist [251].
Still considering the linear cavity configuration, it is possible to achieve laser action
by using a single phase-shifted FBG [252]. This type of fiber laser is usually denoted as
distributed feedback (DFB) laser, and it has been used for measurement of several
physical parameters, such as pressure and force [252], simultaneous measurement of
strain and temperature [253], or even acoustic signals [254].

FCUP
Fiber Sensing Based on New Structures and Post-Processing Enhancement
104
A different approach to the linear cavity is the fiber ring laser. In such cavity, the
Er3+-doped fiber is incorporated in a loop. The pump is coupled to the ring cavity
through a WDM and the output signal is detected by using an optical coupler. In a
simpler configuration, a commercial erbium-doped fiber amplifier (EDFA) is placed in
the loop. The wavelength filter can be a FBG placed outside the ring, connected through
an optical circulator [255], a pair of long period gratings incorporated in the ring [256,
257], a section of polarization maintaining (PM) PANDA fiber inside the ring [258] or
even a phase-shifted chirped FBG [259]. The fiber ring laser has been applied in the
measurement of pressure [260], bending and strain [256], vibration [255], and torsion
[257]. When compared to the behavior linear cavities, the unidirectional travelling wave
obtained in the ring configuration eliminates both the backscattering and the spatial-hole
burning effects [261]. Thus, these cavities present good stability, flexibility, and are easy
to manufacture [262].
Going further in the ring configuration, if a non-amplifying loop is added to the
amplifying loop through an optical coupler, a figure-of-eight configuration is obtained.
In this case, the inclusion of an optical filter in the loop can be decisive in achieving good
output stability [263]. The filter can be a PM fiber [261], a twin-core photonic crystal fiber
(PCF) [264], or a triangular core PCF [265]. All these works have been proposed only for
laser action, not for sensing.
In this Chapter, two fiber sensors are proposed, one for torsion measurements and
the other for strain sensing. The first sensor is based on a post-processed FBG. The device
is subjected to strain measurements, where it exhibits an ultra-high sensitivity. Two
different approaches are compared, for passive and active measurements. The second
configuration consists on a figure-of-eight laser, whose interferometric filter, a PM PCF,
also acts as the sensing element. In this case, the torsion can be applied over a range of
180°.

FCUP
Fiber Sensing Based on New Structures and Post-Processing Enhancement
105
6.2 Strain Sensor based on Post-Processed Fiber Bragg Grating
The sensor developed in this work consisted on an etched fiber Bragg grating tip.
The ultra-thin structure was characterized in strain and temperature. A theoretical model
was used to better understand the device behavior.
6.2.1 Theoretical Considerations
The Bragg wavelength of a fiber Bragg grating (FBG) is determined by 2 ,B eff
n
where neff and are, respectively, the effective refractive index of the propagating mode
and the grating pitch [266]. When the FBG is subjected to axial strain, , its Bragg
wavelength will shift according to Eq. 6.1:
(1 ) ,B B e
p (6.1)
where pe is the photoelastic coefficient for silica, considered to be ≈0.22 [267]. In the case
of a tapered FBG created by means of chemical etching, the cross-section area of the fiber
changes with the position z, as exemplified in Fig. 6.1.
Figure 6.1 – Scheme of a tapered FBG without strain applied (top) and under strain (bottom). Adapted from
[268].
Considering a linearly tapered fiber, the radius across z is given by [268]
0
0
( ) 1 ,z
r z rz
(6.2)

FCUP
Fiber Sensing Based on New Structures and Post-Processing Enhancement
106
where r0 is the original radius and z0 is the point along the z axis where the radius of the
fiber becomes zero. The cross-section area comes also a function of z, according to Eq.
6.3:
22 2
0 0( ) ( ) 1 .A z r z r z z (6.3)
When the fiber is under a tension force N, the strain along z can be determined
through
22
0 0
( ) ,1
N Nz
EA z E r z z
(6.4)
where E is the Young modulus of silica. The strain at z = 0 is given by
2
0
(0) .N
E r
(6.5)
Thus, substituting Eq. 6.5 in Eq. 6.4, one gets that
2
0
(0)( ) .
1z
z z
(6.6)
When the fiber is under strain, the FBG pitch along the z axis becomes a function of
the applied tension force, according to Eq. 6.7:
0 0 2
0
(0)( ) (1 ( )) ,
1 /z z
z z
(6.7)
where 0 is the original pitch and 0((0) 0) is the change in the pitch at z = 0. The
variation of the pitch along the FBG translates into a chirp of the spectrum. Besides, the
distribution of strain is not constant in this case.
The previous equations were used in a numerical simulation to better understand the
consequences of having such a structure subjected to strain. Some assumptions were
made, based on the etching behavior observed experimentally. The chemical etching was
performed in the liquid phase; thus, there was an abrupt change of the fiber diameter at
the interface between the un-etched and the etched regions. The decrease of the fiber
cross-section area will induce a larger amount of strain throughout the etched region.

FCUP
Fiber Sensing Based on New Structures and Post-Processing Enhancement
107
Considering that the whole structure is under the same amount of tension force, and
using Eq. 6.5, it is possible to relate the strain applied to the un-etched structure to the
one obtained at the etched region:
2
2,u u
u u e e e
e
rA A
r
(6.8)
where the subscripts u and e designate the un-etched and etched fiber sections,
respectively. Thus, considering fiber radii of 62.5 m and 10 m (r0), for the un-etched
and etched fiber regions, respectively, and that the length of un-etched fiber is much
larger than the length of etched fiber, when 10 are applied to the whole structure, the
amount of strain at the beginning of the tapered region is determined to be ~390 . The
other parameters considered for the numerical simulations were a reduction of the fiber
radius by 10-3 m by unit length, meaning that z0 = 9×10³ m. It was also considered that
the FBG was located ~1.5 mm after the beginning of the tapered region, and had a length
of 3 mm. Besides, three different values were considered for the strain applied to the
whole structure: 10, 50 and 100 . The results obtained for the variation of the FBG pitch
and for the strain along the taper length are shown in Fig. 6.2. The gray rectangle
indicates where the FBG was positioned along the fiber.
0 1 2 3 4 5 6537
539
541
543
545
547
(
nm
)
z (mm)
(0)=10
(0)=50
(0)=100
a)
0 1 2 3 4 5 60
4
8
12
16
20
b)
x
103 (
)
z (mm)
(0)=10
(0)=50
(0)=100
Figure 6.2 – Numerical simulation of an etched FBG, considering three values of initial strain. (a) variation of
the pitch with the length and (b) strain variation along the grating length.
Figure 6.2 (a) presents the pitch variation along the z axis, for three different values
of initial strain. A maximum increase of ~4 nm was attained, when the applied strain was
100 . The dotted lines represented in the Figure are the expected variation of the FBG
pitch if it was located in other regions of the taper. When the analysis is performed

FCUP
Fiber Sensing Based on New Structures and Post-Processing Enhancement
108
considering the increase of strain as the taper becomes thinner, the values obtained are
much more explanatory. In fact, according to the green curve in Fig. 6.2 (b), when the
fiber is subjected to 10 , the strain in the tapered region, in z = 0 mm, is ~100 times
higher. In this case, the applied strain only increases slightly with the taper length.
However, when the applied strain is of 100 , the tension will be more than 5 times
higher near the fiber tip than at the beginning of the taper. However, the strain
experienced by the FBG increases over its length and, at its edge, the strain is twice the
value determined at its beginning. Thus, although the whole structure is only strained by
100 , the tapered region is locally strained up to 20000 , an impressive amount of
strain for such a thin structure.
The variation of strain along the FBG length, and its induced broadening of the
grating pitch translate into a chirped spectrum, which broadens as strain is applied, as a
consequence of an increase in the pitch difference between the beginning and the end of
the FBG. Besides, this sensor is expected to be more sensitive to the applied strain than a
standard, un-etched FBG, due to the unusual distribution of strain throughout the
structure.
6.2.2 Sensor Design and Spectral Characteristics
The first step to produce the sensor consisted of writing the FBG in a photosensitive
SMF, using a KrF excimer laser that operated at 248 nm and the phase-mask technique.
The fiber, commercialized by the FBGS Company, had a core diameter of 5 m, a
cladding diameter of 125 m and a numerical aperture of 0.26. The configuration for the
gratings inscription, described in Appendix III, was based on a Talbot interferometer.
Since the fiber was photosensitive, there was no need for prior hydrogenation. The
length of the FBG was of 3 mm. The second step consisted of cleaving the end section of
the sensor, guaranteeing that there were ~2 mm of SMF with no inscription between the
FBG and the fiber end. Since the core of the fiber was Ge-doped, the etching rate in this
region was higher than that of the cladding. Thus, it was important to ensure that the
acid did not reach the core area with the FBG. The following step was to submerge the
fiber tip in a 40%-hydrofluoric acid (HF) solution for around one hour, at room

FCUP
Fiber Sensing Based on New Structures and Post-Processing Enhancement
109
temperature, thus obtaining a very thin fiber tip, with a thickness lower than 10 m. The
chemical reactions involved in this step are [81]
2 2 2 6
2
2 3 6
6 2 ,
6 2 .
SiO HF H O H SiF
GeO HF H O GeF
(6.9)
The chemical etching in the liquid medium favored the formation of a linearly
tapered fiber tip, with a small diameter slope over the etched tip length. If the etching
were performed in gas medium, a sharp conic-shaped tip would be expected [226].
Figure 6.3 (a) shows the reduction of the cladding diameter as a function of time. From
the linear relationship between these two parameters, it is possible to estimate the
etching rate to be ~(115 ± 1) m/h. Fig. 6.3. (b)-(d) show microscope images of the fiber at
different etching times. On Fig. 6.3 (b), the fiber was submerged for ~30 min and the
cladding diameter was of (65 ± 2) m. Notice the conical shape of the inner region, that
corroborates the assumption that the etching will be faster in the core than in the
cladding. After ~55 min, the outer diameter was of (18.2 ± 2) m (Fig. 6.3 (c)). Finally,
after a time of ~61 min, the diameter was reduced to (8 ± 2) m.
0 10 20 30 40 50 60 700
20
40
60
80
100
120
140
Cla
dd
ing
Dia
met
er (
m)
Time (min)
a)
Figure 6.3 – (a) Cladding diameter variation with the chemical etching time. Also shown microscope images
of the fiber tip after etching times of (b) ~30 min, (c) ~55 min and (d) ~61 min.
Throughout this time, there was a reduction of the length of the fiber; however, it did
not reach the FBG inscription area, as evidenced by the reflection spectra, taken at
different time steps (0, 30, 55 and 61 min), shown in Fig. 6.4. The Bragg wavelength shifts
towards blue and, as the fiber diameter decreases below 10 m, this shift becomes more
b)
c)
d)

FCUP
Fiber Sensing Based on New Structures and Post-Processing Enhancement
110
pronounced. As the fiber becomes thinner, the evanescent field becomes more exposed
to the environment, decreasing the effective refractive index of the fundamental mode
[269]. Besides, the full-width at half-maximum (FWHM) also increases significantly at
this point. This chirp effect is due to the conic shape acquired by the fiber tip during the
etching, as discussed in Section 6.2.1. Several FBG etched tips were produced as
described and all presented identical properties.
1548.0 1548.5 1549.0 1549.5 1550.0 1550.5 1551.00.0
0.1
0.2
0.3
0.4
0.5
0.6
0.7
0.8
0.9
1.0
1.1
No
rmal
ized
Op
tica
l P
ow
er
Wavelength (nm)
t = 0 min
t = 30 min
t = 55 min
t = 61 min
Figure 6.4 – Reflection spectra of the FBG at different etching times.
6.2.3 Passive Configuration
One FBG etched tip sample was tested for the measurement of strain and
temperature, using the experimental setup shown in Fig. 6.5. The optical source had a
bandwidth of 100 nm, centered at 1570 nm. Regarding the optical spectrum analyzer
(OSA), the resolution used was 0.01 nm. An optical circulator connected these two
components and the etched tip, as depicted in the Figure.
Optical Source Optical Circulator
Etched FBG
OSA
Figure 6.5 – Scheme of the experimental setup.

FCUP
Fiber Sensing Based on New Structures and Post-Processing Enhancement
111
To perform strain measurements, the tip was placed in a translation stage with a
resolution of 0.01 mm. In Fig. 6.6, the spectra of the grating with no strain applied and
with a strain of 93 are shown. Two different effects arise when strain is applied: the
Bragg wavelength shifts and the spectrum broadens. This behavior is in agreement with
the theoretical considerations given in Section 6.2.1. Since the sensor has a conical shape,
the stress is not constant throughout its length. This translates in the elongation of the
FBG periods, with a consequent widening of the range of wavelengths filtered.
1545 1550 1555 1560 1565 1570 1575 1580 1585 1590-100
-95
-90
-85
-80
-75
-70
-65
-60
-55
P1
Op
tica
l P
ow
er (
dB
m)
Wavelength (nm)
0
93
P1
Figure 6.6 – Spectra of the etched FBG tip when no strain is applied (blue line) and with 93 (pink line).
The strain analysis can be done from different points of view, considering the
wavelength shift of the whole spectrum (measured at 3 dB), the changes in the FWHM of
the spectrum, or even by tracking one single peak. In the first case, a linear sensitivity of
(104.7 ± 1.1) pm/ was achieved, as presented in Fig. 6.7 (a). This indicates that it is
possible to improve ~100 times the sensitivity of a standard FBG with the proposed
configuration [267]. If one considers the variation of the FWHM, shown in Fig. 6.7 (b),
the experimental data are also well adjusted by a linear fitting. In this case, the sensitivity
obtained was (61.7 ± 1.7) pm/.
A different analysis was performed by considering the peak identified as P1 in Fig.
6.6. The response, also shown in Fig. 6.7 (a), was likewise linear and a sensitivity of
(127.3 ± 2.4) pm/ was determined through the linear fitting. The increase of sensitivity
in this case was mainly due to the fact that the wavelength of operation was longer than
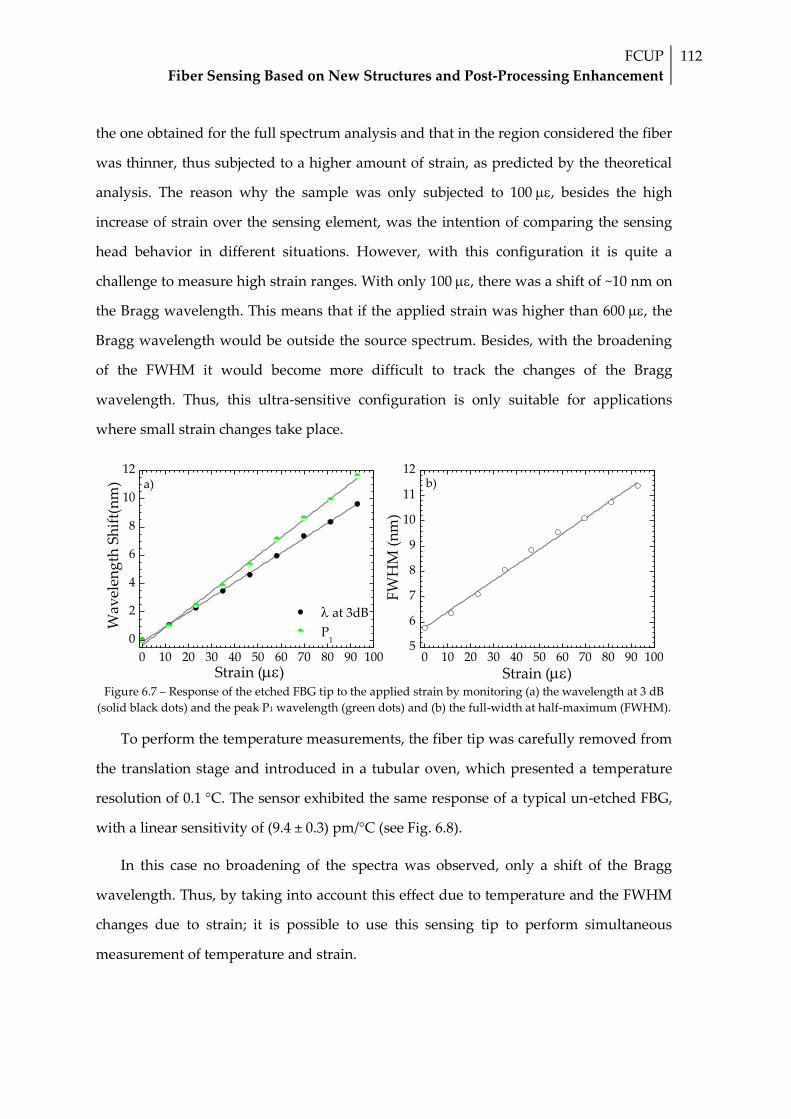
FCUP
Fiber Sensing Based on New Structures and Post-Processing Enhancement
112
the one obtained for the full spectrum analysis and that in the region considered the fiber
was thinner, thus subjected to a higher amount of strain, as predicted by the theoretical
analysis. The reason why the sample was only subjected to 100 , besides the high
increase of strain over the sensing element, was the intention of comparing the sensing
head behavior in different situations. However, with this configuration it is quite a
challenge to measure high strain ranges. With only 100 , there was a shift of ~10 nm on
the Bragg wavelength. This means that if the applied strain was higher than 600 , the
Bragg wavelength would be outside the source spectrum. Besides, with the broadening
of the FWHM it would become more difficult to track the changes of the Bragg
wavelength. Thus, this ultra-sensitive configuration is only suitable for applications
where small strain changes take place.
0 10 20 30 40 50 60 70 80 90 100
0
2
4
6
8
10
12b)
at 3dB
P1
Wav
elen
gth
Sh
ift(
nm
)
Strain ()
a)
0 10 20 30 40 50 60 70 80 90 1005
6
7
8
9
10
11
12
FW
HM
(n
m)
Strain () Figure 6.7 – Response of the etched FBG tip to the applied strain by monitoring (a) the wavelength at 3 dB
(solid black dots) and the peak P1 wavelength (green dots) and (b) the full-width at half-maximum (FWHM).
To perform the temperature measurements, the fiber tip was carefully removed from
the translation stage and introduced in a tubular oven, which presented a temperature
resolution of 0.1 °C. The sensor exhibited the same response of a typical un-etched FBG,
with a linear sensitivity of (9.4 ± 0.3) pm/°C (see Fig. 6.8).
In this case no broadening of the spectra was observed, only a shift of the Bragg
wavelength. Thus, by taking into account this effect due to temperature and the FWHM
changes due to strain; it is possible to use this sensing tip to perform simultaneous
measurement of temperature and strain.

FCUP
Fiber Sensing Based on New Structures and Post-Processing Enhancement
113
30 35 40 45 50 55 60 65 70 75 801550.4
1550.5
1550.6
1550.7
1550.8
1550.9
Wav
elen
gth
(n
m)
Temperature (C)
Figure 6.8 – Sensor response to temperature.
6.2.4 Active Configuration
The broadening of the FWHM can make the monitoring of the sensor response to
strain difficult. This limitation can be overcome by incorporating the sensing tip in a
fiber ring laser configuration, such as the one presented in Fig. 6.9. An erbium-doped
fiber amplifier (EDFA) was connected between an optical circulator and an 80/20 optical
coupler. To close the loop, a connection was made between the optical circulator and the
optical coupler. The 20% port of this device was connected to the data acquisition
system, whereas the 80% arm was connected to the input port of the EDFA. The fiber
with the etched FBG tip was connected to the optical circulator and the readings were
performed in reflection. Two different kinds of equipment were used to acquire the
signal, depending on the type of measurement. Thus, for reading optical power
variations, a powermeter was used (with a maximum resolution of 0.01 nW); and for
spectral monitoring, an OSA with a resolution of 0.01 nm was employed.
80/20 Coupler Etched FBG
EDFAAcquisition
system
Figure 6.9 – Scheme of the experimental setup. EDFA is the erbium doped fiber amplifier and FBG stands for
fiber Bragg grating.

FCUP
Fiber Sensing Based on New Structures and Post-Processing Enhancement
114
The fiber laser sensor output power dependence on the EDFA pump power is shown
in Fig. 6.10. The laser exhibited a threshold power of (5.48 ± 0.05) mW and a slope
efficiency of (6.8 ± 0.1)%. Besides, the signal-to-noise ratio (SNR) of this device was above
50 dB. The stability of the laser cavity was analyzed by measuring the output power over
60 minutes, under a constant input power of 50 mW. Throughout this time, a fluctuation
of only 0.11 mW was observed and the emission was quite stable, as can be seen by the
purple line in Fig. 6.10.
0 10 20 30 40 50 60 70 80 90 1000.0
0.5
1.0
1.5
2.0
2.5
3.0
3.5
4.0
4.5
5.0
5.5
6.0
Po
ut(m
W)
Pin
(mW)
0 5 10 15 20 25 30 35 40 45 50 55 60
Time (min)
Figure 6.10 – Laser output power as a function of the pump power. The laser stability for a constant pump
power of 50 mW, over 60 min is also shown (purple line).
Strain measurements were performed once again, using the same translation stage as
in the previous configuration. Fig. 6.11 presents the laser emission curves for different
strain values, the first peak (black line) corresponding to 0 . The laser was emitting at
1558.4 nm, which corresponds to the lower wavelength region of the chirped spectrum
(see Fig. 6.11). Since the chirp increases for longer wavelengths and the sensitivity of the
FBG also depends on this parameter, this active sensor is expected to be less sensitive
than the passive one, explored in the previous configuration. Nevertheless, with the
proper tuning of the lasing wavelength, higher sensitivities could be achievable. The
inset in Fig. 6.11 (a) shows the dependence of the integrated power, measured with the
powermeter, on the applied strain. There is a pronounced decrease in the optical power
with increased strain which is due to the decrease in the gain of the EDFA in this range.
In fact, this is one of the major limitations of this sensing head, since above 100 the

FCUP
Fiber Sensing Based on New Structures and Post-Processing Enhancement
115
filter was placed out of the EDFA gain range and there was no laser emission. However,
there was no apparent broadening of the laser peak, whose FWHM was limited by the
OSA resolution (0.01 nm).
The wavelength variation with the applied strain is represented in Fig. 6.11 (b), for
the case of the etched FBG tip (solid black lines) and for a non-etched FBG (purple
hollow circles). The non-etched FBG, with B = 1551.07 nm, was subjected to the same
experimental conditions as the etched one, for comparison purposes. As expected, the
non-etched FBG presented a linear sensitivity of (1.1 ± 0.1) pm/, whilst the etched FBG
tip exhibited a linear sensitivity of (74.4 ± 1.2) pm/. It should be highlighted that
throughout the experiments the laser did not suffer from mode hopping.
0 10 20 30 40 50 60 70 80 90 1000
1
2
3
4
5
6
7
8
Wav
elen
gth
Sh
ift
(nm
)
Strain ()
etched FBG
non-etched FBG
b)
1558 1559 1560 1561 1562 1563 1564 1565 15660
1
2
3
4
5
6
7
a)
Op
tica
l P
ow
er (
mW
)
Wavelength (nm)
Strain
0 20 40 60 80 1004.0
4.2
4.4
4.6
4.8
5.0
5.2
Inte
gra
ted
Po
wer
(m
W)
Strain ()
Figure 6.11 – Response of the laser to the applied strain, regarding (a) the spectral variation and (b) the
wavelength shift. The inset represents the integrated power as a function of the applied strain.
The strain resolution of this sensor was evaluated by monitoring the emission peak
wavelength over 30 seconds, for a constant strain value. Then, strain was increased by a
step of 11.61 and the measurement was repeated (see Fig. 6.12). Thus, the minimum
value of strain, that the sensor is able to discriminate is given by [270]:
2 ,
(6.10)
where is the maximum standard deviation of for both values of strain, and and
are the variation of strain and the mean wavelength shift between the two steps,
respectively. This parameter was determined to be ~0.83 nm, and the maximum standard

FCUP
Fiber Sensing Based on New Structures and Post-Processing Enhancement
116
deviation was of 0.01 nm. Thus, by applying Eq. 6.10, one gets a resolution of 280 n.
This value was mainly limited by the signal acquisition system resolution.
0 5 10 15 20 25 301560.0
1560.3
1560.6
1560.9
1561.2
1561.5W
avel
eng
th (
nm
)
Time (arb. units)
11.61
Figure 6.12 – Step technique to estimate the resolution of the fiber laser strain sensor.
6.3 Torsion Sensor based on Figure-of-Eight Fiber Laser
In this work, a figure-of-eight fiber laser is explored for torsion measurements. A
section of polarization maintaining photonic crystal fiber acts both as interferometric
filter and sensing element.
6.3.1 Working Principle
The figure-of-eight fiber laser sensor developed in this work was obtained according
to the scheme depicted in Fig. 6.13. One of the loops was constituted by a pump laser
diode emitting at 980 nm, a 980/1550 nm wavelength division multiplexer (WDM), an
optical isolator, a 90:10 optical coupler and an optical spectrum analyzer (OSA), with a
resolution of 0.01 nm, to perform the readings. In between the WDM and the optical
isolator, a section of Er3+-doped fiber (about 800 mm long) was inserted to provide the
gain.
The concentrations of erbium and aluminum ions in the active fiber were of
1000 ppm and 10000 ppm, respectively. The numerical aperture of this fiber was 0.27, its
core had a diameter of ~5 m, and it presented a step index profile. The other fiber loop

FCUP
Fiber Sensing Based on New Structures and Post-Processing Enhancement
117
included a polarization controller (PC) and the interferometric filter described in the
following Section.
Er3+-doped Fiber
Optical Isolator
Sensing Head
(PM PCF)
WDM
50:50 Coupler
PC
Pump Laser
90:10 CouplerOSA
Figure 6.13 – Scheme of the figure-of-eight fiber laser. WDM stands for wavelength division multiplexer, PC
is the polarization controller and OSA corresponds to the optical spectrum analyzer.
Using the appropriate pump power, the gain medium emits in the 1525-1560 nm
region, according to the erbium spontaneous emission curve [271]. Light from the
amplifier section will enter the loop on the right via the 50:50 coupler. The optical
isolator is placed between the Er3+-doped fiber and the optical coupler to prevent the
return of light through this arm. The coupler splits the incoming light into two guided
waves propagating in opposite directions: one wave will travel in the clockwise
direction, with a certain velocity and polarization state; the other wave will propagate in
the counter-clockwise direction, with a different velocity and polarization state. When
they reach the coupler, the two beams interfere and a periodic spectrum is obtained. The
sensing element, a polarization maintaining photonic crystal fiber (PM PCF), acts as an
interferometric filter, selecting the wavelength at which laser emission will occur. Such
selection results from the combination of two different aspects: the maximum
transmission power of the filter and the region where the spontaneous emission gain is
higher. Thus, the laser is expected to emit around 1530 nm. Depending on the
polarization of lights travelling inside this loop, one or more lasing peaks were observed.
However, all measurements were carried out with the emission of a single laser peak.
The light that is recoupled at the 50:50 coupler is then redirected to the amplification
loop, where a 90:10 coupler is introduced, to obtain the readings from the OSA.

FCUP
Fiber Sensing Based on New Structures and Post-Processing Enhancement
118
6.3.2 Sensor Design and Spectral Characteristics
The sensing element used to perform the torsion measurements was an
interferometric filter based on a PM PCF whose cross-section is shown in Fig. 6.14 (a).
The fiber used is commercially available (PM-1550-01 from Thorlabs, Inc.) and presents a
pure silica core and cladding. The fiber contains two large holes, with a diameter of
4.5 m, and 82 smaller holes, with a diameter of 2.2 m. The core, placed between the
two larger holes, presents dimensions of 6.6/4.3 m and the outer cladding has a
diameter of 125 m [272]. The characteristics of this fiber ensure a high birefringence,
that beat length is lower than 4 mm and an attenuation < 2dB/km.
1520 1530 1540 1550 1560 1570 1580-40
-35
-30
-25
-20
-15
-10
-5
Op
tica
l P
ow
er (
dB
)
Wavelength (nm)
b)
Figure 6.14 – (a) Microscopic photograph of the polarization-maintaining photonic crystal fiber used as
sensing element. (b) Transmission spectrum of the sensor.
The channeled spectrum shown in Fig. 6.14 (b) was obtained by removing the
amplification loop (the loop on the left on Fig. 6.13) and connecting one of the 50:50
coupler arms to the broadband optical source (bandwidth of 100 nm, centered at
1570 nm) and the other arm to the OSA, in a Sagnac configuration. The properties of the
interferometric filter are gathered in Table 6.1. The channel spacing was determined by
calculating the distance between two maxima, in the frequency domain. Regarding the
channel passband and the full-width at half-maximum (FWHM), the two parameters are
relative to the same concept, i.e., the peak full width at half the maximum optical power.
The former is in the frequency domain, whereas the last is in the wavelength domain.
a)

FCUP
Fiber Sensing Based on New Structures and Post-Processing Enhancement
119
Table 6.1 – Properties of the interferometric filter.
Average Value
FWHM (nm) 1.72
Channel Spacing (THz) 0.43
Channel Passband (THz) 0.17
6.3.3 Experimental Results
The response of the laser optical power to the pump diode drive-in current is shown
in Fig. 6.15. The current threshold was estimated to be (145.7 ± 5.2) mA and a maximum
output power of (7.9 ± 0.1) W was achieved for a drive-in current of (229.7 ± 0.1) mA.
Figure 6.15 – Optical power variations with the drive-in current.
In order to perform torsion measurements, one side of the sensor was introduced in
a torsion stage, which had a resolution of 0.5°, while the other side was kept fixed. It was
found that both the amplitude and the central wavelength of the laser peak shifted as
torsion was applied, for both negative and positive angles. This behavior, illustrated in
Fig. 6.16 (a), was due to the rotation of the PM PCF cores.
Starting from 0°, the peak shifted towards longer wavelengths as the torsion angles
increased (red shift). Accordingly, by decreasing the angles from 0° to -90°, the laser
peak shifted towards shorter wavelengths (blue shift). The laser will emit in a
wavelength that corresponds to the maximum response from the combination of the
erbium fiber gain curve and of the interferometric filter function, as shown in
Fig. 6.16 (b).
100 120 140 160 180 200 220 240
0
1
2
3
4
5
6
7
8
9
P (
W)
I (mA)

FCUP
Fiber Sensing Based on New Structures and Post-Processing Enhancement
120
1535.0 1535.7 1536.4 1537.1 1537.8 1538.5
-70
-60
-50
-40
-30
-20
b)
Op
tica
l P
ow
er (
dB
m)
Wavelength (nm)
-0
+a)
1534 1535 1536 1537 1538 1539 1540-40
-35
-30
-25
-20
-15
-10
-5
Op
tica
l P
ow
er (
dB
)
Wavelength (nm)
0.0
0.4
0.8
1.2
1.6
2.0
2.4
Op
tica
l P
ow
er (
W)
Figure 6.16 – (a) Variation of the laser emission with the applied torsion and (b) interferometric filter
spectrum (blue line) and laser spectrum (pink line).
The response of the laser peak wavelength to the applied torsion angle is shown in
Fig. 6.17 (a). The experimental data presented a linear behavior in this range, which led
to a sensitivity of –(7.13 ± 0.05) pm/degree. The analysis could also have been done
considering the variations of optical power, since the laser emission power varies
depending on its wavelength vs. the interferometric filter response. Thus, when the
wavelength corresponds to a maximum of the interferometric filter spectrum, a
maximum also occurs in the laser peak emission, following the same trend as the filter
itself. As the torsion is applied, besides the wavelength shift of the interferometric filter
pattern, there is an increase on the filter transmission losses, which is responsible for the
decrease in the laser peak power. Eventually, the losses become higher than the gain and
the laser ceases to emit (black, blue and green curves in Fig. 6.16. (a)).
-90 -60 -30 0 30 60 901536.0
1536.2
1536.4
1536.6
1536.8
1537.0
1537.2
1537.4
1537.6
Wav
elen
gth
(n
m)
Torsion Angle ()
a)
0 100 200 300 400 500 600 700 800 900 1000
0.00
0.05
0.10
0.15
0.20
0.25
0.30
Wav
elen
gth
Sh
ift
(nm
)
Strain ()
b)
Figure 6.17 – Laser peak wavelength dependence on the applied (a) torsion angle and (b) strain.
Using the same active configuration, the interferometric filter was attached to a
translation stage, with a resolution of 0.01 mm, and strain measurements were carried

FCUP
Fiber Sensing Based on New Structures and Post-Processing Enhancement
121
out over a range of 1000 . The results, depicted in Fig. 6.17 (b), follow a linear trend.
From the fitting, a sensitivity of only (0.30 ± 0.06) pm/ was obtained. Besides, it has
been reported in the literature that this fiber has a very low sensitivity to temperature
(~0.3 pm/°C) [272], meaning that with this configuration it is possible to perform strain
and temperature independent torsion measurements.
6.3.4 Final Remarks
In this Chapter two different fiber lasers were proposed to be applied as sensors. The
first configuration was based on a post-processed fiber Bragg grating tip. The sensor was
firstly characterized as a passive element, where ultra-high strain sensitivity was
obtained. Three different approaches were considered for signal processing: one
regarding the full-width at half maximum variation with the applied strain; the other
regarding the wavelength variation of the whole spectrum, measured at 3 dB; and the
third one consisted of tracking one single peak, where an outstanding sensitivity of
(127.3 ± 2.4) pm/ was achieved. The sensor was also tested in temperature, where it
exhibited a sensitivity similar to the one of a non-etched fiber Bragg grating. However,
the signal processing of this passive sensor is more complex if a commercial
interrogation system is used. When incorporated in a fiber laser, the laser peak varied
not only in wavelength, but also in integrated power, following the EDFA gain curve. In
fact, this was one of the major drawbacks of this configuration, as it is only suitable to be
used in small strain ranges. However, the peak did not broaden with strain and the laser
did not suffer from mode hopping. Nevertheless, this sensor presents a very high signal-
to-noise ratio, being very suitable for applications in remote sensing, and it can also be
useful as vibration sensor. It is also possible to use the laser strain sensor with
temperature independence, if the optical power variations are considered instead of
wavelength variations.
The second configuration consisted of a figure-of-eight fiber laser and had a section of
polarization maintaining photonic crystal fiber which acted simultaneously as an
interferometric filter and the sensing element. The active sensor was subjected to torsion
measurements, and both the peak laser wavelength and the optical power changed over

FCUP
Fiber Sensing Based on New Structures and Post-Processing Enhancement
122
a range of 180°. Since the filter presents low sensitivity to strain and temperature, in
addition to its low cost, ease of fabrication and reliable results, it proves to be a good
choice for performing torsion measurements.

CHAPTER SEVEN
7 Sensors Based on Microspheres


FCUP
Fiber Sensing Based on New Structures and Post-Processing Enhancement
125
7.1 Introduction
The incorporation of microspheres in optical fiber-based configurations has attracted
great attention over the last two decades. The microspheres, due to their physical
characteristics and when successfully excited, can be used in a wide variety of practical
applications, from sensing to lasing or even tight focusing of light, as it shall be seen
next.
Two different mechanisms have been established to explain the propagation of light
in microspheres. Under appropriate excitation conditions, they can provide periodical
resonances in the transmission spectrum with very high Q-factors3 and low transmission
losses [273]. In this mechanism, based on the whispering gallery modes (WGMs), the
light coupled to the microsphere is trapped and propagates in circular orbits close to the
surface [274]. To produce the WGMs, it is necessary to couple the evanescent field
adequately to and from the microsphere. When several microspheres form a linear chain,
besides the tight binding of the WGMs, focusing of light is produced by each
microsphere. The focused spot is designated by photonic nanojet and has an elongated
shape and sub-wavelength lateral size. The nanojets present in a chain of microspheres
produce periodic modes, called nanojet induced modes (NIMs) [275]. In long chains of
microspheres (>10), the NIMs are the dominant effect [276]. However, the microspheres
must display diameters and refractive indices that enable focusing of light at the shadow
surface of the spheres, to ensure the presence of such NIMs.
There are currently several techniques to produce microspheres. The first
microspheres produced on a fiber tip were reported in 1973 by Kato and co-workers
[277]. A hydrogen-oxygen microtorch was used and microspheres with a maximum
diameter of 250 m were proposed to couple light from a laser into the fiber. A couple of
years later, Paek et al. suggested the use of a CO2 laser to produce the hemispherical lens
3 The quality-factor, or Q-factor, is given by Q , where is the wavelength at which the
resonance occurs and corresponds to the linewidth of the resonant wavelength. The microsphere-based
resonators can present Q-factors up to 1011 [273].

FCUP
Fiber Sensing Based on New Structures and Post-Processing Enhancement
126
at the fiber tip [278]. Since then, and besides the CO2 laser technique [279, 280], different
methods have been reported, like flame fusing [274, 281], chemical etching prior to the
CO2 laser [282, 283], or by using a fusion splicer [284-286]. When the microspheres are
intended to be used as laser cavities, the deposition of the active medium, by sol-gel or
dip-coating techniques, is also employed. The deposition of a polymer at the tapered
fiber tip also formed a spherical cavity, used for thermal sensing [287]. The simultaneous
production of several Er3+-doped microspheres was reported by Klitzing et al., by using a
microwave plasma torch [288]. A similar result can be obtained by using an electric
vertical furnace [289-291]. More recently, the microspheres described in the literature
became commercially available. These structures present extremely reduced dimensions
(can be smaller than 10 m) and are made of a wide variety of materials [275, 292, 293].
In systems with one microsphere, effective coupling of light to the micro-resonator is
very important to ensure the desired high-Q WGMs. The first works reported the use of
a prism to launch light onto the microsphere and to collect it to an interrogation system
[294-296]. Successful coupling between a side-polished optical fiber and a microsphere
was reported in 1995 [297, 298]. A couple of years later, Knight et al. used a fiber taper to
excite the WGMs [274]. In a different approach, Ilchenko et al. placed a microsphere on
top of an angle polished fiber tip [299]. Among these designs, the most popular and still
currently used one is the fiber taper-based configuration. It is easy to manufacture, to
handle and can provide very good conditions to study different types of interactions
from single-atom detection [300] to optomechanics [301, 302]. More recently, a new
scheme to excite WGMs has been proposed with the microspheres incorporated inside a
microstructured optical fiber [293], and inside a microtube [303]. In both configurations,
the input and/or the output sub-systems were located outside the fiber, requiring bulk
optics to perform the measurements. In a different perspective, Wang et al. proposed the
use of a thin wall capillary coupler to excite and interrogate the WGMs [304].
The configurations based on WGMs have been used as optical fiber sensors with
applications in biosensing [305], temperature sensing [306] and radiation pressure [307],
among others. Additionally, when doped with lanthanide elements, the microspheres

FCUP
Fiber Sensing Based on New Structures and Post-Processing Enhancement
127
can be used as micro-lasers, where large free-spectral range and single mode operation
are easily achievable [302].
Regarding the propagation of photonic nanojet induced modes, it has been
theoretically and experimentally demonstrated using polystyrene [275, 276, 308] and
sapphire [309] microspheres. Both materials present high refractive index, which when
combined with appropriate dimensions and an optical source in the UV-VIS region
allowed the transmission of light along chains of microspheres (more than 80
microspheres) [276]. These chains display very low propagation losses and the focusing
properties show great potential for different applications, such as microprobes for
biomedical optical spectroscopy [276], ophthalmic laser surgery [292], or enhancement of
Raman scattering [310]. When the transmission spectrum is acquired, Fabry-Perot-like
fringes are observed, even in the case of a high number of microspheres [276].
In this Chapter, two different approaches are presented for optical fiber sensing. The
first one is a Mach-Zehnder type interferometer constituted by an array of microspheres
produced in standard single mode fiber. Several samples are fabricated by splicing
microspheres in series and producing an array. In this case, the light propagation occurs
inside the whole structure. The second approach consists of a Fabry-Perot interferometer
obtained by introducing microspheres inside a hollow-core silica tube. The sensing head
is tested in temperature after inserting each microsphere.
7.2 Silica Microspheres Array Sensor
The sensing structure explored in this Section is based on an array of microspheres
manufactured using a commercial splicing machine and incorporated in a standard
single mode fiber (SMF). The sensors were tested in strain and temperature.
7.2.1 Theoretical Considerations
The dimensions of the microspheres here considered are much larger than the
wavelength of the optical source, thus, geometrical optics can be used to explain the
structure behavior, in a first approximation [209]. The optical path difference of light

FCUP
Fiber Sensing Based on New Structures and Post-Processing Enhancement
128
travelling in the microspheres gives rise to an interferometric behavior, and to
understand its basic characteristics a ray-tracing analysis was employed using the
ZEMAX SE optical design software. The microspheres were simulated as ball lenses of
fused silica, with refractive index 1.44402 at 1550 nm. It was also considered that the
object numerical aperture was the same as in the SMF, translating in the divergence of
the beam observed in Fig. 7.1. The simulations were performed as a first approach and
did not take the polarization of light into account. Due to the broadening of the fiber in
the region close to the first microsphere, the light seems to exit a point-like source (core
of the SMF fiber) located before the microsphere (point f1 in Fig. 7.1). As light passes
through the first microsphere, the beam will diverge, whereas in the second
microsphere, there will be a convergence of the beam. For the case of the 2-microspheres
sensor, light will be recoupled in the SMF core region. Thus, an interference pattern
obtained in transmission (discussed in Section 7.3.2) will be due to the optical path
difference of light that travels from point f1, associated with the first microsphere, to the
exit fiber core connected to the second microsphere. Therefore, as illustrated in
Fig. 7.1 (a), a Mach-Zehnder type interferometric pattern is to be expected.
Figure 7.1 – Microspheres array sensors modeling using ZEMAX SE, considering (a) 2 microspheres, (b) 3
microspheres, (c) 4 microspheres and (d) 5 microspheres. The focal points f1, f2 and f3 for each configuration
are also shown (when applicable).
With the addition of a third microsphere the light will converge on its inside, at a
point indicated by f2 in Fig. 7.1 (b - d). Notice, in Fig. 7.1 (b), that there is further
divergence of the beam after f2. Nevertheless, it will not have much influence on the
power coupling to the output SMF since it is very close to the edge of the microsphere.

FCUP
Fiber Sensing Based on New Structures and Post-Processing Enhancement
129
However, when a fourth microsphere is introduced, the beam will broaden once more,
originating some change on the amount of optical power that propagates down the exit
fiber. The inclusion of a fifth microsphere translates into a convergence of the beam
inside the third microsphere (f2), and divergence once again between the third and fourth
microspheres. Close to the edge of the fifth microsphere, convergence will occur once
again, at the point indicated by f3. The three points, f1, f2 and f3, are associated with light
focusing, therefore can be identified as focal points.
7.2.2 Sensor Design and Spectral Characteristics
The first step to make the proposed sensor consisted of the fabrication of the
microspheres at the tip of a SMF, using a splicing machine (FITEL S182PM) in the
manual program. The arc power was 110 arb. units (pre-defined by the manufacturer),
the pre-fuse time was 240 ms and the arc duration was of 2000 ms. The high power of the
electric arc discharge was transferred to the fiber tip, which partially melted. The fiber
acquired a spherical shape due to surface tension.
The fiber was firstly cleaved and inserted in the splice machine. It was then moved
forward ~125 m, ensuring that the arc discharge occurred in the SMF region. The
arrows represented in the first photograph of Fig. 7.2 illustrate the position of the
electrodes relative to the fiber. After each arc discharge a photograph was taken for
posterior analysis. The first eleven results are shown in Fig. 7.2.
Figure 7.2 – Microphotographs of the microspheres manufactured using the splicing machine. Each photo
was taken after one electric arc discharge.
The microsphere diameter was estimated from the microscope images, with a
measurement uncertainty of ± 3 m, and its evolution is depicted in Fig. 7.3. The

FCUP
Fiber Sensing Based on New Structures and Post-Processing Enhancement
130
measurement was carried out perpendicularly to the SMF length. The growth is stronger
at the beginning of the fabrication (first seven arc discharges). From that point on, the
diameter increase becomes less pronounced, as can be verified in Figure. With this
fabrication method, after a certain amount of electric discharges, the microsphere growth
tends to stabilize. A final diameter of ~240 m was attained, after 18 electric discharges.
The sensing structures developed present a mean diameter of ~230 m.
0 2 4 6 8 10 12 14 16 18 20120
140
160
180
200
220
240
260
Sp
her
e D
iam
eter
(
m)
# Electrical Arcs
Figure 7.3 – Dependence of the sphere diameter on the number of electric arc discharges.
Four different structures were produced by connecting from 2 up to 5 microspheres
in series. The microscope images of each sensor are shown in the insets of Fig. 7.4. The 2-
microspheres sensor, shown in the inset of Fig. 7.4 (a), was fabricated by fusion splicing
two microspheres that were produced separately. This fusion was done using the same
program of the splicing machine, with the two microspheres aligned, and a total of 5
electric arc discharges were applied to ensure the mechanical stability of the sensor
without collapsing the two microspheres. The procedure to fabricate the other sensors
was similar. First, the microspheres were produced separately. Afterwards, two
microspheres were fusion spliced as previously described. A cleave was then made after
the second microsphere. This intermediate structure was placed once again in the
splicing machine and a few electric arc discharges were applied to re-shape it into the
two spherical shapes required. This structure was then spliced to a third microsphere
fiber tip, completing the 3-microspheres sensor. The previous steps were repeated to
produce the 4- and 5-microspheres samples.

FCUP
Fiber Sensing Based on New Structures and Post-Processing Enhancement
131
The sensors spectral response was obtained by connecting the sample between a
broadband optical source and an optical spectrum analyzer (OSA), in a typical
transmission setup. The optical source had a bandwidth of 50 nm and it was centered at
1550 nm. The transmission readings were done with a resolution of 0.2 nm. The
spectrum of each sensor is shown in Fig. 7.4. The interferometric behavior obtained was
due to the optical-path difference of light travelling inside the microspheres, as
considered in Section 7.2.1. The channeled spectrum behavior obtained for the 2-
microspheres sensor resulted from a Mach-Zehnder type interferometer, consistent with
the analysis previously described. When further microspheres are integrated into the
chain, there are more possibilities for different propagation lengths from the input SMF
to the output one. Therefore, additional waves are generated, with non-negligible
amplitude, that add together with the two main waves, originating an interference
pattern with an envelope modulation. This effect becomes more pronounced when the
number of these additional waves increases as a consequence of cascading an increasing
number of microspheres, resulting in a multi-wave interferometric behavior.
1550 1552 1554 1556 1558 1560-21.5
-21.3
-21.1
-20.9
-20.7
d)c)
b)
Op
tica
l P
ow
er (
dB
)
Wavelength (nm)
2 spheres
a)
1550 1552 1554 1556 1558 1560-24.9
-24.8
-24.7
-24.6
-24.5
Op
tica
l P
ow
er (
dB
)
Wavelength (nm)
3 spheres
1550 1552 1554 1556 1558 1560-20.3
-20.2
-20.1
-20.0
Op
tica
l P
ow
er (
dB
)
Wavelength (nm)
4 spheres
1550 1552 1554 1556 1558 1560-24.8
-24.4
-24.0
-23.6
-23.2
Op
tica
l P
ow
er (
dB
)
Wavelength (nm)
5 spheres
Figure 7.4 – Channeled spectra of light that exits the sensing heads with (a) 2 microspheres, (b) 3
microspheres, (c) 4 microspheres and (d) 5 microspheres.

FCUP
Fiber Sensing Based on New Structures and Post-Processing Enhancement
132
7.2.3 Experimental Results
The sensors were held out in a support structure on one end and attached to a
translation stage, with a resolution of 0.01 mm, on the other. Strain measurements were
carried out over a range of 750 by tracking one of the peaks of the channeled
spectrum. The response, shown in Fig. 7.5, was linear in all cases and the sensitivities
obtained through the fitting curves are gathered in Table 7.1.
0 100 200 300 400 500 600 700 800-1.4
-1.2
-1.0
-0.8
-0.6
-0.4
-0.2
0.0
2 spheres
3 spheres
4 spheres
5 spheres
Wav
elen
gth
Sh
ift
(nm
)
Strain ()
Figure 7.5 – Sensors response to applied strain.
Table 7.1 – Strain sensitivity obtained for
each sensor.
No. of
Microspheres
Sensitivity
(pm/)
2 -0.87 ± 0.01
3 -1.83 ± 0.05
4 -0.44 ± 0.01
5 -1.31 ± 0.04
These results seem to indicate that the sensitivity is a function dependent on the
number of microspheres being even or odd. However, in all cases, as strain was
increased, a shift towards shorter wavelengths (blue shift) was noticed. This was a
surprising result, considering that the normal tendency is to observe a red shift, since the
interferometric path imbalance increases as the deformation gets larger. A preliminary
explanation was oriented to admit the dominance of the elastooptic effect relatively to
the change in the optical path (expansion effect [185]). However, the contact area
between the microspheres is small, which means that the deformation in those regions
may be substantial. Thus, the dominance of the elastooptic effect over the expansion
component is unlikely to occur. Other mechanisms must be taken into account to explain
the behavior observed, and so far there is no definite explanation.
The sample with 3-microspheres was also tested against temperature variations. It
was placed inside a tubular oven, in a centered position, and it was kept straight.
Temperature measurements were carried out in a range of 200 °C, with a resolution of

FCUP
Fiber Sensing Based on New Structures and Post-Processing Enhancement
133
0.1 °C. A linear behavior was observed, as depicted in Fig. 7.6, and a sensitivity of
(18.4 ± 0.6) pm/°C was attained. The wavelength shift towards longer wavelengths
indicates that the thermal expansion of the silica microspheres is the dominant effect.
20 40 60 80 100 120 140 160 180 2000.0
0.5
1.0
1.5
2.0
2.5
3.0
3.5
Wav
elen
gth
Sh
ift
(nm
)
Temperature (C) Figure 7.6 – Response of the 3-microspheres sample to temperature variation.
7.3 Fabry-Perot based on Array of Soda-Lime Glass Microspheres
The configuration discussed in this Section is based on an array of soda-lime glass
microspheres incorporated inside a hollow core silica tube. The sensors are tested for
temperature changes.
7.3.1 Theoretical Considerations
The microsphere dimensions are smaller than the ones presented in the previous
configuration, however still large enough for the analysis to be within the limits of
validity of geometrical optics. Considering the scheme presented in Fig. 7.7, the focal
length, f, is measured from the center of the sphere, where the extensions of the entering
and exiting ray meet [311]. This parameter is related to the refractive index of the sphere,
n, and its radius, r, by Eq. 7.1:
.2( 1)
rnf
n
(7.1)
Considering the microsphere parameters given by the manufacturer, r = 26.34 m
and n = 1.52, the focal length for the microspheres used in this work is 38.5 m. The back

FCUP
Fiber Sensing Based on New Structures and Post-Processing Enhancement
134
focal length, bfl, is determined by the difference between the sphere radius and the focal
length.
(2 )
.2( 1)
r nbfl f r
n
(7.2)
In this case, bfl = 12.2 m. In order to have nanojet induced modes (NIMs), the bfl should
be close to zero. This only happens when n = 2.
n
y
r
f
bfl
Figure 7.7 – Scheme of the ray tracing through a ball lens. Adapted from [311].
Under certain conditions, it is possible to obtain NIMs for microspheres with low
refractive index [312, 313]. However, the lowest value reported was 1.68 RIU, which is
still much higher than the refractive index of silica.
7.3.2 Sensor Design and Spectral Characteristics
The hollow core structure used to support the soda-lime glass microspheres was the
same as in Section 5.3. The presence of the four rods increased slightly the electrostatic
forces between the microspheres and the support structure, enabling a higher stability of
the sensor.
The sensing structure was fabricated by fusion splicing a section of hollow core silica
tube with four rods to a SMF, using the manual program of the splicing machine. The
fibers were positioned with a lateral offset relative to the electrodes to prevent the
collapse of the hollow structure, following the same procedures as described in Section
3.3.1. The support structure was cleaved to the desired length, of the order of several
hundred micrometers, and it was attached to a vertical platform that was placed under a

FCUP
Fiber Sensing Based on New Structures and Post-Processing Enhancement
135
5× magnifying lens. The microspheres were inserted, one by one, with the aid of a built
on purpose fiber taper and a short section of a 30 m thick platinum wire. The
microspheres used in the experiment were made of soda-lime glass, with an average
diameter of (52.68 ± 0.90) m and a refractive index of 1.51-1.52 RIU. These parameters
were supplied by the manufacturer, Whitehouse Scientific.
The sensing structure was interrogated in a reflection setup constituted by a
broadband optical source (bandwidth 100 nm, centered at 1570 nm), an OSA with a
resolution of 0.1 nm, and an optical circulator, according to the scheme in Fig. 7.8.
Optical Source Optical Circulator
FP cavity
Splice
OSA
Figure 7.8 – Scheme of the experimental setup.
The reflection spectrum obtained from the support structure, without microspheres,
is shown in Fig. 7.9 (a). There is an interferometric behavior with very low visibility,
~1%. The interference has the same origin as in other similar configurations previously
studied (see Chapter 3). The first reflection occurs at the SMF/silica tube interface. Some
of the light is transferred to the silica tube and a second reflection occurs at its end face.
This light is recoupled once again at the SMF. When a first microsphere is placed inside
the silica tube the visibility increases to 62.3 % (see Fig. 7.9 (b)). A two-wave
interferometric behavior is spectrally observed. In this case, light exiting the SMF will
interact with the microsphere and the reflections occurring at the SMF/microsphere and
microsphere/air interfaces constitute the two FP cavity mirrors. From the spectrum it is
possible to confirm this statement, as for an effective refractive index of 1.51 RIU and
considering the wavelength of two adjacent peaks (e.g. 1546.9 nm and 1561.9 nm), the

FCUP
Fiber Sensing Based on New Structures and Post-Processing Enhancement
136
cavity length is LFP = 53.4 m, which is in good agreement with the microspheres
diameter value supplied by the manufacturer.
-25
-23
-21
-19
b)
Silica Tubea)
-30
-25
-20
-15
e)
d)
c)
1 sphere
-30
-25
-20
-15
Op
tica
l P
ow
er (
dB
)
2 spheres
-30
-25
-20
-15
3 spheres
1520 1530 1540 1550 1560 1570 1580 1590-40
-30
-20
-10
Wavelength (nm)
4 spheres
Figure 7.9 – (left) Spectra of the sensing heads tested. (right) Microphotographs of the characterized sensors.
The alignment of the microspheres relative to the core of the SMF and relative to
each other is of utmost importance to obtain a spectrum with high visibility. In the case
of the two microspheres sample it is not possible to distinguish the interference arising
from each microsphere (see Fig. 7.9. (c)). However, the 3-microspheres sensing head
spectrum, presented in Fig. 7.9 (d), shows the presence of a periodic pattern with three
distinct peaks, corresponding to the three microspheres. The inclusion of a fourth
microsphere increased the number of peaks observed in the periodic pattern (Fig.
7.9 (e)). The microscope images of each sensor are also presented in Fig. 7.9, on the right
side. The overall visibility increased with the number of microspheres, as can be seen in
Fig. 7.10. The 4-microspheres sample was illuminated with a He-Ne laser and a
microphotograph, shown in the inset in Fig. 7.10, was taken where the FP cavity mirrors
at each interface can be well identified.

FCUP
Fiber Sensing Based on New Structures and Post-Processing Enhancement
137
0 1 2 3 4 5
0
20
40
60
80
100
120
Vis
ibil
ity
(%
)
Number of Microspheres
Figure 7.10 – Dependence of the spectral visibility on the number of microspheres. Inset: Microphotograph
of the 4-microspheres sample when illuminated with a He-Ne laser.
7.3.3 Experimental Results
The sensing structure was subjected to temperature variations over a range of
~100 °C. The experiment was repeated each time one additional microsphere was
inserted in the silica tube. The sensing head was placed inside a tubular oven, in a
centered position. The temperature readings had a resolution of 1 °C. The sensors
responses are shown in Fig. 7.11. In all cases, the behavior was non-linear and the
experimental data were adjusted by second order polynomials. The results are gathered
in Table 7.2.
0 10 20 30 40 50 60 70 80 90 1000.0
0.1
0.2
0.3
0.4
0.5
0.6
0.7
0.8
0.9
1.0
1.1 1 sphere
2 spheres
3 spheres
4 spheres
Wav
elen
gth
Sh
ift
(nm
)
Temperature Shift (C)
Figure 7.11 – Wavelength variation with temperature.

FCUP
Fiber Sensing Based on New Structures and Post-Processing Enhancement
138
Table 7.2 – Temperature sensitivity obtained for each sensor. corresponds to the wavelength, in nm, and T
to the temperature, in °C. The correlation coefficient, r2 is also shown.
No. of
Microspheres Polynomial Fitting r2
1 = (0.03 ± 0.01)×10-5 T2 + (8.28 ± 0.32) ×10-3 T + (10.92 ± 6.13) ×10-3 0.99902
2 = (1.24 ± 0.17)×10-5 T2 + (8.61 ± 0.16) ×10-3 T - (2.77 ± 2.98) ×10-3 0.99971
3 = (1.90 ± 0.24)×10-5 T2 + (8.27 ± 0.22) ×10-3 T - (0.83 ± 4.31) ×10-3 0.99938
4 = (1.47 ± 0.12)×10-5 T2 + (7.47 ± 0.12) ×10-3 T - (4.44 ± 2.24) ×10-3 0.99979
Although the second order polynomial is the curve that best represents the behavior
of this sensing structure, a linear fit was also applied to the experimental results. The
coefficient of determination, r2, decreased from a mean value of 0.9995 to 0.9970, which is
still very close to the unity. The samples with 1 and 3 microspheres presented a linear
sensitivity of (11.13 ± 0.20) pm/°C and (9.95 ± 0.12) pm/°C, respectively. In turn, the
devices with 2 and 4 microspheres exhibited a linear sensitivity of (9.74 ± 0.08) pm/°C
and (8.79 ± 0.09) pm/°C, respectively. An interpretation can be developed by recalling Eq.
3.17,
1 1 1
,eff FP
eff FP
n L
T n T L T
(7.3)
where eff
n T and FPL T are the thermo-optic coefficient and the thermal expansion
coefficient of the microspheres, respectively. Since the microspheres are constituted of
soda-lime glass, these parameters are 2.06 × 10⁻⁶ /°C and 7.75 × 10⁻⁶ /°C, respectively [314].
For the case of a single microsphere sensor, dividing its linear sensitivity by the
operation wavelength (1540.55 nm) gives 7.22 × 10⁻⁶ /°C which is in very good agreement
with the microspheres thermal expansion coefficient. Thus, in this case the thermal
expansion is the dominant effect when the sensor is subjected to temperature variations.
However, for the other sensors, when the sensitivity is divided by the operation
wavelength, the values obtained are lower (6.29 × 10⁻⁶ /°C, 6.41 × 10⁻⁶ /°C and
5.66 × 10⁻⁶ /°C for the 2-, 3- and 4-microspheres sensor, respectively), indicating that other
effects arise when there is an increase of the structure complexity. By increasing the
number of microspheres, the number of fringes increases, as a consequence of the cavity
length increase. Thus, according to Eq. 7.3, the contribution of the thermal expansion
coefficient will be smaller, which is in agreement with the values obtained. The response
FCUP
Fiber Sensing Based on New Structures and Post-Processing Enhancement
139
of the sensor clearly depends on the number of microspheres and the results lead to
believe that sensors with and even number of microspheres are less sensitive than
sensors with and odd number of microspheres. To ensure the validity of this
observation, a sensor with five microspheres should be produced and subjected to the
same experimental conditions. This matter will be further investigated in the near future.
7.4 Final Remarks
In this Chapter, two different configurations based on microspheres were proposed
for sensing. The first one was constituted by an array of microspheres incorporated in a
SMF, manufactured using a splicing machine. Four different samples were characterized
in terms of strain, and exhibited a negative response (blue shift of the interferometric
pattern). The reasons behind such behavior are still not fully understood. Besides, the
sensors response showed a dependence on the number of microspheres being even or
odd. This sensor was also tested in respect to temperature.
The second configuration was obtained at the tip of an optical fiber, by introducing
commercially available soda-lime glass microspheres inside a hollow core silica tube. A
Fabry-Perot cavity was obtained, with a spectral response dependent on the number of
microspheres. Four devices were tested in terms of temperature response and exhibited
non-linear behavior. In this configuration, and with the results obtained so far, it is
probable that better responses are achieved from sensors with an odd number of
microspheres. This is a matter for further investigation.
This last structure has a great potential for sensing applications. It can be used to
perform pressure or refractive index measurements, and with adequate post-processing
through chemical etching or focused ion beam, it can be used to measure different
parameters such as flow or magnetic fluids. The employment of different microspheres,
with higher refractive index, can also enhance the sensor performance. Besides, with a
different experimental setup, whispering gallery modes can be detected and the device
can be incorporated in a laser configuration.


CHAPTER EIGHT
8 Final Conclusions and Future Work


FCUP
Fiber Sensing Based on New Structures and Post-Processing Enhancement
143
Final Conclusions and Future Work
Considering an overall perspective, the work developed in this PhD was broadband,
both on the number of sensing configurations and applications. New fiber designs were
explored in different contexts. Some were post-processed, by means of chemical etching
or by writing periodic patterns through excimer laser and femtosecond laser, or even by
producing microspheres with the aid of a fusion splicer.
The majority of sensors presented in this Thesis were based on the Fabry-Perot (FP)
interferometer. For that reason, it was essential to have an overview of what was
published in the field. This state-of-the-art was done on the second Chapter, focusing in
the configurations, the applications and the sensitivities obtained so far. It also
evidenced that even though the first papers were published more than thirty years ago,
this is still a hot topic, as the number of publications continues to grow. This indicates
that the overview is not complete and should be expanded in the years to come.
The FP configurations developed in the third and fourth Chapter were microcavities
at the tip of a single mode optical fiber. The focus on the third Chapter was on gas
sensing applications and two different hollow core fibers were used in a diaphragm-free
cavity. The results were surprising and some of them are still not fully understood.
There was a clear influence of the cavity shape and physical dimensions on the pressure
response. However, further studies are required to understand why smaller cavities
present higher sensitivities than the larger ones. Besides, the study of the sensors
responses to other gases, such as methane, carbon monoxide and dioxide, hydrogen and
sulphur species should be performed, due to the vital importance in many industries.
The fourth Chapter was focused on the post-processing of a double-clad optical fiber.
The inner cladding was removed through chemical etching, exposing the core to the
environment. However, the core was still protected by the outer cladding, enhancing the
mechanical stability of the sensor. The diaphragm-free configuration was only subjected
to temperature variations. The inscription of a fiber Bragg grating (FBG) on this tip could
translate in a high sensitivity refractometer, and should be explored in the future. The
cavity with a diaphragm, on the other hand, revealed different responses to temperature

FCUP
Fiber Sensing Based on New Structures and Post-Processing Enhancement
144
in water and in air, when the diaphragm was thin enough. This idea of post-processing
fibers that did not guide light, by means of chemical etching, could be taken forward
with new fiber designs and finding suitable applications.
On the fifth Chapter three different configurations were proposed for the
measurement of strain. The FP cavity based on a hollow-core ring photonic crystal fiber
presented the highest sensitivity to strain reported, by the time it was published. The
remaining two configurations were used to measure strain at high temperatures. Further
studies should be done to better understand the strain sensitivity obtained with a FP
cavity. Besides, if the high-temperatures strain sensor ought to be considered for a real
application, annealing tests with a longer duration should be performed, to allow the
stabilization of the structure.
Chapter 6 presented the ability of using the same fiber section as a filter in a laser
cavity and the sensing element itself. The figure-of-eight fiber laser was characterized in
strain and torsion. An etched FBG fiber tip was characterized as a passive and an active
sensor. Ultra-high sensitivity to strain was achieved with this sensing element, in both
cases. The field of fiber laser sensors, namely when using microlasers, is still little
explored by the scientific community, and can be a very interesting area to proceed with
the fiber sensors-based investigation.
The employment of microresonators, such as the microspheres has such a huge
potential, both as lasers and as sensors. The incorporation of a microsphere inside the
optical fiber makes the sensor easy to handle. However, to prevent contaminations, a
clean environment is needed. Two different sensors based on microspheres were
developed and characterized in this Thesis. The first, a Mach-Zehnder interferometer,
was obtained by fusion splicing an array of microspheres in series. Many different
configurations can be explored from this. For example, the use of hollow core fibers to
produce hollow core spheres, splicing the spheres with lateral offsets, or even
microspheres with different dimensions. The mechanisms behind the strain behavior
should also be better understood. This configuration is rather complex, and further
studies are required, mainly by computational modelling. The preliminary results

FCUP
Fiber Sensing Based on New Structures and Post-Processing Enhancement
145
obtained with the FP cavities based on soda-lime glass microspheres placed inside a
hollow structure presented in the seventh Chapter point out that these structures have a
huge potential to be applied as fiber sensors. Some guidelines for future work would be
to use these cavities to measure other parameters, such as gas pressure or refractive
index; using high-refractive index microspheres (higher than soda lime glass) instead of
the soda-lime glass ones; and considering the application of hollow structures that
would be able to guide light. With this enhancement, the microspheres would be
protected and would be able to perform passive and active sensing, under the
appropriate conditions, opening a new field in optical fiber sensing.


9 Appendices


FCUP
Fiber Sensing Based on New Structures and Post-Processing Enhancement
149
Appendix I – Fabrication of a Double Clad Optical Fiber
The preform was obtained by the modified chemical vapor deposition (MCVD)
method. In a simple way, gas mixtures with the required compounds are injected in a
quartz silica tube which is continuously rotating. On the outside of this tube there is a
burner that can operate at temperatures above 2000 °C. This burner moves along the
length of the tube and the layers of silica/ phosphorous-doped silica are gradually
deposited, as shown in Fig. 9.1 (a), according to the following steps:
1. Cleaning and refining of the silica tube at temperatures of 1900 °C and 1980 °C
(outer cladding);
2. Deposition of 22 P2O5-doped SiO2 layers at a temperature of 1630 °C (inner
cladding);
3. Deposition of 3 SiO2 layers at a temperature of 1910 °C (fiber core);
4. Collapsing 4 times at temperatures of 2230 °C, 2250 °C, 2160 °C and 2000 °C
Figure 9.1 (b) shows the preform being collapsed, in the fourth step. The details of
the whole process are in [315].
Figure 9.1 – Preform fabrication using the MCVD technique, evidencing (a) the burner that moves along the
tube when the layers are being deposited and (b) when the structure is being collapsed at extremely high
temperatures.
During the MCVD process there was an unusual behavior of the dopants and the
final structure was not perfectly symmetric, as would have been expected. Nevertheless,
the fiber was drawn, by locally heating the fiber preform. Initially, the neck-down region
of the preform is heated up until it softens and it starts to be pulled down by the action

FCUP
Fiber Sensing Based on New Structures and Post-Processing Enhancement
150
of gravity (Fig. 9.2 (a)). This molten section of the preform is analyzed by a diameter
controller, after which it is cut, leaving the thin fiber to be drawn. The drawing
temperature was ~1800 °C. Besides temperature, pressure and drawing speed can also
affect the final structure, so these parameters must be controlled throughout the entire
process. However, given the preform dense structure, in this case, the pressure did not
play a role. The temperature was constant and set to a value adequate to achieve
moderate tensile forces in order to prevent fiber breakage. Therefore, the drawing force
was continuously recorded and showed values ~0.2 N. The preform feed rate was
0.78 mm/min and the drawing speed was adjusted between 4.2 - 4.5 m/min to reach a
constant fiber diameter of 125 µm. The fiber was coated with a single layer UV cured
acrylate coating. The diameter of the coated fiber was 230 µm. Figure 9.2 (b) shows the
UV curing lamp used to process the acrylate. Finally, the fiber was coiled, using a system
of capstans and a drum winder, as shown in Fig. 9.2 (c). A more detailed description of
the drawing process is presented in the literature [315].
Figure 9.2 – Fiber drawing components: (a) the drawing furnace with the preform, (b) the UV curing lamp
and (c) capstan and drum winder.

FCUP
Fiber Sensing Based on New Structures and Post-Processing Enhancement
151
Appendix II - Point-by-Point Femtosecond Laser FBG Inscription
The experimental setup used to write the fiber Bragg gratings using the point-by-
point technique is shown in Fig. 9.3. A mode-locked Yb:YAG laser system, centered at
1026 nm and with a repetition rate of 100 kHz (Amplitude System S-Pulse HP) was used
for the generation of sub-500 fs-laser pulses [316, 317]. The work was carried out under a
20× objective lens (Mititoyo M-Plan Apo NIR Series) which had a numerical aperture of
0.4. The effective laser spot diameter was of 2 m. The samples were placed in a sub-
nanometer precision XY air-bearing translational stage with mechanical z-translation
(ABL1000, Aerotech). The stages were controlled through a control unit (Aerotech
A3200) connected to a personal computer (PC), and a custom made program was
developed using G-code commands for the translation stages motion control.
Figure 9.3 – Experimental setup for the femtosecond laser system used to inscribe the fiber Bragg gratings.
CCD stands for charged coupled device. Adapted from [317].
A section of ~1 cm of fiber coating was removed and afterwards the fiber was
secured to a standard microscope glass slide. In order to compensate the fiber curvature,
thus guaranteeing the tight focus of the laser beam during the inscription and improving
the visibility on the CCD camera, a droplet of index matching oil was placed on the fiber
section without coating. Finally, a cover slip was placed on top of the oil.

FCUP
Fiber Sensing Based on New Structures and Post-Processing Enhancement
152
Through a controlled motion, the laser was focused on the fiber core, at the
beginning of the writing section. As the translation stage acquired the required speed, of
1.071 mm/s, the shutter was opened and the FBG was written on the fiber core. The
writing process was monitored in real time connecting the fiber ends to a transmission
setup constituted by a broadband optical source and an optical spectrum analyzer.

FCUP
Fiber Sensing Based on New Structures and Post-Processing Enhancement
153
Appendix III - Interferometric Excimer Laser FBG inscription
The experimental setup used to write the FBGs using the phase-mask technique is
shown in Fig. 9.4. It consisted on a KrF excimer laser source from Lambda Physik
(Compex150) with a wavelength of 248 nm and a Talbot interferometer [318, 319]. The
beam is focused by a cylindrical lens and passes through the phase mask, which acts as a
beam splitter. For the FBGs written in this work, a phase mask with a period of 530 nm
was used. The split light is then reflected by two rotating mirrors. Depending on the
angle of these components, the angle at which light is recombined, FBG, changes,
allowing the tunability of the Bragg wavelength, B, according to Eq. 9.1 [319]:
2 ,sin
eff UV
B eff
FBG
nn
(9.1)
where neff is the optical fiber effective refractive index and UV is the KrF excimer laser
source wavelength and is the grating period. This setup is incorporated in the fiber
drawing tower facilities, enabling the simultaneous fiber manufacturing and FBG
inscription. The fibers need to be photosensitive in order to achieve high-reflectivity
FBGs. This can be obtained by using fibers with a highly-doped core (ca. 18% Ge
dopants). However, the setup can also be used independently to the fiber drawing
tower. This was the case for the FBGs tested in Chapter 6.
KrF Excimer Laser Source
Scanning Mirror
Cylindrical Lens
Phase Mask
Rotating Mirror
Rotating Mirror
Fiber Holder
Optical Fiber
Figure 9.4 – Scheme of the interferometric KrF excimer laser setup. Adapted from [318].


10 References


FCUP
Fiber Sensing Based on New Structures and Post-Processing Enhancement
157
References
[1] Santos, J. L. and Farahi, F., Handbook of Optical Sensors, CRC Press/Taylor & Francis
Group, 2015.
[2] Gerges, A. S., Newson, T. P., Farahi, F., Jones, J. D. C. and Jackson, D. A., A hemispherical air
cavity fiber Fabry-Perot sensor, Opt Commun, 68(3), 157-160, 1988.
[3] Kersey, A. D., Jackson, D. A. and Corke, M., A simple fiber Fabry-Perot sensor, Opt Commun,
45(2), 71-74, 1983.
[4] Morey, W. W., Meltz, G. and Glenn, W. H., Fiber optic Bragg grating sensors, Fiber Optic and
Laser Sensors Vii, 1169, 98-107, 1990.
[5] Knight, J. C., Birks, T. A., Russell, P. S. and Atkin, D. M., All-silica single-mode optical fiber
with photonic crystal cladding, Opt Lett, 21(19), 1547-1549, 1996.
[6] Huang, Z. Y., Zhu, Y. Z., Chen, X. P. and Wang, A. B., Intrinsic Fabry-Perot fiber sensor for
temperature and strain measurements, Ieee Photonic Tech L, 17(11), 2403-2405, 2005.
[7] Donlagic, D. and Cibula, E., All-fiber high-sensitivity pressure sensor with SiO2 diaphragm, Opt
Lett, 30(16), 2071-2073, 2005.
[8] Rao, Y. J., Deng, M., Duan, D. W., Yang, X. C., Zhu, T. and Cheng, G. H., Micro Fabry-Perot
interferometers in silica fibers machined by femtosecond laser, Opt Express, 15(21), 14123-14128,
2007.
[9] Watson, S., Gander, M. J., MacPherson, W. N., Barton, J. S., Jones, J. D. C., Klotzbuecher, T.,
Braune, T., Ott, J. and Schmitz, F., Laser-machined fibers as Fabry-Perot pressure sensors, Appl
Optics, 45(22), 5590-5596, 2006.
[10] Kou, J. L., Feng, J., Ye, L., Xu, F. and Lu, Y. Q., Miniaturized fiber taper reflective interferometer
for high temperature measurement, Opt Express, 18(13), 14245-14250, 2010.
[11] Fabry, C. and Perot, A., Sur les franges des lames minces argentées et leur application à la mesure
de petites épaisseurs ďair. , Ann. Chim. Phys., 12, 459–501, 1897.
[12] Cielo, P. G., Fiber optic hydrophone - improved strain configuration and environmental noise
protection, Appl Optics, 18(17), 2933-2937, 1979.
[13] Yoshino, T. and Ohno, Y., Fiber Fabry-Perot interferometers, in: 3rd Int. Conf. on Integrated
Optics and Optical Fiber Commun., San Franscisco, CA, 1981.
[14] Petuchowski, S. J., Giallorenzi, T. G. and Sheem, S. K., A sensitive fiber-optic Fabry-Perot
interferometer, Ieee J Quantum Elect, 17(11), 2168-2170, 1981.
[15] Franzen, D. L. and Kim, E. M., Long optical-fiber Fabry-Perot interferometers, Appl Optics,
20(23), 3991-3992, 1981.
[16] Yoshino, T., Kurosawa, K., Itoh, K. and Ose, T., Fiberoptic Fabry-Perot interferometer and its
sensor applications, Ieee J Quantum Elect, 18(10), 1624-1633, 1982.
[17] Ohtsuka, Y., Optical coherence effects on a fiber-sensing Fabry-Perot interferometer, Appl Optics,
21(23), 4316-4320, 1982.
[18] Kist, R. and Sohle, W., Fiber-optic spectrum analyzer, J Lightwave Technol, LT-1(1), 105-110,
1983.
[19] Leilabady, P. A., Jones, J. D. C., Kersey, A. D., Corke, M. and Jackson, D. A., Monomode fiber
optic vortex shedding flowmeter, Electron Lett, 20(16), 664-665, 1984.
[20] Beheim, G., Remote displacement measurement using a passive interferometer with a fiber-optic
link, Appl Optics, 24(15), 2335-2340, 1985.
[21] Beheim, G., Fritsch, K. and Poorman, R. N., Fiber-linked interferometric pressure sensor, Rev Sci
Instrum, 58(9), 1655-1659, 1987.
[22] Dakin, J. P., Wade, C. A. and Withers, P. B., An optical fiber sensor for the measurement of
pressure, Fiber Integrated Opt, 7(1), 35-46, 1988.

FCUP
Fiber Sensing Based on New Structures and Post-Processing Enhancement
158
[23] Ito, T., Precise measurement of the change in the optical-length of a fiber optic Fabry-Perot
interferometer, Appl Optics, 25(7), 1072-1075, 1986.
[24] Tseng, S. M. and Chen, C. L., Optical fiber Fabry-Perot sensors, Appl Optics, 27(3), 547-551,
1988.
[25] Lee, C. E. and Taylor, H. F., Interferometric optical fiber sensors using internal mirrors, Electron
Lett, 24(4), 193-194, 1988.
[26] Farahi, F., Newson, T. P., Jones, J. D. C. and Jackson, D. A., Coherence multiplexing of remote
fiber optic Fabry-Perot sensing system, Opt Commun, 65(5), 319-321, 1988.
[27] Lee, C. E., Atkins, R. A. and Taylor, H. F., Performance of a fiber optic temperature sensor from -
200 to 1050 ºC, Opt Lett, 13(11), 1038-1040, 1988.
[28] Kersey, A. D., Dorsey, K. L. and Dandridge, A., Cross talk in a fiber optic Fabry-Perot sensor
array with ring reflectors, Opt Lett, 14(1), 93-95, 1989.
[29] Maystre, F. and Bertholds, A., Magneto-optic current sensor using a helical-fiber Fabry-Perot
resonator, Opt Lett, 14(11), 587-589, 1989.
[30] Lee, C. E., Taylor, H. F., Markus, A. M. and Udd, E., Optical fiber Fabry-Perot embedded sensor,
Opt Lett, 14(21), 1225-1227, 1989.
[31] Valis, T., Hogg, D. and Measures, R. M., Fiber optic Fabry-Perot strain gauge, Ieee Photonic
Tech L, 2(3), 227-228, 1990.
[32] Farahi, F., Webb, D. J., Jones, J. D. C. and Jackson, D. A., Simultaneous measurement of
temperature and strain: cross-sensitivity considerations, J Lightwave Technol, 8(2), 138-142, 1990.
[33] Alcoz, J. J., Lee, C. E. and Taylor, H. F., Embedded fiber optic Fabry-Perot ultrasound sensor, Ieee
T Ultrason Ferr, 37(4), 302-306, 1990.
[34] Lee, C. E. and Taylor, H. F., Fiber optic Fabry-Perot temperature sensor using a low-coherence
light source, J Lightwave Technol, 9(1), 129-134, 1991.
[35] Murphy, K. A., Gunther, M. F., Vengsarkar, A. M. and Claus, R. O., Quadrature phase-shifted,
extrinsic Fabry-Perot optical fiber sensors, Opt Lett, 16(4), 273-275, 1991.
[36] Claus, R. O., Gunther, M. F., Wang, A. and Murphy, K. A., Extrinsic Fabry-Perot sensor for
strain and crack opening displacement measurements from -200 to 900 ºC, Smart Mater Struct, 1,
237-242, 1992.
[37] Santos, J. L., Leite, A. P. and Jackson, D. A., Optical fiber sensing with a low-finesse Fabry-Perot
cavity, Appl Optics, 31(34), 7361-7366, 1992.
[38] Wang, A., Gollapudi, S., Murphy, K. A., May, R. G. and Claus, R. O., Sapphire fiber-based
intrinsic Fabry-Perot interferometer, Opt Lett, 17(14), 1021-1023, 1992.
[39] Belleville, C. and Duplain, G., White-light interferometric multimode fiber optic strain sensor,
Opt Lett, 18(1), 78-80, 1993.
[40] Kersey, A. D., Berkoff, T. A. and Morey, W. W., Multiplexed fiber Bragg grating strain-sensor
system with a fiber Fabry-Perot wavelength filter, Opt Lett, 18(16), 1370-1372, 1993.
[41] Sirkis, J. S., Brennan, D. D., Putman, M. A., Berkoff, T. A., Kersey, A. D. and Friebele, E. J.,
In-line fiber etalon for strain measurement, Opt Lett, 18(22), 1973-1975, 1993.
[42] Atkins, R. A., Gardner, J. H., Gibler, W. N., Lee, C. E., Oakland, M. D., Spears, M. O.,
Swenson, V. P., Taylor, H. F., Mccoy, J. J. and Beshouri, G., Fiber-optic pressure sensors for
internal-combustion engines, Appl Optics, 33(7), 1315-1320, 1994.
[43] Hsu, K., Miller, C. M., Kringlebotn, J. T., Taylor, E. M., Townsend, J. and Payne, D. N.,
Single-mode tunable erbium-ytterbium fiber Fabry-Perot microlaser, Opt Lett, 19(12), 886-888,
1994.
[44] Sorin, W. V. and Baney, D. M., Multiplexed sensing using optical low-coherence reflectometry,
Ieee Photonic Tech L, 7(8), 917-919, 1995.
[45] Dorighi, J. F., Krishnaswamy, S. and Achenbach, J. D., Stabilization of an embedded fiber optic
Fabry-Perot sensor for ultrasound detection, Ieee T Ultrason Ferr, 42(5), 820-824, 1995.

FCUP
Fiber Sensing Based on New Structures and Post-Processing Enhancement
159
[46] Sadkowski, R., Lee, C. E. and Taylor, H. F., Multiplexed interferometric fiber optic sensors with
digital signal-processing, Appl Optics, 34(25), 5861-5866, 1995.
[47] Ezbiri, A. and Tatam, R. P., Interrogation of low finesse optical fibre Fabry-Perot interferometers
using a four wavelength technique, Meas Sci Technol, 7(2), 117-120, 1996.
[48] Beard, P. C. and Mills, T. N., Extrinsic optical-fiber ultrasound sensor using a thin polymer film as
a low-finesse Fabry-Perot interferometer, Appl Optics, 35(4), 663-675, 1996.
[49] Kao, T. W. and Taylor, H. F., High-sensitivity intrinsic fiber-optic Fabry-Perot pressure sensor,
Opt Lett, 21(8), 615-617, 1996.
[50] Bhatia, V., Murphy, K. A., Claus, R. O., Jones, M. E., Grace, J. L., Tran, T. A. and Greene, J.
A., Optical fibre based absolute extrinsic Fabry-Perot interferometric sensing system, Meas Sci
Technol, 7(1), 58-61, 1996.
[51] Dorighi, J., Krishnaswamy, S. and Achenbach, J. D., Response of an embedded fiber optic
ultrasound sensor, J Acoust Soc Am, 101(1), 257-263, 1997.
[52] Chang, C. C. and Sirkis, J., Absolute phase measurement in extrinsic Fabry-Perot optical fiber
sensors using multiple path-match conditions, Exp Mech, 37(1), 26-32, 1997.
[53] Oh, K. D., Ranade, J., Arya, V., Wang, A. and Claus, R. O., Optical fiber Fabry-Perot
interferometric sensor for magnetic field measurement, Ieee Photonic Tech L, 9(6), 797-799, 1997.
[54] Wang, T. Y., Zheng, S. X. and Yang, Z. G., A high precision displacement sensor using a low-
finesse fiber-optic Fabry-Perot interferometer, Sensor Actuat a-Phys, 69(2), 134-138, 1998.
[55] Fang, J. X., Taylor, H. F. and Choi, H. S., Fiber-optic Fabry-Perot flow sensor, Microw Opt
Techn Let, 18(3), 209-211, 1998.
[56] Lawrence, C. M., Nelson, D. V., Bennett, T. E. and Spingarn, J. R., An embedded fiber optic
sensor method for determining residual stresses in fiber-reinforced composite materials, J Intel Mat
Syst Str, 9(10), 788-799, 1998.
[57] Du, W. C., Tao, X. M. and Tam, H. Y., Fiber Bragg grating cavity sensor for simultaneous
measurement of strain and temperature, Ieee Photonic Tech L, 11(1), 105-107, 1999.
[58] Schmidt, M. and Furstenau, N., Fiber-optic extrinsic Fabry-Perot interferometer sensors with
three-wavelength digital phase demodulation, Opt Lett, 24(9), 599-601, 1999.
[59] Arregui, F. J., Liu, Y. J., Matias, I. R. and Claus, R. O., Optical fiber humidity sensor using a
nano Fabry-Perot cavity formed by the ionic self-assembly method, Sensor Actuat B-Chem, 59(1),
54-59, 1999.
[60] Liu, T. and Fernando, G. F., A frequency division multiplexed low-finesse fiber optic Fabry-Perot
sensor system for strain and displacement measurements, Rev Sci Instrum, 71(3), 1275-1278, 2000.
[61] Katsumata, T., Haga, Y., Minami, K. and Esashi, M., Micromachined 125 m diameter ultra
miniature fiber-optic pressure sensor for catheter, Trans. Inst. Electron. Commun. Eng. Jpn., 120-
E(2), 58-63, 2000.
[62] Jiang, M. Z. and Gerhard, E., A simple strain sensor using a thin film as a low-finesse fiber-optic
Fabry-Perot interferometer, Sensor Actuat a-Phys, 88(1), 41-46, 2001.
[63] Tsai, W. H. and Lin, C. J., A novel structure for the intrinsic Fabry-Perot fiber-optic temperature
sensor, J Lightwave Technol, 19(5), 682-686, 2001.
[64] Dahlem, M., Santos, J. L., Ferreira, L. A. and Araujo, F. M., Passive interrogation of low-finesse
Fabry-Perot cavities using fiber Bragg gratings, Ieee Photonic Tech L, 13(9), 990-992, 2001.
[65] Chen, Y. C. and Taylor, H. F., Multiplexed fiber Fabry-Perot temperature sensor system using
white-light interferometry, Opt Lett, 27(11), 903-905, 2002.
[66] Gander, M. J., MacPherson, W. N., Barton, J. S., Reuben, R. L., Jones, J. D. C., Stevens, R.,
Chana, K. S., Anderson, S. J. and Jones, T. V., Embedded micromachined fiber-optic Fabry-Perot
pressure sensors in aerodynamics applications, Ieee Sens J, 3(1), 102-107, 2003.
[67] Yu, B., Kim, D. W., Deng, J. D., Xiao, H. and Wang, A., Fiber Fabry-Perot sensors for detection
of partial discharges in power transformers, Appl Optics, 42(16), 3241-3250, 2003.

FCUP
Fiber Sensing Based on New Structures and Post-Processing Enhancement
160
[68] Lin, C. J. and Tseng, F. G., A micro Fabry-Perot sensor for nano-lateral displacement sensing with
enhanced sensitivity and pressure resistance, Sensor Actuat a-Phys, 114(2-3), 163-170, 2004.
[69] Xiao, G. Z., Adnet, A., Zhang, Z. Y., Lu, Z. G. and Grover, C. P., Fiber-optic Fabry-Perot
interferometric gas-pressure sensors embedded in pressure fittings, Microw Opt Techn Let, 42(6),
486-489, 2004.
[70] Zhang, G. J., Yu, Q. X. and Song, S. D., An investigation of interference/intensity demodulated
fiber-optic Fabry-Perot cavity sensor, Sensor Actuat a-Phys, 116(1), 33-38, 2004.
[71] Shen, F., Peng, W., Cooper, K., Pickrell, G. and Wang, A. B., UV-induced intrinsic Fabry-Perot
interferometric fiber sensors, Sensors for Harsh Environments, 5590, 47-56, 2004.
[72] Xiao, G. Z., Adnet, A., Zhang, Z. Y., Sun, F. G. and Grover, C. P., Monitoring changes in the
refractive index of gases by means of a fiber optic Fabry-Perot interferometer sensor, Sensor Actuat
a-Phys, 118(2), 177-182, 2005.
[73] Xu, J. C., Wang, X. W., Cooper, K. L. and Wang, A. B., Miniature all-silica fiber optic pressure
and acoustic sensors, Opt Lett, 30(24), 3269-3271, 2005.
[74] Cibula, E. and Donlagic, D., Miniature fiber-optic pressure sensor with a polymer diaphragm,
Appl Optics, 44(14), 2736-2744, 2005.
[75] Kim, D. W., Shen, F., Chen, X. P. and Wang, A. B., Simultaneous measurement of refractive
index and temperature based on a reflection-mode long-period grating and an intrinsic Fabry-Perot
interferometer sensor, Opt Lett, 30(22), 3000-3002, 2005.
[76] Zhu, Y. Z., Cooper, K. L., Pickrell, G. R. and Wang, A., High-temperature fiber-tip pressure
sensor, J Lightwave Technol, 24(2), 861-869, 2006.
[77] Wang, X. W., Xu, J. C., Zhu, Y. Z., Cooper, K. L. and Wang, A. B., All-fused-silica miniature
optical fiber tip pressure sensor, Opt Lett, 31(7), 885-887, 2006.
[78] Cranch, G. A., Flockhart, G. M. H., MacPherson, W. N., Barton, J. S. and Kirkendall, C. K.,
Ultra-high-sensitivity two-dimensional bend sensor, Electron Lett, 42(9), 520-522, 2006.
[79] Chen, X. P., Shen, F. B., Wang, Z. A., Huang, Z. Y. and Wang, A. B., Micro-air-gap based
intrinsic Fabry-Perot interferometric fiber-optic sensor, Appl Optics, 45(30), 7760-7766, 2006.
[80] Tuck, C. J., Hague, R. and Doyle, C., Low cost optical fibre based Fabry-Perot strain sensor
production, Meas Sci Technol, 17(8), 2206-2212, 2006.
[81] Machavaram, V. R., Badcock, R. A. and Fernando, G. F., Fabrication of intrinsic fibre Fabry-
Perot sensors in silica fibres using hydrofluoric acid etching, Sensor Actuat a-Phys, 138(1), 248-
260, 2007.
[82] Cibula, E. and Donlagic, D., In-line short cavity Fabry-Perot strain sensor for quasi distributed
measurement utilizing standard OTDR, Opt Express, 15(14), 8719-8730, 2007.
[83] Zhang, Y., Chen, X. P., Wang, Y. X., Cooper, K. L. and Wang, A. B., Microgap multicavity
Fabry-Perot biosensor, J Lightwave Technol, 25(7), 1797-1804, 2007.
[84] Ran, Z. L., Rao, Y. J., Deng, H. Y. and Liao, X., Miniature in-line photonic crystal fiber etalon
fabricated by 157 nm laser micromachining, Opt Lett, 32(21), 3071-3073, 2007.
[85] Rao, Y. J., Zhu, T., Yang, X. C. and Duan, D. W., In-line fiber-optic etalon formed by hollow-core
photonic crystal fiber, Opt Lett, 32(18), 2662-2664, 2007.
[86] Wang, Z., Shen, F. B., Song, L. J., Wang, X. W. and Wang, A. B., Multiplexed fiber Fabry-Perot
interferometer sensors based on ultrashort Bragg gratings, Ieee Photonic Tech L, 19(5-8), 622-624,
2007.
[87] Ran, Z. L., Rao, Y. J., Liu, W. J., Liao, X. and Chiang, K. S., Laser-micromachined Fabry-Perot
optical fiber tip sensor for high-resolution temperature-independent measurement of refractive index,
Opt Express, 16(3), 2252-2263, 2008.
[88] Wei, T., Han, Y. K., Li, Y. J., Tsai, H. L. and Xiao, H., Temperature-insensitive miniaturized fiber
inline Fabry-Perot interferometer for highly sensitive refractive index measurement, Opt Express,
16(8), 5764-5769, 2008.

FCUP
Fiber Sensing Based on New Structures and Post-Processing Enhancement
161
[89] Wei, T., Han, Y. K., Tsai, H. L. and Xiao, H., Miniaturized fiber inline Fabry-Perot interferometer
fabricated with a femtosecond laser, Opt Lett, 33(6), 536-538, 2008.
[90] Rao, Y. J., Deng, M., Duan, D. W. and Zhu, T., In-line fiber Fabry-Perot refractive-index tip
sensor based on endlessly photonic crystal fiber, Sensor Actuat a-Phys, 148(1), 33-38, 2008.
[91] Choi, H. Y., Park, K. S., Park, S. J., Paek, U. C., Lee, B. H. and Choi, E. S., Miniature fiber-optic
high temperature sensor based on a hybrid structured Fabry-Perot interferometer, Opt Lett, 33(21),
2455-2457, 2008.
[92] Shi, Q., Lv, F. Y., Wang, Z., Jin, L., Hu, J. J., Liu, Z. Y., Kai, G. Y. and Dong, X. Y.,
Environmentally stable Fabry-Perot-type strain sensor based on hollow-core photonic bandgap fiber,
Ieee Photonic Tech L, 20(1-4), 237-239, 2008.
[93] Corres, J. M., Matias, I. R., Hernaez, M., Bravo, J. and Arregui, F. J., Optical fiber humidity
sensors using nanostructured coatings of SiO2 nanoparticles, Ieee Sens J, 8(3-4), 281-285, 2008.
[94] Jiang, Y. and Tang, C. J., High-finesse micro-lens fiber-optic extrinsic Fabry-Perot interferometric
sensors, Smart Mater Struct, 17(5), 2008.
[95] Liu, J., Sun, Y. Z. and Fan, X. D., Highly versatile fiber-based optical Fabry-Perot gas sensor, Opt
Express, 17(4), 2731-2738, 2009.
[96] Cibula, E., Pevec, S., Lenardic, B., Pinet, E. and Donlagic, D., Miniature all-glass robust
pressure sensor, Opt Express, 17(7), 5098-5106, 2009.
[97] Morris, P., Hurrell, A., Shaw, A., Zhang, E. and Beard, P., A Fabry-Perot fiber-optic ultrasonic
hydrophone for the simultaneous measurement of temperature and acoustic pressure, J Acoust Soc
Am, 125(6), 3611-3622, 2009.
[98] Ran, Z. L., Rao, Y. J., Zhang, J., Liu, Z. W. and Xu, B., A miniature fiber-optic refractive-index
sensor based on laser-machined Fabry-Perot interferometer tip, J Lightwave Technol, 27(23), 5426-
5429, 2009.
[99] Frazao, O., Baptista, J. M., Santos, J. L., Kobelke, J. and Shuster, K., Refractive index tip sensor
based on Fabry-Perot cavities formed by a suspended core fibre, J Eur Opt Soc-Rapid, 4, 2009.
[100] Frazao, O., Aref, S. H., Baptista, J. M., Santos, J. L., Latifi, H., Farahi, F., Kobelke, J. and
Schuster, K., Fabry-Perot cavity based on a suspended-core fiber for strain and temperature
measurement, Ieee Photonic Tech L, 21(17), 1229-1231, 2009.
[101] Villatoro, J., Finazzi, V., Coviello, G. and Pruneri, V., Photonic-crystal-fiber-enabled micro-
Fabry-Perot interferometer, Opt Lett, 34(16), 2441-2443, 2009.
[102] Gong, Y., Rao, Y. J., Guo, Y., Ran, Z. L. and Wu, Y., Temperature-insensitive micro Fabry-Prot
strain sensor fabricated by chemically etching Er-doped fiber, Ieee Photonic Tech L, 21(22), 1725-
1727, 2009.
[103] Rao, Y. J., Deng, M., Zhu, T. and Li, H., In-line Fabry-Perot etalons based on hollow-core photonic
bandgap fibers for high-temperature applications, J Lightwave Technol, 27(19), 4360-4365, 2009.
[104] Choi, H. Y., Mudhana, G., Park, K. S., Paek, U. C. and Lee, B. H., Cross-talk free and ultra-
compact fiber optic sensor for simultaneous measurement of temperature and refractive index, Opt
Express, 18(1), 141-149, 2010.
[105] Gong, Y. A., Guo, Y., Rao, Y. J., Zhao, T. A. and Wu, Y., Fiber-Optic Fabry-Perot sensor based
on periodic focusing effect of graded-index multimode fibers, Ieee Photonic Tech L, 22(23), 1708-
1710, 2010.
[106] Gong, Y. A., Zhao, T. A., Rao, Y. J., Wu, Y. and Guo, Y., A ray-transfer-matrix model for hybrid
fiber Fabry-Perot sensor based on graded-index multimode fiber, Opt Express, 18(15), 15844-15852,
2010.
[107] Frazao, O., Silva, S. F., Viegas, J., Baptista, J. M., Santos, J. L. and Roy, P., A hybrid Fabry-
Perot/Michelson interferometer sensor using a dual asymmetric core microstructured fiber, Meas Sci
Technol, 21(2), 2010.
[108] Kou, J. L., Feng, J., Wang, Q. J., Xu, F. and Lu, Y. Q., Microfiber-probe-based ultrasmall
interferometric sensor, Opt Lett, 35(13), 2308-2310, 2010.

FCUP
Fiber Sensing Based on New Structures and Post-Processing Enhancement
162
[109] Deng, M., Tang, C. P., Zhu, T., Rao, Y. J., Xu, L. C. and Han, M., Refractive index measurement
using photonic crystal fiber-based Fabry-Perot interferometer, Appl Optics, 49(9), 1593-1598, 2010.
[110] Zhao, J. R., Huang, X. G., He, W. X. and Chen, J. H., High-resolution and temperature-
insensitive fiber optic refractive index sensor based on Fresnel reflection modulated by Fabry-Perot
interference, J Lightwave Technol, 28(19), 2799-2803, 2010.
[111] Zhu, T., Ke, T., Rao, Y. J. and Chiang, K. S., Fabry-Perot optical fiber tip sensor for high
temperature measurement, Opt Commun, 283(19), 3683-3685, 2010.
[112] Pinto, A. M. R., Frazao, O., Santos, J. L., Lopez-Amo, M., Kobelke, J. and Schuster, K.,
Interrogation of a suspended-core Fabry-Perot temperature sensor through a dual wavelength Raman
fiber laser, J Lightwave Technol, 28(21), 3149-3155, 2010.
[113] Ke, T., Zhu, T., Rao, Y. J. and Deng, M., Accelerometer based on all-fiber Fabry-Perot
interferometer formed by hollow-core photonic crystal fiber, Microw Opt Techn Let, 52(11), 2531-
2535, 2010.
[114] Wang, W. H., Wu, N., Tian, Y., Niezrecki, C. and Wang, X. W., Miniature all-silica optical fiber
pressure sensor with an ultrathin uniform diaphragm, Opt Express, 18(9), 9006-9014, 2010.
[115] Duan, D. W., Rao, Y. J., Wen, W. P., Yao, J., Wu, D., Xu, L. C. and Zhu, T., In-line all-fibre
Fabry-Perot interferometer high temperature sensor formed by large lateral offset splicing, Electron
Lett, 47(6), 401-402, 2011.
[116] Nguyen, L. V., Vasiliev, M. and Alameh, K., Three-wave fiber Fabry-Perot interferometer for
simultaneous measurement of temperature and water salinity of seawater, Ieee Photonic Tech L,
23(7), 450-452, 2011.
[117] Pevec, S. and Donlagic, D., All-fiber, long-active-length Fabry-Perot strain sensor, Opt Express,
19(16), 15641-15651, 2011.
[118] Cibula, E. and Donlagic, D., In-line Fabry-Perot refractive index sensor, Ieee Photonic Tech L,
23(21), 1609-1611, 2011.
[119] Zhou, K. M., Yan, Z. J., Zhang, L. and Bennion, I., Refractometer based on fiber Bragg grating
Fabry-Perot cavity embedded with a narrow microchannel, Opt Express, 19(12), 11769-11779,
2011.
[120] Zhou, X. L. and Yu, Q. X., Wide-range displacement sensor based on fiber-optic Fabry-Perot
interferometer for subnanometer measurement, Ieee Sens J, 11(7), 1602-1606, 2011.
[121] Deng, M., Tang, C. P., Zhu, T. and Rao, Y. J., PCF-based Fabry-Perot interferometric sensor for
strain measurement at high temperatures, Ieee Photonic Tech L, 23(11), 700-702, 2011.
[122] Ferreira, M. S., Coelho, L., Schuster, K., Kobelke, J., Santos, J. L. and Frazao, O., Fabry-Perot
cavity based on a diaphragm-free hollow-core silica tube, Opt Lett, 36(20), 4029-4031, 2011.
[123] Gouveia, C., Jorge, P. A. S., Baptista, J. M. and Frazao, O., Fabry-Perot cavity based on a high-
birefringent fiber Bragg grating for refractive index and temperature measurement, Ieee Sens J,
12(1), 17-21, 2012.
[124] Wang, T. T. and Wang, M., Fabry-Perot fiber sensor for simultaneous measurement of refractive
index and temperature based on an in-fiber ellipsoidal cavity, Ieee Photonic Tech L, 24(19), 1733-
1736, 2012.
[125] Silva, S., Coelho, L., Andre, R. M. and Frazao, O., Gas refractometry based on an all-fiber spatial
optical filter, Opt Lett, 37(16), 3450-3452, 2012.
[126] Liao, C. R., Hu, T. Y. and Wang, D. N., Optical fiber Fabry-Perot interferometer cavity fabricated
by femtosecond laser micromachining and fusion splicing for refractive index sensing, Opt Express,
20(20), 22813-22818, 2012.
[127] Duan, D. W., Rao, Y. J. and Zhu, T., High sensitivity gas refractometer based on all-fiber open-
cavity Fabry-Perot interferometer formed by large lateral offset splicing, J Opt Soc Am B, 29(5),
912-915, 2012.
FCUP
Fiber Sensing Based on New Structures and Post-Processing Enhancement
163
[128] Liu, L., Gong, Y., Wu, Y., Zhao, T., Wu, H. J. and Rao, Y. J., Spatial frequency multiplexing of
fiber-optic interferometric refractive index sensors based on graded-index multimode fibers, Sensors-
Basel, 12(9), 12377-12385, 2012.
[129] Hu, D. J. J., Wang, Y. X., Lim, J. L., Zhang, T. S., Milenko, K. B., Chen, Z. H., Jiang, M.,
Wang, G. H., Luan, F., Shum, P. P., Sun, Q. Z., Wei, H. F., Tong, W. J. and Wolinski, T. R.,
Novel miniaturized Fabry-Perot refractometer based on a simplified hollow-core fiber with a hollow
silica sphere tip, Ieee Sens J, 12(5), 1239-1245, 2012.
[130] Favero, F. C., Araujo, L., Bouwmans, G., Finazzi, V., Villatoro, J. and Pruneri, V., Spheroidal
Fabry-Perot microcavities in optical fibers for high-sensitivity sensing, Opt Express, 20(7), 7112-
7118, 2012.
[131] Wang, T. T., Wang, M. and Ni, H. B., Micro-Fabry-Perot interferometer with high contrast based
on an in-fiber ellipsoidal cavity, Ieee Photonic Tech L, 24(11), 948-950, 2012.
[132] Duan, D. W., Rao, Y. J., Hou, Y. S. and Zhu, T., Microbubble based fiber-optic Fabry-Perot
interferometer formed by fusion splicing single-mode fibers for strain measurement, Appl Optics,
51(8), 1033-1036, 2012.
[133] Ferreira, M. S., Bierlich, J., Kobelke, J., Schuster, K., Santos, J. L. and Frazao, O., Towards the
control of highly sensitive Fabry-Perot strain sensor based on hollow-core ring photonic crystal fiber,
Opt Express, 20(20), 21946-21952, 2012.
[134] Tafulo, P. A. R., Jorge, P. A. S., Santos, J. L., Araujo, F. M. and Frazao, O., Intrinsic Fabry-
Perot cavity sensor based on etched multimode graded index fiber for strain and temperature
measurement, Ieee Sens J, 12(1), 8-12, 2012.
[135] Tafulo, P. A. R., Jorge, P. A. S., Santos, J. L. and Frazao, O., Fabry-Perot cavities based on
chemical etching for high temperature and strain measurement, Opt Commun, 285(6), 1159-1162,
2012.
[136] Zhang, J., Sun, H., Rong, Q. Z., Ma, Y., Liang, L., Xu, Q. F., Zhao, P., Feng, Z. Y., Hu, M. L.
and Qiao, X. G., High-temperature sensor using a Fabry-Perot interferometer based on solid-core
photonic crystal fiber, Chin Opt Lett, 10(7), 2012.
[137] Xu, L. C., Deng, M., Duan, D. W., Wen, W. P. and Han, M., High-temperature measurement by
using a PCF-based Fabry-Perot interferometer, Opt Laser Eng, 50(10), 1391-1396, 2012.
[138] Pevec, S. and Donlagic, D., Miniature all-fiber Fabry-Perot sensor for simultaneous measurement
of pressure and temperature, Appl Optics, 51(19), 4536-4541, 2012.
[139] Lai, C. W., Lo, Y. L., Yur, J. P., Liu, W. F. and Chuang, C. H., Application of Fabry-Perot and
fiber Bragg grating pressure sensors to simultaneous measurement of liquid level and specific
gravity, Measurement, 45(3), 469-473, 2012.
[140] Wang, D. H., Wang, S. J. and Jia, P. G., In-line silica capillary tube all-silica fiber-optic Fabry-
Perot interferometric sensor for detecting high intensity focused ultrasound fields, Opt Lett, 37(11),
2046-2048, 2012.
[141] Wang, Y., Wang, D. N., Liao, C. R., Hu, T. Y., Guo, J. T. and Wei, H. F., Temperature-
insensitive refractive index sensing by use of micro Fabry-Perot cavity based on simplified hollow-
core photonic crystal fiber, Opt Lett, 38(3), 269-271, 2013.
[142] Sun, H., Zhang, J., Rong, Q., Feng, D., Du, Y., Zhang, X., Su, D., Zhou, L., Feng, Z., Qiao, X.
and Hu, M., A hybrid fiber interferometer for simultaneous refractive index and temperature
measurements based on Fabry–Perot/Michelson interference, Ieee Sens J, 13( 5 ), 2039-2044, 2013.
[143] Zhang, J. J., Sun, Q. Z., Liang, R. B., Jia, W. H., Li, X. L., Wo, J. H., Liu, D. M. and Shum, P.
P., Microfiber Fabry-Perot interferometer for dual-parameter sensing, J Lightwave Technol,
31(10), 1608-1615, 2013.
[144] Lee, C. L., Hsu, J. M., Horng, J. S., Sung, W. Y. and Li, C. M., Microcavity fiber Fabry-Perot
interferometer with an embedded golden thin film, Ieee Photonic Tech L, 25(9), 833-836, 2013.
[145] Ferreira, M. S., Bierlich, J., Unger, S., Schuster, K., Santos, J. L. and Frazao, O., Post-processing
of Fabry-Perot microcavity tip sensor, Ieee Photonic Tech L, 25(16), 1593-1596, 2013.

FCUP
Fiber Sensing Based on New Structures and Post-Processing Enhancement
164
[146] Zhao, Y., Wang, D. and Lv, R. Q., A novel optical fiber temperature sensor based on Fabry-Perot
cavity, Microw Opt Techn Let, 55(10), 2487-2490, 2013.
[147] Jin, L., Guan, B. O. and Wei, H. F., Sensitivity characteristics of Fabry-Perot pressure sensors
based on hollow-core microstructured fibers, J Lightwave Technol, 31(15), 2526-2532, 2013.
[148] Zou, X. T., Wu, N., Tian, Y., Zhang, Y., Fitek, J., Maffeo, M., Niezrecki, C., Chen, J. and
Wang, X. W., Ultrafast Fabry-Perot fiber-optic pressure sensors for multimedia blast event
measurements, Appl Optics, 52(6), 1248-1254, 2013.
[149] Lee, C. L., Chang, H. J., You, Y. W., Chen, G. H., Hsu, J. M. and Horng, J. S., Fiber Fabry-Perot
interferometers based on air-bubbles/liquid in hollow core fibers, Ieee Photonic Tech L, 26(8), 749-
752, 2014.
[150] Liu, S., Wang, Y. P., Liao, C. R., Wang, G. J., Li, Z. Y., Wang, Q., Zhou, J. T., Yang, K. M.,
Zhong, X. Y., Zhao, J. and Tang, J., High-sensitivity strain sensor based on in-fiber improved
Fabry-Perot interferometer, Opt Lett, 39(7), 2121-2124, 2014.
[151] Zhou, A., Qin, B. Y., Zhu, Z., Zhang, Y. X., Liu, Z. H., Yang, J. and Yuan, L. B., Hybrid
structured fiber-optic Fabry-Perot interferometer for simultaneous measurement of strain and
temperature, Opt Lett, 39(18), 5267-5270, 2014.
[152] Ferreira, M. S., Bierlich, J., Unger, S., Schuster, K., Santos, J. L. and Frazao, O., Optical phase
refractometer based on post-processed interferometric tip sensors, J Lightwave Technol, 32(17),
3002-3007, 2014.
[153] Pevec, S. and Donlagic, D., Miniature fiber-optic sensor for simultaneous measurement of pressure
and refractive index, Opt Lett, 39(21), 6221-6224, 2014.
[154] Andre, R. M., Pevec, S., Becker, M., Dellith, J., Rothhardt, M., Marques, M. B., Donlagic, D.,
Bartelt, H. and Frazao, O., Focused ion beam post-processing of optical fiber Fabry-Perot cavities
for sensing applications, Opt Express, 22(11), 13102-13108, 2014.
[155] Gao, S. C., Zhang, W. G., Bai, Z. Y., Zhang, H., Lin, W., Wang, L. and Li, J. L., Microfiber-
enabled in-line Fabry-Perot interferometer for high-sensitive force and refractive index sensing, J
Lightwave Technol, 32(9), 1682-1688, 2014.
[156] Ding, W. H. and Jiang, Y., Miniature photonic crystal fiber sensor for high-temperature
measurement, Ieee Sens J, 14(3), 786-789, 2014.
[157] Du, Y. Y., Qiao, X. G., Rong, Q. Z., Yang, H. Z., Feng, D. Y., Wang, R. H., Hu, M. L. and
Feng, Z. Y., A miniature Fabry-Perot interferometer for high temperature measurement using a
double-core photonic crystal fiber, Ieee Sens J, 14(4), 1069-1073, 2014.
[158] Liao, C. R., Liu, S., Xu, L., Wang, C., Wang, Y. P., Li, Z. Y., Wang, Q. and Wang, D. N., Sub-
micron silica diaphragm-based fiber-tip Fabry-Perot interferometer for pressure measurement, Opt
Lett, 39(10), 2827-2830, 2014.
[159] Eom, J., Park, C.-J., Lee, B. H., Lee, J.-H., Kwon, I.-B. and Chung, E., Fiber optic Fabry–Perot
pressure sensor based on lensed fiber and polymeric diaphragm, Sensors and Actuators A 225,
25–32, 2015.
[160] Lee, C.-L., Ho, H.-Y., Gu, J.-H., Yeh, T.-Y. and Tseng, C.-H., Dual hollow core fiber-based
Fabry–Perot interferometer for measuring the thermo-optic coefficients of liquids, Opt Lett, 40(4),
459-462, 2015.
[161] Sun, B., Wang, Y., Qu, J., Liao, C., Yin, G., He, J., Zhou, J., Tang, J., Liu, S., Li, Z. and Liu, Y.,
Simultaneous measurement of pressure and temperature by employing Fabry-Perot interferometer
based on pendant polymer droplet Opt Express, 23(3), 1906-1911, 2015.
[162] Wu, D., Huang, Y., Fu, J.-Y. and Wang, G.-Y., Fiber Fabry–Perot tip sensor based on multimode
photonic crystal fiber, Opt Commun, 338, 288–291, 2015.
[163] Li, Q. and Chen, H., Design of fiber magnetic field sensor based on fiber Bragg grating Fabry-Perot
cavity ring-down spectroscopy, Photonic Sensors, 2015.
[164] Pullteap, S. and Seat, H. C., An extrinsic fiber Fabry-Perot interferometer for dynamic
displacement measurement, Photonic Sensors, 5(1), 50-59, 2015.

FCUP
Fiber Sensing Based on New Structures and Post-Processing Enhancement
165
[165] Liu, S., Yang, K. M., Wang, Y. P., Qu, J. L., Liao, C. R., He, J., Li, Z. Y., Yin, G. L., Sun, B.,
Zhou, J. T., Wang, G. J., Tang, J. and Zhao, J., High-sensitivity strain sensor based on in-fiber
rectangular air bubble, Sci Rep-Uk, 5, 2015.
[166] Chen, Z., Yuan, L., Hefferman, G. and Wei, T., Ultraweak intrinsic Fabry-Perot cavity array for
distributed sensing, Opt Lett, 40(3), 320-323, 2015.
[167] Liu, G. G., Han, M. and Hou, W. L., High-resolution and fast-response fiber-optic temperature
sensor using silicon Fabry-Perot cavity, Opt Express, 23(6), 7237-7247, 2015.
[168] Liu, T. G., Yin, J. D., Jiang, J. F., Liu, K., Wang, S. and Zou, S. L., Differential-pressure-based
fiber-optic temperature sensor using Fabry-Perot interferometry, Opt Lett, 40(6), 1049-1052, 2015.
[169] Zhang, X. P. and Peng, W., Temperature-independent fiber salinity sensor based on Fabry-Perot
interference, Opt Express, 23(8), 10353-10358, 2015.
[170] Ferreira, M. S., Bierlich, J., Lehmann, H., Schuster, K., Kobelke, J., Santos, J. L. and Frazao,
O., Fabry-Perot cavity based on hollow-core ring photonic crystal fiber for pressure sensing, Ieee
Photonic Tech L, 24(23), 2122-2124, 2012.
[171] Bravo, J., Matias, I. R., Del Villar, I., Corres, J. M. and Arregui, F. J., Nanofilms on hollow core
fiber-based structures: An optical study, J Lightwave Technol, 24(5), 2100-2107, 2006.
[172] Tian, J. J., Lu, Y. J., Zhang, Q. and Han, M., Microfluidic refractive index sensor based on an all-
silica in-line Fabry-Perot interferometer fabricated with microstructured fibers, Opt Express, 21(5),
6633-6639, 2013.
[173] Duan, D. W., Rao, Y. J., Xu, L. C., Zhu, T., Deng, M., Wu, D. and Yao, J., In-fiber Fabry-Perot
and Mach-Zehnder interferometers based on hollow optical fiber fabricated by arc fusion splicing
with small lateral offsets, Opt Commun, 284(22), 5311-5314, 2011.
[174] Ferreira, M. S., Schuster, K., Kobelke, J., Santos, J. L. and Frazao, O., Spatial optical filter sensor
based on hollow-core silica tube, Opt Lett, 37(5), 890-892, 2012.
[175] Passaro, D., Foroni, M., Poli, F., Cucinotta, A., Selleri, S., Laegsgaard, J. and Bjarklev, A. O.,
All-silica hollow-core micro structured Bragg fibers for biosensor application, Ieee Sens J, 8(7-8),
1280-1286, 2008.
[176] Cox, F. M., Argyros, A. and Large, M. C. J., Liquid-filled hollow core microstructured polymer
optical fiber, Opt Express, 14(9), 4135-4140, 2006.
[177] Yan, H., Gua, C., Yang, C. X., Liu, J., Jin, G. F., Zhang, J. T., Hou, L. T. and Yao, Y., Hollow
core photonic crystal fiber surface-enhanced Raman probe, Appl Phys Lett, 89(20), 2006.
[178] Smolka, S., Barth, M. and Benson, O., Highly efficient fluorescence sensing with hollow core
photonic crystal fibers, Opt Express, 15(20), 12783-12791, 2007.
[179] Zhang, Y., Shi, C., Gu, C., Seballos, L. and Zhang, J. Z., Liquid core photonic crystal fiber sensor
based on surface enhanced Raman scattering, Appl Phys Lett, 90(19), 2007.
[180] Shi, C., Lu, C., Gu, C., Tian, L., Newhouse, R., Chen, S. W. and Zhang, J. Z., Inner wall coated
hollow core waveguide sensor based on double substrate surface enhanced Raman scattering, Appl
Phys Lett, 93(15), 2008.
[181] Ritari, T., Tuominen, J., Ludvigsen, H., Petersen, J. C., Sorensen, T., Hansen, T. P. and
Simonsen, H. R., Gas sensing using air-guiding photonic bandgap fibers, Opt Express, 12(17),
4080-4087, 2004.
[182] Hoo, Y. L., Jin, W., Ho, H. L., Ju, J. and Wang, D. N., Gas diffusion measurement using hollow-
core photonic bandgap fiber, Sensor Actuat B-Chem, 105(2), 183-186, 2005.
[183] Shavrin, I., Novotny, S., Shevchenko, A. and Ludvigsen, H., Gas refractometry using a hollow-
core photonic bandgap fiber in a Mach-Zehnder-type interferometer, Appl Phys Lett, 100(5), 2012.
[184] Zhao, Y., Lv, R. Q., Ying, Y. and Wang, Q., Hollow-core photonic crystal fiber Fabry-Perot sensor
for magnetic field measurement based on magnetic fluid, Opt Laser Technol, 44(4), 899-902, 2012.
[185] Aref, S. H., Amezcua-Correa, R., Carvalho, J. P., Frazao, O., Caldas, P., Santos, J. L., Araujo,
F. M., Latifi, H., Farahi, F., Ferreira, L. A. and Knight, J. C., Modal interferometer based on
FCUP
Fiber Sensing Based on New Structures and Post-Processing Enhancement
166
hollow-core photonic crystal fiber for strain and temperature measurement, Opt Express, 17(21),
18669-18675, 2009.
[186] Kim, G., Cho, T. Y., Hwang, K., Lee, K., Lee, K. S., Han, Y. G. and Lee, S. B., Strain and
temperature sensitivities of an elliptical hollow-core photonic bandgap fiber based on Sagnac
interferometer, Opt Express, 17(4), 2481-2486, 2009.
[187] Lu, Y. J., Han, M. and Tian, J. J., Fiber-optic temperature sensor using a Fabry-Perot cavity filled
with gas of variable pressure, Ieee Photonic Tech L, 26(8), 757-760, 2014.
[188] Zhu, Y. Z. and Wang, A. B., Miniature fiber-optic pressure sensor, Ieee Photonic Tech L, 17(2),
447-449, 2005.
[189] Coelho, L., Tafulo, P. A. R., Jorge, P. A. S., Santos, J. L., Viegas, D., Schuster, K., Kobelke, J.
and Frazao, O., Simultaneous measurement of partial pressure of O2 and CO2 with a hybrid
interferometer, Opt Lett, 37(15), 3063-3065, 2012.
[190] Bae, H. and Yu, M., Miniature Fabry-Perot pressure sensor created by using UV-molding process
with an optical fiber based mold, Opt Express, 20(13), 14573-14583, 2012.
[191] Bae, H. D., Yun, D., Liu, H. J., Olson, D. A. and Yu, M., Hybrid miniature Fabry-Perot sensor
with dual optical cavities for simultaneous pressure and temperature measurements, J Lightwave
Technol, 32(8), 1585-1593, 2014.
[192] Tian, F., He, Z. H. and Du, H., Numerical and experimental investigation of long-period gratings
in photonic crystal fiber for refractive index sensing of gas media, Opt Lett, 37(3), 380-382, 2012.
[193] Fliessbach, T., Curso de física estatística, 3rd ed., Fundação Calouste Gulbenkian, 2000.
[194] Edlén, B., The refractive index of air, Metrologia, 2(2), 71-80, 1966.
[195] Bradley, C. C. and Gebbie, H. A., Refractive index of nitrogen, water vapor, and their mixtures at
submillimeter wavelengths, Appl Optics, 10(4), 755-&, 1971.
[196] Simmons, A. C., Refractive-index and Lorentz-Lorenz functions of propane, nitrogen and carbon-
dioxide in spectral range 15803-22002 cm-1 and at 944 cm-1, Opt Commun, 25(2), 211-214, 1978.
[197] Achtermann, H. J., Hong, J. G., Wagner, W. and Pruss, A., Refractive-index and density
isotherms for methane from 273 K to 373 K and at pressures up to 34 Mpa, J Chem Eng Data,
37(4), 414-418, 1992.
[198] Ciddor, P. E., Refractive index of air: New equations for the visible and near infrared, Appl Optics,
35(9), 1566-1573, 1996.
[199] Birch, K. P. and Downs, M. J., An updated Edlen equation for the refractive-index of air,
Metrologia, 30(3), 155-162, 1993.
[200] Zhang, J., Lu, Z. H. and Wang, L. J., Precision refractive index measurements of air, N2, O2, Ar,
and CO2 with a frequency comb, Appl Optics, 47(17), 3143-3151, 2008.
[201] Birch, K. P. and Downs, M. J., Correction to the updated Edlen equation for the refractive-index of
air, Metrologia, 31(4), 315-316, 1994.
[202] Bonsch, G. and Potulski, E., Measurement of the refractive index of air and comparison with
modified Edlen's formulae, Metrologia, 35(2), 133-139, 1998.
[203] Peck, E. R. and Khanna, B. N., Dispersion of nitrogen, J Opt Soc Am, 56(8), 1059-&, 1966.
[204] Wright, J. D., Gas property equations for NIST fluid flow goup gas flow measurement
calibration services, in, National Institute of Standards and Technology (NIST), 2004.
[205] Hilsenrath, J., Beckett, C. W., Benedict, W. S., Fano, L., Hoge, H. J., Masi, J. F., Nuttal, R. L.,
Touloukian, Y. S. and Woolley, H. W., Tables of thermal properties of gases, U.S.
Government Printing Office, 1955.
[206] Frazao, O., Carvalho, J. P. and Salgado, H. M., Low-loss splice in a microstructured fibre using a
conventional fusion splicer, Microw Opt Techn Let, 46(2), 172-174, 2005.
[207] Pal, B. P., Optical waveguide sensors, in: Handbook of optical sensors, CRC Press, Taylor &
Francis Group, 2015.
[208] Roriz, P., Ferreira, M. S., Schuster, K., Kobelke, J. and Frazao, O., A Fabry-Perot sensor
prototype for low-pressure measurements, Microw Opt Techn Let, 56(12), 2981-2984, 2014.

FCUP
Fiber Sensing Based on New Structures and Post-Processing Enhancement
167
[209] Hecht, E., Óptica, 3rd ed., Fundação Calouste Gulbenkian, 2002.
[210] Kawakami, S. and Nishida, S., Anomalous dispersion of new doubly clad optical fiber, Electron
Lett, 10(4), 38-40, 1974.
[211] Kawakami, S. and Nishida, S., Characteristics of a doubly clad optical fiber with a low-index inner
cladding, Ieee J Quantum Elect, Qe10(12), 879-887, 1974.
[212] Stolen, R. H., Ramaswamy, V., Kaiser, P. and Pleibel, W., Linear polarization in birefringent
single-mode fibers, Appl Phys Lett, 33(8), 699-701, 1978.
[213] Snitzer, E., Po, H., Hakimi, F., Tumminelli, R. and McCollum, B. C., Double-clad, offset-core
Nd fiber laser, in: Optical Fiber Sensors, New Orleans, Louisiana United States, 1988, PD5.
[214] Jeong, Y., Sahu, J. K., Payne, D. N. and Nilsson, J., Ytterbium-doped large-core fiber laser with
1.36 kW continuous-wave output power, Opt Express, 12(25), 6088-6092, 2004.
[215] Marhic, M. E., Amplification and lasing in optical fibers, in: L. Thévenaz (Ed.) Advanced
fiber optics, EPFL Press, 2011, 171-194.
[216] Salhi, M., Leblond, H. and Sanchez, F., High power tunable all fiber double-clad Er : Yb : silicate
fiber laser, Opt Commun, 247(1-3), 181-185, 2005.
[217] Hirano, Y., Shoji, Y., Kasahara, K., Yoshida, M. and Hisada, Y., Multiwatt operation of
square-shaped double-clad Nd-doped fiber amplifier, in: CLEO, 1998, CTh058.
[218] Po, H., Cao, J. D., Laliberte, B. M., Minns, R. A., Robinson, R. F., Rockney, B. H., Tricca, R. R.
and Zhang, Y. H., High-power neodymium-doped single transverse-mode fiber laser, Electron Lett,
29(17), 1500-1501, 1993.
[219] Li, Y. H., Jackson, S. D. and Fleming, S., High absorption and low splice loss properties of
hexagonal double-clad fiber, Ieee Photonic Tech L, 16(11), 2502-2504, 2004.
[220] Fu, L., Jain, A., Xie, H. K., Cranfield, C. and Gu, M., Nonlinear optical endoscopy based on a
double-clad photonic crystal fiber and a MEMS mirror, Opt Express, 14(3), 1027-1032, 2006.
[221] Han, Q., Lan, X. W., Huang, J., Kaur, A., Wei, T., Gao, Z. and Xiao, H., Long-period grating
inscribed on concatenated double-clad and single-clad fiber for simultaneous measurement of
temperature and refractive index, Ieee Photonic Tech L, 24(13), 1130-1132, 2012.
[222] Pang, F. F., Liu, H. H., Chen, N., Liu, Y. Q., Zeng, X. L., Chen, Z. Y. and Wang, T. Y.,
Cladding-mode resonance of a double-cladding fiber at a near modal cut-off wavelength for RI
sensing, Meas Sci Technol, 21(9), 2010.
[223] Liu, H. H., Pang, F. F., Guo, H. R., Cao, W. X., Liu, Y. Q., Chen, N., Chen, Z. Y. and Wang, T.
Y., In-series double cladding fibers for simultaneous refractive index and temperature measurement,
Opt Express, 18(12), 13072-13082, 2010.
[224] Baiad, M. D., Gagne, M., Madore, W. J., De Montigny, E., Godbout, N., Boudoux, C. and
Kashyap, R., Surface plasmon resonance sensor interrogation with a double-clad fiber coupler and
cladding modes excited by a tilted fiber Bragg grating, Opt Lett, 38(22), 4911-4914, 2013.
[225] Baiad, M. D., Gagne, M., Lemire-Renaud, S., De Montigny, E., Madore, W. J., Godbout, N.,
Boudoux, C. and Kashyap, R., Capturing reflected cladding modes from a fiber Bragg grating with
a double-clad fiber coupler, Opt Express, 21(6), 6873-6879, 2013.
[226] Bierlich, J., Kobelke, J., Brand, D., Kirsch, K., Dellith, J. and Bartelt, H., Nanoscopic tip sensors
fabricated by gas phase etching of optical glass fibers, Photonic Sensors, 2, 331-339, 2012.
[227] Kell, G. S., Precise representation of volume properties of water at 1 atmosphere, J Chem Eng Data,
12(1), 66-&, 1967.
[228] Olson, J. D. and Horne, F. H., Direct determination of temperature-dependence of refractive-index
of liquids, B Am Phys Soc, 18(3), 406-406, 1973.
[229] Abbate, G., Bernini, U., Ragozzino, E. and Somma, F., Temperature-dependence of refractive-
index of water, J Phys D Appl Phys, 11(8), 1167-1172, 1978.
[230] Thormahlen, I., Straub, J. and Grigull, U., Refractive-index of water and its dependence on
wavelength, temperature, and density, J Phys Chem Ref Data, 14(4), 933-946, 1985.
[231] Rao, Y. J., In-fibre Bragg grating sensors, Meas Sci Technol, 8(4), 355-375, 1997.

FCUP
Fiber Sensing Based on New Structures and Post-Processing Enhancement
168
[232] Rao, Y. J., Duan, D. W., Fan, Y. E., Ke, T. and Xu, M., High-temperature annealing behaviors of
CO2 laser pulse-induced long-period fiber grating in a photonic crystal fiber, J Lightwave Technol,
28(10), 1530-1535, 2010.
[233] Mihailov, S. J., Fiber Bragg grating sensors for harsh environments, Sensors-Basel, 12(2), 1898-
1918, 2012.
[234] Martinez, A., Khrushchev, I. Y. and Bennion, I., Thermal properties of fibre Bragg gratings
inscribed point-by-point by infrared femtosecond laser, Electron Lett, 41(4), 176-178, 2005.
[235] Martinez, A., Dubov, M., Khrushchev, I. and Bennion, I., Direct writing of fibre Bragg gratings
by femtosecond laser, Electron Lett, 40(19), 1170-1172, 2004.
[236] Wang, Y. P., Qiao, X. G., Yang, H. Z., Su, D., Li, L. and Guo, T., Sensitivity-improved strain
sensor over a large range of temperatures ysing an etched and regenerated fiber Bragg grating,
Sensors-Basel, 14(10), 18575-18582, 2014.
[237] Frazao, O., Silva, S. F. O., Guerreiro, A., Santos, J. L., Ferreira, L. A. and Araujo, F. M., Strain
sensitivity control of fiber Bragg grating structures with fused tapers, Appl Optics, 46(36), 8578-
8582, 2007.
[238] Mazurin, O., Streltsina, M. and Shvaiko-Shvaikovskaia, T., Handbook of glass data. Part A:
silica glass and binary silicate glasses, 1983.
[239] Bucaro, J. A. and Dardy, H. D., High-temperature Brillouin-scattering in fused quartz, J Appl
Phys, 45(12), 5324-5329, 1974.
[240] Mihailov, S. J., Grobnic, D., Smelser, C. W., Lu, P., Walker, R. B. and Ding, H. M., Bragg
grating inscription in various optical fibers with femtosecond infrared lasers and a phase mask, Opt
Mater Express, 1(4), 754-765, 2011.
[241] Grobnic, D., Smelser, C. W., Mihailov, S. J. and Walker, R. B., Long-term thermal stability tests
at 1000 degrees C of silica fibre Bragg gratings made with ultrafast laser radiation, Meas Sci
Technol, 17(5), 1009-1013, 2006.
[242] Snitzer, E., Proposed fiber cavities for optical masers, J Appl Phys, 32(1), 36-&, 1961.
[243] Kim, H. K., Kim, S. K., Park, H. G. and Kim, B. Y., Polarimetric fiber laser sensors, Opt Lett,
18(4), 317-319, 1993.
[244] Park, J. S., Yun, S. H., Ahn, S. J. and Kim, B. Y., Polarization- and frequency-stable fiber laser for
magnetic-field sensing, Opt Lett, 21(14), 1029-1031, 1996.
[245] Melle, S. M., Alavie, A. T., Karr, S., Coroy, T., Liu, K. X. and Measures, R. M., A Bragg
grating-tuned fiber laser strain sensor system, Ieee Photonic Tech L, 5(2), 263-266, 1993.
[246] Koo, K. P. and Kersey, A. D., Bragg grating-based laser sensors systems with interferometric
interrogation and wavelength-division multiplexing, J Lightwave Technol, 13(7), 1243-1249,
1995.
[247] Mandal, J., Pal, S., Sun, T., Grattan, K. T. V., Augousti, A. T. and Wade, S. A., Bragg grating-
based fiber-optic laser probe for temperature sensing, Ieee Photonic Tech L, 16(1), 218-220, 2004.
[248] Guan, B. O., Tam, H. Y., Lau, S. T. and Chan, H. L. W., Ultrasonic hydrophone based on
distributed Bragg reflector fiber laser, Ieee Photonic Tech L, 17(1), 169-171, 2005.
[249] Arellano-Sotelo, H., Barmenkov, Y. O. and Kir'yanov, A. V., The use of erbium fiber laser
relaxation frequency for sensing refractive index and solute concentration of aqueous solutions,
Laser Phys Lett, 5(11), 825-829, 2008.
[250] Idris, S. M., Abdullah, F., Al-Mansoori, M. H., Jamaludin, M. Z. and Din, N. M., Pressure
sensing utilizing linear cavity erbium-doped fiber laser, Laser Phys, 20(4), 855-858, 2010.
[251] Wo, J. H., Jiang, M., Malnou, M., Sun, Q. Z., Zhang, J. J., Shum, P. P. and Liu, D. M., Twist
sensor based on axial strain insensitive distributed Bragg reflector fiber laser, Opt Express, 20(3),
2844-2850, 2012.
[252] Kringlebotn, J. T., Loh, W. H. and Laming, R. I., Polarimetric Er3+-doped fiber distributed-
feedback laser sensor for differential pressure and force measurements, Opt Lett, 21(22), 1869-1871,
1996.

FCUP
Fiber Sensing Based on New Structures and Post-Processing Enhancement
169
[253] Hadeler, O., Ronnekleiv, E., Ibsen, M. and Laming, R. I., Polarimetric distributed feedback fiber
laser sensor for simultaneous strain and temperature measurements, Appl Optics, 38(10), 1953-
1958, 1999.
[254] Lovseth, S. W., Kringlebotn, J. T., Ronnekleiv, E. and Blotekjaer, K., Fiber distributed-feedback
lasers used as acoustic sensors in air, Appl Optics, 38(22), 4821-4830, 1999.
[255] Tanaka, S., Ogawa, T., Thongnum, W., Takahashi, N. and Takahashi, S., Thermally stabilized
fiber-Bragg-grating vibration sensor using erbium-doped fiber laser, Jpn J Appl Phys 1, 42(5b),
3060-3062, 2003.
[256] Frazao, O., Correia, C., Baptista, J. M., Marques, M. B. and Santos, J. L., Ring fibre laser with
interferometer based in long period grating for sensing applications, Opt Commun, 281(22), 5601-
5604, 2008.
[257] Shi, L. L., Zhu, T., Fan, Y. E., Chiang, K. S. and Rao, Y. J., Torsion sensing with a fiber ring laser
incorporating a pair of rotary long-period fiber gratings, Opt Commun, 284(22), 5299-5302, 2011.
[258] Wei, S., Zhang, W., Shang, J. and Yin, L., Torsion sensing characteristics of fibre ring laser based
on nonlinear polarisation rotation, Electron Lett, 48(2), 116-U1227, 2012.
[259] Lima, S. E. U., Farias, R. G., Araujo, F. M., Ferreira, L. A., Santos, J. L., Miranda, V. and
Frazao, O., Fiber laser sensor based on a phase-shifted chirped grating for acoustic sensing of partial
discharges, Photonic Sensors, 3(1), 44-51, 2013.
[260] Abdullah, F., Idris, S. M., Jamaludin, M. Z. and Al-Mansoori, M. H., Hybrid erbium-doped
fiber laser-pressure sensor utilizing ring cavity, Laser Phys, 21(6), 1099-1102, 2011.
[261] Zhou, K. J. and Ruan, Y. F., Fiber ring laser employing an all-polarization-maintaining loop
periodic filter, Laser Phys, 20(6), 1449-1452, 2010.
[262] Sun, G., Chung, Y. and Moon, D. S., L-band tunable multiwavelength fiber laser using an
unpumped polarization maintaining an erbium-ytterbium double-clad fiber-loop mirror, Laser Phys,
18(10), 1196-1199, 2008.
[263] Liang, P. S., Zhang, Z. X., Kuang, Q. Q. and Sang, M. H., All-fiber birefringent filter with fine
tunability and changeable spacing, Laser Phys, 19(11), 2124-2128, 2009.
[264] Kim, B. K. and Chung, Y., Tunable and switchable SOA-based multi-wavelength fiber laser using
twin-core photonic crystal fiber, Laser Phys Lett, 9(10), 734-738, 2012.
[265] Tan, S. J., Harun, S. W., Shahabuddin, N. S., Arof, H. and Ahmad, H., Dual-cavity dual-output
multi-wavelength fiber laser based on nonlinear polarization rotation effect, Laser Phys, 22(10),
1601-1605, 2012.
[266] Erdogan, T., Fiber grating spectra, J Lightwave Technol, 15(8), 1277-1294, 1997.
[267] Kersey, A. D., Davis, M. A., Patrick, H. J., LeBlanc, M., Koo, K. P., Askins, C. G., Putnam, M.
A. and Friebele, E. J., Fiber grating sensors, J Lightwave Technol, 15(8), 1442-1463, 1997.
[268] Zhang, J., Shum, P., Cheng, X. P., Ngo, N. Q. and Li, S. Y., Analysis of linearly tapered fiber
Bragg grating for dispersion slope compensation, Ieee Photonic Tech L, 15(10), 1389-1391, 2003.
[269] Zhang, Q., Ianno, N. J. and Han, M., Fiber-optic refractometer based on an etched high-Q -phase-
shifted fiber Bragg grating, Sensors-Basel, 13(7), 8827-8834, 2013.
[270] Romero, R., Frazao, O., Pereira, D. A., Salgado, H. M., Araujo, F. M. and Ferreira, L. A.,
Intensity-referenced and temperature-independent curvature-sensing concept based on chirped fiber
Bragg gratings, Appl Optics, 44(18), 3821-3826, 2005.
[271] Cranch, G. A., Fiber-optic sensor multiplexing principles in: J.L. Santos, F. Farahi (Eds.)
Handbook of optical sensors, CRC Press, Taylor & Francis Group, 2015.
[272] Frazao, O., Baptista, J. M. and Santos, J. L., Temperature-independent strain sensor based on a
Hi-Bi photonic crystal fiber loop mirror, Ieee Sens J, 7(9-10), 1453-1455, 2007.
[273] Righini, G. C., Dumeige, Y., Feron, P., Ferrari, M., Conti, G. N., Ristic, D. and Soria, S.,
Whispering gallery mode microresonators: Fundamentals and applications, Riv Nuovo Cimento,
34(7), 435-488, 2011.

FCUP
Fiber Sensing Based on New Structures and Post-Processing Enhancement
170
[274] Knight, J. C., Cheung, G., Jacques, F. and Birks, T. A., Phase-matched excitation of whispering-
gallery-mode resonances by a fiber taper, Opt Lett, 22(15), 1129-1131, 1997.
[275] Kapitonov, A. M. and Astratov, V. N., Observation of nanojet-induced modes with small
propagation losses in chains of coupled spherical cavities, Opt Lett, 32(4), 409-411, 2007.
[276] Yang, S. and Astratov, V. N., Photonic nanojet-induced modes in chains of size-disordered
microspheres with an attenuation of only 0.08 dB per sphere, Appl Phys Lett, 92(26), 2008.
[277] Kato, D., Light coupling from a stripe-geometry GaAs diode laser into an optical fiber with spherical
end, J Appl Phys, 44(6), 2756-2758, 1973.
[278] Paek, U. C. and Weaver, A. L., Formation of a spherical lens at optical fiber ends with a CO2 laser,
Appl Optics, 14(2), 294-298, 1975.
[279] Tanaka, A., Asai, T., Toubaru, K., Takashima, H., Fujiwara, M., Okamoto, R. and Takeuchi,
S., Phase shift spectra of a fiber-microsphere system at the single photon level, Opt Express, 19(3),
2278-2285, 2011.
[280] Wang, P. F., Lee, T., Ding, M., Dhar, A., Hawkins, T., Foy, P., Semenova, Y., Wu, Q., Sahu, J.,
Farrell, G., Ballato, J. and Brambilla, G., Germanium microsphere high-Q resonator, Opt Lett,
37(4), 728-730, 2012.
[281] Cai, M. and Vahala, K., Highly efficient hybrid fiber taper coupled microsphere laser, Opt Lett,
26(12), 884-886, 2001.
[282] White, I. M., Hanumegowda, N. M., Oveys, H. and Fan, X. D., Tuning whispering gallery
modes in optical microspheres with chemical etching, Opt Express, 13(26), 10754-10759, 2005.
[283] Totsuka, K. and Tomita, M., Slow and fast light in a microsphere-optical fiber system, J Opt Soc
Am B, 23(10), 2194-2199, 2006.
[284] Fan, K. C., Hsu, H. Y., Hung, P. Y. and Wang, W. L., Experimental study of fabricating a
microball tip on an optical fibre, J Opt a-Pure Appl Op, 8(9), 782-787, 2006.
[285] Ma, J., Ju, J., Jin, L., Jin, W. and Wang, D. N., Fiber-tip micro-cavity for temperature and
transverse load sensing, Opt Express, 19(13), 12418-12426, 2011.
[286] Wang, M. M., Jiang, L., Wang, S. M., Tan, X. D. and Lu, Y. F., A robust fiber inline
interferometer sensor based on a core-offset attenuator and a microsphere-shaped splicing junction,
Opt Laser Technol, 63, 76-82, 2014.
[287] Dong, C. H., He, L., Xiao, Y. F., Gaddam, V. R., Ozdemir, S. K., Han, Z. F., Guo, G. C. and
Yang, L., Fabrication of high-Q polydimethylsiloxane optical microspheres for thermal sensing,
Appl Phys Lett, 94(23), 2009.
[288] von Klitzing, W., Jahier, E., Long, R., Lissillour, F., Lefevre-Seguin, V., Hare, J., Raimond, J.
M. and Haroche, S., Very low threshold lasing in Er3+ doped ZBLAN microsphere, Electron Lett,
35(20), 1745-1746, 1999.
[289] Hayakawa, T., Ooishi, H. and Nogami, M., Optical bistability of stimulated-emission lines in
Sm3+-doped glass microspheres, Opt Lett, 26(2), 84-86, 2001.
[290] Elliott, G. R., Hewak, D. W., Murugan, G. S. and Wilkinson, J. S., Chalcogenide glass
microspheres; their production, characterization and potential, Opt Express, 15(26), 17542-17553,
2007.
[291] Ward, J. M., Wu, Y. Q., Khalfi, K. and Chormaic, S. N., Short vertical tube furnace for the
fabrication of doped glass microsphere lasers, Rev Sci Instrum, 81(7), 2010.
[292] Hutchens, T. C., Darafsheh, A., Fardad, A., Antoszyk, A. N., Ying, H. S., Astratov, V. N. and
Fried, N. M., Characterization of novel microsphere chain fiber optic tips for potential use in
ophthalmic laser surgery, J Biomed Opt, 17(6), 2012.
[293] Kosma, K., Zito, G., Schuster, K. and Pissadakis, S., Whispering gallery mode microsphere
resonator integrated inside a microstructured optical fiber, Opt Lett, 38(8), 1301-1303, 2013.
[294] Braginsky, V. B., Gorodetsky, M. L. and Ilchenko, V. S., Quality-factor and nonlinear properties
of optical whispering-gallery modes, Phys Lett A, 137(7-8), 393-397, 1989.

FCUP
Fiber Sensing Based on New Structures and Post-Processing Enhancement
171
[295] Ilchenko, V. S., Gorodetsky, M. L. and Vyatchanin, S. P., Coupling and tunability of optical
whispering-gallery modes - a basis for coordinate meter, Opt Commun, 107(1-2), 41-48, 1994.
[296] Gorodetsky, M. L., Savchenkov, A. A. and Ilchenko, V. S., Ultimate Q of optical microsphere
resonators, Opt Lett, 21(7), 453-455, 1996.
[297] Dubreuil, N., Knight, J. C., Leventhal, D. K., Sandoghdar, V., Hare, J. and Lefevre, V., Eroded
monomode optical-fiber for whispering-gallery made excitation in fused-silica microspheres, Opt
Lett, 20(8), 813-815, 1995.
[298] Serpenguzel, A., Arnold, S. and Griffel, G., Excitation of resonances of microspheres on an optical
fiber, Opt Lett, 20(7), 654-656, 1995.
[299] Ilchenko, V. S., Yao, X. S. and Maleki, L., Pigtailing the high-Q microsphere cavity: a simple fiber
coupler for optical whispering-gallery modes, Opt Lett, 24(11), 723-725, 1999.
[300] Vernooy, D. W., Furusawa, A., Georgiades, N. P., Ilchenko, V. S. and Kimble, H. J., Cavity
QED with high-Q whispering gallery modes, Phys Rev A, 57(4), R2293-R2296, 1998.
[301] Kippenberg, T. J. and Vahala, K. J., Cavity opto-mechanics, Opt Express, 15(25), 17172-17205,
2007.
[302] Ward, J. and Benson, O., WGM microresonators: sensing, lasing and fundamental optics with
microspheres, Laser Photonics Rev, 5(4), 553-570, 2011.
[303] Li, H. Y., Hao, S., Qiang, L. S., Li, J. and Zhang, Y. D., Observation of whispering gallery modes
in microtube-microspheres system, Appl Phys Lett, 102(23), 2013.
[304] Wang, H. Z., Lan, X. W., Huang, J., Yuan, L., Kim, C. W. and Xiao, H., Fiber pigtailed thin wall
capillary coupler for excitation of microsphere WGM resonator, Opt Express, 21(13), 15834-15839,
2013.
[305] Soria, S., Berneschi, S., Brenci, M., Cosi, F., Conti, G. N., Pelli, S. and Righini, G. C., Optical
microspherical resonators for biomedical sensing, Sensors-Basel, 11(1), 785-805, 2011.
[306] Ward, J. M. and Chormaic, S. N., Thermo-optical tuning of whispering gallery modes in Er:Yb co-
doped phosphate glass microspheres, Appl Phys B-Lasers O, 100(4), 847-850, 2010.
[307] Ma, R., Schliesser, A., Del'Haye, P., Dabirian, A., Anetsberger, G. and Kippenberg, T. J.,
Radiation-pressure-driven vibrational modes in ultrahigh-Q silica microspheres, Opt Lett, 32(15),
2200-2202, 2007.
[308] Allen, K. W., Darafsheh, A., Abolmaali, F., Mojaverian, N., Limberopoulos, N. I., Lupu, A.
and Astratov, V. N., Microsphere-chain waveguides: Focusing and transport properties, Appl
Phys Lett, 105(2), 2014.
[309] Darafsheh, A., Fardad, A., Fried, N. M., Antoszyk, A. N., Ying, H. S. and Astratov, V. N.,
Contact focusing multimodal microprobes for ultraprecise laser tissue surgery, Opt Express, 19(4),
3440-3448, 2011.
[310] Dantham, V. R., Bisht, P. B. and Namboodiri, C. K. R., Enhancement of Raman scattering by
two orders of magnitude using photonic nanojet of a microsphere, J Appl Phys, 109(10), 2011.
[311] Riedl, M., Optical design fundamentals for infrared systems, Second ed., SPIE Press,
Bellingham, WA, 2001.
[312] Darafsheh, A. and Astratov, V. N., Periodically focused modes in chains of dielectric spheres,
Appl Phys Lett, 100(6), 2012.
[313] Darafsheh, A., Mojaverian, N., Limberopoulos, N. I., Allen, K. W., Lupu, A. and Astratov, V.
N., Formation of polarized beams in chains of dielectric spheres and cylinders, Opt Lett, 38(20),
4208-4211, 2013.
[314] Jewell, J. M., Thermooptic coefficients of some standard reference material glasses, J Am Ceram
Soc, 74(7), 1689-1691, 1991.
[315] Schuster, K., Unger, S., Aichele, C., Lindner, F., Grimm, S., Litzkendorf, D., Kobelke, J.,
Bierlich, J., Wondraczek, K. and Bartelt, H., Material and technology trends in fiber optics, Adv.
Opt. Techn., 3(4 ), 447–468, 2014.

FCUP
Fiber Sensing Based on New Structures and Post-Processing Enhancement
172
[316] Lee, G. C. B., Su, S., Li, J. L., Sugden, K., Roohpour, N., Yan, H. X. and Ye, H. T., Analysis of
femtosecond laser surface patterning on bulk single-crystalline diamond, J Exp Nanosci, 7(6), 662-
672, 2012.
[317] Su, S., Li, J. L., Lee, G. C. B., Sugden, K., Webb, D. and Ye, H. T., Femtosecond laser-induced
microstructures on diamond for microfluidic sensing device applications, Appl Phys Lett, 102(23),
2013.
[318] Rothhardt, M., Chojetzki, C. and Mueller, H. R., High mechanical strength single-pulse draw
tower gratings, Photonics North: Applications of Photonic Technology, Pts 1 and 2, 5579, 127-
135, 2004.
[319] Wieduwilt, T., Bruckner, S. and Bartelt, H., High force measurement sensitivity with fiber Bragg
gratings fabricated in uniform-waist fiber tapers, Meas Sci Technol, 22(7), 2011.