Embed Size (px)
Citation preview
COMPOSITES
www.elsevier.com/locate/compscitech
Composites Science and Technology 67 (2007) 2795–2806
SCIENCE ANDTECHNOLOGY
Mechanical behavior of unidirectional fiber-reinforced polymersunder transverse compression: Microscopic
mechanisms and modeling
Carlos Gonzalez, Javier LLorca *
Departamento de Ciencia de Materiales, Universidad Politecnica de Madrid & Instituto Madrileno de Estudios Avanzados en Materiales
(IMDEA-Materiales) E.T.S. de Ingenieros de Caminos, 28040 Madrid, Spain
Received 1 December 2006; received in revised form 2 February 2007; accepted 2 February 2007Available online 15 February 2007
Abstract
The mechanical behavior of polymer–matrix composites unidirectionally reinforced with carbon or glass fibers subjected to compres-sion perpendicular to the fibers was studied using computational micromechanics. The stress–strain curve was determined by the finiteelement analysis of a representative volume element of the microstructure idealized as a random dispersion of parallel fibers embedded inthe polymeric matrix. The dominant damage mechanisms experimentally observed – interface decohesion and matrix plastic deformation– were included in the simulations, and a parametrical study was carried out to assess the influence of matrix and interface properties onthe stress–strain curve, compressive strength, ductility and the corresponding failure modes. It was found that the composite propertiesunder transverse compression were mainly controlled by interface strength and the matrix yield strength in uniaxial compression. Twodifferent fracture modes were identified, depending on whether failure was controlled by the nucleation of interface cracks or by the for-mation of matrix shear bands. Other parameters, such as matrix friction angle, interface fracture energy or thermo-elastic residual stres-ses, played a secondary role in the composite mechanical behavior.� 2007 Elsevier Ltd. All rights reserved.
Keywords: Computational micromechanics; Interface fracture; Transverse compression; Fiber-reinforced polymers
1. Introduction
Unidirectional fiber-reinforced polymers show outstand-ing specific stiffness and strength along the fiber directionand this has led to a wide range of applications as struc-tural materials. Moreover, the fiber and matrix behaviorfollows very closely the isostrain approximation until theonset of failure and it was possible to develop analyticalmodels to accurately predict the tensile [1–3] and compres-sive [4,5] strength in the fiber direction. Conversely, themechanical behavior under transverse loading cannot berepresented by simplified isostrain or isostress approaches,and micromechanical models capable of predicting failurestrength as a function of the constituent properties, volume
0266-3538/$ - see front matter � 2007 Elsevier Ltd. All rights reserved.
doi:10.1016/j.compscitech.2007.02.001
* Corresponding author. Tel.: +34 91 336 5375; fax: +34 91 543 7845.E-mail address: [email protected] (J. LLorca).
fraction, shape and spatial distribution are not available.This is an important limitation because the experimentalcharacterization of the lamina properties in the transversedirection is subjected to more uncertainties than in the lon-gitudinal one and, in fact, experimental data are morescarce. In addition, the longitudinal compressive strengthis severely affected by the transverse behavior [5,6], andthe development of robust failure criteria for laminateswhich include the interaction between longitudinal andtransverse stresses have to rely on a precise knowledge ofthe lamina behavior under transverse loading until failure.
Computational micromechanics is emerging as an accu-rate tool to study the mechanical behavior of compositesdue to the sophistication of the modeling tools and to theever-increasing power of digital computers. Within thisframework, the macroscopic properties of a compositelamina can be obtained by means of the numerical simula-
2796 C. Gonzalez, J. LLorca / Composites Science and Technology 67 (2007) 2795–2806
tion of the deformation and failure of a representative vol-ume element of the microstructure [7–10]. As comparedwith the classic homogenization techniques, computationalmicromechanics presents two important advantages.Firstly, the influence of the geometry and spatial distribu-tion of the phases (i.e. size, shape, clustering, connectivity,etc.) can be accurately taken into account. Secondly, thedetails of the stress and strain microfields throughout themicrostructure are resolved, which leads to precise estima-tions of the onset and propagation of damage, and to accu-rate predictions of the failure strength. Recent advances inthis area include the analysis of the effect of particle shape[11], particle clustering [12,13] and the influence of damage[14,15] on the mechanical behavior of particle-reinforcedcomposites, the prediction of the mechanical behavior offoams and composites whose microstructure was obtainedby means of X-ray computer-assisted tomography [16,17],or the computer simulation of ‘‘virtual fracture tests’’ infiber-reinforced composites [18,19].
This strategy is applied in this investigation to analyzethe mechanical behavior of a unidirectional fiber-rein-forced polymer composite subjected to transverse compres-sion. The composite microstructure was idealized by arandom and homogeneous dispersion of parallel, circular
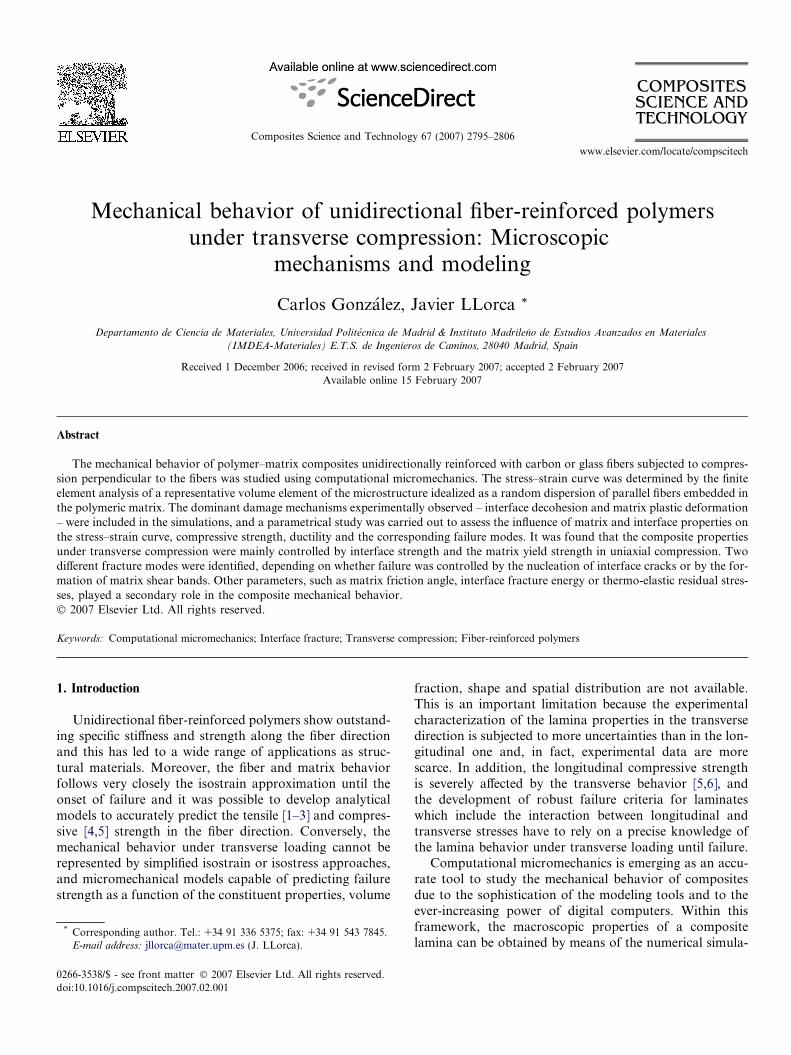
Fig. 1. Scanning electron micrograph of the lateral surface of an AS4/epoxyplastic deformation in the matrix before the maximum load [24].
elastic fibers embedded in the continuous polymeric matrix.The main deformation and failure mechanisms reported inthe literature (namely matrix nonlinear behavior and inter-face failure) as well as the effect of thermal residual stresseswere taken into account in the simulations and a paramet-rical study was carried out to assess the influence of theseparameters on the stress–strain curve, failure strength, duc-tility and the corresponding failure modes.
2. Experimental background and simulation strategy
The experimental evidence shows that lamina of poly-mer–matrix composites unidirectionally reinforced withcarbon or glass fibers fail under transverse compressionalong planes parallel to the fibers [20–22]. The angle aformed between the failure plane and the through-thick-ness (or perpendicular to the in-plane loading) directionis slightly above 45� and typical values reported are inthe range 50–56� [23,21,24]. Significant non-linear defor-mation was often observed before the maximum load[25,26], and this behavior was associated to the plasticdeformation of the polymeric matrix. This is supportedby our observations on the lateral surfaces of a Hexcel8552 epoxy matrix uniaxially reinforced with 57 vol.%
specimen loaded under transverse compression showing bands of intense
C. Gonzalez, J. LLorca / Composites Science and Technology 67 (2007) 2795–2806 2797
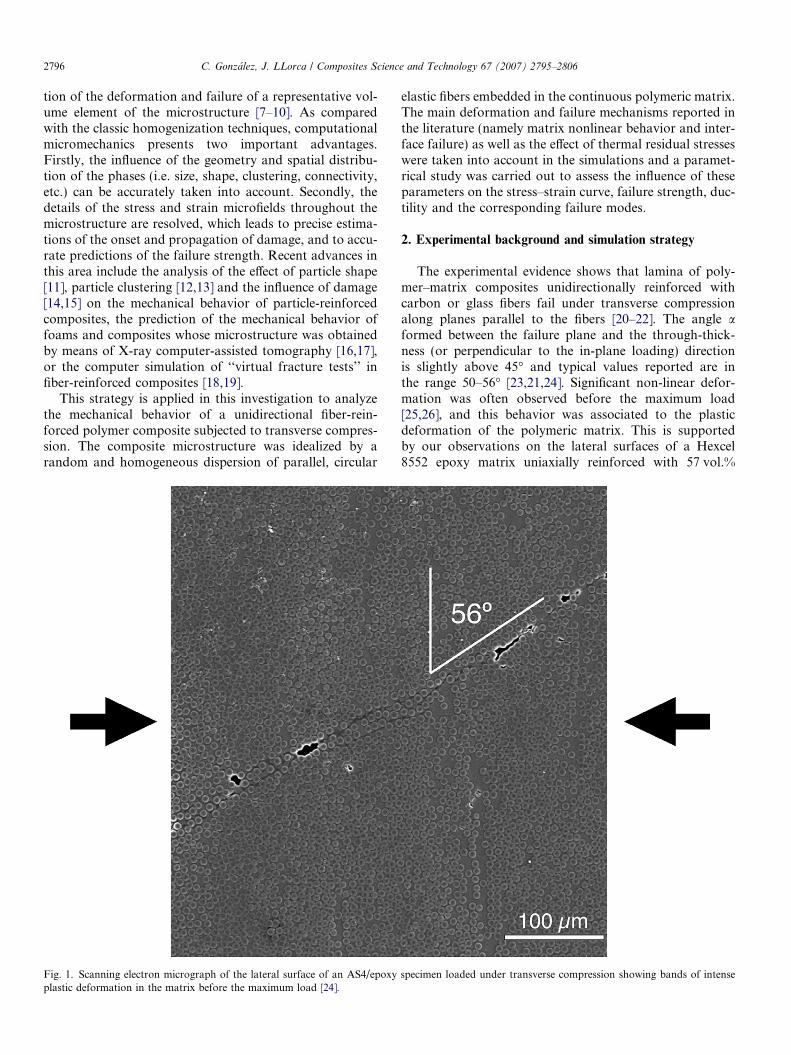
AS4 carbon fibers loaded under transverse compression.Bands of intense plastic deformation in the matrix, inclinedat an angle of 56� with respect to the plane perpendicular tothe loading axis, appeared before the maximum load wasattained (Fig. 1). Damage by interface decohesion devel-oped afterwards around these bands (Fig. 2a) and finalfracture occurred by the failure of the matrix in shear, asevidenced by the numerous hackles in the matrix fracturesurfaces (Fig. 2b).
These results show that the strength of fiber-reinforcedpolymers under transverse compression is controlled bytwo dominant mechanisms, namely the localization of thematrix plastic strain along shear bands and the develop-ment of damage by interface decohesion. Both processes(and their interaction) can be taken into account withinthe framework of computational micromechanics in whichcomposite behavior is analyzed by means of the finite ele-ment simulation of a two-dimensional representative vol-ume element (RVE) of the microstructure. The matrixwas represented by an isotropic, elasto-plastic solid follow-
Fig. 2. Scanning electron micrographs of an AS4/epoxy composite loadedunder transverse compression [24]. (a) Damage by interface decohesionaround the matrix shear bands. The loading axis is horizontal. (b)Fracture surface. The presence of numerous hackles in the matrix isindicative of failure by shear.
ing the Mohr–Coulomb yield criterion, which assumes thatyielding is induced by the shear stresses and that yield stressdepends on the normal stress. This model has often beenused to describe plastic deformation and failure of poly-mers [27] and of polymeric matrices in composites[28,23,21] as it explains the asymmetry between tensileand compressive yielding and failure in compression alongplanes forming an angle of �50–56� with respect to theplane perpendicular to the loading axis. Fiber/matrix dec-ohesion was introduced by means of interface elementswhose behavior is controlled by a cohesive crack model,a standard technique in the computational micromechanicsof composites [29–32].
3. Computational model
3.1. RVE generation and discretization
A square RVE, which contains a random and homoge-neous dispersion of circular fibers embedded in the poly-meric matrix, was selected to determine the behavior ofthe composite under transverse loading, following to Broc-kenbrough et al. [33]. An important issue in the simulationsis the minimum size of the RVE, which should contain allthe necessary information about the statistical descriptionof the microstructure and its size should be large enoughso that the average properties of this volume element areindependent of its size and position within the material.Of course, the critical RVE size depends on the phaseand interface properties and spatial distribution, and noestimates were available for our particular problem. It isalso known that the accuracy provided by RVEs of a givensize can be improved if the results of various realizationsare averaged [34]. Thus, the compressive strength and duc-tility for each set of matrix and interface properties wasgiven by the average value of the results obtained fromsix different fiber distributions in a RVE which included30 fibers. They were compared in selected cases with thoseobtained with RVEs containing over 70 fibers to ensurethat the size of the RVE did not influence significantlythe model predictions.
Random and homogeneous dispersions of monosizedfibers of radius R = 5 lm were generated in square RVEsof dimensions L0 · L0 using the modified random sequen-tial adsortion algorithm of Segurado and LLorca [9]. Itwas assumed that the microstructure of the compositewas given by a indefinite translation of the RVE alongthe two coordinate axes and thus the fiber positions withinthe RVE should keep this periodicity condition. Fiber cen-ters were generated randomly and sequentially, and eachnew fiber was accepted if the distance between neighboringfiber surfaces was >0.07R to ensure an adequate discretiza-tion of this region. In addition, the distance between thefiber surface and the RVE edges should be >0.1R to avoiddistorted finite elements during meshing. Fibers intersect-ing the RVE edges were split into an appropriate numberof parts and copied to the opposite sides of the square
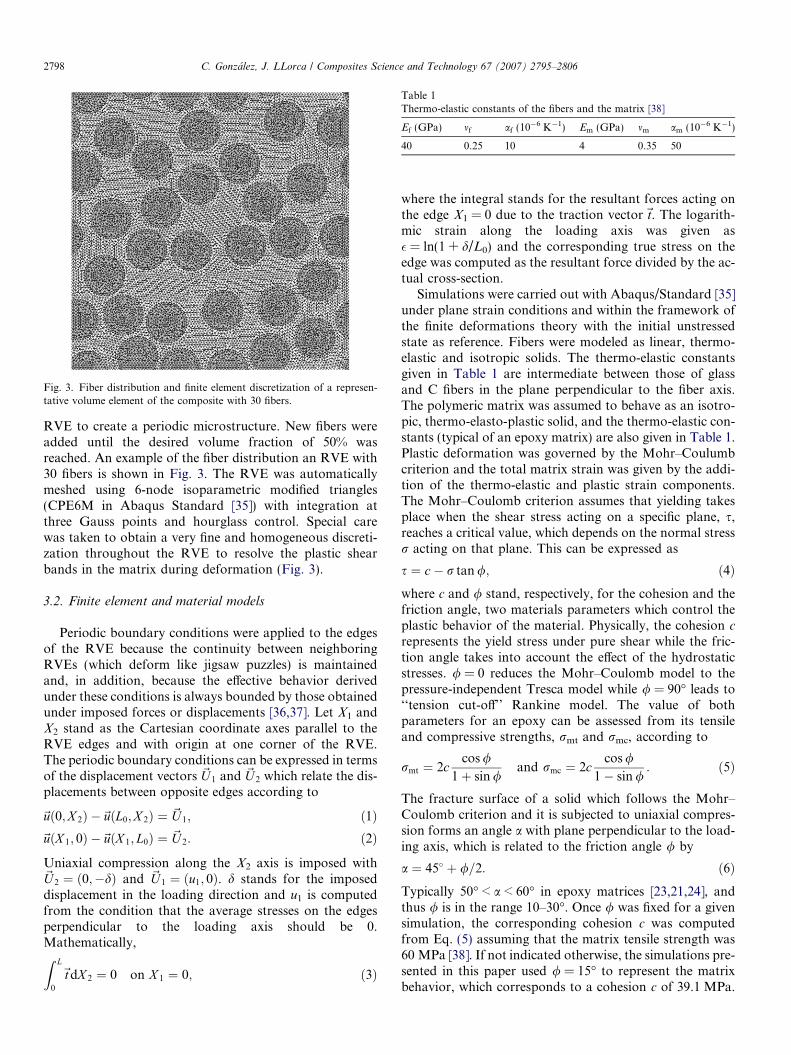
Table 1Thermo-elastic constants of the fibers and the matrix [38]
Ef (GPa) mf af (10�6 K�1) Em (GPa) mm am (10�6 K�1)
40 0.25 10 4 0.35 50
Fig. 3. Fiber distribution and finite element discretization of a represen-tative volume element of the composite with 30 fibers.
2798 C. Gonzalez, J. LLorca / Composites Science and Technology 67 (2007) 2795–2806
RVE to create a periodic microstructure. New fibers wereadded until the desired volume fraction of 50% wasreached. An example of the fiber distribution an RVE with30 fibers is shown in Fig. 3. The RVE was automaticallymeshed using 6-node isoparametric modified triangles(CPE6M in Abaqus Standard [35]) with integration atthree Gauss points and hourglass control. Special carewas taken to obtain a very fine and homogeneous discreti-zation throughout the RVE to resolve the plastic shearbands in the matrix during deformation (Fig. 3).
3.2. Finite element and material models
Periodic boundary conditions were applied to the edgesof the RVE because the continuity between neighboringRVEs (which deform like jigsaw puzzles) is maintainedand, in addition, because the effective behavior derivedunder these conditions is always bounded by those obtainedunder imposed forces or displacements [36,37]. Let X1 andX2 stand as the Cartesian coordinate axes parallel to theRVE edges and with origin at one corner of the RVE.The periodic boundary conditions can be expressed in termsof the displacement vectors ~U 1 and ~U 2 which relate the dis-placements between opposite edges according to
~uð0;X 2Þ �~uðL0;X 2Þ ¼ ~U 1; ð1Þ~uðX 1; 0Þ �~uðX 1; L0Þ ¼ ~U 2: ð2Þ
Uniaxial compression along the X2 axis is imposed with~U 2 ¼ ð0;�dÞ and ~U 1 ¼ ðu1; 0Þ. d stands for the imposeddisplacement in the loading direction and u1 is computedfrom the condition that the average stresses on the edgesperpendicular to the loading axis should be 0.Mathematically,Z L
0
~t dX 2 ¼ 0 on X 1 ¼ 0; ð3Þ
where the integral stands for the resultant forces acting onthe edge X1 = 0 due to the traction vector~t. The logarith-mic strain along the loading axis was given as� = ln(1 + d/L0) and the corresponding true stress on theedge was computed as the resultant force divided by the ac-tual cross-section.
Simulations were carried out with Abaqus/Standard [35]under plane strain conditions and within the framework ofthe finite deformations theory with the initial unstressedstate as reference. Fibers were modeled as linear, thermo-elastic and isotropic solids. The thermo-elastic constantsgiven in Table 1 are intermediate between those of glassand C fibers in the plane perpendicular to the fiber axis.The polymeric matrix was assumed to behave as an isotro-pic, thermo-elasto-plastic solid, and the thermo-elastic con-stants (typical of an epoxy matrix) are also given in Table 1.Plastic deformation was governed by the Mohr–Coulumbcriterion and the total matrix strain was given by the addi-tion of the thermo-elastic and plastic strain components.The Mohr–Coulomb criterion assumes that yielding takesplace when the shear stress acting on a specific plane, s,reaches a critical value, which depends on the normal stressr acting on that plane. This can be expressed as
s ¼ c� r tan /; ð4Þwhere c and / stand, respectively, for the cohesion and thefriction angle, two materials parameters which control theplastic behavior of the material. Physically, the cohesion c
represents the yield stress under pure shear while the fric-tion angle takes into account the effect of the hydrostaticstresses. / = 0 reduces the Mohr–Coulomb model to thepressure-independent Tresca model while / = 90� leads to‘‘tension cut-off’’ Rankine model. The value of bothparameters for an epoxy can be assessed from its tensileand compressive strengths, rmt and rmc, according to
rmt ¼ 2ccos /
1þ sin /and rmc ¼ 2c
cos /1� sin /
: ð5Þ
The fracture surface of a solid which follows the Mohr–Coulomb criterion and it is subjected to uniaxial compres-sion forms an angle a with plane perpendicular to the load-ing axis, which is related to the friction angle / by
a ¼ 45� þ /=2: ð6ÞTypically 50� < a < 60� in epoxy matrices [23,21,24], andthus / is in the range 10–30�. Once / was fixed for a givensimulation, the corresponding cohesion c was computedfrom Eq. (5) assuming that the matrix tensile strength was60 MPa [38]. If not indicated otherwise, the simulations pre-sented in this paper used / = 15� to represent the matrixbehavior, which corresponds to a cohesion c of 39.1 MPa.
δδ0 δ δ
tn tsN S
1
11
(1-d)
K
K
max f
,
Fig. 4. Schematic of the traction-separation law which governs thebehavior of the interface elements.
C. Gonzalez, J. LLorca / Composites Science and Technology 67 (2007) 2795–2806 2799
The corresponding values on the matrix tensile and com-pressive strength are, respectively, 60 MPa and 101.9 MPa.
The yield surface of the Mohr–Coulomb model, writtenin terms of the maximum and minimum principal stresses(rI and rIII), is given by
F ðrI; rIIIÞ ¼ ðrI � rIIIÞ þ ðrI þ rIIIÞ sin /� 2c cos / ¼ 0
ð7Þ
and it was assumed that c and / were constant and inde-pendent of the accumulated plastic strain. A non-associa-tive flow rule was used to compute the directions ofplastic flow in the stress space and the corresponding po-tential flow G was expressed as
G¼ 4ð1� e2Þ cos2 Hþ ð2e� 1Þ2
2ð1� e2Þ cosHþ ð2e� 1Þffiffiffiffiffiffiffiffiffiffiffiffiffiffiffiffiffiffiffiffiffiffiffiffiffiffiffiffiffiffiffiffiffiffiffiffiffiffiffiffiffiffiffiffiffiffiffiffiffiffiffiffiffiffi4ð1� e2Þ cos2 Hþ 5e2� 4e
p
� 3� sin/6 cos/
ð8Þin which e = (3 � sin/)/(3 + sin/) and H is obtained from
H ¼ 1
3arccos
J 3
J 2
� �3
; ð9Þ
where J2 and J3 are, respectively, the second and the thirdinvariants of the deviatoric stress tensor. More detailsabout the numerical implementation of the Mohr–Cou-lomb model can be found in [39,40].
The progressive interface decohesion upon loading wassimulated by 4-node isoparametric linear interface elements(COH2D4 in [35]) inserted at the fiber/matrix interface.The mechanical behavior of these elements was expressedin terms of a traction-separation law which relates the dis-placement jump across the interface with the traction vec-tor acting upon it. The initial response was linear inabsence of damage and, therefore, the traction-separationlaw can be written as
tn ¼ Kdn and ts ¼ Kds ð10Þwhere tn, ts, dn and ds stand for the normal and tangentialtractions and displacement jumps across the interfacerespectively. An elastic stiffness of K = 108 GPa/m was se-lected for the interface, which was large enough to ensurethe displacement continuity at the interface and to avoidany modification of the stress fields around the fibers inthe absence of damage. The linear behavior ends at the on-set of damage, which is dictated by a maximum stress cri-terion expressed mathematically as
maxhtniN
;ts
S
� �¼ 1 ð11Þ
in which h i stand for the Macaulay brackets, which returnthe argument if positive and zero otherwise, to impede thedevelopment of damage when the interface is under com-pression, and N and S are the normal and tangential inter-facial strengths which were assumed to be the equal for
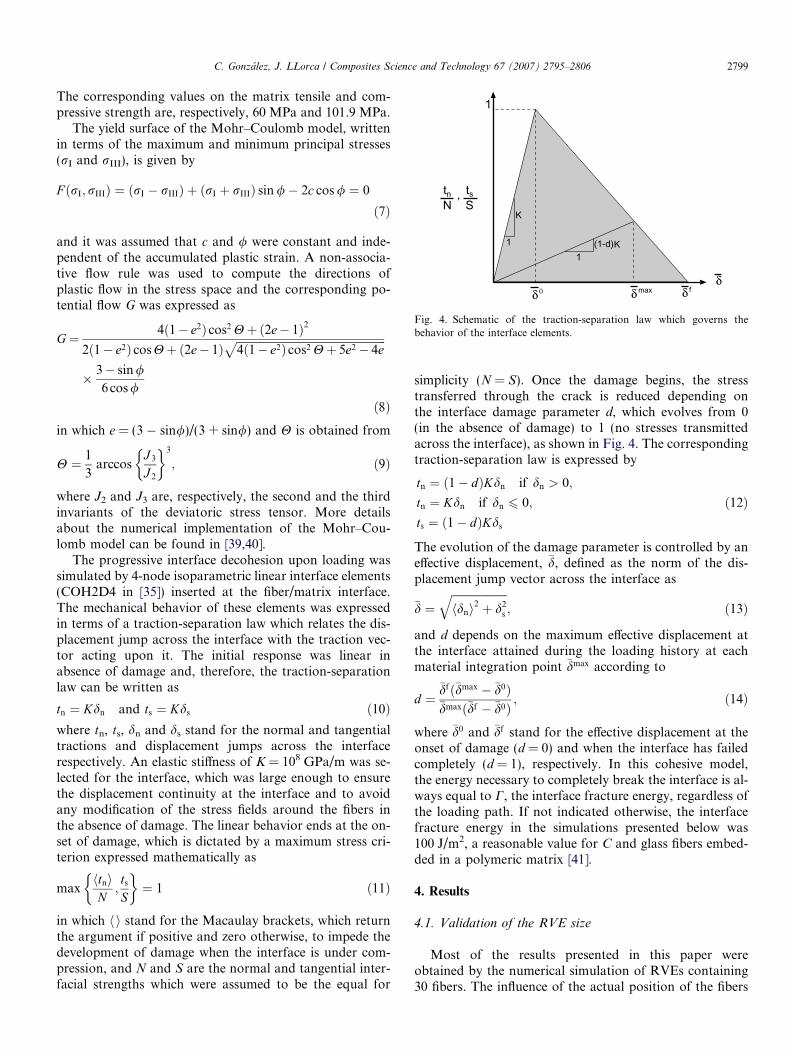
simplicity (N = S). Once the damage begins, the stresstransferred through the crack is reduced depending onthe interface damage parameter d, which evolves from 0(in the absence of damage) to 1 (no stresses transmittedacross the interface), as shown in Fig. 4. The correspondingtraction-separation law is expressed by
tn ¼ ð1� dÞKdn if dn > 0;
tn ¼ Kdn if dn 6 0;
ts ¼ ð1� dÞKds
ð12Þ
The evolution of the damage parameter is controlled by aneffective displacement, �d, defined as the norm of the dis-placement jump vector across the interface as
�d ¼ffiffiffiffiffiffiffiffiffiffiffiffiffiffiffiffiffiffiffiffihdni2 þ d2
s
q; ð13Þ
and d depends on the maximum effective displacement atthe interface attained during the loading history at eachmaterial integration point �dmax according to
d ¼�dfð�dmax � �d0Þ�dmaxð�df � �d0Þ
; ð14Þ
where �d0 and �df stand for the effective displacement at theonset of damage (d = 0) and when the interface has failedcompletely (d = 1), respectively. In this cohesive model,the energy necessary to completely break the interface is al-ways equal to C, the interface fracture energy, regardless ofthe loading path. If not indicated otherwise, the interfacefracture energy in the simulations presented below was100 J/m2, a reasonable value for C and glass fibers embed-ded in a polymeric matrix [41].
4. Results
4.1. Validation of the RVE size
Most of the results presented in this paper wereobtained by the numerical simulation of RVEs containing30 fibers. The influence of the actual position of the fibers
0
20
40
60
80
100
120
140
0 0.01 0.02 0.03 0.04 0.05
Com
pres
sive
str
ess
(MP
a)
Compressive strain
0.1c
∞
0.5c
c
2cmc
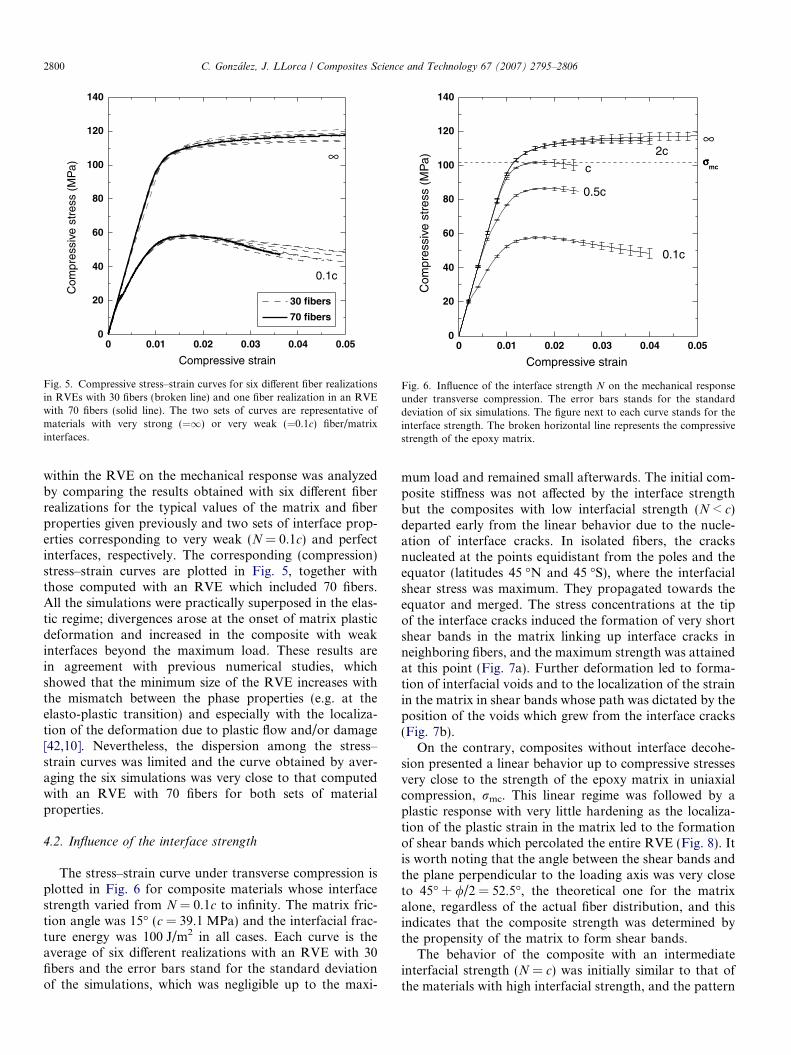
Fig. 6. Influence of the interface strength N on the mechanical responseunder transverse compression. The error bars stands for the standarddeviation of six simulations. The figure next to each curve stands for theinterface strength. The broken horizontal line represents the compressivestrength of the epoxy matrix.
0
20
40
60
80
100
120
140
0 0.01 0.02 0.03 0.04 0.05
30 fibers
70 fibers
Com
pres
sive
str
ess
(MP
a)
Compressive strain
0.1c
∞
Fig. 5. Compressive stress–strain curves for six different fiber realizationsin RVEs with 30 fibers (broken line) and one fiber realization in an RVEwith 70 fibers (solid line). The two sets of curves are representative ofmaterials with very strong (=1) or very weak (=0.1c) fiber/matrixinterfaces.
2800 C. Gonzalez, J. LLorca / Composites Science and Technology 67 (2007) 2795–2806
within the RVE on the mechanical response was analyzedby comparing the results obtained with six different fiberrealizations for the typical values of the matrix and fiberproperties given previously and two sets of interface prop-erties corresponding to very weak (N = 0.1c) and perfectinterfaces, respectively. The corresponding (compression)stress–strain curves are plotted in Fig. 5, together withthose computed with an RVE which included 70 fibers.All the simulations were practically superposed in the elas-tic regime; divergences arose at the onset of matrix plasticdeformation and increased in the composite with weakinterfaces beyond the maximum load. These results arein agreement with previous numerical studies, whichshowed that the minimum size of the RVE increases withthe mismatch between the phase properties (e.g. at theelasto-plastic transition) and especially with the localiza-tion of the deformation due to plastic flow and/or damage[42,10]. Nevertheless, the dispersion among the stress–strain curves was limited and the curve obtained by aver-aging the six simulations was very close to that computedwith an RVE with 70 fibers for both sets of materialproperties.
4.2. Influence of the interface strength
The stress–strain curve under transverse compression isplotted in Fig. 6 for composite materials whose interfacestrength varied from N = 0.1c to infinity. The matrix fric-tion angle was 15� (c = 39.1 MPa) and the interfacial frac-ture energy was 100 J/m2 in all cases. Each curve is theaverage of six different realizations with an RVE with 30fibers and the error bars stand for the standard deviationof the simulations, which was negligible up to the maxi-
mum load and remained small afterwards. The initial com-posite stiffness was not affected by the interface strengthbut the composites with low interfacial strength (N < c)departed early from the linear behavior due to the nucle-ation of interface cracks. In isolated fibers, the cracksnucleated at the points equidistant from the poles and theequator (latitudes 45 �N and 45 �S), where the interfacialshear stress was maximum. They propagated towards theequator and merged. The stress concentrations at the tipof the interface cracks induced the formation of very shortshear bands in the matrix linking up interface cracks inneighboring fibers, and the maximum strength was attainedat this point (Fig. 7a). Further deformation led to forma-tion of interfacial voids and to the localization of the strainin the matrix in shear bands whose path was dictated by theposition of the voids which grew from the interface cracks(Fig. 7b).
On the contrary, composites without interface decohe-sion presented a linear behavior up to compressive stressesvery close to the strength of the epoxy matrix in uniaxialcompression, rmc. This linear regime was followed by aplastic response with very little hardening as the localiza-tion of the plastic strain in the matrix led to the formationof shear bands which percolated the entire RVE (Fig. 8). Itis worth noting that the angle between the shear bands andthe plane perpendicular to the loading axis was very closeto 45� + //2 = 52.5�, the theoretical one for the matrixalone, regardless of the actual fiber distribution, and thisindicates that the composite strength was determined bythe propensity of the matrix to form shear bands.
The behavior of the composite with an intermediateinterfacial strength (N = c) was initially similar to that ofthe materials with high interfacial strength, and the pattern
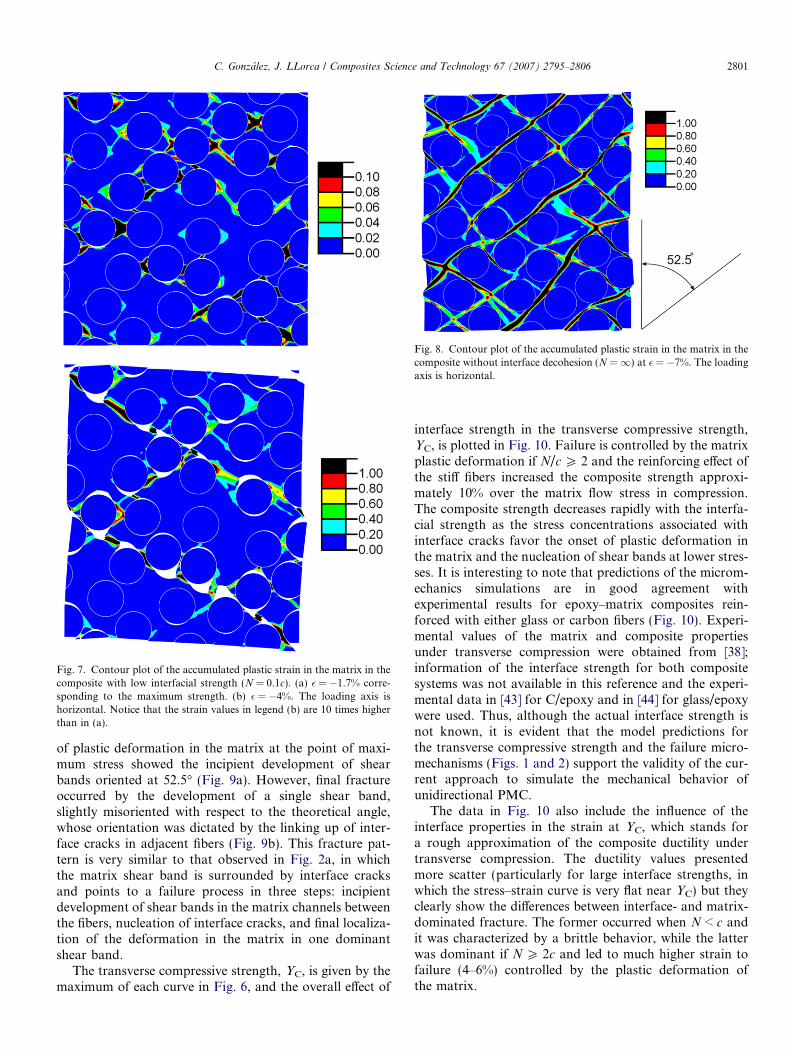
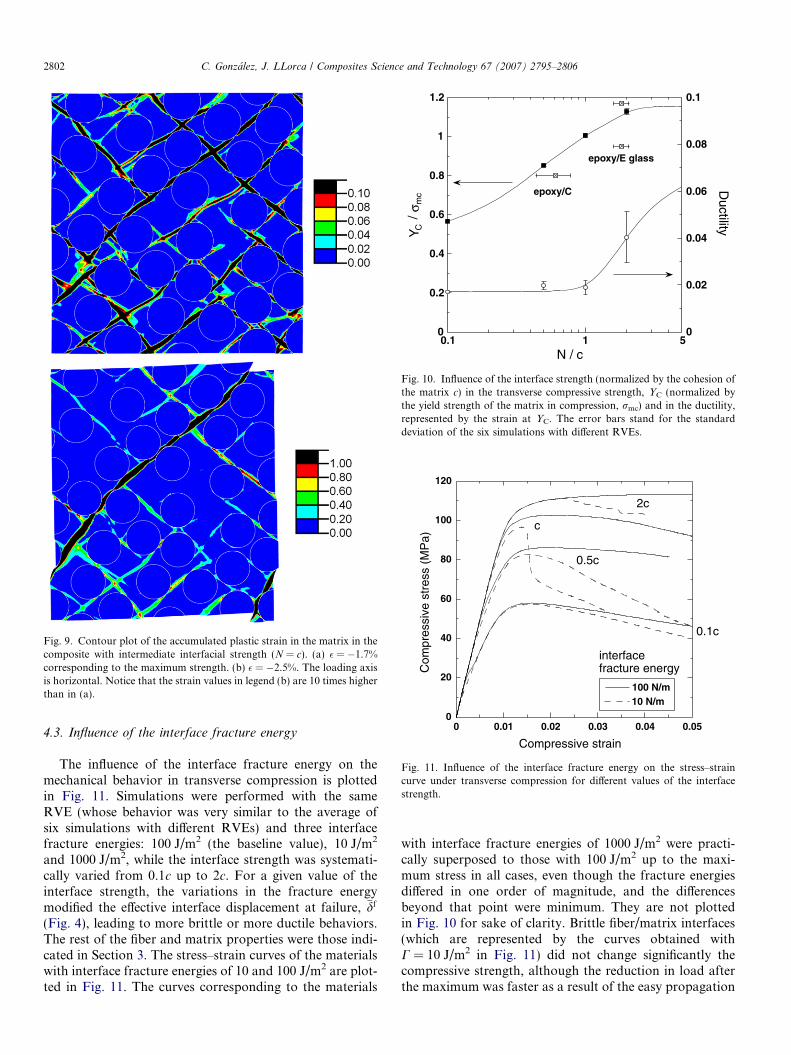
Fig. 7. Contour plot of the accumulated plastic strain in the matrix in thecomposite with low interfacial strength (N = 0.1c). (a) � = �1.7% corre-sponding to the maximum strength. (b) � = �4%. The loading axis ishorizontal. Notice that the strain values in legend (b) are 10 times higherthan in (a).
Fig. 8. Contour plot of the accumulated plastic strain in the matrix in thecomposite without interface decohesion (N =1) at � = �7%. The loadingaxis is horizontal.
C. Gonzalez, J. LLorca / Composites Science and Technology 67 (2007) 2795–2806 2801
of plastic deformation in the matrix at the point of maxi-mum stress showed the incipient development of shearbands oriented at 52.5� (Fig. 9a). However, final fractureoccurred by the development of a single shear band,slightly misoriented with respect to the theoretical angle,whose orientation was dictated by the linking up of inter-face cracks in adjacent fibers (Fig. 9b). This fracture pat-tern is very similar to that observed in Fig. 2a, in whichthe matrix shear band is surrounded by interface cracksand points to a failure process in three steps: incipientdevelopment of shear bands in the matrix channels betweenthe fibers, nucleation of interface cracks, and final localiza-tion of the deformation in the matrix in one dominantshear band.
The transverse compressive strength, YC, is given by themaximum of each curve in Fig. 6, and the overall effect of
interface strength in the transverse compressive strength,YC, is plotted in Fig. 10. Failure is controlled by the matrixplastic deformation if N/c P 2 and the reinforcing effect ofthe stiff fibers increased the composite strength approxi-mately 10% over the matrix flow stress in compression.The composite strength decreases rapidly with the interfa-cial strength as the stress concentrations associated withinterface cracks favor the onset of plastic deformation inthe matrix and the nucleation of shear bands at lower stres-ses. It is interesting to note that predictions of the microm-echanics simulations are in good agreement withexperimental results for epoxy–matrix composites rein-forced with either glass or carbon fibers (Fig. 10). Experi-mental values of the matrix and composite propertiesunder transverse compression were obtained from [38];information of the interface strength for both compositesystems was not available in this reference and the experi-mental data in [43] for C/epoxy and in [44] for glass/epoxywere used. Thus, although the actual interface strength isnot known, it is evident that the model predictions forthe transverse compressive strength and the failure micro-mechanisms (Figs. 1 and 2) support the validity of the cur-rent approach to simulate the mechanical behavior ofunidirectional PMC.
The data in Fig. 10 also include the influence of theinterface properties in the strain at YC, which stands fora rough approximation of the composite ductility undertransverse compression. The ductility values presentedmore scatter (particularly for large interface strengths, inwhich the stress–strain curve is very flat near YC) but theyclearly show the differences between interface- and matrix-dominated fracture. The former occurred when N < c andit was characterized by a brittle behavior, while the latterwas dominant if N P 2c and led to much higher strain tofailure (4–6%) controlled by the plastic deformation ofthe matrix.
0
0.2
0.4
0.6
0.8
1
1.2
0
0.02
0.04
0.06
0.08
0.1
0.1 1
Y C /
mc
Ductility
N / c5
epoxy/C
epoxy/E glass
Fig. 10. Influence of the interface strength (normalized by the cohesion ofthe matrix c) in the transverse compressive strength, YC (normalized bythe yield strength of the matrix in compression, rmc) and in the ductility,represented by the strain at YC. The error bars stand for the standarddeviation of the six simulations with different RVEs.
Fig. 9. Contour plot of the accumulated plastic strain in the matrix in thecomposite with intermediate interfacial strength (N = c). (a) � = �1.7%corresponding to the maximum strength. (b) � = �2.5%. The loading axisis horizontal. Notice that the strain values in legend (b) are 10 times higherthan in (a).
0
20
40
60
80
100
120
0 0.01 0.02 0.03 0.04 0.05
100 N/m10 N/m
Com
pres
sive
str
ess
(MP
a)
Compressive strain
0.1c
2c
0.5c
c
interfacefracture energy
Fig. 11. Influence of the interface fracture energy on the stress–straincurve under transverse compression for different values of the interfacestrength.
2802 C. Gonzalez, J. LLorca / Composites Science and Technology 67 (2007) 2795–2806
4.3. Influence of the interface fracture energy
The influence of the interface fracture energy on themechanical behavior in transverse compression is plottedin Fig. 11. Simulations were performed with the sameRVE (whose behavior was very similar to the average ofsix simulations with different RVEs) and three interfacefracture energies: 100 J/m2 (the baseline value), 10 J/m2
and 1000 J/m2, while the interface strength was systemati-cally varied from 0.1c up to 2c. For a given value of theinterface strength, the variations in the fracture energymodified the effective interface displacement at failure, �df
(Fig. 4), leading to more brittle or more ductile behaviors.The rest of the fiber and matrix properties were those indi-cated in Section 3. The stress–strain curves of the materialswith interface fracture energies of 10 and 100 J/m2 are plot-ted in Fig. 11. The curves corresponding to the materials
with interface fracture energies of 1000 J/m2 were practi-cally superposed to those with 100 J/m2 up to the maxi-mum stress in all cases, even though the fracture energiesdiffered in one order of magnitude, and the differencesbeyond that point were minimum. They are not plottedin Fig. 10 for sake of clarity. Brittle fiber/matrix interfaces(which are represented by the curves obtained withC = 10 J/m2 in Fig. 11) did not change significantly thecompressive strength, although the reduction in load afterthe maximum was faster as a result of the easy propagation
C. Gonzalez, J. LLorca / Composites Science and Technology 67 (2007) 2795–2806 2803
of the cracks along particle/matrix interface. Thus, it canbe concluded that the effect of the interface fracture energyon the transverse compressive strength of fiber-reinforcedpolymers is negligible, as compared with the influence ofthe interface strength.
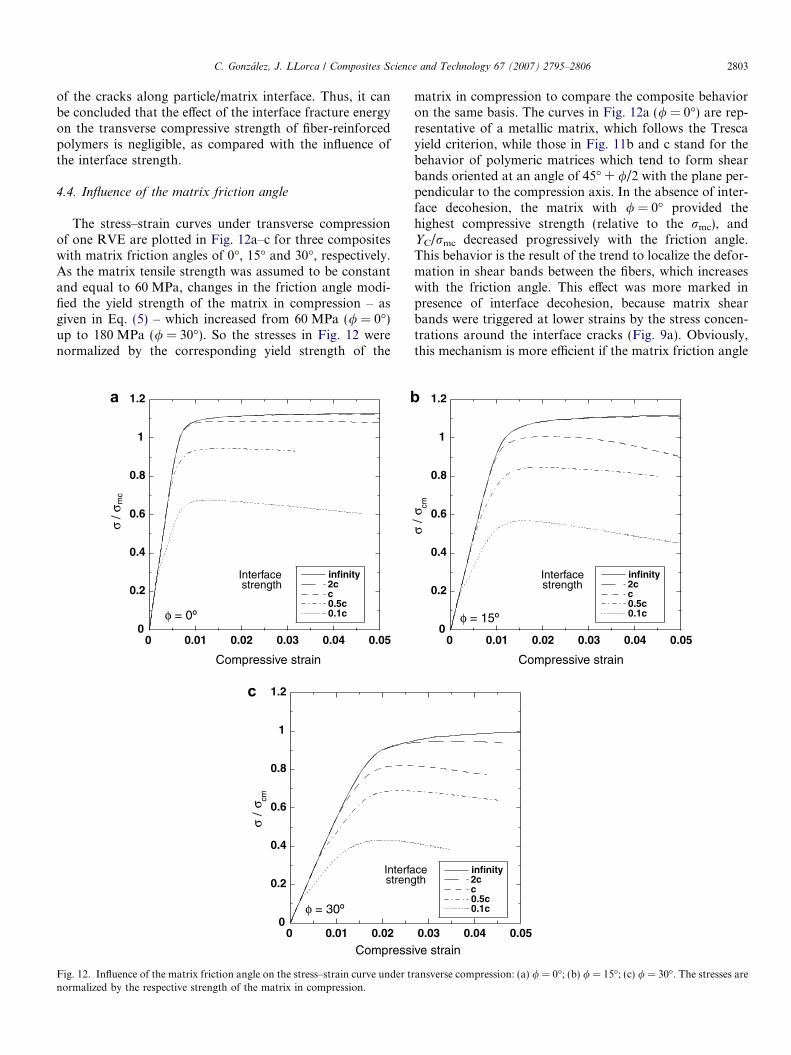
4.4. Influence of the matrix friction angle
The stress–strain curves under transverse compressionof one RVE are plotted in Fig. 12a–c for three compositeswith matrix friction angles of 0�, 15� and 30�, respectively.As the matrix tensile strength was assumed to be constantand equal to 60 MPa, changes in the friction angle modi-fied the yield strength of the matrix in compression – asgiven in Eq. (5) – which increased from 60 MPa (/ = 0�)up to 180 MPa (/ = 30�). So the stresses in Fig. 12 werenormalized by the corresponding yield strength of the
0
0.2
0.4
0.6
0.8
1
1.2
0 0.01 0.02 0.03 0.04 0.05
infinity2cc0.5c0.1c
mc
Compressive strain
= 0º
Interfacestrength
0
0.2
0.4
0.6
0.8
1
1.2
0 0.01 0.02
/ cm
Compress
= 30º
Interfastreng
a
c
b
Fig. 12. Influence of the matrix friction angle on the stress–strain curve under trnormalized by the respective strength of the matrix in compression.
matrix in compression to compare the composite behavioron the same basis. The curves in Fig. 12a (/ = 0�) are rep-resentative of a metallic matrix, which follows the Trescayield criterion, while those in Fig. 11b and c stand for thebehavior of polymeric matrices which tend to form shearbands oriented at an angle of 45� + //2 with the plane per-pendicular to the compression axis. In the absence of inter-face decohesion, the matrix with / = 0� provided thehighest compressive strength (relative to the rmc), andYC/rmc decreased progressively with the friction angle.This behavior is the result of the trend to localize the defor-mation in shear bands between the fibers, which increaseswith the friction angle. This effect was more marked inpresence of interface decohesion, because matrix shearbands were triggered at lower strains by the stress concen-trations around the interface cracks (Fig. 9a). Obviously,this mechanism is more efficient if the matrix friction angle
0
0.2
0.4
0.6
0.8
1
1.2
0 0.01 0.02 0.03 0.04 0.05
infinity2cc0.5c0.1c
/ cm
Compressive strain
= 15º
Interfacestrength
0.03 0.04 0.05
infinity2cc0.5c0.1c
ive strain
ceth
ansverse compression: (a) / = 0�; (b) / = 15�; (c) / = 30�. The stresses are
2804 C. Gonzalez, J. LLorca / Composites Science and Technology 67 (2007) 2795–2806
is high, and thus the degradation of the composite proper-ties was faster as the interfacial strength decreased.
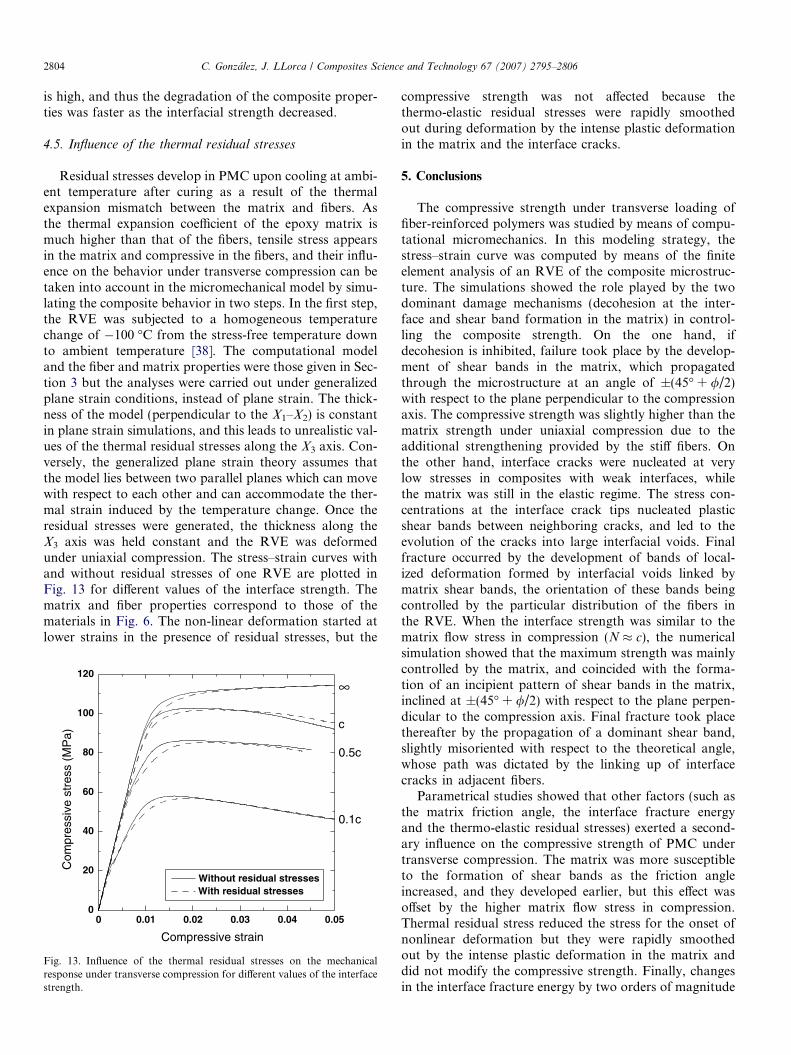
4.5. Influence of the thermal residual stresses
Residual stresses develop in PMC upon cooling at ambi-ent temperature after curing as a result of the thermalexpansion mismatch between the matrix and fibers. Asthe thermal expansion coefficient of the epoxy matrix ismuch higher than that of the fibers, tensile stress appearsin the matrix and compressive in the fibers, and their influ-ence on the behavior under transverse compression can betaken into account in the micromechanical model by simu-lating the composite behavior in two steps. In the first step,the RVE was subjected to a homogeneous temperaturechange of �100 �C from the stress-free temperature downto ambient temperature [38]. The computational modeland the fiber and matrix properties were those given in Sec-tion 3 but the analyses were carried out under generalizedplane strain conditions, instead of plane strain. The thick-ness of the model (perpendicular to the X1–X2) is constantin plane strain simulations, and this leads to unrealistic val-ues of the thermal residual stresses along the X3 axis. Con-versely, the generalized plane strain theory assumes thatthe model lies between two parallel planes which can movewith respect to each other and can accommodate the ther-mal strain induced by the temperature change. Once theresidual stresses were generated, the thickness along theX3 axis was held constant and the RVE was deformedunder uniaxial compression. The stress–strain curves withand without residual stresses of one RVE are plotted inFig. 13 for different values of the interface strength. Thematrix and fiber properties correspond to those of thematerials in Fig. 6. The non-linear deformation started atlower strains in the presence of residual stresses, but the
0
20
40
60
80
100
120
0 0.01 0.02 0.03 0.04 0.05
Without residual stressesWith residual stresses
Com
pres
sive
str
ess
(MP
a)
Compressive strain
0.1c
∞
0.5c
c
Fig. 13. Influence of the thermal residual stresses on the mechanicalresponse under transverse compression for different values of the interfacestrength.
compressive strength was not affected because thethermo-elastic residual stresses were rapidly smoothedout during deformation by the intense plastic deformationin the matrix and the interface cracks.
5. Conclusions
The compressive strength under transverse loading offiber-reinforced polymers was studied by means of compu-tational micromechanics. In this modeling strategy, thestress–strain curve was computed by means of the finiteelement analysis of an RVE of the composite microstruc-ture. The simulations showed the role played by the twodominant damage mechanisms (decohesion at the inter-face and shear band formation in the matrix) in control-ling the composite strength. On the one hand, ifdecohesion is inhibited, failure took place by the develop-ment of shear bands in the matrix, which propagatedthrough the microstructure at an angle of ±(45� + //2)with respect to the plane perpendicular to the compressionaxis. The compressive strength was slightly higher than thematrix strength under uniaxial compression due to theadditional strengthening provided by the stiff fibers. Onthe other hand, interface cracks were nucleated at verylow stresses in composites with weak interfaces, whilethe matrix was still in the elastic regime. The stress con-centrations at the interface crack tips nucleated plasticshear bands between neighboring cracks, and led to theevolution of the cracks into large interfacial voids. Finalfracture occurred by the development of bands of local-ized deformation formed by interfacial voids linked bymatrix shear bands, the orientation of these bands beingcontrolled by the particular distribution of the fibers inthe RVE. When the interface strength was similar to thematrix flow stress in compression (N � c), the numericalsimulation showed that the maximum strength was mainlycontrolled by the matrix, and coincided with the forma-tion of an incipient pattern of shear bands in the matrix,inclined at ±(45� + //2) with respect to the plane perpen-dicular to the compression axis. Final fracture took placethereafter by the propagation of a dominant shear band,slightly misoriented with respect to the theoretical angle,whose path was dictated by the linking up of interfacecracks in adjacent fibers.
Parametrical studies showed that other factors (such asthe matrix friction angle, the interface fracture energyand the thermo-elastic residual stresses) exerted a second-ary influence on the compressive strength of PMC undertransverse compression. The matrix was more susceptibleto the formation of shear bands as the friction angleincreased, and they developed earlier, but this effect wasoffset by the higher matrix flow stress in compression.Thermal residual stress reduced the stress for the onset ofnonlinear deformation but they were rapidly smoothedout by the intense plastic deformation in the matrix anddid not modify the compressive strength. Finally, changesin the interface fracture energy by two orders of magnitude
C. Gonzalez, J. LLorca / Composites Science and Technology 67 (2007) 2795–2806 2805
did not modify significantly the compressive strengtheither.
It is finally worth noting the potential of computationalmicromechanics to assess the mechanical behavior of engi-neering composites. By using the appropriate constitutiveequations for the fiber, matrix and interfaces, this simula-tion tool can provide a detailed picture of deformationand fracture mechanisms at microscopic level, includingthe effect of all non-linear processes and of the interactionamong them. This information can be used to developmore accurate and reliable failure criteria at the laminalevel, which in turn can be used to predict the mechanicalperformance of laminates and composite structures.
Acknowledgments
This investigation was supported by the Spanish Minis-try of Education and Science through the Grant MAT2006-2602 and by the Comunidad de Madrid through theprogram ESTRUMAT-CM (reference MAT/0077).
References
[1] Aveston J, Cooper GA, Kelly A. Single and multiple fracture. In: Theproperties of fibre composites. IPC Science and Technology Press;1971. p. 15–26.
[2] Curtin WA, Takeda N. Tensile strength of fiber-reinforced compos-ites: II. Application to polymer matrix composites. J Compos Mater1998;32:2060–81.
[3] Gonzalez C, LLorca J. Micromechanical modelling of deformationand failure in Ti–6Al–4V/SiC composites. Acta Mater2001;49:3505–19.
[4] Argon AS. Fracture of composites. In: Herman H, editor. Treatise onmaterials science and technology, vol. 1. Academic Press; 1972. p.79–114.
[5] Budiansky B, Fleck NA. Compressive failure of fiber composites. JMech Phys Solids 1993;41:183–211.
[6] Vogler TJ, Hsu S-Y, Kyriakides S. Composite failure under combinedcompression and shear. Int J Solids Struct 2000;37:1765–91.
[7] Michel JC, Moulinec H, Suquet P. Effective properties of compositematerials with periodic microstructure: a computational approach.Comput Meth Appl Mech Eng 1999;172:109–43.
[8] Lusti HR, Hine PJ, Gusev AA. Direct numerical predictions for theelastic and thermoelastic properties of short fibre composites.Compos Sci Technol 2002;62:1927–34.
[9] Segurado J, LLorca J. A numerical approximation to the elasticproperties of sphere-reinforced composites. J Mech Phys Solids2002;50:2107–21.
[10] Gonzalez C, Segurado J, LLorca J. Numerical simulation of elasto-plastic deformation of composites: evolution of stress microfields andimplications for homogenization models. J Mech Phys Solids2004;52:1573–93.
[11] Chawla N, Sidhu RS, Ganesh VV. Three-dimensional visualizationand microstructure-based modeling of deformation in particle-rein-forced composites. Acta Mater 2006;54:1541–8.
[12] Segurado J, Gonzalez C, LLorca J. A numerical investigation of theeffect of particle clustering on the mechanical properties of compos-ites. Acta Mater 2003;51:2355–69.
[13] Segurado J, LLorca J. Computational micromechanics of composites:the effect of particle spatial distribution. Mech Mater 2006;38:873–83.
[14] Bohm HJ, Han W, Eckschlager A. Multi-inclusion unit cell studies ofreinforcement stresses and particle failure in discontinuously reinforcedductile matrix composites. Comput Model Eng Sci 2004;5:5–20.
[15] LLorca J, Segurado J. Three-dimensional multiparticle cell simula-tions of deformation and damage in sphere-reinforced composites.Mater Sci Eng A 2004;365:267–74.
[16] Youssef S, Maire E, Gaertner R. Finite element modelling of theactual structure of cellular materials determined by X-ray tomogra-phy. Acta Mater 2005;53:719–30.
[17] Borbely A, Kenesei P, Biermann H. Estimation of theeffective properties of particle-reinforced metalmatrix compositesfrom microtomographic reconstructions. Acta Mater 2006;54:2735–44.
[18] Gonzalez C, LLorca J. Multiscale modeling of fracture in fiber-reinforced composites. Acta Mater 2006;54:4171–81.
[19] Gonzalez C, LLorca J. Virtual fracture testing of fiber-reinforcedcomposites: a computational micromechanics approach. Eng FractMech 2007;74:1126–38.
[20] Collings TA. Transverse compressive behaviour of unidirec-tional carbon fibre reinforced plastics. Composites 1974;5:108–16.
[21] Pinho ST, Iannucci L, Robinson P. Physically-based failure modelsand criteria for laminated fibre-reinforced composites with emphasison fibre-kinking. Part I: development. Compos: Part A 2006;37:63–73.
[22] Huang YK, Frings PH, Hennes E. Mechanical properties of Zylon/epoxy composite. Compos: Part B 2002;33:109–15.
[23] Puck A, Schurmann H. Failure analysis of frp laminates by means ofphysically based phenomenological models. Compos Sci Technol2002;62:1633–62.
[24] Aragones D. Fracture micromechanisms in C/epoxy compositesunder transverse compression, Master thesis, Universidad Politecnicade Madrid, 2007.
[25] Vogler TJ, Kyriakides S. Inelastic behavior of an AS4/PEEKcomposite under combined transverse compression and shear. PartI: Experiments. Int J Plast 1999;15:783–806.
[26] Hsiao HM, Daniel IM. Strain rate behavior of composite materials.Compos: Part B 1998;29:521–33.
[27] Kinloch AJ, Young RJ. Fracture behavior of polymers. ElsevierApplied Science; 1983.
[28] Hashin Z. Failure criteria for unidirectional fiber composites. J ApplMech 1980;47:329–34.
[29] Segurado J, LLorca J. A new three-dimensional interface finiteelement to simulate fracture in composites. Int J Solids Struct2004;41:2977–93.
[30] Segurado J, LLorca J. A computational micromechanics study of theeffect of interface decohesion on the mechanical behavior ofcomposites. Acta Mater 2005;53:4931–42.
[31] Hashagen F, de Borst R. Numerical assessment of delamination infibre metal laminates. Comput Meth Appl Mech Eng 2000;185:141–59.
[32] Ghosh S, Ling Y, Majumdar B, Kim R. Interfacial debondinganalysis in multiple fiber reinforced composites. Mech Mater2000;32:561–91.
[33] Brockenbrough JR, Suresh S, Wienecke HA. Deformation ofmetal–matrix composites with continuous fibers: geometrical effectsof fiber distribution and shape. Acta Metall Mater 1991;39:735–52.
[34] Hine PJ, Lusti HR, Gusev AA. Numerical simulation of the effects ofvolume fraction, aspect ratio and fibre length distribution on theelastic and thermoelastic properties of short fibre composites.Compos Sci Technol 2002;62:1445–53.
[35] Abaqus, Users’ Manual, ABAQUS Inc; 2006.[36] Suquet P. Effective properties of nonlinear composites. In: Contin-
uum micromechanics. CISM Course and Lecture Notes; 1997, p. 197–264.
[37] Hazanov S, Huet C. Order relationships for boundary conditioneffects in heterogeneous bodies smaller than the representativevolume. J Mech Phys Solids 1994;42:1995–2011.
[38] Soden PD, Hinton MJ, Kaddour AS. Lamina properties, lay-upconfigurations and loading conditions for a range of fibre-

2806 C. Gonzalez, J. LLorca / Composites Science and Technology 67 (2007) 2795–2806
reinforced composite laminates. Compos Sci Technol 1998;58:1011–22.
[39] Abaqus, Theory manual, HKS Inc; 1998.[40] Menetrey P, Willam KJ. Triaxial failure criterion for concrete and its
generalization. ACI Struct J 1995;92:311–8.[41] Zhou X-F, Wagner HD, Nutt SR. Interfacial properties of polymer
composites measured by push-out and fragmentation tests. Compos:Part A 2001;32:1543–51.
[42] Khisaeva ZF, Ostoja-Starzewski M. On the size of RVE infinite elasticity of random composites. J Elast 2006;85:153–73.
[43] Pitkethly MJ et al. A round robin programme on interfacial testmethods. Compos Sci Technol 1993;48:205–14.
[44] Benzarti K, Cangemi L, Maso FD. Transverse properties of unidi-rectional glass/epoxy composites: influence of fibre surface treat-ments. Compos: Part A 2001;32:197–206.