Embed Size (px)
Citation preview
POLYMER COMPOSITES, JUNE 2004, Vol. 25, No. 3 237
1. INTRODUCTION
The prevalence of injection molded thermoplasticcomponents is due to the ability of the process to
deliver complicated shaped components rapidly andcheaply. While the mechanical properties of thesecomponents are often good enough for the chosen ap-plication, more demanding performance is frequentlyrequired. Improved performance is generally achievedby the incorporation of 10�20% by volume of choppedglass fibers. While the incorporation of glass fibersdelivers improvements in stiffness, strength, creep and
temperature performance for the matrix polymer, thereis the additional issue of the often complicated fiberorientation structures that are produced during pro-cessing. These structures are developed by the veloc-ity gradients set up during mold filling as a result ofthe shape of the mold cavity.
The main aim of this paper was to study the fiberorientation structures developed during injection mold-ing in a model ribbed plate. Ribs are often used as anefficient method for increasing component stiffnesswithout substantially increasing weight. Ribs do, how-ever, increase the complexity of the mold shape andhence the flow path, which can affect the resulting fiberorientation structures. In particular, if the orientationstructures developed are non-symmetric, significant
Fiber Orientation Structures and Mechanical Propertiesof Injection Molded Short Glass Fiber
Reinforced Ribbed Plates
P. J. HINE and R. A. DUCKETT
IRC in Polymer Science and TechnologyUniversity of LeedsLeeds LS2 9JT, UK
In this paper we describe a study of the fiber orientation structures presentwithin a model ribbed injection molded plate. The details of the fiber orientation ateach chosen location on the injection molded parts were measured using an in-house developed image analysis system, which enabled large areas to be scanned(up to 200 mm2) up to a limit of 1 million fiber images. Two materials were used forthese experiments, short glass fiber filled PBT and short glass fiber filled nylon 66.First, a comparison was made between the fiber orientation at an identical position,28 mm from the injection gate on a transverse rib, on two plates made from glassfiber filled PBT. It was found that the fiber orientation in these two separately man-ufactured components was virtually identical when comparing the whole scannedarea, but the differences became more significant when comparing areas on thelength scale of an individual fiber (� 200 �m). Second, the fiber orientation at thesame position was compared for two plates made using the glass/PBT and glass/nylon 66 materials. The differences for the complete scanned areas were small,confirming that mold geometry plays a crucial role in determining fiber orientationstructures, and that matrix properties are secondary. Third, the fiber orientationstructures at various positions across one of the glass/PBT plates were examinedin greater detail, in particular across a number of the transverse ribs: the chosen ribswere of various widths and heights. Differences in structure were found dependingon the local rib geometry. Finally, the effect of the measured fiber orientation struc-tures in determining the mechanical properties of the ribbed plate was investigatedusing simple modeling schemes. While the stiffness of the rib/web assembly wasfound to depend on the average fiber orientation of the two parts, the different ther-mal expansions of the web and the rib, caused by the different fiber orientation inthe two regions, led to significant warpage of the rib/web assembly. Polym. Compos.25:237–254, 2004. © 2004 Society of Plastics Engineers.
© 2004 Society of Plastics EngineersPublished online in Wiley InterScience (www.interscience.wiley.com).DOI: 10.1002/pc.20019
panel warping can occur during cooling. Measurementswere made on two samples made under identical con-ditions to establish if the fiber orientation structureswere the same. A similar comparison was made onsamples made with two different matrix polymers,PBT and nylon 66. A more detailed analysis was car-ried out across three of the transverse ribs. From me-chanical measurements on the components and sim-ple modeling ideas, a clear correlation was foundbetween the heterogeneous fiber orientation struc-tures in the ribs and the ribbed plate properties, inparticular the significant warpage that occurs in theregions of some of the ribs.
A number of techniques have been reported in theliterature for measuring the fiber orientation within aglass fiber reinforced component, including transmis-sion light microscopy (1), contact microradiography(2), X-ray tomography (3) and confocal laser scanningmicroscopy (4). While these techniques have theirstrengths, they also have weaknesses: the first twotechniques provide only 2D information, while thesecond two more recent techniques have yet to be au-tomated, so only small regions can be scanned. Themost popular technique, and the one used here andin previously reported work from this laboratory(5�9), is that of optical reflection microscopy of pol-ished sections taken from the composite. The initialsystem, developed by Davidson (10, 11), utilized threetransputers and parallel processing techniques inorder to carry out the image processing on-line and en-able large areas to be accurately and rapidly scanned.Recent computer advances have allowed a PC basedsystem to be developed that runs on Windows NT (12).The two key advantages of the current system are thatit can scan large areas (up to 200 mm2) and encom-pass up to 1 million fiber images, both of which areimportant when comparing and contrasting fiber ori-entation structures in injection molded componentsover a realistic length scale. Previous published pa-pers in this area have either been quantitative on thelength scale of a few fiber lengths [for example, Refer-ence 13] or qualitative on the scale of the whole com-ponent [for example, Reference 14].
Of course, the ultimate goal is to be able to predictthe fiber orientation structures developed during pro-cessing using a numerical mold filling simulation andhence carry out the design in a computer. Currentmold filling simulations, for example Moldflow, aregenerally 2D, so they are not appropriate for the typeof component described here. Work has begun to ap-pear on 3D simulations, for example (15), which de-tails work on a very similar component to that de-scribed here. There is, therefore, merit in detailedmeasurements to understand the structure-propertyissues in these materials.
2. EXPERIMENTAL
2.1. Component Details
The injection molded component under investiga-tion in this program was a rectangular plate, 255 mm
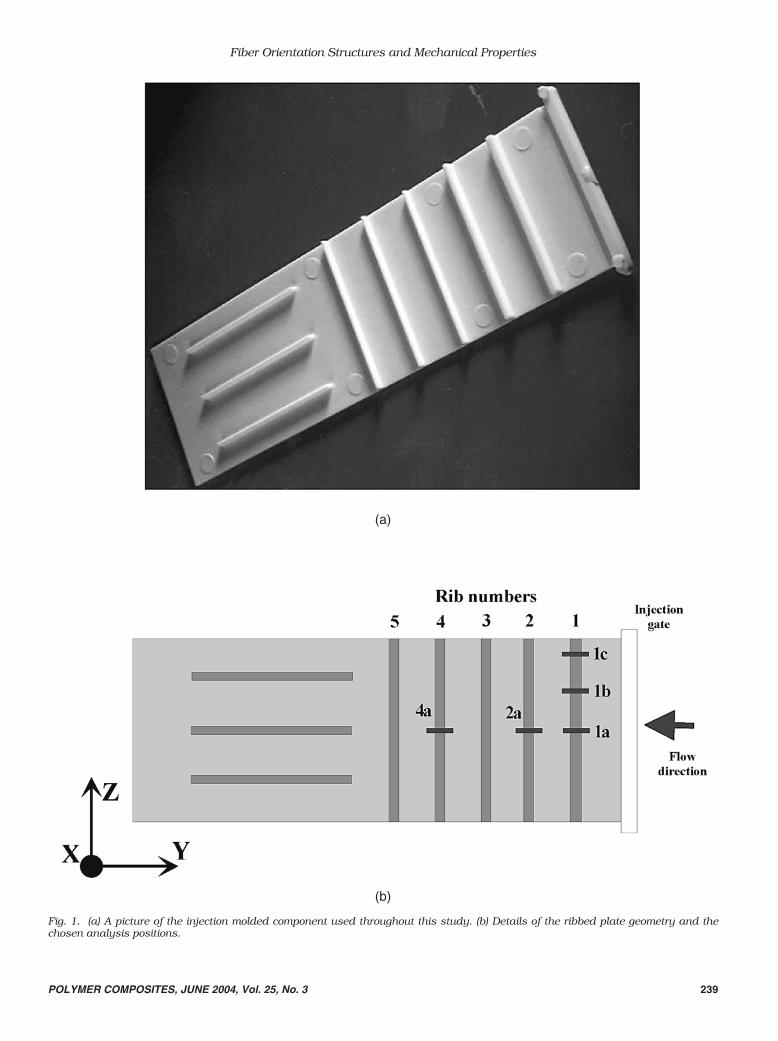
long � 75 mm wide � 3.5 mm thick: all were injectedusing a film gate. This model component contained a number of ribs, both transverse and parallel to theinjection direction as shown in Fig. 1a. As the Figureshows, the component had five transverse and threelongitudinal ribs. In this paper we will describe thefiber orientation structures present at a number ofpositions within the transverse ribs. Figure 1b showsdetails of the ribbed plate geometry and the chosenanalysis positions. All analysis sections were taken inthe XY plane. The first rib (1), at a position of 28 mmfrom the injection gate, was 4 mm wide and 5 mmhigh. Fiber orientation analysis was carried out at thecenter of this rib (section 1a), 15 mm out from themidplane (section 1b) and 30 mm from the midplane(section 1c). Midplane sections were also taken for thesecond rib (section 2a) and the fourth rib (section 4a),which were 54 mm and 105 mm from the gate and 3mm wide by 5 mm high and 2 mm wide by 4 mm highrespectively.
2.2. Materials and Injection Details
The details of the two glass fiber filled thermoplas-tics used in this work are shown in Table 1. Themajority of work was carried out using plates injectionmolded from short glass fiber reinforced polybutyleneterephthalate (PBT) (trade name Valox 420, a productof GE Plastics) kindly supplied by General MotorsR&D Center, Detroit, Michigan. This material had afiber volume fraction of 18% and a number averageaspect ratio, measured by image analysis, of 16. Inaddition, in order to study the effect of matrix typeon fiber orientation structures, one nylon 66 platewas also supplied; this second material had a fibervolume fraction of 20% and a number average aspectratio of 17.
2.3. Image Analysis
The first stage in the image analysis technique is toproduce a polished section from the injection moldedcomponent. The chosen, carefully cut, section is en-capsulated in epoxy and polished with successivelyfiner mediums, finishing with a 0.5 �m alumina sus-pension. Contrast between the fibers and matrix isproduced by using a plasma etch in an oxygen atmos-phere; this roughens the matrix, which then appearsdark in reflected light.
The key to the optical reflection technique is thateach fiber intersects the section plane as an ellipse.By measuring the ellipticity of each fiber image, onecan obtain the two angles, � and �, that specify the3D orientation of each fiber (Fig. 2 ). Here � is definedas the angle the fiber makes with the Z� axis (normalto the sectioned surface), while � is defined as theangle the projection of the fiber in the X� Y� planemakes with the X� axis (the � superscript refers to thelocal image analysis scan axis as opposed to theglobal sample axes). The lower picture on Fig. 2 showsa typical elliptical fiber footprint, and indicates that �
P. J. Hine and R. A. Duckett
238 POLYMER COMPOSITES, JUNE 2004, Vol. 25, No. 3
Fiber Orientation Structures and Mechanical Properties
POLYMER COMPOSITES, JUNE 2004, Vol. 25, No. 3 239
(a)
(b)
Fig. 1. (a) A picture of the injection molded component used throughout this study. (b) Details of the ribbed plate geometry and thechosen analysis positions.
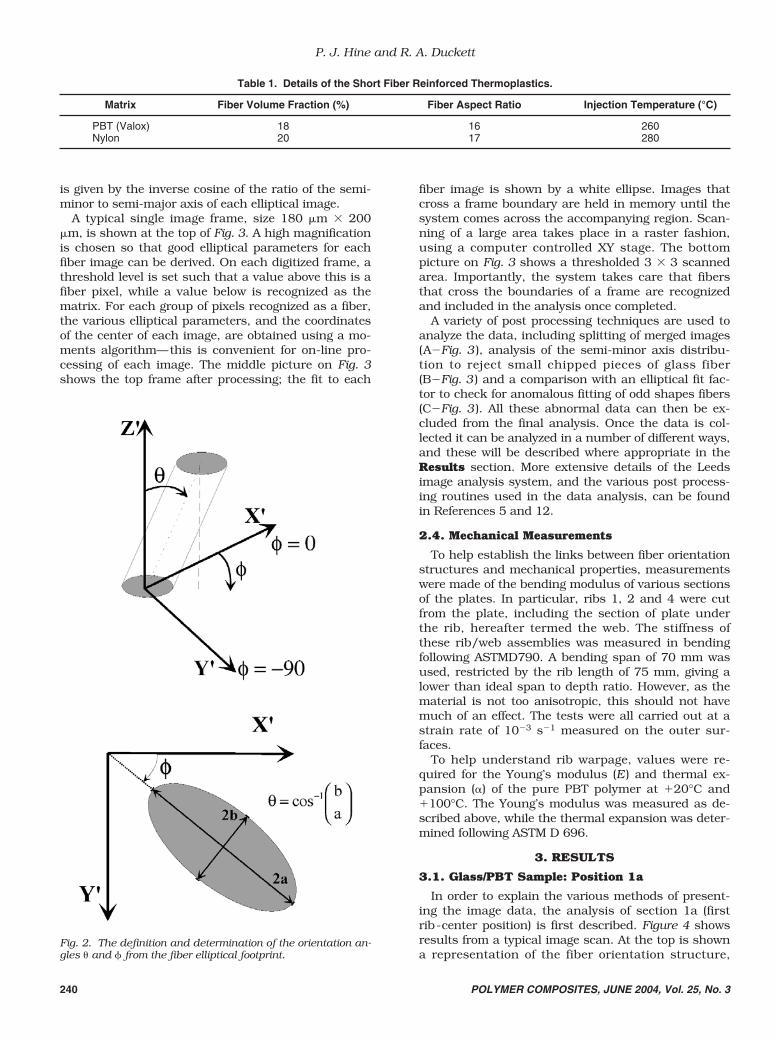
is given by the inverse cosine of the ratio of the semi-minor to semi-major axis of each elliptical image.
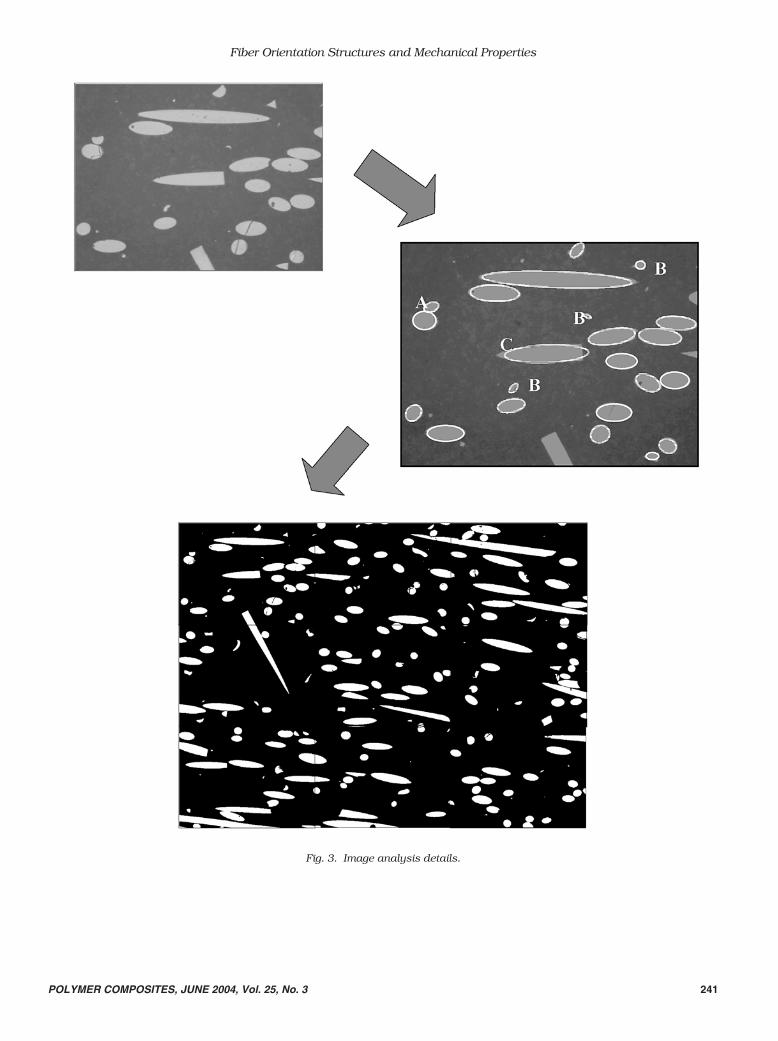
A typical single image frame, size 180 �m � 200�m, is shown at the top of Fig. 3. A high magnificationis chosen so that good elliptical parameters for eachfiber image can be derived. On each digitized frame, athreshold level is set such that a value above this is afiber pixel, while a value below is recognized as thematrix. For each group of pixels recognized as a fiber,the various elliptical parameters, and the coordinatesof the center of each image, are obtained using a mo-ments algorithm—this is convenient for on-line pro-cessing of each image. The middle picture on Fig. 3shows the top frame after processing; the fit to each
fiber image is shown by a white ellipse. Images thatcross a frame boundary are held in memory until thesystem comes across the accompanying region. Scan-ning of a large area takes place in a raster fashion,using a computer controlled XY stage. The bottompicture on Fig. 3 shows a thresholded 3 � 3 scannedarea. Importantly, the system takes care that fibersthat cross the boundaries of a frame are recognizedand included in the analysis once completed.
A variety of post processing techniques are used toanalyze the data, including splitting of merged images(A�Fig. 3 ), analysis of the semi-minor axis distribu-tion to reject small chipped pieces of glass fiber(B�Fig. 3 ) and a comparison with an elliptical fit fac-tor to check for anomalous fitting of odd shapes fibers(C�Fig. 3 ). All these abnormal data can then be ex-cluded from the final analysis. Once the data is col-lected it can be analyzed in a number of different ways,and these will be described where appropriate in theResults section. More extensive details of the Leedsimage analysis system, and the various post process-ing routines used in the data analysis, can be foundin References 5 and 12.
2.4. Mechanical Measurements
To help establish the links between fiber orientationstructures and mechanical properties, measurementswere made of the bending modulus of various sectionsof the plates. In particular, ribs 1, 2 and 4 were cutfrom the plate, including the section of plate underthe rib, hereafter termed the web. The stiffness ofthese rib/web assemblies was measured in bendingfollowing ASTMD790. A bending span of 70 mm wasused, restricted by the rib length of 75 mm, giving alower than ideal span to depth ratio. However, as thematerial is not too anisotropic, this should not havemuch of an effect. The tests were all carried out at astrain rate of 10�3 s�1 measured on the outer sur-faces.
To help understand rib warpage, values were re-quired for the Young’s modulus (E ) and thermal ex-pansion () of the pure PBT polymer at 20°C and100°C. The Young’s modulus was measured as de-scribed above, while the thermal expansion was deter-mined following ASTM D 696.
3. RESULTS
3.1. Glass/PBT Sample: Position 1a
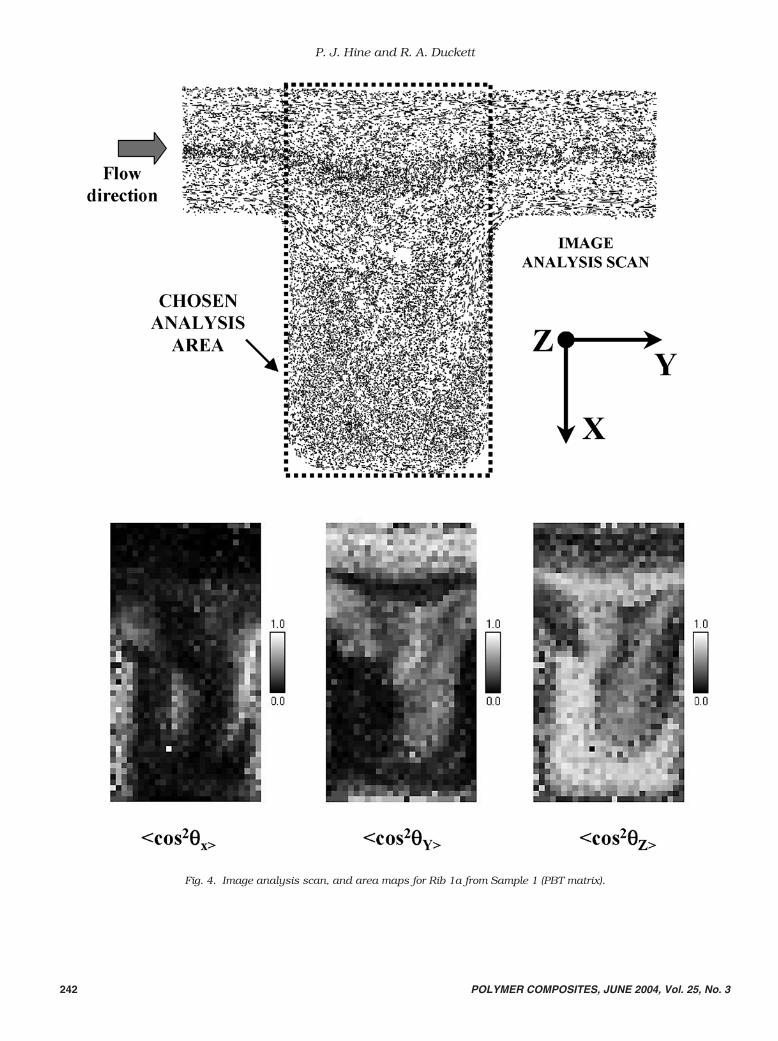
In order to explain the various methods of present-ing the image data, the analysis of section 1a (firstrib-center position) is first described. Figure 4 showsresults from a typical image scan. At the top is showna representation of the fiber orientation structure,
P. J. Hine and R. A. Duckett
240 POLYMER COMPOSITES, JUNE 2004, Vol. 25, No. 3
Table 1. Details of the Short Fiber Reinforced Thermoplastics.
Matrix Fiber Volume Fraction (%) Fiber Aspect Ratio Injection Temperature (°C)
PBT (Valox) 18 16 260Nylon 20 17 280
Fig. 2. The definition and determination of the orientation an-gles � and � from the fiber elliptical footprint.
Fiber Orientation Structures and Mechanical Properties
POLYMER COMPOSITES, JUNE 2004, Vol. 25, No. 3 241
Fig. 3. Image analysis details.
P. J. Hine and R. A. Duckett
242 POLYMER COMPOSITES, JUNE 2004, Vol. 25, No. 3
Fig. 4. Image analysis scan, and area maps for Rib 1a from Sample 1 (PBT matrix).
Fiber Orientation Structures and Mechanical Properties
POLYMER COMPOSITES, JUNE 2004, Vol. 25, No. 3 243
recreated from the elliptical parameters stored duringscanning. The scanned area (� 8 mm � 8 mm) showsboth the web of the plate and the associated rib; theinjection direction was from the left. The scan showsthat there is a complicated fiber orientation structuredeveloped during processing within this area of theweb and rib. In the center of the web is what is usu-ally termed the core, where the fibers are approxi-mately transverse to the injection direction. Awayfrom the core, on either side, is a region, termed theshell, where the fibers have been aligned more prefer-entially along the injection direction (Y axis) by thegapwise shear forces during injection molding. It isseen that under the rib, the core material is drawninto the rib, as shown in a recent numerical simula-tion by VerWeyst et al. (15).
To examine the fiber orientation structures in moredetail, we have often found it useful to divide thescanned area into a number of cells, usually of theorder of an individual frame. In each of these cells wethen calculate the second order orientation averages�cos2�X �, �cos2�Y� and �cos2�Z�; these are identical tothe components of the orientation tensor aXX, aYY andaZZ (16). The higher the value of each of these aver-ages, the greater the orientation along that axis; inaddition, the three averages always add up to 1. Whilethis approach may appear cumbersome, other tech-niques, where the in-plane orientation tensor is diago-nalized and then represented as an ellipse, only reallylend themselves to predominantly 2D information.
The bottom of Fig. 4 shows the image analysis scananalyzed in this way for the region of the scannedarea shown by the dotted line on the top figure. Ahigh value of the second order parameter is shown aswhite, a low value as black. At each of the threeboundaries of the rib, the top and two sides, the ori-entation is, as expected, parallel to that boundary(sides of the rib show high XZ orientation, tip of therib high YZ orientation). The core of the main plate(web) is clearly seen (high Z orientation). Also clear isthat the orientation in the rib itself is predominantlyin the Z axis, that is, transverse to the flow but paral-lel to the rib axis. It might be supposed that materialcould flow into the rib cavity at its center and thenout along the rib, causing Z reorientation to occur. Aswill be seen in the later results, this structure appearsto depend on both the position across the rib, and onthe rib aspect ratio.
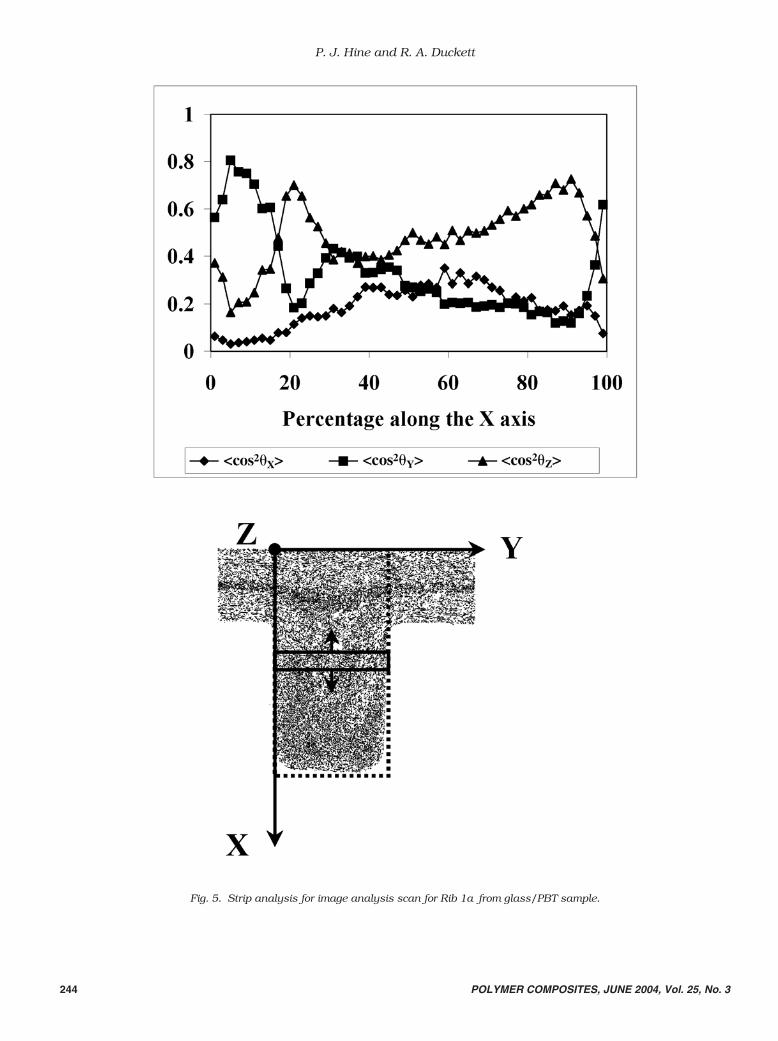
Another way to visualize the fiber orientation struc-ture is to plot numerical data. With the layered struc-tures that are often present in injection molded compo-nents, a useful technique is to plot the average second
order orientation in strips that are parallel to the Yaxis (Fig. 5 ). The average value for each of the threesecond order orientation parameters is here shownplotted vs. distance along the X axis (here each stripwas � 0.17 mm wide in the X direction). Figure 5shows this type of analysis, and confirms the detailsof the structure discussed above: a core located at X 20% and predominantly Z orientation in the rib.This form of representation will be useful in the fol-lowing sections where we attempt qualitatively to com-pare different components.
3.2. Glass/PBT–Two Samples Made UnderIdentical Processing Conditions
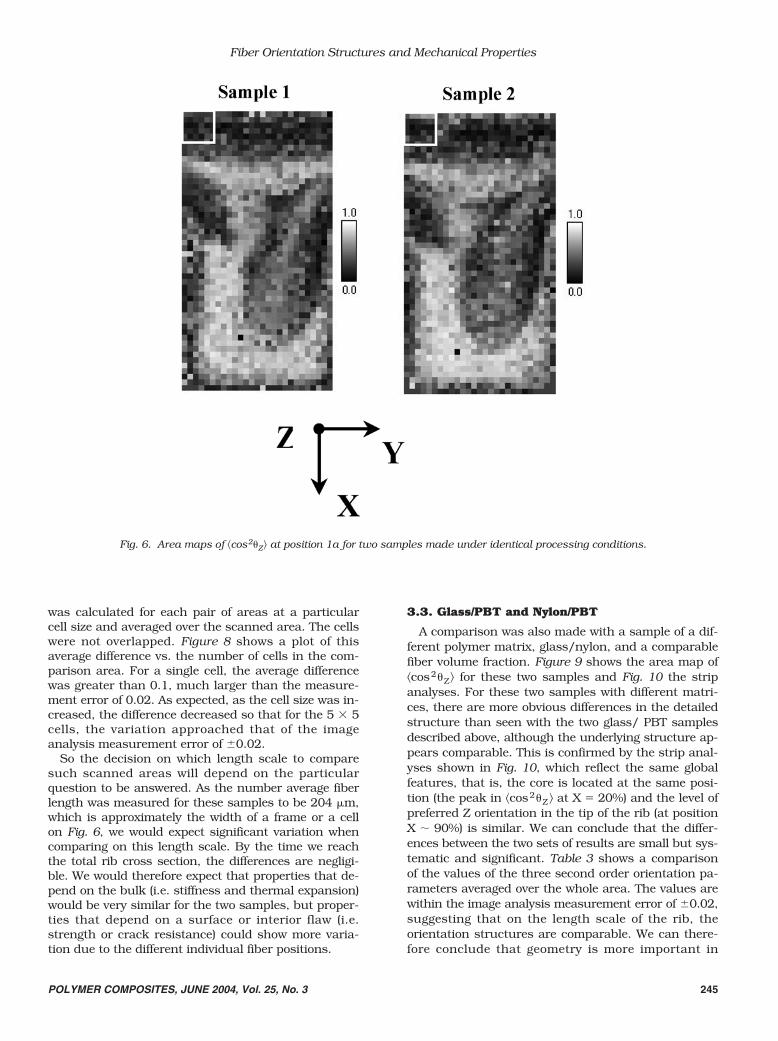
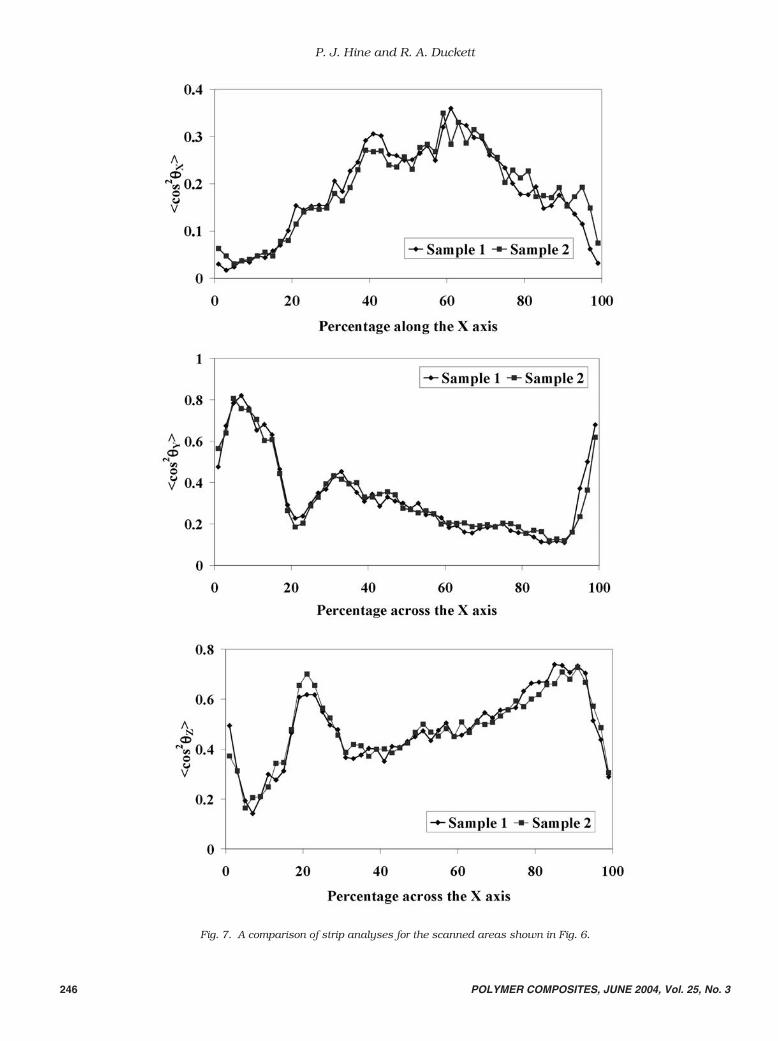
A similar position was examined on a second glass/PBT sample made under identical processing condi-tions. Figure 6 shows area maps of �cos2�Z� for thetwo samples and Fig. 7 the strip analyses for all threeorientation averages. On Fig. 6 each individual square(0.15 mm [X direction] � 0.17 mm [Y direction]) corre-sponds approximately to an individual image analysisframe. The area scans show a spatial structure thatqualitatively is very similar, while the strip analyses(Fig. 7 ) show good quantitative agreement between thetwo samples. This excellent agreement is confirmationof the reproducibility of the image analysis measure-ments as well as that of the samples.
If we were to look in detail at the image scans forthese two areas, we would see that on the length scaleof an individual fiber the samples have no clear corre-lation, i.e. individual fibers are in a different positionin the two components. However, by the time wereach the length scale of an image analysis frame, asrepresented by each individual square on Fig. 6, theagreement is much better, and by the time we averageover the whole area, as shown by the results in Table2, the agreement is excellent, particularly with regardto a typical image analysis measurement error of�0.02. This raises the issue of the ‘correct’ lengthscale to use when comparing such scanned areas, inorder to answer the question, ‘Is the fiber orientationin these two components the same?’
To assess this issue, the difference between the twoscanned areas was determined using a range of cellsizes, i.e. changing the size of the compared averagedarea. Square areas have been compared on each scan,ranging from 1 cell square, that is, comparing eachindividual element on Fig. 6, up to areas of 5 � 5 cellsindicated by the white boxes at top left of each scanarea. The average absolute difference for the three ori-entation averages, given by
: �1cos2 �1X � cos2 �2 X 2 � � �1cos2 �1
Y � cos2 �2Y 2 � � �1cos2 �1 Z � cos2 �2 Z 2 � ;
3,
P. J. Hine and R. A. Duckett
244 POLYMER COMPOSITES, JUNE 2004, Vol. 25, No. 3
Fig. 5. Strip analysis for image analysis scan for Rib 1a from glass/PBT sample.
Fiber Orientation Structures and Mechanical Properties
POLYMER COMPOSITES, JUNE 2004, Vol. 25, No. 3 245
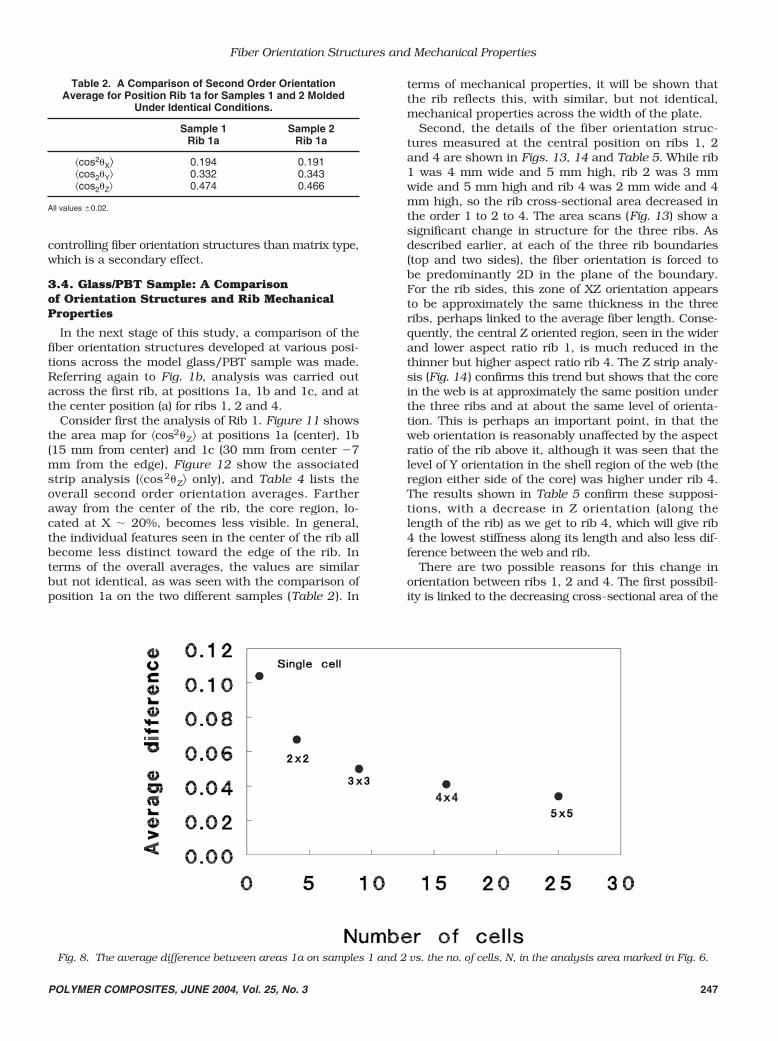
was calculated for each pair of areas at a particularcell size and averaged over the scanned area. The cellswere not overlapped. Figure 8 shows a plot of thisaverage difference vs. the number of cells in the com-parison area. For a single cell, the average differencewas greater than 0.1, much larger than the measure-ment error of 0.02. As expected, as the cell size was in-creased, the difference decreased so that for the 5 � 5cells, the variation approached that of the imageanalysis measurement error of �0.02.
So the decision on which length scale to comparesuch scanned areas will depend on the particularquestion to be answered. As the number average fiberlength was measured for these samples to be 204 �m,which is approximately the width of a frame or a cellon Fig. 6, we would expect significant variation whencomparing on this length scale. By the time we reachthe total rib cross section, the differences are negligi-ble. We would therefore expect that properties that de-pend on the bulk (i.e. stiffness and thermal expansion)would be very similar for the two samples, but proper-ties that depend on a surface or interior flaw (i.e.strength or crack resistance) could show more varia-tion due to the different individual fiber positions.
3.3. Glass/PBT and Nylon/PBT
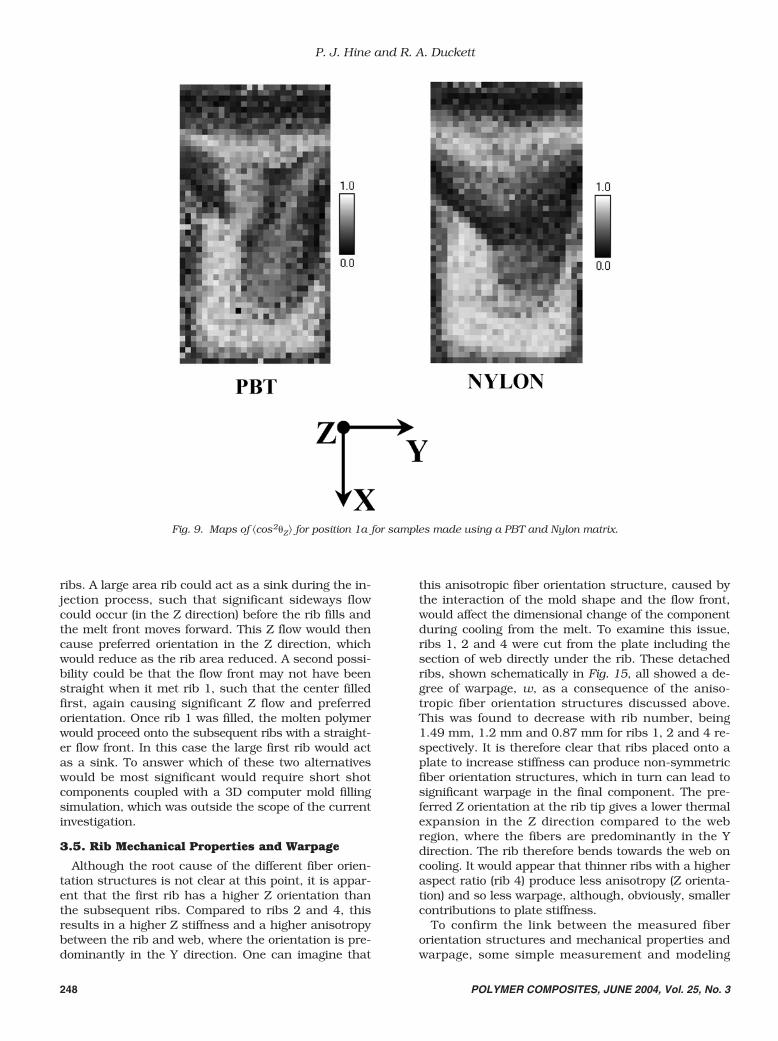
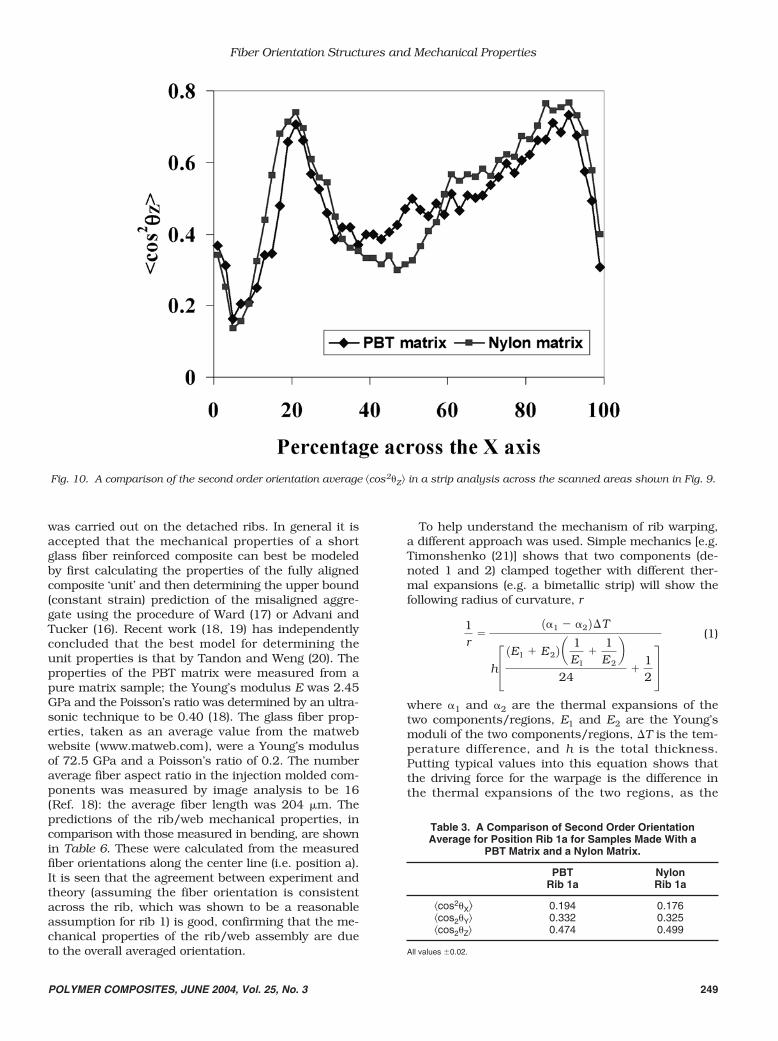
A comparison was also made with a sample of a dif-ferent polymer matrix, glass/nylon, and a comparablefiber volume fraction. Figure 9 shows the area map of�cos2�Z� for these two samples and Fig. 10 the stripanalyses. For these two samples with different matri-ces, there are more obvious differences in the detailedstructure than seen with the two glass/ PBT samplesdescribed above, although the underlying structure ap-pears comparable. This is confirmed by the strip anal-yses shown in Fig. 10, which reflect the same globalfeatures, that is, the core is located at the same posi-tion (the peak in �cos2�Z � at X 20%) and the level ofpreferred Z orientation in the tip of the rib (at positionX � 90%) is similar. We can conclude that the differ-ences between the two sets of results are small but sys-tematic and significant. Table 3 shows a comparisonof the values of the three second order orientation pa-rameters averaged over the whole area. The values arewithin the image analysis measurement error of �0.02,suggesting that on the length scale of the rib, theorientation structures are comparable. We can there-fore conclude that geometry is more important in
Fig. 6. Area maps of �cos2�Z� at position 1a for two samples made under identical processing conditions.
P. J. Hine and R. A. Duckett
246 POLYMER COMPOSITES, JUNE 2004, Vol. 25, No. 3
Fig. 7. A comparison of strip analyses for the scanned areas shown in Fig. 6.
controlling fiber orientation structures than matrix type,which is a secondary effect.
3.4. Glass/PBT Sample: A Comparisonof Orientation Structures and Rib MechanicalProperties
In the next stage of this study, a comparison of thefiber orientation structures developed at various posi-tions across the model glass/PBT sample was made.Referring again to Fig. 1b, analysis was carried outacross the first rib, at positions 1a, 1b and 1c, and atthe center position (a) for ribs 1, 2 and 4.
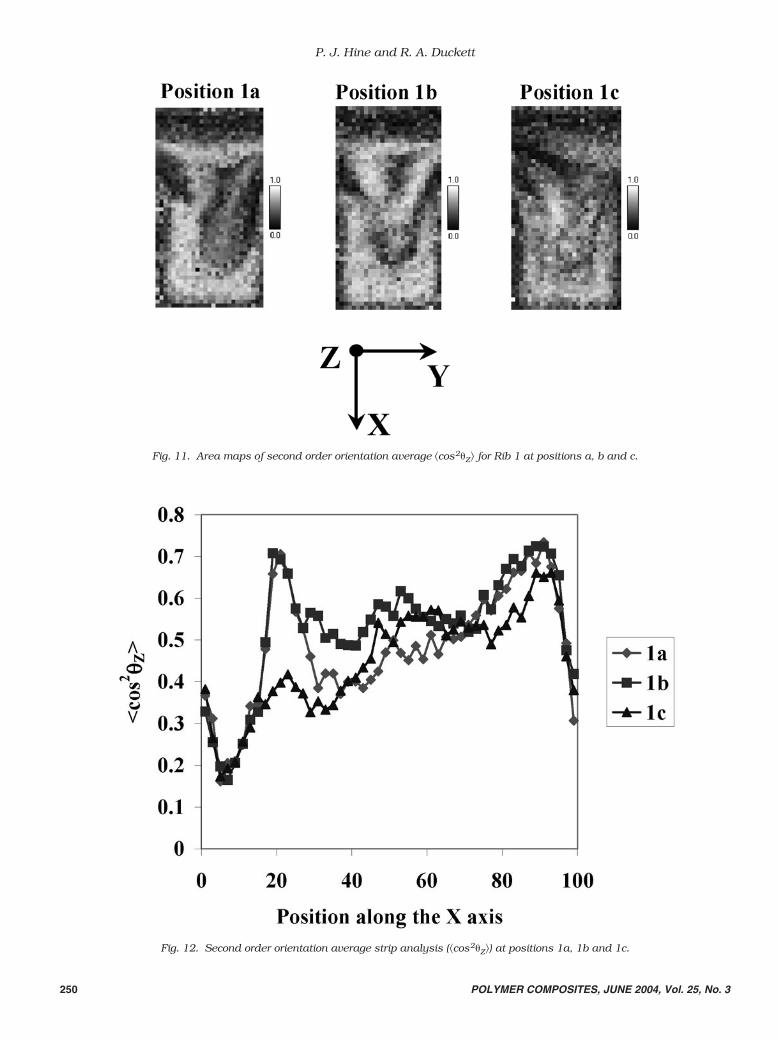
Consider first the analysis of Rib 1. Figure 11 showsthe area map for �cos2�Z� at positions 1a (center), 1b(15 mm from center) and 1c (30 mm from center �7mm from the edge), Figure 12 show the associatedstrip analysis (�cos2�Z� only), and Table 4 lists theoverall second order orientation averages. Fartheraway from the center of the rib, the core region, lo-cated at X � 20%, becomes less visible. In general,the individual features seen in the center of the rib allbecome less distinct toward the edge of the rib. Interms of the overall averages, the values are similarbut not identical, as was seen with the comparison ofposition 1a on the two different samples (Table 2 ). In
terms of mechanical properties, it will be shown thatthe rib reflects this, with similar, but not identical,mechanical properties across the width of the plate.
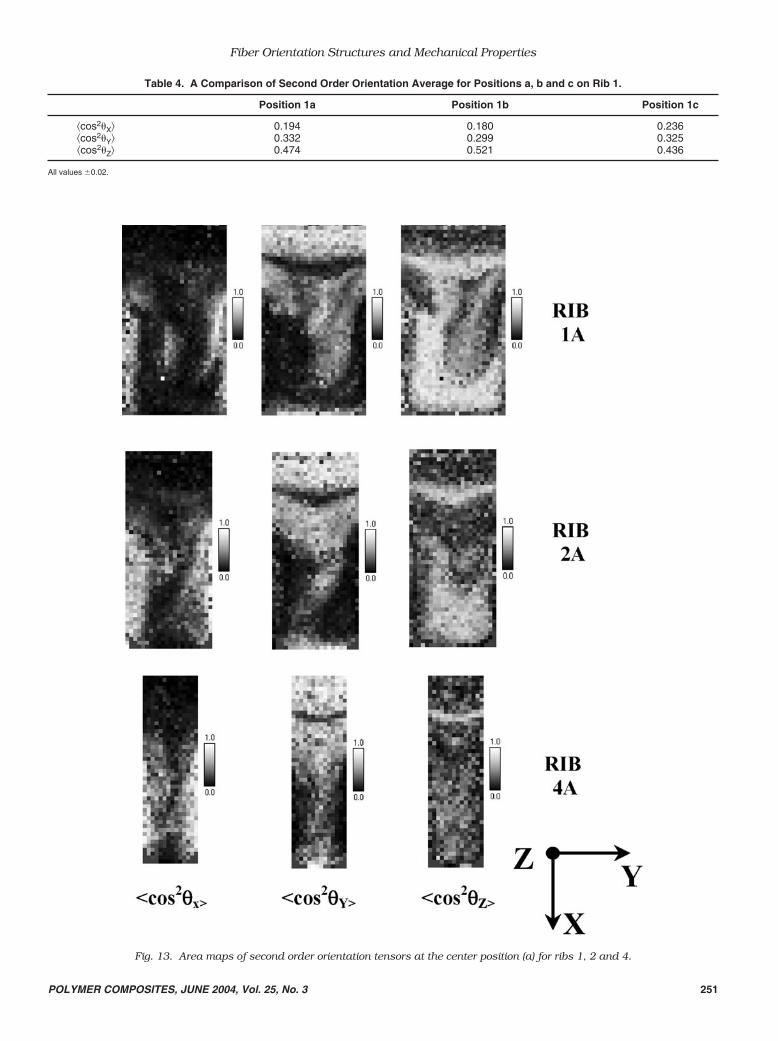
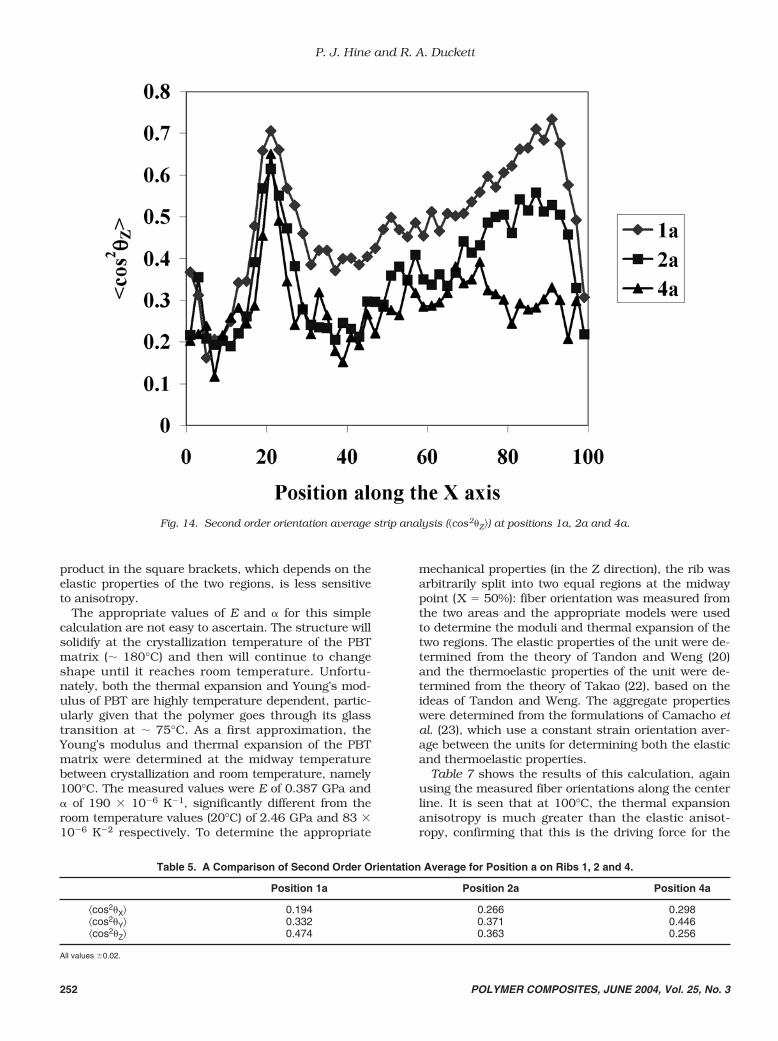
Second, the details of the fiber orientation struc-tures measured at the central position on ribs 1, 2and 4 are shown in Figs. 13, 14 and Table 5. While rib1 was 4 mm wide and 5 mm high, rib 2 was 3 mmwide and 5 mm high and rib 4 was 2 mm wide and 4mm high, so the rib cross-sectional area decreased inthe order 1 to 2 to 4. The area scans (Fig. 13) show asignificant change in structure for the three ribs. Asdescribed earlier, at each of the three rib boundaries(top and two sides), the fiber orientation is forced tobe predominantly 2D in the plane of the boundary.For the rib sides, this zone of XZ orientation appearsto be approximately the same thickness in the threeribs, perhaps linked to the average fiber length. Conse-quently, the central Z oriented region, seen in the widerand lower aspect ratio rib 1, is much reduced in thethinner but higher aspect ratio rib 4. The Z strip analy-sis (Fig. 14 ) confirms this trend but shows that the corein the web is at approximately the same position underthe three ribs and at about the same level of orienta-tion. This is perhaps an important point, in that theweb orientation is reasonably unaffected by the aspectratio of the rib above it, although it was seen that thelevel of Y orientation in the shell region of the web (theregion either side of the core) was higher under rib 4.The results shown in Table 5 confirm these supposi-tions, with a decrease in Z orientation (along thelength of the rib) as we get to rib 4, which will give rib4 the lowest stiffness along its length and also less dif-ference between the web and rib.
There are two possible reasons for this change inorientation between ribs 1, 2 and 4. The first possibil-ity is linked to the decreasing cross-sectional area of the
Fiber Orientation Structures and Mechanical Properties
POLYMER COMPOSITES, JUNE 2004, Vol. 25, No. 3 247
Table 2. A Comparison of Second Order Orientation Average for Position Rib 1a for Samples 1 and 2 Molded
Under Identical Conditions.
Sample 1 Sample 2Rib 1a Rib 1a
�cos2�X� 0.194 0.191�cos2�Y� 0.332 0.343�cos2�Z� 0.474 0.466
All values �0.02.
Fig. 8. The average difference between areas 1a on samples 1 and 2 vs. the no. of cells, N, in the analysis area marked in Fig. 6.
P. J. Hine and R. A. Duckett
248 POLYMER COMPOSITES, JUNE 2004, Vol. 25, No. 3
ribs. A large area rib could act as a sink during the in-jection process, such that significant sideways flowcould occur (in the Z direction) before the rib fills andthe melt front moves forward. This Z flow would thencause preferred orientation in the Z direction, whichwould reduce as the rib area reduced. A second possi-bility could be that the flow front may not have beenstraight when it met rib 1, such that the center filledfirst, again causing significant Z flow and preferredorientation. Once rib 1 was filled, the molten polymerwould proceed onto the subsequent ribs with a straight-er flow front. In this case the large first rib would actas a sink. To answer which of these two alternativeswould be most significant would require short shotcomponents coupled with a 3D computer mold fillingsimulation, which was outside the scope of the currentinvestigation.
3.5. Rib Mechanical Properties and Warpage
Although the root cause of the different fiber orien-tation structures is not clear at this point, it is appar-ent that the first rib has a higher Z orientation thanthe subsequent ribs. Compared to ribs 2 and 4, thisresults in a higher Z stiffness and a higher anisotropybetween the rib and web, where the orientation is pre-dominantly in the Y direction. One can imagine that
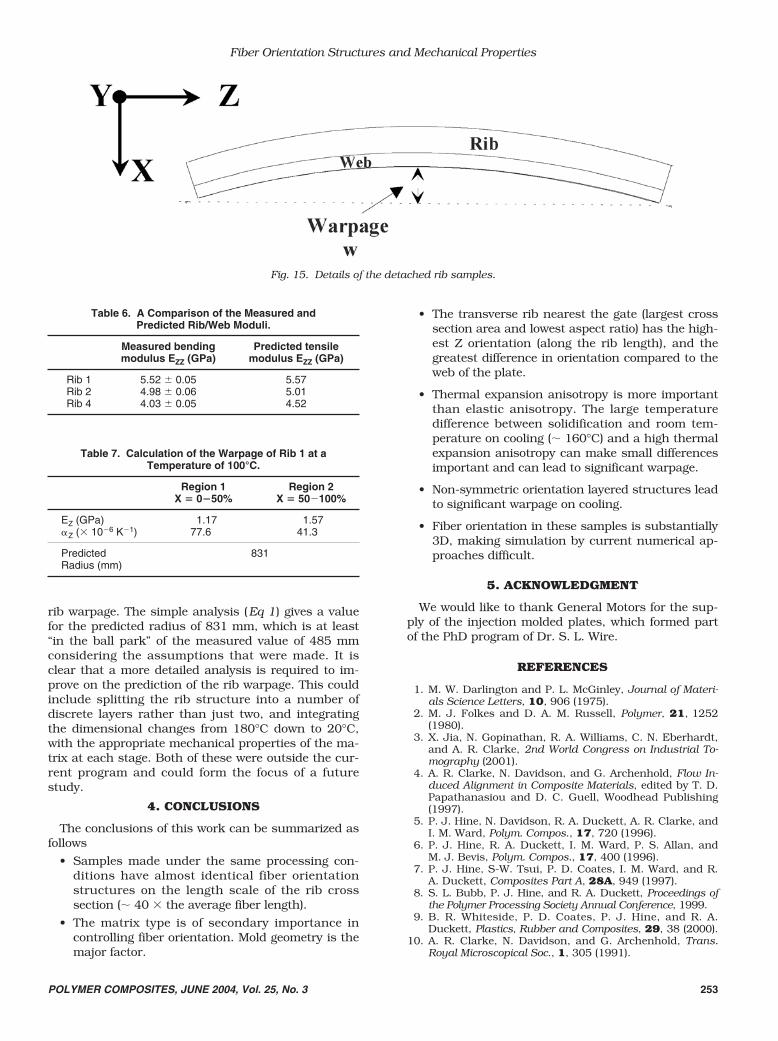
this anisotropic fiber orientation structure, caused bythe interaction of the mold shape and the flow front,would affect the dimensional change of the componentduring cooling from the melt. To examine this issue,ribs 1, 2 and 4 were cut from the plate including thesection of web directly under the rib. These detachedribs, shown schematically in Fig. 15, all showed a de-gree of warpage, w, as a consequence of the aniso-tropic fiber orientation structures discussed above.This was found to decrease with rib number, being1.49 mm, 1.2 mm and 0.87 mm for ribs 1, 2 and 4 re-spectively. It is therefore clear that ribs placed onto aplate to increase stiffness can produce non-symmetricfiber orientation structures, which in turn can lead tosignificant warpage in the final component. The pre-ferred Z orientation at the rib tip gives a lower thermalexpansion in the Z direction compared to the webregion, where the fibers are predominantly in the Ydirection. The rib therefore bends towards the web oncooling. It would appear that thinner ribs with a higheraspect ratio (rib 4) produce less anisotropy (Z orienta-tion) and so less warpage, although, obviously, smallercontributions to plate stiffness.
To confirm the link between the measured fiberorientation structures and mechanical properties andwarpage, some simple measurement and modeling
Fig. 9. Maps of �cos2�Z� for position 1a for samples made using a PBT and Nylon matrix.
Fiber Orientation Structures and Mechanical Properties
POLYMER COMPOSITES, JUNE 2004, Vol. 25, No. 3 249
was carried out on the detached ribs. In general it isaccepted that the mechanical properties of a shortglass fiber reinforced composite can best be modeledby first calculating the properties of the fully alignedcomposite ‘unit’ and then determining the upper bound(constant strain) prediction of the misaligned aggre-gate using the procedure of Ward (17) or Advani andTucker (16). Recent work (18, 19) has independentlyconcluded that the best model for determining theunit properties is that by Tandon and Weng (20). Theproperties of the PBT matrix were measured from apure matrix sample; the Young’s modulus E was 2.45GPa and the Poisson’s ratio was determined by an ultra-sonic technique to be 0.40 (18). The glass fiber prop-erties, taken as an average value from the matwebwebsite (www.matweb.com), were a Young’s modulusof 72.5 GPa and a Poisson’s ratio of 0.2. The numberaverage fiber aspect ratio in the injection molded com-ponents was measured by image analysis to be 16(Ref. 18): the average fiber length was 204 �m. Thepredictions of the rib/web mechanical properties, incomparison with those measured in bending, are shownin Table 6. These were calculated from the measuredfiber orientations along the center line (i.e. position a).It is seen that the agreement between experiment andtheory (assuming the fiber orientation is consistentacross the rib, which was shown to be a reasonableassumption for rib 1) is good, confirming that the me-chanical properties of the rib/web assembly are dueto the overall averaged orientation.
To help understand the mechanism of rib warping,a different approach was used. Simple mechanics [e.g.Timonshenko (21)] shows that two components (de-noted 1 and 2) clamped together with different ther-mal expansions (e.g. a bimetallic strip) will show thefollowing radius of curvature, r
(1)
where 1 and 2 are the thermal expansions of thetwo components/regions, E1 and E2 are the Young’smoduli of the two components/regions, �T is the tem-perature difference, and h is the total thickness.Putting typical values into this equation shows thatthe driving force for the warpage is the difference inthe thermal expansions of the two regions, as the
1r
�11 � 2 2¢T
h £1E1 � E2 2 a 1
E1�
1E2b
24�
12§
Fig. 10. A comparison of the second order orientation average �cos2�Z� in a strip analysis across the scanned areas shown in Fig. 9.
Table 3. A Comparison of Second Order Orientation Average for Position Rib 1a for Samples Made With a
PBT Matrix and a Nylon Matrix.
PBT NylonRib 1a Rib 1a
�cos2�X� 0.194 0.176�cos2�Y� 0.332 0.325�cos2�Z� 0.474 0.499
All values �0.02.
P. J. Hine and R. A. Duckett
250 POLYMER COMPOSITES, JUNE 2004, Vol. 25, No. 3
Fig. 11. Area maps of second order orientation average �cos2�Z� for Rib 1 at positions a, b and c.
Fig. 12. Second order orientation average strip analysis (�cos2�Z�) at positions 1a, 1b and 1c.
Fiber Orientation Structures and Mechanical Properties
POLYMER COMPOSITES, JUNE 2004, Vol. 25, No. 3 251
Table 4. A Comparison of Second Order Orientation Average for Positions a, b and c on Rib 1.
Position 1a Position 1b Position 1c
�cos2�X� 0.194 0.180 0.236�cos2�Y� 0.332 0.299 0.325�cos2�Z� 0.474 0.521 0.436
All values �0.02.
Fig. 13. Area maps of second order orientation tensors at the center position (a) for ribs 1, 2 and 4.
product in the square brackets, which depends on theelastic properties of the two regions, is less sensitiveto anisotropy.
The appropriate values of E and for this simplecalculation are not easy to ascertain. The structure willsolidify at the crystallization temperature of the PBTmatrix (� 180°C) and then will continue to changeshape until it reaches room temperature. Unfortu-nately, both the thermal expansion and Young’s mod-ulus of PBT are highly temperature dependent, partic-ularly given that the polymer goes through its glasstransition at � 75°C. As a first approximation, theYoung’s modulus and thermal expansion of the PBTmatrix were determined at the midway temperaturebetween crystallization and room temperature, namely100°C. The measured values were E of 0.387 GPa and of 190 � 10�6 K�1, significantly different from theroom temperature values (20°C) of 2.46 GPa and 83 �10�6 K�2 respectively. To determine the appropriate
mechanical properties (in the Z direction), the rib wasarbitrarily split into two equal regions at the midwaypoint (X 50%): fiber orientation was measured fromthe two areas and the appropriate models were usedto determine the moduli and thermal expansion of thetwo regions. The elastic properties of the unit were de-termined from the theory of Tandon and Weng (20)and the thermoelastic properties of the unit were de-termined from the theory of Takao (22), based on theideas of Tandon and Weng. The aggregate propertieswere determined from the formulations of Camacho etal. (23), which use a constant strain orientation aver-age between the units for determining both the elasticand thermoelastic properties.
Table 7 shows the results of this calculation, againusing the measured fiber orientations along the centerline. It is seen that at 100°C, the thermal expansionanisotropy is much greater than the elastic anisot-ropy, confirming that this is the driving force for the
P. J. Hine and R. A. Duckett
252 POLYMER COMPOSITES, JUNE 2004, Vol. 25, No. 3
Fig. 14. Second order orientation average strip analysis (�cos2�Z�) at positions 1a, 2a and 4a.
Table 5. A Comparison of Second Order Orientation Average for Position a on Ribs 1, 2 and 4.
Position 1a Position 2a Position 4a
�cos2�X� 0.194 0.266 0.298�cos2�Y� 0.332 0.371 0.446�cos2�Z� 0.474 0.363 0.256
All values �0.02.
Fiber Orientation Structures and Mechanical Properties
POLYMER COMPOSITES, JUNE 2004, Vol. 25, No. 3 253
rib warpage. The simple analysis (Eq 1) gives a valuefor the predicted radius of 831 mm, which is at least“in the ball park” of the measured value of 485 mmconsidering the assumptions that were made. It isclear that a more detailed analysis is required to im-prove on the prediction of the rib warpage. This couldinclude splitting the rib structure into a number ofdiscrete layers rather than just two, and integratingthe dimensional changes from 180°C down to 20°C,with the appropriate mechanical properties of the ma-trix at each stage. Both of these were outside the cur-rent program and could form the focus of a futurestudy.
4. CONCLUSIONS
The conclusions of this work can be summarized asfollows
• Samples made under the same processing con-ditions have almost identical fiber orientationstructures on the length scale of the rib crosssection (� 40 � the average fiber length).
• The matrix type is of secondary importance incontrolling fiber orientation. Mold geometry is themajor factor.
• The transverse rib nearest the gate (largest crosssection area and lowest aspect ratio) has the high-est Z orientation (along the rib length), and thegreatest difference in orientation compared to theweb of the plate.
• Thermal expansion anisotropy is more importantthan elastic anisotropy. The large temperaturedifference between solidification and room tem-perature on cooling (� 160°C) and a high thermalexpansion anisotropy can make small differencesimportant and can lead to significant warpage.
• Non-symmetric orientation layered structures leadto significant warpage on cooling.
• Fiber orientation in these samples is substantially3D, making simulation by current numerical ap-proaches difficult.
5. ACKNOWLEDGMENT
We would like to thank General Motors for the sup-ply of the injection molded plates, which formed partof the PhD program of Dr. S. L. Wire.
REFERENCES
1. M. W. Darlington and P. L. McGinley, Journal of Materi-als Science Letters, 10, 906 (1975).
2. M. J. Folkes and D. A. M. Russell, Polymer, 21, 1252(1980).
3. X. Jia, N. Gopinathan, R. A. Williams, C. N. Eberhardt,and A. R. Clarke, 2nd World Congress on Industrial To-mography (2001).
4. A. R. Clarke, N. Davidson, and G. Archenhold, Flow In-duced Alignment in Composite Materials, edited by T. D.Papathanasiou and D. C. Guell, Woodhead Publishing(1997).
5. P. J. Hine, N. Davidson, R. A. Duckett, A. R. Clarke, andI. M. Ward, Polym. Compos., 17, 720 (1996).
6. P. J. Hine, R. A. Duckett, I. M. Ward, P. S. Allan, andM. J. Bevis, Polym. Compos., 17, 400 (1996).
7. P. J. Hine, S-W. Tsui, P. D. Coates, I. M. Ward, and R.A. Duckett, Composites Part A, 28A, 949 (1997).
8. S. L. Bubb, P. J. Hine, and R. A. Duckett, Proceedings ofthe Polymer Processing Society Annual Conference, 1999.
9. B. R. Whiteside, P. D. Coates, P. J. Hine, and R. A.Duckett, Plastics, Rubber and Composites, 29, 38 (2000).
10. A. R. Clarke, N. Davidson, and G. Archenhold, Trans.Royal Microscopical Soc., 1, 305 (1991).
Fig. 15. Details of the detached rib samples.
Table 6. A Comparison of the Measured andPredicted Rib/Web Moduli.
Measured bending Predicted tensilemodulus EZZ (GPa) modulus EZZ (GPa)
Rib 1 5.52 � 0.05 5.57Rib 2 4.98 � 0.06 5.01Rib 4 4.03 � 0.05 4.52
Table 7. Calculation of the Warpage of Rib 1 at aTemperature of 100°C.
Region 1 Region 2X � 0�50% X � 50�100%
EZ (GPa) 1.17 1.57Z (� 10�6 K�1) 77.6 41.3
Predicted 831Radius (mm)

P. J. Hine and R. A. Duckett
254 POLYMER COMPOSITES, JUNE 2004, Vol. 25, No. 3
11. A. R. Clarke, N. Davidson, and G. Archenhold, Proceed-ings of Transputing, edited by P. Welch, IOS Press(1991).
12. S. L. Bubb, PhD thesis, Fiber Orientation in InjectionMolded Composites, University of Leeds (2001).
13. K. Thomas and P. E. Meyer, Plastics and Rubber: Pro-cessing and Applications, 1, 99 (1976).
14. M. J. Owen and K. Whybrew, Plastics and Rubber: Pro-cessing and Applications, 1, 231 (1976).
15. B. E. VerWeyst, C. L. Tucker III, P. H. Foss, and J. F.O’Gara, International Polymer Processing, 14, 409(1999).
16. S. G. Advani and C. L. Tucker III, Journal of Rheology,31, 751 (1987).
17. I. M. Ward, Proceedings of the Physical Society, 80,1176 (1962).
18. S. L. Wire, PhD thesis, Fiber Orientation and MechanicalProperties of Fiber Reinforced Composites, University ofLeeds (1998).
19. C. L. Tucker III and E. Liang, Composites Science andTechnology, 59, 655 (1999).
20. G. P. Tandon and G. J. Weng, Polym. Compos., 5, 327(1984).
21. S. Timonshenko, Strength of Materials, Part I, Van Nos-trand Reinhold Company, England (1980).
22. Y. Takao and M. Taya, Transactions of the ASME, Jour-nal of Applied Mechanics, 52, 806�810 (1995).
23. C. W. Camacho and C. L. Tucker, Polym. Compos., 11,229 (1990).