Embed Size (px)
Citation preview
FHWA Traveler Analysis FrameworkPart IIStatus Report
AMPO Travel Modeling MeetingWashington, D.C.November 5, 2010
Daniel Jenkins, FHWADon Vary, WSA
FHWA TAF Part II
• FHWA Leading Office and Program ManagerOffice of Highway Policy Information (OHPI)Danny Jenkins, [email protected]
• Team Roger Mingo, WSA, RSG, Matt Coogan
• Aided by expert panel – Academicians, practitioners (MPO, state DOT),
private sector
Traveler Analysis Framework • Background/Purpose
– Development of long-distance multimodal passenger flows for demand analysis
• Motivation– Inconsistent/non-existent data– Expense of “one-off” surveys– Growing importance of multi-regional,
corridor and multinational analysis– Need for policy analysis – price,
demographics– Travel market: high VMT, often high-value
TAF - Evolutionary Process
• 2010 FHWA OHPI Travel “Roadmap” – Track 1– Use of existing data for current and future
flows– Assign to national network– Focus of this study
• 2010 FHWA OHPI Travel “Roadmap” – Track 2– Design/implement new household travel
survey– Develop new models

Preliminary Thoughts and Approached Offered by
the Team
FHWA TAF Part II
• Status– First panel meeting November 18 to lay out
basic methodology– 18 month timeframe
Data Sources
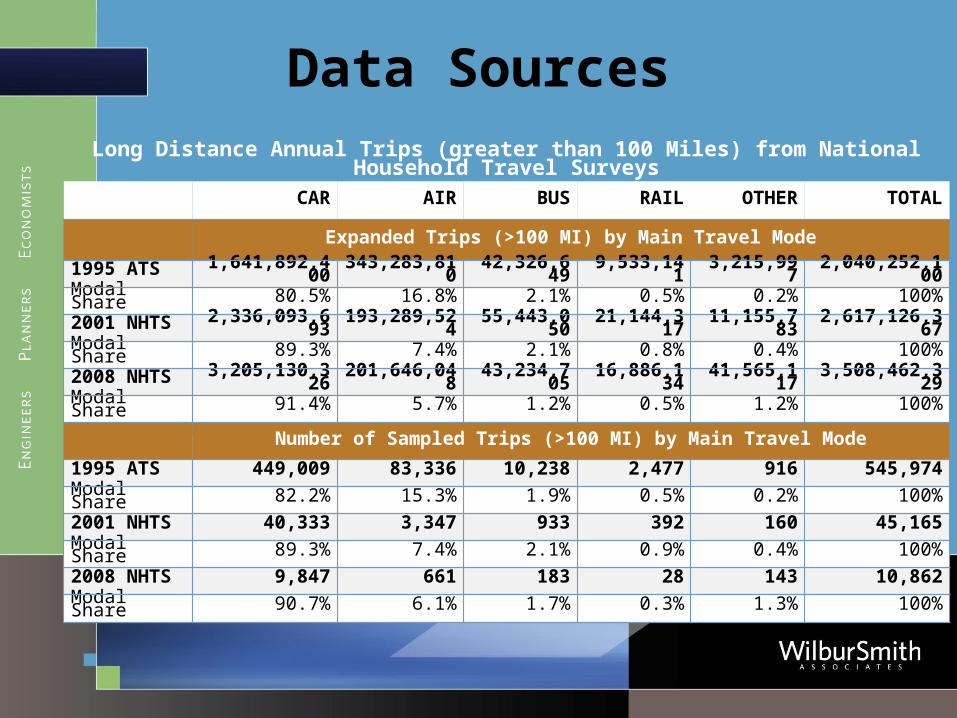
Long Distance Annual Trips (greater than 100 Miles) from National Household Travel Surveys
CAR AIR BUS RAIL OTHER TOTAL
Expanded Trips (>100 MI) by Main Travel Mode
1995 ATS 1,641,892,400 343,283,810 42,326,649 9,533,141 3,215,997 2,040,252,100Modal Share 80.5% 16.8% 2.1% 0.5% 0.2% 100%2001 NHTS 2,336,093,693 193,289,524 55,443,050 21,144,317 11,155,783 2,617,126,367Modal Share 89.3% 7.4% 2.1% 0.8% 0.4% 100%2008 NHTS 3,205,130,326 201,646,048 43,234,705 16,886,134 41,565,117 3,508,462,329Modal Share 91.4% 5.7% 1.2% 0.5% 1.2% 100%
Number of Sampled Trips (>100 MI) by Main Travel Mode
1995 ATS 449,009 83,336 10,238 2,477 916 545,974Modal Share 82.2% 15.3% 1.9% 0.5% 0.2% 100%2001 NHTS 40,333 3,347 933 392 160 45,165Modal Share 89.3% 7.4% 2.1% 0.9% 0.4% 100%2008 NHTS 9,847 661 183 28 143 10,862Modal Share 90.7% 6.1% 1.7% 0.3% 1.3% 100%
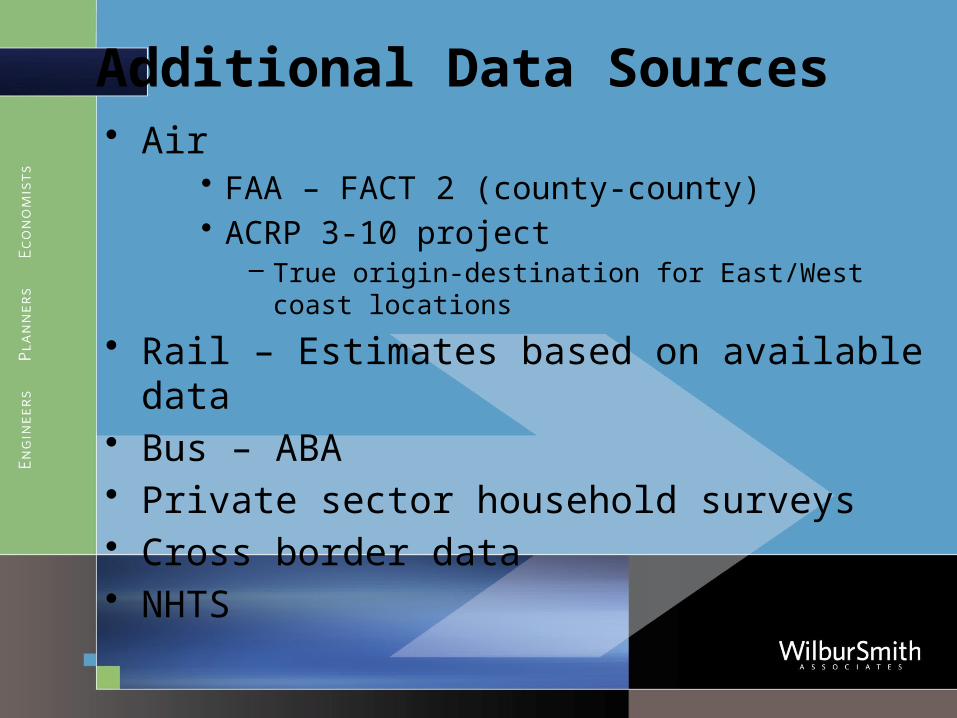
Additional Data Sources • Air
• FAA – FACT 2 (county-county)• ACRP 3-10 project
– True origin-destination for East/West coast locations
• Rail – Estimates based on available data• Bus – ABA• Private sector household surveys • Cross border data• NHTS
Issues/Parameters
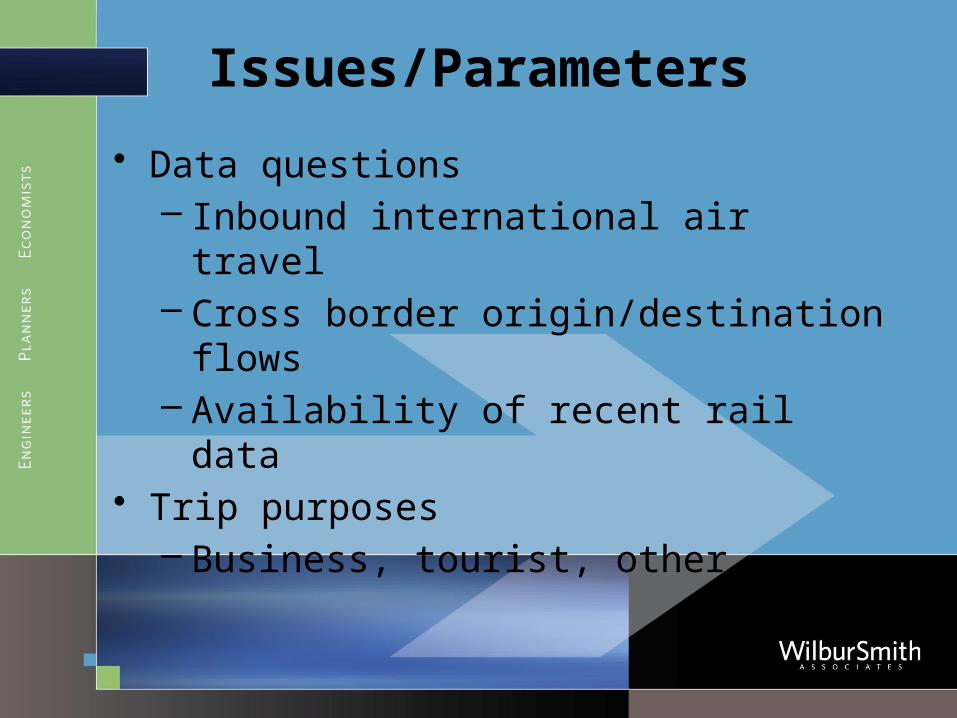
• Data questions– Inbound international air travel– Cross border origin/destination flows– Availability of recent rail data
• Trip purposes– Business, tourist, other

Issues/Parameters
• Long distance >= 100 miles• Geography
– Build from smallest geography to state level

Validation
• Reviews of flows relative to activity centers
• Comparison of flows as percentage of total from HPMS
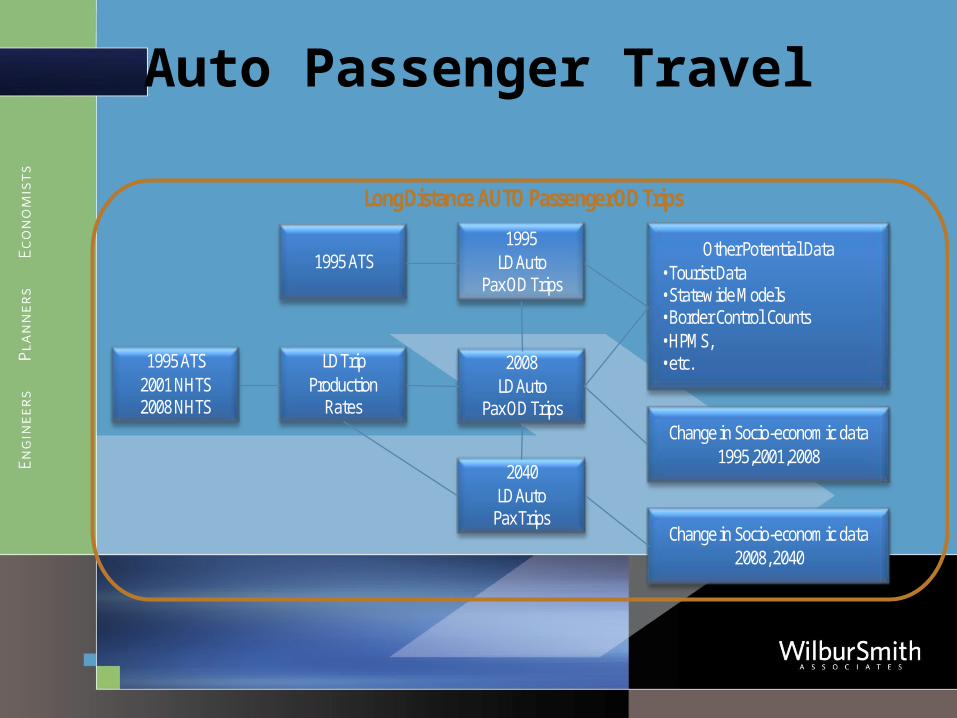
Auto Passenger Travel
Long Distance AUTO Passenger OD Trips
1995 ATS1995
LD Auto Pax OD Trips
Change in Socio-economic data2008, 2040
2040LD Auto
Pax Trips
LD TripProduction
Rates
2008LD Auto
Pax OD TripsChange in Socio-economic data
1995,2001,2008
Other Potential Data• Tourist Data• Statewide Models•Border Control Counts•HPMS, • etc.1995 ATS
2001 NHTS2008 NHTS
Long Distance RAIL Passenger OD Trips
2008Amtrak Station to Station Data
2008LD Rail
Pax OD Trips
Change in Socio-economic Data
2008, 2040
2008Socio-economic
Data
2040LD Rail
Pax OD Trips
MethodologySimilar to FATE
for air trips
Long Distance AIR Passenger OD Trips
Methodology2008
Air Pax OD TripsMajor Airports
Major AirportsAccess/Egress
Surveys
10% Air Tickets Survey Major
Airports
2040 Air Pax OD
Trips
Change in Socio-economic Data
2008, 2040
2030 FAAAerospace & Terminal
Area Forecasts
FATE ModelFuture Air Traffic
Estimator
2008Air Pax OD
Trips
Socio-economic Data2008
2008Air Pax OD Trips
All Other Airports
10% Air Tickets Survey
All Other Airports
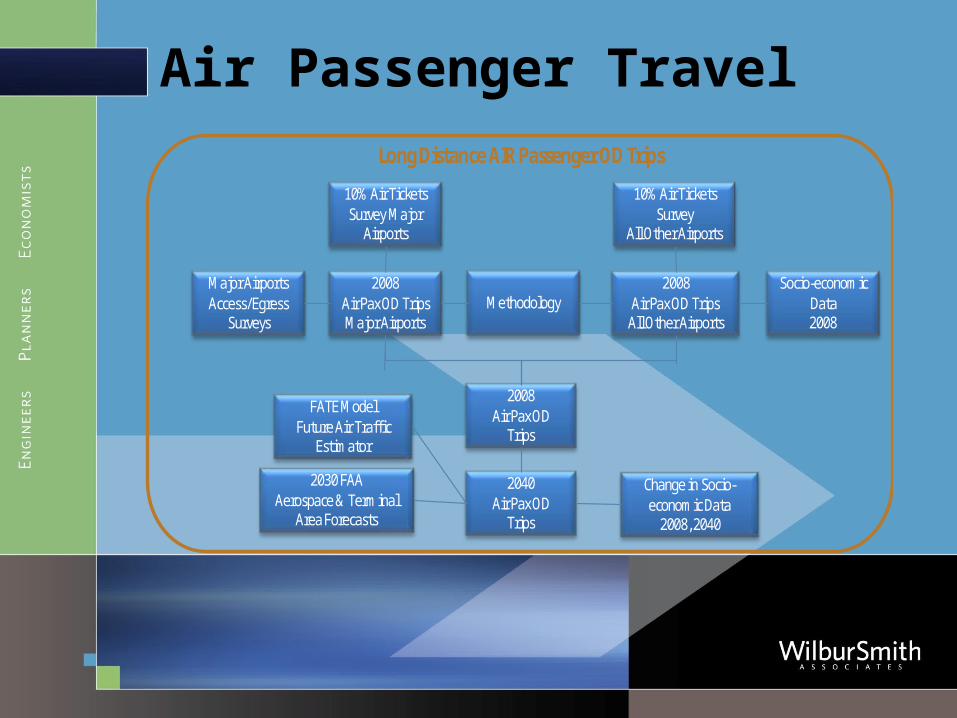
Air Passenger Travel
Long Distance AUTO Passenger OD Trips
1995 ATS1995
LD Auto Pax OD Trips
Change in Socio-economic data2008, 2040
2040LD Auto
Pax Trips
LD TripProduction
Rates
2008LD Auto
Pax OD TripsChange in Socio-economic data
1995,2001,2008
Other Potential Data• Tourist Data• Statewide Models•Border Control Counts•HPMS, • etc.1995 ATS
2001 NHTS2008 NHTS
Long Distance RAIL Passenger OD Trips
2008Amtrak Station to Station Data
2008LD Rail
Pax OD Trips
Change in Socio-economic Data
2008, 2040
2008Socio-economic
Data
2040LD Rail
Pax OD Trips
MethodologySimilar to FATE
for air trips
Long Distance AIR Passenger OD Trips
Methodology2008
Air Pax OD TripsMajor Airports
Major AirportsAccess/Egress
Surveys
10% Air Tickets Survey Major
Airports
2040 Air Pax OD
Trips
Change in Socio-economic Data
2008, 2040
2030 FAAAerospace & Terminal
Area Forecasts
FATE ModelFuture Air Traffic
Estimator
2008Air Pax OD
Trips
Socio-economic Data2008
2008Air Pax OD Trips
All Other Airports
10% Air Tickets Survey
All Other Airports
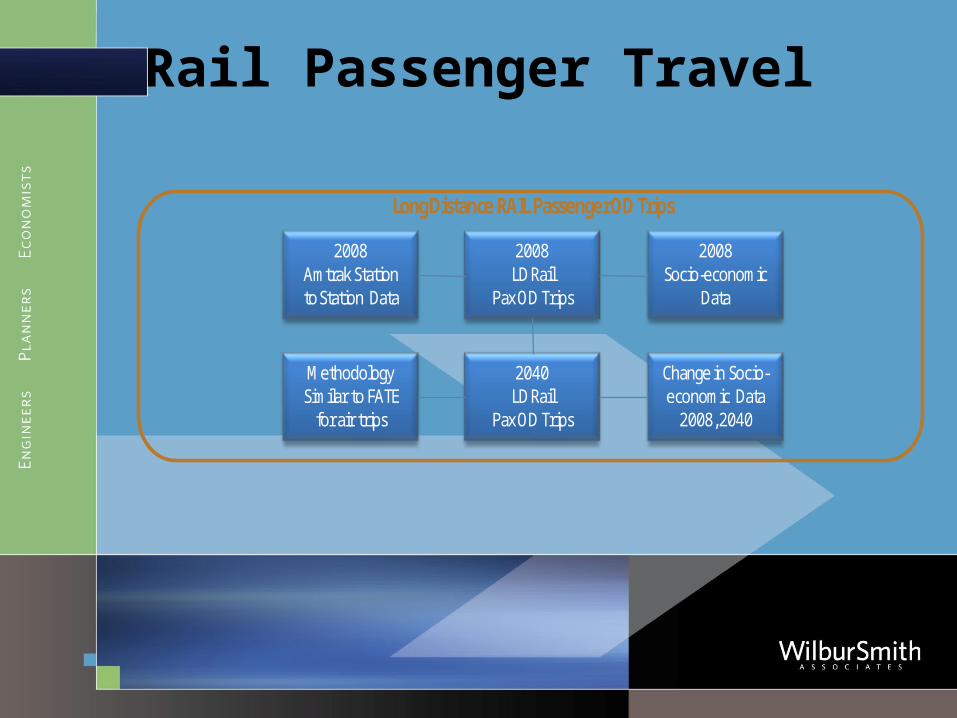
Rail Passenger Travel
Long Distance AUTO Passenger OD Trips
1995 ATS1995
LD Auto Pax OD Trips
Change in Socio-economic data2008, 2040
2040LD Auto
Pax Trips
LD TripProduction
Rates
2008LD Auto
Pax OD TripsChange in Socio-economic data
1995,2001,2008
Other Potential Data• Tourist Data• Statewide Models•Border Control Counts•HPMS, • etc.1995 ATS
2001 NHTS2008 NHTS
Long Distance RAIL Passenger OD Trips
2008Amtrak Station to Station Data
2008LD Rail
Pax OD Trips
Change in Socio-economic Data
2008, 2040
2008Socio-economic
Data
2040LD Rail
Pax OD Trips
MethodologySimilar to FATE
for air trips
Long Distance AIR Passenger OD Trips
Methodology2008
Air Pax OD TripsMajor Airports
Major AirportsAccess/Egress
Surveys
10% Air Tickets Survey Major
Airports
2040 Air Pax OD
Trips
Change in Socio-economic Data
2008, 2040
2030 FAAAerospace & Terminal
Area Forecasts
FATE ModelFuture Air Traffic
Estimator
2008Air Pax OD
Trips
Socio-economic Data2008
2008Air Pax OD Trips
All Other Airports
10% Air Tickets Survey
All Other Airports