Embed Size (px)
Citation preview
Current Guidelines and Evidence for Inpatient Hyperglycemic Control
Curtis L. Triplitt, Pharm.D., CDEAssociate Director
Diabetes Research Center Texas Diabetes Institute
Associate ProfessorDepartment of Medicine, Division of Diabetes
University of Texas Health Science Center at San AntonioSan Antonio, Texas
8%9%4%5%
31%
Hospitalizations
Nursing home
Office visits
ER visits
Outpatient clinics
Outpatient meds andsupplies
Hospitalizations Account for Largest Portion of Direct Cost of Diabetes Care
American Diabetes Association. Diabetes Care. 2013; 36:1033-46.
2012 Total direct cost: $176 billion
43%
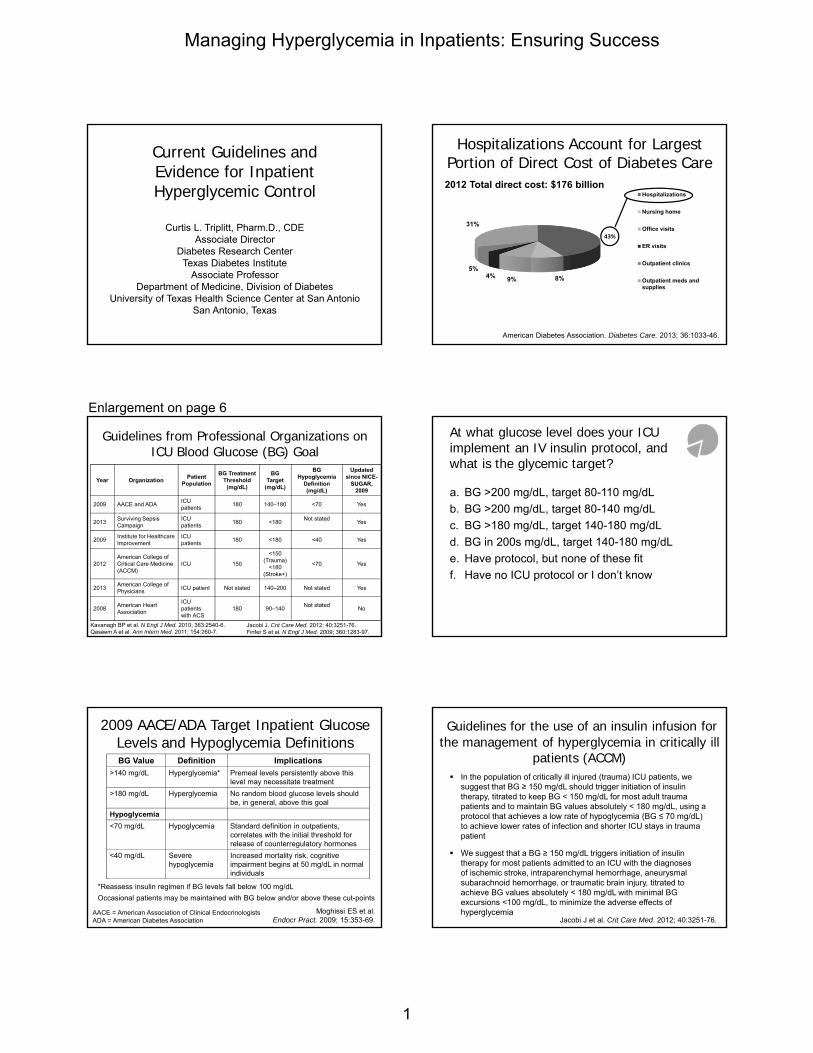
Kavanagh BP et al. N Engl J Med. 2010; 363:2540-6.Qaseem A et al. Ann Intern Med. 2011; 154:260-7.
Year OrganizationPatient
Population
BG Treatment Threshold
(mg/dL)
BG Target
(mg/dL)
BG Hypoglycemia
Definition(mg/dL)
Updated since NICE-
SUGAR, 2009
2009 AACE and ADAICU patients
180 140–180 <70 Yes
2013Surviving Sepsis Campaign
ICU patients
180 <180Not stated
Yes
2009Institute for Healthcare Improvement
ICU patients
180 <180 <40 Yes
2012American College of Critical Care Medicine (ACCM)
ICU 150
<150 (Trauma)
<180(Stroke+)
<70 Yes
2013American College of Physicians
ICU patient Not stated 140–200 Not stated Yes
2008American Heart Association
ICU patients with ACS
180 90–140Not stated
No
Guidelines from Professional Organizations on ICU Blood Glucose (BG) Goal
Jacobi J. Crit Care Med. 2012; 40:3251-76.Finfer S et al. N Engl J Med. 2009; 360:1283-97.
a. BG >200 mg/dL, target 80-110 mg/dL
b. BG >200 mg/dL, target 80-140 mg/dL
c. BG >180 mg/dL, target 140-180 mg/dL
d. BG in 200s mg/dL, target 140-180 mg/dL
e. Have protocol, but none of these fit
f. Have no ICU protocol or I don’t know
At what glucose level does your ICU implement an IV insulin protocol, and what is the glycemic target?
2009 AACE/ADA Target Inpatient Glucose Levels and Hypoglycemia DefinitionsBG Value Definition Implications
>140 mg/dL Hyperglycemia* Premeal levels persistently above this level may necessitate treatment
>180 mg/dL Hyperglycemia No random blood glucose levels should be, in general, above this goal
Hypoglycemia
<70 mg/dL Hypoglycemia Standard definition in outpatients, correlates with the initial threshold for release of counterregulatory hormones
<40 mg/dL Severe hypoglycemia
Increased mortality risk, cognitive impairment begins at 50 mg/dL in normal individuals
*Reassess insulin regimen if BG levels fall below 100 mg/dL
Occasional patients may be maintained with BG below and/or above these cut-points
Moghissi ES et al. Endocr Pract. 2009; 15:353-69.
AACE = American Association of Clinical EndocrinologistsADA = American Diabetes Association
Guidelines for the use of an insulin infusion for the management of hyperglycemia in critically ill
patients (ACCM) In the population of critically ill injured (trauma) ICU patients, we
suggest that BG ≥ 150 mg/dL should trigger initiation of insulin therapy, titrated to keep BG < 150 mg/dL for most adult trauma patients and to maintain BG values absolutely < 180 mg/dL, using a protocol that achieves a low rate of hypoglycemia (BG ≤ 70 mg/dL) to achieve lower rates of infection and shorter ICU stays in trauma patient
We suggest that a BG ≥ 150 mg/dL triggers initiation of insulin therapy for most patients admitted to an ICU with the diagnosesof ischemic stroke, intraparenchymal hemorrhage, aneurysmal subarachnoid hemorrhage, or traumatic brain injury, titrated to achieve BG values absolutely < 180 mg/dL with minimal BG excursions <100 mg/dL, to minimize the adverse effects of hyperglycemia
Jacobi J et al. Crit Care Med. 2012; 40:3251-76.
Enlargement on page 6
Managing Hyperglycemia in Inpatients: Ensuring Success
1

We suggest that BG ≤ 70 mg/dL are associatedwith an increase in mortality, and that even briefsevere hypoglycemia (BG ≤ 40 mg/dL) isindependently associated with a greater risk ofmortality and that the risk increases withprolonged or frequent episodes
Test and adjust BG every 1-2 hours - this hasnot been studied prospectively
Jacobi J et al. Crit Care Med. 2012; 40:3251-76.
Guidelines for the use of an insulin infusion for the management of hyperglycemia in critically ill
patients (ACCM)
We suggest continuous insulin infusion (1 unit/mL)therapy should be initiated after priming newtubing with a 20-mL waste volume
Subcutaneous (SC) insulin may be acceptable inthe ICU if BG goals are maintained
Jacobi J et al. Crit Care Med. 2012; 40:3251-76.
Guidelines for the use of an insulin infusion for the management of hyperglycemia in critically ill
patients (ACCM)
Surviving Sepsis Campaign
Dellinger RP et al. Crit Care Med. 2013; 41:580-637.
1. A protocolized approach to BG management in ICUpatients with severe sepsis commencing insulindosing when
2 consecutive BG levels are >180 mg/dLThis protocolized approach should target an upper BG ≤180 mg/dL rather than an upper target BG ≤110 mg/dL (grade 1A)
2. BG values should be monitored every 1–2 hr untilglucose values and insulin infusion rates are stableand then every 4 hr thereafter (grade 1C)
3. Glucose levels obtained with point-of-care testing ofcapillary blood should be interpreted with caution, assuch measurements may not accurately estimatearterial blood or plasma glucose values (thisstatement is ungraded)
Surviving Sepsis: Guidelines Differences
Although all evidence taken into account,NICE-SUGAR is the main trial that influences
Dellinger RP et al. Crit Care Med. 2013; 41:580-637.
Initiate at 180 mg/dL, but no lowerthreshold for glycemic control excepthypoglycemia
No evidence for 140-180 mg/dL rangeversus 110-140 mg/dL range except forhypoglycemia
American College of Physicians
Qaseem A et al. Ann Intern Med. 2011; 154:260-7.
Recommendation 1: ACP recommends not usingintensive insulin therapy to strictly control bloodglucose in non-surgical intensive care unit(SICU)/medical intensive care unit (MICU) patientswith or without diabetes mellitus (Grade: strongrecommendation, moderate-quality evidence)
Current evidence does not support 80 to 180 mg/dL compared with higher or unspecified targets using a variety of intensive insulin therapy regimens for patients with myocardial infarction, stroke, or acute brain injury or those under perioperative care
A nonsignificant reduction in the incidence of infection has been observed
Although the target blood glucose levels in the current trials ranged widely, avoiding targets less than 7.8 mmol/L (<140 mg/dL) should be a priority because harms are likely to increase at lower blood glucose targets
American College of Physicians Recommendation 2: ACP recommends not using
intensive insulin therapy to normalize blood glucosein SICU/MICU patients with or without diabetes mellitus (Grade: strong recommendation, high-quality evidence)
Current evidence does not show a mortality benefitassociated with use of IIT to achieve a target ofnormoglycemia (blood glucose levels of 4.4 to 6.1mmol/L [80 to 110 mg/dL])
Evidence from some studies showed an increase inmortality associated with IIT and hypoglycemia. Data onthe effects of IIT targeted to normoglycemia on reductionin length of ICU stay are mixed
Qaseem A et al. Ann Intern Med. 2011; 154:260-7.IIT = intensive insulin therapy
Managing Hyperglycemia in Inpatients: Ensuring Success
2

American College of Physicians Recommendation 3: ACP recommends a target blood
glucose level of 7.8 to 11.1 mmol/L (140 to 200 mg/dL)if insulin therapy is used in SICU/MICU patients(Grade: weak recommendation, moderate-qualityevidence)
Summary - poorly controlled glucose worsens outcomes
Evidence is not sufficient to give a precise range for blood glucose levels
140 to 200 mg/dL is associated with similar mortality outcomes asintensive insulin therapy targeted at blood glucose levels of 80 to 110 mg/dL and is associated with a lower risk for hypoglycemia
Current studies do not provide enough information to determine whether allowing blood glucose levels to increase above 10.0 to 11.1 mmol/L (180 to 200 mg/dL) is associated with similar outcomes to those seen at lower target levels
Qaseem A et al. Ann Intern Med. 2011; 154:260-7.
Striking the Right Balance
Hyperglycemia Hypoglycemia
Finfer S et al. N Engl J Med. 2009; 360:1283-97.
NICE-SUGAR Study Multicenter-multinational randomized, controlled trial
(Australia, New Zealand, and Canada; N=6104 ICUpatients)− Intensive BG target: 4.5-6.0 mmol/L (81-108 mg/dL)
− Conventional BG target: <10.0 mmol/L (180 mg/dL)
Primary outcome: Death from any cause within 90days after randomization
Patient population− Mean APACHE II score: ~21; APACHE >25: 31%
− Reason for ICU admission: surgery: ~37%, medical: 63%
− History of DM: 20% (T1DM: 8%, T2DM: 92%)
− At randomization: sepsis: 22%, trauma: 15%
NICE-SUGAR: Baseline Characteristics
Age: ~60 years
Gender: ~36% female
Diabetes: ~20% (BMI ~28 kg/m2)
Interval, ICU admission to randomization: 13.4 hr
Reason for ICU admission− Operative* ~37%
− Non-operative† ~63%
Sepsis: ~22%
Trauma: ~15%
*No significant number of cardiothoracic surgery patients†No significant number of CCU patients
Finfer S et al. N Engl J Med. 2009; 360:1283-97.
Outcome Measure Intensive
GroupConventional
Group
Morning BG (mg/dL) 118 ± 25 145 ± 26
Hypoglycemia(BG ≤ 40 mg/dL)
206/3016 (6.8%)
15/3014(0.5%)
28-Day mortality (P=0.17) 22.3% 20.8%
90-Day mortality (P=0.02) 27.5% 24.9%
NICE-SUGAR Study Outcomes
Finfer S et al. N Engl J Med. 2009; 360:1283-97.
Intensive Glycemic Control in Critically Ill Adults: Severe Hypoglycemia Risk
Meta-analysis of 26 Randomized Controlled Trials (13,567 patients)
Enlargement on page 6
Severe Hypoglycemia(≤ 40 mg/dL)
Study
Van den Berghe et al.8
Henderson et al.31
Bland et al.25
Van den Berghe et al.9
Mitchell et al.35
Azevedo et al.22
De La Rosa Gdel et al.12
Devos et al.13
Oksanen et al.36
Brunkhorst et al.11
Iapichino et al.32
Arabi et al.10
Mackenzie et al.33
NICE‐SUGAR18
Overall
Risk Ratio (95% CI)
Favors IIT Favors conventional control
0.1 1 10
Griesdale DE et al. CMAJ. 2009; 180:821-7.
Managing Hyperglycemia in Inpatients: Ensuring Success
3
Pharmacists Need to Clearly Understand
Treatment goals
Treatment options
Treatment protocols
Potential medication errors and methods toreduce errors
Their important role on multidisciplinary team inensuring safe and effective management ofhyperglycemia in the hospital setting
Adapted from Kelly JL. Am J Health-Syst Pharm. 2010; 67(Suppl 8):S9-16.
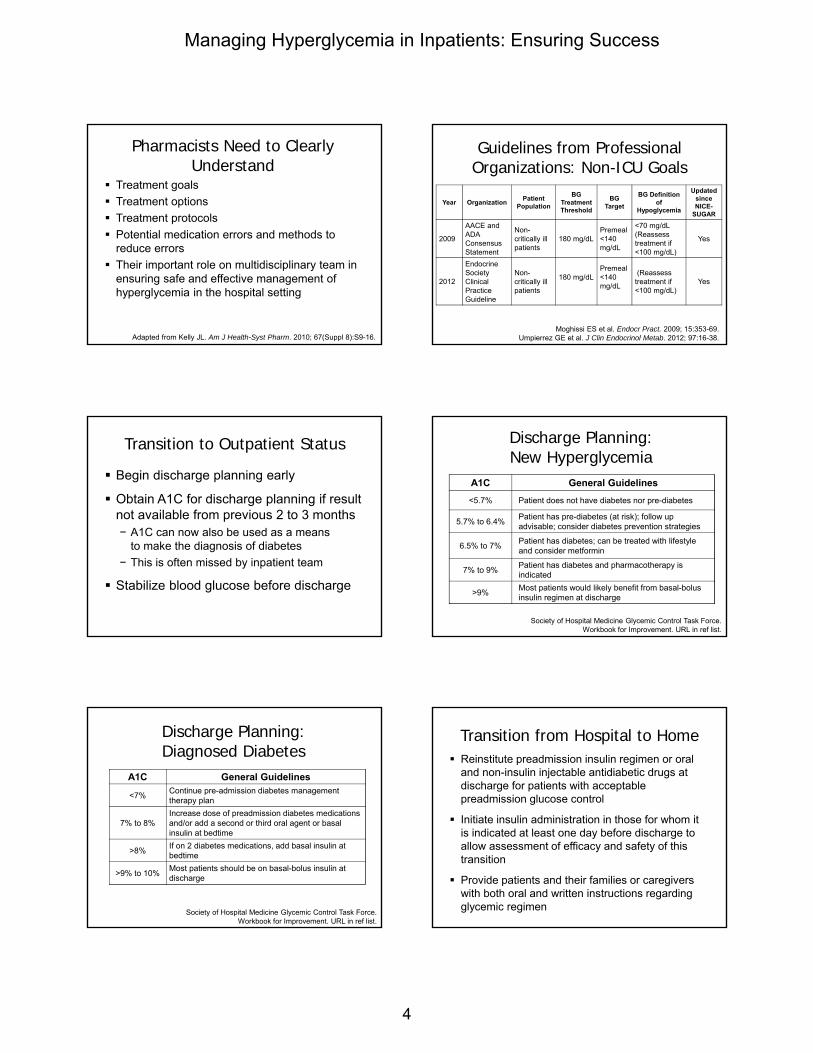
Guidelines from Professional Organizations: Non-ICU Goals
Year OrganizationPatient
Population
BG Treatment Threshold
BG Target
BG Definition of
Hypoglycemia
Updated since NICE-
SUGAR
2009
AACE and ADA Consensus Statement
Non-critically ill patients
180 mg/dLPremeal <140 mg/dL
<70 mg/dL(Reassess treatment if <100 mg/dL)
Yes
2012
Endocrine Society Clinical Practice Guideline
Non-critically ill patients
180 mg/dLPremeal <140 mg/dL
(Reassess treatment if <100 mg/dL)
Yes
Moghissi ES et al. Endocr Pract. 2009; 15:353-69.Umpierrez GE et al. J Clin Endocrinol Metab. 2012; 97:16-38.
Transition to Outpatient Status
Begin discharge planning early
Obtain A1C for discharge planning if resultnot available from previous 2 to 3 months− A1C can now also be used as a means
to make the diagnosis of diabetes
− This is often missed by inpatient team
Stabilize blood glucose before discharge
Discharge Planning: New Hyperglycemia
A1C General Guidelines
<5.7% Patient does not have diabetes nor pre-diabetes
5.7% to 6.4%Patient has pre-diabetes (at risk); follow up advisable; consider diabetes prevention strategies
6.5% to 7%Patient has diabetes; can be treated with lifestyle and consider metformin
7% to 9%Patient has diabetes and pharmacotherapy is indicated
>9%Most patients would likely benefit from basal-bolus insulin regimen at discharge
Society of Hospital Medicine Glycemic Control Task Force. Workbook for Improvement. URL in ref list.
Discharge Planning: Diagnosed Diabetes
A1C General Guidelines
<7%Continue pre-admission diabetes management therapy plan
7% to 8%Increase dose of preadmission diabetes medications and/or add a second or third oral agent or basal insulin at bedtime
>8%If on 2 diabetes medications, add basal insulin at bedtime
>9% to 10%Most patients should be on basal-bolus insulin at discharge
Society of Hospital Medicine Glycemic Control Task Force. Workbook for Improvement. URL in ref list.
Transition from Hospital to Home Reinstitute preadmission insulin regimen or oral
and non-insulin injectable antidiabetic drugs atdischarge for patients with acceptablepreadmission glucose control
Initiate insulin administration in those for whom itis indicated at least one day before discharge toallow assessment of efficacy and safety of thistransition
Provide patients and their families or caregiverswith both oral and written instructions regardingglycemic regimen
Managing Hyperglycemia in Inpatients: Ensuring Success
4

“Survival Skills”to Teach Before Discharge
How and when to takemedication or insulin− What to expect from the
medication− Confirm insurance
reimbursement
How and when to test BG− What are target glucose
levels
Basics on meal planning How to treat and prevent
hypoglycemia
Sick-day management plan
Date and time offollow-up visits− Including diabetes
education
When and who to call onthe health care team− Schedule follow up with
clinician (timely manner)
− Emergency numbers
− Available community resources
Moghissi E et al. Endocr Pract. 2009; 15:353-69.Umpierrez GE et al. J Clin Endocrinol Metab. 2012; 97:16-38.
Conclusion Hyperglycemia
− Common in critically ill patients, both with and withoutdiabetes
− Predictor of adverse outcomes, including mortality
Good, but not stringent, glucose control is mostcommon strategy among different guidelines
Hypoglycemia should be avoided, as adversemortality consequences may result
Pharmacists can and should be part ofmultidisciplinary glycemic control team anddischarge planning in their institution
Managing Hyperglycemia in Inpatients: Ensuring Success
5
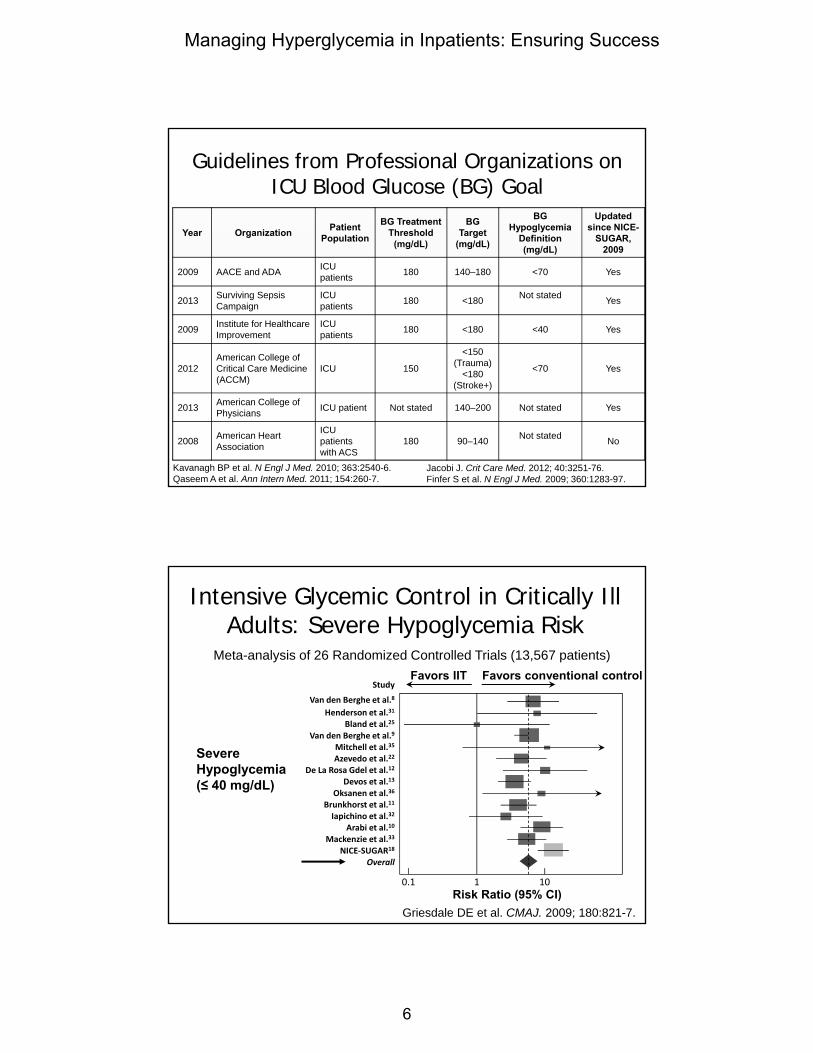
Kavanagh BP et al. N Engl J Med. 2010; 363:2540-6.Qaseem A et al. Ann Intern Med. 2011; 154:260-7.
Year OrganizationPatient
Population
BG Treatment Threshold
(mg/dL)
BG Target
(mg/dL)
BG Hypoglycemia
Definition(mg/dL)
Updated since NICE-
SUGAR, 2009
2009 AACE and ADA ICU patients 180 140–180 <70 Yes
2013 Surviving Sepsis Campaign
ICU patients 180 <180 Not stated Yes
2009 Institute for Healthcare Improvement
ICU patients 180 <180 <40 Yes
2012American College of Critical Care Medicine (ACCM)
ICU 150
<150 (Trauma)
<180(Stroke+)
<70 Yes
2013 American College of Physicians ICU patient Not stated 140–200 Not stated Yes
2008 American Heart Association
ICU patients with ACS
180 90–140 Not stated No
Guidelines from Professional Organizations on ICU Blood Glucose (BG) Goal
Jacobi J. Crit Care Med. 2012; 40:3251-76.Finfer S et al. N Engl J Med. 2009; 360:1283-97.
Intensive Glycemic Control in Critically Ill Adults: Severe Hypoglycemia Risk
Severe Hypoglycemia(≤ 40 mg/dL)
Study
Van den Berghe et al.8
Henderson et al.31
Bland et al.25
Van den Berghe et al.9
Mitchell et al.35
Azevedo et al.22
De La Rosa Gdel et al.12
Devos et al.13
Oksanen et al.36
Brunkhorst et al.11
Iapichino et al.32
Arabi et al.10
Mackenzie et al.33
NICE‐SUGAR18
Overall
Risk Ratio (95% CI)
Favors IIT Favors conventional control
0.1 1 10
Meta-analysis of 26 Randomized Controlled Trials (13,567 patients)
Griesdale DE et al. CMAJ. 2009; 180:821-7.
Managing Hyperglycemia in Inpatients: Ensuring Success
6

Practical Approach to Inpatient Glycemic Control
Kevin W. Box, Pharm.D.
Senior Clinical Pharmacist
UC San Diego Health System
San Diego, California
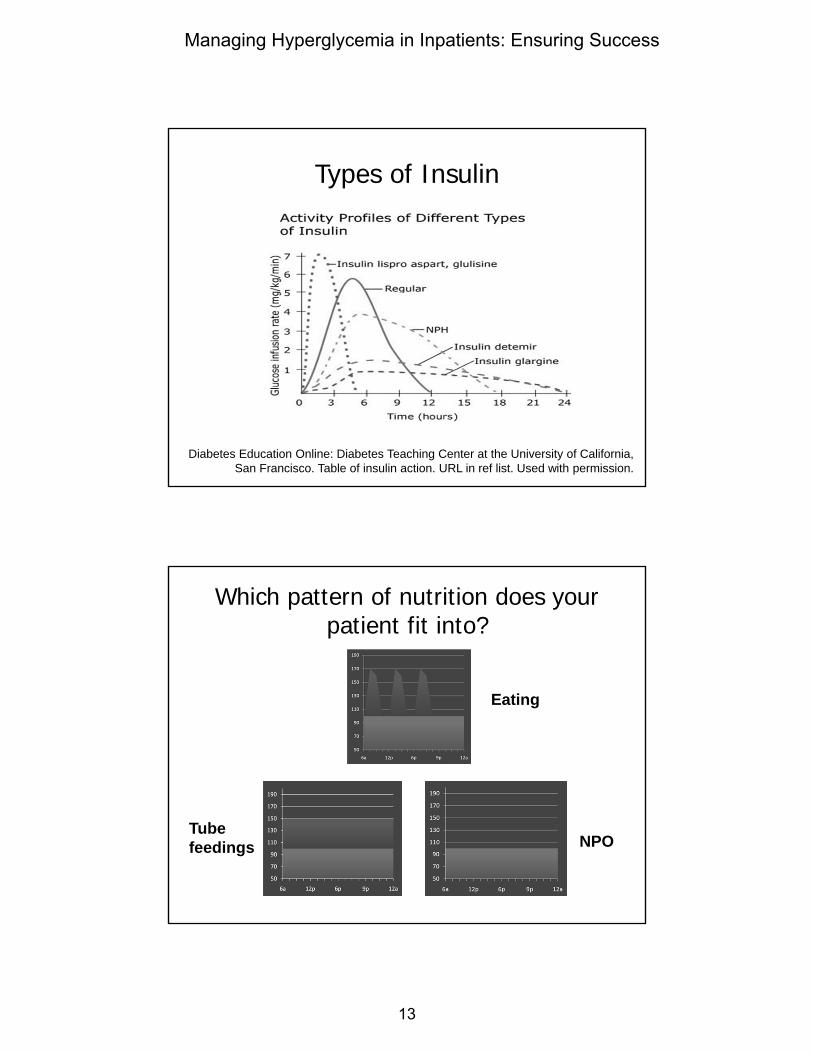
Types of Insulin
Diabetes Education Online: Diabetes Teaching Center at the University of California, San Francisco. Table of insulin action. URL in ref list. Used with permission.
HPI: 54 y/o, 100-kg man with T2DM x 8 yr admitted with diabetes-related foot
infection, eating regular meals
Outpatient Meds− Glipizide 10 mg po daily
− Metformin 1000 mg potwice daily
− NPH insulin 20 unitssubcutaneously at bedtime
Pertinent Labs− A1C 10%
− BG in ED 240 mg/dL
On admission what would you do?
a. Continue home regimen of metformin,glipizide, and NPH
b. Continue metformin and glipizide at half ofoutpatient dose
c. Withhold oral meds; start glargine 30 unitsdaily, lispro 10 units qac, and moderatecorrectional scale
d. Withhold oral meds; start high correctionalscale only
Withhold All Oral Agents
Non-insulin agents are inappropriate inmost hospitalized patients
Moghissi ES et al. Diabetes Care. 2009; 32:1119-31.
Stepwise Approach to Physiologic Insulin Dosing
Estimate amount of insulin patient would need over one day, if getting adequate nutrition = total daily dose (TDD)Step 1
Assess patient’s nutritional situationStep 2Decide which components of insulin the patient will require and percentage of TDD each should representStep 3Assess blood glucose at least daily, adjusting insulin doses as appropriateStep 4
Enlargement on page 13
Managing Hyperglycemia in Inpatients: Ensuring Success
7

STEP 1: Estimate the amount of insulin the patient would need over one day, if getting
adequate nutrition = TDD Insulin drip-based estimate (for patients treated with an insulin
infusion)
For patients already treated with insulin, consider the patient’spreadmission subcutaneous regimen and glycemic control on that regimen
Weight-based estimate− TDD = 0.4 units/kg x Wt in kg− Adjust down to 0.3 units/kg x Wt in kg for those with hypoglycemia
risk factors, including kidney failure, type 1 diabetes (especially if lean), frail/low body weight/ malnourished elderly, or insulin naïve patients
− Adjust up to 0.5-0.6 units/kg (or more) x Wt in kg for those with hyperglycemia risk factors, including obesity and high-dose glucocorticoid treatment
Our Patient
Calculate TDD− No drip
− On orals and NPH as outpatient
− Weight
100 kg (0.6 units/kg) = 60 units
100 kg (0.5 units/kg) = 50 units
STEP 2: Assess the patient’s nutritional situation
Eating meals or receiving bolus tube feedings
Eating meals but with unpredictable intake
Getting continuous tube feedings
Getting tube feedings for only part of the day
Getting parenteral nutrition
NPO
Which pattern of nutrition does your patient fit into?
Eating
NPOTube feedings
Our Patient Eating regular meals
STEP 3: Decide which components of insulin the patient will require and percentage
of TDD each should represent
Basal insulin can generally be estimated to behalf of the TDD
Nutritional insulin makes up remaining half ofthe TDD
50:50
Enlargement on page 13
Managing Hyperglycemia in Inpatients: Ensuring Success
8

STEP 3: Decide which components of insulin the patient will require and percentage
of TDD each should represent
In most cases, basal insulin should be provided
When a patient is not receiving nutrition, nutritionalinsulin should not be given
Nutritional insulin needs must be matched to theactual nutritional intake
In most cases, well-designed corrective insulinregimens should be provided
Our Patient
qac = before every mealqhs = at bedtime
Step 1: TDD
− Weight 100 kg (0.6 units/kg) = 60 units
Step 2: Nutrition pattern
− Eating regular meals
Step 3: Insulin components and ratio
− 50:50
− Basal – glargine 30 units
− Bolus – lispro 10 units qac
− Correction scale - lispro qac and qhs (moderate-high)
Correction InsulinLow Dose Correction Moderate Dose Correction
High Dose Correction1:50 >150 mg/dL qacand >200 mg/dL qhs
1:25 >150 mg/dL, starting at 3 units qac and >200mg/dL, starting at 4 units qhs
1:25 >150 mg/dL qacand >200 mg/dL qhs
STEP 4: Assess blood glucose at least daily, adjusting insulin doses as appropriate
Blood glucose targets can only be achieved viacontinuous management of the insulin program
There is no “autopilot” insulin regimen for a hospitalized patient!
Our Patient Overnight the patient decompensated on
the floor (blood pressure 98/55 mm Hg),and a rapid response was called− Transferred to ICU, started on norepinephrine
drip at 10 mcg/min, and intubated
Blood glucose levels during the night− 201 mg/dL (2400)
− 248 mg/dL (0600)
What insulin regimen would you use now?
a. Continue current glycemic regimen
b. Withhold all subcutaneous insulin andstart IV insulin infusion
c. Restart home NPH of 20 unitssubcutaneous at bedtime
d. 2 units regular insulin every 1 hoursubcutaneous until BG <150 mg/dL
Enlargement on page 14
Managing Hyperglycemia in Inpatients: Ensuring Success
9
Our Patient
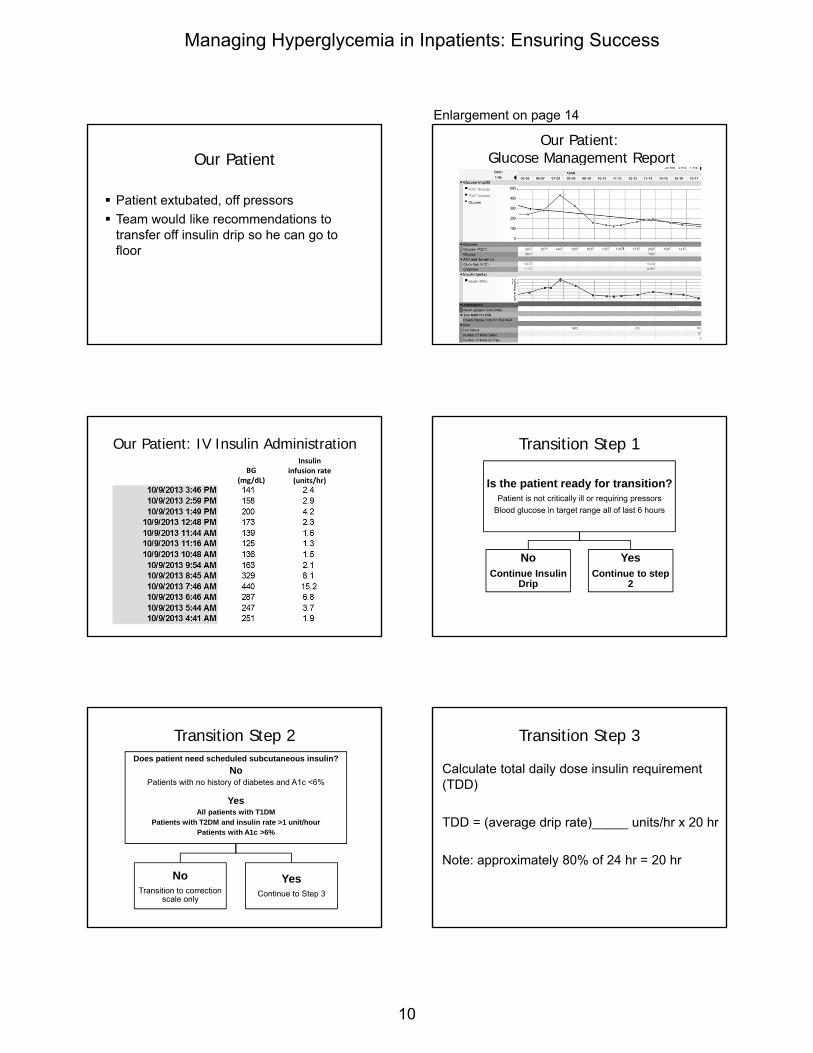
Patient extubated, off pressors
Team would like recommendations totransfer off insulin drip so he can go tofloor
Our Patient:Glucose Management Report
Our Patient: IV Insulin Administration
BG(mg/dL)
Insulin infusion rate(units/hr)
Transition Step 1
Is the patient ready for transition?Patient is not critically ill or requiring pressors
Blood glucose in target range all of last 6 hours
NoContinue Insulin
Drip
YesContinue to step
2
Transition Step 2Does patient need scheduled subcutaneous insulin?
NoPatients with no history of diabetes and A1c <6%
YesAll patients with T1DM
Patients with T2DM and insulin rate >1 unit/hourPatients with A1c >6%
NoTransition to correction
scale only
YesContinue to Step 3
Transition Step 3
Calculate total daily dose insulin requirement (TDD)
TDD = (average drip rate)_____ units/hr x 20 hr
Note: approximately 80% of 24 hr = 20 hr
Enlargement on page 14
Managing Hyperglycemia in Inpatients: Ensuring Success
10

Approximate 6-hour total = 14.7 units
BG(mg/dL)
Insulin infusion rate
(units/hr)
Transition Step 3
Calculate total daily dose insulin requirement (TDD)
14.7 units / 6 hours = 2.5 units/hour
TDD = (average drip rate) 2.5 units/hr x 20 hr
TDD = 50 units
Transition Step 4
Full nutrition: Patient is currently eating>50% of his/her meals, on goal parenteralnutrition or tube feedings, dextrose IV fluid>50 mL/hr
Minimal nutrition: Patient is currently NPO,eating <50% of his/her meals, is on a zerocarbohydrate clear liquid diet, or 6 hoursused in step 3 calculation is a period offasting (overnight)
Full Nutrition
• Patient currently eating >50% of his/her meals
• On goal TPN or tube feeds
• Dextrose IV fluid >50 mL/hr
• Give 50% of TDD asbasal insulin 2 hr before stopping infusion
• Give 50% of TDD asnutritional insulin divided TID if toleratingmeals (lispro) or every 6 hr if on continuoustube feeds (regular)
• Correction scale
Minimal Nutrition: Calculated insulin = basal insulin
• Patient currently NPOor eating<50% of his/her meals
• Zero carbohydrate clear liquid diet
• 6 hours used in step 3 calculation is period offasting (overnight)
• Give 100% TDD asbasal insulin 2 hr before stopping infusion
• Add nutritional insulin when clinically indicated
• Correction scale
Our Patient: Designing Transition Regimen
Transition step 1: Patient is ready to transition Transition step 2: A1C 10%, patient needs scheduled
insulin Transition step 3: TDD = 50 units (weight based 50-60
units)
Transition step 4: Eating regular mealsInsulin components and ratio50:50
− Basal – glargine 25 units− Bolus – lispro 8 units qac− Correction scale – lispro qac and qhs (moderate)
Managing Hyperglycemia in Inpatients: Ensuring Success
11
Transition Step 5
Assess blood glucose values at least daily,adjusting insulin doses as appropriate
Conclusion
Protocols every institution should have−How to initiate a basal-bolus insulin regimen−Continuous IV insulin infusion− Transition from IV insulin infusion to a basal
bolus regimen−Hypoglycemia−Nutrition on hold unexpectedly−Diabetic ketoacidosis−Continuous quality improvement monitoring
Managing Hyperglycemia in Inpatients: Ensuring Success
12
Types of Insulin
Diabetes Education Online: Diabetes Teaching Center at the University of California, San Francisco. Table of insulin action. URL in ref list. Used with permission.
Which pattern of nutrition does your patient fit into?
Eating
NPOTube feedings
Managing Hyperglycemia in Inpatients: Ensuring Success
13

Correction InsulinLow Dose Correction Moderate Dose Correction
High Dose Correction1:50 >150 mg/dL qacand >200 mg/dL qhs
1:25 >150 mg/dL, starting at 3 units qac and >200mg/dL, starting at 4 units qhs
1:25 >150 mg/dL qacand >200 mg/dL qhs
Our Patient:Glucose Management Report
Managing Hyperglycemia in Inpatients: Ensuring Success
14
Issues and Special Populations for Inpatient Glycemic Management
Paul M. Szumita, Pharm.D., BCPS
Clinical Pharmacy Practice Manager
Director, Critical Care Pharmacy Residency
Brigham and Women’s Hospital
Boston, Massachusetts
Overview
Identify controversies in goal glucosevalues in patient specific populations
Determine whether patients in specificsituations are at greater or lesser risk ofhyperglycemia or hypoglycemia
Examine approaches for managinghyperglycemia in special populations ofhospitalized patients
What is your opinion on the goal glucose in critical care setting?
a. Guidelines have it right on the money
b. Would like goal glucose higher thancurrent guideline
c. Would like goal glucose lower thancurrent guideline
d. Would like another large RCT to putcontroversy to bed
ICU Goal Glucose Controversy
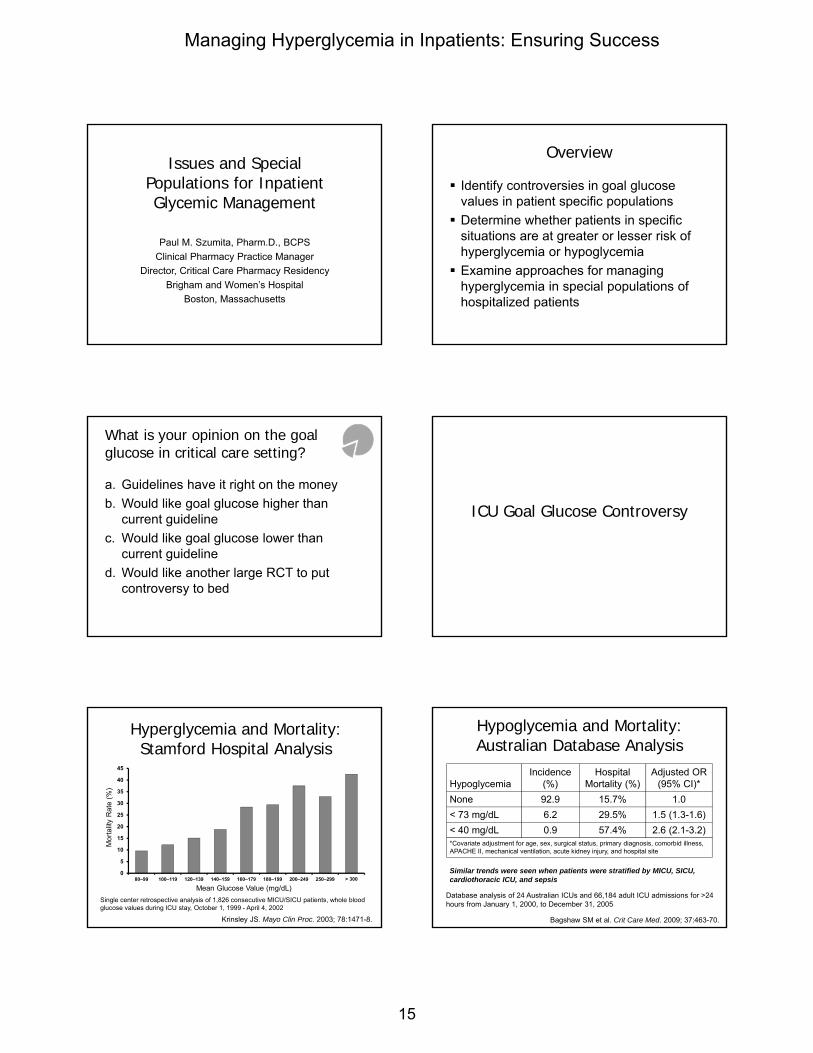
Hyperglycemia and Mortality: Stamford Hospital Analysis
Krinsley JS. Mayo Clin Proc. 2003; 78:1471-8.
0
5
10
15
20
25
30
35
40
45
80–99 100–119 120–139 140–159 160–179 180–199 200–249 250–299 > 300
Mor
talit
y R
ate
(%)
Mean Glucose Value (mg/dL)
Single center retrospective analysis of 1,826 consecutive MICU/SICU patients, whole blood glucose values during ICU stay, October 1, 1999 - April 4, 2002
Hypoglycemia and Mortality: Australian Database Analysis
Bagshaw SM et al. Crit Care Med. 2009; 37:463-70.
HypoglycemiaIncidence
(%)Hospital
Mortality (%)Adjusted OR
(95% CI)*
None 92.9 15.7% 1.0
< 73 mg/dL 6.2 29.5% 1.5 (1.3-1.6)
< 40 mg/dL 0.9 57.4% 2.6 (2.1-3.2)*Covariate adjustment for age, sex, surgical status, primary diagnosis, comorbid illness, APACHE II, mechanical ventilation, acute kidney injury, and hospital site
Database analysis of 24 Australian ICUs and 66,184 adult ICU admissions for >24 hours from January 1, 2000, to December 31, 2005
Similar trends were seen when patients were stratified by MICU, SICU, cardiothoracic ICU, and sepsis
Managing Hyperglycemia in Inpatients: Ensuring Success
15

Protocol HeterogeneityLeuven I Leuven II VISEP Glucontrol NICE SUGAR
ICU SICU MICUSepsis Mixed
ICUMixed Mixed
Centers 1 1 18 19 42
Sample size 1548 1200 488/537 1011 ~6030
Diabetic ~13% ~17 ~30% ~19% ~20%
Excluded 14 863 1,612 ? 34,067
Stopped early No No Yes Yes No
Primary diet TPN 85% TPN 85% 60% TPN 27% TPN 25% TPN
APACHE II ~9 ~23 ~20 ~15 ~21
MortalityICU: ~ 7%
Hos: ~10%
ICU: ~25%
Hos: ~40%28 Day: ~27%
ICU: ~16%
Hos: ~22%28 Day: ~21%
HypoglycemiaIIT: 5%
Control: 2%
IIT: 18.7 %
Control: 3.1%
IIT: 17%
Control: 4.1 %
IIT: 9.8
Control: 2.7%
IIT: 6.8 %
Control: 0.5%
Protocol Leuven Leuven Leuven Variable ? NICE
Target (mg/dL) 80-110 80-110 80-110 80-110 81-108
Control (mg/dL) < 180 < 180 < 180 140-180 144-180
Timing ICU admit ICU admit < 12 hrs ? < 24 hrs
Duration ICU stay ICU stay ICU/ 21 days ICU or 56 daysEating or 90
days
van den Berghe G et al. N Engl J Med. 2001; 345:1359-67;
van den Berghe G et al. N Engl J Med. 2006; 354:449-61; Brunkhorst FM et al. N Engl J Med. 2008; 358:125-39; Preiser JC et al. Intensive Care Med. 2009; 35:1738-48; Finfer S et al. N Engl J Med. 2009; 360:1283-97.
IIT = intensive insulin therapy
Mortality in RCTs Targeting 80-110 mg/dL
van den Berghe G et al. N Engl J Med. 2001; 345:1359-67; van den Berghe G et al. N Engl J Med. 2006; 354:449-61; Brunkhorst FM et al. N Engl J Med. 2008; 358:125-39; Preiser JC et al.
Intensive Care Med. 2009; 35:1738-48; Finfer S et al. N Engl J Med. 2009; 360:1283-97.
4.8
24.2 24.7
16.7
27.5
8
26.8 25.6
15.2
24.9
0
5
10
15
20
25
30
LeuvenSICU*
LeuvenMICU*
VISEP** Glucontrol* NICE-SUGAR***
Mo
rtal
ity
Rat
e (%
)
Intensive Control
P = 0.5
P < 0.04
P = 0.31 P = 0.74
*ICU**28 day***90 day
P = 0.02
Mortality in Patients with Extended ICU Stay
van den Berghe G et al. N Engl J Med. 2001; 345:1359-67; van den Berghe G et al. N Engl J Med. 2006; 354:449-61; Brunkhorst FM et al. N Engl J Med. 2008; 358:125-39; Preiser JC et al.
Intensive Care Med. 2009; 35:1738-48; Finfer S et al. N Engl J Med. 2009; 360:1283-97.
10.6
31.3
22.120.2
38.1
22.3
05
1015202530354045
Leuven SICU> 5days*
Leuven MICU> 3 days*
VISEP > 5days**
Glucontrol* NICE-SUGAR***
Mo
rtal
ity
Rat
e (%
)
Intensive Control
P = 0.005 P = 0.05 P = 0.95
*ICU**28 day***90 day
Not available
Not available
63% of cohort31% of cohort 92% of cohort
Intensive Insulin Therapy in Critically Ill Surgical Patients
van den Berghe G et al. N Engl J Med. 2001; 345:1359-67.
Reduction(%)
Mortality Sepsis Dialysis PolyneuropathyBlood
Transfusion
34%
46%41%
44%50%
Intensive Insulin Therapy in Medical ICU Patients
Mortality- Significantly reduced in patients in ICU ≥ 3 days
Morbidity significantly reduced in all patients- Decreased weaning time from mechanical ventilation
- Decreased time to discharge from ICU
- Decreased time to discharge from the hospital
van den Berghe G et al. N Engl J Med. 2006; 354:449-61.
NICE SUGAR: More Morbidity = More Mortality?
Finfer S et al. N Engl J Med. 2009; 360:1283-97.
Morbidity OutcomeIntensive
n=3014
Conventional
n=3011P Value
Days mechanical ventilation, mean ± SD
6.6 ± 6.6 6.6 ± 6.5 0.56
(+) Blood culture 12.8% 12.4% 0.57
Renal-replacement therapy 15.4% 14.5% 0.34
Red blood cell transfusion 42.1% 41.3% 0.56
What is the mechanism behind the small, but statistically significant increase in mortality with intensive insulin therapy at 90 days in NICE SUGAR?
Polyneuropathy not reported
Enlargement on page 23
Managing Hyperglycemia in Inpatients: Ensuring Success
16

Glycemic Separation in “Good” RCTs Targeting 80-110 mg/dL
van den Berghe G et al. N Engl J Med. 2001; 345:1359-67; van den Berghe G et al. N Engl J Med. 2006; 354:449-61; Brunkhorst FM et al. N Engl J Med. 2008; 358:125-39; Preiser JC et al.
Intensive Care Med. 2009; 35:1738-48; Finfer S et al. N Engl J Med. 2009; 360:1283-97.
103111 112 119 118
153 153 151 147 145
0
20
40
60
80
100
120
140
160
180
LeuvenSICU*
LeuvenMICU*
VISEP* Glucontrol NICE-SUGAR*
Me
an g
luco
se (
mg
/dL
)
Intensive Control
32 vs. 5 units/day
59 vs. 10 units/day
P < 0.001 P < 0.001
71 vs. 33 units/day
43 vs. 10 units/day
P < 0.001 P < 0.001
50 vs. 17 units/day
P < 0.001
* AM glucose
Hypoglycemia in RCTs Targeting 80-110 mg/dL
van den Berghe G et al. N Engl J Med. 2001; 345:1359-67; van den Berghe G et al. N Engl J Med. 2006; 354:449-61; Brunkhorst FM et al. N Engl J Med. 2008; 358:125-39; Preiser JC et al.
Intensive Care Med. 2009; 35:1738-48; Finfer S et al. N Engl J Med. 2009; 360:1283-97.
5
18.717
9.8
6.8
23.1
4.12.7
0.502468
101214161820
Leuven SICU Leuven MICU VISEP Glucontrol NICE-SUGAR
% P
atie
nts
Intensive ControlHypoglycemia defined < 40 mg/dL
All variables P < 0.001
Barriers to Inpatient Glucose Management
Heath care system and workers No consensus regarding goals No published “how to” No standardized approach to testing and treatment Inadequate insulin drip protocol Lack of compliance Fear of hypoglycemia Culture Accuracy of point-of-care testing (POCT) Lack of education Poor communication Lack of health care resources
Anger KE et al. Pharmacotherapy. 2006; 26:214-28.
Many have been described
Few have been rigorously evaluated
Few published protocols were everdesigned to reach blood glucose goal of80-110 mg/dL
No Ideal Protocol in the Literature
Examples of Published IV Insulin Protocols
Yale1
Markovitz2
Leuven3
Portland4
Texas Diabetes Council5
DIGAMI6
University of Washington7
Krinsley8
Rush University Protocol9
Northwestern University10
1Goldberg PA et al. Diabetes Care. 2004; 27:461-7.2Markovitz LJ et al. Endocr Pract. 2002; 8:10-8.
3van den Berghe G et al. N Engl J Med. 2001; 345:1359-67.4Furnary AP et al. Endocr Pract. 2004; 10(Suppl 2):21-33.
5Texas Diabetes Council. October 25, 2007. URL in ref list.6Malmberg K et al. Circulation. 1999; 99:2626-32.
7Ku SY et al. Jt Comm J Qual Patient Saf. 2005; 31:141-7.8Krinsley JS. Mayo Clin Proc. 2004; 79:992-1000.
9Donaldson S et al. Diabetes Educ. 2006; 32:954-62.10DeSantis AJ et al. Endocr Pract. 2006; 12:491-505.
Blood Glucose (mg/dL)
Action
< 50• Stop insulin; give 25 mL of 50% dextrose; recheck BG in 30 minutes
• When BG >75 mg/dL, restart with rate 50% of previous rate
50 – 75• Stop insulin; if previous BG >100 mg/dL, then give 25 mL of 50%
dextrose; recheck BG in 30 minutes
• When BG >75 mg/dL, restart with rate 50% of previous rate
76 –100
• If <10 mg/dL lower than last test, decrease rate by 0.5 units/hr
• If >10 mg/dL lower than last test, decrease rate by 50%
• If ≥ last test result, maintain same rate
101 – 150 • Same rate
151 – 200• If 20 mg/dL lower than previous test, same rate
• If higher than previous test, increase by 0.5 units/hr
> 200• If ≥30 mg/dL lower than last test, use same rate
• If <30 mg/dL lower than last test (OR if higher than last test), increase rate by 1 unit/hr
Furnary AP et al. Endocr Pract. 2004; 10(Suppl 2):21-33.
The “Fixed” Protocol
Managing Hyperglycemia in Inpatients: Ensuring Success
17

CURRENT RATEX
ADJUSTMENT FACTOR(this factor based on rate of change in
BBG over time)=
NEW RATE
BBG = bedside blood glucose
Multiplication Factor Concept “Multiplier” Protocol Concept: A Simple Calculation
(Blood glucose – 60) X multiplication factor= new insulin infusion rate for that hour
- The multiplication factor used in the equationchanges depending on the rate of change in glucose value over time
Osburne RC et al. Diabetes Educ. 2006; 32:394-403.Davidson PC et al. Diabetes Care. 2005; 28:2418-23.
What is your opinion on the importance of the diagnosis of diabetes on goal glucose?
a. All patients should have the same goal(regardless of diagnosis of diabetes)
b. Patients with diabetes should have lowergoal
c. Patients without diabetes should havelower goal
Non-Diabetics vs. Diabetics
Adaptive mechanisms developed in the settingof chronic hyperglycemia in diabetic patientsmay decrease morbidity and mortalityassociated with stress-induced hyperglycemia
Krinsley JS et al. Curr Opin Clin Nutr Metab Care. 2012; 15:151-60.Krinsley JS et al. Crit Care. 2013; 17:R37.
Association Between Mean Blood Glucose and In-Hospital Mortality
Kosiborod M et al. Circulation. 2008; 117:1018-27 (adapted).
0.8
0.4
0.6
0.2
0
No diabetes
All patients
Diabetes
Mor
talit
y R
ate
Mean Glucose (mg/dL)
Patients With Diabetes vs. Patients Without Diabetes
Krinsley et al. Crit Care. 2013; 17:R37 (adapted).
With DiabetesWithout Diabetes
80-110 110-140 140-180 >180
Pe
rce
nta
ge M
ort
alit
y
50
0
25
Mean BG (mg/dL)
80-110 110-140 140-180 >180
Pe
rce
nta
ge M
ort
alit
y
50
0
25
Mean BG (mg/dL)
Managing Hyperglycemia in Inpatients: Ensuring Success
18

2013 DM vs. No-DM in ICU
Trial design- Multi-center, retrospective, cohort analysis from 12
ICUs in eight different hospitals part of the Intermountain Healthcare system
- Approved by the Intermountain investigational review board
Lanspa MJ et al. Chest. 2013; 143:1226-34.
Mor
talit
y P
roba
bilit
y
0
0.02
0.04
0.06
0.08
0.10
0.12
0.14
0.16
0 2 4 6 8 10 12 242220181614 26 28 30
Diabetics
90-140 mg/dL
80-110 mg/dL
Days Post ICU Admission
Lanspa MJ et al. Chest. 2013; 143:1226-34 (adapted).
Diabetes vs. No Diabetes
Diabetes vs. No Diabetes
Lanspa MJ et al. Chest. 2013; 143:1226-34 (adapted).
0 2 4 6 8 10 12 242220181614 26 28 30
0
0.02
0.04
0.06
0.08
0.10
0.12
0.14
0.16
Mor
talit
y P
roba
bilit
y
Days Post ICU Admission
90-140 mg/dL
80-110 mg/dL
Non‐diabetics
Insulin Needs in Special Patient Populations
Patients receiving high dose steroids
Patients receiving enteral or parenteralnutrition
Patients undergoing surgery
Inpatient situations are unstable
No single algorithm is suitable for allpatients
Many scenarios require increasedmonitoring and possible adjustments ininsulin dose
Optimizing Care of the Inpatient with Hyperglycemia Is Challenging!
Case Scenario: Steroids
78-year-old woman hospitalized forworsening dyspnea and cough
Chronic obstructive pulmonary disease(COPD) since age 55
No prior history of diabetes- A1C 6.2%
Started on methylprednisolone 40 mg IVevery 6 hr
BG on day 2 climbs to 210 mg/dL
Managing Hyperglycemia in Inpatients: Ensuring Success
19
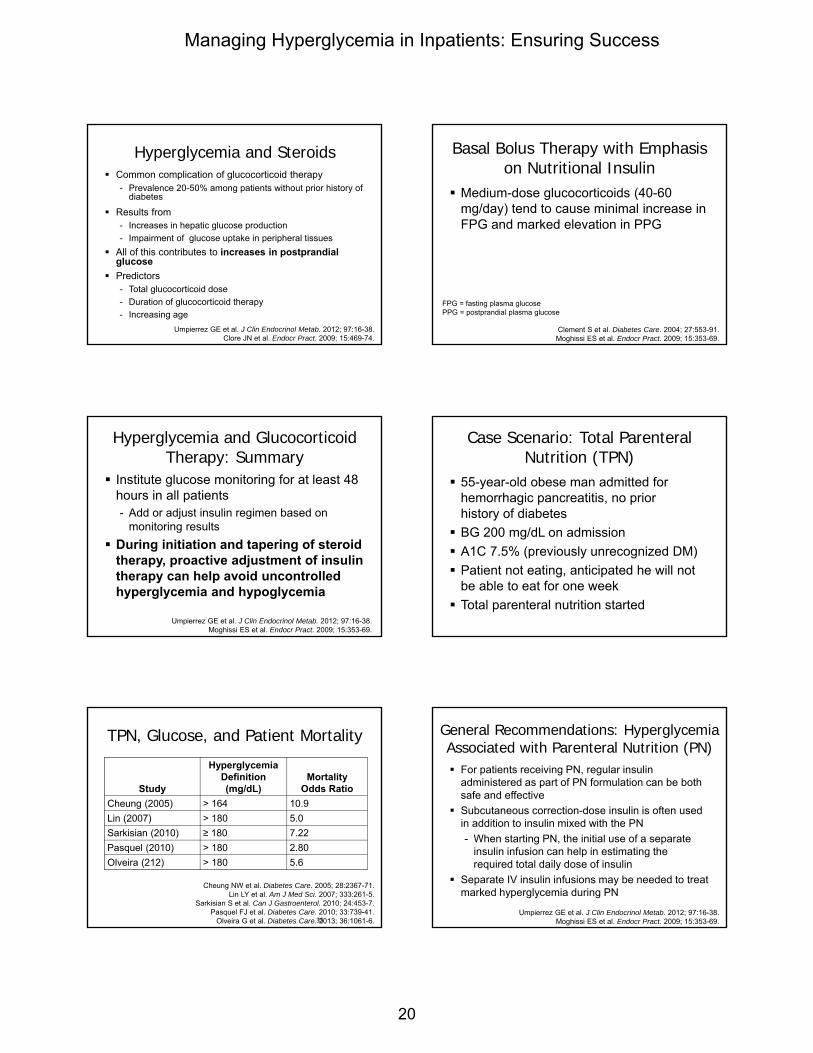
Hyperglycemia and Steroids Common complication of glucocorticoid therapy
- Prevalence 20-50% among patients without prior history of diabetes
Results from- Increases in hepatic glucose production
- Impairment of glucose uptake in peripheral tissues
All of this contributes to increases in postprandialglucose
Predictors- Total glucocorticoid dose
- Duration of glucocorticoid therapy
- Increasing age
Umpierrez GE et al. J Clin Endocrinol Metab. 2012; 97:16-38.Clore JN et al. Endocr Pract. 2009; 15:469-74.
Medium-dose glucocorticoids (40-60mg/day) tend to cause minimal increase inFPG and marked elevation in PPG
Clement S et al. Diabetes Care. 2004; 27:553-91.Moghissi ES et al. Endocr Pract. 2009; 15:353-69.
FPG = fasting plasma glucosePPG = postprandial plasma glucose
Basal Bolus Therapy with Emphasis on Nutritional Insulin
Institute glucose monitoring for at least 48hours in all patients- Add or adjust insulin regimen based on
monitoring results
During initiation and tapering of steroidtherapy, proactive adjustment of insulintherapy can help avoid uncontrolledhyperglycemia and hypoglycemia
Umpierrez GE et al. J Clin Endocrinol Metab. 2012; 97:16-38.Moghissi ES et al. Endocr Pract. 2009; 15:353-69.
Hyperglycemia and Glucocorticoid Therapy: Summary
Case Scenario: Total Parenteral Nutrition (TPN)
55-year-old obese man admitted forhemorrhagic pancreatitis, no priorhistory of diabetes
BG 200 mg/dL on admission
A1C 7.5% (previously unrecognized DM)
Patient not eating, anticipated he will notbe able to eat for one week
Total parenteral nutrition started
Cheung NW et al. Diabetes Care. 2005; 28:2367-71.Lin LY et al. Am J Med Sci. 2007; 333:261-5.
Sarkisian S et al. Can J Gastroenterol. 2010; 24:453-7.Pasquel FJ et al. Diabetes Care. 2010; 33:739-41.
Olveira G et al. Diabetes Care. 2013; 36:1061-6.35
Study
Hyperglycemia Definition (mg/dL)
Mortality Odds Ratio
Cheung (2005) > 164 10.9
Lin (2007) > 180 5.0
Sarkisian (2010) ≥ 180 7.22
Pasquel (2010) > 180 2.80
Olveira (212) > 180 5.6
TPN, Glucose, and Patient Mortality
For patients receiving PN, regular insulinadministered as part of PN formulation can be bothsafe and effective
Subcutaneous correction-dose insulin is often usedin addition to insulin mixed with the PN
- When starting PN, the initial use of a separateinsulin infusion can help in estimating the required total daily dose of insulin
Separate IV insulin infusions may be needed to treatmarked hyperglycemia during PN
Umpierrez GE et al. J Clin Endocrinol Metab. 2012; 97:16-38.Moghissi ES et al. Endocr Pract. 2009; 15:353-69.
General Recommendations: Hyperglycemia Associated with Parenteral Nutrition (PN)
Managing Hyperglycemia in Inpatients: Ensuring Success
20

Case Scenario: Tube Feedings
70-year-old woman admitted witha stroke
Prior history of type 2 diabetes mellitus- Controlled on oral agents
BG 150 mg/dL on admission, A1C 7%
Currently unable to swallow
Continuous enteral nutrition started onhospital day 2
Prospective and observational study in 64 patients (mean age 76.2 yr) receiving EN on internal medicine inpatient unit
Most frequent complications
Pancorbo-Hidalgo PL et al. J Clin Nurs. 2001; 10:482-90.
Should blood glucose levels be checked in patients receiving enteral nutrition?Should blood glucose levels be checked in patients receiving enteral nutrition?
49% 46%
35% 33% 30%
20%13%
3%0%
10%
20%
30%
40%
50%
60%
Percent of patients
Complications of Enteral Nutrition
Glycemic Management of the Patient Receiving Enteral Nutrition Continuous enteral nutrition (EN)
- Basal: 40-50% of TDD as long- or intermediate-acting insulin
given once or twice a day
- Short-acting insulin 50-60% of TDD given every 6 hr
Cycled enteral nutrition
- Intermediate-acting insulin given together with a rapid- or short-acting
insulin with start of tube feeding
- Rapid- or short-acting insulin administered every 4-6 hr
for duration of EN administration
- Correctional insulin given for BG above goal range
Bolus enteral nutrition
- Rapid-acting or short-acting insulin given prior to each bolus feeding
Umpierrez GE et al. J Clin Endocrinol Metab. 2012; 97:16-38.
Case Scenario: Surgery
60-year-old woman with type 2 diabetesmellitus treated with insulin is admitted forhip fracture- Admission glucose = 180 mg/dL
Umpierrez GE et al. Diabetes Care. 2007; 30:2181-6.
*P < 0.01, †P < 0.05. Error bars denote standard deviation.
Insulin glargine + glulisine: 0.4 units/kg for BG 140-200 mg/dL; 0.5 units/kgfor BG 201-400 mg/dL (1/2 daily dose given as basal insulin)
SSI = regular insulin 4 times daily for BG > 140 mg/dL
No differences in rate of hypoglycemia or hospital length of stayNo differences in rate of hypoglycemia or hospital length of stay
Days of Therapy
Mea
n B
G (
mg
/dL
)
100
120
140
160
180
200
220
240
Admit 1
SSI
Basal-bolus insulin
** *
†
2 3 4 5 6 7 8 9 10
††
†
Basal-Bolus Superior to Sliding Scale Insulin (SSI) Treatment for Inpatient Hyperglycemia
Achievement of Glucose Goals
Outcomes and Hypoglycemia
Hospital Complications*
BG <70 mg/dL
BG <40 mg/dL
Basal bolus
8.6% 23.1% 3.8%
Sliding scale
24.3% 4.7% 0%
P value 0.003 < 0.001 0.057
*Composite of postoperative complications including wound infection, pneumonia, bacteremia, respiratory, and acute renal failure
Basal-Bolus vs. Sliding Scale Insulin in RABBIT 2 Surgery Study
Umpierrez GE et al. Diabetes Care. 2011; 34:256-61.
Managing Hyperglycemia in Inpatients: Ensuring Success
21

Clear definition of hypoglycemia- (BG < 70 mg/dL)
Nursing order to treat without delay- Stop insulin infusion (if patient on one - unless type 1
diabetes mellitus)- Oral glucose (if patient able to take oral)- IV dextrose or glucagon (if patient unable to take oral)- Repeat BG monitoring 15 min after treatment for
hypoglycemia and repeat treatment if BG not up to target- Directions for when and how to restart insulin
Look for cause of hypoglycemia and determine if othertreatment changes are needed
Moghissi ES et al. Endocr Pract. 2009; 15:353-69.
Essential Part of Insulin Therapy:Hypoglycemia Protocol
Roe ED et al. Hosp Pract (1995). 2012; 40:116-25.
If patient CAN safely swallow without aspirating
If BG 50-69 mg/dL: Give 4 oz. juice or regular soda
If BG ≤49 mg/dL: Give 8 oz. juice or regular soda
If patient CANNOT safely swallow or patient has NPO
status
If BG 50-69 mg/dL: Give D50W 25-50 mL (12.5-25
g dextrose) IV push
If BG ≤ 49 mg/dL: Give 1 mg glucagon IM
• Recheck BG in 15-20 min. If BG <70 mg/dL, then continuously repeat until BG ≥70 mg/dL and notify provider.
• Once BG >70 mg/dL, repeat BG monitoring in 1 hour and check again in 2 hours. Notify provider of insulin adjustments and changes in BG monitoring.
• If BG level has not remained ≥70 mg/dL for both BG checks, notify provider for further insulin adjustments and changes in BG level monitoring.
Example Hypoglycemia Protocol
• Determine yesterday’s total insulin doseactually administered
• Review yesterday’s glycemic control• Calculate today’s scheduled insulin dose
– Some BG values < 90 mg/dL 80% ofyesterday’s total
– BG values 90-179 mg/dL 100% ofyesterday’s total
– Some BG values ≥ 180 mg/dL, no BG < 90mg/dL 110% of yesterday’s total
McDonnell ME et al. Supplement to ACP Hospitalist. December 15, 2009: pages 24-30. URL in ref list.
Daily Dose Adjustment Conclusion “Best” blood glucose goal for ICU patients is yet
to be established
Not All IV insulin protocols are created equal(regardless of the goal)
Non-diabetes patients MAY BE different frompatients with diabetes and may benefit from tightglycemic control
Large prospective, RCT of non-diabetic patientsfollowing tight glycemic control with multiplicationfactor protocol intervention is warranted
All efforts to reduce hypoglycemia are warranted
Managing Hyperglycemia in Inpatients: Ensuring Success
22

Protocol HeterogeneityLeuven I Leuven II VISEP Glucontrol NICE SUGAR
ICU SICU MICU Sepsis Mixed ICU Mixed Mixed
Centers 1 1 18 19 42
Sample size 1548 1200 488/537 1011 ~6030
Diabetic ~13% ~17 ~30% ~19% ~20%
Excluded 14 863 1,612 ? 34,067
Stopped early No No Yes Yes No
Primary diet TPN 85% TPN 85% 60% TPN 27% TPN 25% TPN
APACHE II ~9 ~23 ~20 ~15 ~21
MortalityICU: ~ 7%Hos: ~10%
ICU: ~25%Hos: ~40%
28 Day: ~27%ICU: ~16%Hos: ~22%
28 Day: ~21%
HypoglycemiaIIT: 5%
Control: 2%IIT: 18.7 %
Control: 3.1%IIT: 17%
Control: 4.1 %IIT: 9.8
Control: 2.7%IIT: 6.8 %
Control: 0.5%
Protocol Leuven Leuven Leuven Variable ? NICE
Target (mg/dL) 80-110 80-110 80-110 80-110 81-108
Control (mg/dL) < 180 < 180 < 180 140-180 144-180
Timing ICU admit ICU admit < 12 hrs ? < 24 hrs
Duration ICU stay ICU stay ICU/ 21 days ICU or 56 days Eating or 90 days
van den Berghe G et al. N Engl J Med. 2001; 345:1359-67; van den Berghe G et al. N Engl J Med. 2006; 354:449-61; Brunkhorst FM et al. N Engl J Med. 2008; 358:125-39;
Preiser JC et al. Intensive Care Med. 2009; 35:1738-48; Finfer S et al. N Engl J Med. 2009; 360:1283-97.
IIT = intensive insulin therapy
Managing Hyperglycemia in Inpatients: Ensuring Success
23


![Hypoglycemia and Diabetes · hypoglycemia, including severe hypoglycemia, occur in people with type 2 diabetes.[25] There is no doubt that hypoglycemia can be fatal.[26] In addition](https://img.pdfslide.us/doc/110x75/5f0518c07e708231d4113f09/hypoglycemia-and-hypoglycemia-including-severe-hypoglycemia-occur-in-people-with.jpg)