Embed Size (px)
Citation preview
Addendum to Analysis Report for Task 2 of AP-088 6 d.7 bDi
Authors:
Page 1 of I6
(AP-088: Analysis Plan for Evaluation of the Effects of Head Changes on Calibration of Culebra Transmissivity Fields)
Task Number 1.3.5.3.1.2
Report Date: February 13,2003
Consulting Hydrogeologist
- GIS Specialist
Technical Review: A j ~ & b q Joel Kuszmaul Consulting Geological Engineer
QA Review: . c l \ ~ arb J. Chavez. 6820 Carlibad programs Group V
Management Review Dave Kessel
Date:
Date: fhb 3
Date: &$
Date: yI.103
Date: q/7/0 3
Manager, Performance Assessment Decision Analysis MFOR I NU
Addendum to Analysis Report for Task 2 of AP-088 Page 2 of 16
Table of Contents
Table of Contents ................................................................................................................ 2 Discussion ........................................................................................................................... 3 References Cited .............................................................................................................. 4 Figures .......................................................................................................................... 5 Appendix Supplements ................................................................................................... 8 Appendix B Supplement - Routine Calculation: Adobe Acrobat File Import for AP-088.9 Appendix D Supplement - Routine Calculation: Creation of Culebra Structure Surface for AP-088 ........................................................................................................................... 11 Appendix E Supplement - Routine Calculation: Creating Surface Elevation Data for AP- 088 .................................................................................................................................... 12 Appendix F Supplement - Routine Calculation: Creating an Isopach of Culebra Overburden for AP-088 .... ....... . ...... ......... ....... ........ .......... ..................................... 13 Appendix H Supplement - Routine Calculation: Creation of the Indicator Grids for AP- 088 ................................................................................................................................. 15
Addendum to Analysis Report for Task 2 of AP-088 Page 3 of 16
Discussion
This addendum applies to activities from Task 2 of AP-088, "Analysis Plan for
Evaluation of the Effects of Head Changes on Calibration of Culebra Transmissivity
Fields." The purpose of this task is to develop a geologically-based predictor of mean
Culebra transmissivity using a standard linear-regression approach and use this predictor
to generate 100 equally probable realizations of the Culebra mean transmissivity field.
This task is subdivided into six subtasks:
1) Conceptual Model Development - Formalize a conceptual model for geologic
controls on Culebra Transmissivity.
2) Linear Regression Analysis - Regress geologic controls against Culebra
transmissivity data to determine regression coefficients for geological controls on
transmissivity.
3) Reduction of Geological Map Data - Import geological map data from Task 1
into a GIs environment and create data files of geological and "soft" data for the
Culebra model domain.
4) Indicator Variography - Analyze variograms of an indicator function of high
Culebra transmissivity to define a variogram model and variogram model
parameters.
5) Conditional Indicator Simulation - Use variogram-model parameters for the high-
transmissivity indicator to generate 100 conditional realizations of the spatial
locations of high-transmissivity zones in the Culebra.
6 ) Construction of Transmissivity Fields -Use the regression coefficients, the 100
realizations of high-transmissivity indicators, and the other geologic data to
generate 100 realizations of the mean transmissivity in the Culebra model domain.
The activities associated with each of these subtasks are described in Holt and Yarbrough
(2002). This addendum is necessary because Task 2 has been revised to reflect new
geologic map data from Powers (2003). Powers (2003) updated two maps that are used
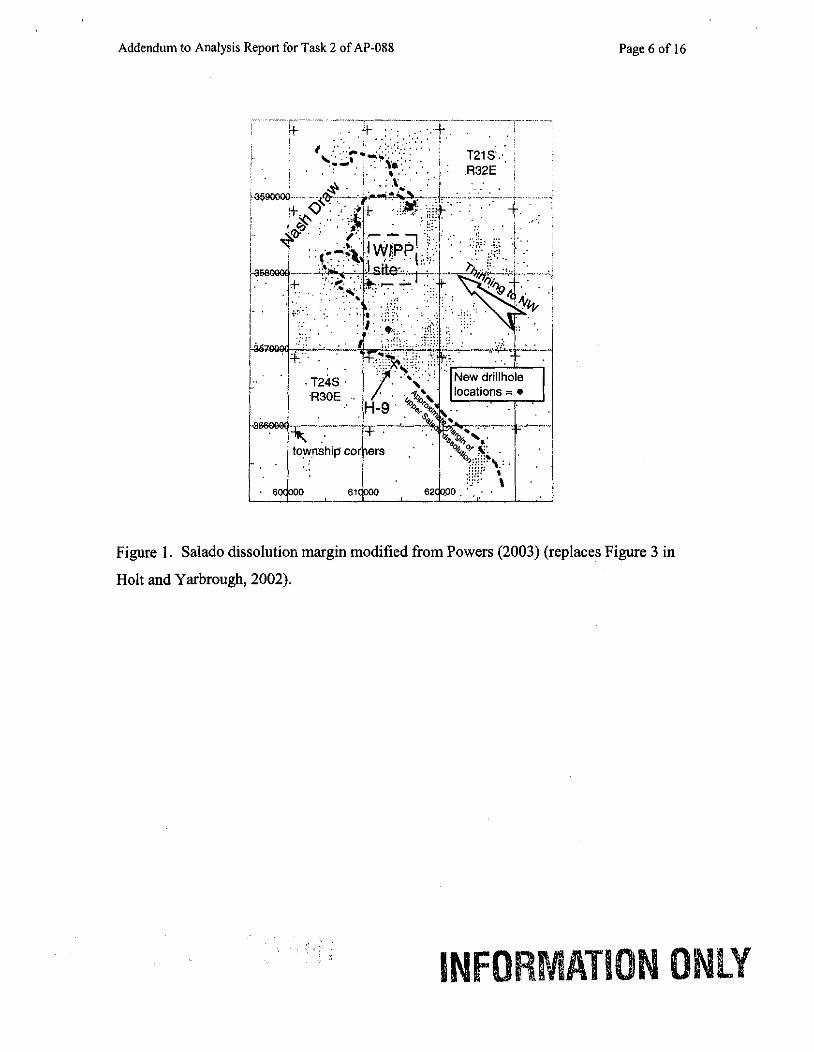
in subtask 3, specifically 1) a map showing the margin of Salado dissolution (Figure 1)
and 2) a structure contour map on the top of the Culebra Dolomite Member of the Rustler
Formation (Figure 2). These maps are used in Subtask 3, and Subtasks 3 through 6 have
been repeated. Subtasks 1 (Conceptual Model Development) and 2 (Linear Regression
INFORMATION Q
Addendum to Analysis Report for Task 2 of AP-088 Page 4 of 16
Analysis) are unaffected by these map changes. Because the new maps result in no
procedural changes in any of Task 2 Subtasks, this addendum only contains supplements
to the appendices contained within Holt and Yarbrough (2002) that require modification
due to the new data. Appendix supplements include:
Appendix B- Routine Calculation: Adobe Acrobat File Import for AP-088,
Appendix D - Routine Calculation: Creation of Culebra Structure Surface for AP-088,
= Appendix E - Routine Calculation: Creating Surface Elevation Data for AP-088,
Appendix F - Routine Calculation: Creating an Isopach of Culebra Overburden for
AP-088
Appendix H - Routine Calculation: Creation of the Indicator Grids for AP-088.
References Cited
Holt, R. M., and L. Yarbrough, Analysis Report Tmk 2 of AP-088 -Estimating base
transmissivity fields, ERMS#523889.
Powers, D. W., 2003, Analysis Report for Task 1 of Ap-088 - Construction of geologic
contour maps -Addendum, ERMS#522086.

Addendum to Analysis Report for Task 2 of AP-088 Page 5 of I6
Figures
NLY
Addendum to Analysis Report for Task 2 of AP-088
. ... - .................. -. .- .- .- - -. .., . . . . . . .:t . .
Page 6 of I6
Figure 1 . Salado dissolution margin modified from Powers (2003) (replaces Figure 3 in
Holt and Yarbrough, 2002).

Addendum to Analysis Report for Task 2 of AP-088 Page 7 of I6
Figure 2. Structure contour map on the top of the Culebra Dolomite modified from
Powers (2003).
INF
Addendum to Analysis Report for Task 2 of AP-088 Page 8 of I6
Appendix Supplements
INF
Addendum to Analysis Report for Task 2 of AP-088 Page9of 16
Appendix B Supplement - Routine Calculation: Adobe Acrobat File Import for AP-
088
Software Used:
ERDAS Imagine
ArcMap 8.1
Description:
Two revised geologic maps were imported into a GIs format. These maps were Adobe
Acrobat portable document files (PDFs). Each of these PDFs was converted to a high-
resolution (600dpi) Tagged Image Format File (TIFF). Using ERDAS Imagine, the
image files were then georectified (assigned coordinates) to the coordinate system
supplied on the maps. In each case, the Universe Transverse Mercator (UTM) Projection,
Zone 13 North was used. All maps were assigned the North American Datum 1927
(NAD27). These rectified images were then opened in ESRI ArcMap 8.1 to begin heads-
up digitizing (HUD). HUD is an interpretive procedure that allows the analyst to trace
on-screen features from a rectified image. The HUD resulted in the following spatial arc
data.
Input:
"Culebra-Elev-rev-1-3-03B.pdf' from ERMS# 522086
"Salado~Dissolution~Line~revised~l-3-03.pdf' from ERMS# 522086
Output:
ArcView Shapefiles:
"dissolution-1ine.shp"
"culebra-contours.shp"
Data Sources:
Spatial data digitized from geologic maps prepared by Dennis Powers for Task
088. ERMS# 522086
1 of AP-

Addendurn to Annlysis Repolt for Task 2 of AP-088
Platform:
1.8-GHz Pentiurn 4 - Windows 2000
Page 10 of I6
Addendum to Analysis Report for Task 2 of AP-088 Page 1 1 of 16
Appendix D Supplement - Routine Calculation: Creation of Culebra Structure
Surface for AP-088
Software Used:
ArcIInfo
Description:
Using the "culebra~contours.shp" spatial data created from the HUD (Appendix B
Supplement), a hydrologically correct surface was calculated for the top of the Culebra
Dolomite. The same technique explained in Appendix D was employed to create a
structure surface. The TOPOGRID command was executed using a 50-meter grid spacing
based on the grid locations derived in Appendix C. The resulting revised Culebra
structure surface was saved as an ArcIInfo GRID format.
Input:
ArcIInfo coverage format "culebra~contours.shp" from Appendix B Supplement.
Output:
ArcIInfo GRID format directory file named "culebra"
Data Sources:
Spatial data digitized from geologic maps prepared by Dennis Powers for Task 1 of AP-
088. ERMS# 522086. (see Input listed in Appendix B Supplement)
Platform:
1 &GHz Pentium 4 - Windows 2000
INFO I NLY

Addendum to Analysis Report for Task 2 of AP-088 Page 12 of 16
Appendix E Supplement - Routine Calculation: Creating Surface Elevation Data for
AP-088
Software Used:
ArcView
Description:
During the first execution of this subtask, elevation data obtained from the USGS
National Elevation Dataset (NED) (http://edcntsl2.cr.usgs.gov/ned/) was assumed to
posses a geographic datum of North American Datum 1927 (NAD27). This assumption
was incorrect and the correct datum was NAD83. To correct this datumshift, the
elevation data was then reprojected to NAD27 prior to resampling the 30 meter data to
conform to the study area's 50 meter grid spacing.
Input:
ArcIInfo GRID format file of the USGS National Elevation Dataset (NED)
Output:
ArcJInfo GRID format directory file named "dem-utm-nad27"
Data Sources:
USGS National Elevation Dataset (NED) (http://edcntsl2.cr.usgs.gov/ned~)
Platform:
I .8-GHz Pentium 4 - Windows 2000
INF ION 0
Addendum to Analysis Report for Task 2 of AP-088 Page 13 of 16
Appendix F Supplement - Routine Calculation: Creating an Isopach of Culebra
Overburden for AP-088
Software Used:
ArcView
Description:
Using the digital elevation data from the NED and the Culebra structure surface, an
isopach grid was created. The revised isopach was created in ArcView using the map
calculator function. The Culebra structure data were subtracted from the elevation data.
The resulting grid is a revised isopach of Culebra overburden on 50-meter spacing.
As before, the GRIDPOINT function in ArcIInfo was used to generate a point spatial data
set. The data was queried using the same 50-meter grid spacing developed in Appendix
C. This resulting isopach data file was exported into a TAB delimited text format.
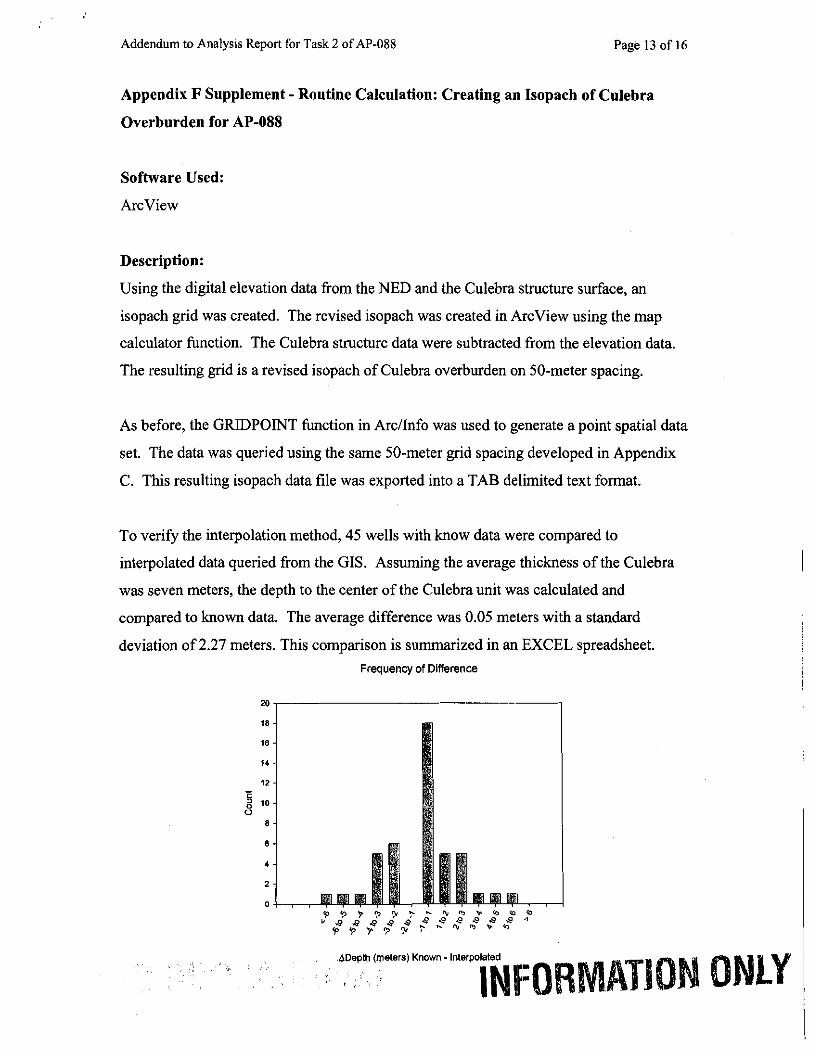
To verify the interpolation method, 45 wells with know data were compared to
interpolated data queried from the GIs. Assuming the average thickness of the Culebra
was seven meters, the depth to the center of the Culebra unit was calculated and
compared to known data. The average difference was 0.05 meters with a standard
deviation of 2.27 meters. This comparison is summarized in an EXCEL spreadsheet. Frequency of Difference
. . .bDepth (meters) Known - Interpolated . , ,, , , ", , . .
. , , : . , . INF

Addendum to Analysis Report for Task 2 of AP-088 Page 14 of 16
Input:
ArcIInfo GRID format directory file named "culebra" from Appendix D
Supplement
ArcIInfo GRID format directory file named "dem-utm-nad27" from Appendix E
Supplement
Output:
ArcIInfo GRID format directory file named "isopach"
EXCEL format file "qa~isopach~supplement.xls"
TAB delimitated file "isopach.txt"
Data Sources:
Geologic maps prepared by Dennis Powers for Task 1 of AP-088. ERMS# 522086. (see
Input listed in Appedix B Supplement)
USGS National Elevation Dataset (NED) (httv://edcntsl2.cr.usns.gov/ned/)
Platform:
1.8-GHz Pentium 4 - Windows 2000
INFO I
Addendum to Analysis Report for Task 2 of AP-088 Page 15of I6
Appendix H Supplement - Routine Calculation: Creation of the Indicator Grids for
AP-088
Software Used:
ArcIInfo
Description:
The indicator grids described in Appendix H, required recreating using the newly revised
data files. The halite margin m2lh2, and halite margin m3/h3 spatial data did not change
so a revised M2iH2 Indicator was not need. Only the Dissolution and Middlezone
Indicators required revision.
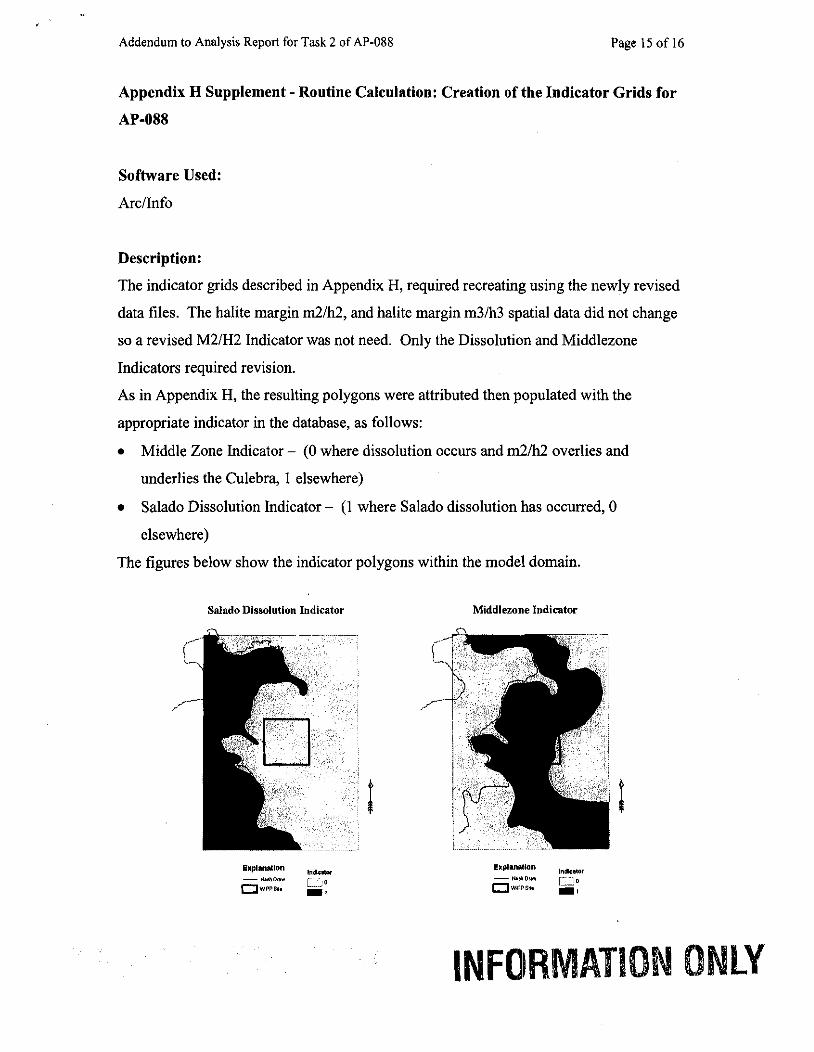
As in Appendix H, the resulting polygons were attributed then populated with the
appropriate indicator in the database, as follows:
Middle Zone Indicator - (0 where dissolution occurs and m2h2 overlies and
underlies the Culebra, 1 elsewhere)
Salado Dissolution Indicator - (1 where Salado dissolution has occurred, 0
elsewhere)
The figures below show the indicator polygons within the model domain.
Salado Dissolution Indicator Middlezone Indicator
Addendum to Analysis Report for Task 2 of AP-088 Page 16 of 16
Next the 50-meter points created in a previous subtask (Appendix C) were overlain on
each of the newly revised indicator polygons. The attributes of the polygons were then
spatially joined to the points, thereby creating a new attribute in the point data
representing the associated indicator value. Two indicator point data files were created
using this technique:
Middle Zone Indicator Grid
Salado Dissolution Indicator Grid
Numerous points within the indicator regions and along the indicator boundaries were
checked to assure proper indicator value assignment to each point. Large scale PDFs
were produced for each grid file. The indicator was color coded and plotted with the
spatial data used to create the indicator girds. Each indicator grid was then exported into a
TAB delimited text format.
Input:
Shapefile "finalgoints.shp" from Appendix C
Shapefile "dissolution-lineshp" from Appendix B Supplement
Shapefile "salt-margin-m2-h2.shp" from Appendix B
Shapefile "salt-margin-m3-h3.shp" from Appendix B
Output: . TAB delimited file: p-middlezone.txt . TAB delimited file: p-dissolution.txt . PDF file: "middlezone-revised-qa.PDF"
PDF file: "salado~dissolution~revised~qa.PDF"
Data Sources:
Spatial data digitized from geologic maps prepared by Dennis Powers for Task 1 of AP-
088. ERMS# 522086. (see Input listed in Appendix B Supplement)
Platform:
1.8-GHz Pentium 4 - Windows 2000

Chavez, Mario Joseph
From: Joel Kuszmaul [email protected]] Sent: Monday, April 07,2003 9:45 AM To: Chavez, Mario Joseph Cc : [email protected]; rmholtQolemiss.edu Subject: RE: DRC FORM COMPLETE
Mario, either you or Rick Beauheim are welcome to sign the DRC for my review of the addendum to Holt's analysis report.
Thanks,
Joel

Chavez, Marlo Joseph
From: Robert M. Holt [[email protected]] Sent: Monday, April 07,2003 11:53 AM To: 'Chavez, Mario Joseph' Subject: RE: DRC FORM COMPLETE
Mario, You may have signature athourity for me with respect to my part of AP-088. Thanks, Bob
Chavez, Mario Joseph
From: Lance Yarbrough [[email protected]] Sent: Monday, April 07,2003 1233 PM To: 'Chaw, Mario Joseph' Cc : Richard Beauheim Subject: RE: DRC FORM COMPLETE
TO Whom It May Concern:
I give Mario Chavez and Rick Beauheim signature authority for the DRC'S and Title Page ior Task 2 of AP-088.
Respectfully, Lance Yarbrough, EIT Consulting Engineer
.......................................................... Lance D. Yarbrough, EIT Graduate Researcher/Instructor Geology and Geological Engineering 118 Carrier Hall University, MS 38677 V- (662) 915-7651 F- (662) 915-5995
INF L'


![Powers of Attorney Act 2003 - NSW Legislation · Powers of Attorney Act 2003 No 53 [NSW] Contents Page Historical version for 19.5.2010 to 12.9.2013 (generated on 18.09.2013 at 13:17)](https://img.pdfslide.us/doc/110x75/5e234b839b014954032fe86a/powers-of-attorney-act-2003-nsw-legislation-powers-of-attorney-act-2003-no-53.jpg)