Embed Size (px)
Citation preview
Local Government Victoria, FG 2 - 2017
www.delwp.vic.gov.au
Local Government - Accounting for Landfills
2016-17
AcknowledgementsLocal Government Victoria acknowledges the contributions of Crowe Horwath, the Environment Protection Authority (EPA) Victoria, Local Government Finance Professionals (FinPro), Boroondara City Council, Mitchell Shire Council and Wyndham City Council to this publication. The Victorian Auditor-General’s Office (VAGO) also contributed in an observer capacity.
AuthorLocal Government Victoria in the Department of Environment, Land, Water and Planning, 2 Lonsdale St Melbourne Victoria, 3000.
Photo creditTitle: “Behold thy Landfill”Author: “Justin Ritchie”Source: https://www.flickr.com/photos/jritch/4677818858“Behold thy Landfill” is licenced under CC BY by the Department of Environment, Land, Water and Planning.
© The State of Victoria Department of Environment, Land, Water and Planning 2017
This work is licensed under a Creative Commons Attribution 4.0 International licence. You are free to re-use the work under that licence, on the condition that you credit the State of Victoria as author. The licence does not apply to any images, photographs or branding, including the Victorian Coat of Arms, the Victorian Government logo and the Department of Environment, Land, Water and Planning (DELWP) logo. To view a copy of this licence, visit http://creativecommons.org/licenses/by/4.0/
ISBN 978-1-76047-430-0 (pdf/online)
DisclaimerThis publication may be of assistance to you but the State of Victoria and its employees do not guarantee that the publication is without flaw of any kind or is wholly appropriate for your particular purposes and therefore disclaims all liability for any error, loss or other consequence which may arise from you relying on any information in this publication.
AccessibilityIf you would like to receive this publication in an alternative format, please telephone the DELWP Customer Service Centre on 136186, email [email protected], or via the National Relay Service on 133 677 www.relayservice.com.au. This document is
also available on the internet at www.delwp.vic.gov.au.
Background.................................................................................................................................................... 2
Introduction............................................................................................................................................... 2
Key Issues................................................................................................................................................. 2
Professional Guidance............................................................................................................................. 2
Determination of Future Costs................................................................................................................3
Guidance........................................................................................................................................................ 4
Accounting for site improvements..........................................................................................................4
Accounting for cell construction.............................................................................................................4
Accounting for rehabilitation, monitoring and aftercare costs............................................................5
Accounting for landfill airspace (intangible asset)................................................................................5
Worked example............................................................................................................................................ 8
Details........................................................................................................................................................ 8
APPENDIX 1 – INITIAL NPV CALCLULATIONS.........................................................................................14
APPENDIX 2 NPV CALCULATIONS YEAR 1..............................................................................................15
APPENDIX 3 NPV CALCULATIONS YEAR 2..............................................................................................16
APPENDIX 4 NPV CALCULATIONS YEAR 3..............................................................................................18
APPENDIX 5 NPV CALCULATIONS YEAR 4..............................................................................................19
APPENDIX 6 NPV CALCULATIONS YEAR 5..............................................................................................21
References................................................................................................................................................... 22
Discount and index rate sources...............................................................................................................23
Contents
Local Government - Accounting for Landfills
1
Introduction
Most councils have either operating or closed landfill sites (or both) that give rise to obligations to rehabilitate and monitor sites for significant periods into the future. In most instances these obligations create a liability for councils. The liability can be significant and the correct measurement and treatment is vital to ensure financial reports are presented fairly.
Accounting for landfills is a technically complex accounting issue that gives rise to a number of specific challenges in the local government sector. More recently, the Victoran Environment Protection Authority (EPA) has provided for an opportunity for local governments that hold an operating landfill license to move to a provisioning model to provide a financial security to the EPA to substitute the bank gurantee requirement. Moving to the new provisioning model may necessitate a more active approach by councils to financial management and accounting of landfill assets and liabilities. This can include operating landfills and closed landfill sites.
This Local Government Victoria (LGV) financial guidence has been prepared to assist local government accountants understand the issues and be prepared for the challenges that landfill sites may pose from an accounting perspective. This financial guidence forms part of the suite of guidelines developed by LGV to provide accounting support to councils.
This guide has been prepared to il the long life cycle accounting requirements for a landfill. The guidance is general in nature and is not expected to meet or cover all possible scenarios. To assist in communicating the principles to be applied, illustrative data has been based on a simplistic single cell example. It is acknowledged that in many cases additional complexities will exist, particularly in multi cell environmments.
While the guide has been prepared to assist local government it is not a replacement for specific accounting advice and, where appropriate, councils should seek specific guidance. LGV would like to acknowledge the contributions of Crowe Horwath, the Environment Protection Authority (EPA) Victoria, Local Government Finance Professionals (FinPro), Boroondara City Council, Mitchell Shire Council and Wyndham City Council to this publication. The Victorian Auditor-General’s Office (VAGO) also contributed in an observer capacity.
Key IssuesAccounting for landfills give rise to three specific accounting issues, namely:
• Accounting for site improvements;
• Accounting for rehabilitation costs; and
• Accounting for landfill airspace (intangible asset).
While each of these issues are related, from an accounting perspective they each need to be considered separately.
Local councils are strongly encouraged to consider the requirements of this guidance statement well in advance of year end. Where potential issues exist discussions with key stakeholders, including auditors, should be undertaken early to avoid issues impacting on year end timelines.
Professional GuidanceThe following accounting standards and interpretations have been issued, providing detailed guidance and direction on the accounting issues associated with landfills:
• AASB 116 – Property, Plant and Equipment;
• AASB 136 - Impairment of Assets;
• AASB 137 - Provisions, Contingent Liabilities and Contingent Assets;
• AASB 138 - Intangible Assets; and
Background
2 Local Government - Accounting for Landfills

• Interpretation 1 - Changes in Existing Decommissioning, Restoration and Similar Liabilities.
Determination of Future CostsGiven the potential for significant impacts on assets and liabilities the accurate and complete determination of future costs is critical to the integrity of the required calculations. Accordingly, it is expected that councils will utilise appropriate expertise from within (and at times external to) council to ensure the most accurate and complete estimates can be made. It is also expected that the accuracy and completeness of cost estimates will be an area of audit focus. As such councils will be required to document the basis for the determination of the costs to a reasonably high standard.
Accounting for site improvementsThe establishment of a landfill facility will result in the acquisition/construction of a range of site improvements that are necessary for the appropriate functioning and control of the facility. Upon commencement of a landfill these assets are to be recognised in accordance with council’s asset recognition policy. Assets are to be depreciated over the life of the asset to council, or the life of the landfill site, whichever is the shorter.
It is important to note that some site improvements, such as fencing, will potentially have a life that extends beyond the operational life of the site and into its rehabilitation phase, whereas others are unlikely to have a life that could exceed the operational life of the site.
Typically, site improvements capitalised as part of the establishment of a landfill will include:
• Roadways;
• Drainage;
• Leachate ponds;
• Fencing;
• Site huts/shedding; and
• Weighbridge.
Other improvements could also be included as part of this asset. Site improvements do not necessarily need to be accounted for as one asset. Where it makes sense and is more practical to do so the individual improvements can be accounted for within other (consistent) categories. However regardless of the approach taken the improvements should not be given a life greater than that of the overall landfill site.
Accounting for cell constructionIn addition to site improvements there will be cost incurred directly in relation to the construction of individual landfill cells. Costs incurred in the construction of the landfill cells should be capitalised as a tangible asset. This asset should then be depreciated over the life of the cell.
It is acknowledged that at times judgement will need to be exercised to determine if particular costs are to be included as part of the cell construction or broader land improvement categories.
Local Government - Accounting for Landfills
3
Guidance

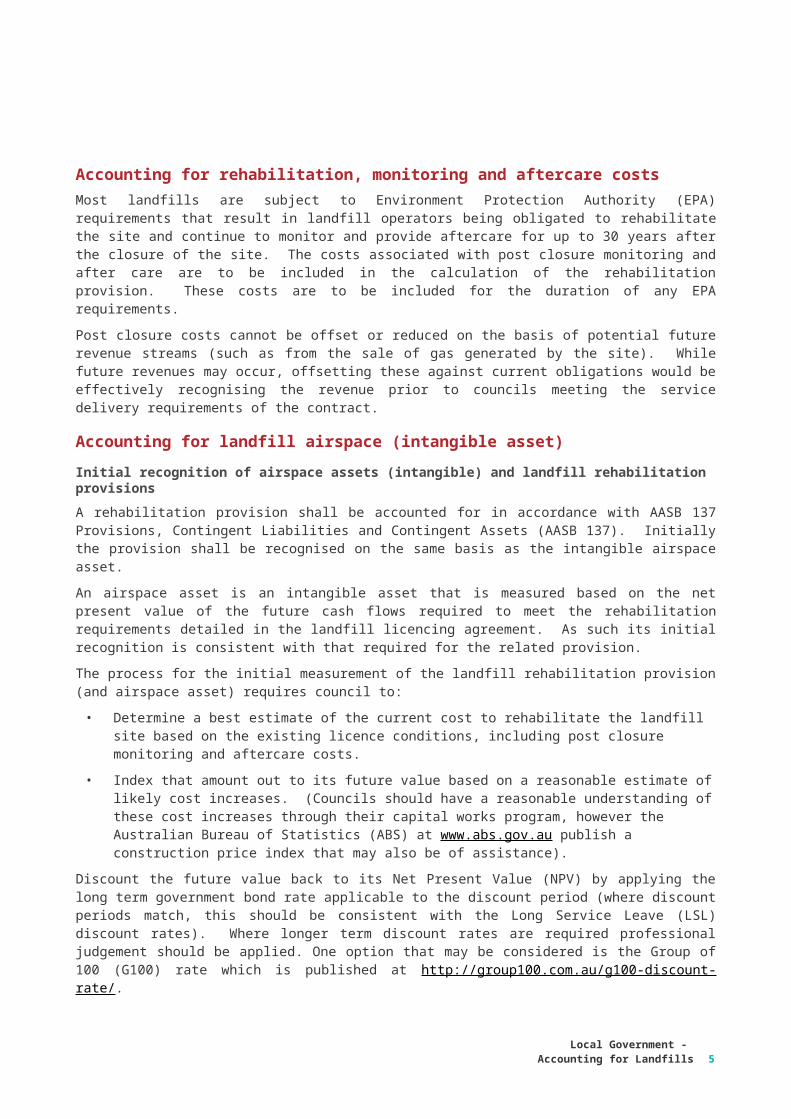
Accounting for rehabilitation, monitoring and aftercare costsMost landfills are subject to Environment Protection Authority (EPA) requirements that result in landfill operators being obligated to rehabilitate the site and continue to monitor and provide aftercare for up to 30 years after the closure of the site. The costs associated with post closure monitoring and after care are to be included in the calculation of the rehabilitation provision. These costs are to be included for the duration of any EPA requirements.
Post closure costs cannot be offset or reduced on the basis of potential future revenue streams (such as from the sale of gas generated by the site). While future revenues may occur, offsetting these against current obligations would be effectively recognising the revenue prior to councils meeting the service delivery requirements of the contract.
Accounting for landfill airspace (intangible asset)
Initial recognition of airspace assets (intangible) and landfill rehabilitation provisionsA rehabilitation provision shall be accounted for in accordance with AASB 137 Provisions, Contingent Liabilities and Contingent Assets (AASB 137). Initially the provision shall be recognised on the same basis as the intangible airspace asset.
An airspace asset is an intangible asset that is measured based on the net present value of the future cash flows required to meet the rehabilitation requirements detailed in the landfill licencing agreement. As such its initial recognition is consistent with that required for the related provision.
The process for the initial measurement of the landfill rehabilitation provision (and airspace asset) requires council to:
• Determine a best estimate of the current cost to rehabilitate the landfill site based on the existing licence conditions, including post closure monitoring and aftercare costs.
• Index that amount out to its future value based on a reasonable estimate of likely cost increases. (Councils should have a reasonable understanding of these cost increases through their capital works program, however the Australian Bureau of Statistics (ABS) at www.abs.gov.au publish a construction price index that may also be of assistance).
Discount the future value back to its Net Present Value (NPV) by applying the long term government bond rate applicable to the discount period (where discount periods match, this should be consistent with the Long Service Leave (LSL) discount rates). Where longer term discount rates are required professional judgement should be applied. One option that may be considered is the Group of 100 (G100) rate which is published at http://group100.com.au/g100-discount-rate/.
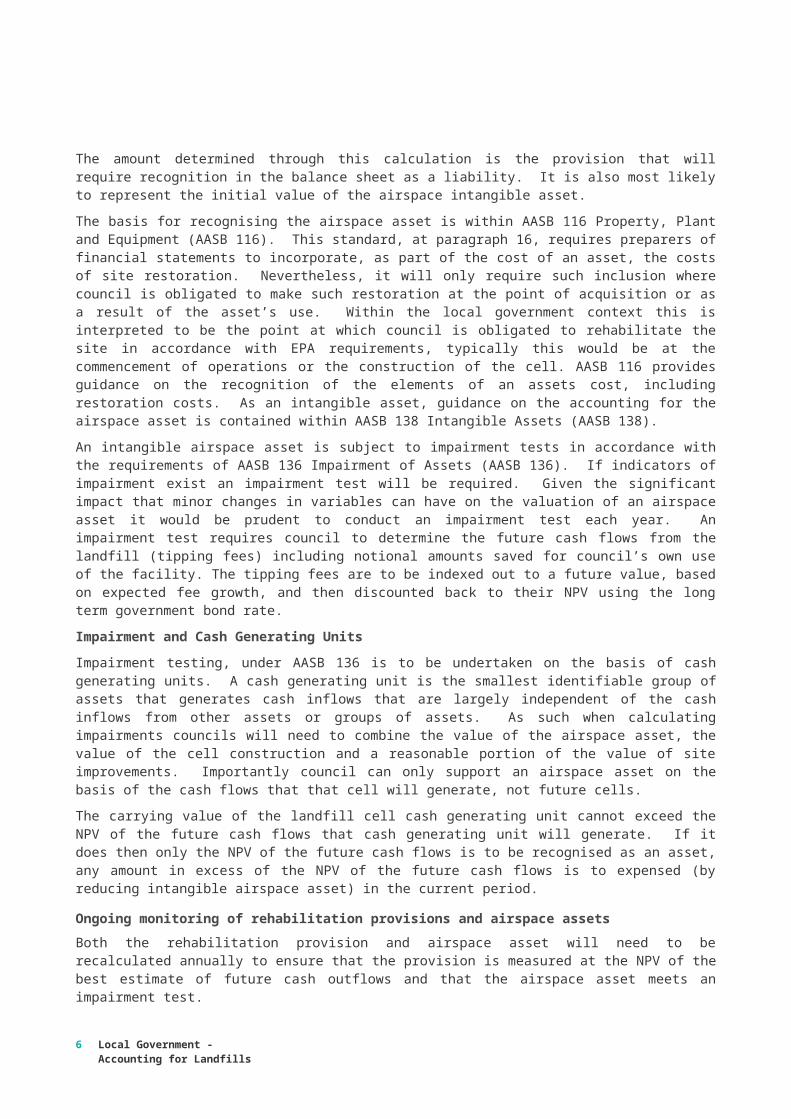
The amount determined through this calculation is the provision that will require recognition in the balance sheet as a liability. It is also most likely to represent the initial value of the airspace intangible asset.
The basis for recognising the airspace asset is within AASB 116 Property, Plant and Equipment (AASB 116). This standard, at paragraph 16, requires preparers of financial statements to incorporate, as part of the cost of an asset, the costs of site restoration. Nevertheless, it will only require such inclusion where council is obligated to make such restoration at the point of acquisition or as a result of the asset’s use. Within the local government context this is interpreted to be the point at which council is obligated to rehabilitate the site in accordance with EPA requirements, typically this would be at the commencement of operations or the construction of the cell. AASB 116 provides guidance on the recognition of the elements of an assets cost, including restoration costs. As an intangible asset, guidance on the accounting for the airspace asset is contained within AASB 138 Intangible Assets (AASB 138).
An intangible airspace asset is subject to impairment tests in accordance with the requirements of AASB 136 Impairment of Assets (AASB 136). If indicators of impairment exist an impairment test will be required. Given the significant impact that minor changes in variables can have on the valuation of an airspace asset it would be prudent to conduct an impairment test each year. An impairment test requires council to determine the future cash flows from the landfill (tipping fees) including notional amounts saved for council’s own use of 4 Local Government -
Accounting for Landfills
the facility. The tipping fees are to be indexed out to a future value, based on expected fee growth, and then discounted back to their NPV using the long term government bond rate.
Impairment and Cash Generating Units
Impairment testing, under AASB 136 is to be undertaken on the basis of cash generating units. A cash generating unit is the smallest identifiable group of assets that generates cash inflows that are largely independent of the cash inflows from other assets or groups of assets. As such when calculating impairments councils will need to combine the value of the airspace asset, the value of the cell construction and a reasonable portion of the value of site improvements. Importantly council can only support an airspace asset on the basis of the cash flows that that cell will generate, not future cells.
The carrying value of the landfill cell cash generating unit cannot exceed the NPV of the future cash flows that cash generating unit will generate. If it does then only the NPV of the future cash flows is to be recognised as an asset, any amount in excess of the NPV of the future cash flows is to expensed (by reducing intangible airspace asset) in the current period.
Ongoing monitoring of rehabilitation provisions and airspace assetsBoth the rehabilitation provision and airspace asset will need to be recalculated annually to ensure that the provision is measured at the NPV of the best estimate of future cash outflows and that the airspace asset meets an impairment test.
The accounting for changes in the rehabilitation provision (and related assets), subject to their initial recognition, is specifically dealt with in AASB Interpretation 1 Changes in Existing Decommissioning, Restoration and Similar Liabilities (Interpretation 1). Interpretation 1 distinguishes between changes that reflect the passage of time (also referred to as the unwinding of the discount) and other changes. The interpretation states that:
• The unwinding of the discount shall be recognised in the profit and loss as a finance cost as it is incurred.
• Other changes such as timing or amount of economic outflow or a change in the discount rate shall be accounted for as follows:
– If the asset is measured at cost – changes in the provision shall be added to or deducted from the cost of the asset (airspace).
– If the asset is measured using the revaluation model – changes in the provision shall alter the revaluation increase or decrease previously recognised.
In simple terms the interpretation requires that changes, other than those reflecting the unwinding of the discount, should be recognised by making an equivalent adjustment to the airspace asset. This is always subject to the airspace asset not exceeding the NPV of the future cash flows associated with its ongoing operations.
In practice this will mean that changes to the rehabilitation requirements of a cell as it is nearing the end of its life are less likely to be supported than those that occur earlier in the life of the asset.
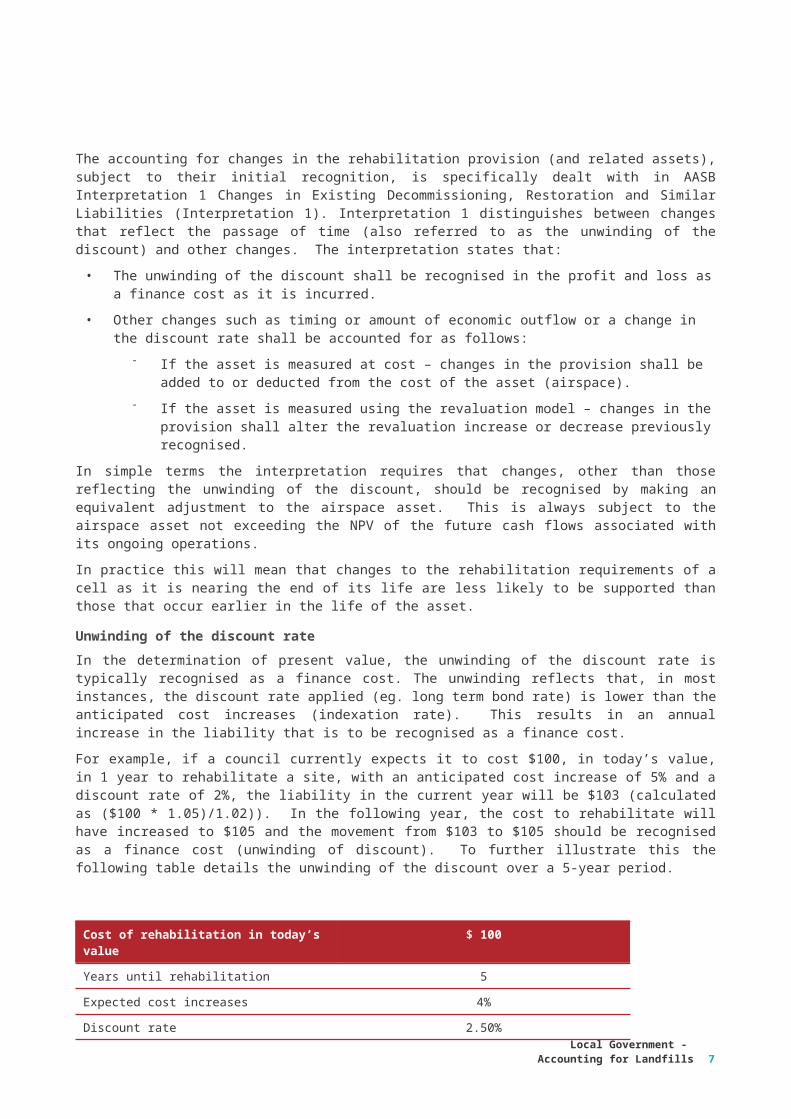
Unwinding of the discount rateIn the determination of present value, the unwinding of the discount rate is typically recognised as a finance cost. The unwinding reflects that, in most instances, the discount rate applied (eg. long term bond rate) is lower than the anticipated cost increases (indexation rate). This results in an annual increase in the liability that is to be recognised as a finance cost.
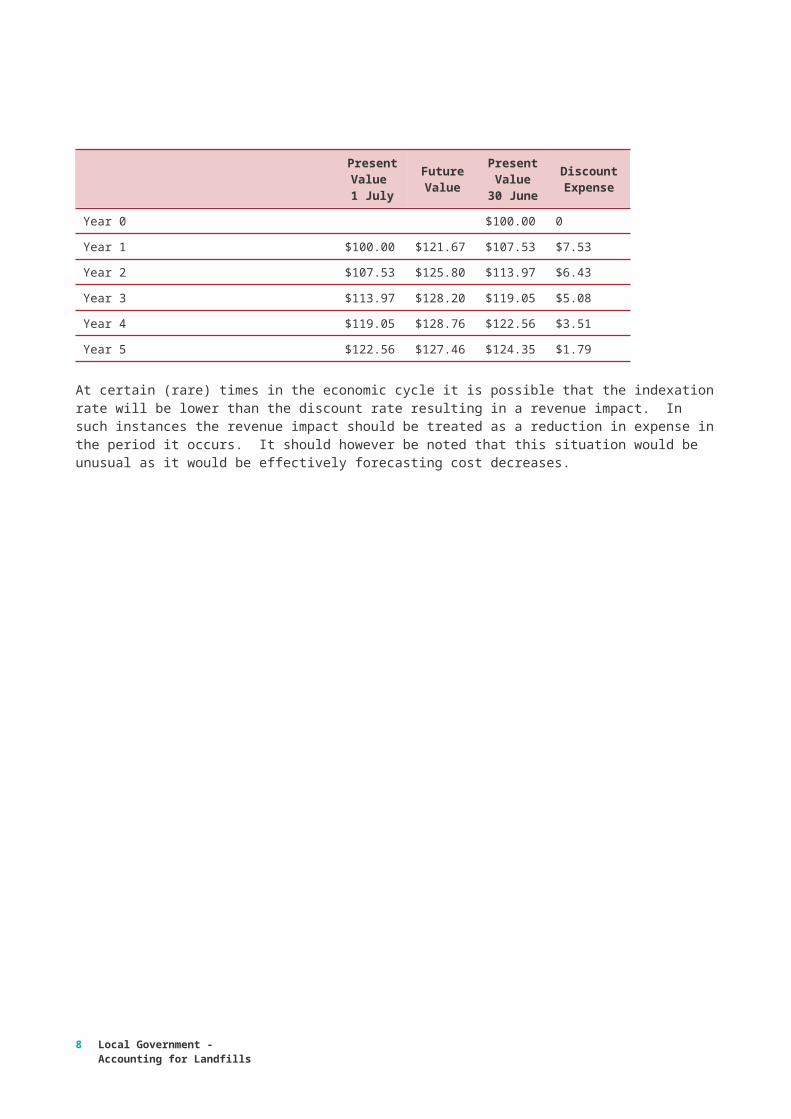
For example, if a council currently expects it to cost $100, in today’s value, in 1 year to rehabilitate a site, with an anticipated cost increase of 5% and a discount rate of 2%, the liability in the current year will be $103 (calculated as ($100 * 1.05)/1.02)). In the following year, the cost to rehabilitate will have increased to $105 and the movement from $103 to $105 should be recognised as a finance cost (unwinding of discount). To further illustrate this the following table details the unwinding of the discount over a 5-year period.
Local Government - Accounting for Landfills
5
Cost of rehabilitation in today’s value $ 100
Years until rehabilitation 5
Expected cost increases 4%
Discount rate 2.50%
Present Value 1 July
Future Value
Present Value
30 June
Discount Expense
Year 0 $100.00 0
Year 1 $100.00 $121.67 $107.53 $7.53
Year 2 $107.53 $125.80 $113.97 $6.43
Year 3 $113.97 $128.20 $119.05 $5.08
Year 4 $119.05 $128.76 $122.56 $3.51
Year 5 $122.56 $127.46 $124.35 $1.79
At certain (rare) times in the economic cycle it is possible that the indexation rate will be lower than the discount rate resulting in a revenue impact. In such instances the revenue impact should be treated as a reduction in expense in the period it occurs. It should however be noted that this situation would be unusual as it would be effectively forecasting cost decreases.
6 Local Government - Accounting for Landfills
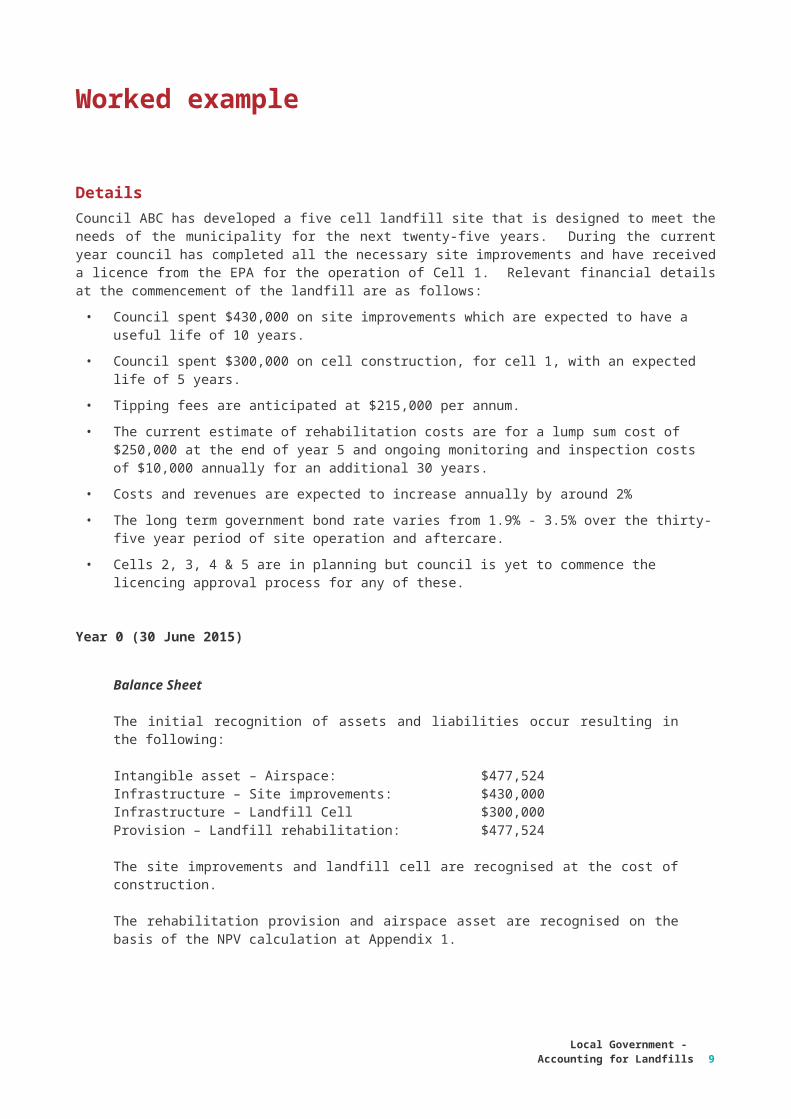
DetailsCouncil ABC has developed a five cell landfill site that is designed to meet the needs of the municipality for the next twenty-five years. During the current year council has completed all the necessary site improvements and have received a licence from the EPA for the operation of Cell 1. Relevant financial details at the commencement of the landfill are as follows:
• Council spent $430,000 on site improvements which are expected to have a useful life of 10 years.
• Council spent $300,000 on cell construction, for cell 1, with an expected life of 5 years.
• Tipping fees are anticipated at $215,000 per annum.
• The current estimate of rehabilitation costs are for a lump sum cost of $250,000 at the end of year 5 and ongoing monitoring and inspection costs of $10,000 annually for an additional 30 years.
• Costs and revenues are expected to increase annually by around 2%
• The long term government bond rate varies from 1.9% - 3.5% over the thirty-five year period of site operation and aftercare.
• Cells 2, 3, 4 & 5 are in planning but council is yet to commence the licencing approval process for any of these.
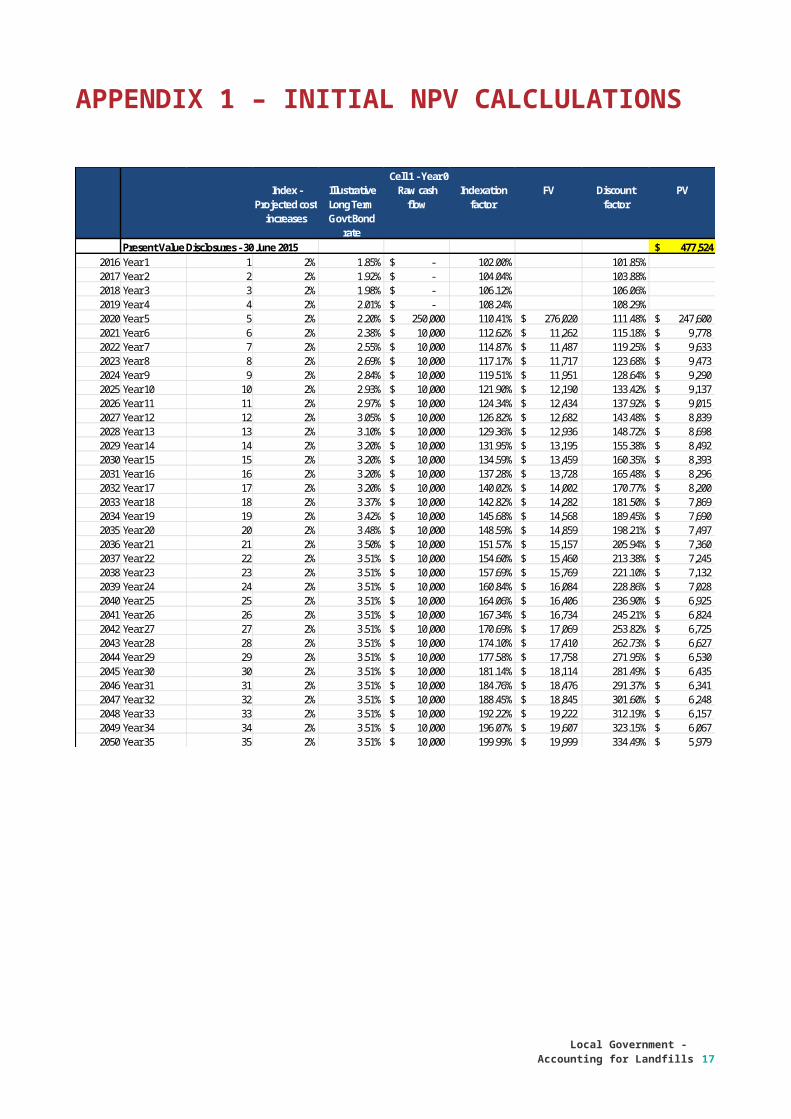
Year 0 (30 June 2015)
Balance Sheet
The initial recognition of assets and liabilities occur resulting in the following:
Intangible asset – Airspace: $477,524Infrastructure – Site improvements: $430,000Infrastructure – Landfill Cell $300,000Provision – Landfill rehabilitation: $477,524
The site improvements and landfill cell are recognised at the cost of construction.
The rehabilitation provision and airspace asset are recognised on the basis of the NPV calculation at Appendix 1.
Local Government - Accounting for Landfills
7
Worked example
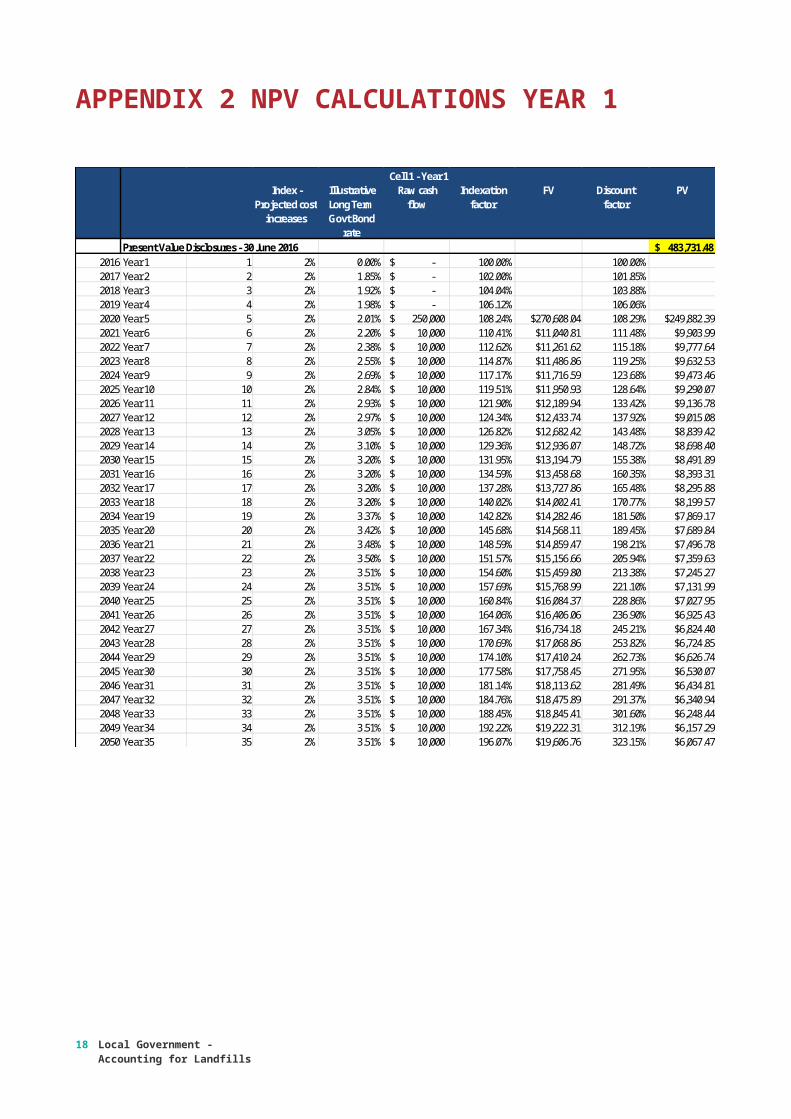
Year 1 (30 June 2016)
This is the first completed year of operation, under this worked example there were no changes to any of the underlying assumptions. Accordingly the following impacts were reported in council’s financial report:
Statement of Comprehensive Income
Revenue – Tipping fees: $ 215,000 Tipping fees received
Depreciation – PPE $ (103,000) Amortisation – Airspace $ (95,505) Amortisation over 5 year lifeFinance costs $ (6,208) Unwinding of discount
Impact on operating result: $ 10,288
Balance Sheet
Cash at bank $ 215,000 Tipping fees received
Cell Construction and Site Improvements $ 730,000Accumulated depreciation $ 103,000 Annual depreciation charge
$ 627,000
Airspace $ 477,524Accumulated amortisation $ 95,505 Annual amortisation charge
$ 382,019
Rehabilitation provision $483,731 Increase $6,208 for unwinding of discount
Impairment test
NPV of future tipping fees (4 years @ $215,000) $858,305Unadjusted Cash Generateing Unit Value: $794,019
The rehabilitation provision and airspace asset are recognised on the basis of the NPV calculation at Appendix 2.
8 Local Government - Accounting for Landfills
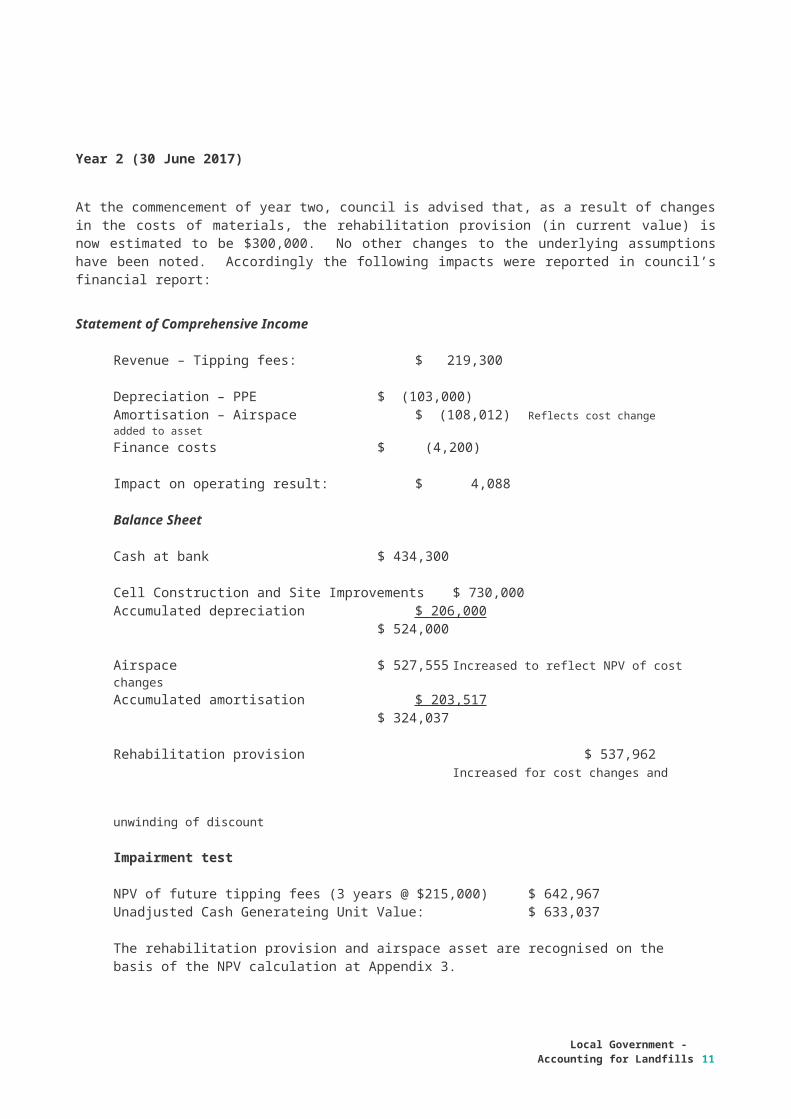
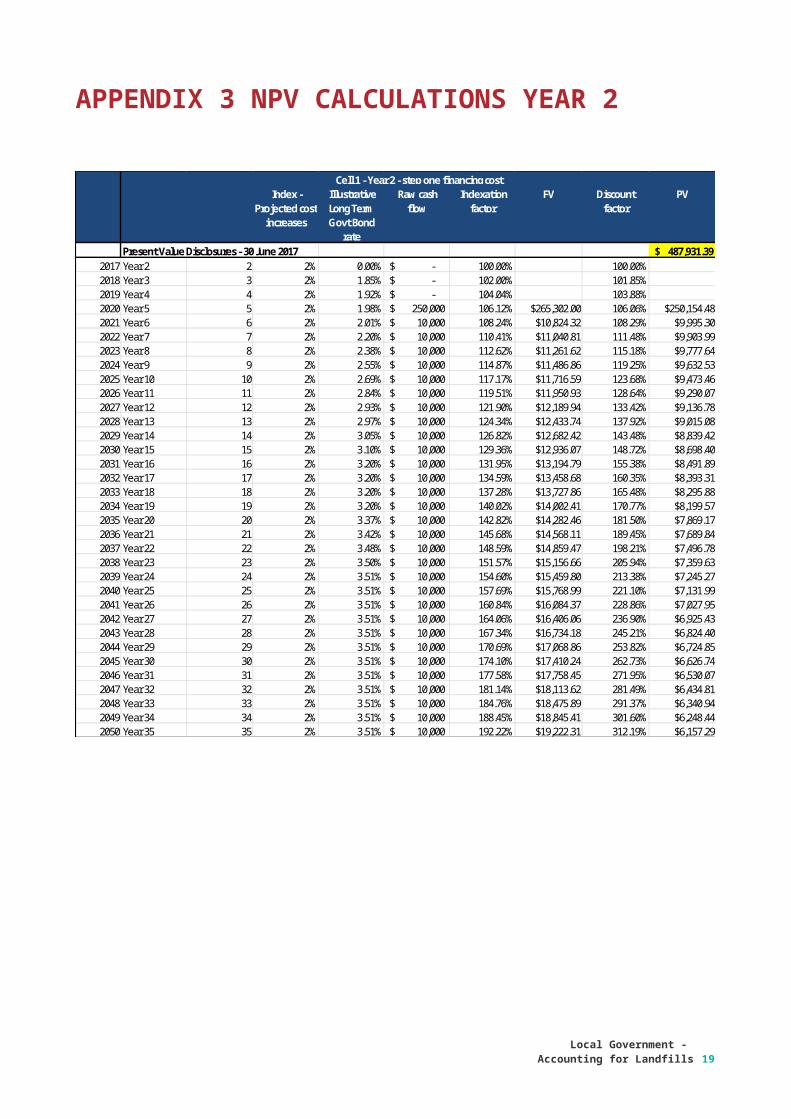
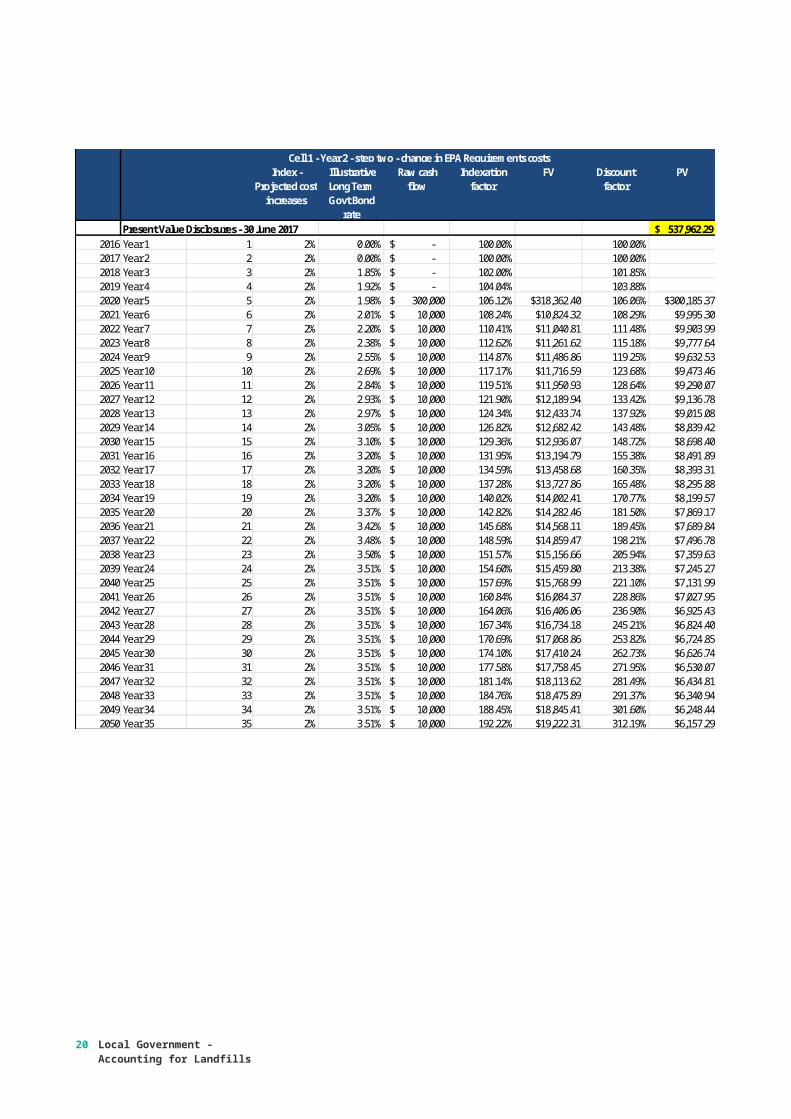
Year 2 (30 June 2017)
At the commencement of year two, council is advised that, as a result of changes in the costs of materials, the rehabilitation provision (in current value) is now estimated to be $300,000. No other changes to the underlying assumptions have been noted. Accordingly the following impacts were reported in council’s financial report:
Statement of Comprehensive Income
Revenue – Tipping fees: $ 219,300
Depreciation – PPE $ (103,000) Amortisation – Airspace $ (108,012) Reflects cost change added to assetFinance costs $ (4,200)
Impact on operating result: $ 4,088
Balance Sheet
Cash at bank $ 434,300
Cell Construction and Site Improvements $ 730,000Accumulated depreciation $ 206,000
$ 524,000
Airspace $ 527,555 Increased to reflect NPV of cost changesAccumulated amortisation $ 203,517
$ 324,037
Rehabilitation provision $ 537,962 Increased for cost changes and unwinding of discount
Impairment test
NPV of future tipping fees (3 years @ $215,000) $ 642,967Unadjusted Cash Generateing Unit Value: $ 633,037
The rehabilitation provision and airspace asset are recognised on the basis of the NPV calculation at Appendix 3.
Local Government - Accounting for Landfills
9

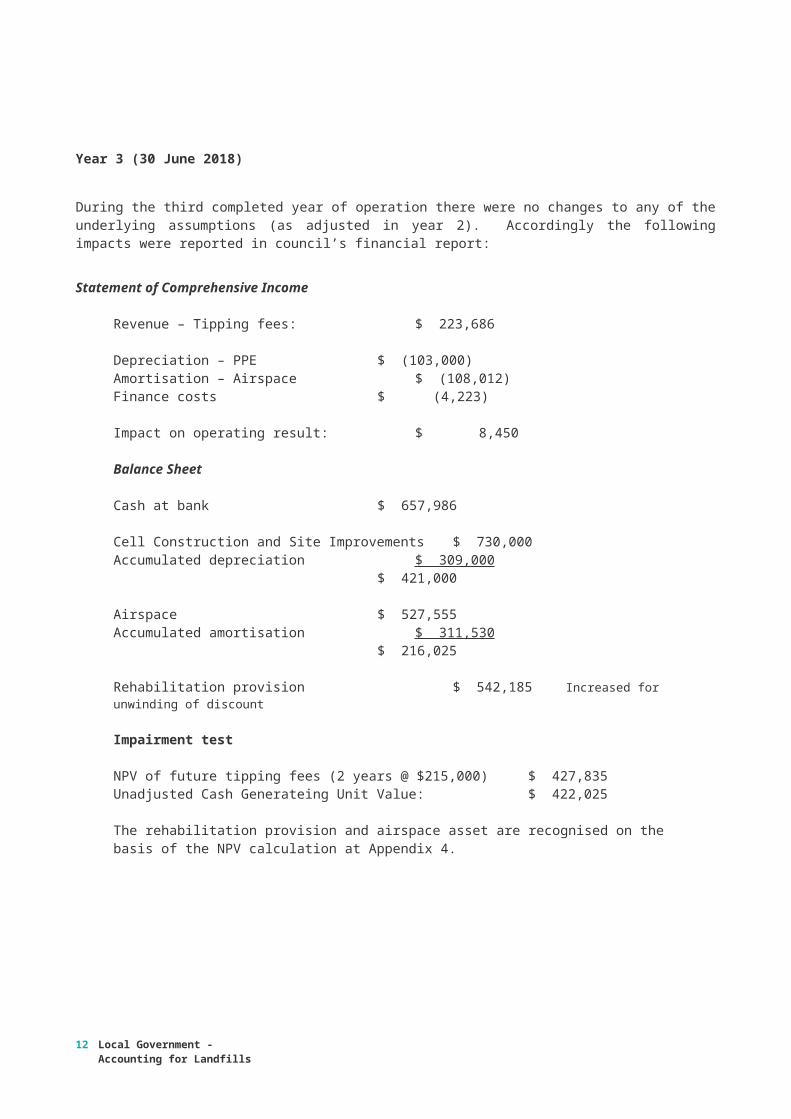
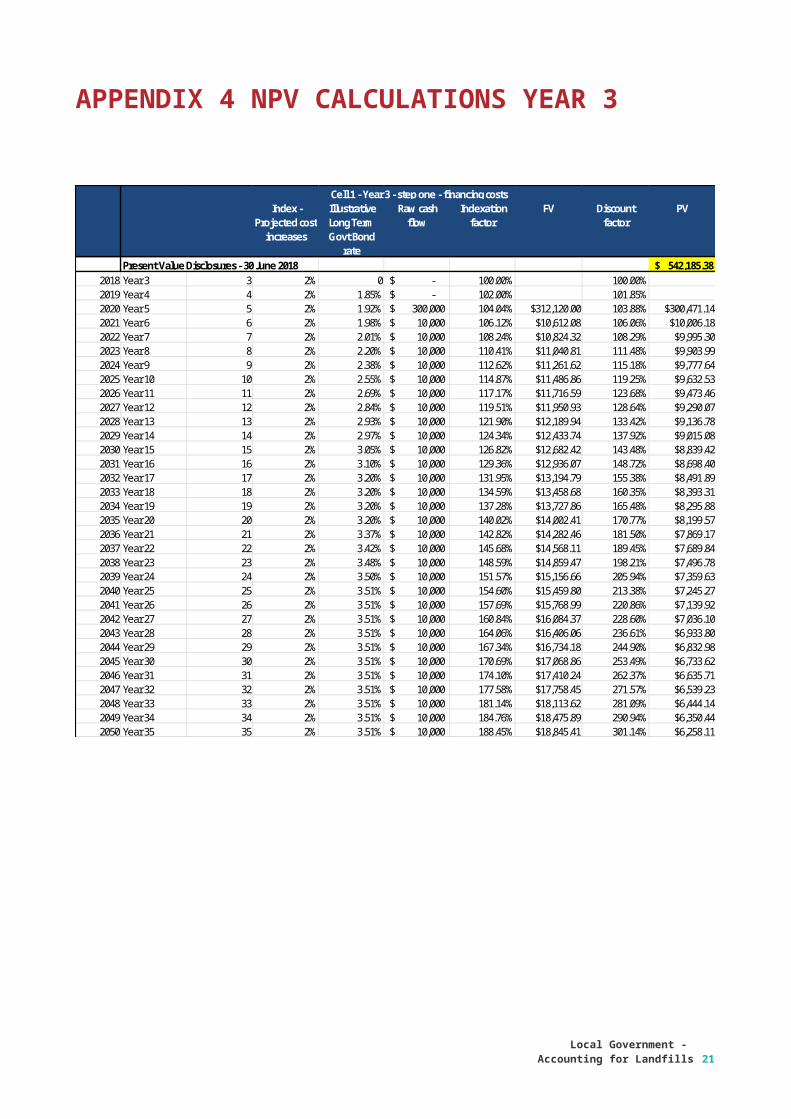
Year 3 (30 June 2018)
During the third completed year of operation there were no changes to any of the underlying assumptions (as adjusted in year 2). Accordingly the following impacts were reported in council’s financial report:
Statement of Comprehensive Income
Revenue – Tipping fees: $ 223,686
Depreciation – PPE $ (103,000) Amortisation – Airspace $ (108,012)Finance costs $ (4,223)
Impact on operating result: $ 8,450
Balance Sheet
Cash at bank $ 657,986
Cell Construction and Site Improvements $ 730,000Accumulated depreciation $ 309,000
$ 421,000
Airspace $ 527,555Accumulated amortisation $ 311,530
$ 216,025
Rehabilitation provision $ 542,185 Increased for unwinding of discount
Impairment test
NPV of future tipping fees (2 years @ $215,000) $ 427,835Unadjusted Cash Generateing Unit Value: $ 422,025
The rehabilitation provision and airspace asset are recognised on the basis of the NPV calculation at Appendix 4.
10 Local Government - Accounting for Landfills
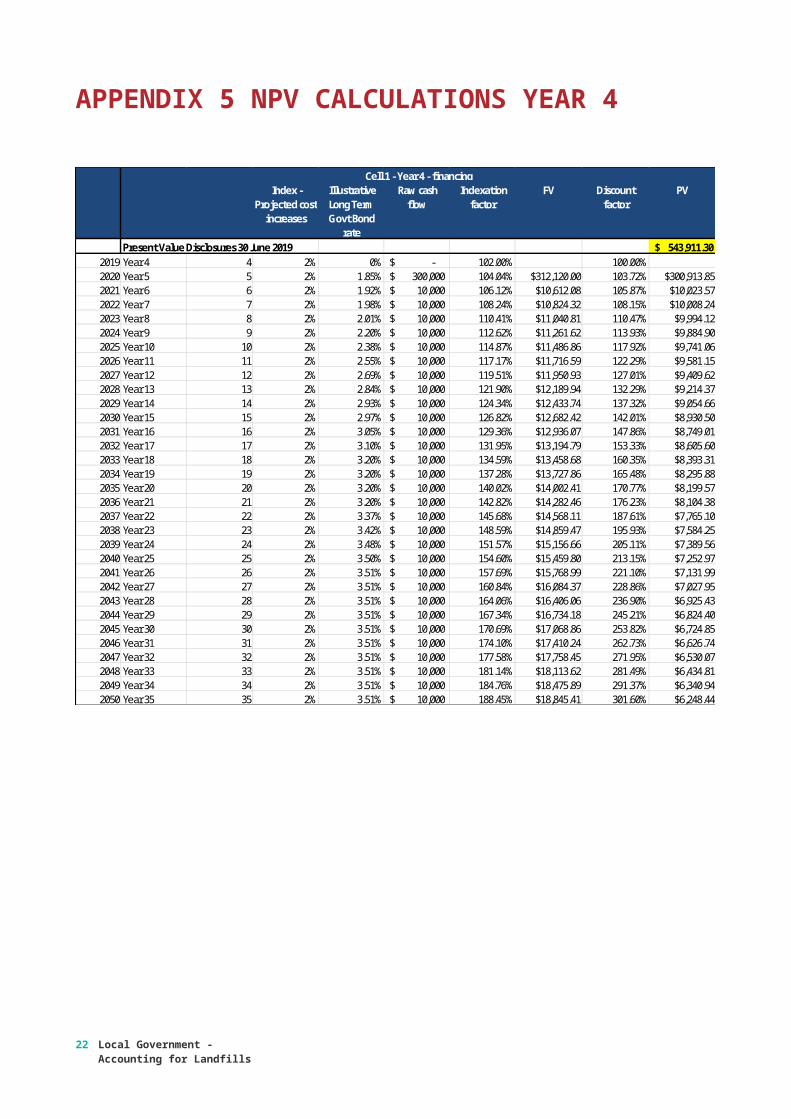
Year 4 (30 June 2019)
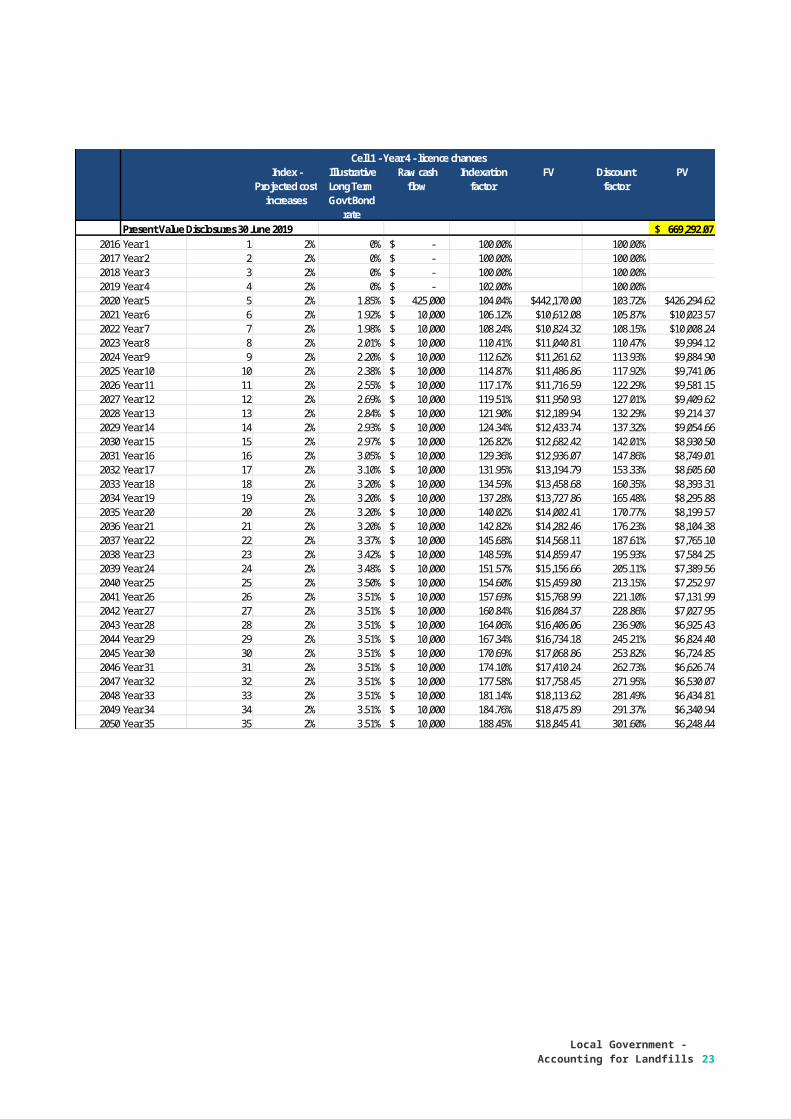
During the fourth completed year of operation the licence conditions for the landfill were significantly amended, resulting in significant increases in the obligations on council. The changes took effect at the end of the financial year. As a result the rehabilitation costs on closing are now expected to be $425,000. Accordingly the following impacts were reported in council’s financial report:
Statement of Comprehensive Income
Revenue – Tipping fees: $ 228,160
Depreciation – PPE $ (103,000) Amortisation – Airspace $ (108,012)Finance costs $ (1,726)
Impairment of Airspace $ (123,457) Impairment required (see below)
Impact on operating result: $ (108,036)
Balance Sheet
Cash at bank $ 886,146
Cell Construction and Site Improvements $ 730,000Accumulated depreciation $ 412,000
$ 318,000
Airspace $ 529,478Accumulated amortisation $ 419,542
$ 109,936
Rehabilitation provision $ 669,292 Increased for licence changes, unwinding of discount
Impairment test
NPV of future tipping fees (1 years @ $215,000) $ 212,936
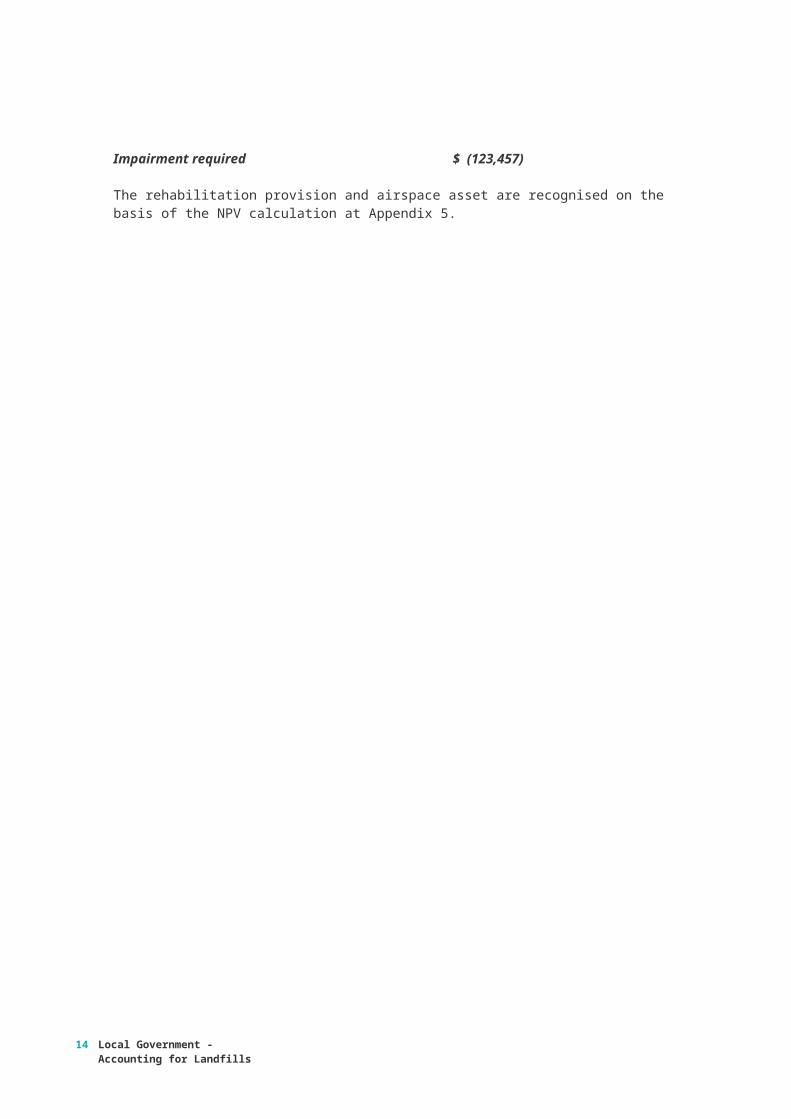
Opening Cash Generateing Unit Value $ 422,025Annual depreciation/amortisation charge $ (211,012)Additional costs to rehabilitate (NPV) $ 125,381Unadjusted $ 336,394
Impairment required $ (123,457)
The rehabilitation provision and airspace asset are recognised on the basis of the NPV calculation at Appendix 5.
Local Government - Accounting for Landfills
11
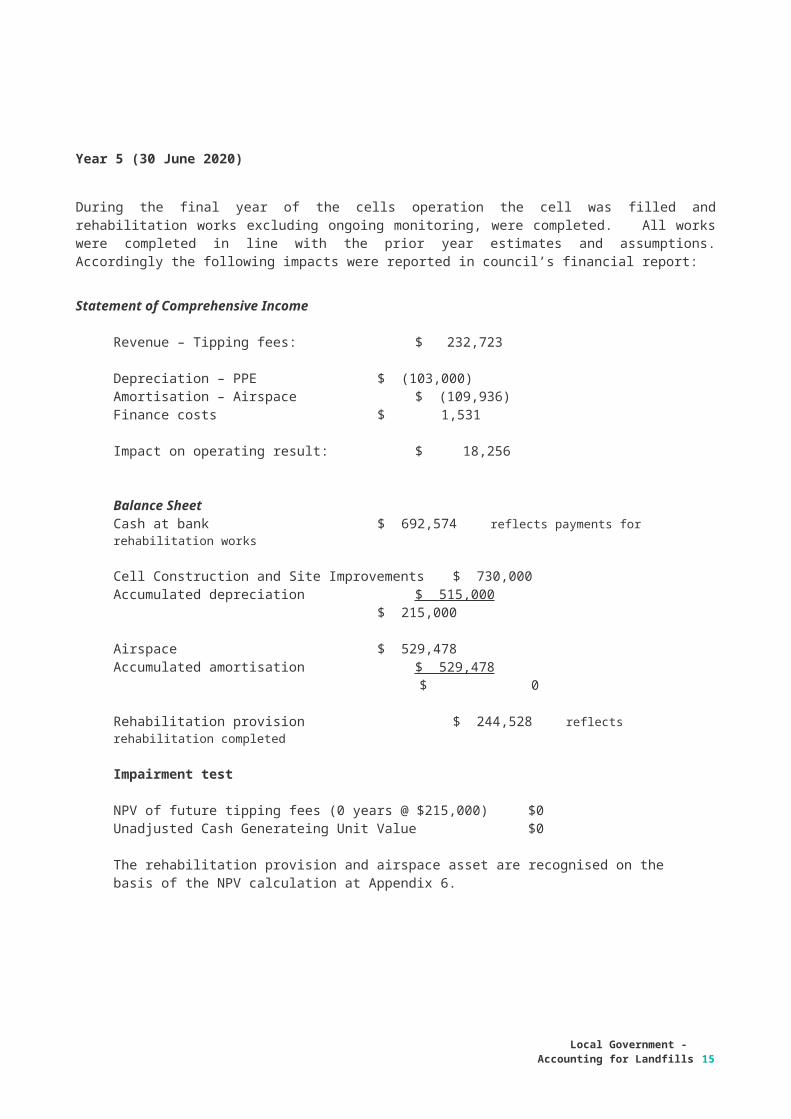
Year 5 (30 June 2020)
During the final year of the cells operation the cell was filled and rehabilitation works excluding ongoing monitoring, were completed. All works were completed in line with the prior year estimates and assumptions. Accordingly the following impacts were reported in council’s financial report:
Statement of Comprehensive Income
Revenue – Tipping fees: $ 232,723
Depreciation – PPE $ (103,000)Amortisation – Airspace $ (109,936)Finance costs $ 1,531
Impact on operating result: $ 18,256
Balance SheetCash at bank $ 692,574 reflects payments for rehabilitation works
Cell Construction and Site Improvements $ 730,000Accumulated depreciation $ 515,000
$ 215,000
Airspace $ 529,478Accumulated amortisation $ 529,478
$ 0
Rehabilitation provision $ 244,528 reflects rehabilitation completed
Impairment test
NPV of future tipping fees (0 years @ $215,000) $0Unadjusted Cash Generateing Unit Value $0
The rehabilitation provision and airspace asset are recognised on the basis of the NPV calculation at Appendix 6.
12 Local Government - Accounting for Landfills

Index - Projected cost
increases
Illustrative Long Term Govt Bond
rate
Raw cash flow
Indexation factor
FV Discount factor
PV
Present Value Disclosures - 30 June 2015 $ 477,524 2016 Year 1 1 2% 1.85% -$ 102.00% 101.85%2017 Year 2 2 2% 1.92% -$ 104.04% 103.88%2018 Year 3 3 2% 1.98% -$ 106.12% 106.06%2019 Year 4 4 2% 2.01% -$ 108.24% 108.29%2020 Year 5 5 2% 2.20% 250,000$ 110.41% 276,020$ 111.48% 247,600$ 2021 Year 6 6 2% 2.38% 10,000$ 112.62% 11,262$ 115.18% 9,778$ 2022 Year 7 7 2% 2.55% 10,000$ 114.87% 11,487$ 119.25% 9,633$ 2023 Year 8 8 2% 2.69% 10,000$ 117.17% 11,717$ 123.68% 9,473$ 2024 Year 9 9 2% 2.84% 10,000$ 119.51% 11,951$ 128.64% 9,290$ 2025 Year 10 10 2% 2.93% 10,000$ 121.90% 12,190$ 133.42% 9,137$ 2026 Year 11 11 2% 2.97% 10,000$ 124.34% 12,434$ 137.92% 9,015$ 2027 Year 12 12 2% 3.05% 10,000$ 126.82% 12,682$ 143.48% 8,839$ 2028 Year 13 13 2% 3.10% 10,000$ 129.36% 12,936$ 148.72% 8,698$ 2029 Year 14 14 2% 3.20% 10,000$ 131.95% 13,195$ 155.38% 8,492$ 2030 Year 15 15 2% 3.20% 10,000$ 134.59% 13,459$ 160.35% 8,393$ 2031 Year 16 16 2% 3.20% 10,000$ 137.28% 13,728$ 165.48% 8,296$ 2032 Year 17 17 2% 3.20% 10,000$ 140.02% 14,002$ 170.77% 8,200$ 2033 Year 18 18 2% 3.37% 10,000$ 142.82% 14,282$ 181.50% 7,869$ 2034 Year 19 19 2% 3.42% 10,000$ 145.68% 14,568$ 189.45% 7,690$ 2035 Year 20 20 2% 3.48% 10,000$ 148.59% 14,859$ 198.21% 7,497$ 2036 Year 21 21 2% 3.50% 10,000$ 151.57% 15,157$ 205.94% 7,360$ 2037 Year 22 22 2% 3.51% 10,000$ 154.60% 15,460$ 213.38% 7,245$ 2038 Year 23 23 2% 3.51% 10,000$ 157.69% 15,769$ 221.10% 7,132$ 2039 Year 24 24 2% 3.51% 10,000$ 160.84% 16,084$ 228.86% 7,028$ 2040 Year 25 25 2% 3.51% 10,000$ 164.06% 16,406$ 236.90% 6,925$ 2041 Year 26 26 2% 3.51% 10,000$ 167.34% 16,734$ 245.21% 6,824$ 2042 Year 27 27 2% 3.51% 10,000$ 170.69% 17,069$ 253.82% 6,725$ 2043 Year 28 28 2% 3.51% 10,000$ 174.10% 17,410$ 262.73% 6,627$ 2044 Year 29 29 2% 3.51% 10,000$ 177.58% 17,758$ 271.95% 6,530$ 2045 Year 30 30 2% 3.51% 10,000$ 181.14% 18,114$ 281.49% 6,435$ 2046 Year 31 31 2% 3.51% 10,000$ 184.76% 18,476$ 291.37% 6,341$ 2047 Year 32 32 2% 3.51% 10,000$ 188.45% 18,845$ 301.60% 6,248$ 2048 Year 33 33 2% 3.51% 10,000$ 192.22% 19,222$ 312.19% 6,157$ 2049 Year 34 34 2% 3.51% 10,000$ 196.07% 19,607$ 323.15% 6,067$ 2050 Year 35 35 2% 3.51% 10,000$ 199.99% 19,999$ 334.49% 5,979$
Cell 1 - Year 0
Local Government - Accounting for Landfills
13
APPENDIX 1 – INITIAL NPV CALCLULATIONS
Index - Projected cost
increases
Illustrative Long Term Govt Bond
rate
Raw cash flow
Indexation factor
FV Discount factor
PV
Present Value Disclosures - 30 June 2016 $ 483,731.48 2016 Year 1 1 2% 0.00% -$ 100.00% 100.00%2017 Year 2 2 2% 1.85% -$ 102.00% 101.85%2018 Year 3 3 2% 1.92% -$ 104.04% 103.88%2019 Year 4 4 2% 1.98% -$ 106.12% 106.06%2020 Year 5 5 2% 2.01% 250,000$ 108.24% $270,608.04 108.29% $249,882.392021 Year 6 6 2% 2.20% 10,000$ 110.41% $11,040.81 111.48% $9,903.992022 Year 7 7 2% 2.38% 10,000$ 112.62% $11,261.62 115.18% $9,777.642023 Year 8 8 2% 2.55% 10,000$ 114.87% $11,486.86 119.25% $9,632.532024 Year 9 9 2% 2.69% 10,000$ 117.17% $11,716.59 123.68% $9,473.462025 Year 10 10 2% 2.84% 10,000$ 119.51% $11,950.93 128.64% $9,290.072026 Year 11 11 2% 2.93% 10,000$ 121.90% $12,189.94 133.42% $9,136.782027 Year 12 12 2% 2.97% 10,000$ 124.34% $12,433.74 137.92% $9,015.082028 Year 13 13 2% 3.05% 10,000$ 126.82% $12,682.42 143.48% $8,839.422029 Year 14 14 2% 3.10% 10,000$ 129.36% $12,936.07 148.72% $8,698.402030 Year 15 15 2% 3.20% 10,000$ 131.95% $13,194.79 155.38% $8,491.892031 Year 16 16 2% 3.20% 10,000$ 134.59% $13,458.68 160.35% $8,393.312032 Year 17 17 2% 3.20% 10,000$ 137.28% $13,727.86 165.48% $8,295.882033 Year 18 18 2% 3.20% 10,000$ 140.02% $14,002.41 170.77% $8,199.572034 Year 19 19 2% 3.37% 10,000$ 142.82% $14,282.46 181.50% $7,869.172035 Year 20 20 2% 3.42% 10,000$ 145.68% $14,568.11 189.45% $7,689.842036 Year 21 21 2% 3.48% 10,000$ 148.59% $14,859.47 198.21% $7,496.782037 Year 22 22 2% 3.50% 10,000$ 151.57% $15,156.66 205.94% $7,359.632038 Year 23 23 2% 3.51% 10,000$ 154.60% $15,459.80 213.38% $7,245.272039 Year 24 24 2% 3.51% 10,000$ 157.69% $15,768.99 221.10% $7,131.992040 Year 25 25 2% 3.51% 10,000$ 160.84% $16,084.37 228.86% $7,027.952041 Year 26 26 2% 3.51% 10,000$ 164.06% $16,406.06 236.90% $6,925.432042 Year 27 27 2% 3.51% 10,000$ 167.34% $16,734.18 245.21% $6,824.402043 Year 28 28 2% 3.51% 10,000$ 170.69% $17,068.86 253.82% $6,724.852044 Year 29 29 2% 3.51% 10,000$ 174.10% $17,410.24 262.73% $6,626.742045 Year 30 30 2% 3.51% 10,000$ 177.58% $17,758.45 271.95% $6,530.072046 Year 31 31 2% 3.51% 10,000$ 181.14% $18,113.62 281.49% $6,434.812047 Year 32 32 2% 3.51% 10,000$ 184.76% $18,475.89 291.37% $6,340.942048 Year 33 33 2% 3.51% 10,000$ 188.45% $18,845.41 301.60% $6,248.442049 Year 34 34 2% 3.51% 10,000$ 192.22% $19,222.31 312.19% $6,157.292050 Year 35 35 2% 3.51% 10,000$ 196.07% $19,606.76 323.15% $6,067.47
Cell 1 - Year 1
14 Local Government - Accounting for Landfills
APPENDIX 2 NPV CALCULATIONS YEAR 1
Index - Projected cost
increases
Illustrative Long Term Govt Bond
rate
Raw cash flow
Indexation factor
FV Discount factor
PV
Present Value Disclosures - 30 June 2017 $ 487,931.39 2017 Year 2 2 2% 0.00% -$ 100.00% 100.00%2018 Year 3 3 2% 1.85% -$ 102.00% 101.85%2019 Year 4 4 2% 1.92% -$ 104.04% 103.88%2020 Year 5 5 2% 1.98% 250,000$ 106.12% $265,302.00 106.06% $250,154.482021 Year 6 6 2% 2.01% 10,000$ 108.24% $10,824.32 108.29% $9,995.302022 Year 7 7 2% 2.20% 10,000$ 110.41% $11,040.81 111.48% $9,903.992023 Year 8 8 2% 2.38% 10,000$ 112.62% $11,261.62 115.18% $9,777.642024 Year 9 9 2% 2.55% 10,000$ 114.87% $11,486.86 119.25% $9,632.532025 Year 10 10 2% 2.69% 10,000$ 117.17% $11,716.59 123.68% $9,473.462026 Year 11 11 2% 2.84% 10,000$ 119.51% $11,950.93 128.64% $9,290.072027 Year 12 12 2% 2.93% 10,000$ 121.90% $12,189.94 133.42% $9,136.782028 Year 13 13 2% 2.97% 10,000$ 124.34% $12,433.74 137.92% $9,015.082029 Year 14 14 2% 3.05% 10,000$ 126.82% $12,682.42 143.48% $8,839.422030 Year 15 15 2% 3.10% 10,000$ 129.36% $12,936.07 148.72% $8,698.402031 Year 16 16 2% 3.20% 10,000$ 131.95% $13,194.79 155.38% $8,491.892032 Year 17 17 2% 3.20% 10,000$ 134.59% $13,458.68 160.35% $8,393.312033 Year 18 18 2% 3.20% 10,000$ 137.28% $13,727.86 165.48% $8,295.882034 Year 19 19 2% 3.20% 10,000$ 140.02% $14,002.41 170.77% $8,199.572035 Year 20 20 2% 3.37% 10,000$ 142.82% $14,282.46 181.50% $7,869.172036 Year 21 21 2% 3.42% 10,000$ 145.68% $14,568.11 189.45% $7,689.842037 Year 22 22 2% 3.48% 10,000$ 148.59% $14,859.47 198.21% $7,496.782038 Year 23 23 2% 3.50% 10,000$ 151.57% $15,156.66 205.94% $7,359.632039 Year 24 24 2% 3.51% 10,000$ 154.60% $15,459.80 213.38% $7,245.272040 Year 25 25 2% 3.51% 10,000$ 157.69% $15,768.99 221.10% $7,131.992041 Year 26 26 2% 3.51% 10,000$ 160.84% $16,084.37 228.86% $7,027.952042 Year 27 27 2% 3.51% 10,000$ 164.06% $16,406.06 236.90% $6,925.432043 Year 28 28 2% 3.51% 10,000$ 167.34% $16,734.18 245.21% $6,824.402044 Year 29 29 2% 3.51% 10,000$ 170.69% $17,068.86 253.82% $6,724.852045 Year 30 30 2% 3.51% 10,000$ 174.10% $17,410.24 262.73% $6,626.742046 Year 31 31 2% 3.51% 10,000$ 177.58% $17,758.45 271.95% $6,530.072047 Year 32 32 2% 3.51% 10,000$ 181.14% $18,113.62 281.49% $6,434.812048 Year 33 33 2% 3.51% 10,000$ 184.76% $18,475.89 291.37% $6,340.942049 Year 34 34 2% 3.51% 10,000$ 188.45% $18,845.41 301.60% $6,248.442050 Year 35 35 2% 3.51% 10,000$ 192.22% $19,222.31 312.19% $6,157.29
Cell 1 - Year 2 - step one financing cost
Local Government - Accounting for Landfills
15
APPENDIX 3 NPV CALCULATIONS YEAR 2

Index - Projected cost
increases
Illustrative Long Term Govt Bond
rate
Raw cash flow
Indexation factor
FV Discount factor
PV
Present Value Disclosures - 30 June 2017 $ 537,962.29 2016 Year 1 1 2% 0.00% -$ 100.00% 100.00%2017 Year 2 2 2% 0.00% -$ 100.00% 100.00%2018 Year 3 3 2% 1.85% -$ 102.00% 101.85%2019 Year 4 4 2% 1.92% -$ 104.04% 103.88%2020 Year 5 5 2% 1.98% 300,000$ 106.12% $318,362.40 106.06% $300,185.372021 Year 6 6 2% 2.01% 10,000$ 108.24% $10,824.32 108.29% $9,995.302022 Year 7 7 2% 2.20% 10,000$ 110.41% $11,040.81 111.48% $9,903.992023 Year 8 8 2% 2.38% 10,000$ 112.62% $11,261.62 115.18% $9,777.642024 Year 9 9 2% 2.55% 10,000$ 114.87% $11,486.86 119.25% $9,632.532025 Year 10 10 2% 2.69% 10,000$ 117.17% $11,716.59 123.68% $9,473.462026 Year 11 11 2% 2.84% 10,000$ 119.51% $11,950.93 128.64% $9,290.072027 Year 12 12 2% 2.93% 10,000$ 121.90% $12,189.94 133.42% $9,136.782028 Year 13 13 2% 2.97% 10,000$ 124.34% $12,433.74 137.92% $9,015.082029 Year 14 14 2% 3.05% 10,000$ 126.82% $12,682.42 143.48% $8,839.422030 Year 15 15 2% 3.10% 10,000$ 129.36% $12,936.07 148.72% $8,698.402031 Year 16 16 2% 3.20% 10,000$ 131.95% $13,194.79 155.38% $8,491.892032 Year 17 17 2% 3.20% 10,000$ 134.59% $13,458.68 160.35% $8,393.312033 Year 18 18 2% 3.20% 10,000$ 137.28% $13,727.86 165.48% $8,295.882034 Year 19 19 2% 3.20% 10,000$ 140.02% $14,002.41 170.77% $8,199.572035 Year 20 20 2% 3.37% 10,000$ 142.82% $14,282.46 181.50% $7,869.172036 Year 21 21 2% 3.42% 10,000$ 145.68% $14,568.11 189.45% $7,689.842037 Year 22 22 2% 3.48% 10,000$ 148.59% $14,859.47 198.21% $7,496.782038 Year 23 23 2% 3.50% 10,000$ 151.57% $15,156.66 205.94% $7,359.632039 Year 24 24 2% 3.51% 10,000$ 154.60% $15,459.80 213.38% $7,245.272040 Year 25 25 2% 3.51% 10,000$ 157.69% $15,768.99 221.10% $7,131.992041 Year 26 26 2% 3.51% 10,000$ 160.84% $16,084.37 228.86% $7,027.952042 Year 27 27 2% 3.51% 10,000$ 164.06% $16,406.06 236.90% $6,925.432043 Year 28 28 2% 3.51% 10,000$ 167.34% $16,734.18 245.21% $6,824.402044 Year 29 29 2% 3.51% 10,000$ 170.69% $17,068.86 253.82% $6,724.852045 Year 30 30 2% 3.51% 10,000$ 174.10% $17,410.24 262.73% $6,626.742046 Year 31 31 2% 3.51% 10,000$ 177.58% $17,758.45 271.95% $6,530.072047 Year 32 32 2% 3.51% 10,000$ 181.14% $18,113.62 281.49% $6,434.812048 Year 33 33 2% 3.51% 10,000$ 184.76% $18,475.89 291.37% $6,340.942049 Year 34 34 2% 3.51% 10,000$ 188.45% $18,845.41 301.60% $6,248.442050 Year 35 35 2% 3.51% 10,000$ 192.22% $19,222.31 312.19% $6,157.29
Cell 1 - Year 2 - step two - change in EPA Requirements costs
16 Local Government - Accounting for Landfills
Index - Projected cost
increases
Illustrative Long Term Govt Bond
rate
Raw cash flow
Indexation factor
FV Discount factor
PV
Present Value Disclosures - 30 June 2018 $ 542,185.38 2018 Year 3 3 2% 0 -$ 100.00% 100.00%2019 Year 4 4 2% 1.85% -$ 102.00% 101.85%2020 Year 5 5 2% 1.92% 300,000$ 104.04% $312,120.00 103.88% $300,471.142021 Year 6 6 2% 1.98% 10,000$ 106.12% $10,612.08 106.06% $10,006.182022 Year 7 7 2% 2.01% 10,000$ 108.24% $10,824.32 108.29% $9,995.302023 Year 8 8 2% 2.20% 10,000$ 110.41% $11,040.81 111.48% $9,903.992024 Year 9 9 2% 2.38% 10,000$ 112.62% $11,261.62 115.18% $9,777.642025 Year 10 10 2% 2.55% 10,000$ 114.87% $11,486.86 119.25% $9,632.532026 Year 11 11 2% 2.69% 10,000$ 117.17% $11,716.59 123.68% $9,473.462027 Year 12 12 2% 2.84% 10,000$ 119.51% $11,950.93 128.64% $9,290.072028 Year 13 13 2% 2.93% 10,000$ 121.90% $12,189.94 133.42% $9,136.782029 Year 14 14 2% 2.97% 10,000$ 124.34% $12,433.74 137.92% $9,015.082030 Year 15 15 2% 3.05% 10,000$ 126.82% $12,682.42 143.48% $8,839.422031 Year 16 16 2% 3.10% 10,000$ 129.36% $12,936.07 148.72% $8,698.402032 Year 17 17 2% 3.20% 10,000$ 131.95% $13,194.79 155.38% $8,491.892033 Year 18 18 2% 3.20% 10,000$ 134.59% $13,458.68 160.35% $8,393.312034 Year 19 19 2% 3.20% 10,000$ 137.28% $13,727.86 165.48% $8,295.882035 Year 20 20 2% 3.20% 10,000$ 140.02% $14,002.41 170.77% $8,199.572036 Year 21 21 2% 3.37% 10,000$ 142.82% $14,282.46 181.50% $7,869.172037 Year 22 22 2% 3.42% 10,000$ 145.68% $14,568.11 189.45% $7,689.842038 Year 23 23 2% 3.48% 10,000$ 148.59% $14,859.47 198.21% $7,496.782039 Year 24 24 2% 3.50% 10,000$ 151.57% $15,156.66 205.94% $7,359.632040 Year 25 25 2% 3.51% 10,000$ 154.60% $15,459.80 213.38% $7,245.272041 Year 26 26 2% 3.51% 10,000$ 157.69% $15,768.99 220.86% $7,139.922042 Year 27 27 2% 3.51% 10,000$ 160.84% $16,084.37 228.60% $7,036.102043 Year 28 28 2% 3.51% 10,000$ 164.06% $16,406.06 236.61% $6,933.802044 Year 29 29 2% 3.51% 10,000$ 167.34% $16,734.18 244.90% $6,832.982045 Year 30 30 2% 3.51% 10,000$ 170.69% $17,068.86 253.49% $6,733.622046 Year 31 31 2% 3.51% 10,000$ 174.10% $17,410.24 262.37% $6,635.712047 Year 32 32 2% 3.51% 10,000$ 177.58% $17,758.45 271.57% $6,539.232048 Year 33 33 2% 3.51% 10,000$ 181.14% $18,113.62 281.09% $6,444.142049 Year 34 34 2% 3.51% 10,000$ 184.76% $18,475.89 290.94% $6,350.442050 Year 35 35 2% 3.51% 10,000$ 188.45% $18,845.41 301.14% $6,258.11
Cell 1 - Year 3 - step one - financing costs
Local Government - Accounting for Landfills
17
APPENDIX 4 NPV CALCULATIONS YEAR 3
Index - Projected cost
increases
Illustrative Long Term Govt Bond
rate
Raw cash flow
Indexation factor
FV Discount factor
PV
Present Value Disclosures 30 June 2019 $ 543,911.30 2019 Year 4 4 2% 0% -$ 102.00% 100.00%2020 Year 5 5 2% 1.85% 300,000$ 104.04% $312,120.00 103.72% $300,913.852021 Year 6 6 2% 1.92% 10,000$ 106.12% $10,612.08 105.87% $10,023.572022 Year 7 7 2% 1.98% 10,000$ 108.24% $10,824.32 108.15% $10,008.242023 Year 8 8 2% 2.01% 10,000$ 110.41% $11,040.81 110.47% $9,994.122024 Year 9 9 2% 2.20% 10,000$ 112.62% $11,261.62 113.93% $9,884.902025 Year 10 10 2% 2.38% 10,000$ 114.87% $11,486.86 117.92% $9,741.062026 Year 11 11 2% 2.55% 10,000$ 117.17% $11,716.59 122.29% $9,581.152027 Year 12 12 2% 2.69% 10,000$ 119.51% $11,950.93 127.01% $9,409.622028 Year 13 13 2% 2.84% 10,000$ 121.90% $12,189.94 132.29% $9,214.372029 Year 14 14 2% 2.93% 10,000$ 124.34% $12,433.74 137.32% $9,054.662030 Year 15 15 2% 2.97% 10,000$ 126.82% $12,682.42 142.01% $8,930.502031 Year 16 16 2% 3.05% 10,000$ 129.36% $12,936.07 147.86% $8,749.012032 Year 17 17 2% 3.10% 10,000$ 131.95% $13,194.79 153.33% $8,605.602033 Year 18 18 2% 3.20% 10,000$ 134.59% $13,458.68 160.35% $8,393.312034 Year 19 19 2% 3.20% 10,000$ 137.28% $13,727.86 165.48% $8,295.882035 Year 20 20 2% 3.20% 10,000$ 140.02% $14,002.41 170.77% $8,199.572036 Year 21 21 2% 3.20% 10,000$ 142.82% $14,282.46 176.23% $8,104.382037 Year 22 22 2% 3.37% 10,000$ 145.68% $14,568.11 187.61% $7,765.102038 Year 23 23 2% 3.42% 10,000$ 148.59% $14,859.47 195.93% $7,584.252039 Year 24 24 2% 3.48% 10,000$ 151.57% $15,156.66 205.11% $7,389.562040 Year 25 25 2% 3.50% 10,000$ 154.60% $15,459.80 213.15% $7,252.972041 Year 26 26 2% 3.51% 10,000$ 157.69% $15,768.99 221.10% $7,131.992042 Year 27 27 2% 3.51% 10,000$ 160.84% $16,084.37 228.86% $7,027.952043 Year 28 28 2% 3.51% 10,000$ 164.06% $16,406.06 236.90% $6,925.432044 Year 29 29 2% 3.51% 10,000$ 167.34% $16,734.18 245.21% $6,824.402045 Year 30 30 2% 3.51% 10,000$ 170.69% $17,068.86 253.82% $6,724.852046 Year 31 31 2% 3.51% 10,000$ 174.10% $17,410.24 262.73% $6,626.742047 Year 32 32 2% 3.51% 10,000$ 177.58% $17,758.45 271.95% $6,530.072048 Year 33 33 2% 3.51% 10,000$ 181.14% $18,113.62 281.49% $6,434.812049 Year 34 34 2% 3.51% 10,000$ 184.76% $18,475.89 291.37% $6,340.942050 Year 35 35 2% 3.51% 10,000$ 188.45% $18,845.41 301.60% $6,248.44
Cell 1 - Year 4 - financing
18 Local Government - Accounting for Landfills
APPENDIX 5 NPV CALCULATIONS YEAR 4
Index - Projected cost
increases
Illustrative Long Term Govt Bond
rate
Raw cash flow
Indexation factor
FV Discount factor
PV
Present Value Disclosures 30 June 2019 $ 669,292.07 2016 Year 1 1 2% 0% -$ 100.00% 100.00%2017 Year 2 2 2% 0% -$ 100.00% 100.00%2018 Year 3 3 2% 0% -$ 100.00% 100.00%2019 Year 4 4 2% 0% -$ 102.00% 100.00%2020 Year 5 5 2% 1.85% 425,000$ 104.04% $442,170.00 103.72% $426,294.622021 Year 6 6 2% 1.92% 10,000$ 106.12% $10,612.08 105.87% $10,023.572022 Year 7 7 2% 1.98% 10,000$ 108.24% $10,824.32 108.15% $10,008.242023 Year 8 8 2% 2.01% 10,000$ 110.41% $11,040.81 110.47% $9,994.122024 Year 9 9 2% 2.20% 10,000$ 112.62% $11,261.62 113.93% $9,884.902025 Year 10 10 2% 2.38% 10,000$ 114.87% $11,486.86 117.92% $9,741.062026 Year 11 11 2% 2.55% 10,000$ 117.17% $11,716.59 122.29% $9,581.152027 Year 12 12 2% 2.69% 10,000$ 119.51% $11,950.93 127.01% $9,409.622028 Year 13 13 2% 2.84% 10,000$ 121.90% $12,189.94 132.29% $9,214.372029 Year 14 14 2% 2.93% 10,000$ 124.34% $12,433.74 137.32% $9,054.662030 Year 15 15 2% 2.97% 10,000$ 126.82% $12,682.42 142.01% $8,930.502031 Year 16 16 2% 3.05% 10,000$ 129.36% $12,936.07 147.86% $8,749.012032 Year 17 17 2% 3.10% 10,000$ 131.95% $13,194.79 153.33% $8,605.602033 Year 18 18 2% 3.20% 10,000$ 134.59% $13,458.68 160.35% $8,393.312034 Year 19 19 2% 3.20% 10,000$ 137.28% $13,727.86 165.48% $8,295.882035 Year 20 20 2% 3.20% 10,000$ 140.02% $14,002.41 170.77% $8,199.572036 Year 21 21 2% 3.20% 10,000$ 142.82% $14,282.46 176.23% $8,104.382037 Year 22 22 2% 3.37% 10,000$ 145.68% $14,568.11 187.61% $7,765.102038 Year 23 23 2% 3.42% 10,000$ 148.59% $14,859.47 195.93% $7,584.252039 Year 24 24 2% 3.48% 10,000$ 151.57% $15,156.66 205.11% $7,389.562040 Year 25 25 2% 3.50% 10,000$ 154.60% $15,459.80 213.15% $7,252.972041 Year 26 26 2% 3.51% 10,000$ 157.69% $15,768.99 221.10% $7,131.992042 Year 27 27 2% 3.51% 10,000$ 160.84% $16,084.37 228.86% $7,027.952043 Year 28 28 2% 3.51% 10,000$ 164.06% $16,406.06 236.90% $6,925.432044 Year 29 29 2% 3.51% 10,000$ 167.34% $16,734.18 245.21% $6,824.402045 Year 30 30 2% 3.51% 10,000$ 170.69% $17,068.86 253.82% $6,724.852046 Year 31 31 2% 3.51% 10,000$ 174.10% $17,410.24 262.73% $6,626.742047 Year 32 32 2% 3.51% 10,000$ 177.58% $17,758.45 271.95% $6,530.072048 Year 33 33 2% 3.51% 10,000$ 181.14% $18,113.62 281.49% $6,434.812049 Year 34 34 2% 3.51% 10,000$ 184.76% $18,475.89 291.37% $6,340.942050 Year 35 35 2% 3.51% 10,000$ 188.45% $18,845.41 301.60% $6,248.44
Cell 1 - Year 4 - licence changes
Local Government - Accounting for Landfills
19
Index - Projected cost
increases
Illustrative Long Term Govt Bond
rate
Raw cash flow
Indexation factor
FV Discount factor
PV
Present Value Disclosures 30 June 2020 $ 244,527.76 2016 Year 1 1 2% 0% -$ 100.00% 100.00%2017 Year 2 2 2% 0% -$ 100.00% 100.00%2018 Year 3 3 2% 0% -$ 100.00% 100.00%2019 Year 4 4 2% 0% -$ 102.00% 100.00%2020 Year 5 5 2% 0% -$ 100.00% $0.00 100.00% $0.002021 Year 6 6 2% 1.85% 10,000$ 102.00% $10,612.08 105.64% $10,045.732022 Year 7 7 2% 1.92% 10,000$ 104.04% $10,824.32 107.90% $10,031.432023 Year 8 8 2% 1.98% 10,000$ 106.12% $11,040.81 110.29% $10,010.302024 Year 9 9 2% 2.01% 10,000$ 108.24% $11,261.62 112.70% $9,992.942025 Year 10 10 2% 2.20% 10,000$ 110.41% $11,486.86 116.43% $9,865.842026 Year 11 11 2% 2.38% 10,000$ 112.62% $11,716.59 120.73% $9,704.622027 Year 12 12 2% 2.55% 10,000$ 114.87% $11,950.93 125.40% $9,530.042028 Year 13 13 2% 2.69% 10,000$ 117.17% $12,189.94 130.43% $9,346.212029 Year 14 14 2% 2.84% 10,000$ 119.51% $12,433.74 136.05% $9,139.282030 Year 15 15 2% 2.93% 10,000$ 121.90% $12,682.42 141.34% $8,973.292031 Year 16 16 2% 2.97% 10,000$ 124.34% $12,936.07 146.22% $8,846.722032 Year 17 17 2% 3.05% 10,000$ 126.82% $13,194.79 152.37% $8,659.532033 Year 18 18 2% 3.10% 10,000$ 129.36% $13,458.68 158.08% $8,513.782034 Year 19 19 2% 3.20% 10,000$ 131.95% $13,727.86 165.48% $8,295.882035 Year 20 20 2% 3.20% 10,000$ 134.59% $14,002.41 170.77% $8,199.572036 Year 21 21 2% 3.20% 10,000$ 137.28% $14,282.46 176.23% $8,104.382037 Year 22 22 2% 3.20% 10,000$ 140.02% $14,568.11 181.87% $8,010.302038 Year 23 23 2% 3.37% 10,000$ 142.82% $14,859.47 193.93% $7,662.412039 Year 24 24 2% 3.42% 10,000$ 145.68% $15,156.66 202.63% $7,480.122040 Year 25 25 2% 3.48% 10,000$ 148.59% $15,459.80 212.25% $7,283.882041 Year 26 26 2% 3.50% 10,000$ 151.57% $15,768.99 220.61% $7,147.862042 Year 27 27 2% 3.51% 10,000$ 154.60% $16,084.37 228.86% $7,027.952043 Year 28 28 2% 3.51% 10,000$ 157.69% $16,406.06 236.90% $6,925.432044 Year 29 29 2% 3.51% 10,000$ 160.84% $16,734.18 245.21% $6,824.402045 Year 30 30 2% 3.51% 10,000$ 164.06% $17,068.86 253.82% $6,724.852046 Year 31 31 2% 3.51% 10,000$ 167.34% $17,410.24 262.73% $6,626.742047 Year 32 32 2% 3.51% 10,000$ 170.69% $17,758.45 271.95% $6,530.072048 Year 33 33 2% 3.51% 10,000$ 174.10% $18,113.62 281.49% $6,434.812049 Year 34 34 2% 3.51% 10,000$ 177.58% $18,475.89 291.37% $6,340.942050 Year 35 35 2% 3.51% 10,000$ 181.14% $18,845.41 301.60% $6,248.44
Cell 1 - Year 5
20 Local Government - Accounting for Landfills
APPENDIX 6 NPV CALCULATIONS YEAR 5
AASB 116 – Property, Plant and Equipment, www.aasb.gov.au
AASB 136 - Impairment of Assets, www.aasb.gov.au
AASB 137 - Provisions, Contingent Liabilities and Contingent Assets, www.aasb.gov.au
AASB 138 - Intangible Assets, www.aasb.gov.au
Interpretation 1 - Changes in Existing Decommissioning, Restoration and Similar Liabilities, www.aasb.gov.au
Local Government - Accounting for Landfills
21
References
Group of 100 (G100) discount rate report, http://group100.com.au/g100-discount-rate/
Australian Bureau of Statistics, 6427.0 Producer Price Indexes, Australia, Table 17. Output of the Construction industries, subdivision and class index numbers, www.abs.gov.au
Australian Bureau of Statistics, 6401.0 Consumer Price Index, Australia, www.abs.gov.au
22 Local Government - Accounting for Landfills
Discount and index rate sources
delwp.vic.gov.au Local Government -
Accounting for Landfills
23