Embed Size (px)
Citation preview
FFS REFINERS (PTY) LTD (“FFS”)
TARIFF APPLICATION
FOR THE YEAR MARCH 2012 TO FEBRUARY 2013
CAPE TOWN HARBOUR TANK FARM
LICENCE PPL.sf.F3/80/10/2008
FOR NERSA REVIEW ONLY
PLEASE REVERT TO SENSITISED VERSION FOR PUBLIC COMMENT
2
Table of Contents
1 Executive Summary ........................................................................................ 4
2 Background .................................................................................................. 7
3 Approach and base of assumptions used ............................................................... 7
3.1 Property, Plant Vehicles & Equipment (V) ..................................................... 8
3.1.1 Indexation ............................................................................... 9
3.1.2 Useful Lives .............................................................................. 9
3.1.3 Decommissioning provision ........................................................ 9
3.1.4 Summary of RAB asset values ..................................................... 9
3.2 Borrowing costs .................................................................................. 10
3.3 Net working capital (w) ......................................................................... 11
3.4 Deferred Tax (dtax) ............................................................................. 12
4 Weighted Average Cost of Capital (WACC) ........................................................... 12
4.1 Cost of Equity .................................................................................... 13
4.1.1 Risk free rate ............................................................................ 13
4.1.2 Market risk premium (“MRP”) ........................................................ 13
4.1.3 BETA ...................................................................................... 13
4.1.4 Real cost of equity calculation .................................................. 18
4.1.5 Comparable IRRs for related industries ...................................... 19
4.2 Cost of Debt .................................................................................... 21
4.3 WACC ............................................................................................. 22
5 Expenses ................................................................................................... 23
6 Income Taxation .......................................................................................... 24
7 Depreciation ............................................................................................... 24
8 Clawback ................................................................................................... 24
9 Allowable Revenue Calculation ......................................................................... 25
10 Volumes .................................................................................................... 25
11 Conclusion ................................................................................................. 26
3
List of Tables Table 1: RAB Asset Values (ZAR) ...................................................................... 9
Table 2: Replacement Cost Estimate (ZAR) ....................................................... 10
Table 3: Working Capital Summary (ZAR) ......................................................... 12
Table 4: Reviewed BETA Summary ................................................................... 18
Table 5: Real Cost of Equity............................................................................. 18
Table 6: Comparable IRRs ............................................................................... 19
Table 7: Comparable IRRs Summary ................................................................ 20
Table 8: Real Cost of Debt ............................................................................... 21
Table 9: Post Tax Real WACC ........................................................................... 22
Table 10:Site Expense Summary (ZAR mil) ....................................................... 23
Table 11:Allowable Revenue (ZAR mil) .............................................................. 25
4
1 Executive Summary
FFS submits its 2012/13 petroleum Loading and Storage facilities tariff application in terms of
section [4(f)] of the Petroleum Pipelines Act, 2003 (Act No. 60 of 2003) (“PPA”). This tariff
application has been guided by the National Energy Regulator of South Africa’s (“NERSA”) “Tariff
Methodology for Petroleum Loading Facilities and Petroleum Storage facilities” as approved on
March 31st, 2011 (“the methodology”). Furthermore, FFS has endeavoured to meet NERSA’s
draft Minimum Information Required for Tariff Applications (“draft MIRTA”), subject to limitations
on accounting information as FFS does not specifically account for Petroleum licensed storage
business. Refer to Annexure B for the checklist of information submitted
FFS is requesting a one year tariff for the period – ending February 2013. It is expected that in
the 2nd tariff period a 3 year tariff will be requested once FFS fully understands the impact of the
methodology and that Petroleum licensed storage business related information is available.
FFS has complied with the NERSA methodology with the exception of the following:
1. Used a differing approach to calculate BETA specific for FFS (in line with other
applications and based on currently available economic best practice)
A point to note:
The impact should Ankelig not have diesel fuel available to provide peak power would result in a
substantially larger impact on the South African economy than the current tariffs agreed with
FFS. The impact of this cannot be accurately measured but could be over R200million per annum
– loss of production / downtime and other negative impacts.
FFS specific business considerations:
FFS specific issues compared to Loading Facilities and Petroleum Storage facilities owned by
other bulk liquid storage operators:
• FFS designs, builds and operates its own storage facilities. The Tank Farm in the Cape
Town Harbour is a case in point. This was built to enable FFS to take advantage of marine
de-bunkers (the purchase of out of specification bunker fuel and the purchase of bunker
fuel from vessels, over-loaded or in distress, such as the Maersk Sealander, that went
5
ashore of Milnerton Beach) and also to prevent Chevron, who is the only supplier of
heavy fuel oil in the Western Cape, from charging excessively high prices above import
parity (as the Tank farm gave FFS the opportunity to import fuel oil for its production
facility at Vissershok).
• The use of the Tank Farm changed when Eskom and PetroSA needed storage facilities in
the Western Cape for the storage of diesel fuel for Eskom’s emergency power generators
at Ankelig. There were no other bulk fuel storage facilities available in the Western Cape,
and FFS reluctantly agreed to provide this facility to Eskom and PetroSA to improve
electrical supply security to the Western Cape.
• As FFS is primarily a manufacturer and supplier of “cost effective, fit for purpose industrial
heating fuels” and does not account separately for its storage facility, the current FFS
information is based on best available information obtained through manual interventions
in the FFS accounting system. It is expected that over time the quality of this information
will improve.
• FFS is planning to interact with NERSA on the RRMs after the tariff approval
6
Basis of the Application
This application has been prepared for the currently licensed loading facilities and Petroleum
Storage facilities in the FFS Cape Town Harbour Tank Farm.
In arriving at the 2012/13 Allowable Revenue (“AR”), FFS has adhered to the PPA, the
Regulations made thereunder and the methodology, save for some deviations from the
methodology in the calculation of the cost of equity (Ke) – specifically in relation to the
calculation of the relevant Beta for FFS.
FFS’s approach is supported by literature, international best practice and sound rationale. Refer
to Annexure F for the supporting calculations for the BETA calculations.
Annexure D provides an excel spread sheet supporting the many calculations involved with this
application based on the original NERSA calculations sheets and updated for FFS specific
requirements.
RAB Considerations:
In arriving at the Regulatory Asset Based (“RAB”) for the application, historical information is
unfortunately not available with the first tank built in July 1995. As with other companies
historical information is scarce, unreliable and generally irrelevant. FFS has obtained a detailed
cost estimate from a reputable construction company (dated 9th February 2012) for the building
of such a facility which indicates that a replacement cost for this facility would be R121 - R449
million. Refer to Annexure C for the cost estimate from --- ----, a reputable South African
contractor with experience of storage facility construction.
This is in line with the tariff applications submitted by Transnet and Vopak, in which they also
revalued the storage assets based on independent valuations at replacement value at the start of
the tariff period and then applied the TOC methodology for the following period.
Unlike other independent tank storage operators, bulk liquid storage is not the core business of
FFS. The structural, safety and environmental control over the FFS storage assets is, however,
key and even though some of the FFS assets may be close to the end of the accounting specific
7
useful lives, the strict maintenance requirements that FFS complies with and ensures require FFS
to continue to invest in the assets through on-going capital expenditure and maintenance.
2 Background
FFS designed, built and commissioned the Cape Harbour Tank Farm for its own use, to take
advantage of marine and refinery distress cargo and to enable FFS to import industrial fuel oil to
supply its markets in times when the availability of supply in the Western Cape was interrupted.
It was used on a number of occasions, most notably for the receipt and storage of the Bunker
fuel removed from the Maersk Sealander, the vessel that went aground off Milnerton beach. The
recovery of this vessel would not have been possible without the FFS Cape Harbour Tank Farm
being available to take the bunker fuel removed from the vessel.
As mentioned earlier, FFS eventually agreed, in the interests of the national economy, to enter
into an agreement with Eskom and PetroSA for the full capacity of the Tank Farm for the storage
of diesel for the operation of Eskom’s emergency power generators at Ankerlig.
There is no other storage facility in the Western Cape available for this purpose.
3 Approach and base of assumptions used
FFS has complied with the NERSA methodology relating to the calculation of Allowable Revenue
with the exception of the methodology used to calculate BETA (based on the use of the CAPM
model) and the impact on Ke (within the WACC calculation – refer to Annexure D for additional
information).
The building blocks of the methodology are reflected in the following formula:
Allowable Revenue = (RAB x WACC) +E +T + D ± C
Where:
RAB = Regulatory Asset Base
WACC = Weighted average cost of capital
E = Expenses: operating and maintenance expenses for the tariff period under review
8
T = Tax: estimated tax expense for the tariff period under review
D = Depreciation: the charge for the tariff period under review
C = Clawback adjustment (to correct for differences between actuals and forecasts in
formula elements as well as efficiency gains and volume differences) from a preceding
tariff period in relation to the latest estimates for that tariff period
The formula allows for the calculation of an AR for the petroleum storage assets. A detailed
spread sheet (as per the NERSA format) is included in this application – refer to Annexure D
Base worksheet for full calculation.
In terms of the methodology, the value of the RAB is the inflation-adjusted historical cost or
“trended original cost” (“TOC”) of property, plant, vehicles and equipment less the accumulated
depreciation for the period under consideration, plus net working capital and adjusted for
deferred tax.
The formula for the RAB is as follows:
RAB = (V – d) + w ± dtax1
Where:
V = Value of property, plant, vehicles and equipment
D = accumulated depreciation up to the commencement of the tariff period under review
w = net working capital
dtax = deferred tax
3.1 Property, Plant Vehicles & Equipment (V)
Property, plant, vehicles and equipment are valued on the Trended Original Cost (“TOC”) basis
using the consumer price index (“CPI”) as the inflation measure. Property, plant, vehicles and
9
equipment expected to become used during the forthcoming tariff period have been admitted to
the RAB in proportion to the share of the tariff period under review in which they will be used.
3.1.1 Indexation
FFS has not used any indexation as an updated replacement valuation was received from a
reputable construction company for the facility on a replacement cost basis on the 9th February
2012 – refer to Annexure C. This replacement cost was inflated by the 5.9% projected inflation
factor for 2012 to obtain the TOC at the end of the tariff period.
3.1.2 Useful Lives
The useful lives of the storage assets has been considered to be an additional __ years based on
date of instalment with additional refurbishment required on a periodic basis (large scale
recurring capital expenditure and maintenance) to ensure useful life is achieved.
3.1.3 Decommissioning provision
The current agreement with the owner of the land, National Ports Authority (“NPA”), is that FFS
will ensure that the land is reverted back to its original use at the end of the lease period. NPA
has provided no indication of the exact requirements or cost, however an annual expense has
been included for site rehabilitation of R0.7 - R3.6 million. No decommissioning provision has been
included in the RAB calculation.
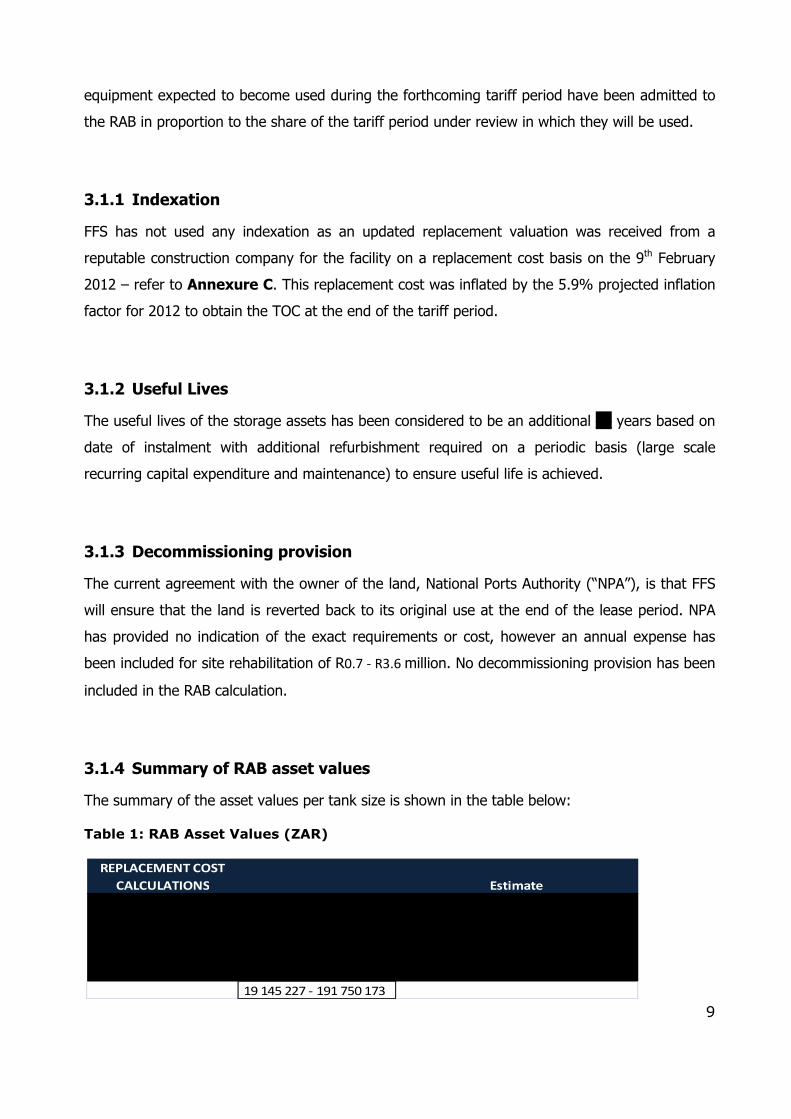
3.1.4 Summary of RAB asset values
The summary of the asset values per tank size is shown in the table below:
Table 1: RAB Asset Values (ZAR)
REPLACEMENT COST
CALCULATIONS Estimate
19 145 227 - 191 750 173
10
FFS accounting records (started in 1986 when started are very vague and unsupported. The
current fixed asset register indicates certain start dates for the key assets (as detailed above).
These have been revalued based on the replacement value based on the year of completion.
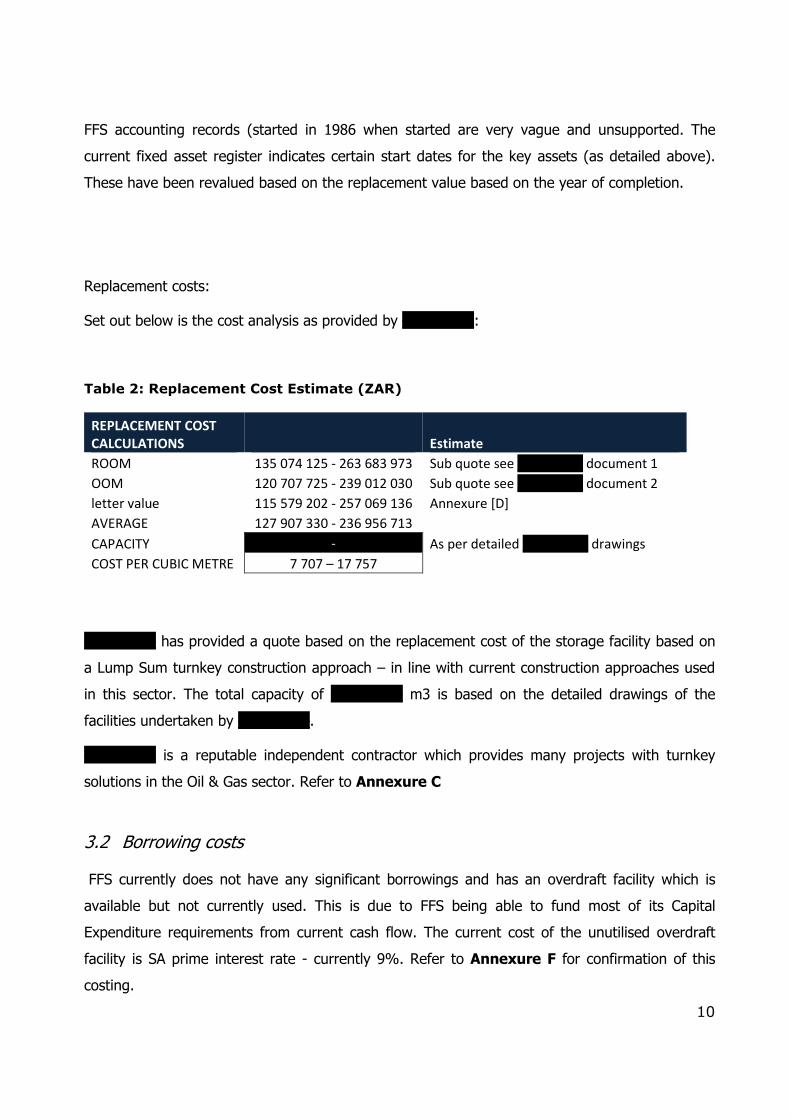
Replacement costs:
Set out below is the cost analysis as provided by _________:
Table 2: Replacement Cost Estimate (ZAR)
REPLACEMENT COST
CALCULATIONS Estimate
ROOM 135 074 125 - 263 683 973 Sub quote see _________ document 1
OOM 120 707 725 - 239 012 030 Sub quote see _________ document 2
letter value 115 579 202 - 257 069 136 Annexure [D]
AVERAGE 127 907 330 - 236 956 713
CAPACITY As per detailed _________ drawings
COST PER CUBIC METRE 7 707 – 17 757
_________ has provided a quote based on the replacement cost of the storage facility based on
a Lump Sum turnkey construction approach – in line with current construction approaches used
in this sector. The total capacity of _________ m3 is based on the detailed drawings of the
facilities undertaken by _________.
_________ is a reputable independent contractor which provides many projects with turnkey
solutions in the Oil & Gas sector. Refer to Annexure C
3.2 Borrowing costs
FFS currently does not have any significant borrowings and has an overdraft facility which is
available but not currently used. This is due to FFS being able to fund most of its Capital
Expenditure requirements from current cash flow. The current cost of the unutilised overdraft
facility is SA prime interest rate - currently 9%. Refer to Annexure F for confirmation of this
costing.
11
FFS understands that NERSA require a minimum Debt / Equity ratio of 30%. Although FFS
reading of the relevant wording indicates that this will only be included when the actual market
cost of debt is vague or the Project is highly structured. FFS, based on its comparable company
study, has applied the average Debt / Equity ratio applicable to its sector. This has been used in
the tariff application and the subsequent leveraging of the relevant BETA.
3.3 Net working capital (w)
Net working capital refers to various regulated business operations, funding requirements other
than utility plant in service. These funding requirements include inventories, prepayments,
minimum bank balances, cash working capital and other non-plant operating requirements.
Working capital funding requirements funded by investors are legitimate Regulatory Asset Base
allowances on which a return may be granted.
Net working capital is included in the RAB and is calculated according to the formula provided in
the methodology which is as follows:
Net working capital = inventory + receivables + operating cash + minimum cash
balance – trade payables2
The components are recognised as follows:
• No inventory is considered – spares procured based on required demand
• Trade receivables are based on 30 days of turnover based on the current customer
contract. Allowances for irrecoverable amounts are recognised in the income statement
when there is objective evidence that the asset is impaired. Other receivables include
prepayments;
• Direct labour and direct operating expenses are, where possible, charged to the Tank
Farm. The expenses of the FFS Western Cape Region are allocated on a percentage basis
to the Tank Farm.
• External Trade payables are settled within 45 days with majority based on intercompany
with no credit terms; and
2 Refer to section 4.3.2 of tariff methodology
12
• The allowance for operating cash is taken as a standardised factor of 45 days operating
expenditure, excluding depreciation and income tax.
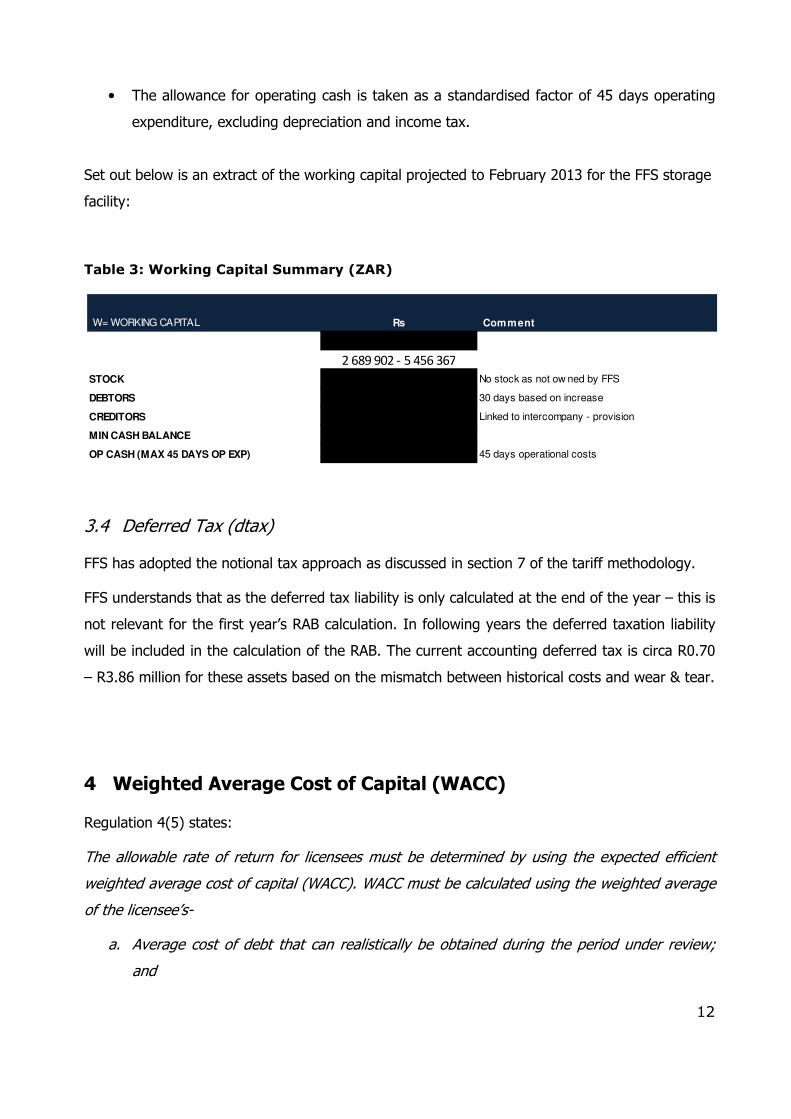
Set out below is an extract of the working capital projected to February 2013 for the FFS storage
facility:
Table 3: Working Capital Summary (ZAR)
3.4 Deferred Tax (dtax)
FFS has adopted the notional tax approach as discussed in section 7 of the tariff methodology.
FFS understands that as the deferred tax liability is only calculated at the end of the year – this is
not relevant for the first year’s RAB calculation. In following years the deferred taxation liability
will be included in the calculation of the RAB. The current accounting deferred tax is circa R0.70
– R3.86 million for these assets based on the mismatch between historical costs and wear & tear.
4 Weighted Average Cost of Capital (WACC)
Regulation 4(5) states:
The allowable rate of return for licensees must be determined by using the expected efficient
weighted average cost of capital (WACC). WACC must be calculated using the weighted average
of the licensee’s-
a. Average cost of debt that can realistically be obtained during the period under review;
and
W= WORKING CAPITAL Comment
STOCK
DEBTORS
CREDITORS
MIN CASH BALANCE
OP CASH (MAX 45 DAYS OP EXP)
Rs
-
45 days operational costs
Linked to intercompany - provision
30 days based on increase
No stock as not ow ned by FFS
-
2 689 902 - 5 456 367
13
b. Cost of equity capital calculated by means of the capital asset pricing model or any other
appropriate model
The approach taken by FFS in this application is fully compliant with Regulation 4(5). Also, in
line with NERSA, FFS has applied the capital asset pricing model (“CAPM”) to estimate the cost of
equity, with an exception being the calculation of BETA, which adjusts the final BETA calculation
4.1 Cost of Equity
Section 5.6.2 of the methodology sets out the formula for calculating the real cost of equity. In
this section of the application, we deal in turn with the individual components of the cost of
equity calculation embodied in the Capital Asset Pricing Model (“CAPM”), namely the risk free
rate, the market risk premium and beta.
4.1.1 Risk free rate
FFS has derived the risk free rate element for the cost of equity based on the MRP information
available on NERSAs website for applications of 4.40%
4.1.2 Market risk premium (“MRP”)
In common with the methodology, FFS has derived the MRP element of the cost of equity from
monthly observations, as published by NERSA in line with section 5.6.3 of the methodology. As
the methodology does not specify how to calculate the average, FFS has used the real MRP as
published by NERSA, which indicates a Market risk premium of 7.32% for the 25 year period
starting May, 1987 to mid last year 2011 based on current available information.
4.1.3 BETA
The methodology requires the licensee to propose a beta along with details of proxies used to
derive the beta suggested.
FFS Beta limitations:
In estimating the beta, FFS notes several key elements:
a. FFS is not a listed or stock exchange traded company
14
b. Its primary business is industrial heating fuels from waste products and Refinery by-
products and not tank farm rentals.
c. Information on local companies operating in the industry is not publicly available,
therefore FFS has had to use off shore comparable companies, and primarily those
companies traded on the NYSE.
d. No public companies on the NYSE are businesses which operate solely in petroleum
storage. In the cases observed, petroleum storage is a segment within the broader
business.
Beta
e. This situation described above has several major implications for deriving the beta that is
applicable:
I. Beta (as defined) is a measure of systematic risk; a measure of risk present in the
company across its business segments and measures the stock performance in
relation to the index.
II. The standard procedure for estimating betas, is to regress the specific stock
returns ���� against the market returns ����:���� = � + ����, where b is the
slope of the regression (referred to as �), and a is the intercept. It can be shown
mathematically, that the relationship described above can be expressed as
= ���/��� × � , where � is the variance of the stock/market and � is the
correlation between the two. This equation implies that the measure of market
risk is the portion of the relative standard deviation (i.e. the stock performance
compared to the market performance) that comes from the stock correlation with
the market.
III. R�, which by definition is R� = ρ� , is percentage in variance of the independent
variable that can be explained by the dependent variable. In our discussion, R� is
the percentage in variance of the stock, �R��, that can be explained by market
performance �R��. Assuming R� of 30%, would suggest that 30% of the risk in
the stock comes from market sources, and that 70% of the risk, comes from
company specific risk, which can arise from lack of diversification in business
15
segments, lack of geographic diversification etc. The R� statistic is reported by
financial information providers, along with other information relating to beta.
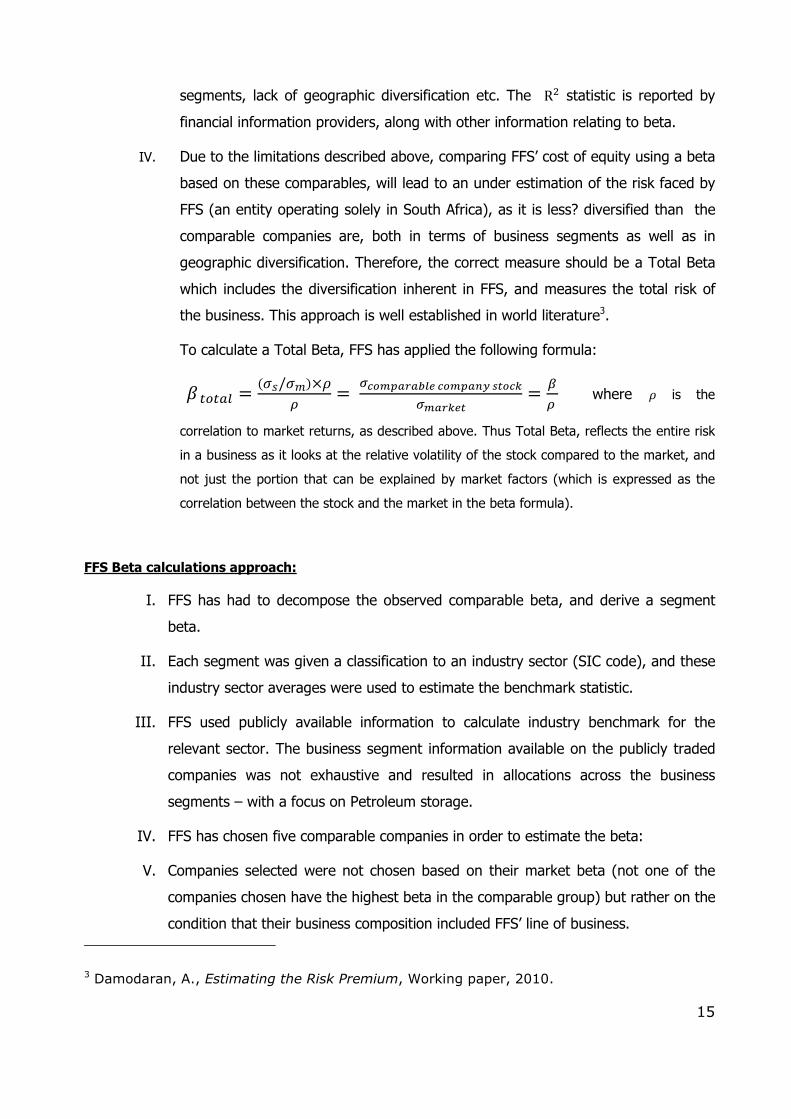
IV. Due to the limitations described above, comparing FFS’ cost of equity using a beta
based on these comparables, will lead to an under estimation of the risk faced by
FFS (an entity operating solely in South Africa), as it is less? diversified than the
comparable companies are, both in terms of business segments as well as in
geographic diversification. Therefore, the correct measure should be a Total Beta
which includes the diversification inherent in FFS, and measures the total risk of
the business. This approach is well established in world literature3.
To calculate a Total Beta, FFS has applied the following formula:
� ����� = ���/����� = ���� !"!#$% ��� !&' ()��*
��!"*%) = +
� where � is the
correlation to market returns, as described above. Thus Total Beta, reflects the entire risk
in a business as it looks at the relative volatility of the stock compared to the market, and
not just the portion that can be explained by market factors (which is expressed as the
correlation between the stock and the market in the beta formula).
FFS Beta calculations approach:
I. FFS has had to decompose the observed comparable beta, and derive a segment
beta.
II. Each segment was given a classification to an industry sector (SIC code), and these
industry sector averages were used to estimate the benchmark statistic.
III. FFS used publicly available information to calculate industry benchmark for the
relevant sector. The business segment information available on the publicly traded
companies was not exhaustive and resulted in allocations across the business
segments – with a focus on Petroleum storage.
IV. FFS has chosen five comparable companies in order to estimate the beta:
V. Companies selected were not chosen based on their market beta (not one of the
companies chosen have the highest beta in the comparable group) but rather on the
condition that their business composition included FFS’ line of business.
3 Damodaran, A., Estimating the Risk Premium, Working paper, 2010.
16
High level summary of the Beta calculation:
The methodology followed by FFS is supported by international best practice and includes the
following:
a. Identifying the segments the comparable company operates in, based on the
management discussion and analysis (“MD&A”) section in the latest audited financial
statements.
b. Obtaining the average turnover for each sector for the past three years ending no sooner
than December, 2010 using latest audited financial statements (“the average turnover”).
c. Estimating Total Enterprise Value (“TEV”) for the company, where
,- = ./��/0 �01 23454341 ,6789: + ;49 − .��ℎ �01 .��ℎ ,678>�?409�+ @80/389: A09434�9 − B��/C8�941 ./�D�084�
o Market value of common and preferred equity (if any) was obtained from
observed values.
o Market value of debt: where debt is comprised of bank debt, an adjustment has
been made to obtain a market value for it. For traded debt, market values were
used.
o Cash and cash equivalents were obtained from latest audited values on the
balance sheet.
o Minority interests and associated companies share were obtained from latest
audited values on the income statement.
d. Industry averages for TEV/Sales were applied to each segment the comparable company
operates in. This multiples estimates are publicly available, and are based on the entire
population of companies operating in an industry sector and listed on the NYSE (e.g.
TEV/Sales for logistics and equipment segment in the comparable company, was
estimated based on industry classification of SIC code 3133: OIL & GAS FIELD
MACHINERY & EQUIPMENT, and is based on 95 traded companies on the NYSE).
e. The multiple was applied to the average turnover to obtain a segment EV.
f. As no companies listed operate solely in petroleum storage business, the EV/Sales
multiple for the storage business was derived as the necessary multiple that would make
the sum of segment EVs equal to the TEV (i.e. the after summing all estimated segment
17
EV, and given the turnover for the storage business, the EV/Sales multiple is the number
that if applied to the storage business turnover, would make the sum of segment EVs
equal to the TEV estimated directly).
g. A proportion was calculated for each segment representing the segment proportion in the
company’s EV (i.e. Segment EV/TEV).
h. Average unlevered beta for each segment the comparable company operates in, as well
as an unlevered beta for the comparable company as a whole (“company beta”) was
obtained from publicly available information. The unlevered beta was used to neutralize
any leverage effects from the observed beta, using the formula:
�EF�GHGIGJ = +$%K%"%L MNO�NP��Q I��G�×�RGS� T⁄ VEW�X�Y
i. The unlevered beta for each segment was estimated as the proportion of the segment to
the TEV (i.e. EV/TEV) multiplied by the industry sector average unlevered beta (e.g. if the
pipeline segment’s proportion in the TEV is ___ and the average unlevered beta for
pipeline industry sector is ___, the pipeline segment’s contribution to the company beta is
_ __
j. As noted earlier, because no listed companies operate solely in the petroleum storage
business, the storage business’ contribution to the company beta _ ___ _
___ ___ ___ ___ ___
___ ___ __.
k. An average correlation to the market for each segment (i.e. an industry sector) was
obtained from publicly available information. The average calculated was applied to the
petroleum storage segment.
l. A Total Beta for the petroleum storage business was calculated (refer to section b(I)
above) using the estimated sector unlevered beta and the average correlation.
m. The total beta described was then re-levered at the average Debt-to-Equity (“D/E”) ratio.
The average industry D/E was obtained from publicly available information, and an
average value across segments was applied to the petroleum storage business.
The process described above was repeated for several companies, and the weighted average
value (based on market capitalization) obtained was used.
The beta estimated by FFS and used in the calculation is _ __.
Set out below is the low, high and average of the companies reviewed:

18
Table 4: Reviewed BETA Summary
Value High _ __ Low Weighted Average
_ __ _ __
Beta Used __ _
The weighted average Beta for the 5 companies compared was used
Point to note:
FFS understands that the current NERSA Beta’s calculation only considers the
levered beta for integrated pipeline companies and that no similar analysis to
understand the specific Beta for private companies solely linked to the independent
storage sector - has been undertaken. It is hoped that FFS approach will be
considered for reasonableness by NERSA and considered in the final decision.
___________________________________________________________________
_________________________________________________
FFS will share these detailed calculations with NERSA as required.
4.1.4 Real cost of equity calculation
Using the results of the calculation of the annualized real risk free rate, the market risk premium
and beta, the real cost of equity can be calculated.
Table 5: Real Cost of Equity
Tariff Application
Annualized real risk free 4.4 % Market risk premium (“MRP”) 7.32% Beta _____ Real cost of equity __ __
19
In Summary:
FFS is aligning with the NERSA methodology with the exception of the Beta
calculation – which FFS is the opinion is far more accurate than the NERSA
proposals as this has been tailored for FFS based on empirical data.
Another approach would be to use the NERSA Beta and then to adjust the
calculated Real Cost of Equity by an adjustment. The adjustment is,
however, difficult to support with credible research – which is in contrast
with the FFS beta approach above which can be supported.
FFS current shareholders require a minimum ____ IRR on new investments
FFS understands that other independent storage operators are also considered adjusting the
Beta calculation based on future capital investment and considerations in limiting private
companies’ ability to raise finance to obtain a beta range that is within the FFS calculations
above.
4.1.5 Comparable IRRs for related industries
The following IRR figures for businesses in related industries substantiate this
minimum acceptable rate of return which further supports the calculations presented
above, grounding the required return in market standards.
Set out below are certain relevant benchmarks for both integrated pipeline businesses and
independent storage based on market research:
Table 6: Comparable IRRs
Project/Company NameUSD
Project IRRIndustry
Adjusted SA
EquityIRR
20
Source: Publications, annual reports, press releases across the sectors
FFS has a hurdle rate of ____% but depending on the assessed business risk and the
chance of failure of each project, this could be as high as ____%. The FFS management
team expects only one in two ventures to be successful as FFS operates in a high risk
environment.________________________________________________________________
__________________________________________________________________________
_____________________________.
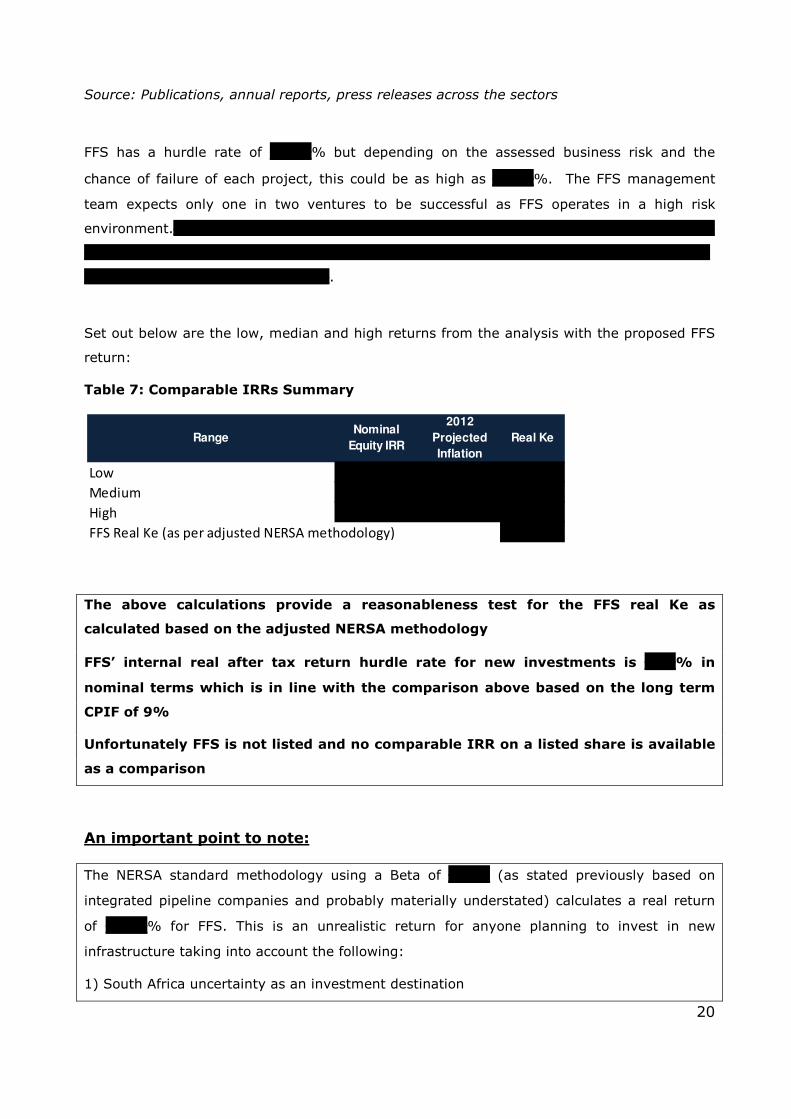
Set out below are the low, median and high returns from the analysis with the proposed FFS
return:
Table 7: Comparable IRRs Summary
The above calculations provide a reasonableness test for the FFS real Ke as
calculated based on the adjusted NERSA methodology
FFS’ internal real after tax return hurdle rate for new investments is ___% in
nominal terms which is in line with the comparison above based on the long term
CPIF of 9%
Unfortunately FFS is not listed and no comparable IRR on a listed share is available
as a comparison
An important point to note:
The NERSA standard methodology using a Beta of ____ (as stated previously based on
integrated pipeline companies and probably materially understated) calculates a real return
of ____% for FFS. This is an unrealistic return for anyone planning to invest in new
infrastructure taking into account the following:
1) South Africa uncertainty as an investment destination
RangeNominal
Equity IRR
2012
Projected
Inflation
Real Ke
Low
Medium
High
FFS Real Ke (as per adjusted NERSA methodology)
21
2) South Africa Rand cost of funding of ___% prime relative to other countries in Europe and
the USA of 2 to 3%
3) The on-going risk and high cost of doing business in terms of expenses and time with
South African parastatels
4) High cost of construction in South Africa vs. the rest of the World
5) Investors can get up to 8% on Fixed deposits in South African Banks with no risk.
In FFS opinion should investors be limited to only ____real return over longer terms further
investment would not be made by the private sector in large scale petroleum related
infrastructure, which would be disastrous for the economy.
4.2 Cost of Debt
FFS has effectively no interest bearing debt, nor does it expect to issue such debt in the tariff
period, the weight applied to this portion is 30% as per the methodology and assumed cost of
prime rate (for information purposes FFS has an overdraft facility in place, at prime interest rate,
which is not currently utilised).
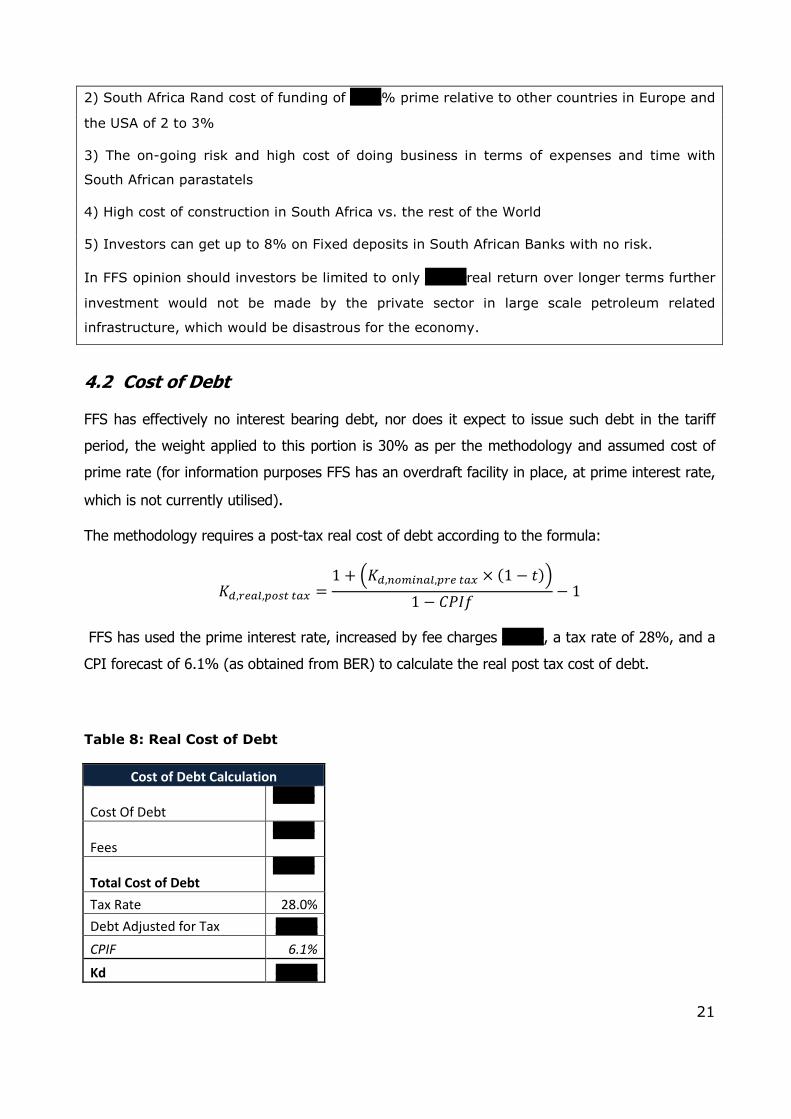
The methodology requires a post-tax real cost of debt according to the formula:
ZJ,IG��,\��� ��Q = 1 + ^ZJ,F��WF��,\IG ��Q × �1 − 9�_1 − .2A5 − 1
FFS has used the prime interest rate, increased by fee charges ____, a tax rate of 28%, and a
CPI forecast of 6.1% (as obtained from BER) to calculate the real post tax cost of debt.
Table 8: Real Cost of Debt
Cost of Debt Calculation
Cost Of Debt ____
Fees
____
Total Cost of Debt ____
Tax Rate 28.0%
Debt Adjusted for Tax ____
CPIF 6.1%
Kd ____
22
As detailed previously FFS has complied with the current NERSA treatment but
requests that in future NERSA allows the zero debt to be included – in line with FFS
current financial position.
FFS management is of the opinion that the current NERSA methodology with regards
to discounting the nominal cost of debt to real is incorrect and should be revised. For
the purpose of this application the excel calculations have applied the NERSA
approach but FFS requests that future tariff applications correct this.
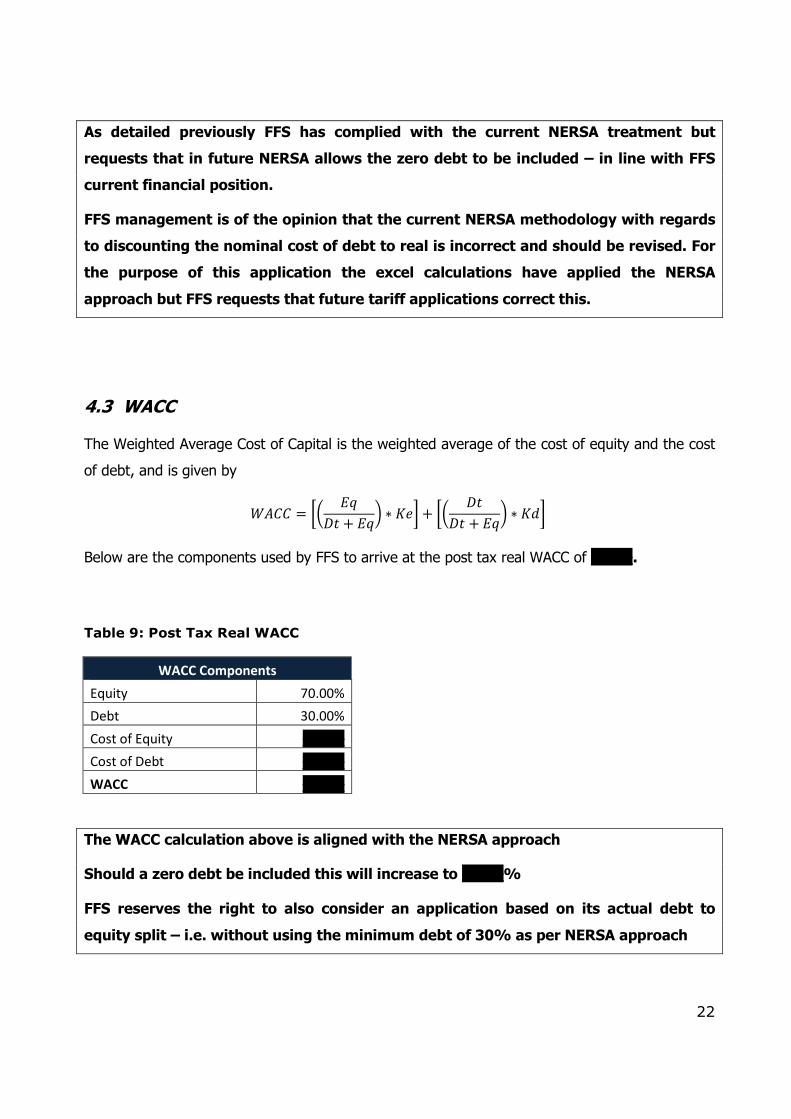
4.3 WACC
The Weighted Average Cost of Capital is the weighted average of the cost of equity and the cost
of debt, and is given by
`B.. = ab ,6;9 + ,6c ∗ Z4e + ab ;9
;9 + ,6c ∗ Z1e
Below are the components used by FFS to arrive at the post tax real WACC of ____.
Table 9: Post Tax Real WACC
WACC Components
Equity 70.00%
Debt 30.00%
Cost of Equity ____
Cost of Debt ____
WACC ____
The WACC calculation above is aligned with the NERSA approach
Should a zero debt be included this will increase to ____%
FFS reserves the right to also consider an application based on its actual debt to
equity split – i.e. without using the minimum debt of 30% as per NERSA approach
23
5 Expenses
Expenses are those planned for the efficient operation and maintenance of the core business.
These expenses are to be categorised in accordance with the Regulatory Reporting Manual
(Volume 4). The fully allocated cost attribution approach for the allocation of costs is used.
FFS’ operating expenses are recognized and reported in terms of the International Financial
Reporting Standards (“IFRS”). Approximately 80% of the operating expenses are fixed and
consequently are not driven by the volume of petroleum products stored. The largest exception
compared to other independent storage companies is the transport cost (i.e. cost of moving
product from the storage location to the customer site) – in this case some 50kms away at
Ankelig.
Expense forecasts are based on the latest actual information available.
A summary of FFS’ expenses is shown in the table below.
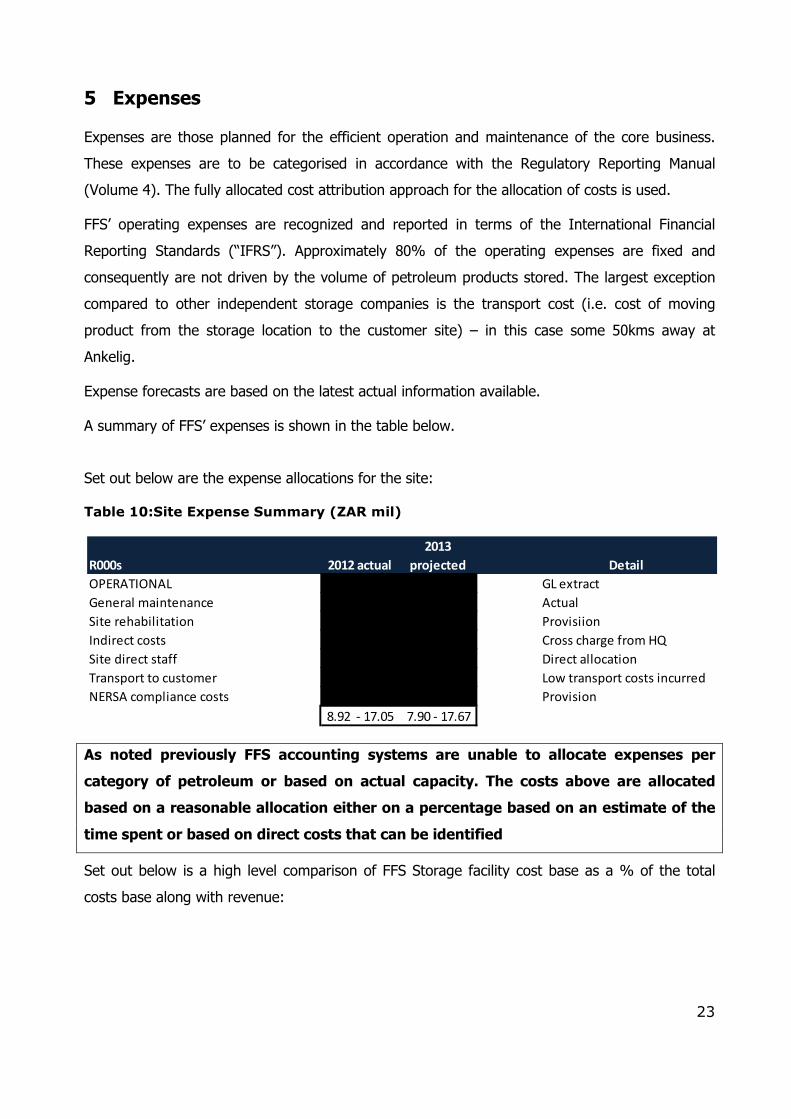
Set out below are the expense allocations for the site:
Table 10:Site Expense Summary (ZAR mil)
As noted previously FFS accounting systems are unable to allocate expenses per
category of petroleum or based on actual capacity. The costs above are allocated
based on a reasonable allocation either on a percentage based on an estimate of the
time spent or based on direct costs that can be identified
Set out below is a high level comparison of FFS Storage facility cost base as a % of the total
costs base along with revenue:
R000s 2012 actual
2013
projected Detail
OPERATIONAL GL extract
General maintenance Actual
Site rehabilitation Provisiion
Indirect costs Cross charge from HQ
Site direct staff Direct allocation
Transport to customer Low transport costs incurred
NERSA compliance costs Provision
8.92 - 17.05 7.90 - 17.67
24
The FFS licensed storage facility accounts for __ of the total Group’s revenue but only has __ of
the Total Group’s expenses allocated towards application this based on the current costing
approach.
6 Income Taxation
An election between the use of either (a) flow through (actual tax) payment or (b) notional tax
payment needs to be made. Once the election has been made; the selected option will be used
in future for all the licensee’s assets.
FFS elects to use the normalised (notional) tax approach in its tariff application. Normalised tax
refers to an estimated normalised tax expense with respect to the regulated activity for the tariff
period under review. In accordance with the methodology it is calculated based on the following
formula:
Tax = (NPBT (excluding tax allowance) / (1-tr)) x tr
Where:
NPBT (excl tax allowance) = {(RAB x WACC) +E + D (of total TOC asset base) ± C} – {E +
D (historic)}
tr = prevailing corporate tax rate
7 Depreciation
Depreciation is calculated on a straight line basis over the useful lives of the assets as per the
methodology over __ year. This is a conservative assumption and could be reduced which would
increase the AR.
The estimated depreciation charge for 2012/13 is R0.70 –R2.84million.
8 Clawback
No Clawback adjustment has been noted in the application as it is the first
application. The impact of this will be considered in the next application.
25
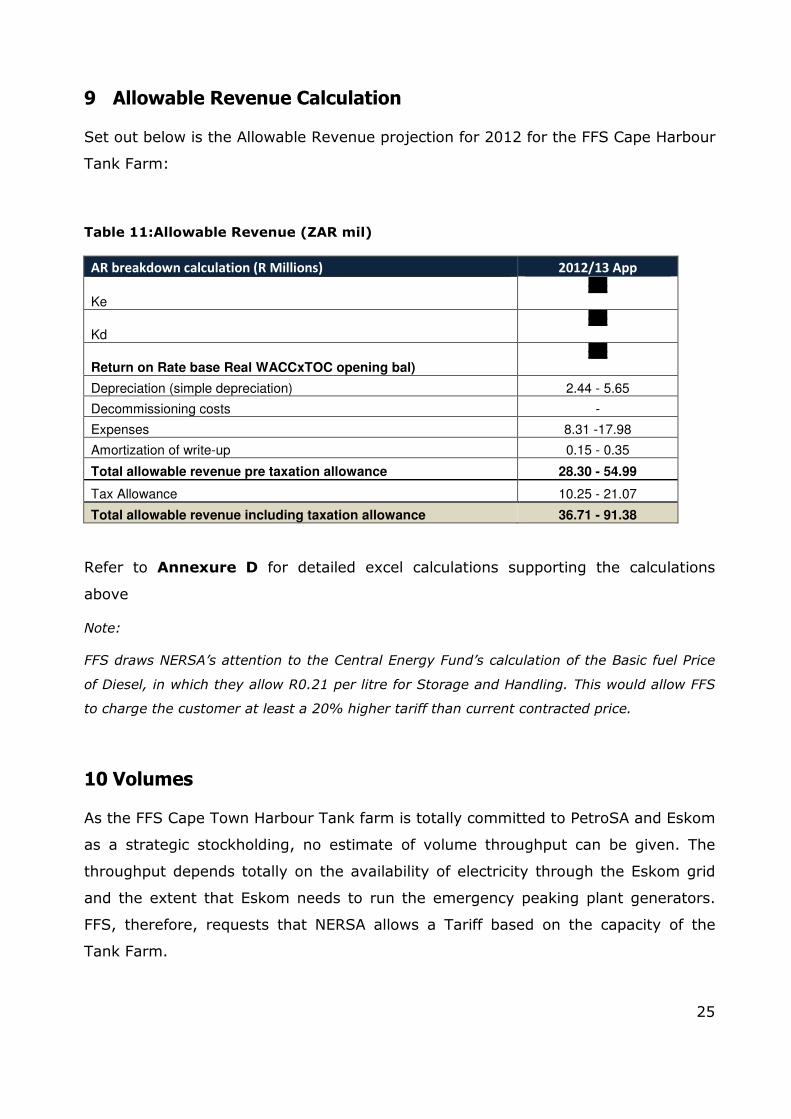
9 Allowable Revenue Calculation
Set out below is the Allowable Revenue projection for 2012 for the FFS Cape Harbour
Tank Farm:
Table 11:Allowable Revenue (ZAR mil)
AR breakdown calculation (R Millions) 2012/13 App
Ke
__
Kd
__
Return on Rate base Real WACCxTOC opening bal) __
Depreciation (simple depreciation) 2.44 - 5.65
Decommissioning costs -
Expenses 8.31 -17.98
Amortization of write-up 0.15 - 0.35
Total allowable revenue pre taxation allowance 28.30 - 54.99
Tax Allowance 10.25 - 21.07
Total allowable revenue including taxation allowance 36.71 - 91.38
Refer to Annexure D for detailed excel calculations supporting the calculations
above
Note:
FFS draws NERSA’s attention to the Central Energy Fund’s calculation of the Basic fuel Price
of Diesel, in which they allow R0.21 per litre for Storage and Handling. This would allow FFS
to charge the customer at least a 20% higher tariff than current contracted price.
10 Volumes
As the FFS Cape Town Harbour Tank farm is totally committed to PetroSA and Eskom
as a strategic stockholding, no estimate of volume throughput can be given. The
throughput depends totally on the availability of electricity through the Eskom grid
and the extent that Eskom needs to run the emergency peaking plant generators.
FFS, therefore, requests that NERSA allows a Tariff based on the capacity of the
Tank Farm.
26
The customer currently uses a strategic reserve as lack of own storage capacity on-
site. This approach can change based on the customer’s requirements – which is
impacted by South Africa’s electricity shortage position.
11 Conclusion
FFS has endeavoured to meet the draft MIRTA requirements in this application. In arriving at its
AR requirement, FFS has applied the methodology in all respects with the exception of the
calculation of cost of equity relating to the BETA calculation as discussed earlier.
FFS is cognisant that this is a maximum tariff and that FFS takes on the risk if a lower monthly
tariff is charged, along with the lower revenue. The requested tariff for the 2012/13 period is
R3,346 per m3 – as detailed by the methodology.