Embed Size (px)
Citation preview
GPO PRICE $
CFSTI PRICE(S) $
Hard copy (HC|__ _" _ -
Microfiche (MF) • Z S -
ff 653 July 65
DEVELOPMENT OF AN ACCURATE WIDE RANGE ULTRA HIGH
VACUUM GAUGE CALIBRATION METHOD
By Peter Fowler and F. J. Brock
Distribution of this report is provided in the interest of
information exchange. Responsibility for the contentsresides in the author or organization that prepared it.
iX
=.[
Prepared under Contract No. NAS5-3967 by ilINATIONAL RESRARCH CORPORATION
Cambridge, Massachusetts ifor
NATIONAL AERONAUTICS AND SPACE ADMINISTRATION
N66 27965I IACCIIIIO1N IIUMtER) ¢/'H III U)
: 1/3- ]o__ |PACEI) ¢C E|
i
4NAliA GR OR TMX OR AD NUMliIrR)
J
1966018675
https://ntrs.nasa.gov/search.jsp?R=19660018675 2018-07-23T22:02:17+00:00Z
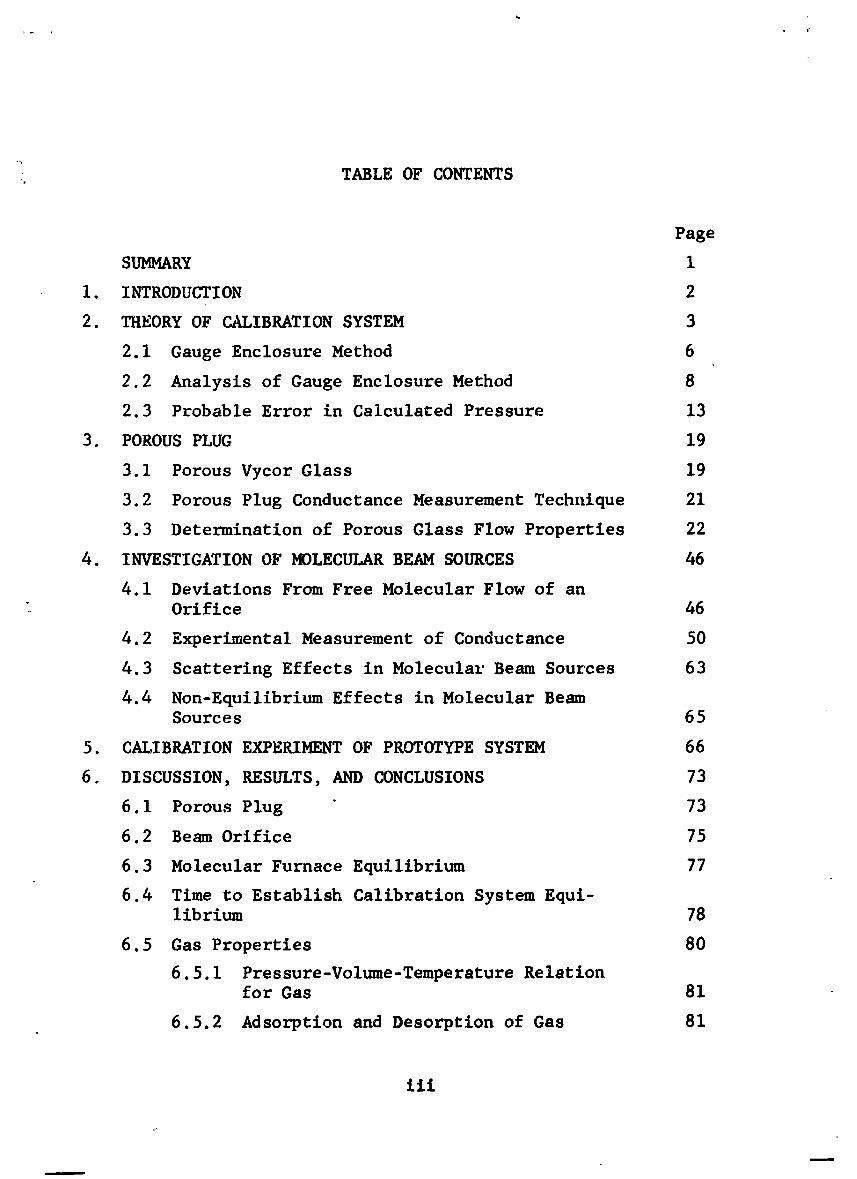
_ TABLE OF CONTENTS
Page
SUMMARY i
i. INTRODUCTION 2
2. THEORY OF CALIBRATION SYSTEM 3
2.1 Gauge Enclosure Method 6
2.2 Analysis of Gauge Enclosure Method 8
2.3 Probable Error in Calculated Pressure 13
3. POROUS PLUG 19
3.1 Porous Vycor Glass 19
3.2 Porous Plug Conductance Measurement Technique 21
3.3 Determination of Porous Glass Flow Properties 22
4. INVESTIGATION OF MOLECULAR BEAM SOURCES 46
4.1 Deviations From Free Molecular Flow of anOrifice 46
4.2 Experimental Measurement of Conductance 50
4.3 Scattering Effects in Molecular Beam Sources 63
4.4 Non-Equilibrium Effects in Molecular BeamSources 65
5. CALIBRATION EXPERIMENT OF PROTOTYPE SYSTEM 66
6. DISCUSSION, RESULTS, AND CONCLUSIONS 73
6.1 Porous Plug 73
6.2 Beam Orifice 75
6.3 Molecular Furnace Equilibrium 77
6.4 Time to Establish Calibration System Equi-librium 78
6.5 Gas Properties 80
6.5.1 Pressure-Volume-Temperature Relationfor Gas 81
6.5.2 Adsorption and Desorption of Gas 81
iii
1966018675-002
I
TABLE OF cO,rENTS (Continued)
Page
6.5.3 Background Gas Pressure 87
6.6 Application of kesults to Design Principles 88
6.7 Probable Error in Geuge Pressure 92
7. RECOMMENDATIONS FOR FUTURE WORK 94
APPENDIX I. MEAN MOLECULAR VELOCITY IN MOLECULAR BEAM 98
APPENDIX 2. ANALYSIS OF ORIFICE CONDUCTANCE EXPERIMENT i00
REFERENCES 105
iv
i
1966018675-003
LIST OF FIGURES
PAGE
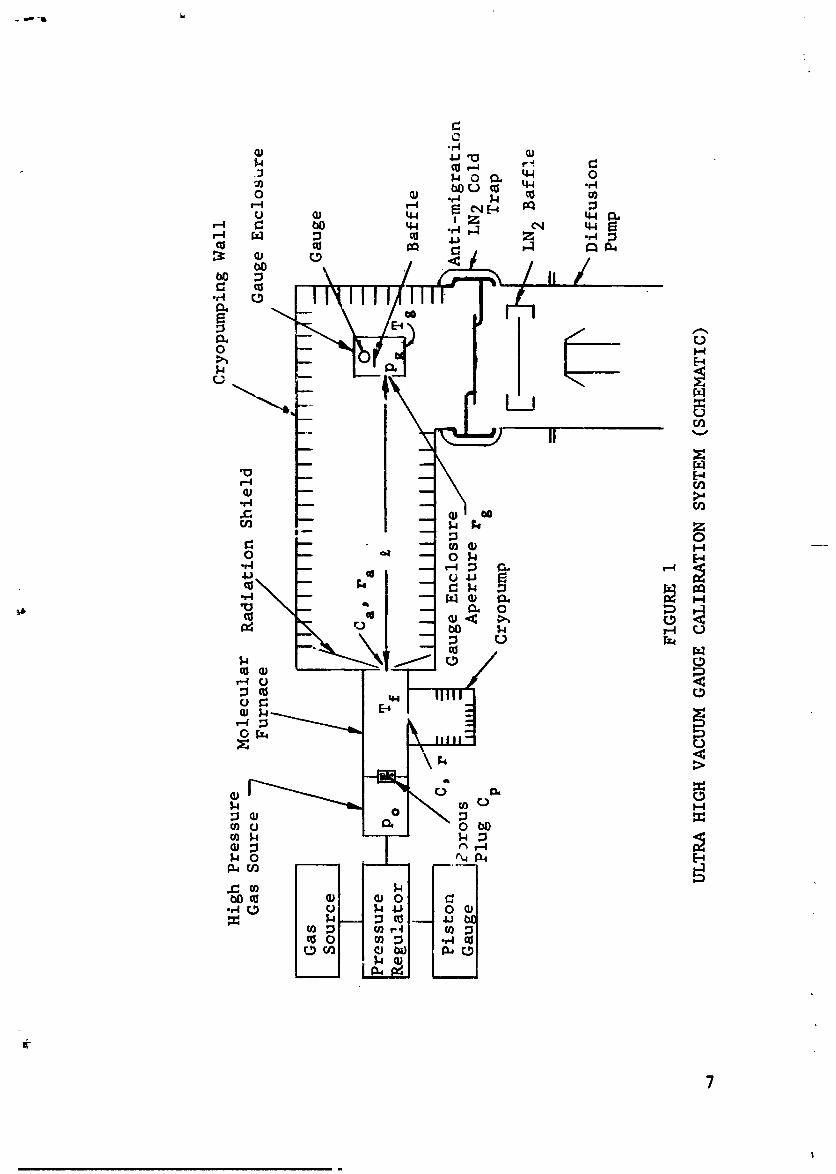
!. Ultra High Vacuum Gauge Calibration System.7(Schematic) .......................
2. Molecular Beam and Enclosure Apertures. (SchematlC)... 9
3. Gas Source Chamber Volume Measurement Apparatus.(Schematic) ....................... 17
4. Porous Plug #i ..................... 23
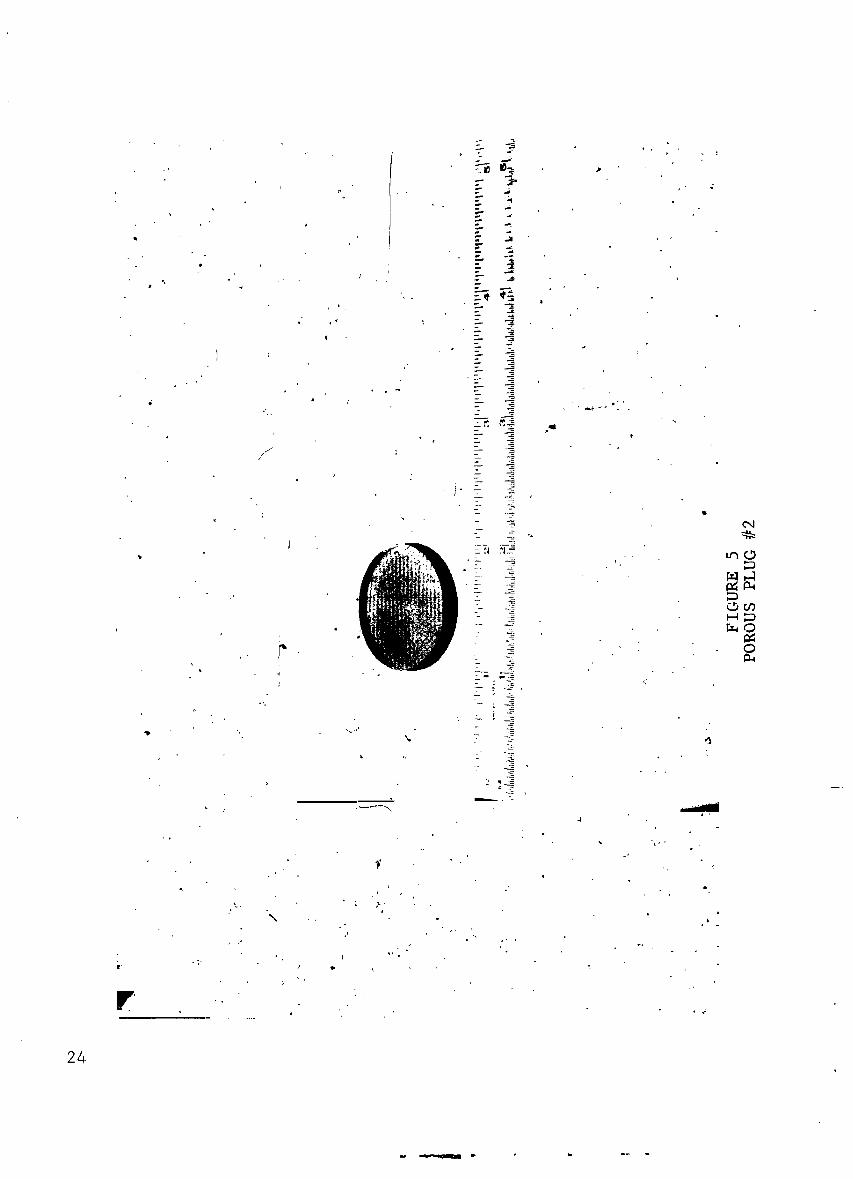
5. Porous Plug #2 ..................... 24
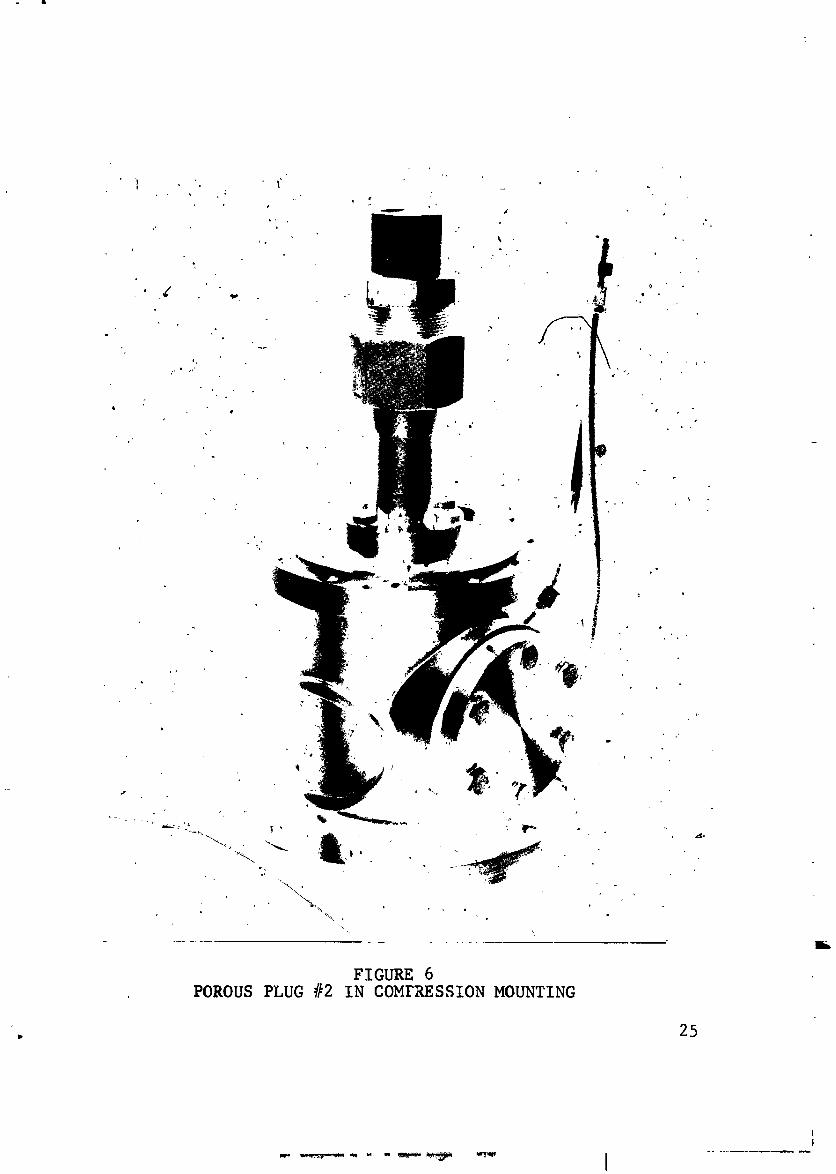
6. Porous Piug #2 fn Compression Mounting ......... 25
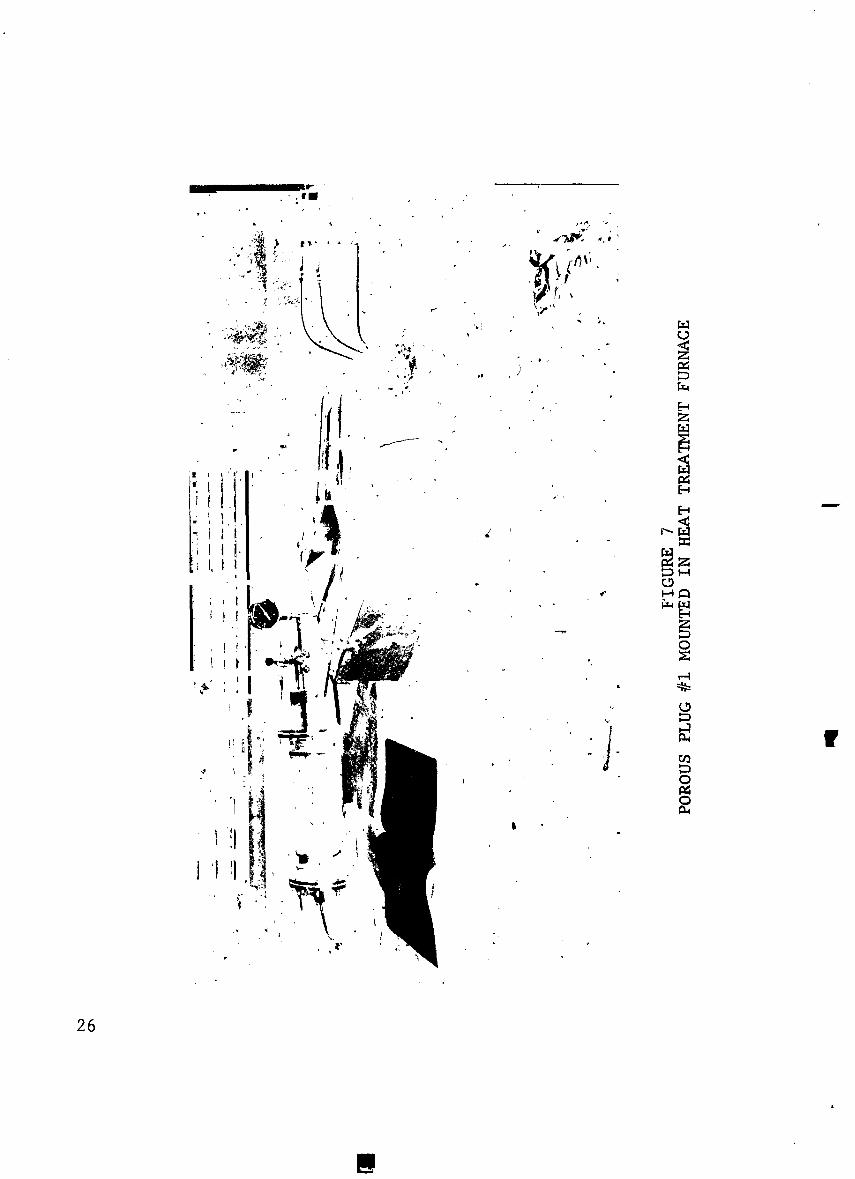
7. Porous Plug #i Mounted in Heat Treatment Furnace .... 26
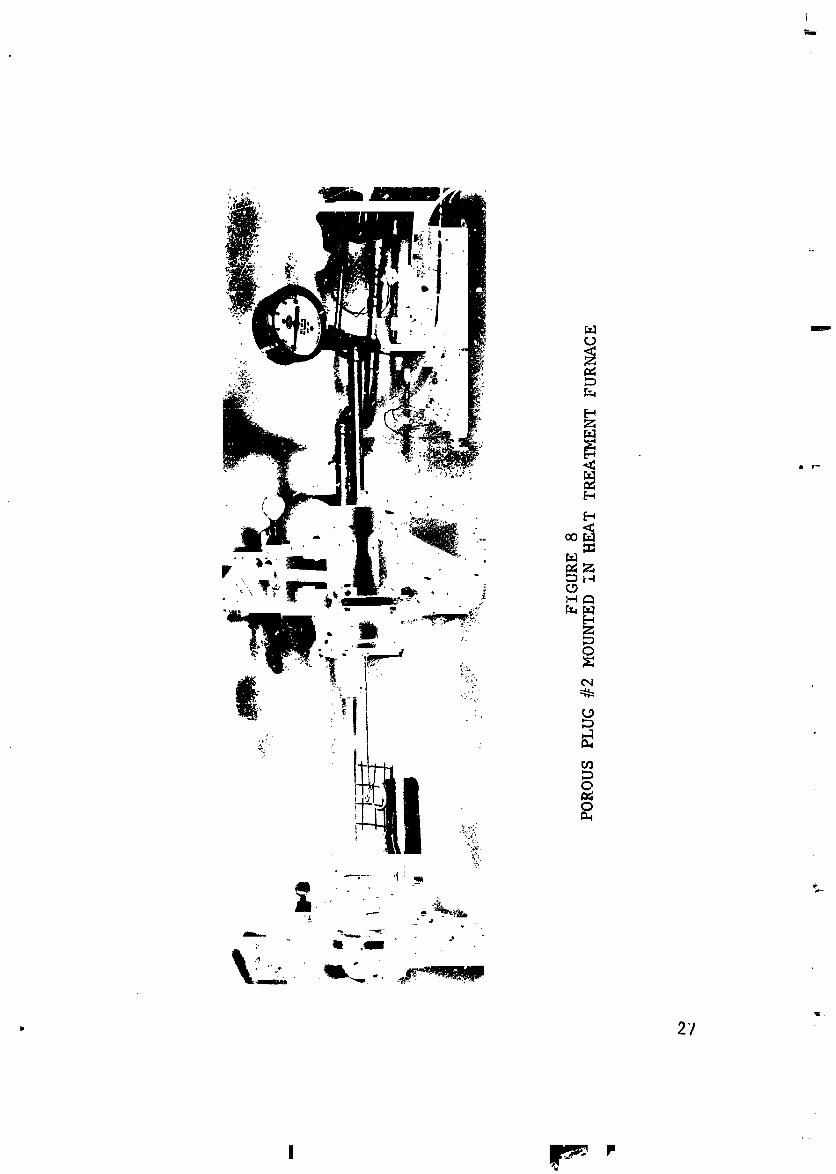
8. Porous Plug #2 Mounted in Heat Treatment Furnace .... 27
J 9. Flow'System for Porous Plug Conductance Measurement.(Schematic) ....................... 29
i0. Rotating Piston Gauge and Auxiliary Equipment ...... 30
II. Gas Source Chamber and Molecular Furnace Prior to
Joining ......................... 31
12. Porous Plug Conductance Measurement ExperimentalApparatus ........................ 33
13. Porous Plug Conductance Measurement Run i-I.. ..... 34
14. Porous Plug Conductance Measurement Run I-3_ ...... 35 ---
15. Porous Plug Conductance Measurement Run 1-4....... 36
16. Porous Plug Conductance Measurement Run 1-5 ....... 37
17. Porous Plug Conductance Measurement Run 1-6 ....... 38
18. Porous Piug Conductance Measurement Run 1-7....... 39
v
m
1966018675-004
i !
LIST OF FIGURES (Continued)
PAGE
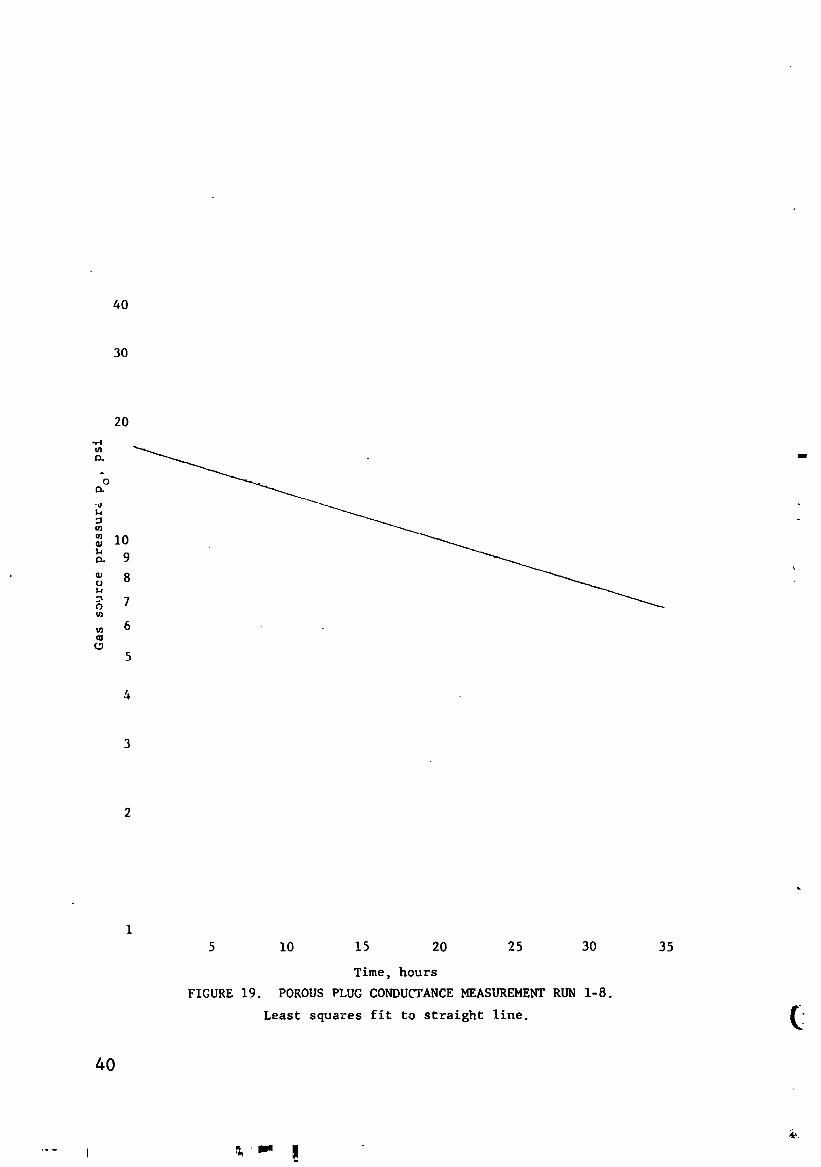
19. Porous Plug Conductance Measurement Run 1-8 ...... 40
20. Gas Source Chamber Volume Measurement ExperimentalApparatus ....................... 44
21. Flux Distribution of Molecular Beam with _/d = 0,I . . 49
22. Orifice Conductance Measurement Experiment .....(Schematic) ...................... 51
23. Orifice Conductance Measurement Experiment ...... 56
24. Orifice #I Mounted on Gold O-Ring Seal Flange ..... 57
25. Orifice #2 100X Magnified ............. 587
26. Orifice Conductance Measurement Run 1-6 ........ 60
27. Orifice Conductance Measurement Run 1-7 ........ 61
28. Calculated and Measured Deviation from Free Molecular
Flow Through an Orifice ................ 62
29. Calibration Run of Prototype System.a) Gauge and Enclosure in Cryopumped Chamber ..... 67
b) Molecular Furnace and Gas Source Chamber Mountedon Cryopumping Chamber Wall ............ 67
30. Auxiliary Apparatus for Calibration Run of PrototypeSystem ........................ 68
31. Calibration Data for Suppressor Grid Gauge ...... 71
32. Signal-to-Background Gas Pressure Ratio: and CryopumpTemperature During Calibration Run .......... 72
33. Orifice #2 Mounted on Gold O-Ring Seal Flange ..... 76
34. Argon R.lative Coverage Versus Temperature for ai0 cm. Radius Spherical Cavity ............ 84
35. Maximum Gauge Enclosure Pressure Versus BeamAperture Diameter for Various ConstrainingConditions ...................... 89
vi
1966018675-005
LIST OF FIGUP,_.S (Concluded)
PAGE
36. Percentage Increase of Furnace Gas Density Due toEmergent Flux from E,nclosure Versus L ........ 93
37. Orifice Conductance Measurement Experiment.(Schematic) .................... i00
vii
m
m
1966018675-006
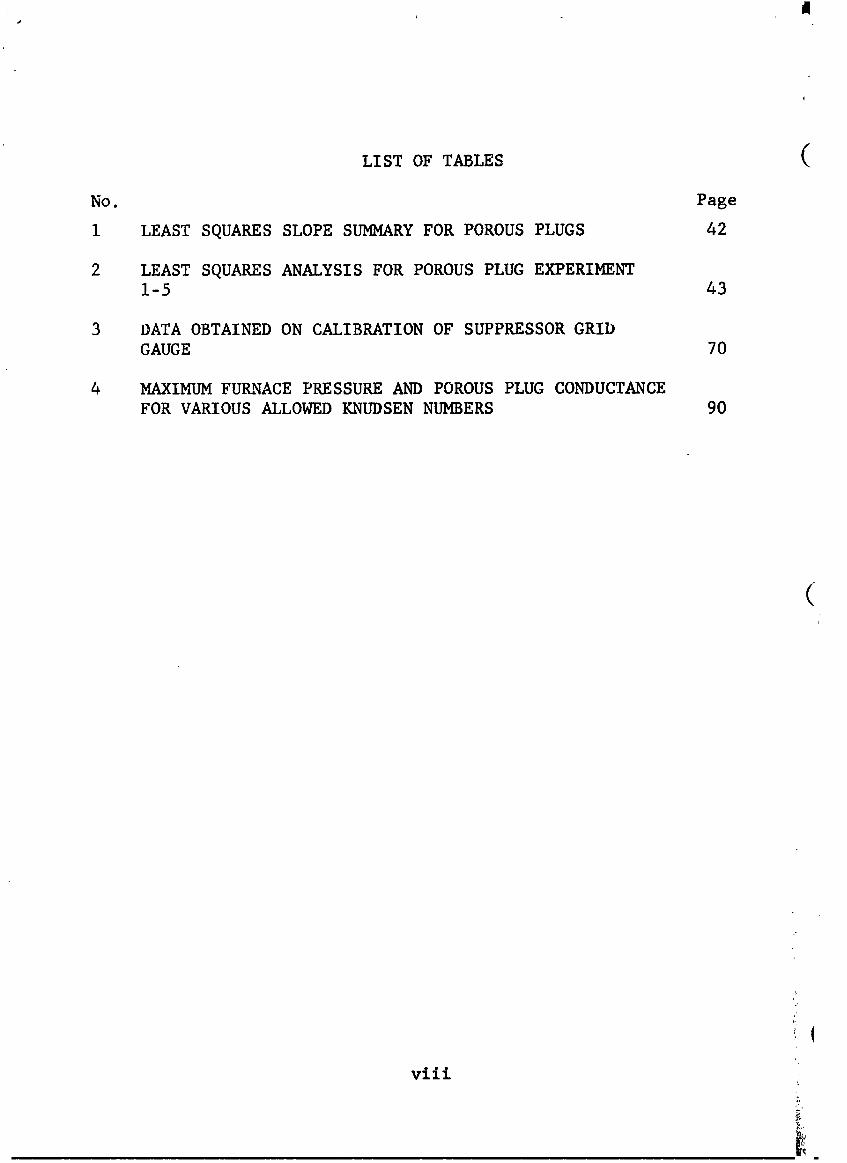
LIST OF TABLES (
No. Page
i LEAST SQUARES SLOPE SUMMARY FOR POROUS PLUGS 42
2 LEAST SQUARES ANALYSIS FOR POROUS PLUG EXPERIMENT1-5 43
3 DATA OBTAINED ON CALIBRATION OF SUPPRESSOR GRID
GAUGE 70
4 MAXIMUM FURNACE PRESSURE AND POROUS PLUG CONDUCTANCE
FOR VARIOUS ALLOWED KNUDSEN NUMBERS 90
(
viii
1966018675-007
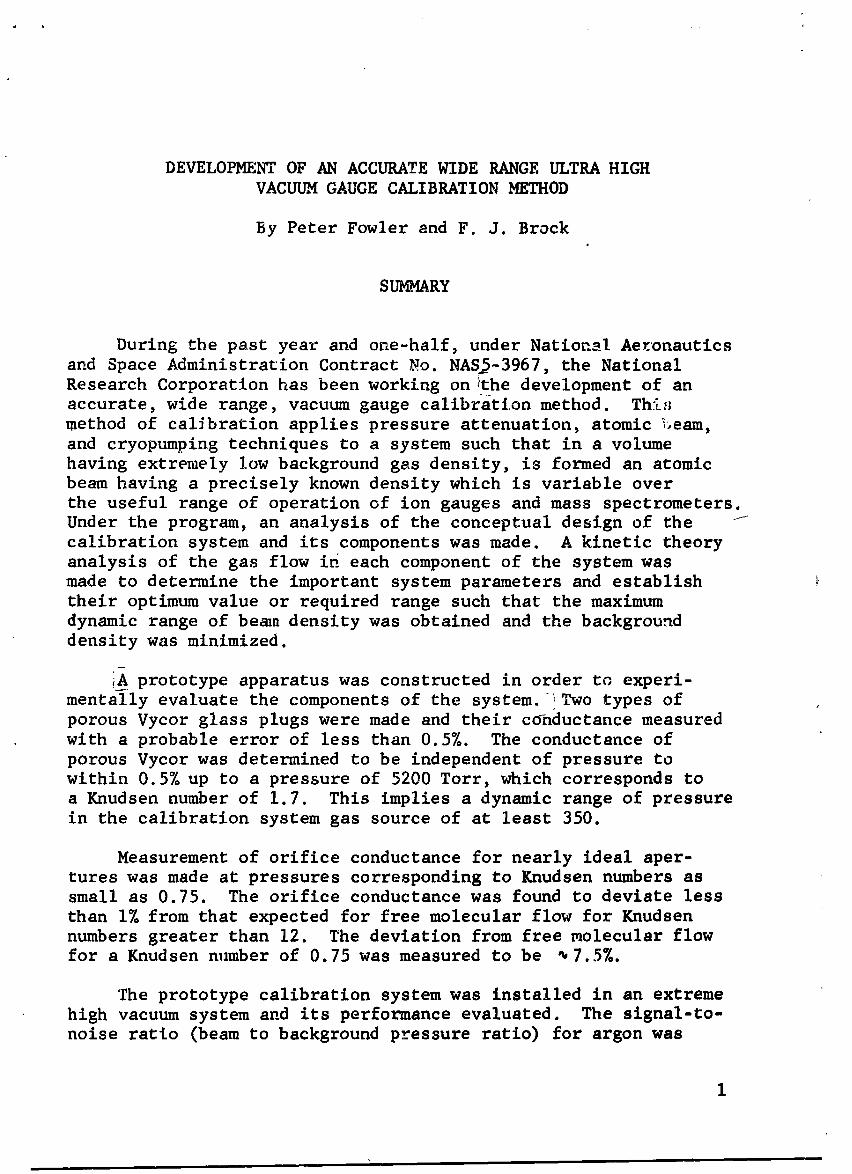
DEVELOPMENT OF AN ACCURATE WIDE RANGE ULTRA HIGHVACUUM GAUGE CALIBRATION METHOD
By Peter Fowler and F. J. Brock
SUMMARY
During the past year and one-half, under National Aeronautics
and Space Administration Contract No. NAS_-3967, the NationalResearch Corporation has been working on!the development of anaccurate, wide range, vacuum gauge calibration method. Thismethod of cal_bration applies pressure attenuation, atomic Leam,and cryopumping techniques to a system such that in a volumehaving extremely low background gas density, is formed an atomicbeam having a precisely known density which is variable overthe useful range of operation of ion gauges and mass spectrometers.Under the program, an analysis of the conceptual design of the Icalibration system and its components was made. A kinetic theoryanalysis of the gas flow in each component of the system wasmade to determine the important system parameters and establish _their optimum value or required range such that the maximumdynamic range of bean density was obtained and the backgrounddensity was minimized.
IA prototype apparatus was constructed in order to experi-mentally evaluate the components of the system. _Two types ofporous Vycor glass plugs were made and their conductance measuredwith a probable error of less than 0.5%. The conductance ofporous Vycor was determined to be independent of pressure towithin 0.5% up to a pressure of 5200 Torr, which corresponds toa Knudsen number of 1.7. This implies a dynamic range of pressurein the calibration system gas source of at least 350.
Measurement of orifice conductance for nearly ideal aper-tures was made at pressures corresponding to Knudsen numbers assmall as 0.75. The orifice conductance was found to deviate less
than 1% from that expected for free molecular flow for Knudsen
numbers greater than 12. The deviation from free molecular flowfor a Knudsen number of 0.75 was measured to be _ 7.5%.
The prototype calibration system was installed in an extremehigh vacuum system and its performance evaluated. The signal-to-noise ratio (beam to background pressure ratio) for argon was
i
1966018675-008
El I I
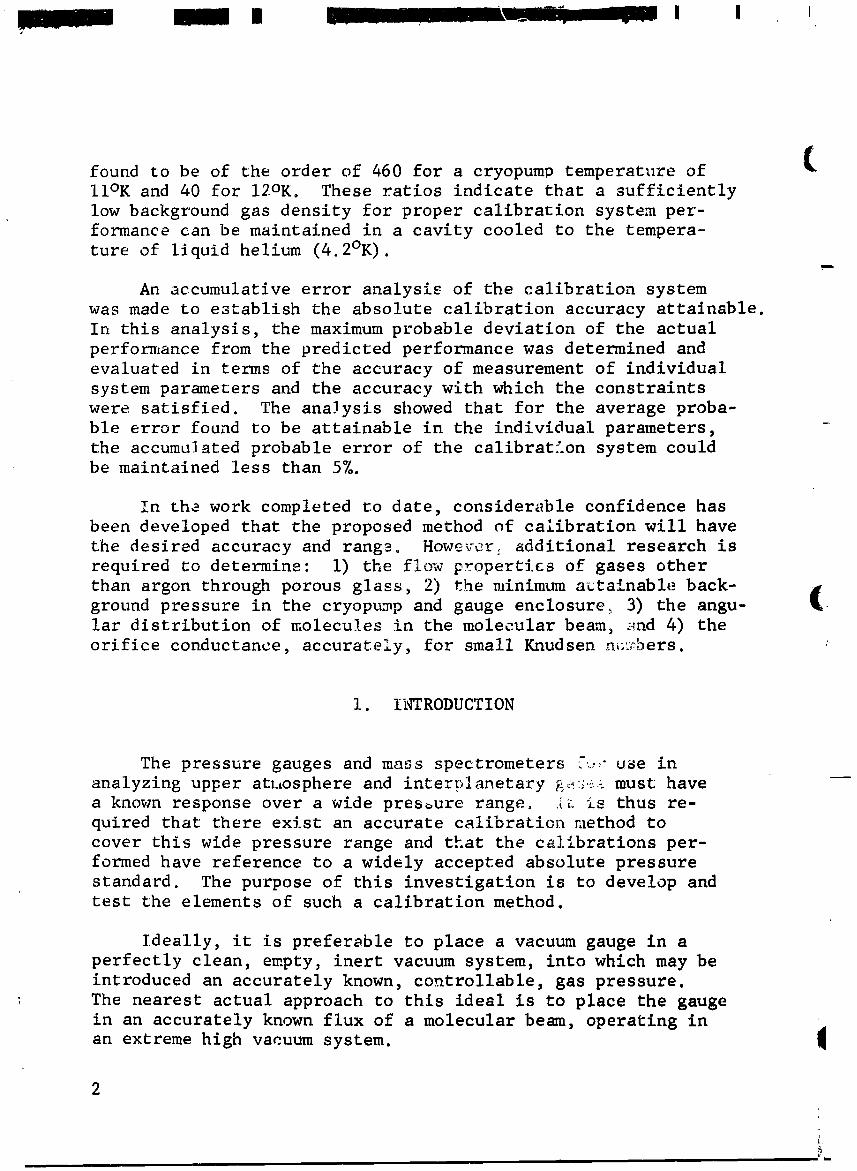
ffound to be of the order of 460 for a cryopump temperature ofll°K and 40 for 12OK. These ratios indicate that a sufficiently
low background gas density for proper calibration system per-
formance can be maintained in a cavity cooled to the tempera-
ture of liquid helium (4.2°K).
An accumulative error analysis of the calibration system
was made to establish the absolute calibration accuracy attainable.
In this analysis, the maximum probable deviation of the actual
performance from the predicted performance was determined and
evaluated in terms of the accuracy of measurement of individual
system parameters and the accuracy with which the constraints
were satisfied. The anaJysis showed that for the average proba-ble error found to be attainable in the individual parameters,
the accumulated probable error of the calibration system couldbe maintained less than 5%.
In the work completed to date, consider_ble confidence has
been developed that the proposed method of calibration will have
the desired accuracy and range° However. additional research isrequired to determine: i) the flow properties of gases other
than argon through porous glass, 2) the minimum a_tainable back- jground pressure in the cryopump and gauge enclosure_ 3) the angu- l
lar distribution of molecules in the molecular beam, and 4) the
orifice conductance, accurately, for small Knudsen n_._aers. _
i. INTRODUCTION
The pressure gauges and mass spectrometers _.,_"use in
analyzing upper atmosphere and interblanetary g_ must have
a known response over a wide pressure range. [_ is thus re-quired that there exist an accurate calibration method to
cover this wide pressure range and that the calibrations per-formed have reference to a widely accepted absolute pressure
standard. The purpose of this investigation is to develop andtest the elements of such a calibration method.
Ideally, it is preferable to place a vacuum gauge in a
perfectly clean, empty, inert vacuum system, into which may beintroduced an accurately known, controllable, gas pressure.
The nearest actual approach to this ideal is to place the gaugein an accurately known flux of a molecular beam, operating in
an extreme high vacuum system. I
L,
ii
1966018675-009
.IP_IH I i i Ill i I II D I lia Na ili ,.
=
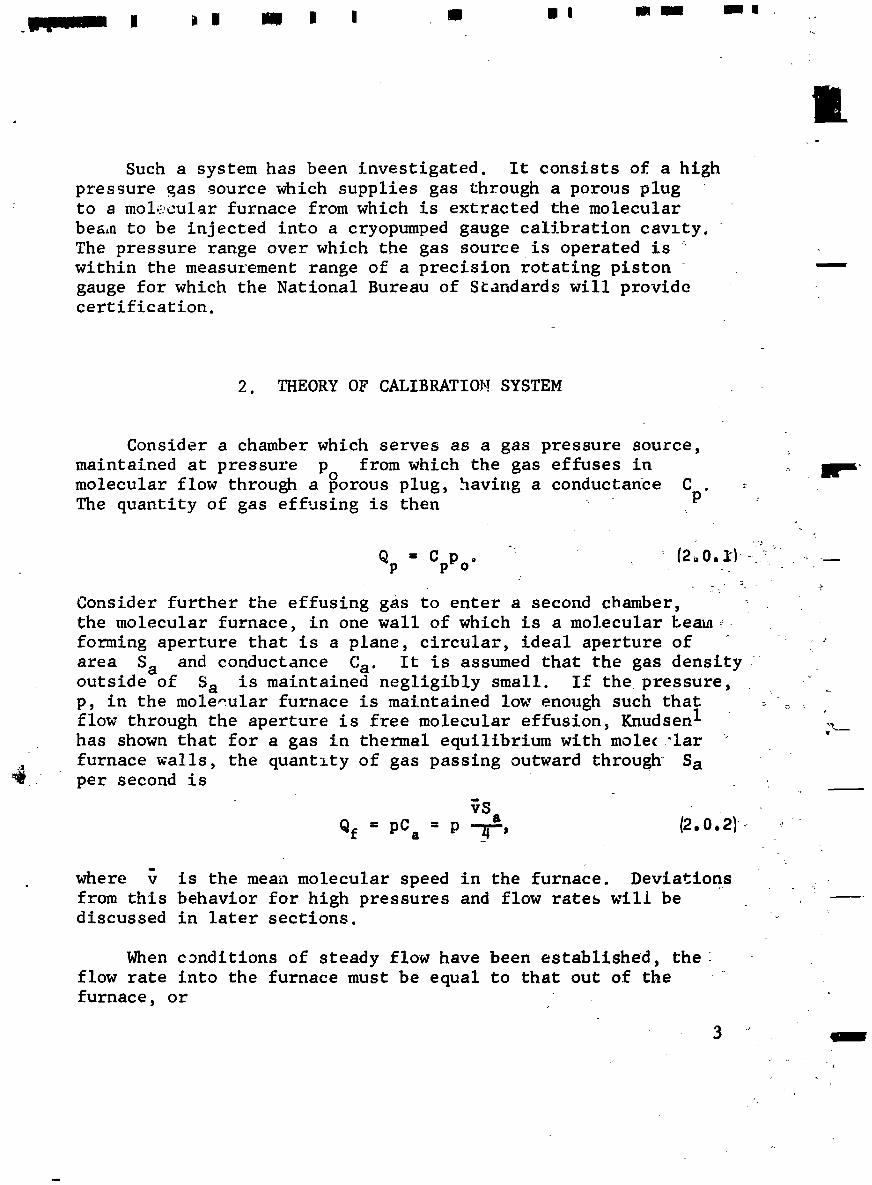
Such a system has been investigated. It consists of a high
pressure Bas source which supplies gas through a porous plug: to a molecular furnace from which is extracted the molecular
beam to be injected into a cryopumped gauge calibration cavzty,
The pressure range over which the gas source is operated is _
within the measurement range of a precision rotating pistongauge for which the National Bureau of Standards will providecertification.
2. THEORY OF CALIBRATION SYSTEM
Consider a chamber which serves as a gas pressure source,
maintained at pressure Po from which the gas effuses in _ p_molecular flow through a porous plug, having a conductance C . =
The quantity of gas effusing is then _P
t
= C p _ : (2_,0.1"1_ _'"Qp p o ° _. - .-_,._
Consider further the effusing gas to enter a second chamber,
the molecular furnace, in one wall of which is a molecular Lemn_
forming aperture that is a plane, circular, ideal aperture of _ = _"
area Sa and conductance. Ca . It is assumed that the gas density :outside of Sa is mazntazned negligibly small. If the pressure, -_:_p, in the molecular furnace is maintained low enough such that .-._.
flow through the aperture is free molecular effusion, Knudsen I ___has shown that for a gas in thermal equilibrium with molec "lar
furnace walls, the quantzty of gas passing outward through Sa__ " per second is •
Qf = pCa = p -..._, (2.0.2)- '_'
where v is the mean molecular speed in the furnace. Deviations
from this behavior for high pressures and flow rate_ will bediscussed in later sections.
When conditions of steady flow have been established, the _
flow rate into the furnace must be equal to that out of the
furnace, or
1966018675-010
I
= pC o (2 0 3)PoCp a ° •
Anticipating the requirements of a wide range calibration
system, and therefore a large pressure attenuation between the
gas source and the molecular furnace, a second aperture of con-
ductance, C is introduced in the molecular furnace wall so that
in place of EquationI2.0.3!, we have
po c = p(C + C )o (2.0.4)p a
Out of the beam aperture in the furnace, the moleculeseffuse into the half space beyond with a flux distribution,
in the limit that the mean free path of furnace molecules is
very large compared to _he aperture dimensions, given by 2
= S v n cos e dN• a _ , (2oOo5)
where dm is the elementary solid angle at an angle 0 with
the axis of the beam (aperture normal).
[Now, for a detector of area Ab distant _ along the
normal to the orifice, the above flux also is given by
= nbAb_b' {2o0o6)
where nb is the beam density and vb is the mean beam velocity.ExpressionI2.0.61 is seen to hold for _ sufficiently large that
the molecular velocity is axial. Quantitatively, the require-
ment is that the cosine of the half angle subtended at orifice
Sa by the detector be sufficiently close to unity. For mostgauges it is thus required that _ _ 20 cm fur the cosine to
differ from unity by less than 1/2%. The method of dealing withsmaller L will be discussed below.
Comparing Equations (2.051and {2.061and noting that the solid -
subtended by Ab is Ab/_ 2, it is found that the molecu-_gle
lar beam density on the axis of the beam is _,_
nb= _ _2 vb
Li
1966018675-011
As is shown in Appendix I, the mean molecular speed in thefurnace is related to that in the beam by
= 8 ;b" (2.0.8)
Substitution of Equation _.0.8) into Equation(2.0.71 gives, for
a circular aperture of radius ra,
n b = _ n. (2.0.9_
Q
Although the gas molecules have a mean velocity vb withrespect to a stationary observer (i.e., the gauge to be calibrated),
this velocity is negligible compared to the velocity of the
ionizing electrons which generate the gauge ion current. Thus,
the gas molecules appear stationary in comparison to Jynamic
operation of the gauge. In addition, for ordinary molecular
beam velocities, the average kinetic energy that an ion has
immediately after ionization is not substantially different from
the average kinetic energy that an ion formed from an equilibriumgas molecule would have. Therefore, the ion collection efficiency
_ of the gauge is the same for beam molecules as for equi]ibriumgas molecules. The ionization gauge, which measures molecular
density, therefore cannot distinguish between a non-equilibrium
gas such as in a moderate temperature molecular beam and an
equilibrium gas. Thus, although Equation {2.0.9)was demived interms of density, the ideal gas law,
p = nkT, (2.0.10)
may be used to restate Equation (2.0.9)in terms of the equilibrium
pressure of a gas of density equal to the beam density. Thus,
' Pb 3, P" (2.0.111
Finally, combining Equations (2. O. 4) and {2.0.1]J yields an equationthat may be considered the calibration equation:
°,Pb = _ C + Ca Po" (2.0.12)
5
1966018675-012
I I
2.1 Gauge Enclosure Method
An assumption implicit in this derivation has been that
the beam density is constant over the voiL_ne of the gauge ion
collectir,_g structure (e.g., within the grid cage of a Bayard-
Alpert gauge). Considering separately the density variationsperpendicular to and parallel to the beam axis, the forme_ is
seen from Equation {2.0.51 to be negligible as long as cos _ issufficiently close to unity, where 0 is the angle at the
f..
aperture subtended by the gauge, whil_ the latter may be in-vestigated by applying Equation {2.0.9)to two different values
of f. Let _I and t2 represent, for example, the midpoint
and one extremity of the ionizing region of length L. The
ratio of densities at these points is given by (for large t )
2
n(t'2) tl L
n-T_ = (2.i.i)Thus, there exists a minimum distance of approach of the gauge
to the molecular beam aperture if an unacceptable non-uniformity
in the gas density distribution within the gauge is to be
avoided. But to obtain a sufficiently large variation in beam
density by varying _, the calibration apparatus becomes longand cumbersome, since the range of beam density variation is
proportional to t2
max {2.1.2)2 "_mtn
For example, if less than 1/27o error is required in this term,
then for L = 4 cm, _i > 800 cm. The error at _ = 200 cm is 2%.
As an alternative method, an isothermal enclosure can be
placed around the gauge such that the molecular beam is trans-
formed to an equilibrium gas upon entering the enclosure, thuseliminating the density variation associated with the non-
equilibrium beam. This has the further desirability that it maybe used in calibrating gauges that would otherwise, due to theirgeometry, strongly scatter the molecular beam.
Figure I is a schematic of such a calibration system asdescribed above. In the next two sections, a mathematical
analysis of that calibration system and of the accumulated
probable error in the gauge enclosure pressure will be presented.
6
1966018675-013
7
i
1966018675-014
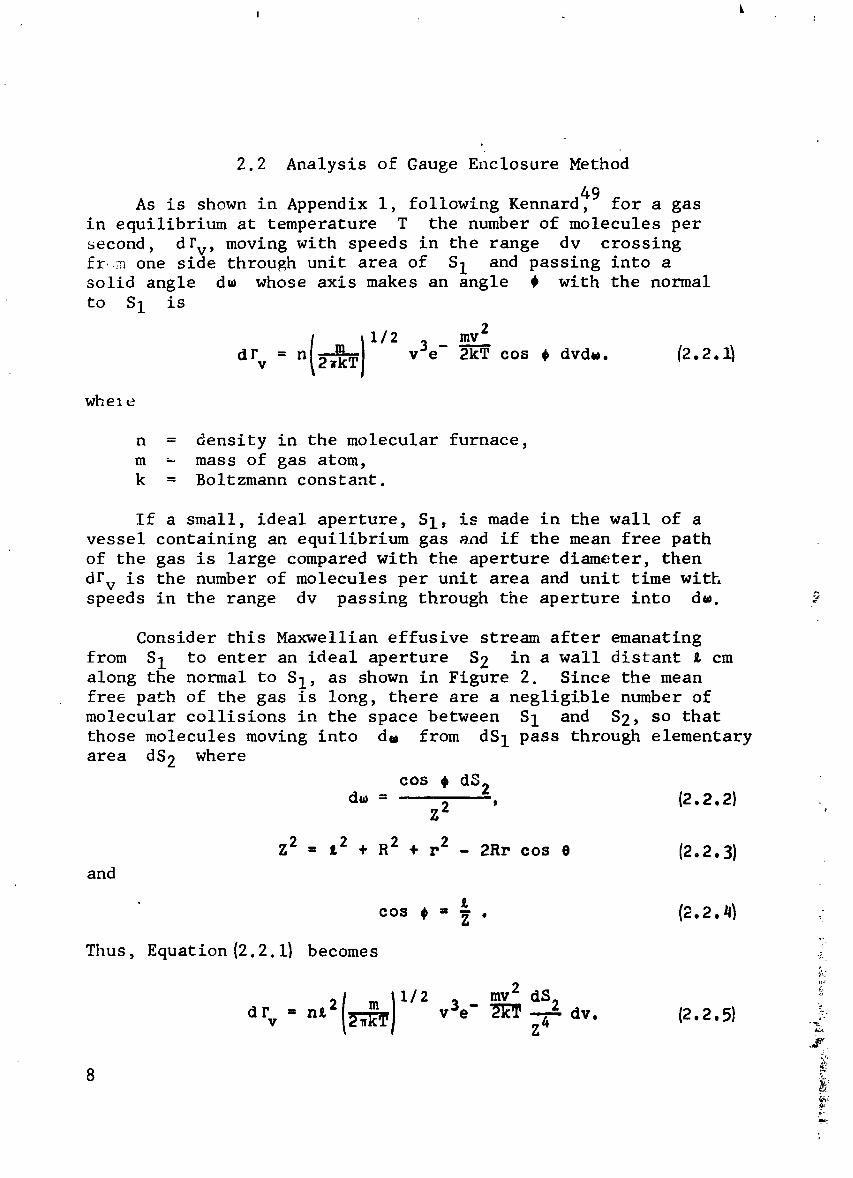
2.2 Analysis of Gauge Enclosure Method
As is shown in Appendix I, following Kennard@ 9 for a gas
in equilibrium at temperature T the number of molecules per
second, drv, moving with speeds in the range dv crossingfrm one side through unit area of SI and passing into asolid angle dw whose axis makes an angle , with the normal
to SI is
1/2 mv2
dr= n(2-_kTI v3e - _ cos, dvd.. (2.2._V
where
n = density in the molecular furnace,
m _ mass of gas atom,k = Boltzmann constant.
If a small, ideal aperture, SI, is made in the wall of avessel containing an equilibrium gas and if the mean free path
of the gas is large compared with the aperture diameter, then
drv is the number of molecules per unit area and unit time withspeeds in the range dv passing through the aperture into dw. #
Consider this Maxwellian effusive stream after emanating
from S 1 to enter an ideal aperture S 2 in a wall distant A cmalong the normal to SI, as shown in Figure 2. Since the meanfree path of the gas is long, there are a negligible number of
molecular collisions in the space between SI and $2, so that
those molecules moving into dm from dS 1 pass through elementaryarea dS 2 where
cos , dS2d_ = - 12.2.21
7.2 '
Z2 = i2 + R 2 + r2 - 2Rr cos e (2.2.31and
cos + - t_ (2 2.41Z @ @ +++
Y
Thus, Equation (2.2.11 becomes _?t
- _ vae- z4 dv. (2.2.5) .._+i.+
1966018675-015
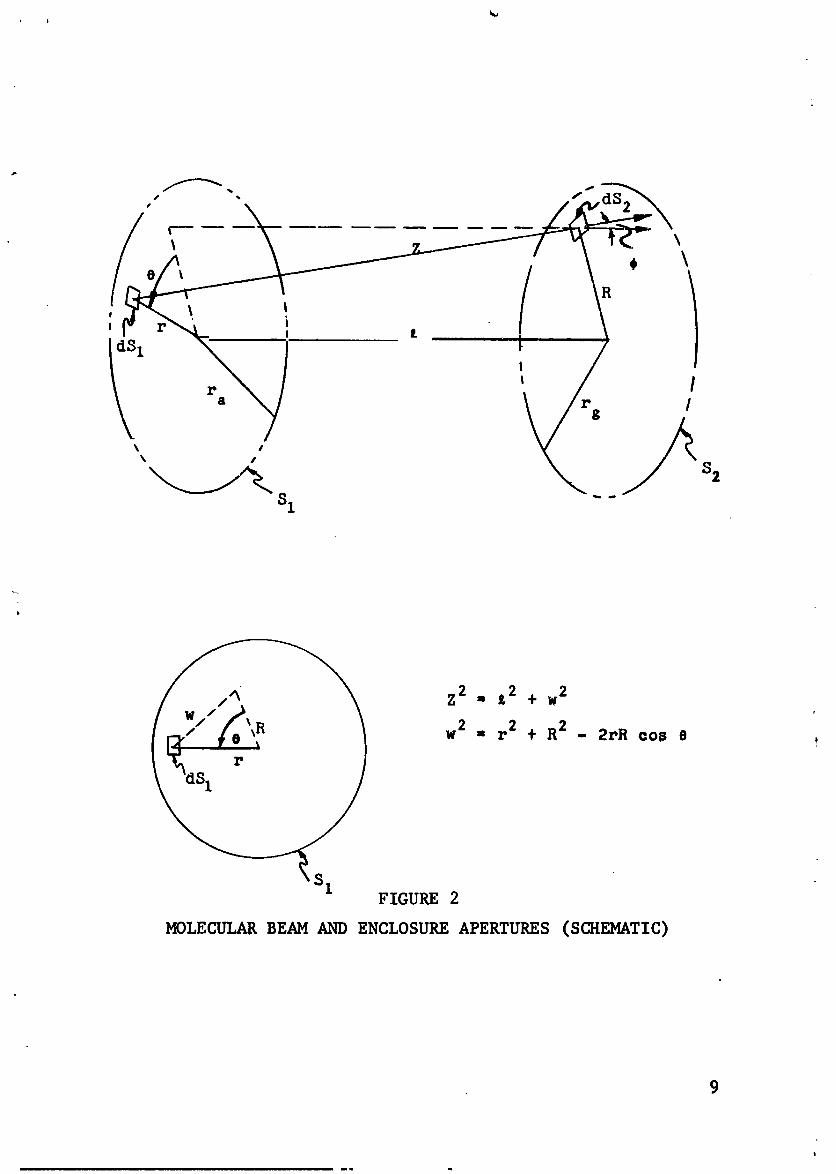
Z 2 = jL2 + w2
w2 = r 2 + R2 - 2rR cos e !,
FIGURE 2
MOLECULAR BEAM AND ENCLOSURE APERTURES (SCHEMATIC)
9
I
mm m
1966018675-016
Integrating over the velocity spectrum gives the total
number of molecules per unit area and per second, dr, leaving
dS I and entering dS 2
® dr n_2 igkT 11/2 dS 2_r = _v dv= ,_- t_- j z-;- (2.2.6)o dv
Now, as shown in Appendix I, the mean molecular speed in thefurnace is
(8kTf 11/2_f= _-r_-I ;
therefore,
nr_f _2 dS2
dr = _ (_Z + R2 + r 2 _ 2Rr cos e) 2 " (2.2.7)
The total molecular flux contribution into dS 2 from all theaperture area SI is then,
f nvf IL2 o_f_.f_.a,, = dr a_1 = -- r at, ae ,, (a.2 8)4_ (_2 + R 2 + r2 _ 2Rr cos e)2 " "
S I o o
Using Dwight 446.03 and 859.2, and integrating with respect togives
(2.2.9)
l -i • •"iAfter some manipulation and change of varia les to
u = R2 - _2 _ r 2 {2.2 101<
Equation {2.2.9}may be written
£2 2 r 2)a (u- 2R2)dudv n_f /Fu(R2-_ - {2.2.11_ !i.
dS---'_ _ u_(a2__2) (u2 * 4R2L2)3/z" ;,_Using Dwight 200.03 and 201.03 to evaluate this integral, gives _
I0 '_
y-
i
1966018675-017
L
Now, integrating the molecular flux into dS2, over all of
aperture $2, gives the total numbe= of molecules entering S2per unit time
NS _dS2 dS 12(In)
S2 (2.2.13)
- ra 2.RdR.
o
R2 _2 r2Changing variables to u = + + and using Dwight 380.011ato evaluate the integral gives
112_
- ngf I 4r2 r2 ]• gs = T "(r2 + r2 + _2) 1 - 1 - . a '. 12.2 14)
a S (r2 + r2 + _2)2 '2(In) a g
In this application, the.enclosure.radius rg must bemaintained large enough that ionic pumplng does not introduce
large errors in enclosure pressure. For a Bayard-Alpert structure
this requires rg = 0.8 cm and for a Redhead structure, rg = 3.1 cm.If, to minimize scattering, the closest approach of the enclosureto the furnace aperture is fixed at 9 cm and the practical upper
limit for the furnace aperture is fixed at ra - .75 cm, then thequantity in square brackets in Equation{2.2.1_ is approximately
equal to one, since
4r 2 r 2
a g < _ (2.2.15)(r2a + r_ + _2)2-
Therefore, to better than 1/4% the square bracket in Equation
_.2.141may be expanded in a binomial series in which all but thefirst two terms are neglected. Equation (2.2.1_ then becomes
1966018675-018
n_¢ _ r 2 r 2= f a _ o (2.2.16)
Ns2(.f ) (r2 + r2 +g
The beam molecules, after being randomized in the gauge enclosure
at temper ture Tg, then re-emerge from the enclosure aperture asa molecular beam. The number of molecules effusing per second is1
o + g_r2gNS2 = ng _ . (202.17)(Our)
In addition, in the process of its operation, an ion gauge drivesgas into the gauge elements with an effective pumping speed,S(cm3/sec), so that when the molecular density in the gauge en-closure reaches equilibrium,
NS2 = NS + Sngo (2.2°18}(zn) 2(Our)
Therefore, substituting Equations (2.2. 161, {2.2.17) intoEquation {2.2.18), it is found that
- n = a no 12.2.19} (
,r _g a g
But the constraint has already been imposed that
_ r 2 >> So (202,20)g
Therefore, Equation {2.2.191may be written
_f r 2a= _-- , no (2 2 211
ng g ;2 + r2 + '¢2 ' "g g
Now, Appendix i shows
Tf / 112= , 12.2.22)
and since the molecular density in the furnace is related tothat in the isothermal gas source by (Equation (2.0.4))
C _P
n = C + C no' (2.2.231
12 !.
1966018675-019
where,
Cp = porous plug conductance,
C = furnace attenuation aperture conductance, and
Ca = furna°ce beam aperture conductance,
then, the steady state molecular density in the gauge enclosure
is given by
= .....a (2.2 24_r + r + £2 C + Ca n "
Followit,_ the reasoning in Section 2.0, Equation [2.2.241may
be expressed in terms of p,'essure using Equation (2.0.i01, so that
finally
.___.( 11/2 r 2 cp 2.2.25);,.. _Pg _-gl r2 + r + A2 C + Ca Po'a g
2.3 Probable Error in Calculated Pressure
Equation(2.2.25) is the expression for the pressure in the
gauge enclosure. If Rpg is the probable error in the meanvalue of the pressure, then the relative probable error,
rpg = _g/pg, in the mean value of pg is
f
2
(2.3.zl
2 + 2 :
l_Ca R2 + R2 + R2 + RT+ Ca laPo/ Po i_rgl rg f RTg
13
1966018675-020
In Equation (2.3oliand what follows, the mean value is to beinferred for each variable; however, the mean value notation
(e,g., x) will be deleted.
Calculating from Equation (2.2.25_ the partial derivatives
required in Equation (2.3.11,and dividing by pg yields
2 2+ £
pg @ra ra (r2 + r2 + £2) pg @T 2Ta g g g
@r r2 + r2 + £2 pg aC CPg g a a P P
i _Pg= _ -2£ I_ ._ = _ 1
pg _o r2a + r2g + _2 pg _C C + Ca
__1 _ 1pg _Tf 2Tf pg @C C + Ca a
Pg _Po Po
_2.3o2)
Substituting these into Equation (2.3.1)and remembering that
rx = Rx/X , it is found, assuming for the length measurements
rra = rrg = r£ and for the temperature measurements ZTf = rTg ,
that
14
f
,mm._n.._ •
1966018675-021
l
I 4 (CL �€�"
r2gt2 + r+R) -2 2 C2r28(t +
= r2 r2)2 r2 + ½ r2 + 2 + ..... )2 (u r c + )rpg "(t2 + + r a Tf a Ca g rCp a
1/2+ r 2 . {2.3.3}
Po
Now Ca = bTf I/2 r2a' where b i_ a constant, --
(2.3.4)so, following the procedure of Equation (2.3.11gives
2 = 1/4 r 2 + £1r2rarca Tf ' (2.3, 5)
and since assuming that since the measurements are similar,
r c - r c. (2.3.6)a
Now, since 02 + 02
..... a _ z, (_',3.7)(C + Ca)2
it is seen hat Equation (2.3.3)becomes
rpg _ L ( r2a + r2g + _2)2 + It ra Tf rCp p.3 B)
Now, as will be more fully described in Section 3, Cp isobtained from the decay of pressure Po in the gas sourcevolume, V, from times 0 to T, that is,
Po(O)C = V tn (2.3.9} "
p z po ('r) "
Therefore, following the procedure of Equation (2.3.I}and
assuming for both pressure measurements that (0) = (*) "give s rpo rP° rP°
e
I[.
15
i ,,i
1966018675-022
f_, Po (O)] -22 2 + r2 + 2 n _j r_o. (2.3.10)rCp = PV T
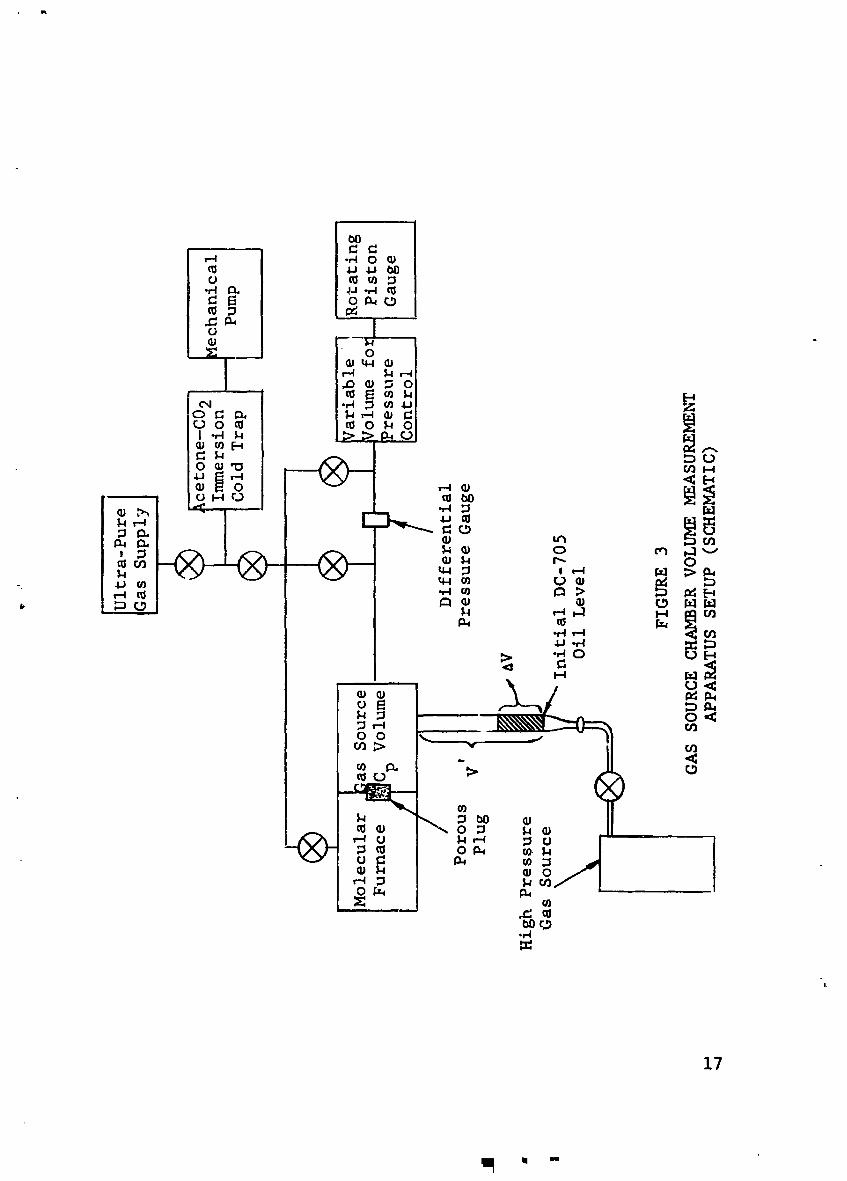
As will also be described in Section 3, the volume, V, of
the pressure source is determined by measuring the pressure
change Ap = Pl.- P2 when the volume of the system is changed byAV = V 1 - V2 by means of a precision burette. A schematic ofthe experimental setup is shown in Figure 3. The initial volume
of the system is
' - " kmx (23 11)V1 = V + V Pl i • •
and the volume after increasing the diffusion pump oil level in
the precision burette is
, NkT2 (2.3.12)V 2 V + V - AV - P2
where V' is the unused volume of the burette during measure-
ment of PI" Simultaneous solution of {2.3.II) and (2.3.12) yields
| "-
V = aV - V (2.3.13)
P2TI/
Thus, following the procedure of Equation (2.3.i),we have
(AV)2-2 2 2 (,AV)2-2 2-2 2,]
TIP2Pl R 2 + "1'IP2'1'2R 2 + II . (2.3.14)+ (TIP2- PIT2 )_ T2 (TIP2 PIT2 )4 Pl
c16
1966018675-023
i,
17
_ ul m
1966018675-024
Now, since they are similar measurements, we may take
RTI = RT2 and _I = _2 and then Equation (2.3.14} becomes
2 ...._ I[ T_p_Av )2
- r 2
LIT.,p2 p._T:,lAv- v
(PlP2TIT2 AV)2 [ ] '2 1
_ r 2 + r2 + V 2 (2 3 15)+ 2 -(TIP 2 PIT2)4 T1 Pl rY_ " " "
Thus, finally, substituting Equations _.3.10) and _.3.15) into
Equation(2.3.8}gives the relative probable error rpg in themean value of the gauge enclosure pressure:
[8(I 4 + r212 + r_) r2 + 1 + 2 9.n, I_ -g - +, +_r 2rpg_ (r2 + r 2 + L2)2 r a Tf Po(,) r °
u a g
2
(PlP2TIT2 aV) 2 / 1/2[ ] ,'• r2 + r2 + v 2J (2.%.161+ 2 (TII_2 ,_ Pi%2)4 TI Pl rv' " "
18
1966018675-025
A numerical estimate of the accumulated probable error was
made from Equation {2.3.16), b_sed on the assumption that theprobable errors in the individual measurements can be maintained
at the following levels: length <_0.5%, time <_0.1%, temperature0.5%, and pressure _ 0.03%. Experience with the development
of this calibration system r indicates that such probable errors
can be maintained in practice. It was assumed t',at the dat_
formed an adequate statistical sample. The results, indicate
thatl an accumulated probable error of calibration of not greaterthan 5% is attainable.
3. POROUS PLUG
As discussed in Section 2, a porous plug is introducedbetween the gas pressure source and molecular furnace to provide
pressure attenuation. The flow properties of porous materials
have been extensively studied. 3, 4, 5, 14, 15, 19 In many
porous media, the character of the flow makes the transition
from viscous to molecular flow as gas proceeds through the
porous material. Such a transition naturally depends uponthe upstream and downstream pressure and the characteristic
dimensions of the pores. By choosing a material with an effective
pore diameter, dp, sufficiently small compared to the mean freepath, _ , of the gas at the upstream surface of the porous plug,
molecular flow conditions can be maintained throughout the
entire porous plug; thus, the throughput is a linear function
of the pressure differential across the porous material. This
latter condition of linearity is highly desirable in a gauge
calibration system.
3.1 Porous Vycor Glass
One of the stages in the development of Vycor is a porous
_ilicic network obtained by leaching of borosilicate glass. 6After once cycling to high temperatures (up to about 700°C),
this porous structure is reported 7, 8 to be stable with respect
to repeated cycles to lower temperatures. Because of its tempera-
ture stability, porous Vycor is a very suitable material for apressure attenuator in a wide range calibration system since
high temperature degessing is essential to proper system per-formance.
19
1966018675-026
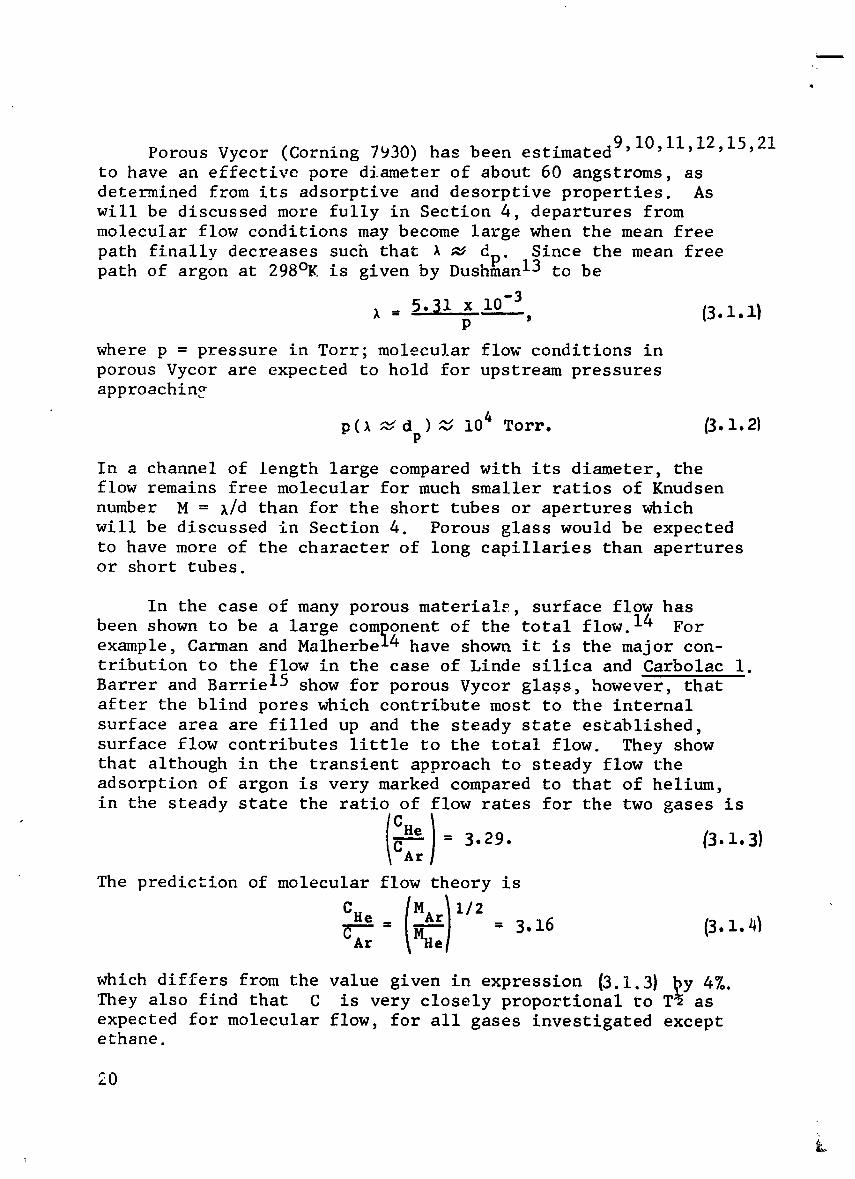
Porous Vycor (Corning 7930) has been estimated 9'I0'II'12'15'21
to have an effective pore diameter of about 60 angstroms, asdetermined from its adsorptive and desorptive properties. As
will be discussed more fully in Section 4, departures from
molecular flow conditions may become large when the mean free
path finally decreases such that A _ d.. Since the mean free
path of argon at 298°K is given by Dush_an 13 to be
= 5.31 x 10⁻³• -----, {3.1.11P
where p = pressure in Tort; molecu].ar flow conditions in
porous Vycor are expected to hold for upstream pressures
approaching
p(_ _ d )_ 104 Tort. (3.1.21P
In a channel of length large compared with its diameter, theflow remains free molecular for much smaller ratios of Knudsen
number M = l/d than for the short tubes or apertures which
will be discussed in Section 4. Porous glass would be expected
to have more of the character of long capillaries than aperturesor short tubes.
In the case of many porous materials, surface flow has
been shown to be a large component of the total flow. 14 Forexample, Carman and Malherbe 4 have shown it is the major con-tribution to the flow in the case of Linde silica and Carbolac i.
Barrer and Barrie 15 show for porous Vycor glass, however, thatafter the blind pores which contribute most to the internal
surface area are filled up and the steady state established,
surface flow contributes little to the total flow. They showthat although in the transient approach to steady flow the
adsorption of argon is very marked compared to that of helium,
in the steady state the ratio of flow rates for the two gases is
CAr = 3.29. _.I.3)
The prediction of molecular flow theory is
--= = 3.16 (3.1.41CAr MHe
which differs from the value given in expression (3.1.3) _y 4%.They also find that C is very closely proportlonal to T_ as
expected for molecular flow, for all gases investigated exceptethane.
2O
i
1966018675-027
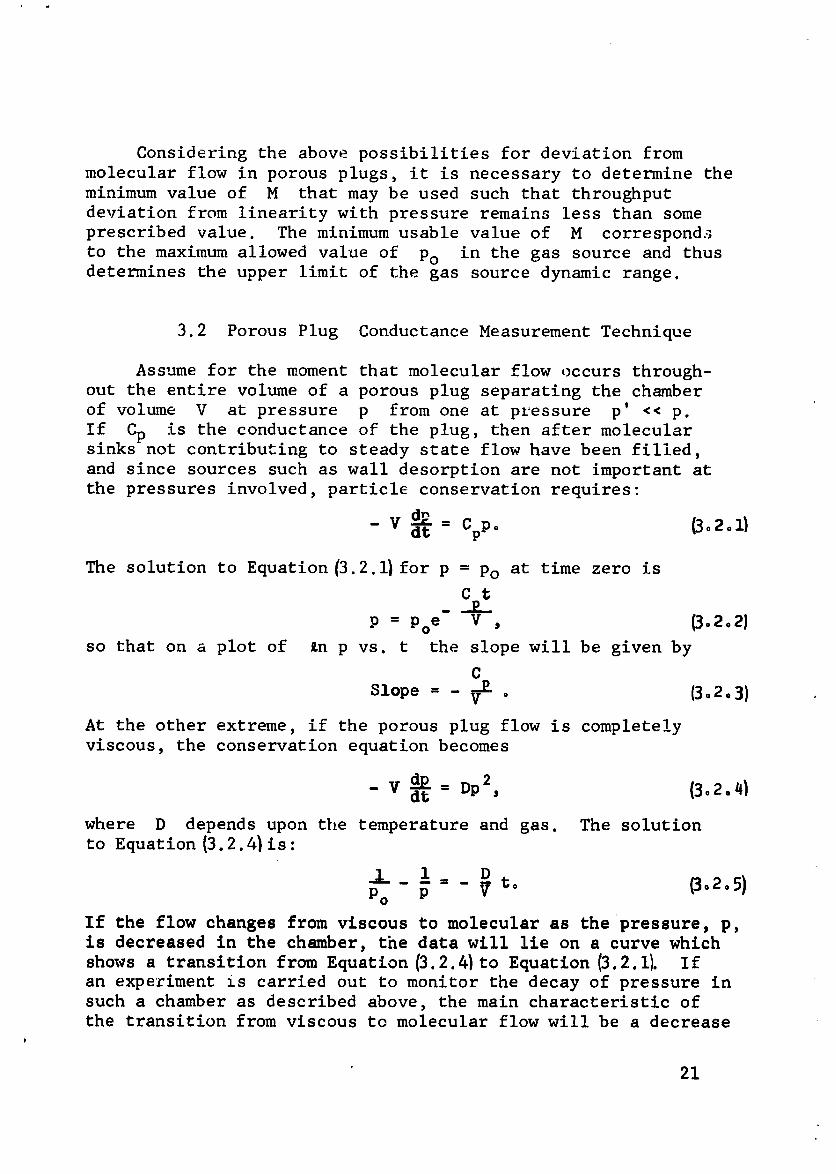
Considering the above possibilities for deviation from
molecular flow in porous plugs, it is necessary to determine the
minimum value of M that may be used such that throughput
deviation from linearity with pressure remains less than some
prescribed value. The minimum usable value of M corresponds
to the maximum allowed value of Po in the gas source and thusdetermines the upper limit of the gas source dynamic range.
3.2 Porous Plug Conductance Measurement Technique
Assume for the moment that molecular flow occurs through-
out the entire volume of a porous plug separating the chamberof volume V at pressure p from one at pressure p' << p.
If Cp is the conductance of the plug, then after molecularsinks not contributing to steady state flow have been filled,
and since sources such as wall desorption are not important at
the pressures involved, particle conservation requires:
Cppo B02oII
The solution to Equation 13.2_i)for p = Po at time zero is
Ct__2._
p - po e V , (3o2o2}
so that on a plot of _n p vs. t the slope will be given by
O
Slope - - _E o (3°2.3)
At the other extreme, if the porous plug flow is completely
viscous, the conservation equation becomes
_ V d-P..= Dp 2dt ' (3o 2.4)
where D depends upon the temperature and gas. The solution
to Equation (3.2.4) is :
DPo F- - V to (3.2.s)
If the flow changes from viscous to molecular as the pressure, p,is decreased in the chamber, the data will lie on a curve which
shows a transition from Equation {3.2.41to Equation (3.2.i). Ifan experiment is carried out to monitor the decay of pressure in
such a chamber as described above, the main characteristic ofthe transition from viscous to molecular flow will be a decrease
P
21
1966018675-028
in the absolute value of the slope of Zn p vs. t until at low
enough pressures the slope becomes constant and equal to - Cp/V.
3.3 Determination of Porous Glass Flow Properties
Such an experiment was carried out for two separate porous
Vycor plugs. Figures 4 and 5 show the two plugs, the first ofwhich is in the form of a porous tip on the end of a test tube
structure. Several grades of glass were used in this plug,
the last being Corning 7052 for sealing to a Kovar tube welded
to the gold o-ring sealed flange used to join it to the gas
source. The second plug, Figure 5, was in the form of a I inchdiameter, right circular cylinder of rolled porous Vycor. The
cylinder which is about 0.135 inches thick was mounted in pureindium contained in a Cajon connector VC-16. The connector
brazed to a gold o-ring sealed flange is shown in Figure 6mounted on the wall of the molecular furnace.
During the manufacture of porous plugs and while they aremaintained under normal atmospheric conditions, various con-
taminants are adsorbed in ._e pores. The plugs take on a 16 17yellowish or brownish color and upon heating become dark brown. '
In order to clean up this adsorbed material, Corning Glass Company,
the manufacturer, advised heating the plug to 500°C in oxygenuntil the color clears up. The furnace shown in Figure 7, with
porous plug #I installed, was constructed so that oxygen passing
through a dry ice acetone immersion cold trap was continuously
forced through the porous plug, and at the same time, another
similarly treated oxygen line supplied oxygen at a lower pressure
to the exterior of the plug. The temperature was increased at
a rate not exceeding 100°C per hour to 425°C. The temperature
was measured by a thermocouple inside the porous end of the tube.
During the first 8 hours of heating in oxygen, the color of
the porous glass varied among yellow, brown, and red. Theheating and flushing was continued to a total of 24 hours after
which time the porous glass had a translucent appearance with
a slight blue color when illuminated with white light. Thedisc-type porous plug, #2, was similarly heat treated, being
mounted in the furnace as shown in Figure 8. Both plugs were
maintained in the purified oxygen environment until they were
installed in the prototype calibration system and during this
installation they were bathed in a flow of dry argon, nitrogen,or helium.
2
1966018675-029
23
1966018675-030
24
1966018675-031
., #
I
' L
°
/
. a'
°
8
t
r4_
--..%..
-\
................ L
FIGURE 6POROUS PLUG #2 IN COMFRESSION MOUNTING
. 25
IJ
1966018675-032
26
1966018675-033
t
, 27
' r'
1966018675-034
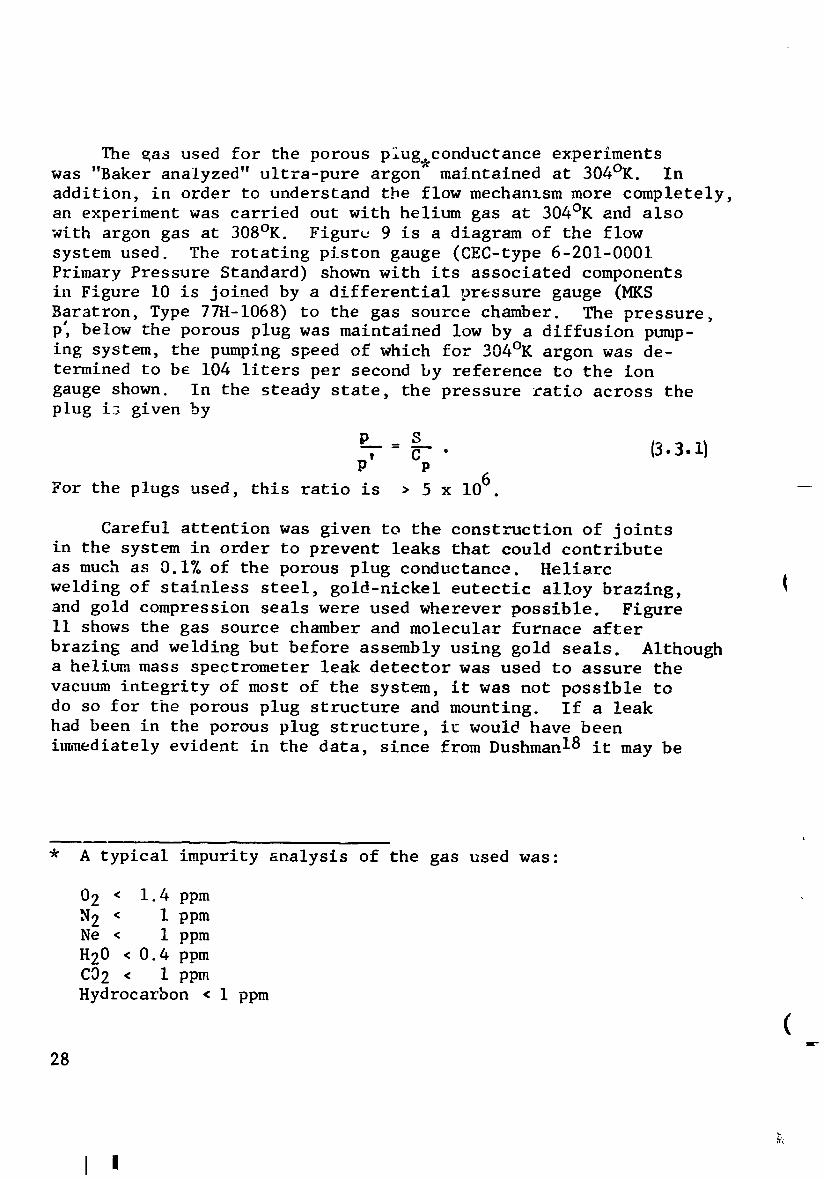
The Kas used for the porous plug, conductance experimentswas "Baker analyzed" ultra-pure argon maintained at 304°K. Inaddition, in order to understand the flow mechanlsm more completely,
an experiment was carried out with helium gas at 304°K and also
with argon gas at 308°K. Figuru 9 is a diagram of the flow
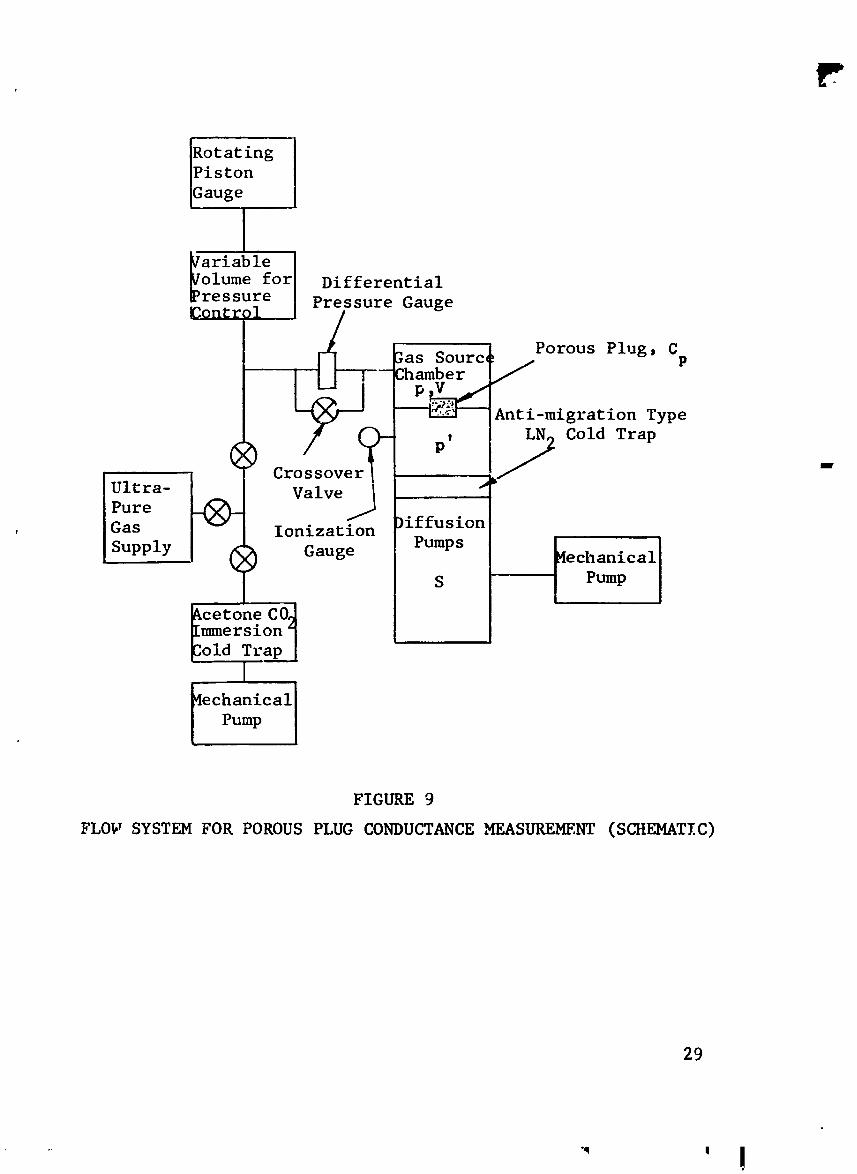
system used. The rotating piston gauge (CEC-type 6-201-0001
Primary Pressure Standard) shown with its associated components
in Figure I0 is joined by a differential pressure gauge (MKS
Baratron, Type 77H-I068) to the gas source chamber. The pressure,p, below the porous plug was maintained low by a diffusion pump-ing system, the pumping speed of which for 304°K argon was de-
termined to be 104 liters per second by reference to the iongauge shown. In the steady state, the pressure ratio across the
plug i_ given by
P _ S, C " (3.3.i)
P P
For the plugs used, this ratio is > 5 x 10⁶ . --
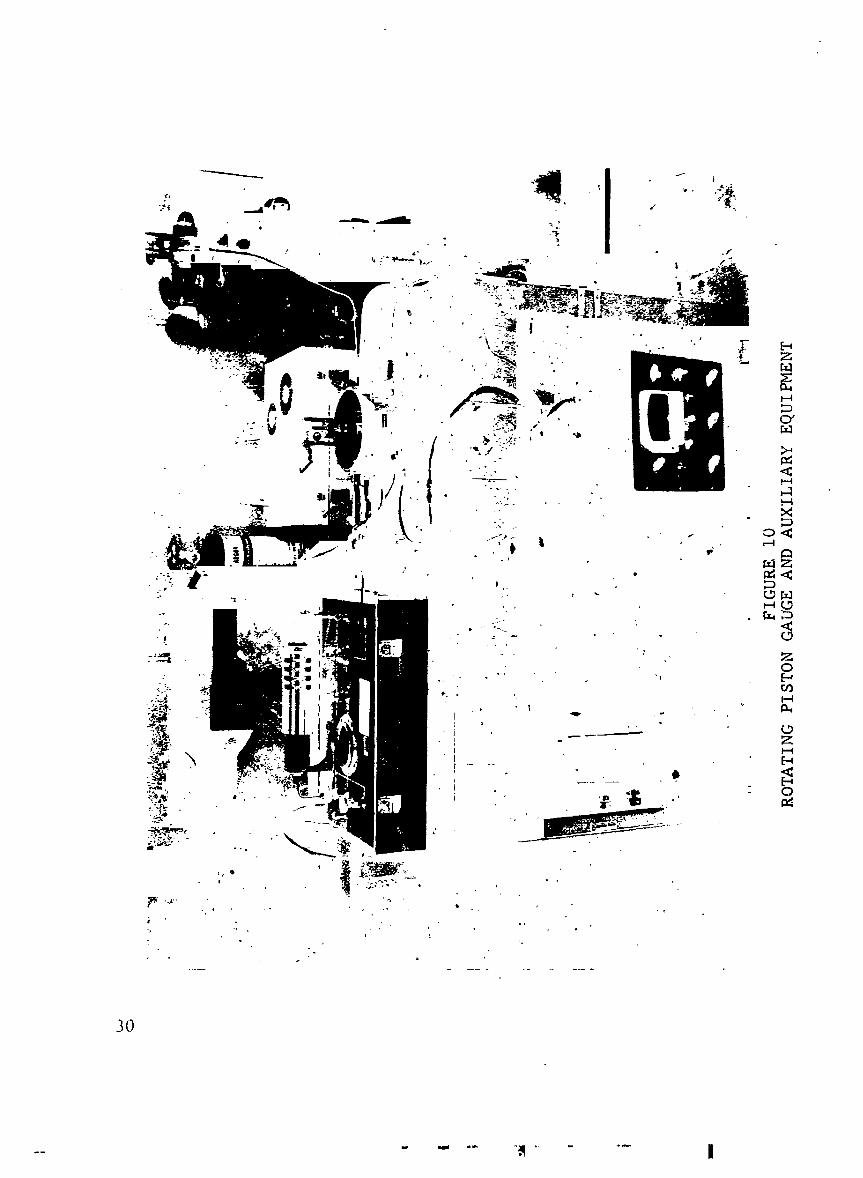
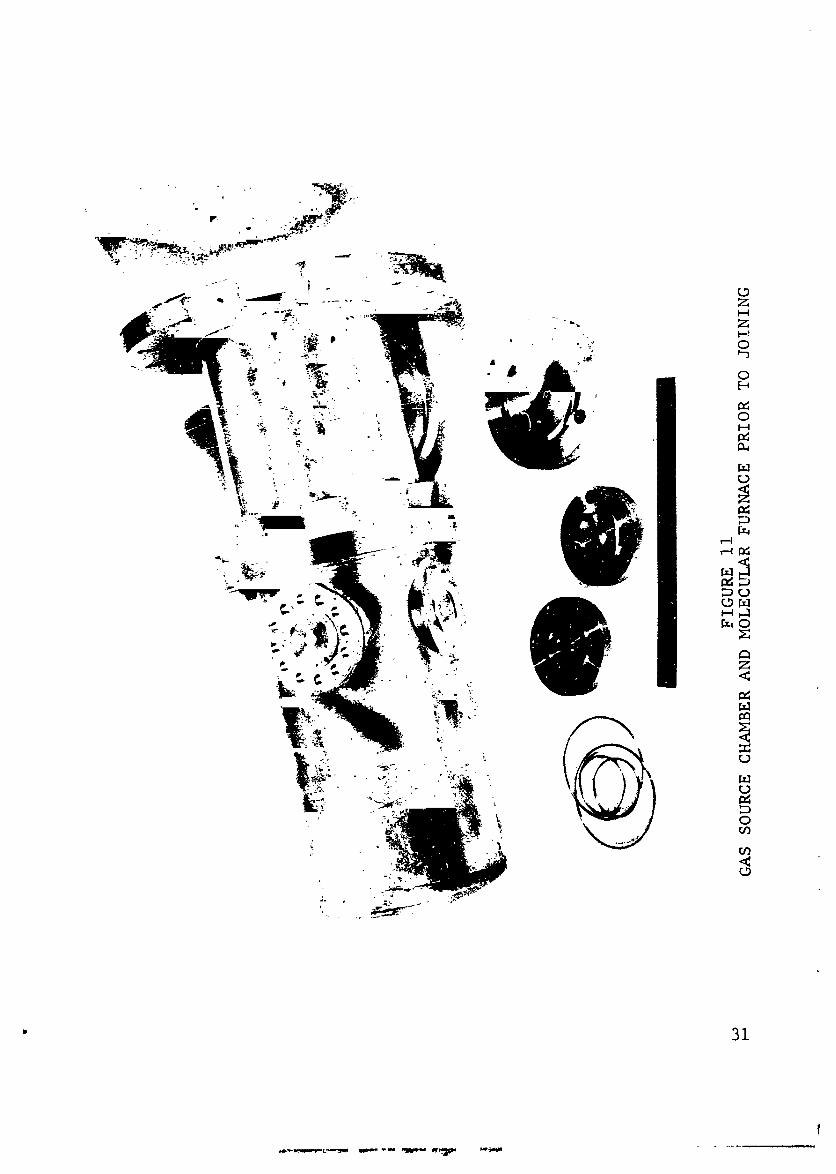
Careful attention was given to the construction of jointsin the system in order to prevent leaks that could contribute
as much as 0.1% of the porous plug conductance. Heliarc
welding of stainless steel, gold-nickel eutectic alloy brazing,
and gold compression seals were used wherever possible. FigureIi shows the gas source chamber and molecular furnace after
brazing and welding but before assembly using gold seals. Althougha helium mass spectrometer leak detector was used to assure the
vacuum integrity of most of the system, it was not possible to
do so for the porous plug structure and mounting. If a leakhad been in the porous plug structure, iu would have been
immediately evident in the data, since from Dushman 18 it may be
* A typical impurity analysis of the gas used was:
02 < 1.4 ppm
N2 < I ppmNe < I ppm
H20 < 0.4 ppmC02 < I ppm
Hydrocarbon < I ppm
(28
I i
1966018675-035
Rotating
Piston
auge
ariable
olume for Differentialressure Pressure Gauge
_ontrol
3as Sourcq Porous Plug, Cp--Chamber
P---___nti-migration Type
Ultra-Pure
, Gas lon_m_tion Diffusion
Supply Gauge Pumps _echanical
S Pump
_cetone
Immersi_O_Fold Trap |
I_echanieal
Pump
FIGURE 9
FLOW SYSTEM FOR POROUS PLUG CONDUCTANCE MEASUREMENT (SCHEMATIC)
29
1966018675-036
3O
1966018675-037
31
"_ "" 196601867 5-
calculated that the diameter of a capillary in a 0.i cm wall (
necessar_ to give 0.1% of the conductance of the plug used(2 x 10-J lilers/sec) is, approximately,
d = 6 x 10 -4 cm. (3.3.2)
Since the mean free path in the gas source chamber is orders of
magnitude smaller than this, the flow would have a definitely
viscous behavior and the conductance would show large variationswith pressure.
After evacuation of the gas source chamber and gauges, theentire system was pressurized with ultra-pure gas. The differential
pressure gauge was then calibrated for zero differential and
the crossover valve closed, isolating the gas source chamber
from the rotating piston gauge through the differential pressure
gauge diaphragm. This part of the procedure is necessary since
the leakage between the piston and cylinder (gas lubrication) was
of the same order of magnitude as the conductance of the porousplug and would introduce a very large error in the measured value
of Cp if this leakage path were not blocked. As the gasdiffused through the porous plug, the chamber pressure decay was
monitored with the rotating piston gauge. There was not infinite (resolution of pressure with the piston gauge since the measure-
ment involves adding incremental weights to the rotated piston
or cylinder. Therefore, the procedure in making the measurement
was to maintain the piston floating with the appropriate weights
for the next lowest pressure to be arrived at in the decay ofchamber" pressure. The pressure differential between the pistongauge and the chamber was monitored and the time that the differ-
ential becomes zero was observed. The zero point had been
previously calibrated as mentioned above. Experience had shownthat the Baratron zero drift was less than 10-3 Torr over an
experiment lasting for several days. This procedure was then
carried out for incremental decreases in weight of the pistonor cylinder.
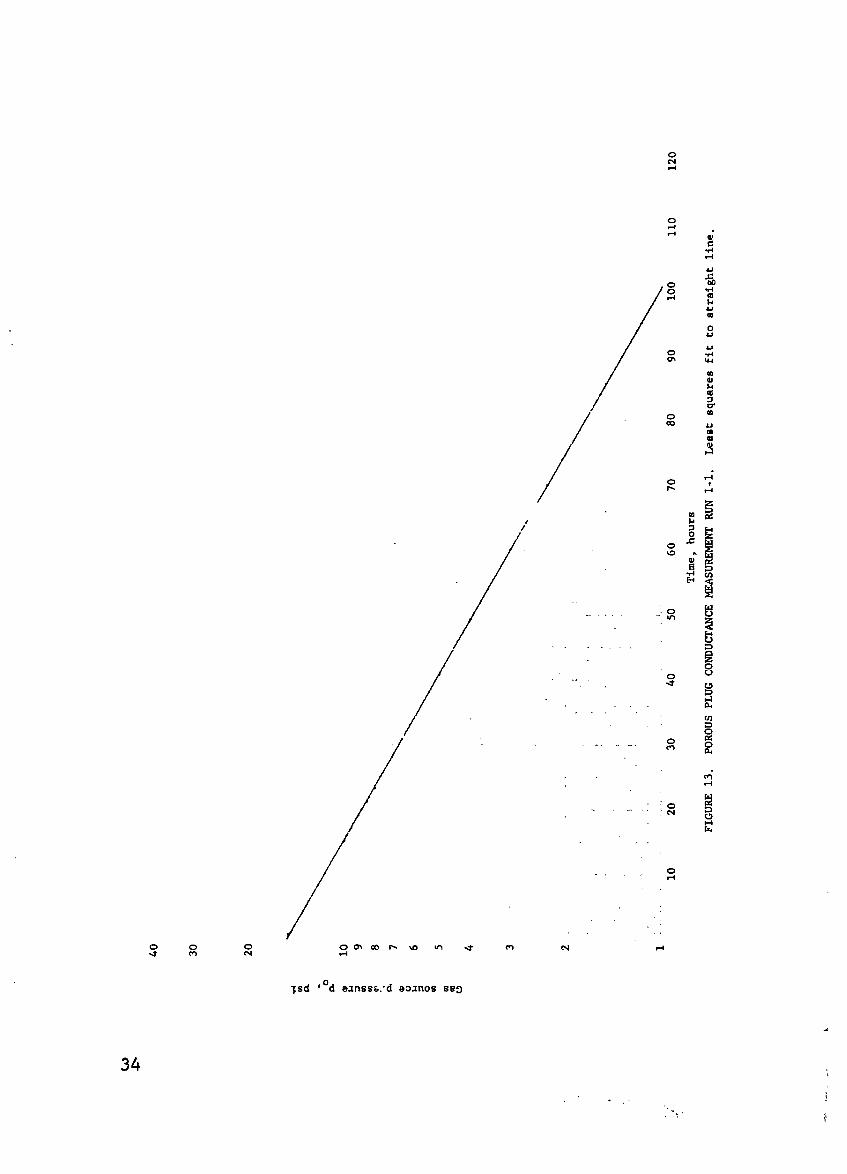
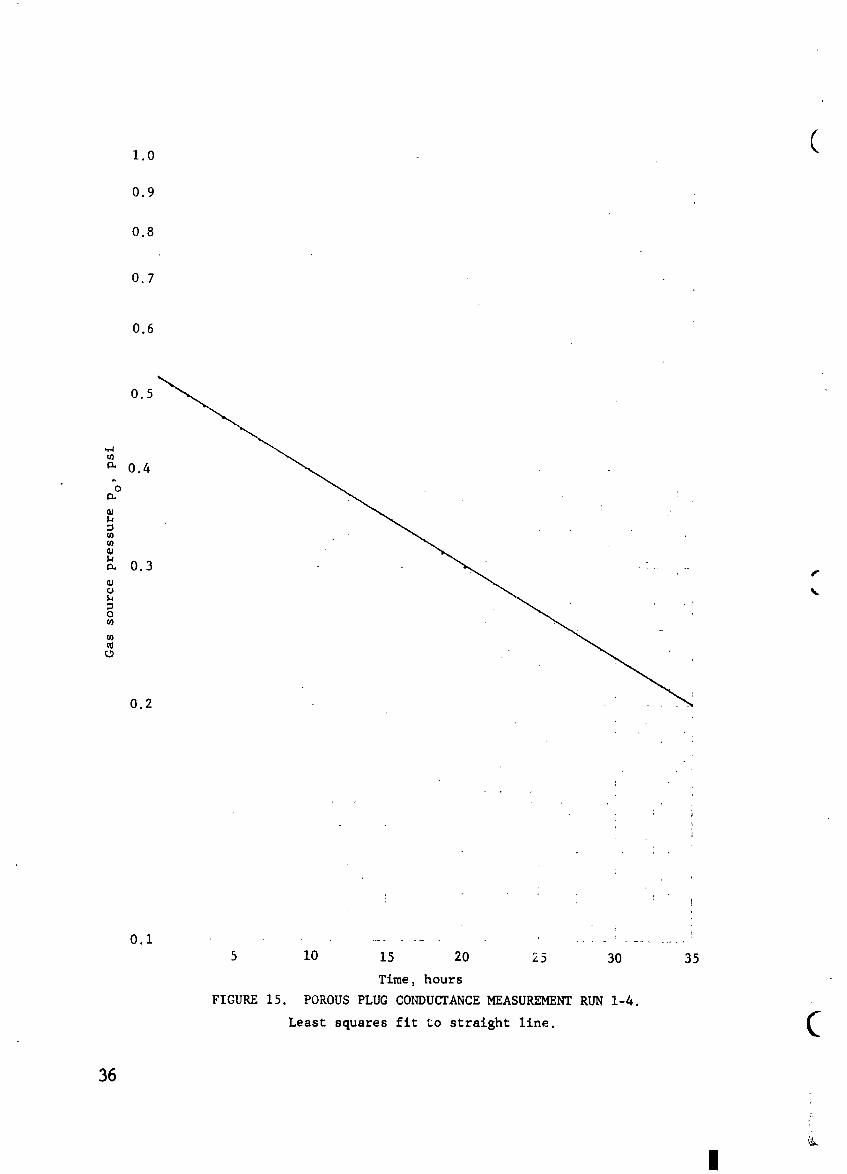
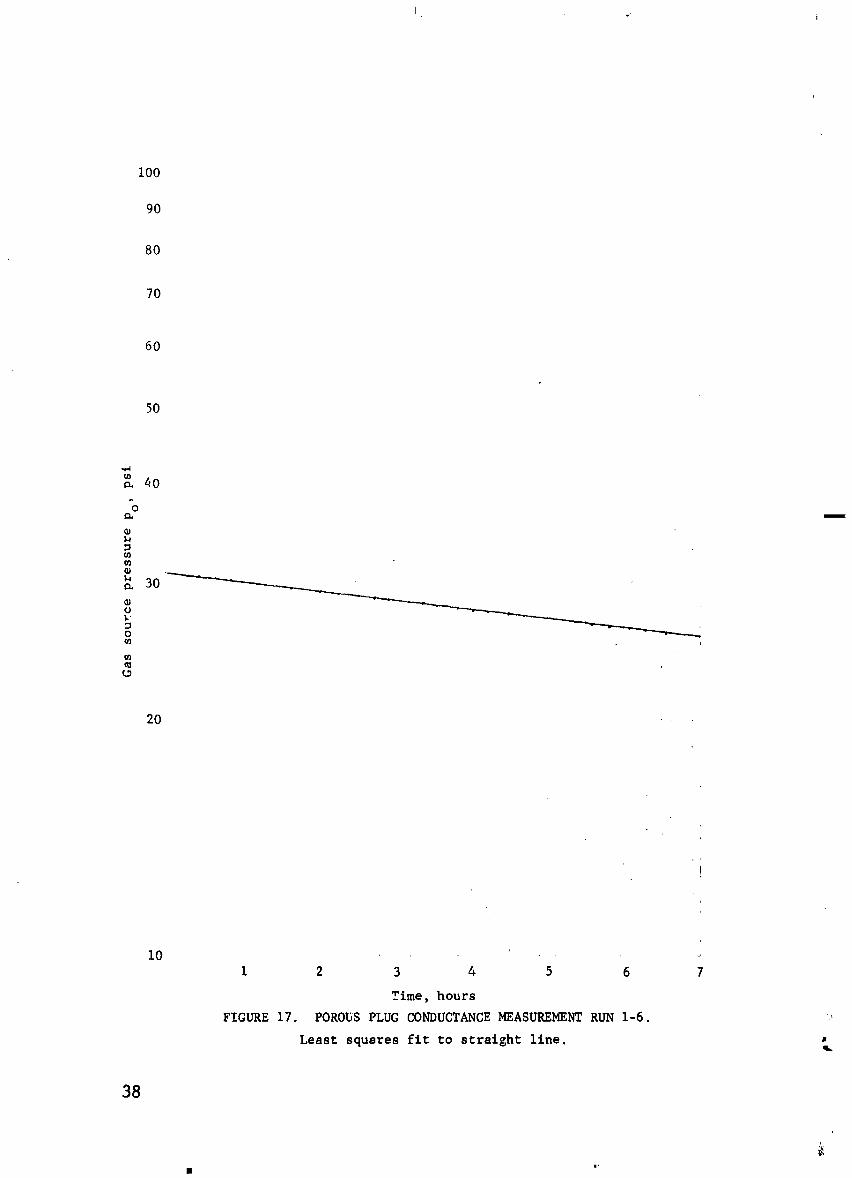
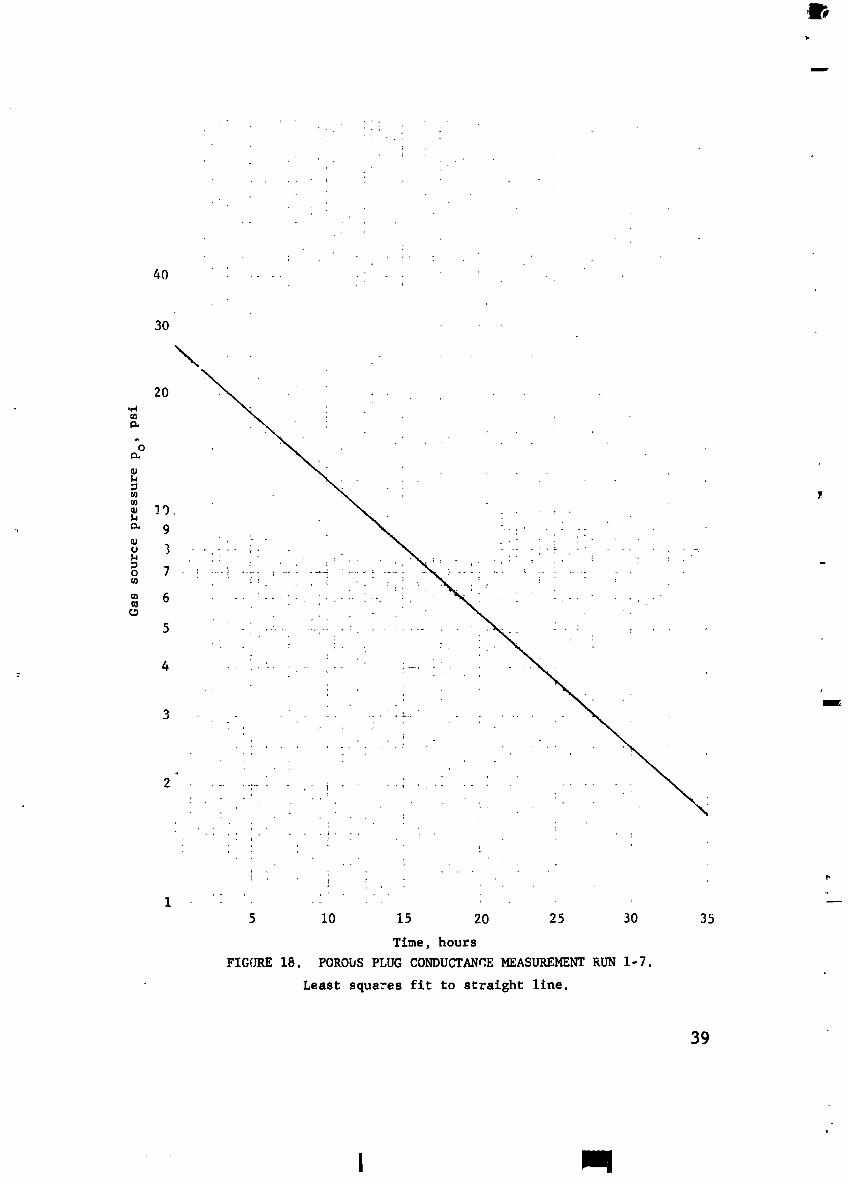
The measurements were carried out for a pressure range of
0°3 psi to 100.5 psi using porous plug #I in the equipment shownin Figure 12_ Figures 13 and 19 show on logarithmic plots the
decay of pressure with time. The solid lines are least squaresfits to a straight line. The relative standard error estimates
for these least squares fits are less than 0.2%. The averagevalue of the slopes of the least squares fits was determined
from the results of seven separate pressure decay curves derived
32
!
1966018675-039
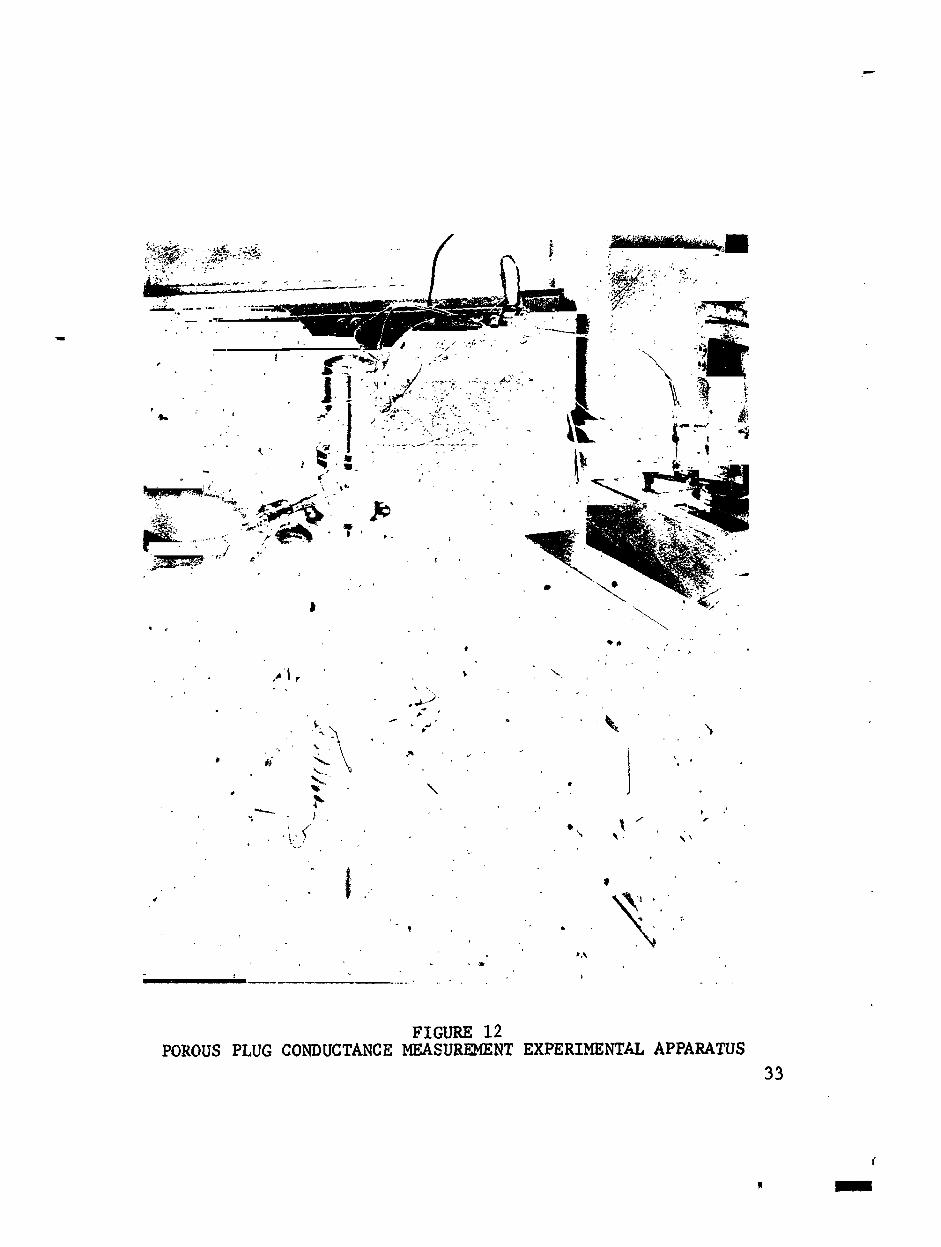
FIGURE 12POROUS PLUG CONDUCTANCE HEASURENENT EXPERIHENTAL APPARATUS
33
" W
1966018675-040
0
Ted '°d o:nss_.'d ea_nos seO
34 ,,
]
1966018675-041
,_9660
lO (
0.9
0.8
0.7
0.6
0.5
.,4
0.4
_u
I11
0.3 ¢cA
_4
0
g)
0.2
,1 ...... - .............
5 i0 15 20 25 30 35
Time, hours
FIGURE 15. POROUS PLUG CONDUCTANCE MEASUREMENT RUN 1-4.
Least squares fit to straight llne. (
36
II
1966018675-043
.,,., 37
I
1966018675-044
100
9O
8O
7O
60
5O
20
I0
I 2 3 4 5 6 7
Time, hours
FIGURE 17. POROUS PLUG CONDUCTANCE MEASUREMENT RUN 1-6.
Least squares fit to straight line.
38
m,
1966018675-045
40 ......
3O
\
_oc_
U)
59
3
_o7U)
6
5
4
i
3
2
15 I0 15 20 25 30 35
Time, hours
FIGURE 18. PORODS PLUG CONDUCTANCE MEASUREMENT RUN 1-7.
Least squares fit to straight llne.
39
I
1966018675-046
40
30
2O
.,4
Q. I
0
_.hem109U
_ 7o
_ 6
5
4
I
5 i0 15 20 25 30 35
Time, hours
FIGURE 19. POROUS PLUG CONDUCTANCE MEASUREMENT RUN I-8.
Least squares fit to straight line. _"
40
1966018675-047
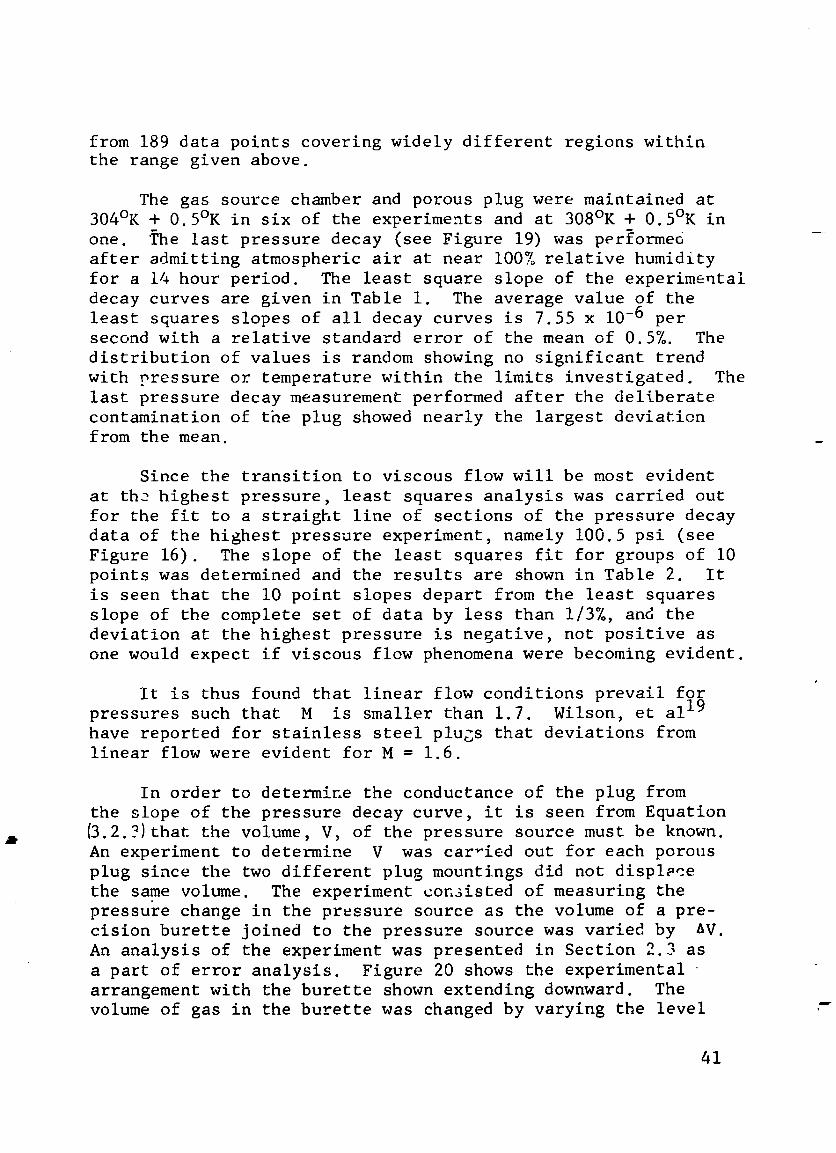
from 189 data points covering widely different regions withinthe range given above.
The gas source chamber and porous plug were maintained at
304°K + 0.5°K in six of the experiments and at 308°K + 0.5°K in
one. The last pressure decay (see Figure 19) was pe_formeo
after admitting atmospheric air at near 100,% relative humidity
for a 14 hour period. The least square slope of the experimental
decay curves are given in Table I. The average value of the
least squares slopes of all decay curves is 7.55 x 10⁻⁶ persecond with a relative standard error of the mean of 0.5%. The
distribution of values is random showing no significant trendwith pressure or temperature within the limits investigated. The
last pressure decay measurement performed after the deliberate
contamination of the plug showed nearly the largest deviationfrom the mean.
Since the transition to viscous flow will be most evident
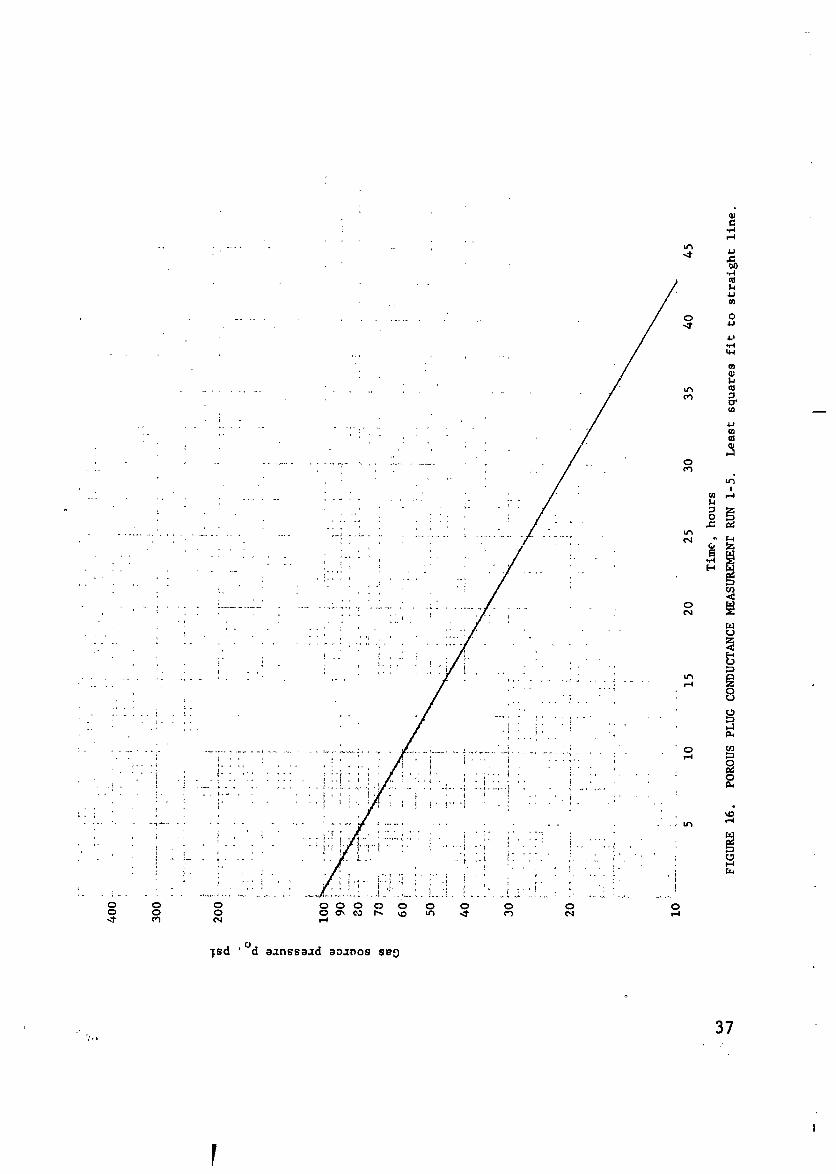
at the highest pressure, least squares analysis was carried out
for the fit to a straight line of sections of the pressure decaydata of the highest pressure experiment, namely 100.5 psi (see
Figure 16). The slope of the least squares fit for groups of I0
points was determined and the results are shown in Table 2. It
is seen that the I0 point slopes depart from the least squares
slope of the complete set of data by less than 1/3%, and the
deviation at the highest pressure is negative, not positive asone would expect if viscous flow phenomena were becoming evident.
It is thus found that linear flow conditions prevail for
pressures such that M is smaller than 1.7. Wilson, et a119
have reported for stainless steel plugs that deviations fromlinear flow were evident for M = 1.6.
In order to determine the conductance of the plug from
the slope of the pressure decay curve, it is seen from Equation
{3.2._)that the volume, V, of the pressure source must be known.An experiment to determine V was carried out for each porous
plug since the two different plug mountings did not displ_ce
the same volume. The experiment consisted of measuring the
pressure change in the pressure source as the volume of a pre-
cision burette joined to the pressure source was varied by AV.
An analysis of the experiment was presented in Section 2.3 as
a part of error analysis. Figure 20 shows the experimental
arrangement with the burette shown extending downward. Thevolume of gas in the burette was changed by varying the level
41
1966018675-048
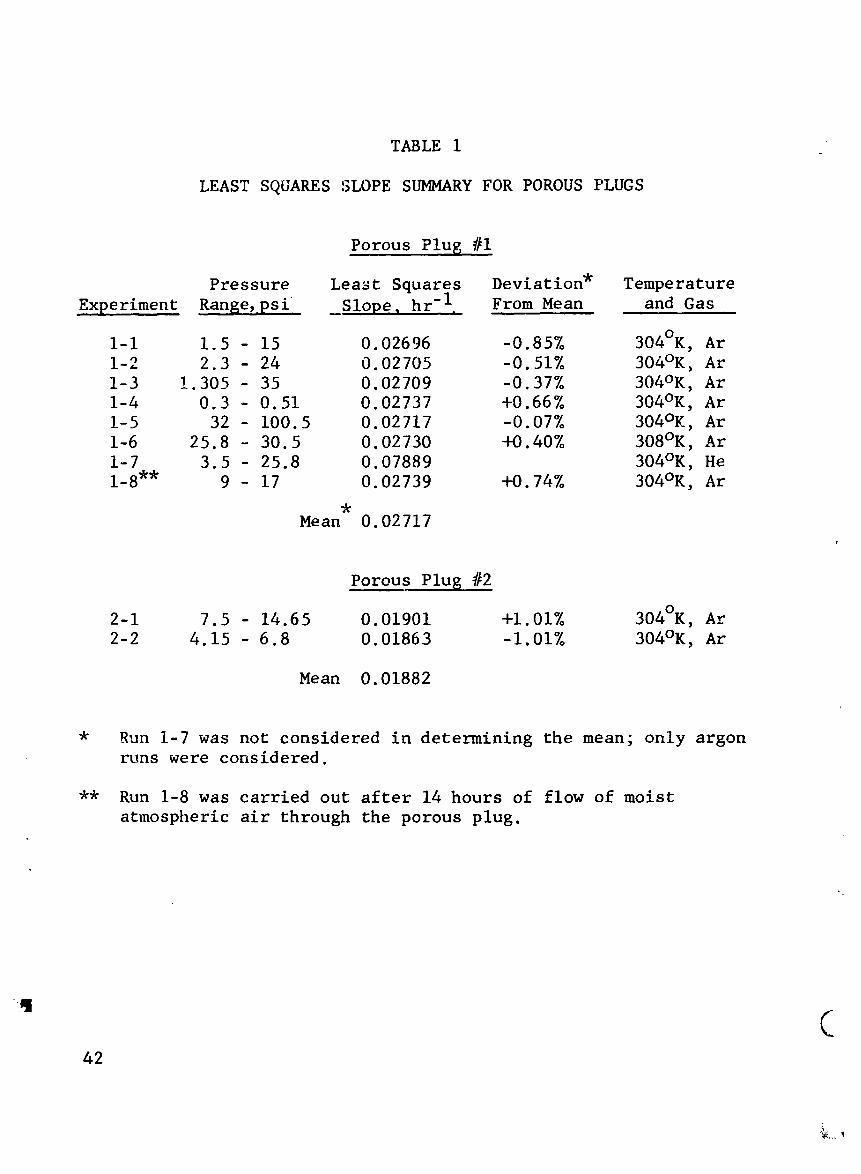
TABLE 1
LEAST SQUARES SLOPE SUMMARY FOR POROUS PLUGS
Porous Plug #I
Pressure Least Squares Deviation* Temperature
Experiment Range,.psi I _Slope, hr[ I, From Mean and Gas
I-i 1.5- 15 0.02696 -0.85% 304°K, Ar
1-2 2.3 - 24 0.02705 -0.51% 304°K, Ar1-3 !.305 - 35 0.02709 -0.37% 304°K, Ar
1-4 0.3 - 0.51 0.02737 +0.66% 304°K, Ar
1-5 32 - 100.5 0.02717 -0.07% 304°K, Ar
1-6 25.8 - 30.5 0.02730 +0.40% 308°K, Ar
1-7 3.5 - 25.8 0.07889 304°K, He
1-8"* 9 - 17 0.02739 +0.74% 304°K, Ar
Mean 0.02717
Porous Plug #2
2-1 7.5 - 14.65 0.01901 +1.01% 304°K, Ar
2-2 4.15 - 6.8 0.01863 -1.01% 304°K, Ar
Mean 0.01882
* Run 1-7 was not considered in determining the mean; only argonruns were considered.
** Run 1-8 was carried out after 14 hours of flow of moist
atmospheric air through the porous plug.
C42
1966018675-049
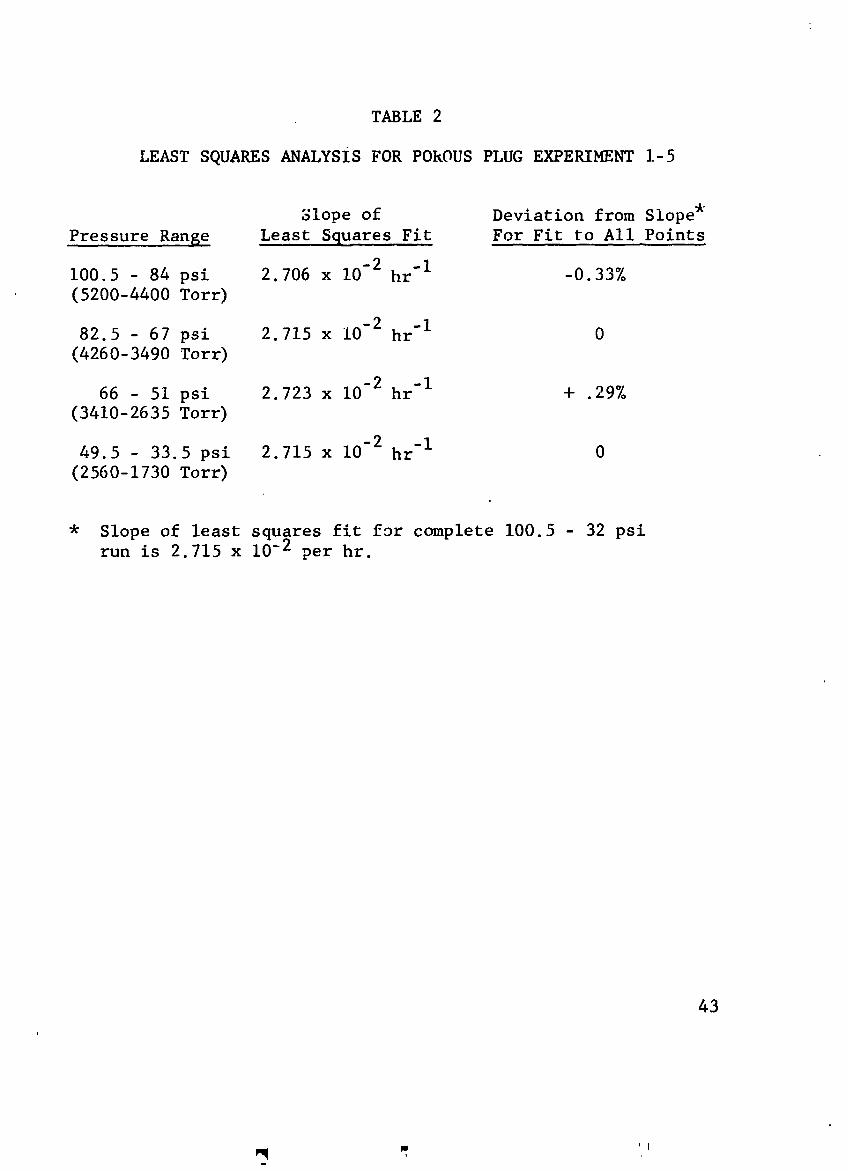
TABLE 2
LEAST SQUARES ANALYSIS FOR POkOUS PLUG EXPERIMENT 1-5
Slope of Deviation from Slope*
Pressure Range Least Squares Fit For Fit to All Points
I00.5 - 84 psi 2.706 x 10⁻² hr -I -0.33%
(5200-4400 Torr)
-2 -i82.5 - 67 psi 2.715 x I0 hr 0
(4260-3490 Torr)
66 - 51 psi 2.723 x 10⁻² hr "I + .29%
(3410-2635 Torr)
49.5 - 33.5 psi 2.715 x 10⁻² hr -I 0
(2560-1730 Torr)
* Slope of least squares fit for complete 100.5 - 32 psirun is 2.715 x 10⁻² per hr.
43p
J 'q
1966018675-050
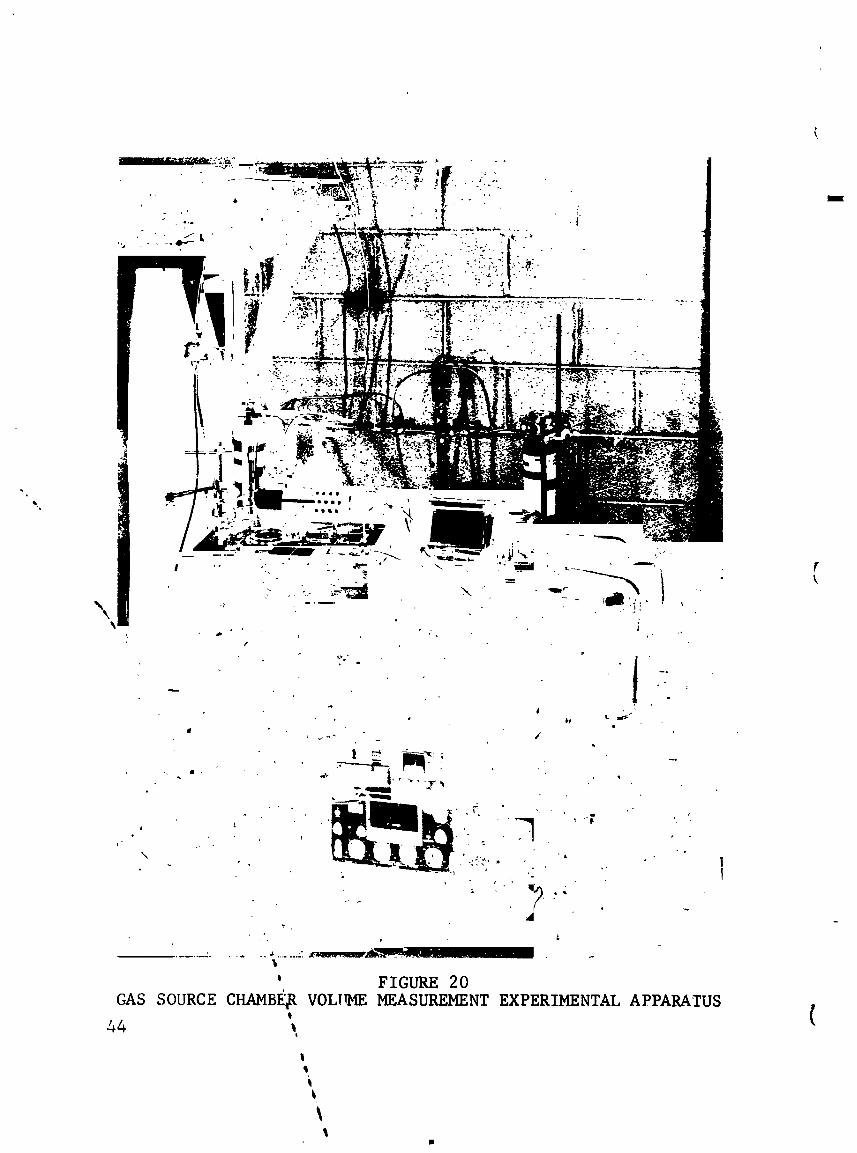
of a low vapor pressure silicone oil (Dow-Corning 705) using anexternal source of pressure. The pressure in the gas source
volume was determined using the rotating piston gauge. As with
the pressure decay measurements, to prevent the leakage in the
piston gauge from affecting the measurement, the differential
pressure gauge was placed between the piston gauge and gas sourceand the readings taken for zero pressure differential. The
experiment is begun with the gas source, molecular furnace and
piston gauge joined to a common manifold pressurized with ultra-
high purity argon to the level required to float the piston.All metal valves are then closed to isolate the three elements.
By taking care in closing the valves, the small variation in
pressure in the system, due to the tra_ping of gas as the valveseat closes, can be kept less than 10-0 Torr, which is negligiblein comparison to the change in pressure induced by changing the
volume by AV. The weight of the piston is increased to correspond
to a 0.5 psi (_26 Torr) pressure increase and the level of oil
in the burette increased until the differential pressure gaugeagain indicates zero and the oil level noted so that AV can be
determined. In creating this pressure differential across the
porous plug there is a flow through the plug decreasing the
pressure in the gas source volume. The error introduced by thisflow into the determination of V was estimated using an ex-
pression similar to Equation 9.2.2)and found to be negligible
for porous plugs whose conductance is less than 10-5 liters persecond.
The volumes of the gas source with each of the plugs in
place were determined to be:
V1 = 1.383 liters, andV2 = 1.309 liters.
The relative probable error calculated from t,le error analysis
given in Section 2.3 is 1.8%. The reason for this relatively
large error is the multiplication of errors in pressure and
temperature by the ratio V/AV where V is the gas source
volume and AV is the incremental change in _olume. In the
measurements made, V/AV was greater than 50.
Measurements on the leak-down of the _isc-type porous plug#2 were carried out over the pressure range 4 to 15 psi° From
the slope of the pressure decay curve derived from 89 data points
and the measured volume, V2, the conductance of the porous plugwas determined to be 6.84 x 10⁻⁶ _/s. From the measured dimension
45
i
r_ III
1966018675-052
of the plug, a specific flow rate of 6.0 x 10⁻⁶ liter mm/sec cm 2is calculated. This is greater than the value published 20
(oxygen data corrected to argon) for porous Vycor glass by afactor of 2.7, and larger than that obtained by Barrer and Barrie
by a factor of 1.4. The reason for this discrepancy is not known
although possibly 30% of the difference could be accounted for
by uncertainty of tne area and thickness of the plug due to the
type of mounting used and the fact that the rolled glass surface
used is not flat. There may also be variations in the manufactur-
ing procedure for different lots of glass. Several differentcharacteristics were shown by Emett and Dewitt 21 for different
samples of porous Vycor.
The experiments on the flow of argon in porous Vycor haveshown its conductance to be constant with pressure over a very
wide range of pressure and indications are that the conductance
is not greatly affected by exposure to normal atmospheric con-ditions. It is concluded that the conductance of a porous plug
of Vycor is not predictable a priori. However, by putting adifferential pressure gauge between the pressure source and
rotating pistc_ gauge, the conductance of the porous plug in
use in a calibration system may be meas,_red at any time in anexperiment as described above to any dej1"ed accuracy. Since
the linear character of the decay has been proven, the measure-ment could consist of a few determinations of pressure and time
over a period of a day. Such measurements could be periodicallymade to check system performance. In addition to the determina-
tion of conductance, this experiment would give a positive check
on the pressure integrity of the gas source since as discussed
above, non-linearity in the plot of _n p vs. t would be veryevident if the pressure decay is due to flow through any other
element except the porous plug.
4. INVESTIGATION OF MOLECULAR BEAM SOURCES
4.1 Deviations From Free Molecular Flow of an Orifice
In the derivation of the calibration equation (Equation{2.1_),there are several implicit assumptions which must be more careful-
ly considered concerning the nature of gas flow in and from the
molecular furnace. The constraints placed upon the operation of
the system due to the result of these considerations may be
46
1966018675-053
described, as for the porous plug, in terms of the ratio of themean free path of the gas to some characteristic dimension. Allof these constraints relate to the maximum allowable deviation
from: i) molecular flow conditions, and 2) thermodynamic equi-librium.
The most important constraint and the one given the most
consideration both in the literature and in this investigation
is that concerning the deviation from molecular flow through
the orifice which defines the molecular beam. Postulating
molecular flow conditions, the number of molecules passing outof the unit area of the orifice in unit time is
1F nf.
This is a result derived from kinetic theory by M. Knudsen I for
the number of molecules within an equilibrium gas that passtoward one side through unit area in unit time. The situation
in the case of an aperture in the wall of a vessel containing anequilibrium gas, outside of which a relative vacuum is maintained,
differs from the above in that a completely negligible number
of molecules pass through the aperture with inward directed
velocities. Therefore, the molecular density in tne vicinity
of the aperture is reduced, being ½n in the plane of the orifice
and increasing to n, the equilibrium gas density, as one proceeds
back into the gas. If the molecular mean free path is very largecompared to the aperture diameter, the presence of the aperture
has little effect on the molecular distribution function, and
expression _.I.iI yields the correct flow. Theoretical calcula-
tions of the correction to expression_4.1.11have been made by
Liepmann,22, 23 Narishima,24 Willis,25, 26 and Probstein. 27Their calculations are in general agreement with the fact thatthe deviation from the molecular flow limit (expression _.i. III
due to a finite ratio M (KDudsen number) of molecular mean free
path, X, to aperture diameter, d, for large M is
Actual Mass Flow Rate, = i + .io2)Free Molecular Mass Flow Rate
Willis gives an expansion in terms to order (I/M) 2 which
is valid for smaller M than is Equation _.1.2), but agreementwith exact numerical computation is for M E 3. Willis' exact
result (using the first iterate distribution function) for themass flow rate at the center of an orifice normalized to the
Knudsen flow rate is shown in Figure 28.
47
|
1966018675-054
As Willis points out, since his is a first iterate treat-
ment and a second order expansion of this shows large deviations
for M < 1.5, therefore, it is expected that the second iterate
problem should be considered for such small M values.
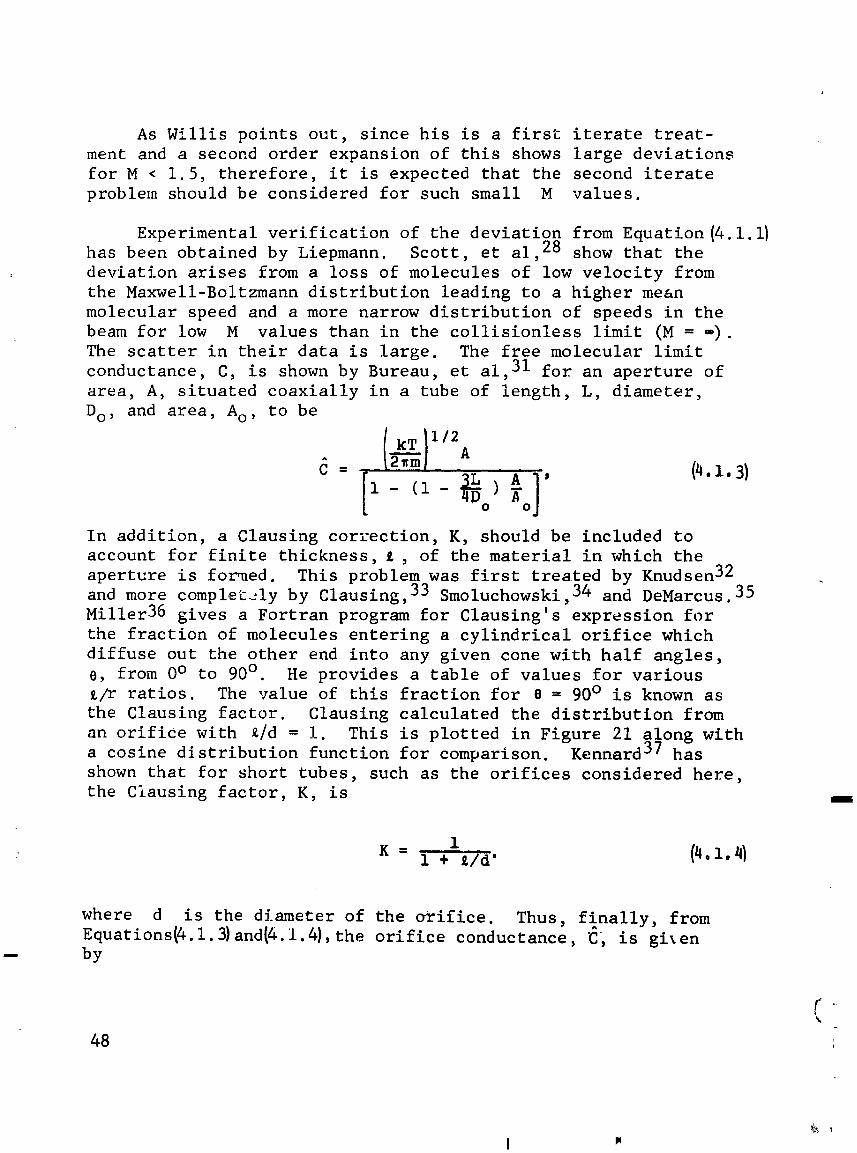
Experimental verification of the deviation from Equation(4.1.11has been obtained by Liepmann. Scott, et ai,28 show that the
deviation arises from a loss of molecules of low velocity from
the Maxwell-Boltzmann distribution leading to a higher meanmolecular speed and a more narrow distribution of speeds in the
beam for low M values than in the collisionless limit (M = -).
The scatter in their data is large. The free molecular limit
conductance, C, is shown by Bureau, et al, 31 for an aperture of
area, A, situated coaxially in a tube of length, L, diameter,
Do, and area, Ao, to be
d= A
1 - (1 - o) To
In addition, a Clausing correction, K, should be included toaccount for finite thickness, _ , of the material in which theaperture is formed. This problem was first treated by Knudsen 32and more complet.ely by Clausing, 33 Smoluchowski, 34 and DeMarcus. 35Miller36 gives a Fortran program for Clausing's expression forthe fraction of molecules entering a cylindrical orifice which
diffuse out the other end into any given cone with half angles,0, from 0° to 90° . He provides a table of values for various_/r ratios. The value of this fraction for 6 = 90° is known as
the Clausing factor. Clausing calculated the distribution from
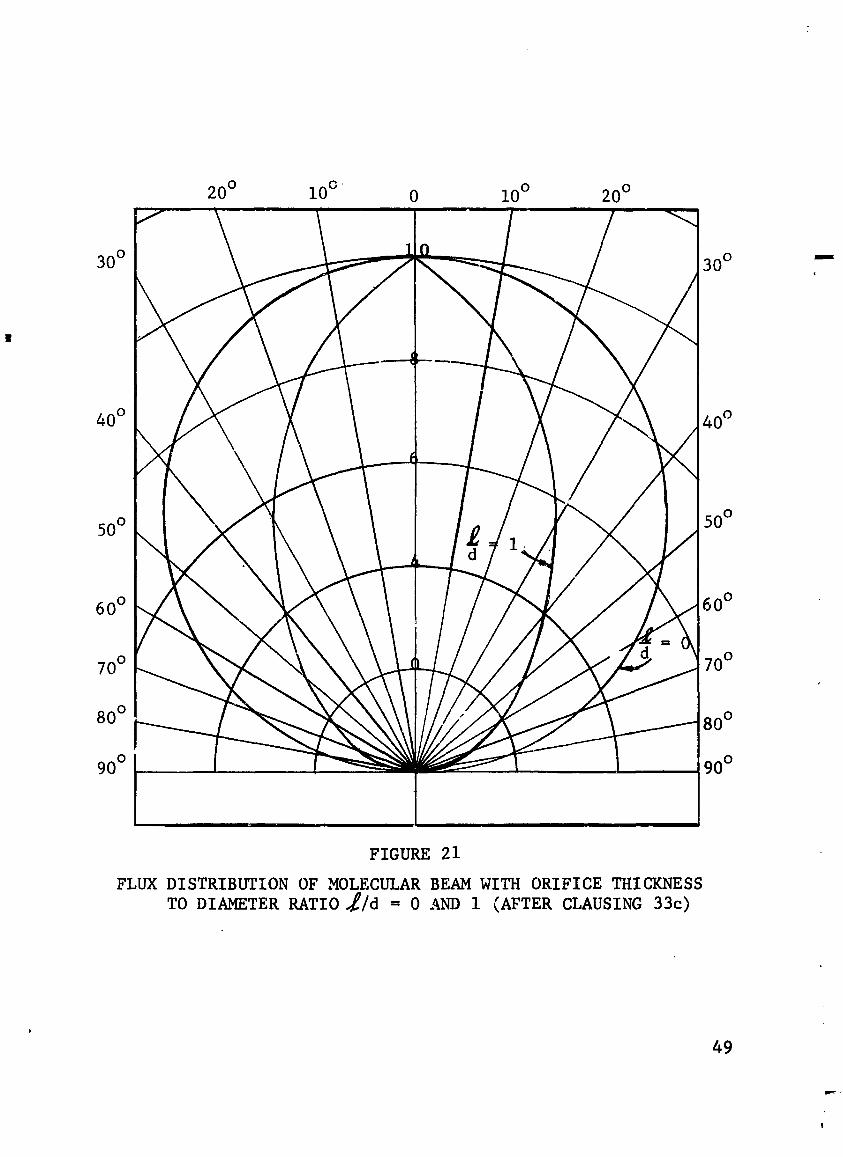
an orifice with _/d = I. This is plotted in Figure 21 along witha cosine distribution function for comparison. Kennard 37 has
shown that for short tubes, such as the orifices considered here,
the Ciausing factor, K, is a
where d is the diameter of the orifice. Thus, finally, fromEquations_.l.3)and_.l.4),the orifice conductance, C, is givenby
48
1966018675-055
200 i0°' 0 I0° 20°
....... ,
30° 30° =--
l
40° 40°
50° 50°
60° 60°
70° 70°
90° 90°
FIGURE 21
FLUX DISTRIBUTION OF MOLECULAR BEAM WITH ORIFICE THICKNESS
TO DIAMETER RATIO _/d = 0 AND I (AFTER CLAUSING 33c)
49
1966018675-056
i
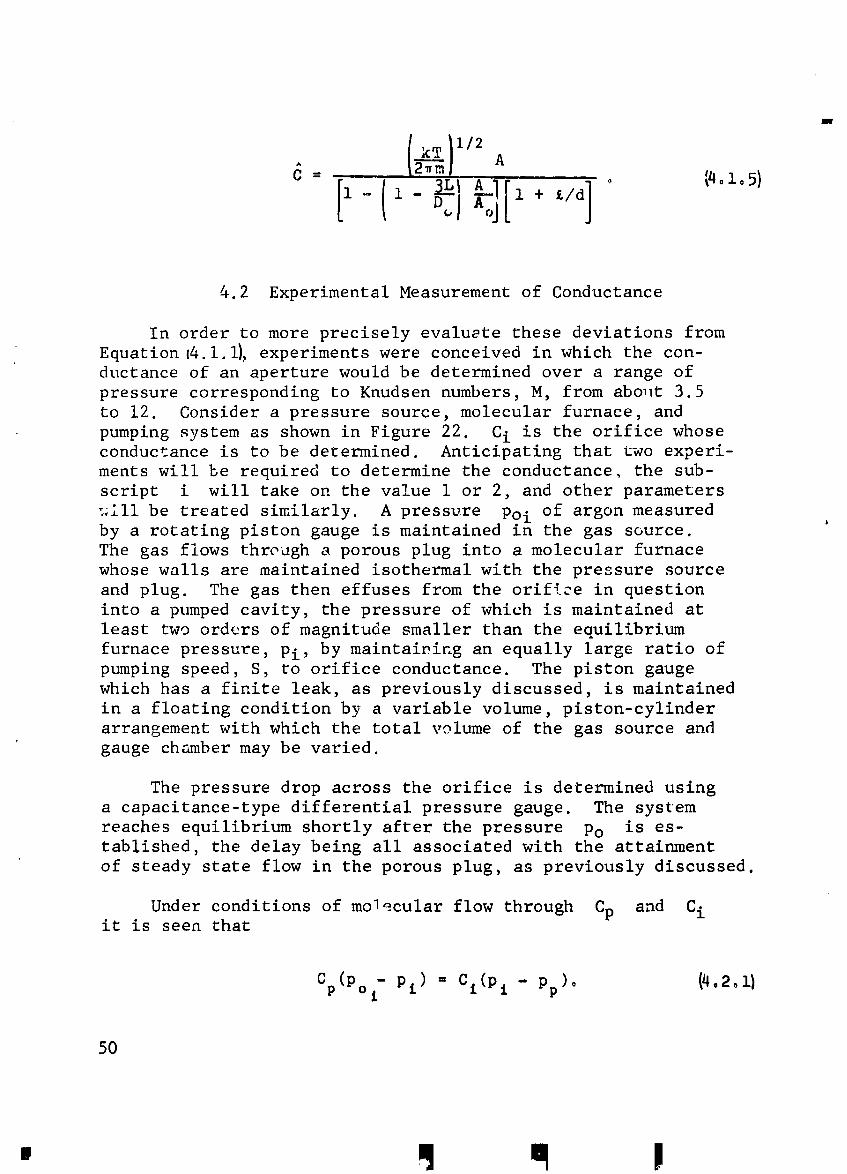
6 - 12.mI A
[(i- i - D_ A<,]) _][i + _I_]° 14oio_)
4.2 Experimental Measurement of Conductance
In order to more precisely evaluete these deviations from
Equationt4.1.11, experiments were conceived in which the con-ductance of an aperture would be determined over a range of
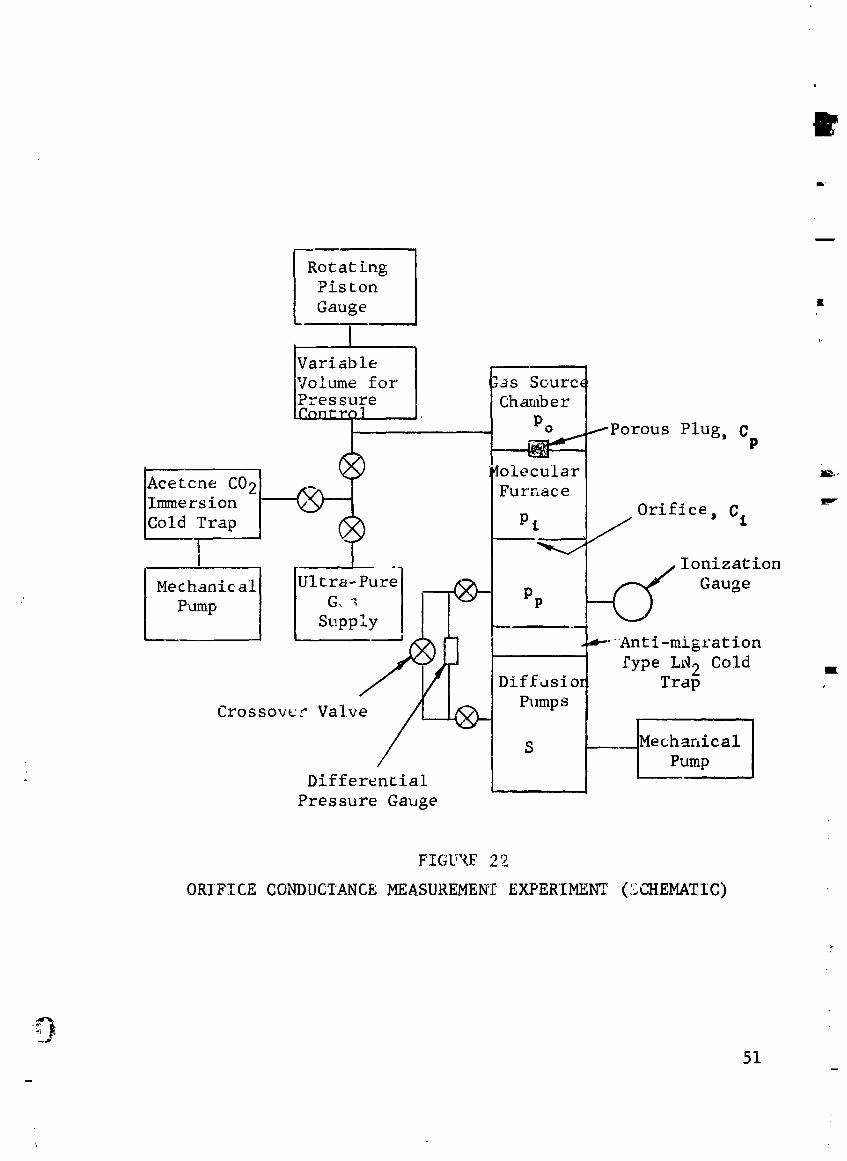
pressure corresponding to Knudsen numbers, M, from abo,lt 3.5to 12. Consider a pressure source, molecular furnace, and
pumping system as shown in Figure 22. Ci is the orifice whoseconductance is to be determined. Anticipating that two experi-
ments will be required to determine the conductance, the sub-script i will take on the value i or 2, and other parameters
_;ill be treated similarly. A pressure Poi of argon measuredby a rotating piston gauge is maintained in the gas source.The gas flows threugh a porous plug into a molecular furnace
whose walls are maintained isothermal with the pressure source
and plug. The gas then effuses from the orifice in question
into a pumped cavity, the pressure of which is maintained at
least two orders of magnitude smaller than the equilibrium
furnace pressure, Pi, by maintaining an equally large ratio ofpumping speed, S, to orifice conductance. The piston gauge
which has a finite leak, as previously discussed, is maintained
in a floating condition by a variable volume, piston-cylinderarrangement with which the total volume of the gas source and
gauge chamber may be varied.
The pressure drop across the orifice is determined using
a capacitance-type differential pressure gauge. The system
reaches equilibrium shortly after the pressure Po is es-tablished, the delay being all associated with the attainment
of steady state flow in the porous plug, as previously discussed.
Under conditions of molecular flow through Cp and Ciit is seen that
Cp(Poi- pi) = Ct (pi - Pp)° {4.2°11
50
• ,q II
1966018675-057
i
Rot at ingPislon
Gauge •
1VariableVolume for' _as SourcePres sure ChamberContr_ _1
Po _-Porous Plug, 0
_____ lolecular i_._IA_letcne nC02 Furnace l._o Orifice _ 0i
Ionization
Mechanical [Ultra-Pure __ _ Gauge" Pump ] G_ I_ PP
7 1Supp_ _-Anti-mig_'ation
fype LN 2 Cold ,,Diffusiot Trap ,
urossove_ Valve /___ Pumps
/ S __ MechanicalPump
Differential
Pressure Gauge
FIGU'{F 22
ORIFICE CONDUCTANCE MEASUREME_I EXPERIMENT (_._6_.EMATIC)
51
1966018675-058
Also,
Ct(pi - pp) = Spp, 14.2.2)
so that,
C t_--- iIL
Pp C. + S Pt =-QiPt ' (4 2.3)
and therefore
C
P_ = di(1- P i"_'i) + Cp Po 14.2.-41
No:-:,C_ is much smaller than Ci for any reasonablediameter ofPorifice, and we have, finally,
C= P
Pl Ct(z- ,,t) Poi" (4,2.5)
The mounting and flange for the porous plug (see Figure 5)
has a conductance CM which is of the same order as the orifice
conductance Ci. However, the geometry of this mounting andflange are such that Pi is determined by the series combination
of CM and C It follows directly from the flux continuityequation that _he total conductance is 29
CpC Mc' -p C + CM 'P
and since CM > Ci then, as before. CD may be neglected com-
pared with CM and no correction to Equation _.2.5} is foundnece3sary.
Consider an experiment in which the molecular furnace is
operated over a range of pressure Pl such that the ratio, MI,of the mean free path,
: i Pl
to orifice diameter, dl, is sufficiently large compared with
unity, that there are negligible deviations from molecular flow, asgiven by Equation (4.1.1). y here varies directly with tempera-
ture, and its value for various gases may be found in Dushman. 30
52
i ||
1966018675-059
Since Co can be accurately measured, as shown in Section 3,Equation i4.2._Imay be used to calibrate a gauge which is arranged
to measure Pl. Since it is desirable that the gauge have linearresponse characteristics over the lange of pressure to be in-
vestigated, a capacitance-type differential pressure gauge, MKS
Instruments, Inc., BARATRON, was chosen. The gauge is non-specific with respect to the gas to be measured. The particular
model used (77H-I068) had high sensitivity and fast response over
the range 2 x 10⁻⁵ Torr to 3 Torr, although the noise level was
high at the low end of the range. A 1/4% chart recorder
(Honeywell Eiectronik 17) was used as the indicator. 1_e leastcount of the system is 2 x 10⁻⁵ Torr and short time zero drift
variations of this order were found during zero check made
before and after each of the data points measured. This also
constitutes a hysteresis check since the zero check was madeimmediately following the removal of the measured differential
pressure. A differential of 3 to 5x 10⁻⁵ Torr, the origin ofwhich is unknown, was measured across-the orifice with the
furnace evacuated. The range over which the differential
pressure gauge was calibrated was 1.4 x i0-3 Torr to 5.0 x 10⁻³
Torr. Data was obtained over the range up to 1.5 x I0-I Torras will be described more fully bel_.
Now consider a second experiment performed with the same
apparatus but with a different orifice such that the ratio
M2 = _2/d2 is smaller than M I. Equation_.l._ predicts for
small M 2 values some variation from the specific flow rate, C2 ,_obtained in the free molecular flow limit. In order to assess
the magnitude of any such deviation, measurements of furnace
pressure, P2, must be made over the range for which the differ_ential pressure gauge was calibrated in experiment i, and since
Cp and Po are accurately known, then C2 may be evaluated andcompared with the predictions of Equation _.I.2).
If _ is the multiplicative factor denoting the deviation
from free molecular flow, then
c2= . 2o So2.
Now if measurement of Pi was made using a gauge which
had, a scale error nj for the j scale, then thederived valuePi is
t
Pi = n] pto _o2.9}
53
,lmllll
1966018675-060
Using the j scale, Equations {4.2.51 and (4.2._ yield
, CpPo I
Pl = "j " ' (402.10_ ---oi(1- az)
so that the gauge constant is!
61(l - _I) dpI
n__ : " C'p _ [4o2..11_
as long as the measurement is carried out for pressures low
enough that C I is not a function of pressure. From Equation{4.1.2}this is seen to require that M be large.
For the second orifice experiment, the steady state solution,
Equation 14.2.5_ and Equations {4.2.8) and (4.2.i_ may be combined
to yielda. t
, CI(I - -,) dp I _.2.1P_)
P2 = .{_2(i +2"_ d-_o 1 Po 2" .:.
where P2 is the pressure across the orifice as measured usingthe j scale. Thus, by rearranging terms, the deviation from -
molecular flow may be determined from •!
61(1- _I) dPl Po2_ -r-, (4.2.13!62(1 _2)-I P2
+
Using Equation (4.1.5), the orifice conductances for argon
at 304OK are calculated to be for the two experiments performed
C 1 = 7.63 x i0-2 liters per second, (4.2.14}and
C 2 = 8.62 x i0-I liters per second. 14.2.15)
The system pumping speed, S, was determined during the porousplug experiments by measuring the pressure in the chamber belowthe plug with an NRC type 507 ionization gauge. The speed de-
termined for 304°K argon is 104 liters per second. Correctionwas made for the series conductance of the spool I,ieee inter-
posed between the pump and the molecular furnace for the orifice+• experiments. The effective pumping speed in those experiments _-
is then ...
54 _
-¢_,.
ii [ r
1966018675-061
S = 86 llters/second. (q.2.16)
Using Equations (4.2.3)and _. 2.141 - (4.2.16), the coefficients aiare calculated to be
a I = 8.9 x 1o-4 (4.2.17)and
a2 :" 1,01 I 10 -2. {4.2.18)
Thus, Equation (4.2.13_ becomes
' Po2dPl 14.2.191
P2! •
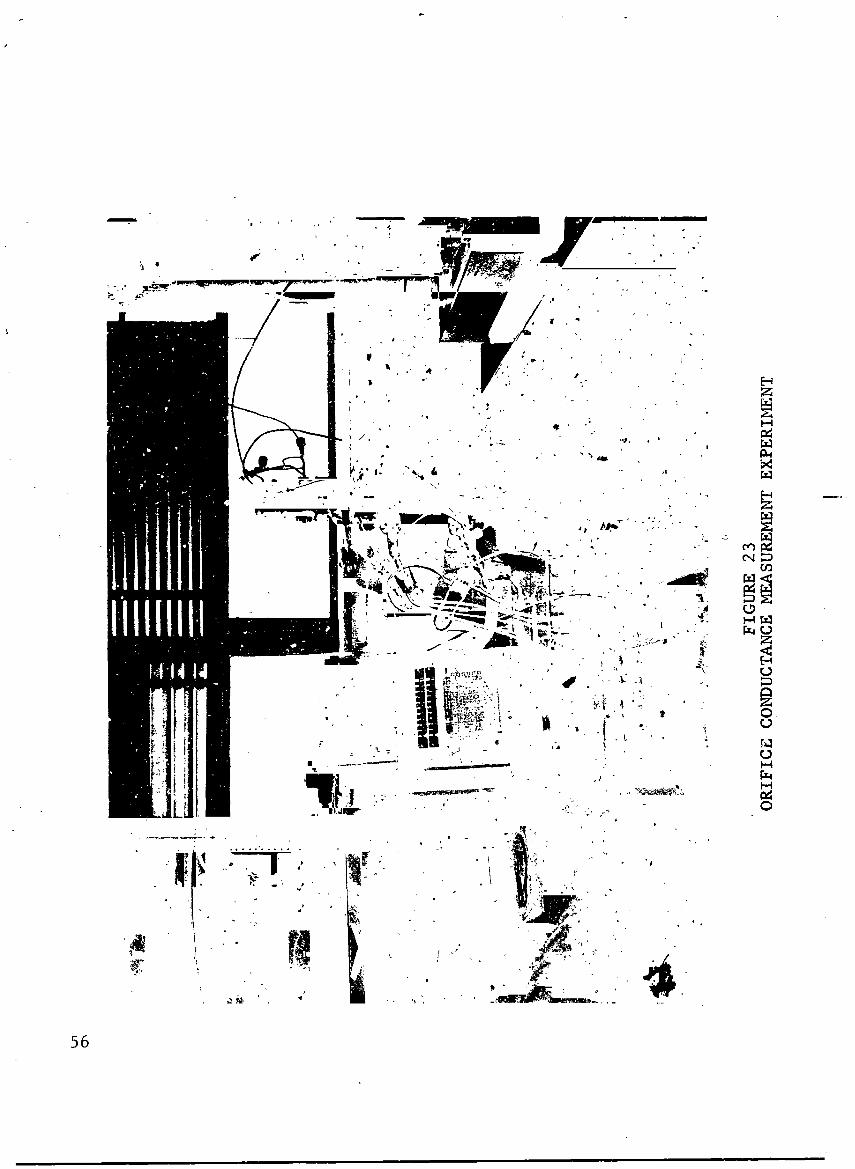
u = 0.0893 dPol
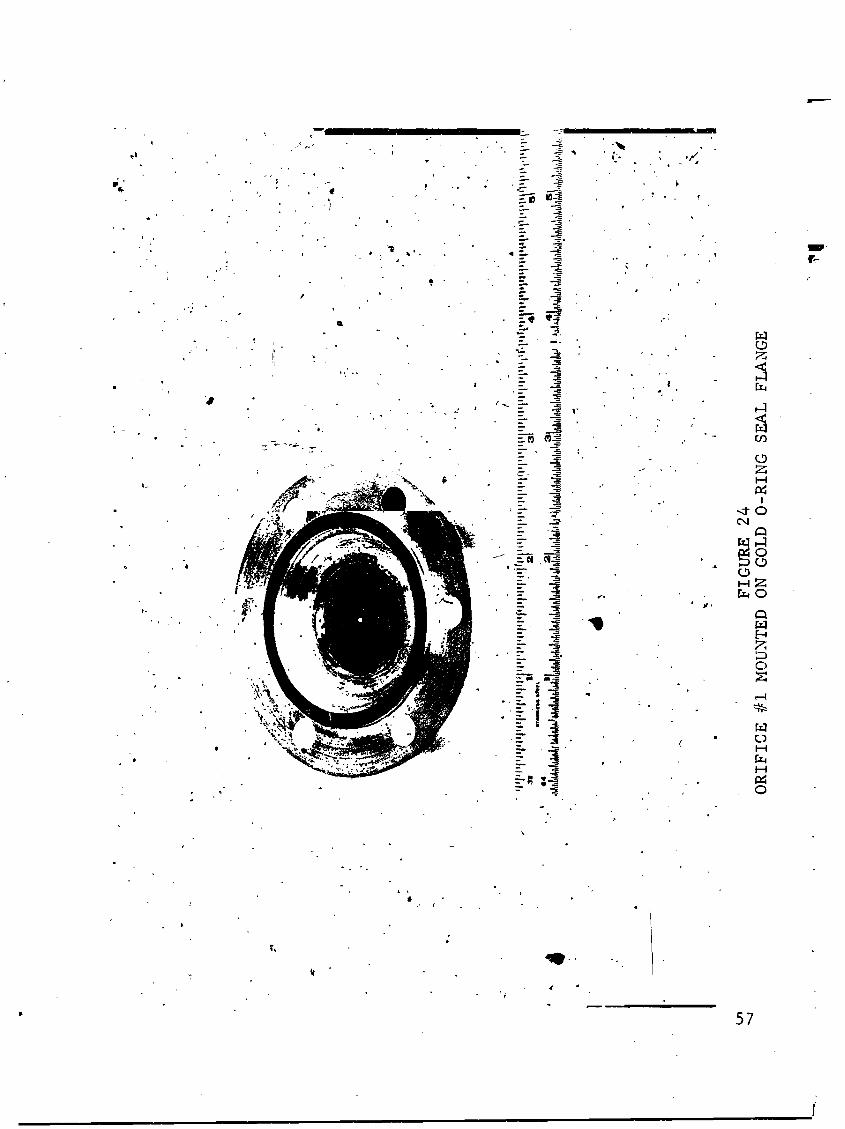
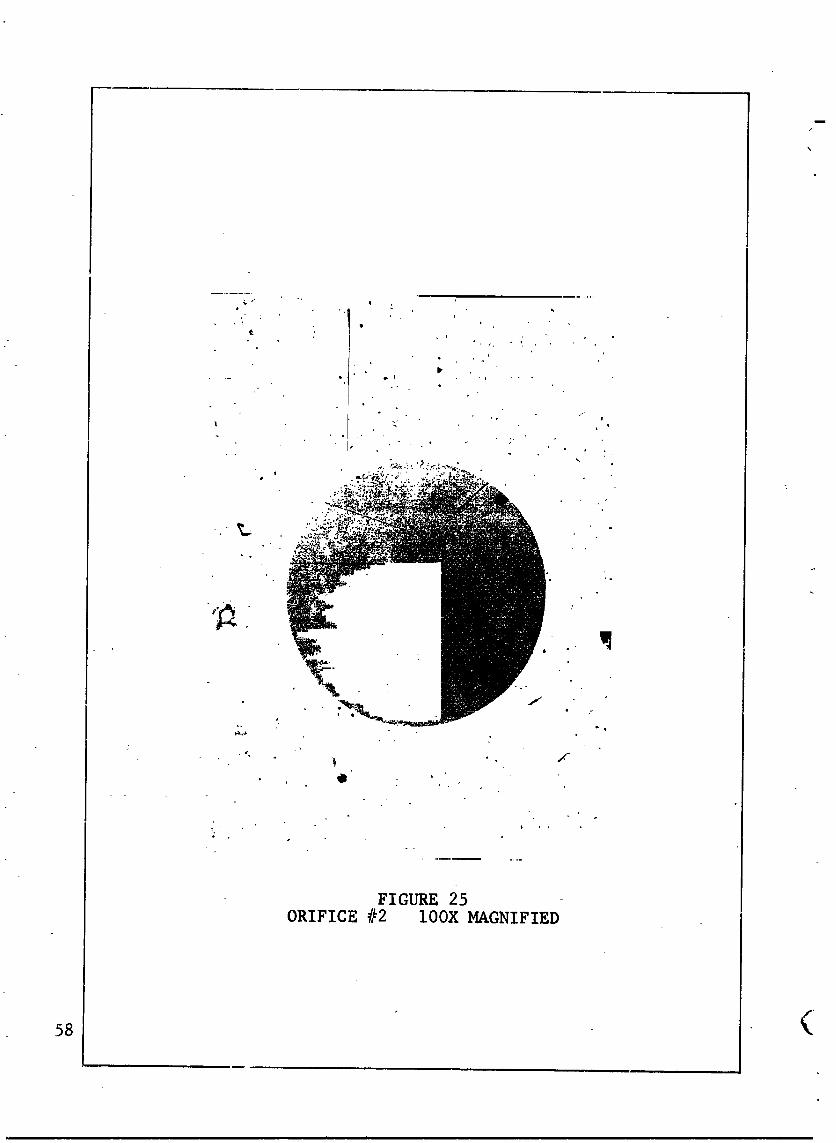
Figure 23 is a picture oflth_ experimental equipment shownschematically in Figure 22. Figure 24 shows one of the 0.0005"
thick copper aperture plates mounted on a flange which joins it
to the molecular furnace and Figure 25 is a IOOX magnified
picture of aperture #2 which was formed by drilling with fast
spiral twist drills through the copper sandwiched between 1/8"
thick ground and polished aluminum plates.
The deviation from free molecular flow, _ , was evaluated
according to Equation {4.2.!9) over the range 3.3 < M < i2.5.The deviation from Knudsen flow was found to be less than 3%
over this range. The uncertainty in this determination wasslightly less than 2%. Since the deviation, _ , determined
above was small, it was considered desirable to investigate
the region of ..,laller M where the deviation is expected to be
substantially larger. A repeat of the calibration proceduredescribed above for a wider range of M is impractical With
any reasonable set of system parameters, as can be shown fromthe results of Appendix 2. Therefore, the extension of the
measurement of u to smaller M values must depend on the
assumed linearity of the differential pressure gauge. A measure-
ment is also required of the multiplicative factor, _Jk, re-lating readings on scale k to those on scale j so that
! !
Pzj = P2k" (4.2.20)e
J
55
m
!
H u i i i
1966018675-062
56
ii
1966018675-063
i
1966018675-064
s,
FIGURE 25
ORIFICE #2 100X MAGNIFIED
11 i
1966018675-065
!
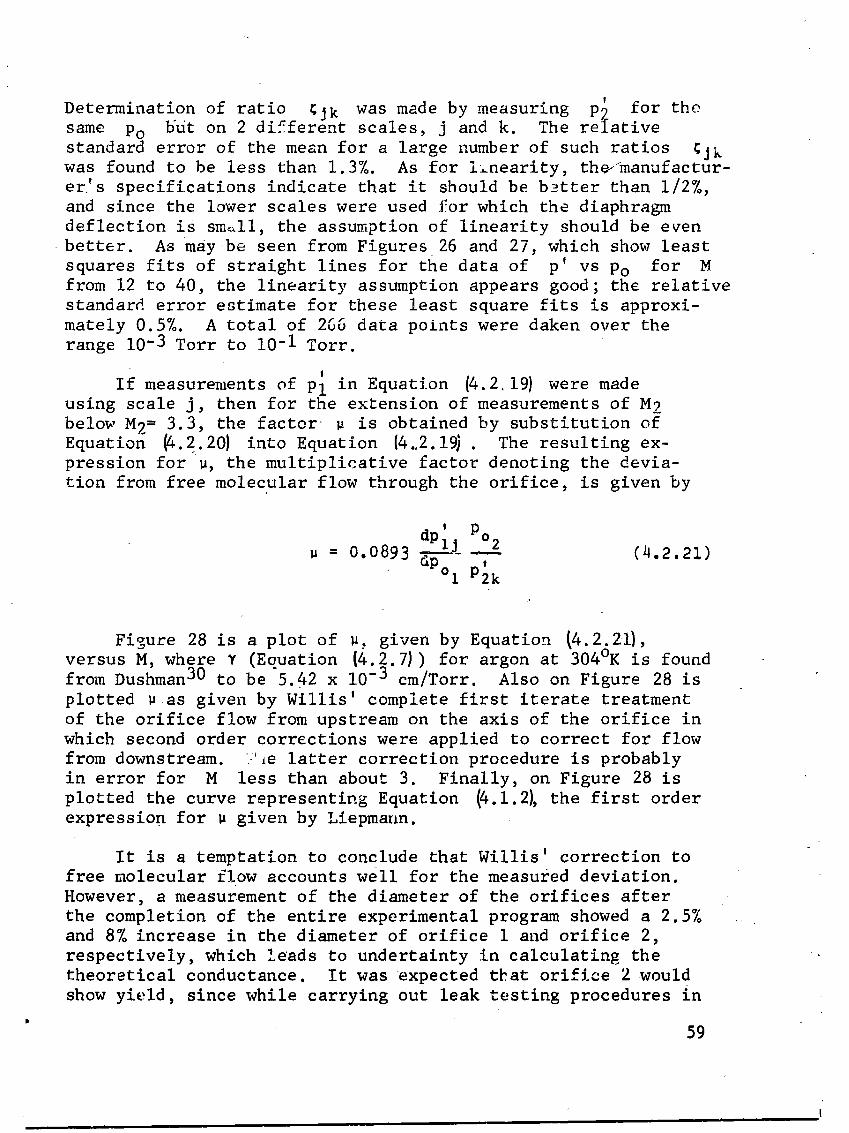
Determination of ratio _Jk was made by measuring P2 for thesame Po Nut on 2 different scales, j and k. The relative
standard error of the mean for a large number of such ratios _Jkwas found to be less than 1.3%. As for i_nearity, the-manufactur-
er's specifications indicate that it should be better than 1/2%,
and since the lower scales were used for which the diaphragm
deflection is sm=ll, the assumption of iinearity should be even
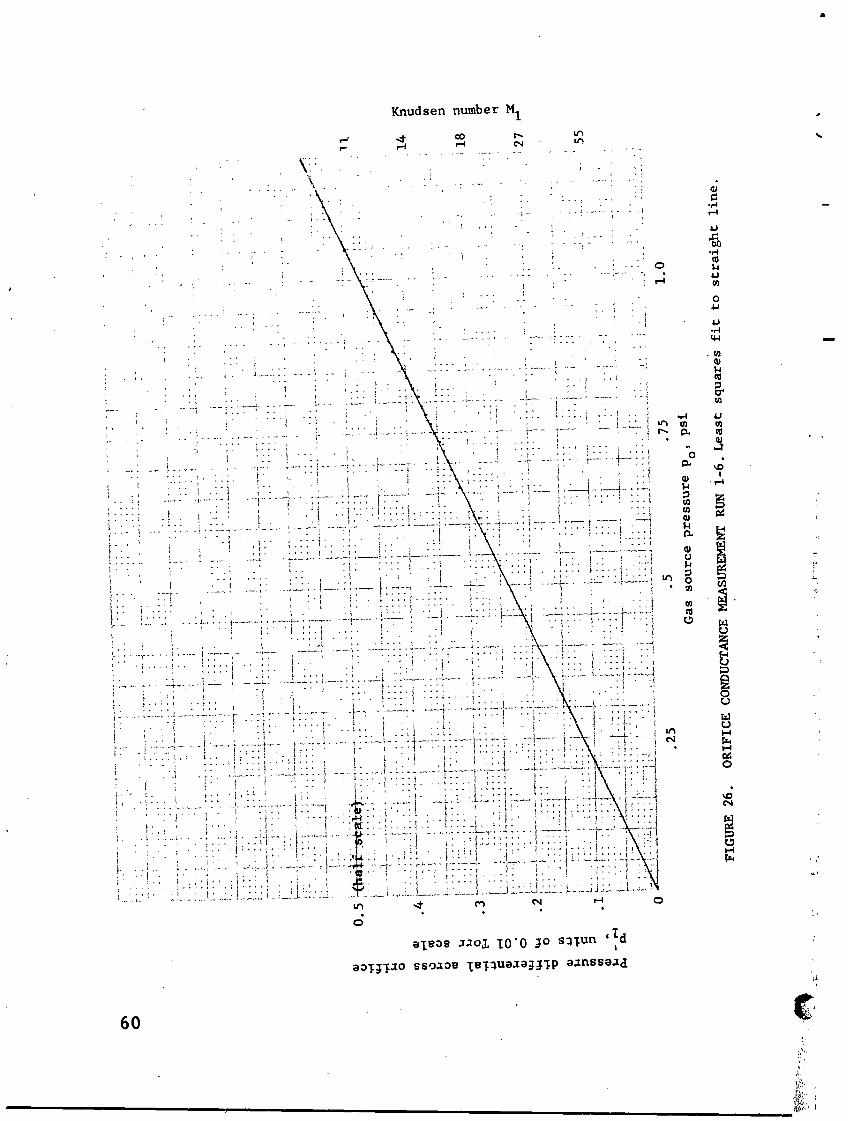
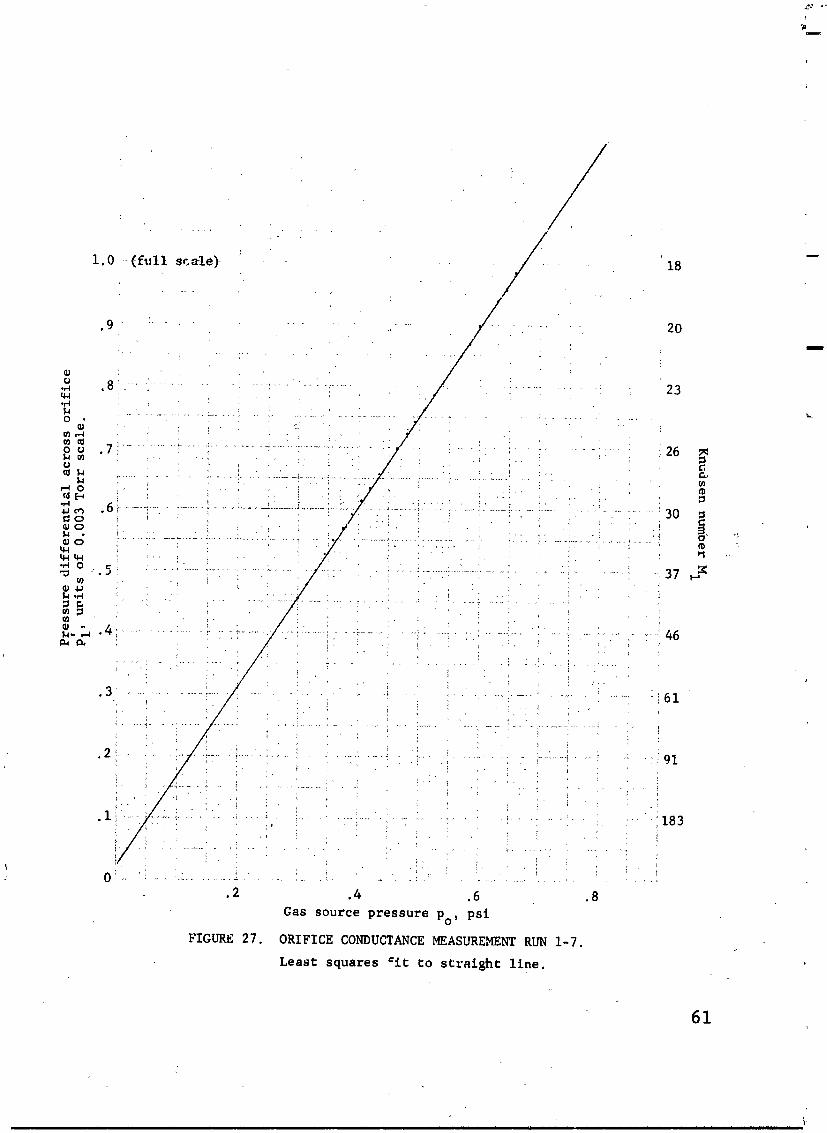
better. As may be seen from Figures, 26 and 27, which show least
squares fits of straight lines for the data of p' vs Po for Mfrom 12 to 40, the linearity assumption appears good; the relative
standard error estimate for these least square fits is approxi-
mately 0.5%. A total of 266 data points were daken over therange 10-3 Torr to I0-I Torr.
!
If measurements of Pl in Equation {4.2,19) were madeusing scale j, then for the extension of measurements of M 2
below M2= 3.3, the factor* _ is obtained by substitution ofEquation _.2.20} into Equation (4..2.1_ . The resulting ex-c.
pression for _, the multiplicative factor denoting the devia-
tion from free molecular flow through the orifice, is given by
t po 2-_- ---- (4.2.21)
= 0.0893 dp° ,I P2k
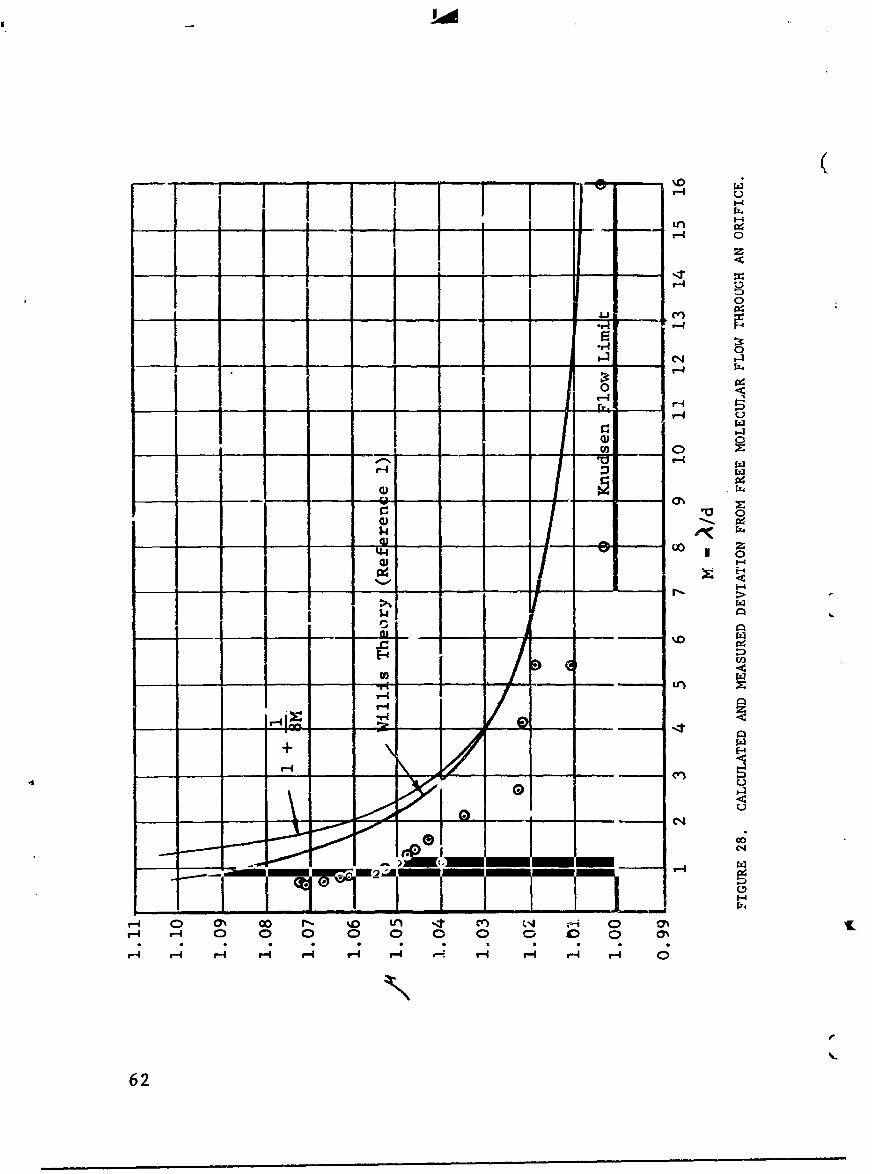
Figure 28 is a plot of _. given by Equation (4.2.21),
versus M, where Y (Equation (4.2.7)) for argon at 304°K is foundfrom Dushman 30 to be 5.42 x 10⁻³ cm/Torr. Also on Figure 28 is
plotted u as given by Willis' complete first iterate treatmentof the orifice flow from upstream on the axis of the orifice in
which second order corrections were applied to correct for flow
from downstream. /'Le latter correction procedure is probably
in error for M less than about 3. Finally, on Figure 28 is
plotted the curve representing Equation _.i.2_ the first orderexpression for u given by Liepmann.
It is a temptation to conclude that Willis' correction tofree molecular flow accounts well for the measured deviation.
However, a measurement of the diameter of the orifices after
the completion of the entire experimental program showed a 2.5%
and 8% increase in the diameter of orifice 1 and orifice 2,
respectively, which leads to undertainty in calculating the
theoretical conductance. It was expected that orifice 2 would
show yield, since while carrying out leak testing procedures inD
59
Ii J
tr i
1966018675-066
Knudsen number MI
°r4 _
OU
' " _ ...... Z ...... '. ................. 0
.,-I
o
0Z 4
L
S
', .... ' ..... 1 .... _ ' ) )
eleo_ _ao_ I0'0 _o s_!un 'Id
eoT_Ti=o s_o=oe l_T3,ue.zez:TTp o._nsse.Zcl
_o (
'],
iii>-N::i
] 9660] 8675-067
I
2O
fl}
m,-i 0 m
_ 3713 _,
.2 .4 .6 .8
Gas source pressure Po' psi
FIGURE 27. ORIFICE CONDUCTANCEMEASUREMENTRUN 1-7.
Least squares =it to straight line.
61
i i i HI i u i i i HI iii ii i ilrl ?
1966018675-068
f
62
1966018675-069
the extreme high vacuum system, a large pressure differential
was applied across the orifice.
However, in the previoas orifice experiments, a conductance
was put in parallel with the orifice to minimize such pressure
differentials during pumpdown. Since orifice i was found to
have been yielded much less than orifice 2, it is probable that
most of the yielding of orifice 2 occurred after the orifice
flow experiments were complete, that is, during the XHV experi-
ments. If, for example, the frdctional yield of o':ifice 2
during pumpdown for the orifice flow experiment w_ about thesame as for orifice i, then to first order there would be no
correction to the treatment given above or to the experimental
curve in Figure 28. Thus, depending on the fractional yield
occurring during pumpdown for the orifice experiments, the
experimental curve in Figure 28 could be in error up to about11% which is much greater than the deviation that must be m._
explained. It is for this reason, and because as M gets large,the measured deviation from Knudsen flow goes to zero, that
it is assumed the yield of orifices i and 2 was nearly the same
during the orifice experiments and u plotted in Figure 28
requires no correction. The problem of the yielding of theorifice must have a more satisfactory solution for the calibra-
tion system. Possible solutions are that the pressure differ-
entials applied must be kept small enough, or perhaps a stronger
material tban copper may be used for the orifice and still
maintain a sufficiently low temperature gradient in the orifice
material. However, even the copper orifice used in the experi-
ments described above showed a large temperature gradient.
4.3 Scattering Effects in Molecular Beam Sources
It is concluded from the results shown in Figure 28 that
the deviation from Knudsen flow for small M may be estimatedwith some precision from Willis' first iterate solution. This
gives one confidence in the range of pressure over which
molecular flow theory may be applied. In the calibration system,measurement of the pressure in the molecular furnace is notcarried out so that correction to the molecular flow throughput
need not be made. The throughput of the orifice must be identi-cal with the throughput of the porous plug which is always
maintained in the molecular flow regime as shown in Section 3.
63
I
1966018675-070
Thus, the correction to the downstream intensity of the (beam becomes a question not of the throughput but rather of the
angular distribution of the beam as it effuses from the orifice,and of the scattering that occurs downstream of the orifice. This
is a distinct problem not connected with the total flow rate ofthe orifice as considered above, but rather with a secondary
effect on the intensity of the molecular beam downstream of theorifice. With respect to total flow rate. the back scattered
flow from downstream of the orifice which must occur due to gas-
gas collisions in the vicinity of the orifice, has been con-
sidered by Willis and found for M = 3 to be nearly 10% in magni- •tude of the increased flow from upstream. The gas-gas collisionsoutsid_ the orifice are expected to be increasingly more im-
portant as M is decreased. Knauer and Stern 38 were the firstto show that as M is decreased, the intensity downstream isdecreased. The reason for this decrease was claimed to be the
formation outside the orifice of a "cloud," the area of which
is the emitting surface for the molecular beam rather than that
of the orifice. At any given value of M, the effect is dependent
on the particular type of orifice used. For example, Knauerand Stern 39 dismissed Mayer's 40 criticism of their "cloud" theory
on the basis that a stronger cloud formation should occur for
their slit type of orifice than for Mayer's circular orifice,
since the intensity, a distance r from an emitting slit. •
should vary as l/r, however for" a circular orifice as I/r 2.
Knauer and Stern, using a slit, showed for H20 that the cloudeffects appear at M = 3 and less. Kratzenstein, 41 using a
circular orifice, showed for potasium thac ciGud formation was
just detectable at M = 1.6.
Other experimental problems affecting the detection ofcloud formation arise from scattering phenomena. Johnson 42
suggested that Knauer and Stern saw the cloud at large Mvalues because of scattering from background gas near the
orifice. He suggested the remedy of cryopumping in this area
as is used in tbe present calibratien system. In addition,
the effect of small angle scattering is more noticable as one
moves farther away from the orifice where all the scatteringtakes place. As the detector with its finite opening is brought
close to the furnace orifice, molecules scattered through onlysmall angles are still collected, lhus, since in the calibra-tion system high pressures and, thus, small M will be used
when the distance _ is small, therefore, the effect of the
scattering or "cloud" formation will be least. It is expected
that the effect of this scattering on the beam intensity would
64
1966018675-071
|
not become evident before that of deviation _, due to collisions
inside the orifice. Therefore_ Willis' theory may be used to
estimate the M below which unacceptable deviations in the beam
flux occur. From Figure 28 it may be seen that the deviationbecomes 1% for M = 13.
4.4 Nonequilibrium Effects in Molecular Beam Sources
The last constraint on the molecular furnace and beam
orifice system arises from the requirement that the gas be it_
thermal equilibrium with the isothermal furnace walls and that
density gradients in the furnace be negligibly small. There areseveral distinct elements to this constraint.
The first element in maintaining density gradients small
is that the conductance of the furnace be very great comparedwith that of the orifice. This is not difficult to attain for
any reasonable aperture size.
Second, there is the requirement that the orifice area be
small compared with the internal surface area of the furnace
so that wall collisions will be orders of magnitude more frequent
than will be passages through the orifice. This is analogous
to the problem that arises when an exit hole is made in a black
body cavity. Also, if a temperature gradient exists in theorifice material due to radiation to the 4°K cryopump, then it
is required that the wall surface be large compared with thearea of orifice material having an excessive temperature
difference from the furnace temperature.
The third element is concerned with the finite mass flow
rate of gas through the furnace and orifice which ma_ lead tononequilibrium of the gas with the furnace. _arnes 4 and alsoCooke 4_ using different methods have treated some prob]ems
arising from such mass flow. It may be seen that this non-
equilibrium effect decreases and finally becomes negligible _s
the mean free path approaches and exceeds the furnace dimensions.In that limit, gas-wall collisions are more frequent than are
gas-gas collisions and there is no opportunity for the moleculesto deviate from a Maxwellian distribution characteristic of the
temperature of the wall.
65
1966018675-072
5. CALIBRATION EXPERIMENT OF PROTOTYPE SYSTEM
The prototype calibration system was installed in the extreme
high vacuum system in order to make use of the low temperature
helium gas cryopumping system_or attaining conditions of low
background density. Johnson, _ in 1927, suggested _at the devi-ation from molecular flow found by Knauer and Stern JU in their
molecular be&m experiment was due to background gas collisions
and could be eliminated by cryopumping between the furnace and
detector. The cylindrical cryopumped cavity used in the present
experiment is 45 cm. in diameter by 60 cm. long. It may be seenin Figure 29a. Previous experiments 45 carried out in this systemhave shown that if the wall were maintained at about 8°K the
capture coefficient for argon would be greater than 0.999. This
is supported by the work of Dawson, et ai,46 who show the capture
coefficient for argon to increase to unity as the temperature is
decreased below about 12°K. A different view is expressed by
Foner, et al, 47 who give the capture coefficient for argon on a
4°K surface to be 0.6, but their experimental conditions are lesswell defined than those in the other experiments. Figure I is aschematic of the installation.
f
The molecular furnace and gas source was joined to the cryo-
pump wall by means of a stainless steel bellows, as may be seenin Figure 29b. A conical radiation shield which operates at the
temperature of the rest of the cryopumped cavity shields the 300°K
beam orifice from the cryopump. The beam orifice may be seen
beyond the radiation shield in Figure 29a. The axis of the molecu-
lar furnace, and thus, the axis of the molecular beam, was alignedtoward the gauge in the cavity by adjusting three stainless steel
turnbuckles. The gauge was enclosed in a copper cylinder which
is shown mc'Inted in the cryopumped cavity in Figure 29a. The
theory of the calibration system using the gauge enclosure is
given in Section 2.2. The gas source, molecular furnace, andgauge enclosure were maintained isothermal by a common heat trans-fer line which circulated fluid around them. Water was used as
the heat transfer fluid and the temperature of the 30 liter bath
was maintained at 304°K + 0.03°K. The auxiliary equipment for
maintaining constant temperature, supplying and measuring argongas pressure, and measuring ion current of all ion gauges isshown in Figure 30.
The gauge in the enclosure was a hot filament suppressor
grid gauge. The orifice on the enclosure was a 1.6 cm. diameter (
66
iiiii
1966018675-073
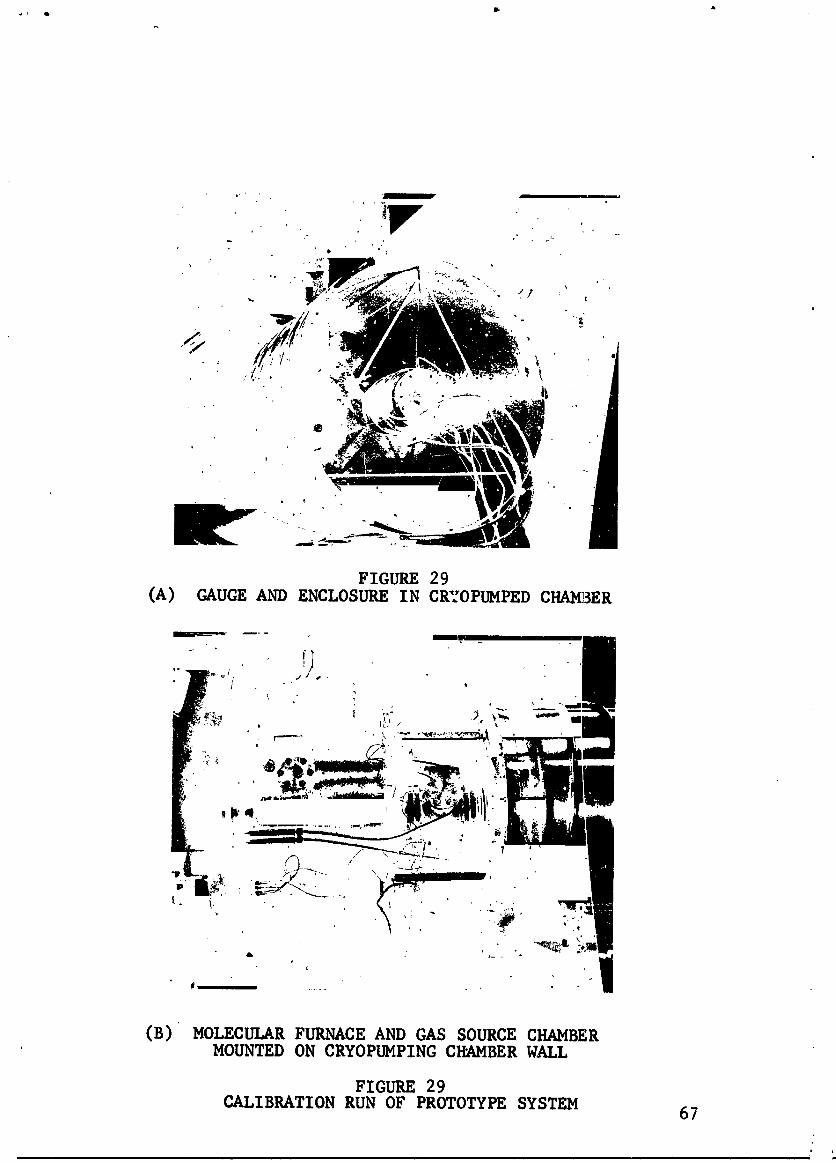
FIGURE 29(A) GAUGE AND ENCLOSURE IN CRYOPUMPED CHAMBER
(B) MOLECULAR FURNACE AND GAS SOURCE CHAMBER' MOUNTED ON CRYOPUMPING ClimBER WALL
FIGURE 29CALIBRATION RUN OF PROTOTYPE SYSTEM
67
1966018675-074
i
f
68
- 1966018675-075
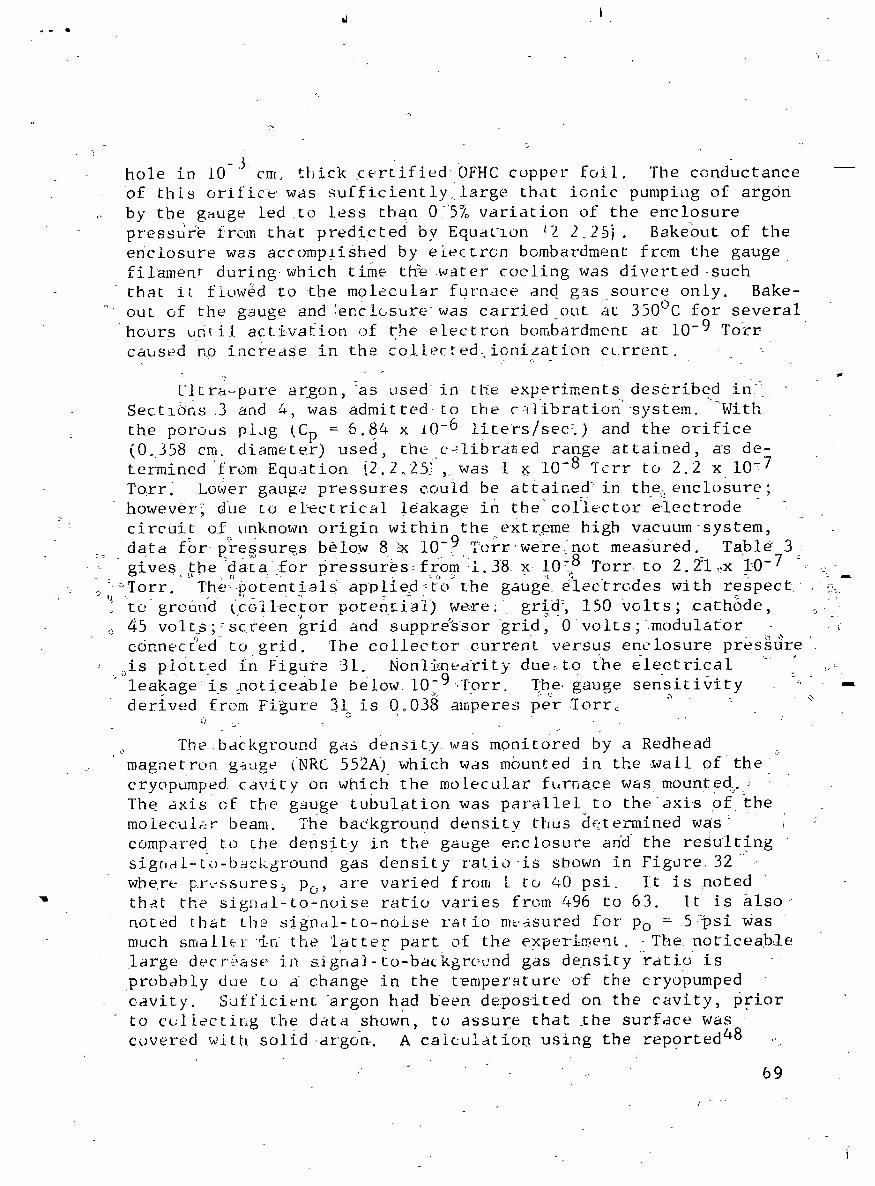
c
hole in i0-j- cm. thick certifiedOFHC copper foil, The conductance
of this orifice' was sufficiently.ilarge that ionic pumping of argon
, by the g_uge led .to less than 0_5% variation of the enclosure
press_r_e from that predicted by EquaL-ion t2 2.25_. Bakeout of theenclosure was accomplished by electron bombardment from the gauge
filament during, which time thee.water cocling was diverted suchthat it fiow$d to the molecular furnace and g_s source only. Bake-
_ out of the gauge and :enclosure was carried out at 350°C for severalhours until acti_va_ion of the electron bombardment at 10-9 Tort
caused no increase in the coiiec_ed_ionization cL.rrent. -_
L;]cra_pure argon, :as used in the experiments described in_
Sectl0ns .3 and 4, was admitted _to [he c:_libration'-system. _'_With
: the porous plug _Cp = 6.84 x 10⁻⁶ iiters/sec:.) and the orifice(0.358 cm. diameter) used, the c-_.libra_ed range attained, as de-
termined "from Equation (2o2o25S, was i _ 10-8 Tcrr, to 2.2 x 10⁻⁷
To:rr. Lower" gauge pressures could be attained:_ in the _enclosure;however, due Lo el:ectrieal leakage in the collector electrode
$" . g
circuit of unknown origin wlthin the extr_eme high vacuum-system,
, :_ data for p_re._sur_s below 8 _ 10-9 _:orr'were_not measured. Table 3_gives tbe_data £or pressures fr0m_.38 x I0_8 Torr, to 2.2_11_,xi_0-7 =
_: o:°Torr. The_.i_otentials_ applied=to r:he gauge e_lectrodes with respect-__E te gro6nd (Coilec_or-pote6_.ia!) we_,re',grid:, 150 Volts, cathode,
o 45 volt s;-_screen grid and suppreNsor grid, 0 -volt s;_,modulator
connec_'edt0 grid. 'Ibe collector current -versus enclosure presSUre: is p_otted in Figure 31. Nonli_nea-rity due._.t.othe electrical
leakage is _oticeable below lO-9.Torr• The-gauge sensitivity _' --
derived from Figure 31._is 00038 amperes per .7orr_
T.he_background gas density_ was monitored by a Redhead
magnetron ga,age (NRC 552A) which was mounted in the .wall of-the
cryopumped cavity on w_ich the molecular furnace was mounted.. _
The: axis of the gauge tubulation was parallel_ to the-axis Of :themolecular beam. The background density thus d_te,nnined was _
compared to the density in the gauge enclosure and the resultingsignal-to-background gas density ratio is shown in Figure 32
where _.._:_ssures_Pc,, are varied from L _o _0 psi. It is noted_" that the sig:_l-to-noise ratio varies from 496 to 63. It is also-
noted that the sign,_l-Lo-noise ratio m_,._sured for' Po = 5rP si Wasmuch small(_r 'in_ the 'latter part of the experi-menL, _The. noticeable
large decr'_]_asein a_gr,a]-to-backgr'e_.'nd gas density 'ratio is
probably due to a change in the temper'_ture of the cryopumped
cavity. Suffici_.nt argon had been deposited on the cavity , prior
to cul.lecting the data shown, to assure that .the surface wascovered wiLh solid .argo_. A calculation using the reported 48 .,_
J ., 69
1966018675-076
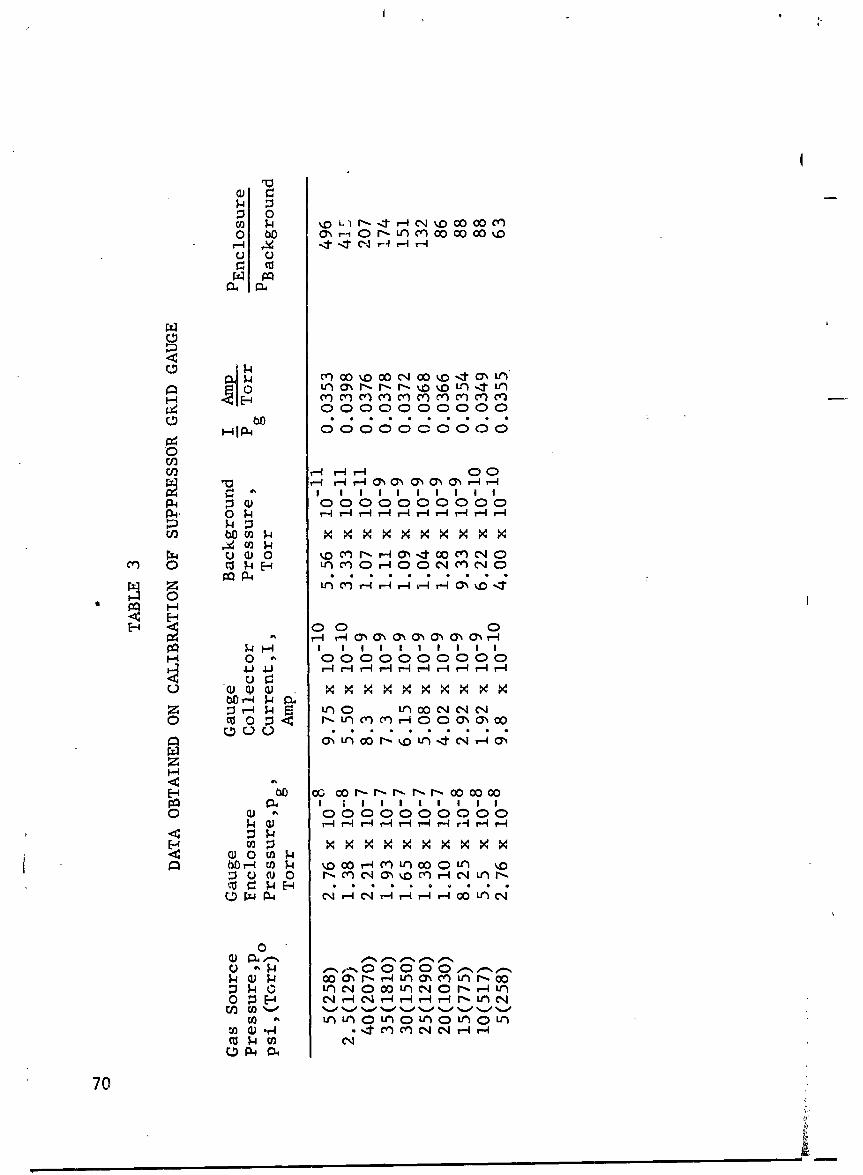
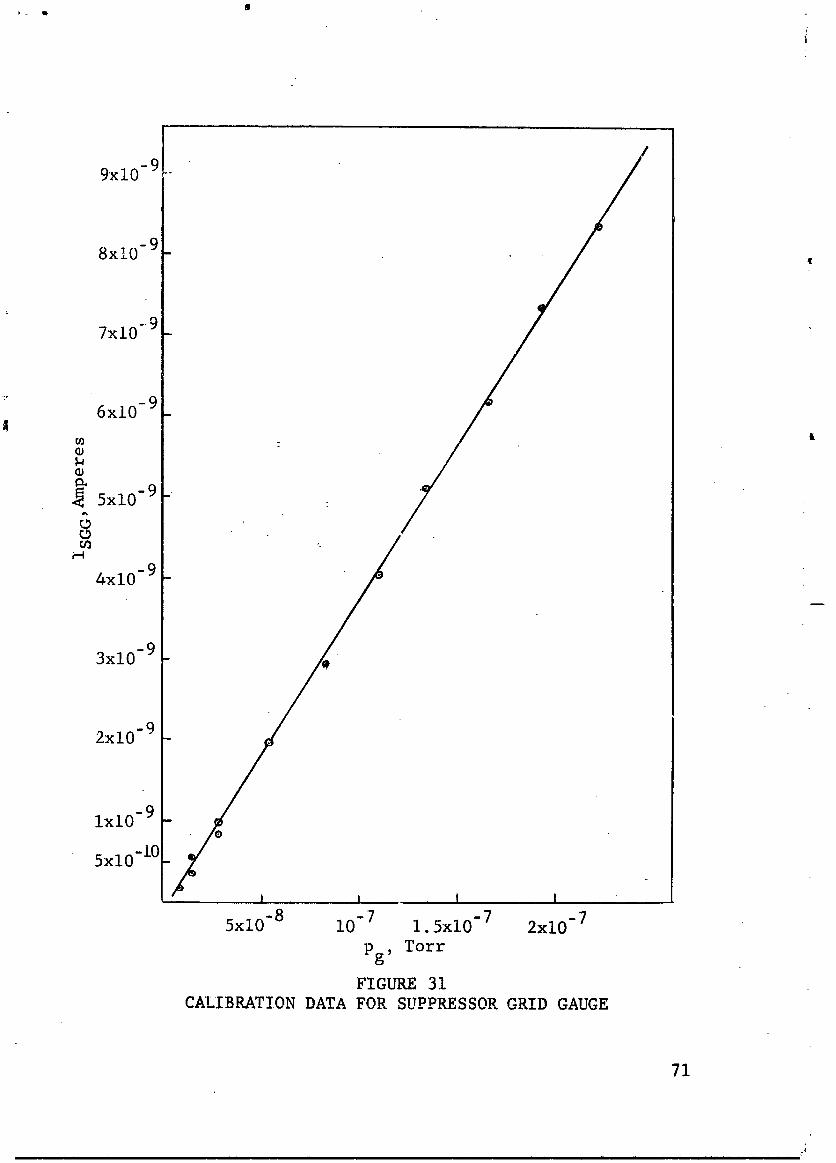
9x10 -9 .
8x10 -9 -
7x10" 9 _
6x10 -9 _4
ra_ z L
-9
; /4x10- 9
3x10 -9
2x10 -9
ixl0 -9
5x10 -I0
I I I i
5x10 -8 10-7 I.5x10 -7 2xlO -7
pg, Torr
FIGURE 31
CALIBRATION DATA FOR SUPPRESSOR GRID GAUGE
71
ii i i i i i . . i .ii i i i i
1966018675-078
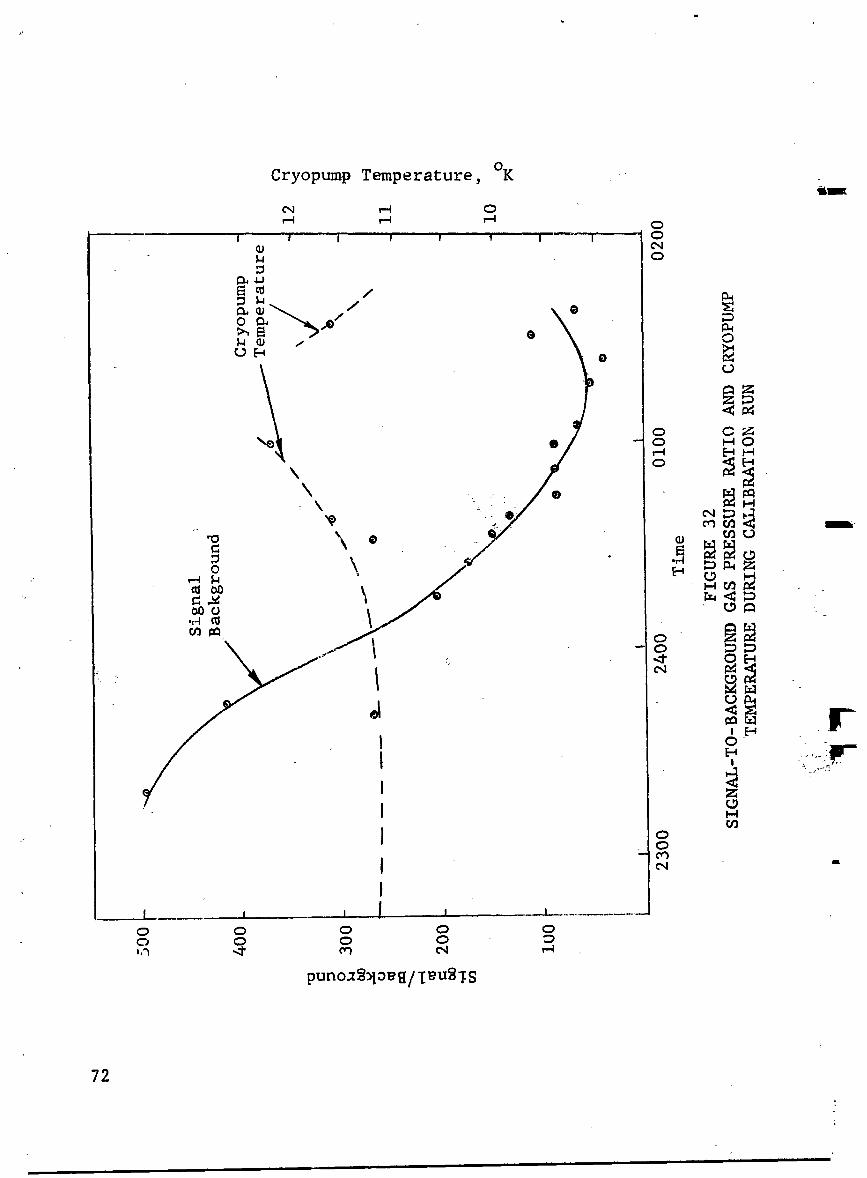
72L
. I | I II If II I I I III II I I I " I II llllllnlll
1966018675-079
|
Iheat conductivity of solid argon shows that the heat of conden- rs_tion or radiated heat available is insufficient to significantly |increase the surface temperature° Due, however, to a failure in
the helium heat transfer system tbere was a temporary increasein the temperature of the circulating gaseous helium. Tne
measured increase was from approximately ll°K to approximately '
12OK. The data of Dawson, et al, 46 indicate that a decrease in
capture coefficient of argon from unity occurs in this range of
temperatures. In addition, desorption of cryosorbed hydrogen icould add a significant gas load. In o_d_r to investigate the ..
possible effects of this on the data, the average of the tempera-
tures of the helium gas out of the cryostat and the return gas
is also plotted in Figure 32 on the same time scale as for the
signal-to-background pres3ure ratio. It is seen that there is a "
rough correlation between the decrease in signai-to.-backgroundratio and increase in average gas temperature.
m
,_ 6o DISCUSSION, RLSULTS, AND CONCLUSIONS _
During the construction and testing of th_ calibration ---
--_ system prototype apparatus, individual components of the system
havebeen examined in detail. Those areas in which the problemsconsidered have been resolved will be discussed below and the
appZication of these results to calibration system designprinciples will be presented° Discussion Of those areas in
which future work is considered necessary will be deferred runtil Section 7o _
mO
6.1 Porous Plug [It was shown in Section 3 that a porous Vycor glass plug
may be effectively used as a pressure attenuation element
between the gas source chamber and molecular furnace for pres-
sures at least as high as 5200 Torr for argon at 304°K_ The
lowest'pressure in the gas source chamber that may be used i_
that: for which the National Bureau of Standards will presently ,_ -certify a measuring device, namely 15.5 Torr; therefore,_the
dynamic range of the calibration system that may be obtainedby variation of 'the gas source chamber pressure is at least '_--
350. The addition of a differential pressure gauge between the
73
L u
Mln
1966018675-080
i
rotating piston gauge and gas source chamber of ehe calibration
system allows that system to be used to determine the porousplug conductance. Thus, the conductance of this very criticalelement of the calibration system could be measured at any time,
providing a continuing on-site calibration of the system.
The apprehension that contamination due _o exposure of
the plug to atmospheric air may have a large effect on subse-
quent flow measurements has been found to be groundless. A
deliberate attempt to contaminate a porous Vycor plug for more
than 1/2 day by flowing humid atmospheric air through it was "_followed by a measurement that showed the conductance for argonto be within 1.5 times the standard deviation obtained by con-
sidering all conductance measurements.
A _orous Vycor plug with a conductance smaller than7 x i0-° liters/sec was made and by combining the techniques
used for fabricating the plugs _n this investigation, a porousVycor plug of less than 2 x I0 -° liters/sec probably could be
made. Using well controlled heat treatment techniques it may
then be possible to shrink the pore structure and reduce theconductance to a still lower value. This may be desirable
for attaining the lowest level of pressure (10 -15 rorr) sinceit would mean that both the beam attenuation orifice and
auxiliary cryGpump could be eliminated and all the pressure
attenuation could be accomplished with the porous plug and
beam aperture conductances.
The two porous plugs used were subjected to a maximum
stress level on the order of 1500 psi. Porous Vycor is manytimes stronger than this 7 even for long time loading, so that
the gas source pressure attained is not limited on that basis_
in the case of plug no. 2 which was sealed in a compression
mounting with indium, a stress level of about 500 psi was
reached in the indium which is approximately the tensile strengthfor pure indium. 50 A step increase was found in the measuredconductance. Tightening the plug in the mounting caused the
conductance to decrease to its former value. Since a higher
strength material is desirable and since the low melting point
of indium restricts the temperature attainable in degassing
required for proper system preparation, future compression
mountings should use a metal such as gold that does not havethese undesirable characteristics.
74
1966018675-081
6.2 Beam Orifice
It was found that various metal foils of sufficient qualityfor use as orifice materials are available in the thickness
range down to 2.5 x 10⁻⁴ cm. This allows the fabrication of
orifices with negligible (i 1/2%) Clausing corrections (see
Equation {4.1.4))for diameters as small as 0.05 cm. An orificeas small as 0.i0 cm diameter was fabricated in 10-3 cm thick
OFHC copper foil. The circularity of the orifice was betterthan 1/2%. Two problem areas were found which require con-
sideration in future work. The first was that during the
pumpdown of the system a large enough pressure differential
was attained across the orifice material to cause it to yield.
Figure 33 shows the yielding of the 10-3 cm thick OFHC copperof orifice #2. The diameter of the orifice was found to be
increased by 8 percent. The solution to this problem would be
to provide a sufficiently large parallel conductance betweenthe molecular furnace and cryopump cavity during pumpdown.
The second problem was the relatively high thermal resistance
of the thin orifice material leading to a noticeable radial
temperature gradient due to heat radiation from the 300°K
foil to the ll°K cryopump wall. This gradient is illustrated
in Figure 33 where the condensation of diffusion pump oil
resulting from a failure in the liquid nitrogen trappingsystem, may be seen. The pattern of condensation clearly
indicates the temperature gradient that must have existed.
The result of this was that the assumption of isothermal
molecular furnace walls was violated. The most satisfactorysolution is to increase the ratio of the area of isothermal
walls and baffles to the area of orifice material. Another
approach is to consider a knife edged type of orifice but
the effect of such non-ideal aperture geometry would have to
be carefully investigated in order to define the error intro-duced.
The results of the experiment to determine the departure
from free molecular flow as the mean free path of the gas in
the molecular furnace was made comparable with the diameter of
the orifice, were presented in Section 4. It is seen from theresults plotted in Figure 28 that the ratio of the measuredflow to that calculated for free molecular flow is approxi-
mately that predicted by theory and the departure is _ess than
one percent for Knudsen numbers greater than about M = 12.It is seen from Equation (2.2.25) that considering only the
75
1966018675-082
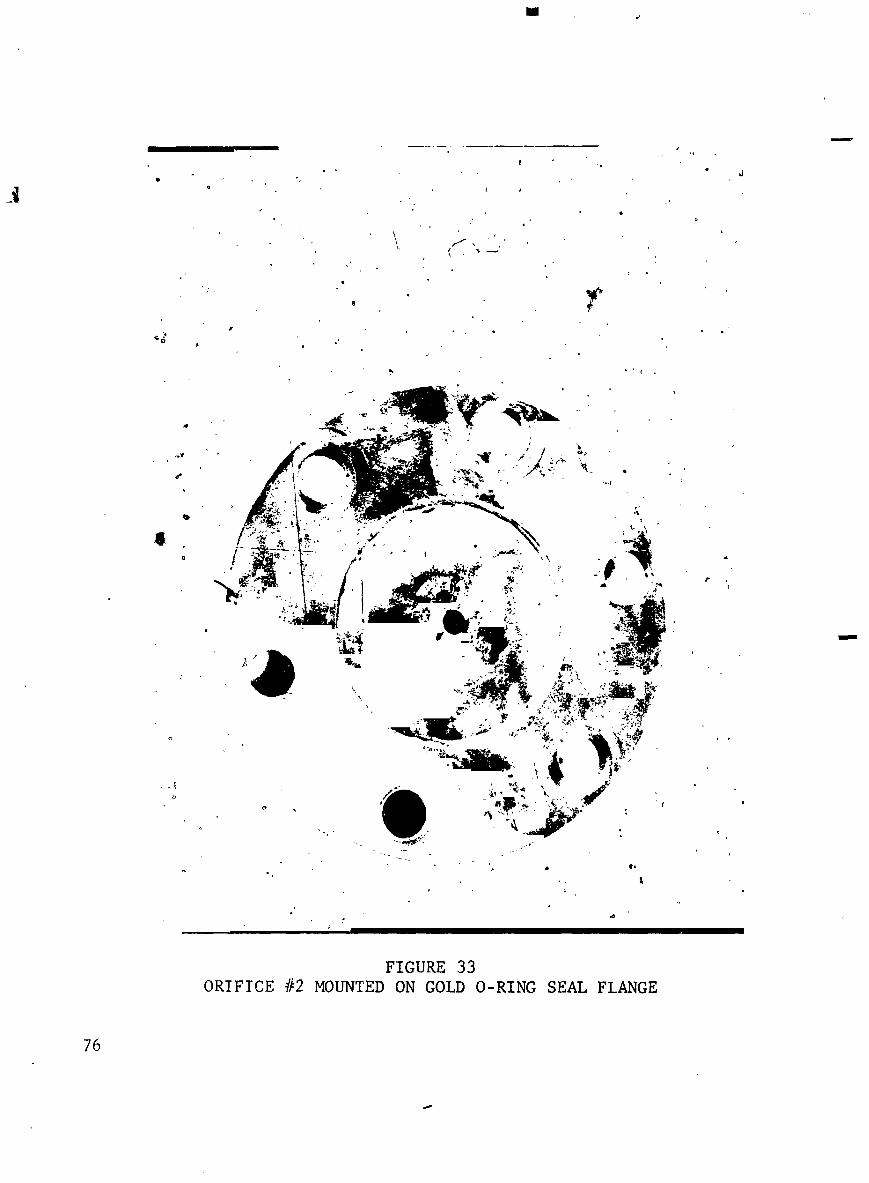
FIGURE 33ORIFICE #2 MOUNTED ON GOLD O-RING SEAL FLANGE
76
1966018675-083
density of the molecular beam or gas enclosure density, not thetotal throughput, then for the case where the molecular furnace
attenuation aperture conductance, C, is zero, the effect of
transition flow through the beam orifice conductance, Ca, isat most of second order due to the appearance of C =nd_ iu thenumerator and the denomenator. If C # 0 deviations from
molecular flow lead to deviations in pg which are not compensatedas above when C = 0. Thus, it is desirable to operate the
calibration system with C = 0. As will be shown below, in order
to attain the lower limit of pressure desired (i.e., 10-15 Tcrr)
the constraint that C = 0 requires that Cp be decreased by atleast two orders of magnitude which may ehvolve substantial
fabrication problems for porous plugs of Vycor glass. However,
the minimum C reauired depends on the lower limit of gas sourceppressure, Po, for which the National Bureau of Standards willcertify a pr(ssure gauge. At present the Pressure and VacuumMeasurements Sections of the Naticnal Bureau of Standards are
not prepared to calibrate a commercially available absoluteinstrument below 15.5 Torr, but they expect, in the near future,
to be able to certify certain gauges to 0.i Torr with an
accuracy of 1/2 percent.
The above conclusions were based on the assumption that
deviations in beam intensity resulting from scattering down-stream of the orifice are a weaker function of M than is the
deviation in throughput. These deviations in beam intensityresult from the formation of a "cloud" downstream of the
orifice as discussed in Section 4. Experiments to determine
the effect of the "cloud" on beam density were not made.
6.3 Molecular Furnace Equilibrium
In developing the theory of the calibration system and incarrying out the experiments on it, it was implicitly assumed
that the gas in the molecular furnace was in thermal equilibri-
um with the (isothermal) walls. There are severa] distinct
elements to this assumption: the conductance of the molecular
furnace must be large compared with the conductance of theapertures; the area of the aoerture and non-isothermal orifice
material must be small compared with the furnace wall area;
the center of mass velocity of the gas through the furnace
must be sufficiently small compared to the mean thermal velocity
that the gas may be considered in equilibrium with the furnacewalls.
77
1966018675-084
The problems associated with the first two elem_Lts above
were solved by their proper consideration during the design of
the molecular furnace. The problem of non-isothermal orificematerial as discussed above in reference to Figure 33 must be
more carefully considered in future work. The non-equilibriumcondition due to finite mass flow rate of the gas is negligi-
ble if the gas mean free path greatly exceeds the molecular
furnace dimensions, since the temperature of the moleculesthen becomes that of the wall. As the mean free path becomes
smaller, the influence of gas-gas collisions becomes more
important than gas wall collisions. In the absence of a quanti-
tative measure of the extent to which the gas becomes non-
equilibrium due to gas-gas collisions, an estimate of the effectma> be made based on the ratio, R, of the collision probability
in the gas phase to the collision probability with the furnace
surface. This ratio is given by kinetic theory for a gas of
mean free path _ in a spherical cavity of radius rf as
2y_R = -- . (6.3.1)3_
Thus, the probability for collision with another gas molecule
is less than that for collision with the cavity wall if
is about equal to the furnace dimension and becomes negligible
with increasing _. For a cylindrical cavity, R is still
smaller. Thus, it is expected that for a gas whose mean freepath is at least as large as the furnace dimension, the de-
parture of the distribution from that of a gas in thermal equi-libriumwith the wall is small. Due to the relative insensiti-
vity of the average velocity to small changes in the distribution,
it is concluded that errors introduced into Equation (4.1.I)
by molecule-molecule collisions will be negligible as long as
A df or in terms of the Knudsen number Mf = _/df _ I.
6.4 Time to Establish Calibration System Equilibrium
In the practical application of the calibration system, itis necessary that the time to set up equilibrium in the system
be reasonably short. The approach to equilibrium of a volume
V filled or evacuated through a conductance C is exponential
in time as was shown in Section 3. Equation (3.2.3) shows the
time constant to be V/C. In the calibration system, the timesto establish equilibrium in the following volumes are of inter-est:
78
1966018675-085
!
Io Source chamber
2. Gauge enclosure3o Molecular furnace
In changing the pressure in the gas source chamber, benefitis obtained from the fact that viscous flow conditions lead to a
high effective conductance C. Thus, by providing a sufficientlylarge bore tube connecting the gas source chamber to its gas
supply, the time lag in arriving at equilibrium in the gas sourcechamber can be made negligible.
Equation (2.2.20) shows that the diameter of the gauge
enclosure must be maintained large for gauge pumping effectsto be negligible. Even for gauges with pumping speeds as small
as 0.I liters/sec, the enclosure conductance must be at least20 liters/sec so that the time constant of a i liter enclosure
would be approximately 0.05 seconds.
The desired value of the conductance, Ca, of the molecularfurnace will vary with the pressure range covered. As can be
calculated from Equation (2.2.25), the smallest conductance,
Ca, required in a calibration system to reach 10"15 Torr for
an attenuation aperture diameter.of 0.5 cm and Cp = 1.6 x 10⁻⁷llters/sec is about 3.8 x 10 -3 llters/sec. Thus, the timeconstant for a i liter molecular furnace is about 4.5 minutes.
By decreasing Cp and Po suggested in Section 6.2, Ca maybe increased with a consequent decrease in the time delay inestablishing equilibrium.
In addition to these time delays associated with the
volumes discussed above, there can be a substantial delay
associated with the attainment of equilibrium in the porous
plug. It may be shown 15 that the time lag, TL, in establish-ing equilibrium for flow proceeding by a diffusion mechanism
is directly proportional to the square of the length, L, ofthe element through which diffusion occurs and inversely
proportional to the diffusion constant, D, that is,
L2TLQ _--, (6,4,1)
Barrer 15 has shown for 300°K argon diffusion through porous
Vycor glass that T L = 44 minutes for L = 2.69 cm. Therefore,for a porous Vycor plug as thick as the one used in this
:)79
f
1966018675-086
d
investigation, namely 0.3 cm for porous plug #2, Equation (6.4.1)°
shows that
• 30 seconds. (6o4,2)TO.3cm
This is a reasonably short time lag and for porous plug #I used
in this investigation the expected time lag would be
• 5 seconds. (6.4.3)TO, llcm
[It should be noted that the T L Barrer measured probably in-cludes tile effect of filling up the blind pores in the plug.
During a change of pressure, Po, from one level to another, theeffect of filling these blind pores will be very much less thanin the first introduction of gas into evacuated pores and thus
the time lags calculated above are upper limits to TL.
During the experiments carried out and d_scribed inSections 3, 4, and 5, the approximate time, T , to attain 70%
of the equilibrium system pressure was determined. Some ofthese times are given below.
!
Gas source chamber: T • 2 seconds.!
Porous plug #I: T • 5°5 seconds.
Porous plug #2: T' • 14 seconds.
Porous plug #2, molecular furnace, and 0.i cm diameterorifice: Tv • 45 seconds.
Porous plug #2, molecular furnace, and 0.33 cm diameterorifice: T < 12 seconds.
Response of gauge in enclosure using porous plug #2 and0°33 cm diameter orifice: T' • 60 seconds.
6.5 Gas Properties
The performance of the calibration system depends on
various properties of the gas to be used. Some of these proper-ties will be considered here with respect to the behavior of
the gas in the various parts of the calibration system.
80m
1966018675-087
6.5_i Pressure-Volume-Temperature Relation for Gas
The virial equation of state may be written
PV = RT(1 + Bpp + Cpp 2 + .... ) (6.5.1)
where Bp, C_ etc. are the second, third, etc. virial coef-ficients, may be seen by comparison of Equation (6.5.1)
with Equation (2.0.10), a perfect gas has been assumed in
deriving the calibration equation, that is:
B - C - . . . m 0.P P
For argon at room temperature the error introduced by this
assumption is less than 1/2 percent for Po = 5200 Tort. However,
if the temperature is de_[eased to 200°K, the second virialcoefficient for argon is--
B - - 0.002941. (6.5.2)P
and at Po " 5200 Torr, the error in Equation (2.0.10) is 2%.Virial coefficients for the various gases are tabulated in
reference 51 and may be used to correct Equation (2.0.10).
Referring to these tabulated values it is seen that the correct-
ion is only important for the gas source pressure, Po, and maybe neglected for the gauge enclosure pressure, p_, since the
correction is negligible for pressures as low as_lO -5 Torr.
6.5.2 Adsorption and Desorption of Gas
Under some conditions of temperature and pressure, the
amount of gas adsorbed on the walls of a chamber may be a
substantial amount of the gas present. The calibration system
can be adversely affected by such a situation since smalltemperature fluctuations could, as a result, provide a signifi-
cant, uncontrolled, variable source or sink for gas. To in-
vestigate this situation the ratio, R, of the quantity of gas
adsorbed on a surface of area, A cm 2, with relative coverage,e, to that present zn the volume V cm3 at pressure P is con-
sidered. Since a monolayer of an elemental gas contains 52approximately 8 x 10¹⁴ molecules per cm2, the above ratio istherefore
%81
I
1966018675-088
R = 8.4 x 10⁻⁵ ACTPV (6.5.3)
F,r a spherical volume of radius i0 cm maintained at
300°K, this ratio is less than 1/2% for pressures greater than
1.5 Torr, even for a complete monolayer. Thus, for the case
of the gas source which is at a pressure at least an order
of magnitode greater than this, the effects of such sources
or sinks may be neglected. Taking into account the relative
coverage e as will be described below, it can be calculatedthat the quantity of gas adsorbed at the high pressures (5200
Torr) is small compared to that in the gas phase at low pres-
sures (15 Torr) so that desorption-time effects in the gas
source may be neglected. Of course, the gas source pressure,
Po, is always measured so that any desorption would be of
little consequence in any case.
In the case of the porous plug and molecular furnace, the
pressure decreases to less than 1.5 Torr, and these situations
must be considered more carefully. The relative coverage of
the wall 0, defined as the ratio of number of molecules ad-
sorbed per cm 2 to the number in a complete monolayer, is not
necessarily unity as assumed above. Hobson 53 has shown thatis well represented for a gas at temperature T and pressure
p by the Dubinin-Radushkevich equation,
_n e = - BR2T 2 _n , (6.5.4)
where B is a constant for the gas considered and Po is thevapor pressure that would exist above the liquified gas at
temperature T, given by the Clausius-Clapeyron equation,
E d
p = d e - , (6.5.5)O
where d and Ed are constants for the gas.
Using the value of the constants found by Hobson, the
solution of the relative coverage was calculated for the
82
1966018675-089
I
highest pressure expected in the molecular f irnace, namely,
p = 3 x 10 -3 Torr, and log 0 vs T is plotted in Figure 34.From Equation (6.5.3) it is seen that for R to be less than
1/2 percent, the following inequality must therefore hold forthe I0 cm sphere:
O_.TT< ±98. (6.5,6)p -
Substituting for _ obtained from Equation (6.5.4), thisbecomes
T e- BR2T2 n ! 198. (6.5.7)P Po
The solution to this transcendental inequality may beobtained by graphical methods° From Figure 34 and using in-
equality (6.5.6) it is found that for p = 3 x 10⁻³ Torr, the
inequality requires
T _ 103°K. (6.5.8)
Investigation of inequality (6.5.7) for lower pressuresshows the minimum allowed surface temperature T is yet
smaller. The fact that low temperatures are allowed for the
gauge enclosure is significant in attaining the lower limit of
pressure in the calibration system. The outgassing rate due
to the combination of permeation, diffusion and desorption ofgas is an exponential function of temperature. For well out-
gassed stainless steel, the outgassing rate, Q', at 300°K isof the order of 10-13 Torr liters/sec cm 2. Thus, for a stain-
less steel gauge enclosure of area A = I000 cm 2 which has a
200 iiter/sec conductance, C, to the cryopumped cavity, the
equilibrium pressure attained due to the outgassing of theenclosure is
p = _ = 5 x10-13 Torr_ (6.5.9)
-15To reach i0 Torr calibration pressure, the background pres-
sure must be at least 200 times lower, so a pressure of5 x 10"18 Tort must be reached in the gauge enclosure. It is
thus required that either a material with a lower outgassing
83
1966018675-090
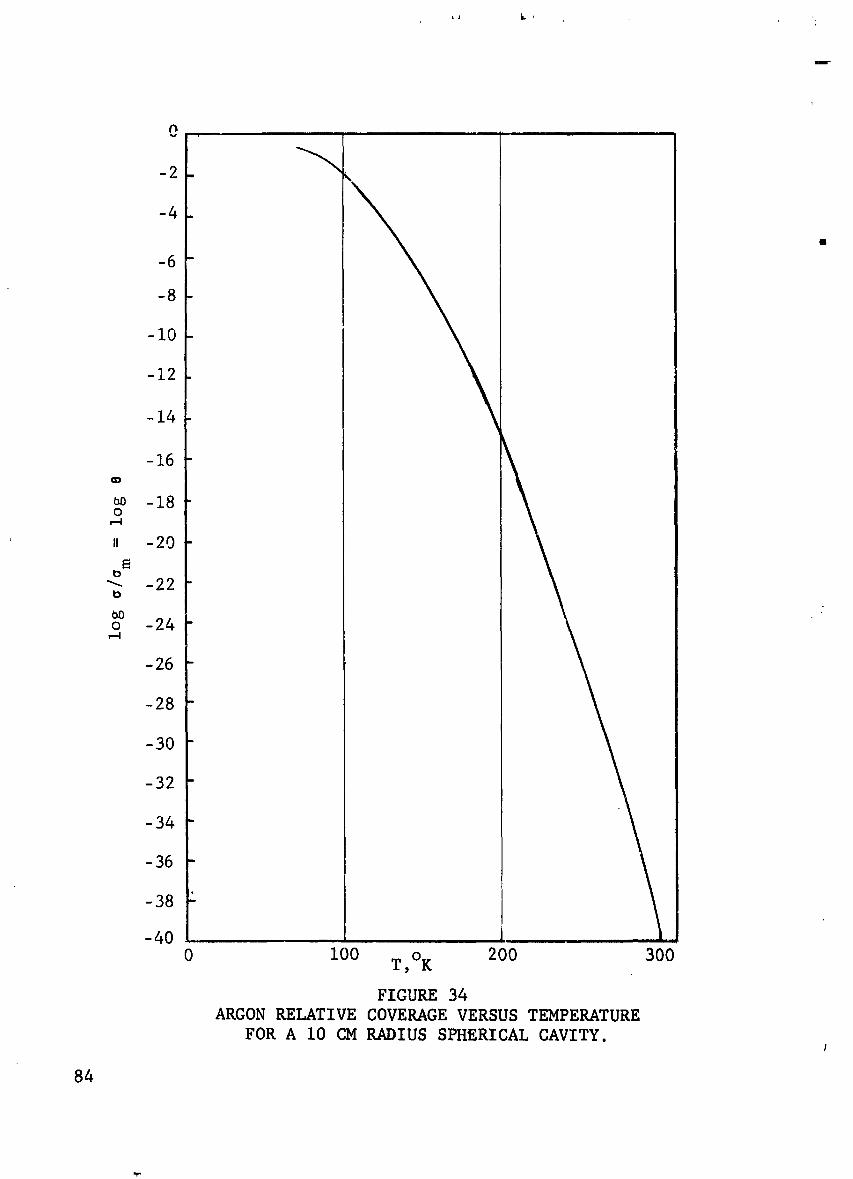
LJ k, _ ,
I
0
-2
-4
-6
-8
-i0
-12
-14
-16
_m -180
,--4
, -20
"_ -22D
O0o -24,--4
-26
-28
-30
-32
-34
-36 -
-38 2,
-40
0 I00 T, °K 200 300
FIGURE 34
ARGON RELATIVE COVERAGE VERSUS TEMPERATURE
FOR A I0 CM RADIUS SPHERICAL CAVITY.I
84
1966018675-091
rate be used or that the outgassing rate of the stsinless
steel be lowered by decreasing the temperature. Reducing thetemperature to 150°K reduces the total outgassing rate by
three to four orders of magnitude.
If the pressure in the gauge enclosure were Iuwered and
there were any time lag in arrival at equilibrium, the amount
of gas adsorbed at the initial pressure may be significant
compared with the equilibrium amount at the final pressure.In order to minimize this problem during operation ._ the
calibration system, the pressure should initially be low,
and the calibration conducted in the direction of increasing
pressure° This may not always be the situation so that the
time to reach equilibrium must be estimated. Due to the
similarity of this problem to other adsorption processes, itis expected that if the desorption is retarded below the
value:expected on the basis of kinetic theory, it is probably
due to an activation energy that must be provided. The rate
of desorptioh of adsorbed gas from a s_-face at temperatureT into a volume maintained at a pressure far below that corre-
sponding to an equilibrium coverage No is given by firstorder theory ,s54
dN = _ e" Ed/kT _d-F - • , (6.5.z0)
where N is the number of molecules adsorbed, Ed is the ._activation energy for desorption, and T is the effective
period of oscillation of the adsorbed molecule in the poten-tial field of the surface.
Solution of Equation (6.5.10) for N yields
m
N _ N e • • RT , (6.5.11)o
where NO is the number of molecules adsorbed at time t = 0.Equation (6.5.11) cbviously represents a decay of the number
of molecules adsorbed with a time co_tstant glven by
Ed/RT I_I " ,e . (6.5.12)
%85
1966018675-092
Now, the results of Section 6.4 show that after decreasing thepressure in the furnace at 304°K, equilibrium is set up in
less than I minute. Thus, _I in Equation (6.5.12) will betaken to be 1/2 minute. Now consider the approach to equili-
brium for temperature T2. In a similar manner to Equation(6.5.12) the time constant in the pressure decay is given by
Ed/RT 2= Te . (6.5.13)_2
m
Therefore, from Equations (6.5.12) and (6.5.13) it is seenthat
_2 = _le . (6.5.14)
Now, for argon, the heat of desorption is53 1558 calories/
mole so that for T 2 = 100°K, Equation (6.5.14) yields a timeconstant,
_2 = 95.3 minutes. (6.5.15)
This provides an upper limit to the time la_ that could
occur in the attainment of equilibrium when the pressure is
suddenly decreased in the molecular furnace or gauge enclosure
at 100°K. It is unlikely that such a delay would occur due to
the relatively low activation energy for desorption.
Incestigation of Equations (6.5.3) and (6.5.4) shows that
the ratio, R, of gas adsorbed on the surface to that in the
volume is negligible for most of the range of pressure over
which the porous plug is operated. The result, observed in
this and in other investigations and discussed in Section 3,
that kinetic theory does not account for the observed porousplug conductance with respect to molecular mass is therefore
surprising (see Equation _.I.3) ). If the ratio, R, for_ argon were significant, an increased conductance for argon
over helium could be accounted for since the ratio of the
relative coverages, 0 , for argon and helium at, say, 15 Torrand 304°K from Equation (6.5.4) is _I0 _J. The value of the
argon to helium conductance ratio measured in this investiga-
tion is 0.344 which is 8% larger than that predicted bykinetic theory (see Equation _.i._). The opposite trend
86
I u 1
1966018675-093
noted by Barrer and Barrie (see EquaL±on {3.1_3))can not beaccounted ,for on the.basis of surface f%ow but such observa-
tions could be-accounted for by atomic size effects.
6.5.3 Background Gas Pressure
As was shown in Section 61_.2 , the background gas densitymust be kept as low as 5 x i0- v Torr. This pressure level
requires the use of cryosorption or cryopumping. The data onvapor pressure of gases shows that for helium the wall tempera-
ture must be _ 0.215°K, for hydrogen 0.48°K and for neon notless than 3°K. Since these temperatures are economically im-
practical in large systems, these gases must be excluded from
the system. For all other gases 10°K is sufficiently low forthe vapor pressure to be less than 5 x 10-18 Torr. Another
requirement for low background pressure is that the capturecoefficient, a , for the gas be sufficiently close to unity.
In the case of several gases, a has been shown 46 to increase
to unity for T < 10°K. As discussed in Section 5, the measured
signal-to-background ratio was at least 40 at about 12°K im-
plying a large value of a . The measurement of a should be
performed for a 4.2°K surface where a would be expected torise above the desired value of 0.995. Previous experience 45
has shown that 8°K is a sufficiently low temperature to attain
at least this large a capture coefficient.
A calculation was made of the time required for the gas
effusing from the furnace to form a uniform condensate of signi-
ficant thickness (2.5 x 10⁻³ cm). For the condition of the
largest throughput expected in pract=ce, this time is I000hours so that the buildup is insignificant during a calibration
experiment. Furthelnuore, a calculation of the temperature
gradient across the condensate due to the heat radiated fromcontemplated gauges or the gauge enclosure is found to be com-
pletely negligible. On the other hand, due to the low heat of
vaporization of liquid helium, the boil-off rate of liquid
helium resulting from the radiative heat load would be at leastseveral liters per hour.
The technique of beam chopping and synchronous detection
may be used to solve the problem of background gas inter-
ference. This scheme may be unfeasible at the lowest pressure
due to the relatively long time constant of measuring devices
for extremely small currents.
87
1966018675-094
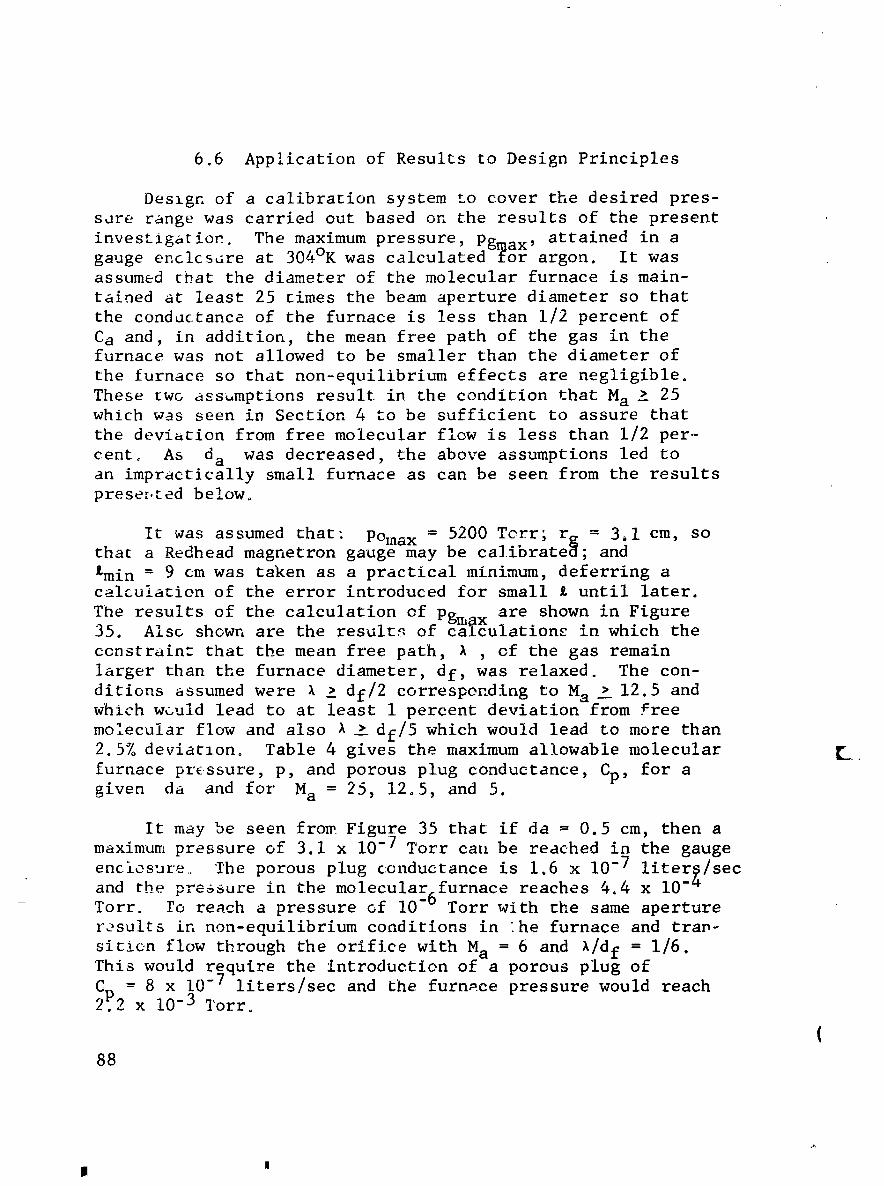
6.6 Application of Results to Design Principles
Deslgn of a calibration system to cover the desired pres-
sdre range was carried out based on the results of the present
investigation. The maximum pressure, Pgmax' attained in agauge enclosure at 304°K was calculated _or argon. It wasassumed that the diameter of the molecular furnace is main-
tained at least 25 times the beam aperture diameter so thatthe conddctance of the furnace is less than 1/2 percent of
Ca and, in addition, the mean free path of the gas in thefurnace was not allowed to be smaller than the diameter of
the furnace so that non-equilibrium effects are negligible.
These two assumptions result in the condition that M a _ 25which was seen in Section 4 to be sufficient to assure that
the deviation from free molecular flow is less than 1/2 per-
cent. As da was decreased, the above assumptions led toan impractically small furnace as can be seen from the resultsprese_[ed below°
It was assumed that: Poma x = 5200 Torr; r~ = 3_I cm, sothat a Redhead magnetron gauge may be caliDrate_; and
_min = 9 cm was taken as a practical minimum, deferring acalculation of the error introduced for small _ until later.
The results of the calculation of pg are shown in FigureX . .35° Also shown are the results of calculations in whlch the
constraint that the mean free path, _ , of the gas remain
larger than the furnace diameter, df, was relaxed. The con-
ditions assumed were ; g df/2 corresponding to Ma__, 12.5 andwhich w_uld lead to at least i percent deviation from free
molecular flow and also _ _ df/5 which would lead to more than2.5% deviatlOno Table 4 gives the maximum allowable molecular [_
furnace pressure, p, and porous plug conductance, Cp, for agiven da and for Ma = 25, 12o5, and 5.
It may be seen from Figure 35 that if da = 0.5 cm, then a
maximum pressure of 3.1 x 10-.7 Torr can be reached in the gauge
enciesure_ The porous plug conductance is 1.6 x 10 -7 liter_/sec
and the pressure in the molecular6furnace reaches 4°4 x I0-_Torr. ro reach a pressure of i0- Torr with the same aperture
results in non-equilibrium conditions in he furnace and trap-
sitien flow through the orifice with M a = 6 and _/df = 1/6.This would require the introduction of a porous plug of
8 7C_ = x I0- liters/sec and the furnace pressure would reach2_2 x 10-3 Torr.
(88
l
1966018675-095
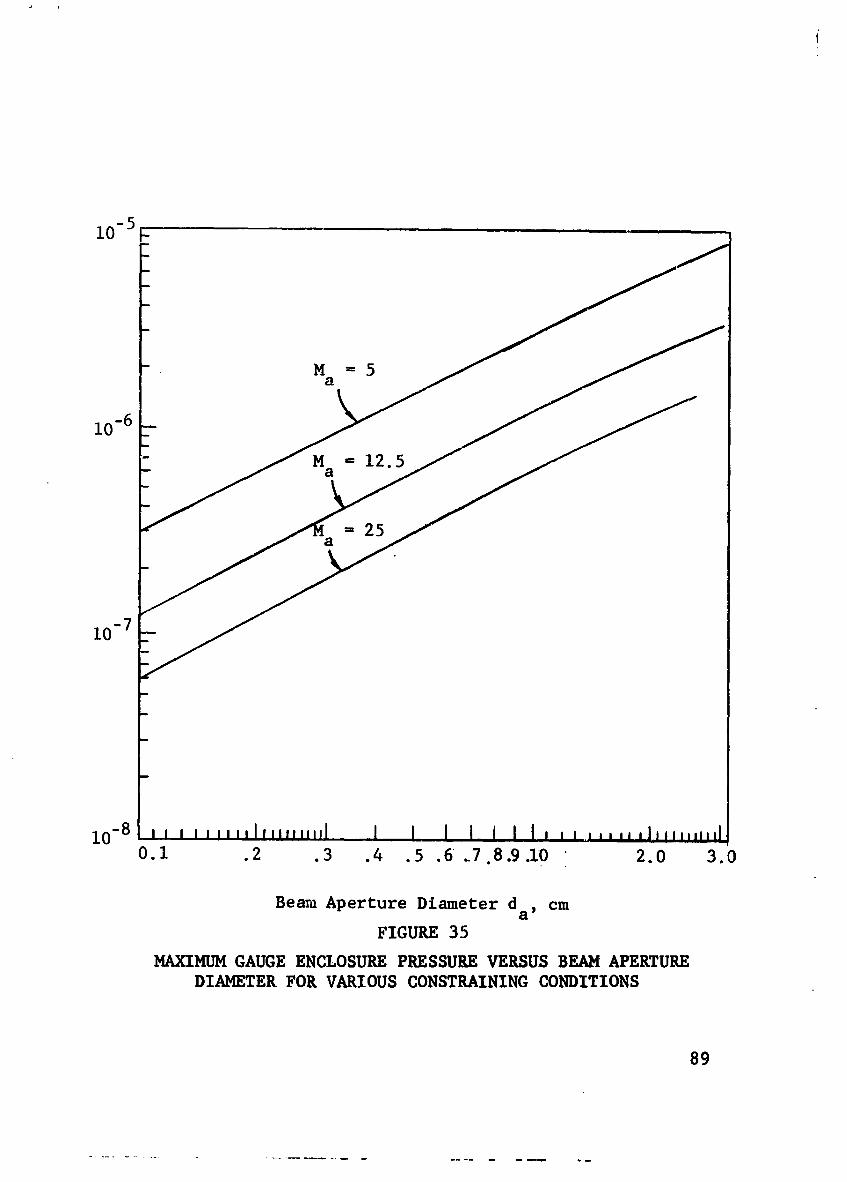
-510 i--
i0-8 ,,,,,,,,,l,,i,J,,,,JI I I I I I l,,i,,,,,,l,,,,,,,,,l0.I .2 .3 .4 .5 .6 .7.8.9.10 2.0 3.0
Beam Aperture Diameter d , cmaFIGURE 35
MAXIMUM GAUGE ENCLOSURE PRESSURE VERSUS BEAM APERTUREDIAMETER FOR VARIOUS CONSTRAINING CONDITIONS
89
1966018675-096
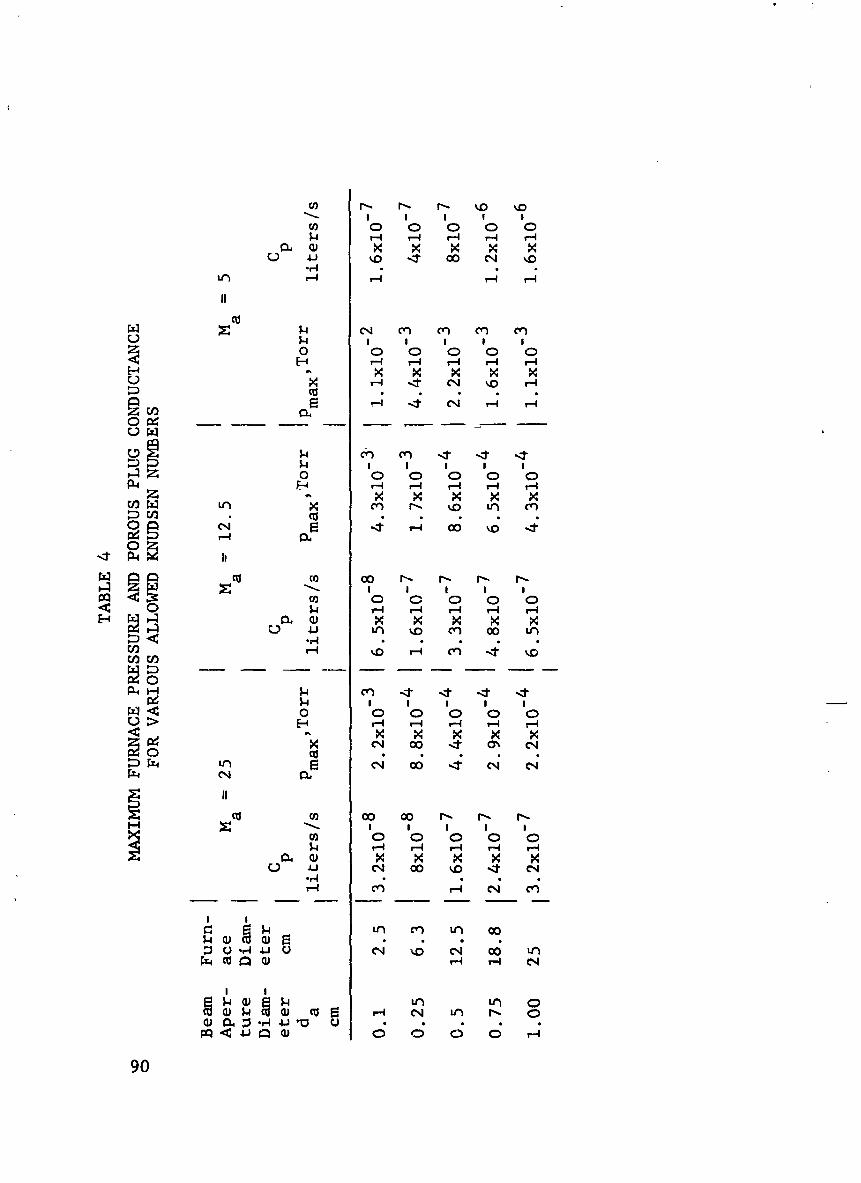
I I I I I
0 O C) 0 0
II
<I_ 0 0 0 C) 0 0
_-I I I I I I
_1_ O O O O O O
_r_ _l • •
.,_ ,,
_ _ _ _0 _ oo u_,r=_
mm
_ _ o o o o o
I U r_o o o o
o_ • N N N N N
_ N _ d M
I I
_ _ ml_
I I
90
1966018675-097
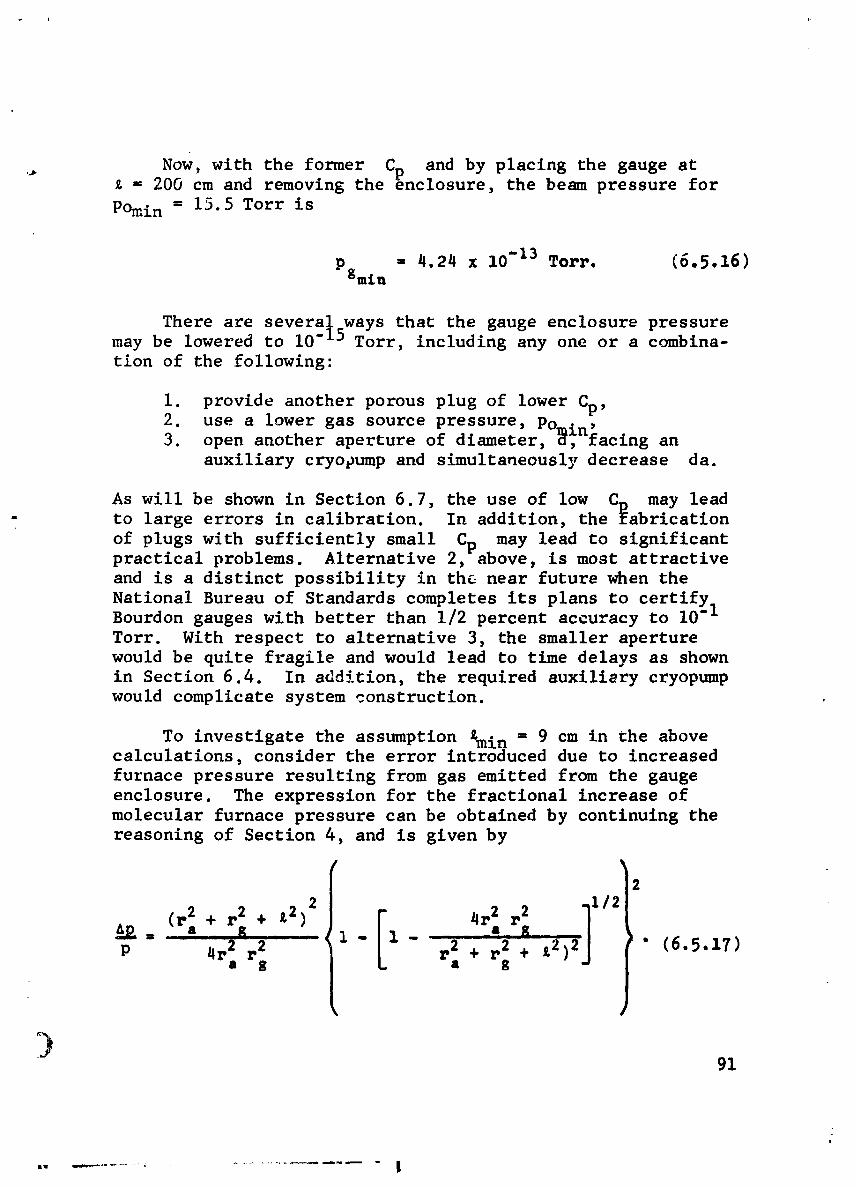
,_ Now, with the former Cp and by placing the gauge at= 200 cm and removing the enclosure, the beam pressure for
POmi n = 15.5 Torr is
Pgmtn = 4.24 x 10 "13 Tore. (6.5.16)
There are several ways that the gauge enclosure pressuremay be lowered to 10-15 Torr, including any one or a combina-
tion of the following:
i. provide another porous plug of lower Cp,2. use a lower gas source pressure, Po • ,
3. open another aperture of diameter, _nfacing an
auxiliary cryopump and simultaneously decrease da.
As will be shown in Section 6.7, the use of low CD may leadto large errors in calibration. In addition, the fabrlcation
of plugs with sufficiently small Cp may lead to significantpractical problems. Alternative 2, above, is most attractive
and is a distinct possibility in th& near future when the
National Bureau of Standards completes its plans to certifyBourdon gauges wlth better than 1/2 percent accuracy to I0-I
Torr. With respect to alternative 3, the smaller aperture
would be quite fragile and would lead to time delays as shownin Section 6.4. In addition, the required auxilisry cryopump
would complicate system construction.
To investigate the assumption _min = 9 cm in the abovecalculations, consider the error introduced due to increased
furnace pressure resulting from gas emitted from the gaugeenclosure. The expression for the fractional increase of
molecular furnace pressure can be obtained by continuing the
reasoning of Section 4, and is given by
2
[ ]+ + ,2)2 1/2= i- i- .a gp 4r2 r2 r2 + r2 + ¢2)2 " (6.5.17)
a g a g
1966018675-098
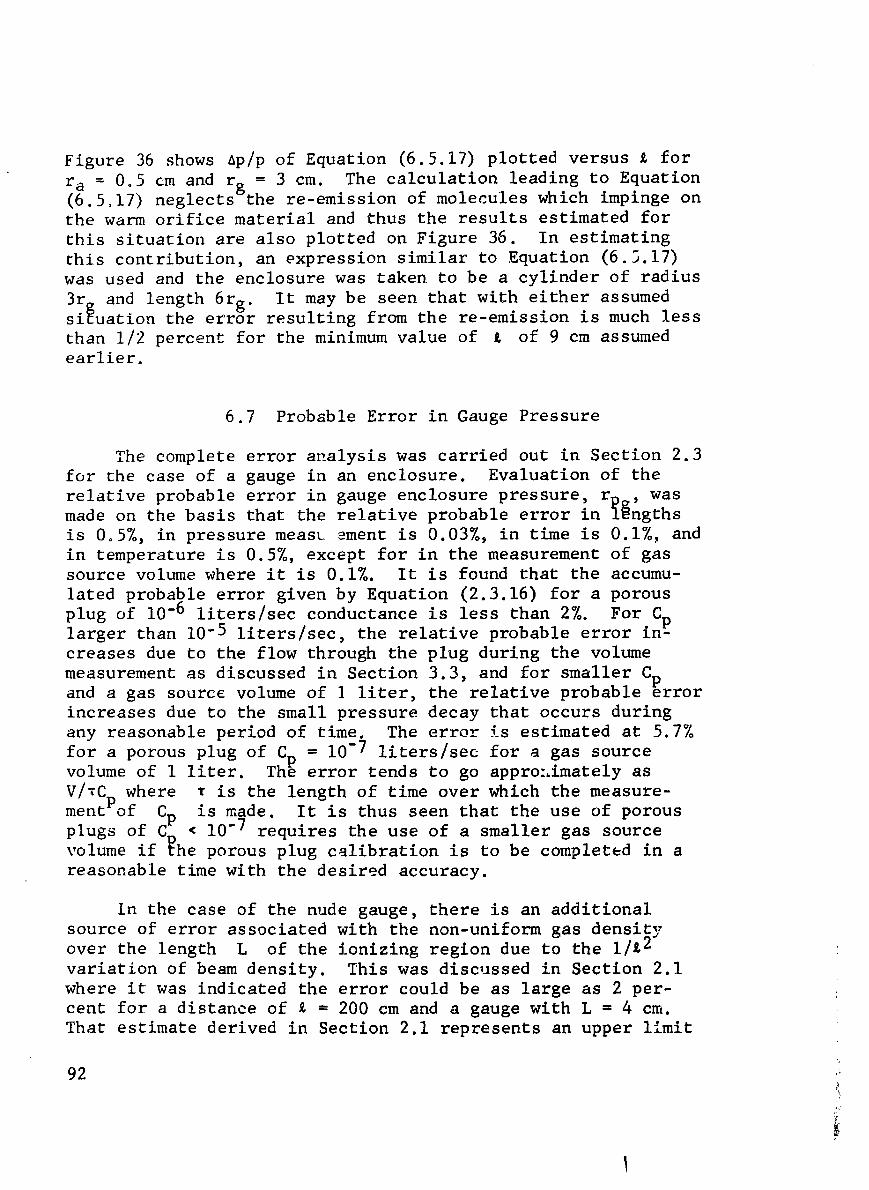
Figure 36 shows _p/p of Equation (6.5.17) plotted versus _ for
ra = 0.5 cm and r_ = 3 cm. The calculation leading to Equation(6.5,17) neglects_the re-emission of molecules which impinge onthe warm orifice material and thus the results estimated for
this situation are also plotted on Figure 36. In estimating
this contribution, an expression similar to Equation (6.5.17)was used and the enclosure was taken to be a cylinder of radius
3rg and length 6rg. It may be seen that with either assumedsituation the error resulting from the re-emission is much less
than 1/2 percent for the minimum value of _ of 9 cm assumedearlier°
6.7 Probable Error in Gauge Pressure
The complete error analysis was carried out in Section 2.3
for the case of a gauge in an enclosure. Evaluation of the
relative probable error in gauge enclosure pressure, rp_, wasmade on the basis that the relative probable error in l_ngths
is 0.5%, in pressure measu ement is 0.03%, in time is 0.1%, and
in temperature is 0.5%, except for in the measurement of gassource volume where it is 0.1%. It is found that the accumu-
lated probable error given by Equation (2.3.16) for a porous
plug of 10-6 liters/see conductance is less than 2%. For. Cplarger than 10-5 liters/see, the relative probable error in-
creases due to the flow through the plug during the volume
measurement as discussed in Section 3.3, and for smaller C
and a gas source volume of 1 liter, the relative probable _rrorincreases due to the small pressure decay that occurs during
any reasonable period of time. The error is estimated at 5.7%
for a porous plug of Cp = 10-7 liters/see for a gas sourcevolume of 1 liter. The error tends to go appro:_imately as
V/TCp where T is the length of time over which the measure-ment of C_u is made. It is thus seen that the use of porous
plugs of C_ _ 10-7 requires the use of a smaller gas sourcevolume if the porous plug calibration is to be completed in areasonable time with the desired accuracy.
In the case of the nude gauge, there is an additional
source of error associated with the non-uniform gas density
over the length L of the ionizing region due to the i/_ 2
variation of beam density. This was discussed in Section 2.1where it was indicated the error could be as large as 2 per-
cent for a distance of _ = 200 cm and a gauge with L = 4 cm.
That estimate derived in Section 2.1 represents an upper limit
92 _
r
1966018675-099
t',4
I I I o
'd/dr
93
t
1966018675-100
to t_e error' in p_, referred to the midpoint _ of the gaugemdue to the integrating effect of the gauge with respect to
pairs of points equidistant from _ along a ray from the molecu-mfar beam aperture° The additional error due to the i/z 2 varia-
tion is thus expected to be much less than 2% for _ = 200 cm.
7. RECOMLMENDAIION FOR FUTURE WORK
From the results obtained in the work that has been com-
pleted and from the more complete understanding of the potentialof this calibration method resulting from exp=_ience with the
system, there has developed a clear need for additional re-search work° The recommendations for future research work
are discussed separately below°
First, in the interest of achieving maximum operational
efficiency and a wide calibration range_ it is necessary tolet the beam-forming furnace aperture approach as near as
practicable to the upper bound ef the free molecular flow
regimeo This upper boundary may be defined as that pressure
at which the conductance of the aperture deviates by a pres-
cribed amount from the free molecular flow conductance° Experi-
ments were performed to _etermine the conductance properties
of an aperture in the range of smal] Knudsen numbers° In these
experiments it was found necessary to extrapolate the calibra-tion of the gauge used to measure the pressure differential
across the aperture beyond, the range over' which it was cali-bratedo Also, during these experiments some accidental yield-
ing of the aperture occurred° However, from the results of
this experimental work and some recent theoretical work, it
ncw appears that fair agreement between experimental resultsand theoretical mrediction of ¢cnductance deviation from molecu-
lar flew conductance for small Knudsen numbers may be possible.Therefore, an experiment should be performed in which theaperture conductance is measured as a function of Knudsen
number over the range I to 25 and the deviation of the actualconductance from free molecular flow conductance determined
as a function of Knudsen number° In order to maintain the
aperture differential pressure gauge_within its calibrated
range, it is probable that three apertures will be required°Conductance around the aperture should be provided to prevent
94
I
1966018675-101
J,
yielding during pumpdown. The conductance deviation as afunction of Knudsen n_mber should be calculated from theory.
The experimental deviation data should be correlated withdeviation theory and the upper pressure limit for which the
measured deviation departs from the theoretically predicted
deviation by less than a prescribed amount established. If
theory is not sufficiently precise at small Knudsen numbers,
the experimental data alone may be used to establish the con-ductance deviation down to the minimum Knudsen number for
which there is high confidence in the accuracy of the data.
It is estimated that this will lower the limiting Knudsen
number by about a factor ef 8.
The second problem recommended for future research,
which is closely related to the first, concerns the angular
distribution of atoms effusing from an apertur_ operatingat small Knudsen numbers. The deviation of the aperture con-
ductance from its molecular flow value, to be determined in
the above experiment, is actually a measurement of the devia-
tion in the total flux effusing from the aperture as comparedto free molecular flow. In atomic beam applications, it is
necessary to know also the angular distribution of the ef-
fusing flux. Free molecular effusion through an aperture hasa cosine angular distribution; however, it is expected theo-
retically that the distribution shifts toward the forward
direction as small Knudsen numbers are approached. This has
the effect of increasing the flux density near the beam axis
at small Knudsen numbers. If full advantage is to be takenof driving the beam aperture into the range of low Knudsen
numbers, an experiment must be performed to determine the
deviation between the actual angular distribution of the flux
effusing out of the beam aperture, and the free moleculaz
flow distribution (cosine) as a function of Knudsen number
(for small Knudsen numbers). If the angular distributionis a strong function of Knudsen number in a range which is
acceptable with respect: to all other considerations, this
would impose a new constraint on the system in that a limitwould be set on the minimum distance between the beam aper-
ture and gauge enclosure aperture; however, if the deviation
in angular distribution becomes substantial only at Knudsen
numbers that are below limits imposed by other considerations,no new constraint is introduced.
The third problem that requires further investigation
involves the signal-to-noise ratio (beam pressure to background
95
1966018675-102
W7
pressdre ratio). It has already been determined experimentally
that large signal-to-noise ratios are attainable° However.there exists some possibility that substantial density varia-
tions could occur in the background gas density in the cavity
and thus introduce a spurious dependence of gauge enclosure
density on the distance between the beam aperture and gauge
enclosure aperture. It is therefore necessary to conduct
further experiments in which a detailed density survey of the
cryopumped cavity is made at various beam densities or to con-duct a chopped-beam experiment at various beam densities in
which the signal-to-noise ratio would be measured directly°
The fourth problem that requires further research is
somewhat related to the above experiment in the sense that
it is concerned with the ultimate background densitY attainableboth in the cryopumped cavity and in the gauge enclosure.
Cryopumping experiments have been conducted, under somewhat
different conditions, in which the background density attained
was be_w the limit of detectability of any gauge available(_ i0-_J Torr) o Total surface gas desorption measurements
have been made after applying ultra high vacuum processing
techniques, from the results of which it is calculated that
0 tbe background pressure inside the gauge enclosure due toou_gassing and desorption of the enclosure should be no great-
er than _ 10-13 Tort. Using extremely rigorous processing
techniques it is confidently expected that substantially lower
background pressures are attainable inside the gauge enclosure.
However, it is essential in establishing the accuracy anddynamic range of this method of calibration that the ultimate
background pressure attainable be submitted to direct experi-
ment_l determination in an actual system.
The fifth recommended investigation may be considered
an o_erall proof of performance of the calibration system.
After having completed the above experiments, sufficient datawiil be available to specify all known constraints and to
apply accurate corrections for all known deviations fromkinetic theory° An experiment should then be performed in
which che beam density is varied over its complete allowed
range and the beam aperture-to-detector distance is varied
o_er its complete allowed range. The calibration systemmeasured performance should then be correlated with predictedperfommance_ The absel.ce of substantial deviations between
these two sets of data may be taken as proof that system per-
forma_ce is known and predictable within the prescribed accu- fracy° Q
96
1966018675-103
Sixth, it is very desirable for calibration purposes that
the conductance properties of porous Vycor be known for several
gases over the range of temperat1_/e ,hat may be useful in thelaboratory_ An experiment should therefore be performed on a
porous Vycor diffuser in which its conductance is determined
for several additional gases and in which the temperature of
the gas source and porous plug is varied over a temperatureinterval which is a substantial fraction of normal tempera-
ture for at least one gas. It is also desirable to evaluatethe problems encountered in fabrication and calibration of
small conductance (10-8 to 10-7 liters/sec) porous plugs.
The final recommendation for future work is to synthesize ,
the theory, experiment:_l data. and experience developed inthis program and apply it to the design and specification of
a complete calibration system.
i
1966018675-104
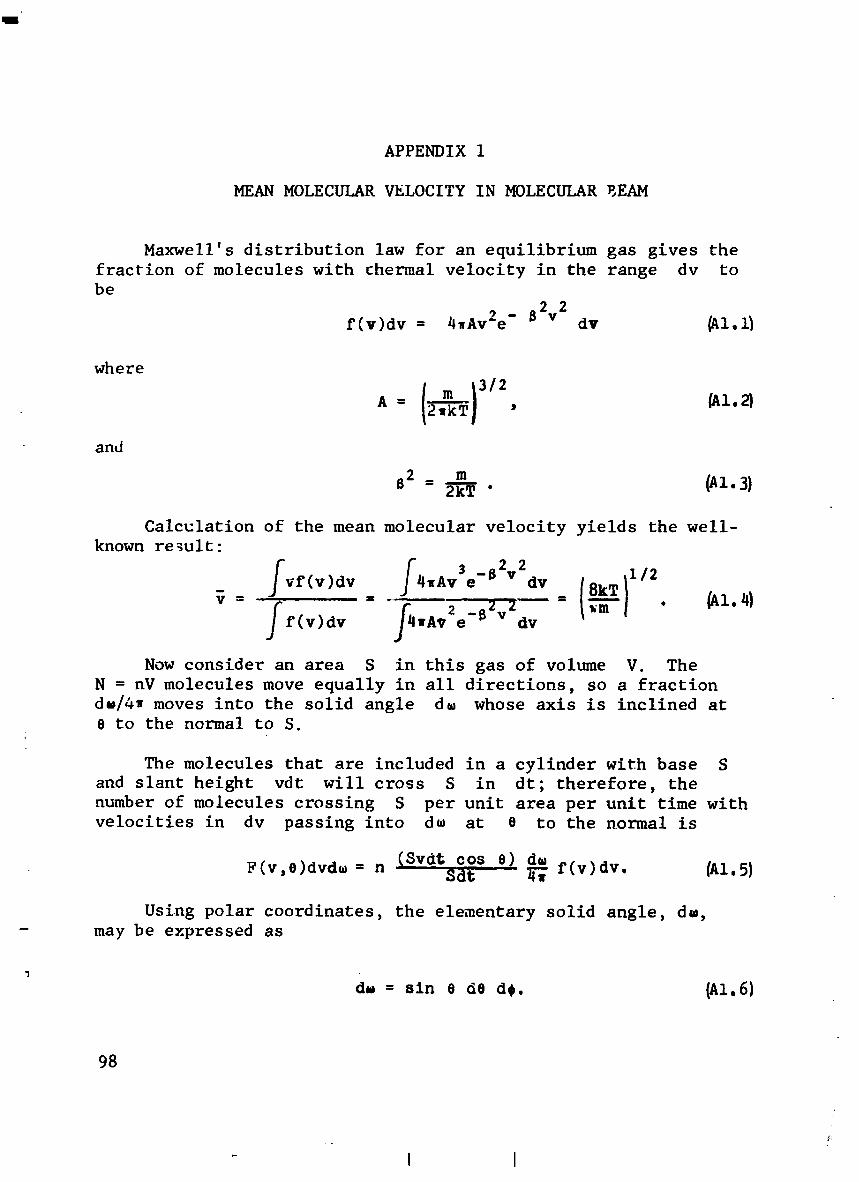
APPENDIX I
MEAN MOLECULAR VELOCITY IN MOLECULAR BEAM
Maxwell's distribution law for an equilibrium gas gives the
fraction of molecules with thermal velocity in the range dv tobe
2 2
£(v)dv = 4_Av2e - 6 v dv _AI.II
where
f m i 3/2A- 12,kTl, 1.a
and
62 = m (AI.3)2kT "
Calculation of the mean molecular velocity yields the well-known re_ult-
4-Av e-p v dv I/2
= = r 2" .z z = _ . _z.4)
ff(v)dv J,,k,e -t_ v dv ,m
Now consider an area S in this gas of volume V. The
N = nV molecules move equally in all directions, so a fractiondin/4, moves into the solid angle dw whose axis is inclined ate to the normal to S.
The molecules that are included in a cylinder with base Sand slant height vdt will cross S in dt; therefore, the
number of molecules crossing S per unit area per unit time withvelocities in dv passing into dw at e to the normal is
F(v,e)dvd_ = n _Svdt cos e) dw" Sdt _ f (v) dv. IAI.5)
Using polar coordinates, the elementary solid angle, dm,- may be expressed as
dm = sin e de d,. (AI.6)
98
I I
1966018675-105
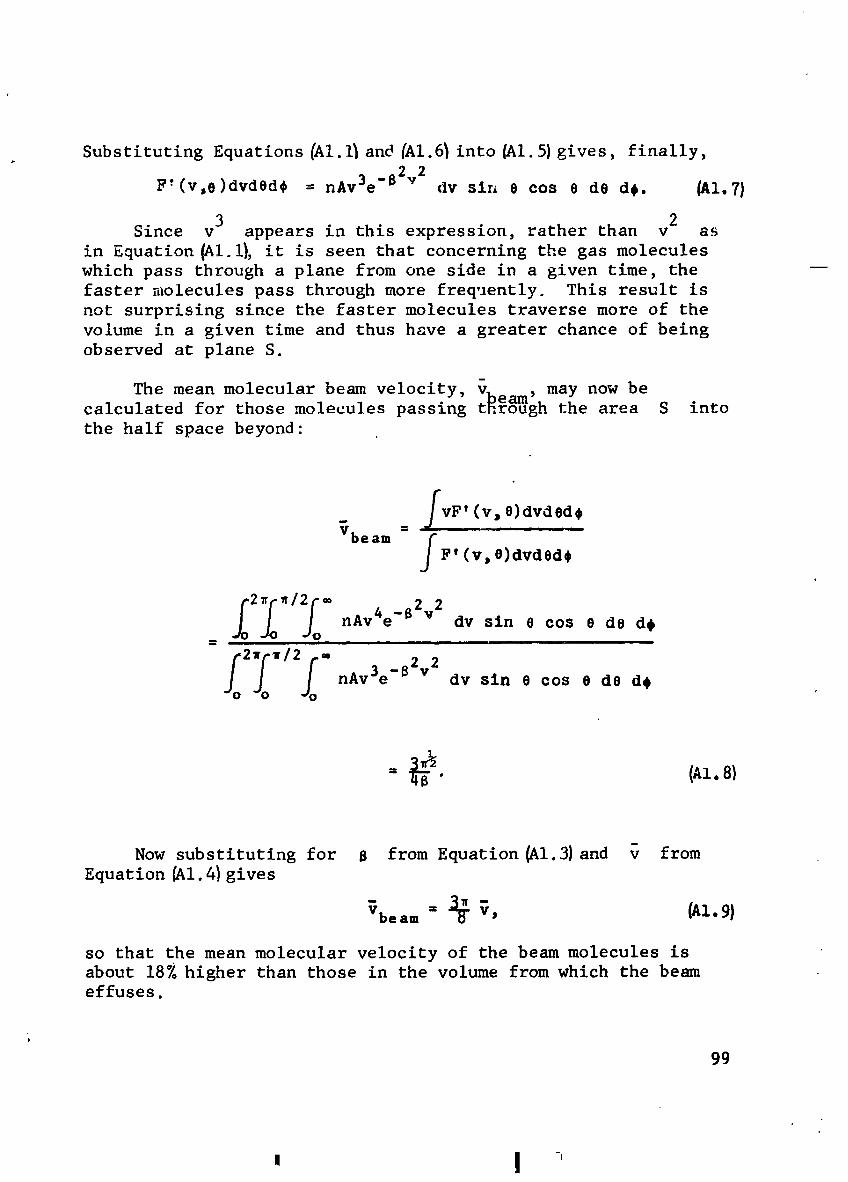
Substituting Equations _I._ an_ _1.6_ into_l.5) gives, finally,
F' (v,0)dvd0d¢ = nAv3e -B2v2 dv sin 8 cos e de de. _1.7}
3 2Since v appears in this expression, rather than v as
in Equation _1.1_ it is seen that concerning the gas moleculeswhich pass through a plane from one side in a given time, the
faster molecules pass through more frequently. This result is
not surprising since the faster molecules traverse more of the
volume in a given time and thus have a greater chance of being
observed at plane S.
The mean molecular beam velocity _ , may now be' eam
calculated for those molecules passing t_rough the area S into
the half space beyond:
vF' (v, e)dvd%d$
Vbeam f F'(v,O)dvded¢
121"/2f ® nAv4e -62"2 dv sin e cos e de d._O• | i - - i jim •
nAv3e-B v dv sin e cos e de de
: (Ai. 81
Now substituting for 6 from Equation _1.3)and v from
Equation _l.41gives
so that the mean molecular velocity of the beam molecules isabout 18% higher than those in the volume from which the beameffuses.
P
9g
! I -
1966018675-106
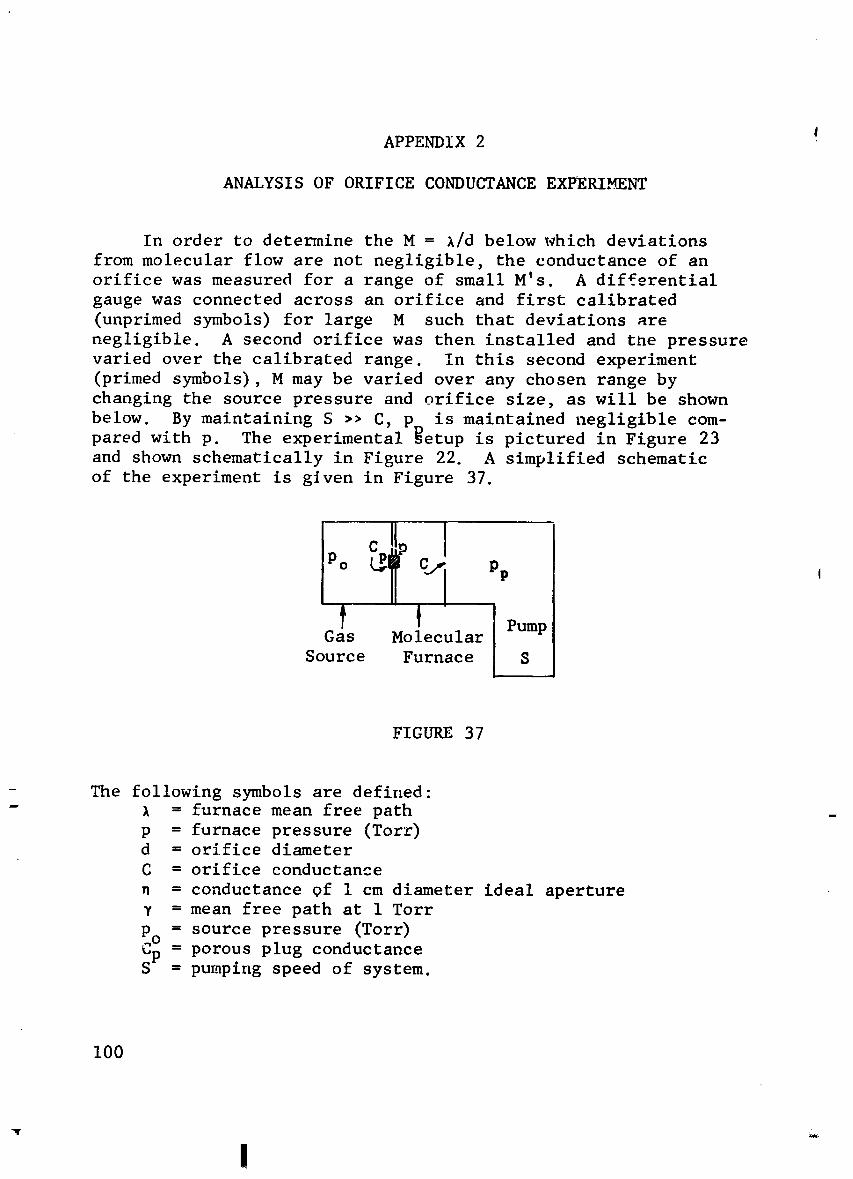
APPENDIX 2 I
ANALYSIS OF ORIFICE CONDUCTANCE EXPERIMENT
In order to determine the M = A/d below which deviations
from molecular flow are not negligible, the conductance of anorifice was measured for a range of small M's. A differential
gauge was connected across an orifice and first calibrated
(unprimed symbols) for large M such that deviations are
negligible. A second orifice was then installed and the pressure
varied over the calibrated range. In this second experiment
(primed symbols), M may be varied over any chosen range bychanging the source pressure and orifice size, as will be shown
below. By maintaining S >> C, p_ is maintained negligible com-
pared with p. The experimental _etup is pictured in Figure 23
and shown schematically in Figure 22. A simplified schematicof the experiment is g_ven in Figure 37.
t'fGas Molecular Pump
Source Furnace S
FIGURE 37
The following symbols are defined:= furnace mean free path
p = furnace pressure (Tort)d = orifice diameter
C = orifice conductance
n = conductance of I cm diameter ideal aperturey = mean free path at I Torr
[o = source pressure (rorr)= porous plug conductance
Sp = pumping speed of system.
I00
!
1966018675-107
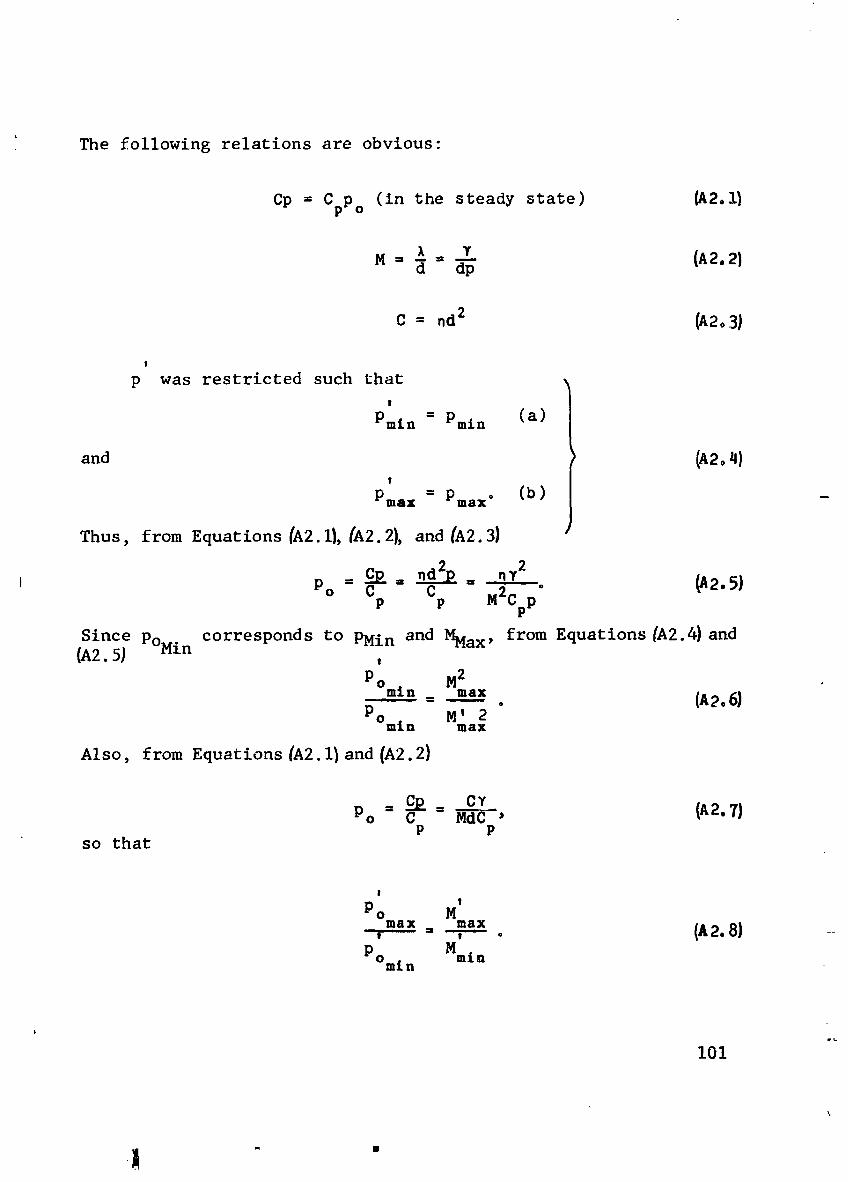
The following relations are obvious:
Cp = Cpp ° (in the steady state) (A2.1)
C = nd 2 (A2o3/
!
p was restricted such that!
Pmln = Pmln (a)
and (A20 4}!
Pmax = Pmax ° (b)
Thus, from Equations (A2.11, /A2.2), and (A2.3}
--_ : _ : ,."v2 (A2.5)I Po C C "P P M2C pP
(A2.Since5)P°Min corresponds to PMin, and MMax, from Equations (A2.4)and
Pomi n M2= max ° (A2•6)
Point n M ' 2max
Also, from Equations (A2.IIand (A2.2)
Po cC_P_: cv (A2.7)= Md--a_-'P P
so that
!!
Po IVl
max (a2 81max = ---.--1 I o • --
Point n Mmtn
)F_
I01
1966018675-108
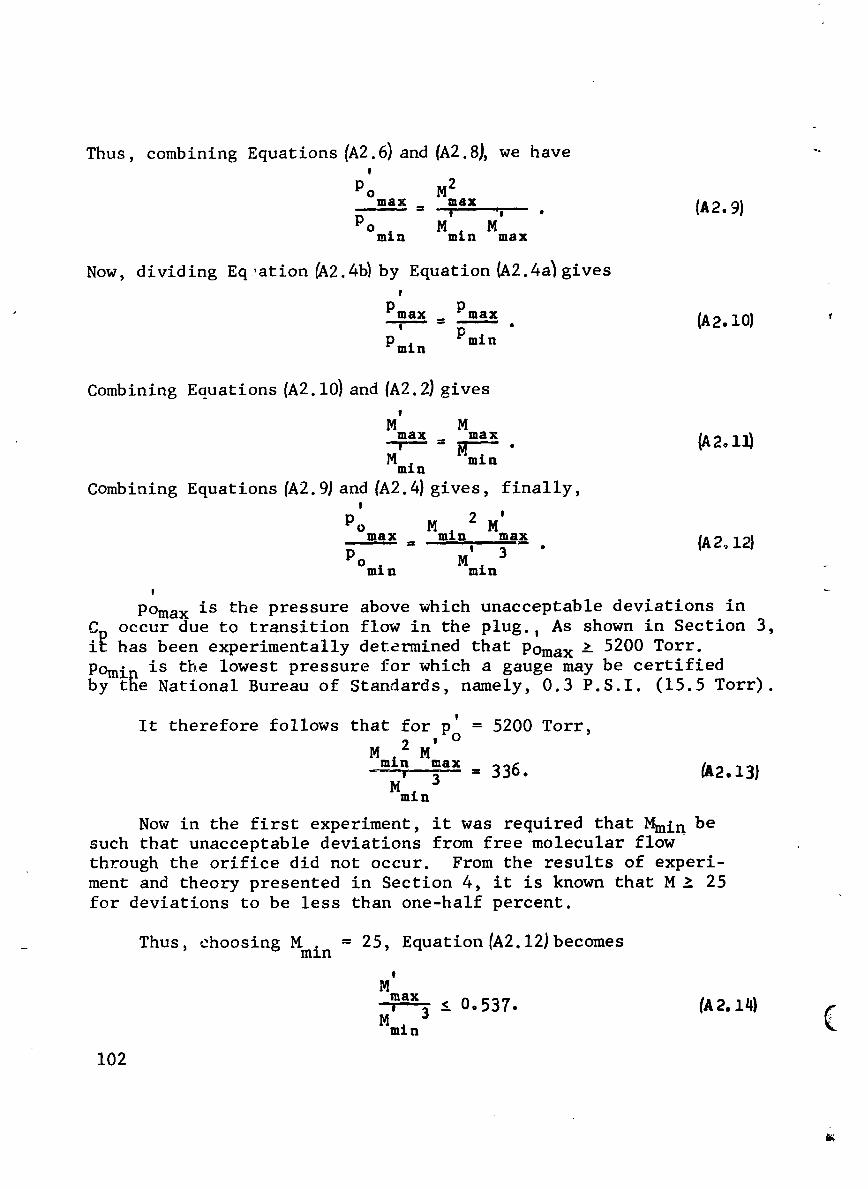
Thus, combining Equations (A2.6)and {A2.8),we have "-
Po M2max = max (A2.9)- --I " :| •
P°mi n Hmi n Mmax
Now, dividing Eq,ation (A2.4blby Equation _2.4a_ gives!
Pmax Pmax----=---- (A2Io) 'ql • •
Pm/n Pm/n
Combining Eouations (A2.i0) and {A2.2) gives!
M Mmax max _2o1_
--r--- = _ .Hmln
Combining Equations (A2.9) and (A2.4) gives, finally,!
Po 2 'max = Mmin Mma_x (A2_12}
p ' 3 "°min Mmin
POma x is the pressure above which unacceptable deviations inoccur due to transition flow in the plug., As shown in Section 3,
C_ has been experimentally determined that Pomax >- 5200 Torr.
POmi n is tbe lowest pressure for which a gauge may be certifiedby the National Bureau of Standards, namely, 0.3 P.S.I. (15.5 Torr).
It therefore follows that for p = 5200 Torr,2 , O
Mmin Mmax
= 336. ,3)min
Now in the first experiment, it was required that Minin besuch that unacceptable deviations from free molecular flowthrough the orifice did not occur. From the results of experi-
ment and theory presented in Section 4, it is known that M _> 25for deviations to be less than one-half percent.
Thus, choosing Mmi n = 25, Equation IA2.12) becomes
!
Mmax
< O.537. (A2. 14) (Mmin
102
1966018675-109
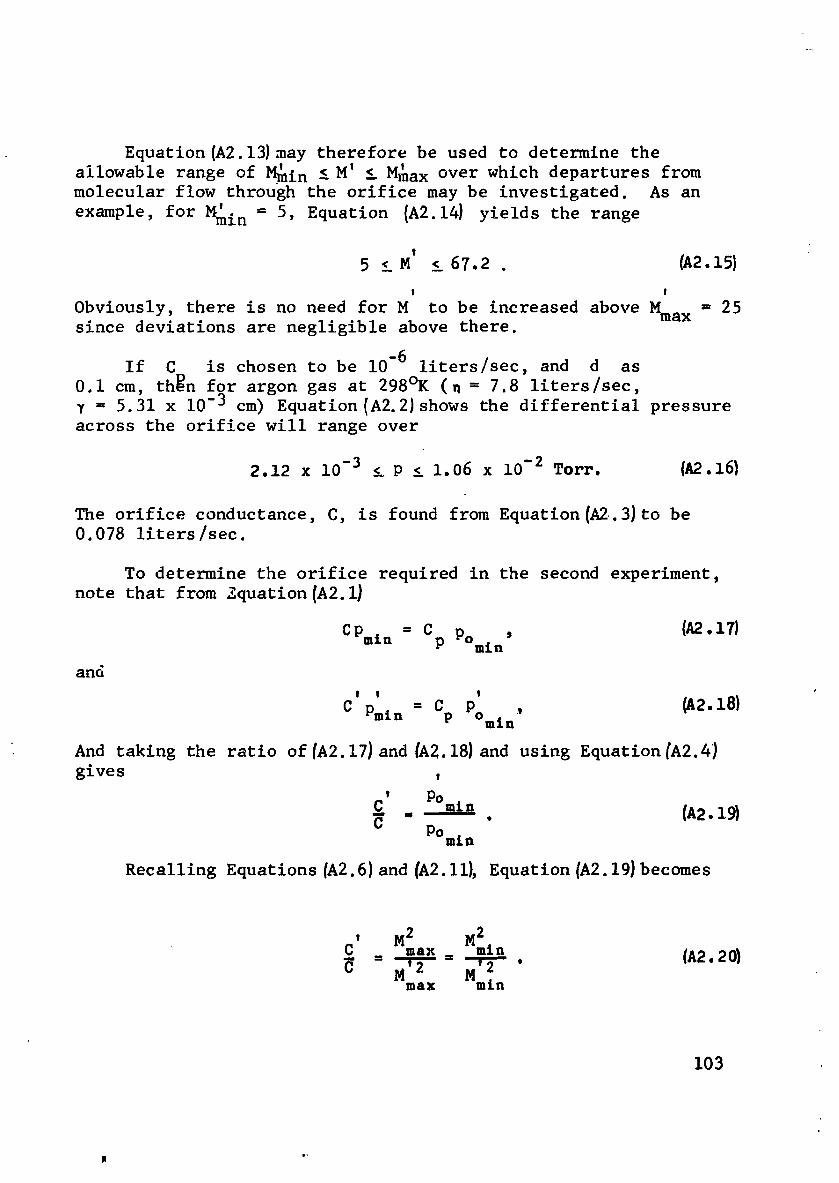
Equation (A2.13)may therefore be used to determine the!
allowable range of Mmin _ M' _ M_a x over which departures frommolecular flow through the orifice may be investigated. As an
| _ )example, for M_l n 5 Equation (A2 14} yields the range
!
5 s M e 67.2 . _2.15)
! l
Obviousiy, there is no need for M to be increased above Mma x = 25since deviations are negIigibIe above there.
If C is chosen to be iO-6 iiters/sec, and d as
0.I cm, th_n for argon gas at 298°K (, = 7.8 liters/sec,
7 = 5.31 x 10⁻³ cm) Equation(A2.2) shows the differential pressureacross the orifice will range over
2.12 x 10 -3 & P i 1.06 x 10⁻² Tort. {A2.16)
The orifice conductance, C, is found from Equation{A2.3) to be0.078 liters/sec.
To determine the orifice required in the second experiment,
note that from Equation {A2.1_
CPml. - C , (A2.17)P P°mi n
andf ! f
C Pmtn = Op Pomin, _2.18)
And taking the ratio of IA2.17)and IA2.18)and using Equation (A2.4)
gives!
- P°min . {A2.19)CP°mi n
Recalling Equations IA2.6) and (A2.11}, Equation IA2.19) becomes
, M 2 M 2C max mr- {A2.20)
- ffi..-q-'max Mmtn
103
m .4
1966018675-110
Then, using Equaticns _2.3) and _2.20), gives!
d Mmi n: -r--. (A2.2zl
Mmln
Thus, for the example cited above, the second orifice must be
0.5 cm diameter and thus will have a conductance of 1.95 liters/
sec. The required pumping speed determined fr6m S = 200 C' is390 liters/sec.
104
!
1966018675-111
REFERENCES
I. M. Knudsen, Ann. Physik 28, 999 (1909), English Transla-tion: AEC-tr-3715.
2. N. F. Ramsey, Molecular Beams, Oxford at the ClarendonPress, 1956, p. iI.
3. a) P. C. Carman, Flow of Gases Through Porous Media,Academic Press, Inc., New York, 1956; b) P. C. Carman and
F. A. Raal, Trans. Faraday Soc. 50, 842 (1954).
4. a) R. M. Barrer, Disc. Faraday Soc. 3. 61 (1948);b) R. M. Barrer and D. M. Grove, Trans. Faraday Soc.47, 826, 837 (1951); c) R. M. Barrer and E. Strachan, Proc.Roy. Soc. A 231, 52 (1955); d) R. M. Barrer, Brit. J. Appl.Phys., Supplement No. 3, 541, 549 (1954).
5. a) K. Kan_nermeyer and D. W. Brubaker, Chem. Eng. Prog.50, 560 (1954); b) K. Kammermeyer and D. D. Wyrick, Ind.
and Eng. 6 m. 50, 1309 (1958).
6. M. B. Volf, Technical Glasses, Sir Isaac Putnam and Sons,Ltd., London, 1961, p. 176.
7. M. E. Nordberg, J. Amer. Cer. Soc. 27, 299 (1944).
8. T. H. Elmer and M. E. Nordberg, VYCOR Brand Porous Glass,Code 7930 - A Unique Drying Agent, Research and DevelopmentDivision, Corning Glass Works, Corning_ New York, June 29,1961.
9. F. A. Schwertz, J. Amer. Cer. Soc. 32, 390 (1949).
i0. K. R. Atkins and H. Seki, Phys. Rev. 102, 582 (1956).
ii. D. F. Brewer and D. C. Champeney, Pro. Phys. Soc. (London)79, 8: (1962).
12. P. H. Enmiett and T. W. DeWitt, J. Amer. Chem. Soc. 65,1253 (1943).
13. S. Dushman, Scientific Foundations of Vacuum Technique,Second Edition, J. M. Lafferty, Editor, John Wiley andSons, Inc., New York, 1962, pp. 30-32.
105
1966018675-112
REFERENCES (Continued)
14. P. C. Carman and P. le R. Malherbe, Proc° Roy. Soc. A.,
203, 165 (1950).
15. R. M. Barrer and J. A. Barrie, Proc. Roy. Soc. A., 213,
250 (1952).
16. !. H. Elmer, Research and Development Division, Corning
Glass Works, Corning, New York, Private Communication.
17. A. J. Mathews, Evaluation of Porous Materials as Molecular
Leak____s,Arnold Engineering Development Center TechnicalDocumentary Report No. AEDC-TDR-64-94, Air Force Systems
Con_Tiand, U. S. Air Force.
18. Sc Dushman, op. cit., p. 87.
19. Lo H. Wilson, W. L. Sibbitt, and Mo Jakob, J. Appl. Phys.
22, 1027 (1951) o
20. Industrial Components Department, Corning Glass Works,
Corning, New York, Bulletin IC-21, August 5, 1960.
21. P. Ho Emmett and Martin Cines, J. Phys. Chemo 51, 1248(19_7).
22. H. W. Liepmann, A Study of Effusive Flow) Aeronautics andAstronautics, Proceedings of the Durand Centennial Conference,
Stamford University 5-8 August, 1959, Pergamon Press,New Yon'k, 1960, p. 153.
23. H. W. Liepma_:L, J., Fluid Mech. i0, 65 (1961).
24. R. Narasimha, Phys. Fluids 3, 476 (1960).
25. R. Narasimha, J. Fluid Mech. IO, 371 (1961).
26. D. R. Willis, Center-Point Mass Flow Throush a CircularOrifice Using the Integral Iteration Method, Technical Note
No. 3, Division of Gas Dynamics, Royal Irstitute of Technology,Stockholm, Sweden, December 1960.
i
106
|
1966018675-113
REFERENCES (Contlrued)
27. R. F. Probstein, The First Collision Orifice Problem and a
Suggested Transformation for Rarefied Flow Analysi's, SecondInternational Symposium on Rarefied Gas Dynamics, Berkeley(1960).
28. J. E. Scott, Jr., H. S. Morton, Jr., J. A. Phipps, andJ. F. Moonan, Project Squid Technical Report UNA-5-P,July 1964 Department of Aero Space Engineering, Universityof Virginia, Charlottesville, Virginia, ASTIA Document No.AD-602 977.
29. S. Dushman, op. cit., p. 82.
30. S. Dushman, op. cit., p. 32.
31. A. J. Bureau, L. J. Laslett, and J. M. Keller, Rev. Sci.
Instr. 23, 683 (1952).
32. M. Knudsen, Ann. Physik, 28, 75 (1909). English Transla-tion: AEC-tr-3303.
33. a) P. Clausing_ Physica, 9, 65 (1929), English Transla-tion: AEC-tr-2525 ; b) Ann. Physik, 7, 489 (1930); c) Zeits.
f. Phys. 66, 471 (1930). English Translation: AEC-tr-2446 ;d) Ann. Phys. 52, 961 (1932), English Translation: AEC-tr-2447 .
34. M. v. Smoluchowski, Ann. der Physik u. Chemie 33, 1567 (1910).
35. W. C. deMarcus, The Problem of Knudsen Flow. Part !II.Solutions for One Dimensional Systems. Report No. K-1302,March 19, 1957, Union Carbide Nuclear Company, Oak Ridge,Tennessee, ASTIA Document No. AD 124 579.
36. A. R. Miller, The Fraction of EffusinK Molecules Strlkln_a Collector Plate Over a Circular Capillary, Report An-1328,Aerojet-General Nucleonics, San Ramon, California, December,1964, ASTIA Do-ument No. AD 454 732.
37. E. H. Kennard, Kinetic Theory of Gases, McGr_,,-Hill Book Co.,Inc., New York, 1938, p. 307.
107
1966018675-114
REFERENCES (Continued)
'38 a) F Knauer and O. Sternj ZeitSo fo Physik 38, 764
(1926); b) F. Knauer, Zeitso f. Physik 53, 766 (1929),
Erlgiish Translation" AEC-NP 2400°
39° _. Enauer, Zeits. f. Pbysik 60, 414 (1930).
40_ H. Mayer, Zeits. f. Physik 58, 373 (1929) o
' 41 M_ Kratzens_ein, Zeits. f o Physik 93, 279 (1935).
42_ a) T. H. Johnson, Nature i19, 745 (1927); b) _hyso Revo 31,103 (1928).
43° C_ B. Barnes, Jr., Vacuum 14, 429 (1964).
44. N_ E o Cooke, An Inherent Error in tlbe Knudsen EffusionManometer and a Method of Correct..... Vacuum Symposium
Transactions, 1956, Pergamcn Press, m_ndon, 1957, po 82.
45. r. Feak_s, Fo L. Torney, Jr., and F. J. Brock, GaugeCalibration in Extreme High Vacuum, NASA Contractor Report,NASA CR-167.
46. J. P Dawson, J. D. Haygood_ and J. Ao Collins, Jr o,
Temperature Effects on the Capture Coefficients of Carbon
Dioxide, Nitrogen, and Argon, Advances in Cryogenic Engi-neer'ing, Volume 9, Ko D. Timmerhaus, Editor, Plenum Press,
New York, t964, p. 443.
47. S. N. Foner, F. A. Mauer, and L. H. Bolz, J. Chemo Phys.
3_[, 546 (1959).
48° V_ J. Johnson, General Editor, A Compendium of the Propertiesof Materials at Low Temperatures° Part Io Properties of
Fluids_ July 1960. Wright Air Development Division Technical
Repert WADD TR 60-56 (Part I). U. S. Air Research andDevelopment Command, United States Air Force, Wright-
Patterson Air Force Base, Ohio.
49. _. H. Kennard, op. cir., p_ 61.
50. Indalloy Intermediate Solders, The Indium Corporation ofAmerica, Utica, New York, 1957, po 19.
108
I I
1966018675-115
REFERENCES (Concluded)
51. American Institute of PhysicE, Handbook, D. E. Gray, Editor, bMcGraw-Hill Book Co., Inc., New York, 1957, p. 4-118.
52. Dushman, op. cit., p. 422.
53. J. P. Hobson and R. A. Amnstrong, J. Phys. Chem. 67, 2000(1963).
54. J. H. de Boer, The Dynamical Character of Adso_r_tion,Oxford University Press (1953).
" 109
1966018675-116