Embed Size (px)
Citation preview

ES 230 Strengths – Intro to Finite Element Modeling & Analysis Homework Assignment 4 The GREAT Combined Load Problem – Normal Stress due to Bending and Shear Stress due to a Shear Force and Torsion
Setup a new basic ANSYS project environment by Importing the Material as ‘Lafayette Steel’, Units to US Customary and start up the Sketching environment with the Units in Inches and with the Auto Constraints options turned On. Set the ‘Lafayette Steel’ Material as the Default Model Material.
Sketch out a circle on the YZ Plane. Use the AutoConstraints cursor info to help center the cross-section on the axes. Add a Diameter dimension for a 1 inch diameter circle.
This is the cross-section of the entire bar that you need to model. You will now use the Sweep tool to construct the side profile and length of the bar in 3D space to match the problem being solved. To do this you will start a new Sketch that will define the path followed by the Sweep tool when it draws the 3D bar in profile. As part of Sweep you will assign the 1” solid circular cross-section you have just drawn.
For this example the 3D bar lies flat in the ZX Plane. Therefore, you will need to draw the path defining the bar dimensions on this plane in ANSYS. The path will consist of two lines, one in the X-axis direction and the one in the Z-axis direction. As usual, you will draw the lines making up the path first and then you will add dimensions to these lines afterwards.
Change to the ZX Plane and then click on the Y-axis arrow to look down on a top view of the bar on the ZX plane to aid in sketching. Go to the Draw options in Sketching and start drawing the lines defining the bar geometry along the X and Z axes. Make sure Auto Constraints are set to make this easier. Draw a line along the +X-axis direction (note the V guide) and draw a line from the end of that line out in the +Z-axis direction (H guide). Dimension the first line at 8 inches and the second line at 4 inches. You should get something that looks like the view below for the lines you have drawn on the ZX Plane.

Now go to the Modeling tab and click on an ISO view. You should have a Path Sketch in the ZX Plane and a Cross-Section Sketch in the YZ Plane.
If you do not have these, delete your current sketches and redraw then as needed.
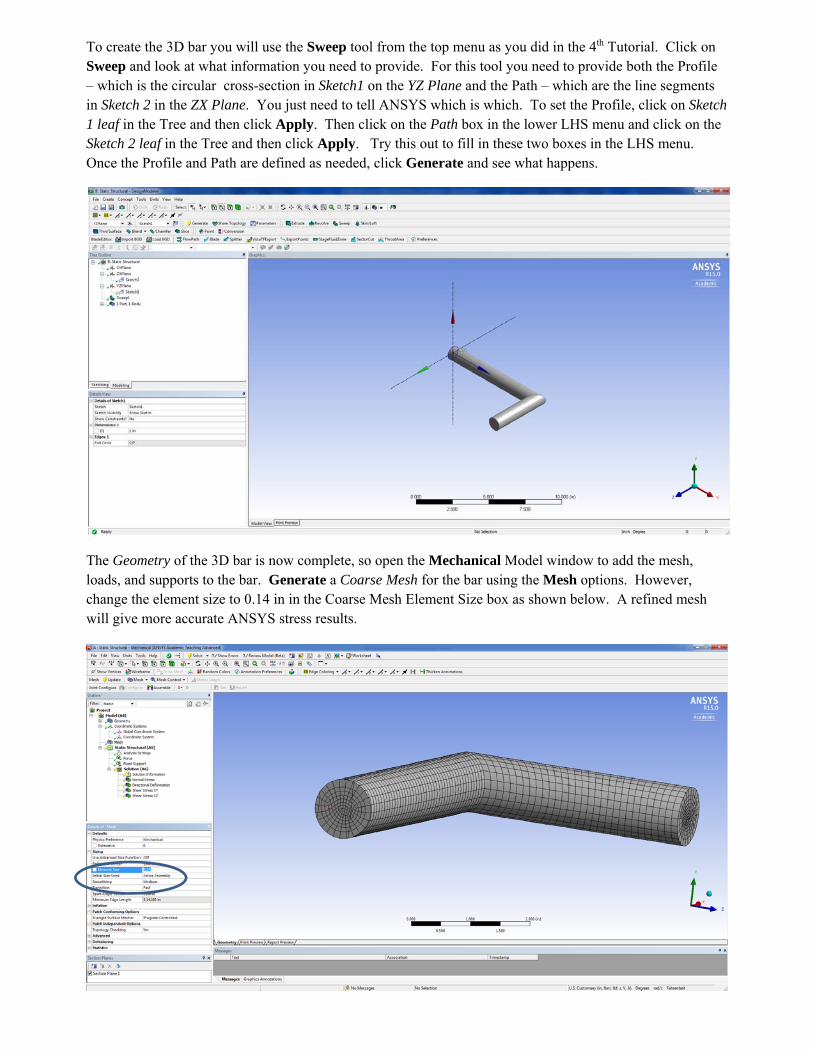
To create the 3D bar you will use the Sweep tool from the top menu as you did in the 4th Tutorial. Click on Sweep and look at what information you need to provide. For this tool you need to provide both the Profile – which is the circular cross-section in Sketch1 on the YZ Plane and the Path – which are the line segments in Sketch 2 in the ZX Plane. You just need to tell ANSYS which is which. To set the Profile, click on Sketch 1 leaf in the Tree and then click Apply. Then click on the Path box in the lower LHS menu and click on the Sketch 2 leaf in the Tree and then click Apply. Try this out to fill in these two boxes in the LHS menu. Once the Profile and Path are defined as needed, click Generate and see what happens.
The Geometry of the 3D bar is now complete, so open the Mechanical Model window to add the mesh, loads, and supports to the bar. Generate a Coarse Mesh for the bar using the Mesh options. However, change the element size to 0.14 in in the Coarse Mesh Element Size box as shown below. A refined mesh will give more accurate ANSYS stress results.
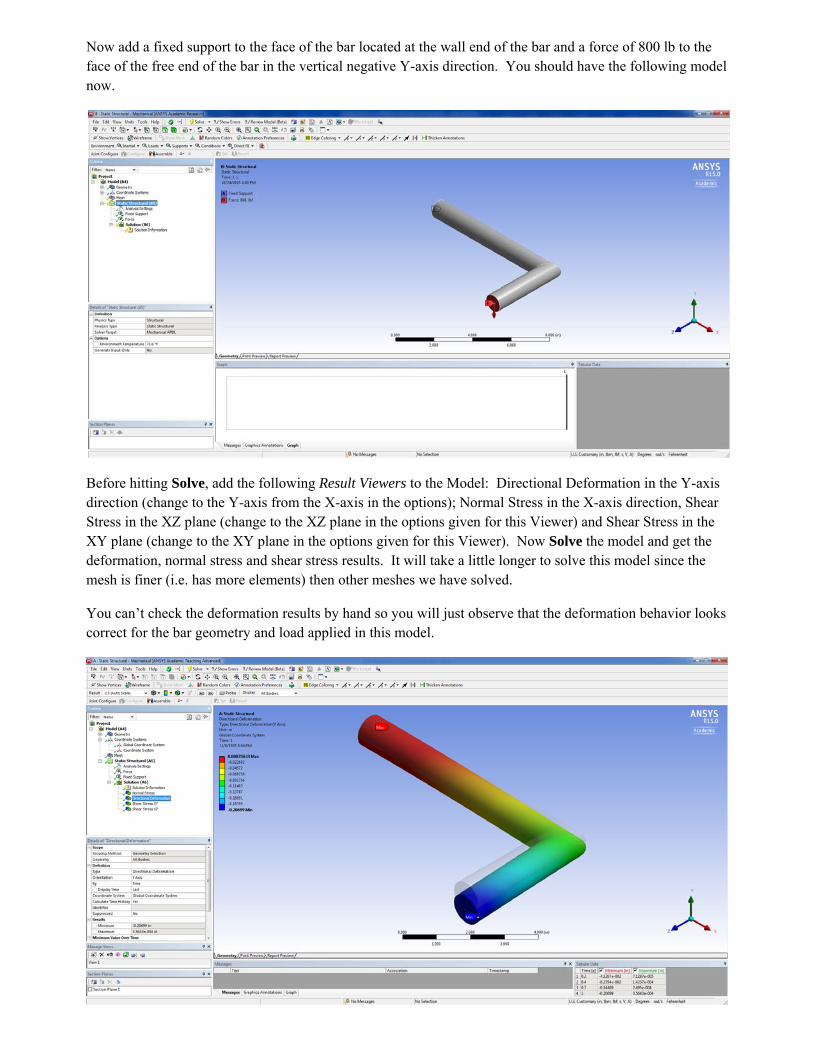
Now add a fixed support to the face of the bar located at the wall end of the bar and a force of 800 lb to the face of the free end of the bar in the vertical negative Y-axis direction. You should have the following model now.
Before hitting Solve, add the following Result Viewers to the Model: Directional Deformation in the Y-axis direction (change to the Y-axis from the X-axis in the options); Normal Stress in the X-axis direction, Shear Stress in the XZ plane (change to the XZ plane in the options given for this Viewer) and Shear Stress in the XY plane (change to the XY plane in the options given for this Viewer). Now Solve the model and get the deformation, normal stress and shear stress results. It will take a little longer to solve this model since the mesh is finer (i.e. has more elements) then other meshes we have solved.
You can’t check the deformation results by hand so you will just observe that the deformation behavior looks correct for the bar geometry and load applied in this model.

You can check the normal stress and shear stresses at the support location by comparing the ANSYS values with values you obtain by hand calculations at this support location. However, the overconstrained fixed support conditions will make a direct comparison of the stress levels difficult. To help validate the ANSYS model (check if the results are close to hand calculations) you can compare the ANSYS values to your hand calculation values in a region that is away from the fixed support to minimize the effect of the support on the stress calculations. The location selected however needs to be at a specific location so that you can calculate normal and shear stress by hand for this same location on the bar. To do this in ANSYS you will need to set up a New Section Plane at the location of interest in order to allow a way to query these stress values at a particular location using the Probe tool. In the 4th Tutorial you put in Section Planes to make cuts but only at approximate locations along the bar length. Also instead of clicking on the New Section Plane tool in the top toolbar as you did in the 4th Tutorial, you will add a New Section Plane by defining a new Coordinate System.
To start this process you will need to create a new Coordinate System on the bar and place this new Coordinate System at a location 2 inches from the support along the positive X-axis. Right-click on the Coordinate Systems leaf in the LHS tree and select Insert-> Coordinate System to create a new Coordinate System in the model.
This will open up the Details of Coordinate System bottom LHS menu. What you need to do now is locate this new Coordinate System at the location 2 inches away from the fixed support along the X-axis. The new Coordinate System as a default right now is located at the origin at the fixed support. You need to move it out along the X-axis by 2 inches. To do this change the Define By box from Geometry Selection to Global Coordinates. Then type ‘2’ in the Origin X text box and then hit enter.

After this change, the new Coordinate System will move in the view to the desired location at 2 inches along the X-axis.
After you click on this, change to the ISO view. You will see that only half of the bar is showing from side to side as is shown in the next view. This is the default section plane defined for the new Coordinate System, but it is not the one you need to view the stress results. You will need to change the axis information in the bottom LHS menu to get the section plane cut through the YZ plane that is needed. So now edit one of the other bottom LHS menu text boxes to get the correct section plane.

To get the correct Section Plane orientation, change the Principal Axis to the Z-axis from the default X-axis.
Once this change is made, right-click on the Coordinate System leaf and select the Create Section Plane option as shown in the view below.
The Section Plane should change to one across the bar cross-section, similar to what we typically see in the combined load problems run in class. Rotate the view so you can see the end of the bar at the Section Plane cut made.

Now you are set to compare the stress values ANSYS claims and the stress values you get from your hand calculations for this bar at a section cut taken 2 inches from the support.
Normal Stress Results The normal stress would be a combination of the normal stress from an axial force and from the bending moments. For this example there is no axial force and the only bending moment is about the Z-axis and is at the section cut location, Mz = (800 lb)(6 in) = 4800 lb-in. Based on the cross-section dimension you can calculate the normal stress due to bending using the equation σ = -My/I.
In ANSYS change to the Normal Stress Viewer to see the normal stress distribution across the solid cross-section. Try to add probe values at the top extreme fiber and the bottom extreme fiber to find the maximum and minimum normal stress due to bending on the cross-section. Compare these values to your hand calculated normal stress due to bending. The values should be close, but they will not be the same.

To view more of the typical stress variation across the cross section, change the bound in the color legend to have more color variations between the max and min normal stress levels. It takes a little practice but you can hover over the division lines and use hold the left mouse button down to increase or decrease each of the color bound values. You can often add more divisions by clicking on the + sign that appears in the legend. The green section across the middle section horizontally is banded about the neutral axis of the cross-section, which is the z-axis for bending.
Shear Stress Results The shear stress that acts on the section cut at 2 inches from the support is due to a vertical shear force of V = -800 lbs and a torque of, T = (800 lb)(4 ft) = 3200 lb-in. To view the Shear Stress on the cross-section we can think of 4 points: A at Noon, B and 3 o’clock, C at 6 o’clock and D 9 o’clock on the face. In a couple of weeks we will be able to simply this process of viewing results because we will look directly at the principal stresses and maximum shear stresses acting on the plane. For now we can look and the combined shear stress due to the Shear Force and Torque at points B and D using the XY Shear Stress Viewer (τXY)and the shear stress due to the Torque at points A and C using the XZ Shear Stress Viewer (τXZ). The Shear Stress varies with location on the cross-section, so we are just looking at these four specific locations for now. Location of Pts. A, B, C, and D on the cross-section: and XY Shear Stress vs. XZ Shear Stress
A
B
C
DZ‐axis
Y‐axis
XY Shear Stress
XZ Shear Stress

XY Shear Stress Results
XZ Shear Stress Results
Homework 4 Assignment Part to Turn In – A), B) and C): Due Tuesday, Nov. 17th Turn in the following items in hard copy form (print out) for grading. To get good views of the ANSYS Results you may need to zoom in or rotate the axial bar in the window as needed.
A) Hand Calculations to turn in for the Combined Load Analysis Solve for the Maximum and Minimum Normal Stress acting on the cross-section located at 2 inches from
the support due to the bending moment, Mz. Solve for the Maximum Shear Stress acting on the cross-section located at 2 inches from the support due
to the applied Shear Force, V. Solve for the Maximum Shear Stress acting on the cross-section located at 2 inches from the support due
to the applied Torque, T.

Calculated the Combined Shear Stress on Pts. B and D on the cross-section located at 2 inches from the support due to the Shear Force, V, and the applied Torque, T.
B) Screen Captured ANSYS analysis results to turn in for the Combined Load Analysis: Screen-capture and print-out a view showing results for the Normal Stress on the cross-section located at
2 inches from the support. Make sure you can clearly see the color variation along the truss and the color legend. Use the Probe to identify where the maximum and minimum normal stresses act on the cross-section at this location. Circle the units on the printed copy.
Screen-capture and print-out a view showing results for the XY Shear Stress on the cross-section located at 2 inches from the support. Make sure you can clearly see the color variation along the truss and the color legend. Use the Probe to identify where the maximum and minimum XY Shear stresses act on the cross-section at Pts. B and D at this location. Circle the units on the printed copy.
Screen-capture and print-out a view showing results for the XZ Shear Stress on the cross-section located at 2 inches from the support. Make sure you can clearly see the color variation along the truss and the color legend. Use the Probe to identify where the maximum and minimum XZ Shear stresses act on the cross-section at Pts. A and C at this location. Circle the units on the printed copy.
C) Comparison of the Hand Calculations and ANSYS Analysis Results to turn in for the Combined Load Analysis:
Compare the values of the Maximum and Minimum Normal Stress acting on the cross-section located at 2 inches from the support that you found using hand calculations and using ANSYS. Discuss any difference in these values.
Compare the values of the Maximum and Minimum XY Shear Stress acting at Pts. B and D on the cross-section located at 2 inches from the support that you found using hand calculations and using ANSYS. Discuss any difference in these values.
Compare the values of the Maximum and Minimum XZ Shear Stress acting at Pts. A and C on the cross-section located at 2 inches from the support that you found using hand calculations and using ANSYS. Discuss any difference in these values.