Embed Size (px)
Citation preview

19JAN201715352596
Ferroglobe PLCAnnual Report and Accounts 2019

Company Registration No. 09425113
Ferroglobe PLCAnnual Report and Financial Statements
Year ended 31 December 2019

Ferroglobe PLC
Annual report and financial statements 2019
Contents Page No.
Glossary and definitions . . . . . . . . . . . . . . . . . . . . . . . . . . . . . . . . . . . . . . . . . . . . . . . 1
Officers and professional advisers . . . . . . . . . . . . . . . . . . . . . . . . . . . . . . . . . . . . . . . . 5
Introduction . . . . . . . . . . . . . . . . . . . . . . . . . . . . . . . . . . . . . . . . . . . . . . . . . . . . . . . . 6
Chairman’s letter to shareholders . . . . . . . . . . . . . . . . . . . . . . . . . . . . . . . . . . . . . . . . 7
Strategic report (including section 172 statement) . . . . . . . . . . . . . . . . . . . . . . . . . . . . 11
Directors’ report . . . . . . . . . . . . . . . . . . . . . . . . . . . . . . . . . . . . . . . . . . . . . . . . . . . . . 18
The Board of Directors . . . . . . . . . . . . . . . . . . . . . . . . . . . . . . . . . . . . . . . . . . . . . . . . 25
Directors’ remuneration report . . . . . . . . . . . . . . . . . . . . . . . . . . . . . . . . . . . . . . . . . . 30
Independent auditor’s report to the members of Ferroglobe PLC . . . . . . . . . . . . . . . . . . 60
Consolidated financial statements . . . . . . . . . . . . . . . . . . . . . . . . . . . . . . . . . . . . . . . . 73
Notes to the consolidated financial statements . . . . . . . . . . . . . . . . . . . . . . . . . . . . . . . 79
Parent company financial statements . . . . . . . . . . . . . . . . . . . . . . . . . . . . . . . . . . . . . 192
Notes to the parent company financial statements . . . . . . . . . . . . . . . . . . . . . . . . . . . . 194
Appendix 1 — Non-IFRS financial metrics . . . . . . . . . . . . . . . . . . . . . . . . . . . . . . . . . . 202

Ferroglobe PLC
GLOSSARY AND DEFINITIONS
Unless the context requires otherwise, the following definitions apply throughout this U.K.Annual Report (including the Appendix, save as set out below):
‘‘2019’’ . . . . . . . . . . . . . . . . . . the financial year ended 31 December 2019;
‘‘2018’’ . . . . . . . . . . . . . . . . . . the financial year ended 31 December 2018;
‘‘2020 AGM’’ . . . . . . . . . . . . . . the Annual General Meeting of the Company, to be held in 2020;
‘‘2019 Form 20-F’’ . . . . . . . . . . the Company’s Form 20-F for the fiscal year ended31 December 2019;
‘‘ABL RCF’’ . . . . . . . . . . . . . . . The Credit and Security Agreement for a new $100 million NorthAmerican asset-based revolving credit facility dated as of11 October, 2019, entered into between Globe and QSIPCanada ULC, as borrowers, and PNC Bank, N.A., as lender;
‘‘ABL Revolver’’ . . . . . . . . . . . credit available under the ABL RCF;
‘‘Adjusted EBITDA’’ . . . . . . . . . earnings before interest, tax, depreciation and amortisation,adjusted in accordance with Company’s adjustments announcedas part of its earnings reports. Alternative Performance Measuresare reconciled at Appendix 1;
‘‘Alternative PerformanceMeasures’’ . . . . . . . . . . . . . . the non-IFRS financial metrics reconciled at Appendix 1;
‘‘Aon’’ . . . . . . . . . . . . . . . . . . . Aon Plc;
‘‘ARA’’ . . . . . . . . . . . . . . . . . . these annual report and accounts for the financial year ended31 December 2019;
‘‘Articles’’ . . . . . . . . . . . . . . . . the Articles of Association of the Company, from time to time;
‘‘Auditor’’ . . . . . . . . . . . . . . . . Deloitte LLP, the Company’s independent U.K. statutory auditor;
‘‘Aurinka’’ . . . . . . . . . . . . . . . . Aurinka Photovoltaic Group, S.L.;
‘‘Blue Power’’ . . . . . . . . . . . . . Blue Power Corporation, S.L.;
‘‘Board’’ . . . . . . . . . . . . . . . . . the Company’s board of directors;
‘‘Business Combination’’ . . . . . the business combination of Globe and FerroAtlantica as theCompany’s wholly owned subsidiaries on 23 December 2015;
‘‘Business CombinationAgreement’’ . . . . . . . . . . . . . the definitive transaction agreement entered into on 23 February
2015 (as amended and restated on 5 May 2015) by, amongothers, the Company, Grupo VM, FerroAtlantica and Globe;
‘‘Capital’’ . . . . . . . . . . . . . . . . net debt plus total equity. Alternative Performance Measures arereconciled at Appendix 1;
‘‘CEO’’, ‘‘Chief ExecutiveOfficer’’ or ‘‘Chief Executive’’ the Chief Executive Officer of the Company, or where the context
requires, of the relevant company or organization;
1
‘‘Companies Act’’ . . . . . . . . . . the U.K. Companies Act 2006;
‘‘Company’’ or ‘‘Ferroglobe’’ . . Ferroglobe PLC, a company incorporated in England and Waleswith registered number 09425113 and whose registered office isat 5 Fleet Place, London EC4M 7RD, United Kingdom or, wherethe context requires, the Group;
‘‘Consolidated FinancialStatements’’ . . . . . . . . . . . . . (save in the supplemental attachment when it will have the
meaning given below) these consolidated financial statementsfor the year ended 31 December 2019
‘‘Compensation Committee’’ . . the compensation committee of the Company;
‘‘EBITDA’’ . . . . . . . . . . . . . . . . earnings before interest, tax, depreciation and amortisation;
‘‘EIP’’ . . . . . . . . . . . . . . . . . . . the Ferroglobe PLC Equity Incentive Plan, adopted by the Boardon 29 May 2016 and approved by shareholders on 29 June2016;
‘‘EU’’ . . . . . . . . . . . . . . . . . . . . the European Union;
‘‘Exchange Act’’ . . . . . . . . . . . the U.S. Securities Exchange Act of 1934 (as amended);
‘‘Executive Chairman’’ . . . . . . . the executive chairman of the Company;
‘‘Executive Directors’’ or‘‘Executives’’ . . . . . . . . . . . . the executive directors of the Company;
‘‘FerroAtlantica’’ or ‘‘GrupoFerroAtlantica’’ or‘‘Predecessor’’ . . . . . . . . . . . Grupo FerroAtlantica, S.A.U. a joint stock company organised
under the laws of Spain, including (where the context sorequires), its subsidiaries and subsidiary undertakings;
‘‘Free cash-flow’’ . . . . . . . . . . . operating cash-flow less property, plant and equipment cashflows. Alternative Performance Measures are reconciled atAppendix 1;
‘‘Globe’’ or ‘‘GSM’’ . . . . . . . . . Globe Specialty Metals, Inc., a Delaware corporation, including(whether the context requires) its subsidiaries and subsidiaryundertakings;
‘‘Group’’ . . . . . . . . . . . . . . . . . the Company and its subsidiaries;
‘‘Grupo VM’’ . . . . . . . . . . . . . . Grupo Villar Mir, S.A.U.;
‘‘IASB’’ . . . . . . . . . . . . . . . . . . International Accounting Standards Board;
‘‘IFRS’’ . . . . . . . . . . . . . . . . . . International Financial Reporting Standards;
‘‘Indenture’’ . . . . . . . . . . . . . . . the indenture, dated as of 15 February 2017, among Ferroglobeand Globe as co-issuers, certain subsidiaries of Ferroglobe asguarantors, and Wilmington Trust, National Association astrustee, registrar, transfer agent and paying agent;
‘‘KPI’’ . . . . . . . . . . . . . . . . . . . key performance indicator;
2

‘‘LIBOR’’ . . . . . . . . . . . . . . . . . the basic rate of interest payable in respect of the drawn amountof the ABL Revolver, interest under which is to be paid at therate of LIBOR plus the applicable margin;
‘‘NASDAQ’’ . . . . . . . . . . . . . . . the NASDAQ Global Select Market;
‘‘NASDAQ Rules’’ . . . . . . . . . . the NASDAQ Stock Market Rules;
‘‘Net debt’’ . . . . . . . . . . . . . . . bank borrowings, debt instruments, obligations under financeleases, and other financial liabilities, less cash and cashequivalents. Alternative Performance Measures are reconciled atAppendix 1;
‘‘Non-Executive Directors’’ or‘‘NEDs’’ . . . . . . . . . . . . . . . . the non-executive directors of the Company;
‘‘Notes’’ . . . . . . . . . . . . . . . . . $350,000,000 aggregate principal amount of Senior Notes due2022;
‘‘Note’’ . . . . . . . . . . . . . . . . . . A note to the Consolidated Financial Statements;
‘‘Ordinary Shares’’ . . . . . . . . . the ordinary shares of $0.01 each in the capital of the Company;
‘‘Policy’’ . . . . . . . . . . . . . . . . . the directors’ remuneration policy in force from time to time;
‘‘Revolving Credit FacilityAgreement’’ or ‘‘RCF’’ . . . . . the credit agreement, dated 27 February 2018, as amended on
or about 31 October 2018 and 22 February 2019 amongFerroglobe PLC, as Borrower, certain subsidiaries ofFerroglobe PLC from time to time party thereto as guarantors,the financial institutions from time to time party thereto aslenders, PNC Bank, National Association, as administrativeagent, issuing lender and swing loan lender, PNC CapitalMarkets LLC, Citizens Bank, National Association and BMOCapital Markets Corp., as joint legal arrangers and bookrunners,Citizens Bank, National Association, as syndication agent, andBMO Capital Markets Corp., as documentation agent, asamended from time to time;
‘‘Revolving Credit Facility’’ . . . borrowings available under the RCF;
‘‘SHA’’ . . . . . . . . . . . . . . . . . . the amended and restated shareholders agreement betweenGroup VM and the Company dated 22 November 2017, asamended on 23 January 2018;
‘‘SEC’’ . . . . . . . . . . . . . . . . . . . the U.S. Securities and Exchange Commission;
‘‘SOX’’ . . . . . . . . . . . . . . . . . . . the U.S. Sarbanes-Oxley Act of 2002;
‘‘SPE’’ . . . . . . . . . . . . . . . . . . . Ferrous Receivables DAC, a special purpose entity domiciledand incorporated in Ireland to which trade receivables generatedby the Company’s subsidiaries in the United States, Canada,Spain and France were sold;
‘‘U.K.’’ . . . . . . . . . . . . . . . . . . . the United Kingdom of Great Britain and Northern Ireland;
‘‘U.S.’’ . . . . . . . . . . . . . . . . . . . the United States of America;
3

‘‘Working capital’’ . . . . . . . . . . inventories and trade and other receivables, less trade and otherpayables. Alternative Performance Measures are reconciled atAppendix 1;
‘‘$’’ . . . . . . . . . . . . . . . . . . . . . U.S. dollars.
In the separate attachment hereto only (and for the avoidance of doubt, not in the remainder of thisU.K. Annual Report), the following phrase has the meaning given below:
‘‘Consolidated FinancialStatements’’ . . . . . . . . . . . . . the audited consolidated financial statements of Ferroglobe and
its subsidiaries as of 31 December 2019, 2018 and 2017 and foreach of the years ended 31 December 2019, 2018 and 2017,including the related notes thereto, prepared in accordance withIFRS, as filed annually on SEC Form 20-F.
4
Ferroglobe PLC
Report and financial statements 2019Officers and professional advisers
DirectorsJ Lopez MadridJ M AlapontD G BargerB L CrockettS E EizenstatM Garrido y RuanoG Hamilton (resigned 31 May 2020)M Levi (appointed 15 January 2020)P Larrea Paguaga (resigned 10 January 2020)J Monzon (resigned 13 May 2019)P Vareille (resigned 14 May 2019)J Villar-Mir de Fuentes
Company SecretaryDorcas Murray
Registered Address5 Fleet PlaceLondonEC4M 7RD
AuditorDeloitte LLPStatutory AuditorLondon
5

Ferroglobe PLC
Introduction
Ferroglobe PLC is a public limited company incorporated under the laws of England andWales under Company Number: 09425113. With its operational headquarters in Madrid, Spain,Ferroglobe (encompassing its subsidiaries Globe and FerroAtlantica) is a global, leading producerof silicon metals and silicon and manganese based alloys, with a geographical reach building onGlobe’s footprint in North America and FerroAtlantica’s footprint in Europe.
The Company was incorporated in 2015 and its Ordinary Shares are listed for trading on theNASDAQ in U.S. dollars under the symbol ‘‘GSM’’.
The Company is subject to disclosure obligations in the U.S. and the U.K. While some ofthese disclosure requirements overlap or are otherwise similar, some differ and require distinctdisclosures. Pursuant to the requirements of the Companies Act, this document includes ourdirectors’ strategic report, directors’ report, remuneration report and required financial information(including our statutory accounts and statutory auditor’s report for the reporting period commencing1 January 2019 and ending 31 December 2019), which together comprise our U.K. annual reportsand accounts for the period ended 31 December 2019 (the ‘‘U.K. Annual Report’’).
We are also subject to the information and reporting requirements of the Exchange Act,regulations and other guidance issued by the SEC and the NASDAQ listing standards applicable toforeign private issuers. In accordance with the Exchange Act, we are required to file annual andperiodic reports and other information with the SEC, including, without limitation, our 2019Form 20-F. Certain other announcements made by the Company are furnished to the SEC onForm 6-K. Our status as a foreign private issuer requires the Company to comply with variouscorporate governance practices under the SOX, as well as related rules subsequently implementedby the SEC. In addition, NASDAQ Rules permit foreign private issuers to follow home countrypractice in lieu of the NASDAQ corporate governance standards, subject to certain exemptions andexcept to the extent that such exemptions would be contrary to U.S. federal securities law.
We have provided as a separate attachment to the U.K. Annual Report extracts from the 2019Form 20-F to assist shareholders in assessing the Group’s performance and results. Thisattachment does not form part of the financial statements. Investors may obtain the full 2019Form 20-F, without charge, from the SEC at the SEC’s website at www.sec.gov or from our websiteat www.ferroglobe.com. Unless expressly stated otherwise, the information on our website is notpart of this U.K. Annual Report and is not incorporated by reference herein.
The capitalised terms used throughout the U.K. Annual Report are defined in the Glossary andDefinitions section of this U.K. Annual Report unless otherwise indicated. In the following text, theterms ‘‘we,’’ ‘‘our,’’ ‘‘the Company’’, ‘‘our Company’’ and ‘‘us’’ may refer, as the context requires, toFerroglobe or collectively to Ferroglobe and its subsidiaries. Throughout the U.K. Annual Report,rounding has been applied and numbers given and totals aggregated may differ in consequence.
6

Chairman’s Letter to Shareholders
Dear shareholders
2019 was a very challenging year for the Company. The significant market downturn whichcommenced in the second half of 2018 continued throughout 2019, resulting in sales of $1.6 billionand adjusted EBITDA of $(37.0) million. Disappointingly, the early signs of recovery across our endmarkets we saw at the beginning of 2019 failed to materialize in the second half of the year, leavinga prolonged reduction in demand, particularly in end markets such as chemicals. The rate ofdiminution in demand across all our product groups outpaced industry-wide supply curtailments,leading to a steady decline in prices throughout 2019. Concurrently, we were faced with relativelyhigh input costs, increasing further the pressure on our margin.
In response to this difficult market environment, we applied our focus to mitigating thefinancial impact to the Company through a combination of operational adjustments and cashgenerating initiatives. We successfully concluded a number of key actions to strengthen ourbalance sheet and bolster liquidity including right-sizing of our operating platform, refinancings,non-core divestitures and accelerating working capital improvements. We ended the year with grossdebt at $481 million, compared with $428.7 million at the end of 2018, and a cash balance(including current and non-current cash and cash equivalents) of $123.2 million, compared to$217 million as at 31 December 2018. For the year as a whole, we reported an operating loss of$355.6 million and a net loss of $285.6 million.
Given the continued headwinds and their impact on our business, we commenced work inearly 2020 on the development of a new strategic plan aimed at returning the Company toprofitability. Over the past eighteen months we have been faced with a number of difficult marketdynamics. We must now re-assess our commercial strategy and operating footprint against thebroader competitive environment to determine how best to drive sustainable profitability andrecover value for our shareholders. We were delighted to welcome Marco Levi as our new ChiefExecutive Officer in January 2020. Marco has considerable experience of turning aroundmultinational companies and transforming businesses and he has been leading this strategicinitiative.
We now face a new challenge in the form of the novel coronavirus and its impact on ourmarkets globally. Our focus first and foremost has been on ensuring the well-being of ouremployees and we have adapted the way we operate to ensure their safety.
In these uncertain times we were pleased to announce on 29 May 2020 that our 2019Form 20-F had been filed with an unqualified audit opinion. The auditor’s opinion in this ARA issimilarly unqualified. Both opinions include a going concern explanatory paragraph attributable inpart to the uncertainties arising from the COVID-19 pandemic and the limited visibility we have of itspossible effect on our business and in part due to the potential of a call for redemption of the Noteson a change of control of our Company or its major shareholder, Grupo VM.
To date, the pandemic has not had a material effect on the Company’s liquidity or financialposition but there is considerable uncertainity as to its effects on our markets, industry andbusiness. We continue to monitor the situation closely, including with daily management calls, toassess its impact on our business and industries and on the geographies in which we operate. Wehave carried out stress testing to model the potential effects of the pandemic on our business andthe extent of any mitigating actions we may need to take, including reducing our operating costsand capital expenditure. Developing a reliable estimate of the potential impact on the results ofoperations and cash flow has been challenging as markets and industries react to the pandemicand we have limited visibility as to its likely effects. Based on current visibility and scenario
7

modelling, we expect the Company to have sufficient cash to continue to operate for the nexttwelve months even in our downside scenario.
Health and Safety
Throughout 2019, improvements in our health and safety performance remained a priority,embedded as such in our management incentive plans. We measure our lost time injuries and theirfrequency rate (LTIFR) across our facilities and report our performance against these metrics ateach board meeting. We aspire to meet industry benchmarks of low single figures for our LTIFR.Despite our efforts, we did not achieve the standards we strive for and this was reflected in thebonus outturn for senior management. We remain dissatisfied with our efforts and have applied newfocus to improving our policies and processes in 2020, working to share best practice across oursites of operation and unifying the initiative under the newly created role of Corporate Health andSafety Manager with global responsibility and reporting directly to the Chief Operating Officer.
Performance in 2019
The cyclical downturn experienced at the end of 2018 continued into 2019. Over the year as awhole, we saw a drop in revenue of 28%, from $2,242 million in 2018 to $1,615 million in 2019,while operating profit fell from $99 million in 2018 to an operating loss of $(355.6) million in 2019,including impairment charges of $174.0 million related to the value of goodwill with respect to theCompany’s U.S. and Canadian operations. There is more on the Company’s performance inrespect of its key performance indicators in 2019 at page 12. In the first quarter of 2019 input costsremained at high levels while volumes declined and prices and margins came under pressure inmost markets. In the first quarter alone we saw a drop in revenues to $456 million from$603.5 million in the last quarter of 2018. We reacted quickly, focusing on operational adjustmentsand cash generating initiatives and implementing a costs savings plan across the organization. Thisincluded reductions in corporate overheads, a key technical metrics (KTM) programme to driveplant-level improvements and decreases in plant-level fixed costs. By year end we had achieved$36.6 million in savings.
To adapt our operating footprint to the evolving market, we implemented further capacitycurtailments. In the first quarter of 2019 we idled two silicon metal furnaces at our Niagara Falls,U.S. plant and one at Sabon, Spain; by the third quarter of the year, we had temporarily shut downour plant at Polokwane in South Africa and annual production capacity had been managed downfrom 328, 000 tonnes at the end of 2018 to 242,000 tonnes. In the third quarter we extended orbrought forward further planned outages at Chateau Feuillet, Montricher and Laudun in France, atBridgeport, Alabama, U.S. and at our joint venture facility at Becancour, Quebec, Canada. Thesecurtailments are never easy and bring with them their own costs but were necessary.
In the second half of the year, our focus was on the release of working capital and thecontinued generation of cash. In June 2019, we entered into a definitive agreement to sellFerroAtlantica S.A.U, our subsidiary in Spain which owned and operated our non-core hydro-electricoperations in Galicia, Spain as well as our Cee-Dumbrıa ferroalloys plant. That transaction wasconsummated in August 2019, resulting in gross cash proceeds for the Company of $177.62 millionafter customary adjustments. Simultaneously with the completion of the sale, we entered into along-term tolling agreement with FerroAtlantica under which the Company was appointed exclusiveoff-taker of the finished goods from the Cee-Dumbrıa plant. The divestiture was complex and, at avaluation multiple of around thirteen times cycle average EBITDA, represented an importantmilestone in our efforts to strengthen our balance sheet. Other non-core divestitures followed,including the sale of our remaining timber farms in South Africa for $8.58 million and our cored wiresubsidiary in Poland, Ultracore Polska ZOO for net proceeds of $2.2 million.
8

In September 2019, we announced that our operational headquarters would re-locate fromLondon, U.K. to Madrid, Spain. This move was undertaken to reduce overhead costs but also tooptimize operations, improving efficiencies by having management and key functions in a singlelocation. The move was largely completed by the year end and the transition has been effectedsmoothly. As part of our cash generating initiatives, we conducted a concerted programme torelease working capital, reducing inventory by $120 million in the fourth quarter.
During the year, we completed two important refinancings that support our goal of increasingliquidity and maintaining financial flexibility. We entered into a new North American asset-basedrevolving credit facility of up to $100m million in October 2019, the proceeds of which were used torepay our then existing revolving credit facility. Unlike its predecessor, the new North Americanasset-based revolver has no leverage-based or financial ratio-based covenants and has a minimumliquidity requirement of $32.5 million, compared with $150 million under our previous facility. InDecember 2019, we completed a new European accounts receivable securitization facility of$150 million, of which $104 million was utilized at closing. This facility provided an additional$23.4 million of liquidity at closing and a further $31.5 million in February 2020 when we added anintermediate special purpose vehicle to the structure. As noted above, we have assessed that wehave sufficient albeit limited cash to operate for the next twelve months. This is something wecontinue to monitor, particularly in light of the COVID-19 pandemic, and we continue to pursueadditional sources of financing to increase our liquidity to fund our operations.
Board and senior management changes
In October 2019, we announced the strengthening of our senior management team throughthe creation of the new role of Chief Operating Officer and the appointment of Benoist Ollivier tothat position. Benoist has a profound knowledge of our business, with over twenty-five years ofexperience in the industry and fifteen years in senior management with the Company and itspredecessors. His new role has been created to ensure greater oversight of our global platform andinvolves working closely with our divisional managers to set, implement and adapt our operationalstrategy. Benoist’s expertise is deeply respected by our regional and divisional teams.
In October 2019, we were also delighted when Beatriz Garcıa-Cos agreed to join us as ourChief Financial Officer. Beatriz’s background as a senior financial professional in multinationalcompanies, with the past seven years spent as the CFO of companies in the metals and miningsector, make her ideally placed to lead the Company’s finance strategy, oversee its financialoperations and provide leadership on many of the key initiatives currently underway, including thoseto optimize our cost structure.
In January 2020, Marco Levi joined us as our new CEO. Marco is an exceptional leader, withover 30 years’ experience in process manufacturing industries, including chemicals, plastics, rubberand paper. He has a proven track record of successful business transformations and demonstrabletalent in leading global, asset-rich, materials technology companies through cyclical downturns tosustainable growth and profitability. With Marco as the latest and key addition to our C-suite, I amconfident we have the leadership team we need to address the challenges and opportunities weface in the months and years ahead.
As CEO, Marco succeeded Pedro Larrea Paguaga who stepped down in January 2020 topursue other opportunities. The Board and I are grateful to Pedro for his commitment to theCompany during his four-year tenure and the four prior years with its predecessor.
On 2 June 2020 we announced the resignation of Greger Hamilton from our Board ofDirectors on 31 May 2020 and that Don Barger would not stand for re-election at the Company’s2020 AGM. Both Don and Greger have been on the Board since the Company was formed in 2015.Greger has been a key driver of the significant improvements we have seen to our control
9

environment and Don has overseen a number of key remuneration initiatives, including theappointment of Marco Levi and Beatriz Garcıa-Cos as CEO and CFO respectively. Don alsooversaw the revision of our directors’ remuneration policy approved at the annual general meetingin 2019, which gained the support of over 90% of the shareholders who voted at that meeting. TheBoard and I are very grateful to Greger and Don for their respective contributions and wish bothwell for the future.
On 4 June 2020, Bruce Crockett was appointed as Chairman of the Audit Committee, havingbeen a member of that Committee since 2015. Bruce brings a strong financial and commercialbackground and significant experience of audit maters to the role. Stu Eizenstat was also appointedto the Committee on this date.
Looking Ahead
We have set out on our journey to re-define the strategic vision and plan for the Company.The COVID-19 pandemic raises new uncertainties and risks but also possible opportunities as theglobal markets flex and settle. We will continue to monitor the situation closely and remain focussedon our priority of recovering value for shareholders: strengthening our balance sheet, continuing todrive down cost and generate cash, with a firm belief in the underlying value of our business andasset base, the strength of our refreshed leadership team and the unique flexibility that our globalproduction platform provides to take advantage of market recovery as it emerges.
I would like to finish by expressing my thanks to our loyal and hard-working employees acrossthe Group and to our customers, suppliers and other partners for their valued contribution. I wouldalso like to thank you, our shareholders, for your continued support.
Javier Lopez Madrid
Executive Chairman
10

Strategic report
This strategic report for the financial year to 31 December 2019 has been prepared incompliance with Section 414C of the Companies Act to provide an overview of the Group’sbusiness and strategy. It contains certain forward-looking statements. These statements are madeby the directors in good faith based on the information available to them up to the time of theirapproval of this report and such statements should be treated with caution due to the inherentuncertainties, including both economic and business risk factors, underlying any such forward-looking information.
For a supplementary description of our business (including our model, strategy andcompetitive strengths), risks associated with our business and our results of operations, see thefollowing sections of the 2019 Form 20-F: Part I, Item 3, Section D, Risk factors; Item 4, Informationon the Company; Item 5, Operating and Financial Review and Prospects; Item 7, MajorShareholders and Related Party Transactions and Item 11, Quantitative and Qualitative DisclosuresAbout Market Risk. These sections are set out in a separate attachment to this U.K. Annual Reportand do not form part of the financial statements.
Nature of the business
Ferroglobe is a global leader in the growing silicon and specialty metals industry with anexpansive geographical reach. It is one of the world’s largest producers of silicon metal, silicon-based alloys and manganese-based alloys and has quartz mining activities, low-ash metallurgicalquality coal mining activities and interests in hydroelectric power across the globe, with operatingunits in 9 countries across 5 continents.
The Group sells its products to a diverse base of customers worldwide, includingmanufacturers of aluminium, silicone compounds used in the chemical industry, ductile iron,automotive parts, photovoltaic (solar) cells, electronic semiconductors and steel and are keyelements in the manufacture of a wide range of industrial and consumer products. Supplies tocustomers are made from our production centres in North America, Europe, South America, Africaand Asia. The Group’s manufacturing platform is flexible, enabling it to switch production betweenplants and products to enhance profitability and meet customer requirements. The Group’sownership of sources of critical raw materials also contributes to reduced operating costs.Ferroglobe recycles and sells most of the by-products generated in its production processes.
Business model and strategy
We believe our vertically integrated business model and ownership of raw materials providesus with a cost advantage over our competitors. We are not reliant on any single supplier for our rawmaterials and currently own sources of these materials, which provides us with stable, long-termaccess to critical raw materials for our production processes and, therefore, enhances operationaland financial stability.
As part of the strategy for delivering the objectives of the Company, the Group develops newproducts or new specifications on a continual basis. As a consequence of these efforts, investmentsmay be made in facilities that allow the production of new products, such as higher-grade siliconmetal, solar grade silicon metal or new foundry products.
The Group is continually pursuing growth opportunities by the acquisition of industrial facilitiesor companies that operate in the same sector and products and which are deemed to bepotentially valuable for the Group.
There is more information on the Group’s business and organizational structure in Part I,Item 4, Information on the Company of the 2019 Form 20-F (as set out in the separate attachment
11

to this U.K. Annual Report and not forming part of our financial statements). This, together with theinformation in this Strategic Report, and the Operating and Financial Review and Prospects sectionof the 2019 Form 20-F included in the separate attachment provides a fair review of the Company’sbusiness and its development and performance during 2019.
Key Performance Indicators (‘‘KPIs’’)
The Board considered that the most important KPIs during 2019 were those set out below.Certain of these KPIs will also be a core area of focus during 2020.
At the corporate level, the principal KPIs that we use for measuring the overall performance ofour business are:
Adjusted EBITDAAdjusted EBITDA marginWorking capital improvementFree cash-flowNet Debt to Total AssetsNet Debt to Capital; andNet Income.
Some of these measures are also part of our compensation structure for the key executives,as follows:
• Adjusted EBITDA: EBITDA, adjusted in accordance with Company’s adjustments announcedas part of its earnings reports.
• Free cash-flow, which represents net cash provided by operating activities less payments forproperty, plant and equipment and, for the purposes of the Company’s annual bonus plan,includes cash from divestitures.
The following table sets out the Company’s performance in respect of these financialmeasures in 2019.
Adjusted WorkingAdjusted EBITDA Capital Free Cash-EBITDA Margin Improvement Flow
($m) ($m) ($m)(29.2) (1.8)% (117.8) (63.6)
(2018: 253.00 (2018: 11.1) (2018: (76.3)) (2018: (32.4))
Net Net Debt to Net Debt toIncome Total Assets Capital
(280.6) 20.7% 37.3%(2018: 43.7) (2018: 20.2%) (2018: 32.7%)
In addition to these financial KPIs, there are a number of non-financial performance measureswhich the Company uses to gauge its success. Some of these are reflected in the annual bonusobjectives for senior management and are reviewed each year to ensure their continued relevance.In the financial year ended 31 December 2019, the annual bonus was subject to an underpinrelated to improvements in the Group’s health and safety performance and a further conditionrelating to the Company’s financial performance or condition. Further information on performance inrespect of these performance measures is in the Directors Remuneration Report at page 51.
12
Details of the Group’s anti-bribery and corruption and environmental policies are below anddetails of its employment policies and greenhouse gas emissions are set out below and in theDirectors’ Report.
Principal risks and uncertainties
The Company is exposed to a number of operational risks which are monitored on anongoing basis and which are summarised in the supplementary attachment. The key financial risksrelated to credit risk and liquidity risk are highlighted in Note 27.
Employees
As at 31 December 2019, the Group had:
• 9 directors, all of whom are male;
• 345 senior managers, of whom 281 are male and 64 are female; and
• 3,383 employees (including the senior managers and 2 of the directors above), of whom3,058 are male and 325 are female.
Environment and other social matters
Ferroglobe is committed to conducting its business in compliance with all applicable laws andregulations in a manner that has the highest regard for human rights, the environment and thehealth and safety and well-being of employees and the general public. During the year underreview the Group’s employees were each asked to re-confirm in writing their commitment to theCompany’s Code of Conduct which emphasizes the Group’s commitment to the highest standardsof integrity, ethical behavior, transparency, safety and corporate citizenship. The Code of Conductincorporates the Group’s key policies on matters including whistleblowing, anti-bribery andcorruption, environmental impacts, health and safety and respect in the workplace and the conductof national and international trade.
Section 172 (1) Statement
This section of the U.K. Companies Act sets out a number of matters to which directors of aU.K. company must have regard in discharging their duty to promote the success of the Company.As of this year, the strategic report must include a statement which describes how the directorshave had regard to those matters when performing their duties. The Board welcomes thisopportunity to throw more light on its governance structures and on how input from its stakeholdershas informed and shaped its decision-making. In 2019 the Board exercised all their duties withregard to these and other factors as they reviewed and considered proposals from seniormanagement and governed the Company through the Board and its Committees.
The factors which the directors must take account of can be summarised as:
• the consequences of any decision in the long term
• taking account of the interests of the Company’s employees and fostering businessrelationships with customers, suppliers and other relevant stakeholders, such as regulatorybodies, governments and local authorities
• the impact of operations on the community and the environment
• maintaining a high standard of business conduct
• acting fairly between its members
13
In order to take account of these factors, the Board must be informed as to them. This takesplace directly and indirectly, through collaborative working with management and direct and indirectfeedback, as illustrated below. The Company’s internal control framework, including the Company’sSarbanes Oxley controls, and the work of the Internal Audit team assists in providing assurance tothe Board on the information made available to it.
The consequences of any decision in the long-term
The governance structures of the Company include delegation of certain responsibilities of theBoard to its key Committee and delegation of the Board’s authority for the executive managementof the Company to its executive team, subject to clearly defined limits and regular monitoring by theBoard and subject also to the reservation to the Board of any matter not expressly delegated in thisway.
The Executives bring their annual plan to the Board for approval each year. This includesforecasts, expected revenues, costs and major expenditure and projects for the year ahead. Eachyear the Board also takes a day out of its board calendar to consider, with the majority of themanagement team, the Company’s strategic plan. In 2019 this strategy day was held in June.Throughout the year, the Board has received a number of reports on the Company’s capitalstructure and financing arrangements. Reports were made regularly to the Board by the EVPs andVPs of each function and region on their area of responsibility, their performance, priorities and keydecisions and risks for the immediate future and medium term, giving assurance that properconsideration is made to the longer-term in decision making throughout the business.
One example of the way in which the consequences of a decision for the longer term havebeen taken into account by the Board is in relation to the relocation of the Company’s managementheadquarters to Madrid in 2019. Several analyses were presented by management during thecourse of the year, detailing the implications for the Company and for its key stakeholders,including its employees in London, where the headquarters were then based, and in Madrid.Factors taken into account by the Board included the operational and organisational benefits ofhaving the majority of the Company’s senior managers and key functions in one location, therelative costs of employment and premises in London and Madrid, the potential loss of keyemployees, the availability of talent in each location with the necessary skills and experience toserve the Company’s needs in the short, medium and longer term, investor reaction, the taxconsequences of moving location, ensuring a seamless transition and the potential complexity ofheadquartering a U.K. plc listed in the U.S.A. in a third country, Spain. Ultimately the Board decidedthat the long-term interests of the Company were best served through prioritisation of operationaland organisational efficiency and embedding a strong and consistent culture within theorganisation. This was seen as key to secure the success of the Company for the longer term andin the best interests of the Company’s stakeholders. The Board therefore determined to re-locatemanagement to Madrid but declined, at present, to move the Company’s residency in order tominimise complexity. The Board will keep this aspect of its decision under review.
Staying informed on employee, customer, supplier, investor and other key stakeholders’ views
Our relationships with those who work for the Company and with the Company are key to oursuccess. The Board stays up to date with views of our employees through a number of means: keymembers of the management team, including the VP Human Resources, usually attend themanagement presentation made at each Board meeting when their input is regularly solicited. Theyare also normally invited to dinners with the Board to allow the dialogue to continue in a less formalsetting. Directors have to date had an annual schedule of visits to our facilities which enable themto spend time with our people on the ground and receive their direct feedback. In 2019 one outputof these site visits has led to an increased focus at Board level on the importance of driving a
14

unified brand and culture for Ferroglobe. In November 2019 we held one of our scheduled Boardmeetings in Chambery, France which gave the Board and our French plant managers anopportunity to meet, get to know one another and exchange views. There are other channelsthrough which the Board or its Committees receives reports on employee views: these include theVP Human Resources’ normal attendance at Compensation Committee meetings and his annualreport on pay and conditions across the Group; and the confidential whistleblowing hotline, reportsto which are in turn reported to the Audit Committee at its scheduled meetings. In 2020 the CEOcommenced town hall meetings, face to face and virtually, with employees across the Group tokeep them updated on our financial and operational performance and employees are encouragedto raise questions as part of those sessions.
We build strong relationships with our customer and suppliers, including our joint venturepartners, spending a lot of time with them to best understand their goals and how to develop ourbusiness in our respective interests. The Board is aware that many of our relationships arelong-term and depend on mutual trust and collaboration. The Board gets feedback on customerand supplier issues on a regular basis: through the input of the EVP Sales and Marketing and VPSupply Chain Management who normally attend management presentations in the scheduled Boardmeetings and through presentations each has made to the Board in late 2018 and 2019 on theirareas of responsibility, priorities and challenges.
The Board is aware that the Company relies on the support of its shareholders and their viewsare important to it. The Board’s interactions with these stakeholders take place through a variety ofchannels. The Company’s major shareholder, Grupo VM, has three representative directors on theBoard through whom views and input can be provided or sought. The Board receives feedbackfrom other shareholders and the investment community through the Company’s quarterly resultspresentations and one to one meetings of the Executive Directors. The EVP Investor Relations is aregular attendee at Board meetings and shares themes or commentary made to the Executives andmanagement by the Company’s investors and certain other stakeholders. Shareholders have theopportunity to attend the general meetings of the Company, including the AGM, and put questionsto directors formally at the meeting and in a more relaxed environment before and afterwards. TheCompany also maintains an investor relations email address on its corporate website, questionsposed to which are directed to its EVP Investor Relations and Company Secretary and, whererelevant, would then be raised by them with the Executive Directors or the Board.
Engaging with community and the environment
We engage with communities, government and regulators in the areas and countries in whichwe operate through a range of industry consultations, trade or industry bodies, conferences, forumsand meetings. In 2019, examples of matters discussed included the proposed divestiture ofFerroAtlantica S. A.U. on which we held a regular dialogue with the local authorities in Galicia,Spain. In prior years we have engaged with local charities and community groups. In 2019 we heldan open day at our plant at Mo I Rana in Norway to allow local residents to view the facility and, inSouth Africa, the Mahale Community Forum visited our plant at Polokwane to see how quartz minedon their tribal lands is used in our production processes. We would also routinely consult with thelocal, regional and sometimes central governments and their agencies on the proposed idling ofour production facilities. These matters are reported to the Board, which is kept updated on thestatus of these discussions and their progress.
We recognise that our business has an impact on the environment and work with relevantauthorities and industry experts to manage and minimise that impact. The Audit Committee of theBoard receives regular updates on any allegations of non-compliance by the business withenvironmental laws and regulations, such as the allegations of violations of clean air legislation in
15
the U.S.A. made by the U.S. Department of Justice in relation to the operations and construction ofour Beverly facility. There is more on this in Note 24.
There is more on our environmental impact on pages 19 to 21.
Maintaining a high standard of business conduct
On behalf of the Company, the Board has adopted a number of policies which articulate theCompany and the Board’s commitment to the highest standards of integrity, ethical behaviour,transparency, safety and corporate citizenship. These include, as their mainstay, the Company’scode of conduct which sets out the Company’s policies on bribery and corruption, whistleblowing,conflicts of interest and political and charitable contributions, as well as the importance ofsafeguarding the wellbeing of its employees and protecting its resources. The Code of Conduct issupported by further policies on whistleblowing, data protection and statements on tradecompliance, tax and modern slavery. The Board has also adopted a corporate governance policy toprotect the interests of minority shareholders (on which there is more on page 16 below).
The Code of Conduct is reviewed regularly and every employee of the Company and all of itsBoard members are asked to confirm their personal commitment to the Code on joining theCompany and to re-confirm it annually thereafter. Employees have the opportunity to reportsuspected breaches of the Code, for which purpose a secure and confidential hotline has beenestablished run by an independent third party. Allegations of breaches of the Code are normallyreported to the Audit Committee at each of its scheduled meetings and regular updates on thestatus of follow-up actions and outcomes given. As stated above, the Audit Committee also receivesregular updates on any allegations of non-compliance of the business with environmental and otherlaws and regulations.
Acting fairly between members
A significant number of the Company’s shares are held by Grupo VM, its major shareholder.The Company has a number of checks and balances in place throughout the Company’sgovernance framework to ensure that the interests of the majority and the minority shareholders arerespected and the Board is very cognisant of its duties in this regard. These checks and balancesinclude:
• the Company’s shareholders agreement with Grupo VM which regulates Boardappointments, including those nominated by Grupo VM, Grupo VM’s rights to transfer andpledge its shares, its pre-emption rights and standstill obligations and the confidentialityagreement with Grupo VM which regulates the use, disclosure and security of confidentialinformation shared with Grupo VM or its representatives;
• the Company’s Articles of Association which, among other things, require the approval of amajority of independent directors to any agreement or arrangement between the Companyand Grupo VM,
• the Board’s corporate governance policy first adopted in October 2017 under which theBoard commits to maintain a majority of independent directors on the Board. This policy isreviewed by the Board at least every eighteen months;
• the workings and functions of the Board’s key Audit and Compensation Committees, whichare made up exclusively of independent Board directors;
• the Company’s related parties’ policy which stipulates how and in what way proposedrelated party transactions are to be submitted for consideration and approval by the Audit
16

Committee of the Board and the Company’s register of related party transactions which issubmitted to each scheduled meeting of the Audit Committee;
• the presence of three directors on the Board who were nominated by Grupo VM.
The Group Company Secretary has primary responsibility — with the Chief Legal Officer — foradvising the Board on its duties and on the Company’s governance framework and normallyattends all meetings of the Board and its Committees.
The Strategic Report for the financial period ended 31 December 2019 has beenreviewed and approved by the Board on 5 June 2020.
Dr. Marco Levi
Director
17

Directors’ report
The Directors present their report and the audited financial statements of the Group andCompany for the year ended 31 December 2019.
The Directors’ Report comprises these pages 18 to 24 and the other sections and pages ofthe Annual Report cross-referred below which are incorporated by reference.
As permitted by legislation, certain disclosures normally included in the Directors’ Report haveinstead been integrated into the Strategic Report (pages 11 to 17). These disclosures includeinformation relating to the Group’s principal risks and uncertainties.
Directors
The directors of the Company, who held office at any time during the year to 31 December2019, were as follows:
Javier Lopez Madrid . . . . . . . . . . . . . . . . . . . . . Director and Executive ChairmanJose Marıa Alapont . . . . . . . . . . . . . . . . . . . . . Non-Executive DirectorDonald G. Barger, Jr. . . . . . . . . . . . . . . . . . . . . Non-Executive DirectorBruce L. Crockett . . . . . . . . . . . . . . . . . . . . . . . Non-Executive DirectorStuart E. Eizenstat . . . . . . . . . . . . . . . . . . . . . . Non-Executive DirectorManuel Garrido y Ruano . . . . . . . . . . . . . . . . . . Non-Executive DirectorGreger Hamilton . . . . . . . . . . . . . . . . . . . . . . . Non-Executive DirectorPedro Larrea Paguaga . . . . . . . . . . . . . . . . . . . Director and Chief Executive OfficerJavier Monzon . . . . . . . . . . . . . . . . . . . . . . . . . Non-Executive DirectorPierre Vareille . . . . . . . . . . . . . . . . . . . . . . . . . Non-Executive DirectorJuan Villar-Mir de Fuentes . . . . . . . . . . . . . . . . . Non-Executive Director
Messrs Javier Monzon and Pierre Vareille resigned from the Board on 13 and 14 May 2019,respectively.
On 10 January 2020, Mr Pedro Larrea Paguaga left the employment of the Company and itsBoard. On the same date, Dr. Marco Levi was appointed as CEO of the Company and on15 January 2020 he was appointed to the Board.
On 31 May 2020 Greger Hamilton resigned from the Board. Donald Barger has announced hisintention to step down from the Board at the conclusion of the 2020 AGM.
The biographies of our directors as at the date of this report are set out on pages 25 to 28.Details of the directors standing for election or re-election at our 2020 AGM will be set out in thenotice of that meeting.
Directors’ indemnities
As required by the Articles, each director is indemnified in connection with his role as adirector, to the extent permitted by law. As permitted by the Articles, the Company has purchasedand maintained throughout the year under review directors’ and officers’ liability insurance.
Share repurchases
The Company has not acquired any of its own shares during the year ended 31 December2019.
During the year under review the Company disposed of 8,040 shares held by it in treasury.These shares were transferred to employees in satisfaction of the Company’s obligations on the
18

vesting of two conditional share awards granted in 2016 under the EIP and vesting on 5 December2019. No further consideration was received for the transfer of these shares.
Dividends
The Company has not declared any dividends during the year under review.
Political donations
During the year under review the Company has not made any political donations, incurred anypolitical expenditure or made any contributions to an EU or non-EU political party.
Employee policies
Ferroglobe has a culture of continuous improvement through investment in people at all levelswithin the organisation. Its Code of Conduct (‘‘Code’’), which applies to all directors and toemployees of the Group, sets out Ferroglobe’s commitment to protecting, respecting andsupporting its workforce. The Code was revised in 2017 to bring together Ferroglobe’s policies onkey ethical, behavioural and compliance matters. Its roll-out across the Group globally was initiatedin autumn 2017, supported by mandatory training for all employees. In 2018 and 2019, Grouppersonnel were requested to re-certify their knowledge of and continued compliance with the Code.The adoption and further promulgation of the Code is consistent with our evolution to anorganization with an integrated approach to human relations policies across the five continents inwhich the Group operates.
Those key policies include:
• Health and safety, where Ferroglobe places high value on the well-being of all personneland is committed to providing a healthy and safe working environment;
• Respect in the workplace, promoting equality and diversity, rejecting harassment andbullying and supporting work-life balance.
• Striving to conduct operations in a way that respects the human rights of personnel,suppliers and others with whom Ferroglobe works, including local communities;
• Encouraging the reporting of wrongdoing or of any suspicions or concerns as towrongdoing, any of which can be raised in confidence through the whistleblowing hotlinewhich Ferroglobe has established in all countries in which it operates where it is lawful to doso.
Ferroglobe is committed to providing equal opportunities for all Group personnel and tocreating an inclusive workforce by promoting employment equality. This includes pursuing equalityand diversity in all its employment activities, including recruitment, training, career development andpromotion and ensuring there is no bias or discrimination in the treatment of people. Ferroglobeopposes all forms of unlawful or unfair discrimination on the grounds of race, age, nationality,religion, ethnic or national origin, sexual orientation, gender or gender reassignment, marital statusor disability. Wherever possible, vacancies are filled from within Ferroglobe and efforts are made tocreate opportunities for internal promotion.
Greenhouse gas emissions
The UK Companies Act 2006 (Strategic Report and Directors’ Reports) Regulations 2013requires UK-based quoted companies to report global greenhouse gas (‘‘GHG’’) emissions data inthe Annual Report and Accounts. Comparison year data for 2017, 2018 and 2019 is included inTable 2 in this report. As in 2017-2018, the 2019 GHG inventory was prepared in accordance with
19

the Ferroglobe PLC Greenhouse Gas Inventory Management Plan (2017), prepared in consultationwith ERM Group, Inc. and its UK affiliate (the ‘‘IMP’’).
The Company has selected the Operational Control approach and criteria as the basis forreporting GHG emissions data, defining ‘‘Operational Control’’ to encompass facilities the Groupowns and operates, facilities it leases and operates, and joint venture facilities it operates. Allfacilities within Ferroglobe’s Operational Control that are material to its Group-wide GHG emissioninventory are included in reported figures. This approach means that the operations for whichemissions are reported are substantially coextensive with operations comprised by Ferroglobe’sconsolidated financial reporting. The Company does not have responsibility for any emissionsources that are not included in its financial reporting.
Table 1 sets forth the Company’s consolidated greenhouse gas emissions expressed in metrictonnes of carbon dioxide equivalent (CO2e). The figures reported below include all material direct(Scope 1) and indirect (Scope 2) emission sources for facilities within the Company’s OperationalControl. Principal sources of Scope 1 emissions from operations at, or Scope 2 emissions imputedto, Ferroglobe-controlled facilities include:
• Electricity purchased or produced by Ferroglobe facilities
• Fuels purchased for consumption in stationary sources on-site at Ferroglobe facilities (e.g.,natural gas, diesel, LPG)
• Fuels purchased for consumption in mobile sources owned and operated by Ferroglobe
• Process emissions associated with electric arc furnaces used for the production of siliconmetal and ferroalloys.
Table 1. Company-wide Scope 1 and Scope 2 Emissions for 2019
Global GHG emissions data for period 1 January 2018 to 31 December 2019
Emissions From: Tonnes of CO2e
Combustion of fuel and operation of facilities . . . . . . . . . . . . . . . . . . . . . . . . . . . 2,490,210*Electricity, heat, steam and cooling purchased for own use . . . . . . . . . . . . . . . . 1,929,965Company’s chosen intensity measurement:
Emissions reported above normalized to per tonne of product output . . . . . . . 4.99
* In line with DEFRA Guidance, 944.997 tonnes of CO2e are not included in the above table, due to being biogenic innature.
20
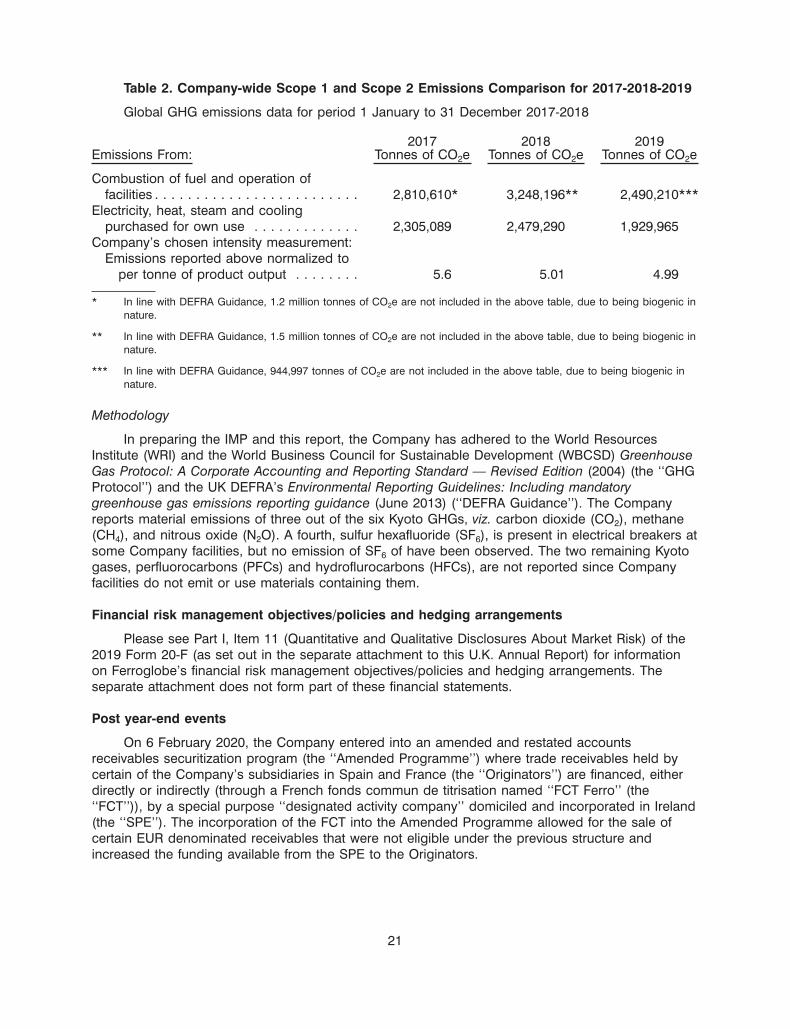
Table 2. Company-wide Scope 1 and Scope 2 Emissions Comparison for 2017-2018-2019
Global GHG emissions data for period 1 January to 31 December 2017-2018
2017 2018 2019Emissions From: Tonnes of CO2e Tonnes of CO2e Tonnes of CO2e
Combustion of fuel and operation offacilities . . . . . . . . . . . . . . . . . . . . . . . . . 2,810,610* 3,248,196** 2,490,210***
Electricity, heat, steam and coolingpurchased for own use . . . . . . . . . . . . . 2,305,089 2,479,290 1,929,965
Company’s chosen intensity measurement:Emissions reported above normalized to
per tonne of product output . . . . . . . . 5.6 5.01 4.99
* In line with DEFRA Guidance, 1.2 million tonnes of CO2e are not included in the above table, due to being biogenic innature.
** In line with DEFRA Guidance, 1.5 million tonnes of CO2e are not included in the above table, due to being biogenic innature.
*** In line with DEFRA Guidance, 944,997 tonnes of CO2e are not included in the above table, due to being biogenic innature.
Methodology
In preparing the IMP and this report, the Company has adhered to the World ResourcesInstitute (WRI) and the World Business Council for Sustainable Development (WBCSD) GreenhouseGas Protocol: A Corporate Accounting and Reporting Standard — Revised Edition (2004) (the ‘‘GHGProtocol’’) and the UK DEFRA’s Environmental Reporting Guidelines: Including mandatorygreenhouse gas emissions reporting guidance (June 2013) (‘‘DEFRA Guidance’’). The Companyreports material emissions of three out of the six Kyoto GHGs, viz. carbon dioxide (CO2), methane(CH4), and nitrous oxide (N2O). A fourth, sulfur hexafluoride (SF6), is present in electrical breakers atsome Company facilities, but no emission of SF6 of have been observed. The two remaining Kyotogases, perfluorocarbons (PFCs) and hydroflurocarbons (HFCs), are not reported since Companyfacilities do not emit or use materials containing them.
Financial risk management objectives/policies and hedging arrangements
Please see Part I, Item 11 (Quantitative and Qualitative Disclosures About Market Risk) of the2019 Form 20-F (as set out in the separate attachment to this U.K. Annual Report) for informationon Ferroglobe’s financial risk management objectives/policies and hedging arrangements. Theseparate attachment does not form part of these financial statements.
Post year-end events
On 6 February 2020, the Company entered into an amended and restated accountsreceivables securitization program (the ‘‘Amended Programme’’) where trade receivables held bycertain of the Company’s subsidiaries in Spain and France (the ‘‘Originators’’) are financed, eitherdirectly or indirectly (through a French fonds commun de titrisation named ‘‘FCT Ferro’’ (the‘‘FCT’’)), by a special purpose ‘‘designated activity company’’ domiciled and incorporated in Ireland(the ‘‘SPE’’). The incorporation of the FCT into the Amended Programme allowed for the sale ofcertain EUR denominated receivables that were not eligible under the previous structure andincreased the funding available from the SPE to the Originators.
21

Subsequent to entering into the Amended Programme, the Company has repaid $34.5 millionof senior loans in order to optimise the level of borrowings of the SPE with the level of receivablesin the securitization.
In early 2020, the outbreak of coronavirus disease in China spread to other jurisdictions,including locations where the Company conducts business. As of the date of the issuance of theconsolidated financial statements, the COVID-19 pandemic has not had a material effect on theCompany’s liquidity or financial position. The Company continues to monitor the impact that theCOVID-19 pandemic is having on the Company, the specialty chemical industry and the economiesin which the Company operates. Given the speed and frequency of continuously evolvingdevelopments with respect to this pandemic and the uncertainties this may bring for the Companyand the demand for its products it is difficult to forecast the level of trading activities and hencecash flow in the next twelve months. The Company has developed an impact assessment to stresstest and assess potential responses to a downside scenario. This assessment involves applicationof key assumptions around market demand and prices, including the extent of the decrease thatmight be experienced in summer 2020 and the subsequent timing and level of recovery.Additionally, judgment is required around the level and extent of mitigating actions such asreductions in operating costs and capital expenditure. Developing a reliable estimate of thepotential impact on the results of operations and cash flow at this time is difficult as markets andindustries react to the pandemic and the measures implemented in response to it, but theCompany’s downside scenario analysis supports an expectation that the Company will have cashheadroom to continue to operate throughout the next twelve months. The key assumptionunderlying this assessment is a recovery in forecast trading activity in the latter part of 2020.
In March 2020, the Company closed out the cross-currency swap (see Note 28) resulting inthe receipt of cash proceeds of $3.608 million.
Future developments
As part of its strategy to serve customers better, the Group develops new products or newspecifications on a continuous basis. As a consequence of these efforts, investments have beenmade in facilities that allow the production of new products, such as higher-grade silicon metal,solar grade silicon metal, electrodes for use in silicon metals furnaces, high-value powders for usein Li-on batteries or new foundry products. Please see the details of the Elsa electrode, solar gradesilicon and high-value powders projects at Part I, Item 4, Information on the Company of the 2019Form 20-F as examples of how the Group has developed proprietary technologies and has pursuedinnovation in the development of new products.
Research and development
Please refer to Part I, Item 4, Information on the Company of the 2019 Form 20-F (as set outin the separate attachment to this U.K. Annual Report) for information on Ferroglobe’s research anddevelopment activities and opportunities.
Overseas branches
The Company has no overseas branches.
Share capital structure and change of control provisions
The Company’s share capital comprises ordinary shares of $0.01 each, all of which bear thesame rights and obligations. The Company’s issued share capital at 31 December 2019 is set outat Note 13.
22

The rights attaching to the Ordinary Shares are set out in the Articles, a copy of which can beobtained from the Company Secretary on request. Each Ordinary Share has one vote attaching to itfor voting purposes and all holders of Ordinary Shares are entitled to receive notice of and attendand vote at the Company’s general meetings. The Articles vest power in the directors to refuse toregister transfers of Ordinary Shares in certain circumstances including where the instrument oftransfer is not stamped or is in favour of more than 4 transferees. There are also restrictions in theArticles affecting the terms of tender offers and any scheme of arrangement, consolidation, mergeror business combination designed to protect minority shareholders while Grupo VM and itsassociates hold ten percent or more of the Ordinary Shares. The SHA contains restrictions on thetransfer of shares by Grupo VM.
Significant agreements affected by a takeover
There are no agreements between the Group and any of its employees or any director of theCompany that provide for compensation to be paid to the employee or director for termination ofemployment or for loss of office as a consequence of a takeover of the Company, other thanprovisions that would apply on any termination of employment.
The Notes and the ABL RCF are subject to provisions allowing the lenders to terminate thefacilities and demand repayment following a change of control, including the requirement to offerredemption of the Notes at 101% of par value in the event of a change of control. Grupo VM, theCompany’s principal shareholder, has pledged its holding to secure its obligations to its lenders.The Company may experience a change of control and be required to offer redemption of theNotes at a cash purchase price equal to 101% of par value were this pledge to be enforced andmore than 35% of the Ordinary Shares were acquired by a beneficial owner (or group actingtogether as beneficial owner) in circumstances where Grupo VM (and certain other ‘PermittedHolders’ as defined in the Notes) held a lesser percentage. Grupo VM’s percentage holding in theCompany is currently approximately 54%. While Grupo VM maintains its current shareholding, achange of control cannot occur. On this basis, a change of control as defined in the Incentive isunlikely to occur but the matter it is beyond the Company’s control. If a change of control were tooccur, the Company may not have sufficient financial resources available to satisfy all of itsobligations.
Going concern
The Company acknowledges that the material uncertainties described in this ARA, includingthe possible impact of the COVID-19 pandemic and the potential repayment of the outstandingbalance of the Notes should there be a change of control, raise substantial doubt as to the ability ofthe Company to continue as a going concern for a period of twelve months following the date ofthis ARA. Nevertheless, based on the assessments undertaken by the Company, the directors havea reasonable expectation that the Company has the resources necessary to continue in operationalexistence for the period of twelve months following the date of this report and have thereforeprepared the financial statements in this ARA on a going concern basis. There is more informationon the material uncertainties and the basis of this assessment in Note 3.1.
Statement of disclosure to the Company’s U.K. statutory auditor
In accordance with section 418 of the Companies Act, each director at the date of thisDirectors’ Report confirms that:
• so far as he is aware, there is no relevant audit information of which the Auditor is unaware;and
23

• he has taken all the steps he ought to have taken as a director to make himself aware ofany relevant audit information and to establish that the Auditor is aware of that information.
This confirmation is given and should be interpreted in accordance with the provisions ofsection 418 of the Companies Act. Deloitte LLP has indicated its willingness to continue in office,and a resolution that it be re-appointed will be proposed at the 2020 AGM.
By order of the Board on 5 June 2020
Dr. Marco Levi
Director
24

The Board of Directors
Details of the members of the Board as at the date of this ARA are below.
Javier Lopez Madrid
Javier Lopez Madrid has been Executive Chairman of the Company since 31 December 2016and Chairman of our Nominations Committee since 1 January 2018. He was first appointed to theBoard on 5 February 2015 and was the Company’s Executive Vice-Chairman from 23 December2015 until 31 December 2016.
He has been Chief Executive Officer of Grupo VM since 2008, is a member of the WorldEconomic Forum, Group of Fifty and a member of the Board of several non profit organizations. Heis the founder and largest shareholder of Financiera Siacapital S.L. and founded Tressis, Spain’slargest independent private bank.
Mr. Lopez Madrid holds a Masters in law and business from ICADE University.
Marco Levi
Marco Levi was appointed Chief Executive Officer of the Company on 13 January 2020 andappointed to its Board of Directors on 15 January 2020. Dr. Levi previously served as President andCEO of Alhstrom-Munksjo Oyj, a global fiber materials company listed in Finland, where he led asuccessful transformation of the business by refocusing its product portfolio towards value-addedspecialty products. Prior to that, Dr. Levi was Senior Vice President and Business President of the$3 billion emulsion polymers division of chemicals manufacturer Styron, including during the periodin which Styron was acquired by Bain Capital from Dow Chemical Company. Dr. Levi previously hadspent over twenty-two years at Dow in various departments and roles, ultimately serving as generalmanager of the emulsion polymers business.
Dr. Levi is also a Non-Executive Director of Schweitzer-Mauduit International, Inc, the leadingglobal performance materials company, listed on the New York Stock Exchange. Dr Levi holds adoctorate in industrial chemistry from the Universita degli Studi di Milano, Statale,in Italy.
Jose Marıa Alapont
Jose Marıa Alapont was appointed to our Board of Directors as a Non-Executive Director on24 January 2018 and to our Audit Committee and Compensation Committee on 16 May 2018.Mr. Alapont was appointed on 16 January 2019 as our Senior Independent Director and Chairmanof our Corporate Governance Committee.
Mr. Alapont holds a number of other Board appointments. Since 2017, he has been a memberof the Board of Directors of Ashok Leyland Ltd and is also a member of its Investment andTechnology Committee Since 2018, he has been a member of its Nomination and RemunerationCommittee and joined its Audit Committee in 2019. Mr Alapont has also been a Board Director ofNavistar Inc. and a member of its Finance Committee since 2016 and Chair of its Nomination andGovernance Committee since 2018. He has been a member of the Board of Directors of HindujaInvestments and Project Services Ltd since 2016 and of Hinduja Automotive Ltd since 2014.
Mr. Alapont was formerly President and Chief Executive Officer of Federal-Mogul Corporation,the automotive powertrain and safety components supplier, from March 2005 to 2012, Chairman ofits Board from 2005 to 2007 and Board director from 2005 to 2013. Prior to that, he was ChiefExecutive and a Board Director of Fiat Iveco, S.p.A., a leading global manufacturer of commercialtrucks, buses, defense and other specialized vehicles from 2003 to 2005. Prior to 2003, he heldExecutive, Vice President and President positions for more than 30 years at other leading global
25

vehicle manufacturers and suppliers, such as Ford Motor Company, Delphi Corporation andValeo S.A. His non-executive experience also includes being member of the Board of Directors ofthe Manitowoc Company Inc. from 2016 to 2018 and a Board Director of Mentor Graphics Corp.from 2011 to 2012. He was a member of the Davos World Economic Forum from 2000 to 2011.
Mr. Alapont holds an Industrial Engineering degree from the Technical School of Valencia anda Philology degree from the University of Valencia in Spain.
Donald G. Barger Jr.
Donald G. Barger, Jr, was appointed to our Board of Directors as a Non-Executive Director onDecember 23, 2015. He has served as the Chairman of our Compensation Committee and amember of our Nominations Committee since January 1, 2018. From December 23, 2015 toDecember 31, 2017, he was the Chair of our Nominating and Corporate Governance Committeeand a member of our Compensation Committee.
Mr Barger was a member of the Board of Directors of Globe from December 2008 until theclosing of the Business Combination and Chairman of Globe’s Audit Committee and CompensationCommittee. He had a successful 36-year business career in manufacturing and services companies,including as Vice President and Chief Financial Officer of YRC Worldwide Inc. (formerly YellowRoadway Corporation) from 2000 to 2007 and as advisor to the CEO from 2007 until his retirementin 2008. He was Vice President and Chief Financial Officer of Hillenbrand Industries, a provider ofservices and products for the health care and funeral services industries, from 1998 to 2000. Hewas Vice President of Finance and Chief Financial Officer of Worthington Industries, Inc., adiversified steel processor, from 1993 to 1998 and a member of the Board of Directors of GardnerDenver, Inc. and a member on its Audit Committee for his entire 19-year tenure until the company’ssale in July 2013, serving as chair of the Audit Committee for 17 of those years. He served on theBoard of Directors of Quanex Building Products Corporation for sixteen years, retiring in February2012. He served on its Audit Committee for 14 years and was its Chair for most of that time.
Mr. Barger has a Bachelor of Science degree from the U.S. Naval Academy and an MBA fromthe University of Pennsylvania.
Bruce L. Crockett
Bruce L. Crockett was appointed to our Board of Directors as a Non-Executive Director on23 December 2015. He has been a member of our Audit Committee from that date and has servedon our Compensation Committee since 1 January 2018. He was appointed Chairman of the AuditCommittee on 4 June 2020.
Mr. Crockett holds a number of other Board and governance roles. He has been Chairman ofthe Invesco Mutual Funds Group Board of Directors and a member of its Audit, Investment andGovernance Committees, serving on the board since 1991, as Chair since 2003 and on the Boardof predecessor companies from 1978. Since 2013, he has been a member of the Board of Directorsand, since 2014, Chair of the Audit Committee of ALPS Property & Casualty Insurance Company.He has been Chairman of, and a private investor in, Crockett Technologies Associates since 1996.He is a life trustee of the University of Rochester.
Mr. Crockett was a member of the Board of Directors of Globe from April 2014 until theclosing of the Business Combination, as well as a member of Globe’s Audit Committee. He wasformerly President and Chief Executive Officer of COMSAT Corporation from 1992 until 1996 and itsPresident and Chief Operating Officer from 1991 to 1992, holding a number of other operationaland financial positions at COMSAT from 1980, including that of Vice President and Chief Financial
26
Officer. He was a member of the Board of Directors of Ace Limited from 1995 until 2012 and ofCaptaris, Inc. from 2001 until its acquisition in 2008 and its Chairman from 2003 to 2008.
Mr. Crockett holds an A.B. degree from the University of Rochester, B.S. degree from theUniversity of Maryland, an MBA from Columbia University and an Honorary Doctor of Law degreefrom the University of Maryland.
Stuart E. Eizenstat
Stuart E. Eizenstat was appointed to our Board of Directors as a Non-Executive Director on23 December 2015. He has been a member of the Company’s Corporate Governance Committeesince January 1, 2018 and was appointed to our Nominations Committee on 16 May 2018 and ourAudit Committee on 4 June 2020.
Mr. Eizenstat has been a Senior Counsel at Covington & Burling LLP in Washington, D.C. andHead of its international practice since 2001. He has served as a member of the Advisory Boards ofGML Ltd. since 2003 and of the Office of Cherifien de Phosphates since 2010. He was a trustee ofBlackRock Funds from 2001 until 2018.
Mr. Eizenstat was a member of Board of Directors of Globe from 2008 until the closing of theBusiness Combination and Chair of its Nominating Committee. He was a member of the Board ofDirectors of Alcatel-Lucent from 2008 to 2016 and of United Parcel Service from 2005 to 2015. Hehas had an illustrious political and advisory career, including serving as Special Adviser to Secretaryof State Kerry on Holocaust-Era Issues from 2009 to 2017 and Special Representative of thePresident and Secretary of State on Holocaust Issues during the Clinton administration from 1993to 2001. He was Deputy Secretary of the United States Department of the Treasury from July 1999to January 2001, Under Secretary of State for Economic, Business and Agricultural Affairs from1997 to 1999, Under Secretary of Commerce for International Trade from 1996 to 1997, U.S.Ambassador to the European Union from 1993 to 1996 and Chief Domestic Policy Advisor in theWhite House to President Carter from 1977 to 1981. He is the author of ‘‘Imperfect Justice: LootedAssets, Slave Labor, and the Unfinished Business of World War II’’; ‘‘The Future of the Jews: HowGlobal Forces are Impacting the Jewish People, Israel, and its Relationship with the United States’’and ‘‘President Carter: The White House Years.’’
Mr. Eizenstat holds a B.A. in Political Science, cum laude and Phi Beta Kappa, from theUniversity of North Carolina at Chapel Hill, a J.D. from Harvard Law School and nine honorarydoctorate degrees and awards from the United States, French, German, Austrian, Belgian andIsraeli governments.
Manuel Garrido y Ruano
Manuel Garrido y Ruano was appointed to our Board of Directors as a Non-Executive Directoron 30 May 2017. He was a member of our Nominating and Corporate Governance Committee from30 May 2017 until 31 December 2017, when he was appointed to our Corporate GovernanceCommittee.
Mr. Garrido y Ruano has been Chief Financial Officer of Grupo VM since 2003 and a memberof the Board or on the steering committee of a number of its subsidiaries in the energy, financial,construction and real estate sectors. He is Professor of Communication and Leadership of theGraduate Management Program at CUNEF in Spain. Mr. Garrido y Ruano was a member of thesteering committee of FerroAtlantica until 2015, having previously served as its Chief FinancialOfficer from 1996 to 2003. He worked with McKinsey & Company from 1991 to 1996, specializing inrestructuring, business development and turnaround and cost efficiency projects globally.
27

Mr. Garrido y Ruano holds a Masters in Civil Engineering with honors from the UniversidadPolitecnica de Madrid and an MBA from INSEAD.
Juan Villar-Mir de Fuentes
Juan Villar-Mir de Fuentes was appointed to our Board of Directors as a Non-ExecutiveDirector on 23 December 2015.
Mr. Villar-Mir de Fuentes has been Vice Chairman of Inmobiliaria Espacio, S.A since 1996 andVice Chairman of Grupo Villar Mir, S.A.U. since 1999. He has been a member of the Board ofDirectors of Obrascon Huarte Lain, S.A. since 1996, a member of the Audit Committee and, later, itsCompensation Committee and its Chairman since 2016. He was a Board director and member ofthe Compensation Committee of Inmobiliaria Colonial, S.A from June 2014 to May 2017. He alsowas a member of the Board of Directors and of the Compensation Committee of AbertisInfraestructuras, S.A. between 2013 and 2016.
Mr. Villar-Mir de Fuentes is Patron and member of the Patronage Council of Fundacion NantikLum and Fundacion Princesa de Gerona.
Mr. Villar-Mir holds a Bachelor’s Degree in Business Administration and Economics andBusiness Management.
28

Directors’ responsibilities
The directors are responsible for preparing the Company’s annual reports and financialstatements in accordance with applicable law and regulations.
Company law requires the directors to prepare financial statements for each financial period.Under that law the directors have elected to prepare the financial statements in accordance withInternational Financial Reporting Standards (‘‘IFRSs’’) as issued by the International AccountingStandards Board (‘‘IASB’’) and have elected to prepare the parent company financial statements inaccordance with Financial Reporting Standard 101 Reduced Disclosure Framework. Undercompany law the directors must not approve the financial statements unless they are satisfied thatthey give a true and fair view of the state of affairs of the Company and the Group and of the profitor loss of the Group for that period. In preparing these financial statements, InternationalAccounting Standard 1 requires that directors:
• properly select and apply accounting policies;
• present information, including accounting policies, in a manner that provides relevant,reliable, comparable and understandable information;
• provide additional disclosures when compliance with the specific requirements in IFRSs isinsufficient to enable users to understand the impact of particular transactions, other eventsand conditions on the entity’s financial position and financial performance; and
• make an assessment of the entity’s ability to continue as a going concern.
The directors are responsible for keeping adequate accounting records that are sufficient toshow and explain the Company’s transactions and disclose with reasonable accuracy at any timethe financial position of the Company and the Group and enable them to ensure that the financialstatements and the directors’ remuneration report comply with the Companies Act. They are alsoresponsible for safeguarding the assets of the Company and the Group and hence for takingreasonable steps for the prevention and detection of fraud and other irregularities.
The directors are responsible for the maintenance and integrity of the corporate and financialinformation included on the Company’s website.
Legislation in the United Kingdom governing the preparation and dissemination of financialstatements may differ from legislation in other jurisdictions.
Directors’ responsibility statement
To the best of each directors’ knowledge:
• the financial statements, prepared in accordance with the applicable accounting standards, givea true and fair view of the assets, liabilities, financial position and profit or loss of the Company;
• this directors’ report and the strategic report include a fair review of the development orperformance of the business and the position of the Company and its subsidiaries andsubsidiary undertakings taken as a whole, together with a description of the principal risksand uncertainties that they face;
• the annual report and financial statements, taken as a whole, are fair, balanced andunderstandable and provide the information necessary for shareholders to assess theCompany’s position, performance, business model and strategy.
The responsibility statement was approved by the Board and signed on its behalf.
By order of the Board on 5 June 2020
Dr. Marco LeviDirector
29

Directors’ Remuneration Report
Introduction
Dear Shareholder
As Chairman of the Compensation Committee (the Committee), and on behalf of the Board, Ipresent the Directors’ Remuneration Report for the period ended 31 December 2019.
This report sets out both the Company’s annual report on remuneration (the ARR) for 2019and the directors’ remuneration policy (the 2019 Policy or the Policy), which was put toshareholders at the 2019 AGM and approved by over 91% of the shareholders who voted on it.Thank you for your support. The 2019 Policy is included on pages 33 to 46 for your informationand ease of reference.
The Policy
Under English law, a directors’ remuneration policy requires shareholder approval not lessthan once in every three years. The Committee concluded its review of the policy first approved in2016 in early 2019 and determined, as the deterioration in market conditions in the second half of2018 continued into 2019, that the then current remuneration framework achieved an appropriatebalance of performance and reward. The few changes as between the version of the 2019 Policyincluded in last year’s U.K. Annual Report and Accounts and that in this report reflect thedifferences between the Policy’s implementation in relation to our new CEO, appointed in January2020, and to his predecessor, Pedro Larrea Paguaga, who left the Company at the same time.
Management Changes
We welcomed Marco Levi as our new CEO in January 2020. The Committee reviewed hisproposed terms of employment and compensation package prior to his appointment to determinethat they met the objectives of and complied with the Policy and, following some changes proposedby the Committee, recommended their approval to the Board. Consequent on the relocation ofmanagement to Spain in 2019, Marco is employed in Spain under a contract of employmentgoverned by Spanish law. This has necessitated some changes to the manner in which we haveimplemented the Policy, as detailed in this report. Marco Levi’s base salary is slightly higher thanhis predecessor but, taking account of base salary and benefits, both his overall fixedcompensation and his total remuneration are lower, reflecting, among other things, the lower marketcapitalization of the Company, its financial performance at the date of appointment and therelocation of the Company’s head office to Madrid. A similar approach was taken in relation to theremuneration of the new CFO, Beatriz Garcıa-Cos, appointed in October 2019. Starting in 2020, weexpect the roll-out of this review and re-alignment of executive compensation to continue in respectof senior managers below Board level.
The relocation of our operational headquarters to Madrid also implies some changes to ourexecutive remuneration framework in 2020. Some of these have already been implemented, asillustrated in relation to Marco Levi’s service contract detailed in this report. We also expect that, asmanagement relocates to be based permanently in Madrid, any expatriate allowances awarded toemployees relocating to their home country to work will be phased out during the year ahead.
The Committee also evaluated the terms of settlement proposed with Pedro Larrea Paguagaas former CEO on his leaving the Company in January 2020. Pedro Larrea Paguaga’s servicecontract and the rules of the Company’s EIP and Annual Bonus Plan included express provision onthe compensation payable and the treatment of Pedro Larrea Paguaga’s awards on leaving.Following evaluation by the Committee and recommendation to the Board, it was agreed with Pedro
30
Larrea Paguaga that some reductions to this compensation would be made. Details of thecompensation paid or payable to Pedro Larrea Paguaga are set out on page 48.
There were no increases in Executive Directors’ salaries in 2019 and, save for that implicit inthe rebalancing of elements of the fixed remuneration payable to Marco Levi as compared with theformer CEO, none to date or expected for 2020.
Annual Bonus awards for 2019
The annual bonus objectives for the Executives in 2019 were adjusted EBITDA in relation to33.3% of the award and free cash-flow in relation to 66.7%. Bonuses were also subject to anunderpin requiring measurable improvement in the Group’s health and safety record in 2019, withpotential to reduce the overall award by 20%, if not met, and a further condition related to theCompany’s financial performance or condition, failing which the bonus would be reduced to zero.
The threshold performance target for adjusted EBITDA and the level of improvements onhealth and safety were not met. The Company achieved 122% performance in respect of freecash-flow but did not satisfy the health and safety underpin nor the financial performance condition.As a result and notwithstanding the achievement of the free cash-flow target, the ExecutiveChairman recommended to the Committee that no annual bonus be paid for 2019. The Committeeapproved this recommendation for sign-off by the Board and this outcome was duly approved. Seethe ARR for more on the 2019 annual bonus outturn.
LTIPs in 2019
Awards granted to our Executive Directors in 2017 under the EIP came to the end of theirperformance period on 31 December 2018, the Committee assessed their performance at 35.74%of target and, on conclusion of our closed period in early December 2019, the awards vested andbecame exercisable. To date, the awards to our Executives have not been exercised.
Awards granted under the EIP to Javier Lopez Madrid and to Pedro Larrea Paguaga in March2019 were made at 115% and 100% respectively of salary, discounted by 50% from their ‘normal’target award levels. This exceptional adjustment was made in light of the significant fall in theCompany’s share price in 2018 and 2019. The vesting of these awards is also subject to a cap setat eight times the value at grant of the number of shares awarded, to mitigate the risk of anunjustified gain arising solely from share price appreciation. The performance conditions remainstretching and were unchanged from 2018, save for necessary adjustments to the make-up of thecomparator group. See page 53 of the ARR for more information.
Non-Executives and their remuneration
2019 was a challenging year for the Company and the Board met more frequently thananticipated in its usual annual calendar. Due to these exceptional requirements, the Board metnineteen times in 2019, rather than the seven times normally scheduled. No additional fees werepaid to its Non-Executive Directors for the time and attention in preparing for and attending thesemeetings.
The Committee reviewed the structure of NED fees as part of its overall review of the Policy in2019 and decided not to recommend any adjustment to the level or principles underlying NED fees,which remained unchanged in quantum from 2016. Any increases in amount reflect the fact that aNon-Executive Director has taken on additional responsibilities, as Jose Marıa Alapont did onassuming the roles of Senior Independent Director and Chair of the Corporate GovernanceCommittee in January 2019 and which Mr. Alapont and Greger Hamilton did when they took on aliaison and communication role as ‘Designated Directors’ in connection with a specific strategic
31

project for a brief time in 2019. The value which they added through their contribution andleadership in relation to this project were invaluable to the Company and the Board. The Committeerecommended that, in recognition of their additional duties and the considerable time and effortspent in discharging them, they be paid a fee commensurate with that due to the SeniorIndependent Director which the Board approved. These fees were paid for the period that theyfulfilled these supplementary roles and ceased when the relevant project came to an end and theystood down from those responsibilities.
In late 2019, the Committee undertook its annual review of its terms of reference and workedwith the Corporate Governance Committee and the Board in considering whether responsibility forthe oversight of NED fees should more properly sit with the Corporate Governance Committee tomake recommendations to the Board. While this might be unusual in the U.K. it is more common inthe U.S.A. where the Company is listed. It was decided that this change was appropriate in light ofthe overall governance regime to which the Company is subject by virtue of its listing on theNasdaq Global Select Market. Going forward, the Corporate Governance Committee will review andmake recommendations to the full Board on the amount and type of compensation to be paid tothe Company’s Non-Executive Directors. This change was effected in November 2019. To meet therequirements of U.K. corporate law, this report continues to advise on NED remuneration policy andpractice in the relevant period and the Corporate Governance Committee has therefore reviewedand signed off on any aspect of NED remuneration disclosed in this report since the date itsassumed oversight.
Looking forward to 2020
2019 will have been my final full year as Chairman of the Committee. I will step down when Iretire from the Board at the AGM in June 2020. I was appointed to this position in January 2018and have thoroughly enjoyed my responsibilities. It has been challenging, particularly in light of theperformance of the Company and the markets, and I am deeply grateful to my colleagues, JoseMarıa Alapont and Bruce Crockett, as well as to the rest of the Board and to management, for theirsupport.
We anticipated continued market challenges for our industry and business in early 2020 andthe level of uncertainty has significantly increased as a result of the COVID-19 pandemic. As aresult, we have decided in these exceptional times to delay the determination of the terms of ourannual bonus awards and the level of award and performance conditions for our EIP until economicconditions are clarified. We will release details of the implementation of the annual bonus plan andawards under the EIP once determined.
I would like to thank you, our shareholders, for your support for the Company and throughoutmy tenure. I hope that you will continue to be supportive of the Company in 2020.
Signed on behalf of the Board.
Donald G. Barger, Jr
Chairman of the Compensation Committee
5 June 2020
32

The Policy
The following sections on pages 33 to 46 set out the directors’ remuneration policy that wasapproved at the 2019 Annual General Meeting. The approved Policy can be found in theCompany’s U.K. Annual Report and Accounts for the period ended 31 December 2018 and on theCompany’s website. The Policy is set out below for information only.
The following changes have been made to this section as compared with the same section inthe U.K. Annual Report and Accounts 2018 to reflect application of the Policy in period from1 Janaury 2019 to date:
Following the re-allocation of oversight of Non-Executive Directors’ remuneration to theBoard’s Corporate Governance Committee in late 2019 referred to in the Chairman’s statement onremuneration, that committee makes recommendations to the Board on matters relating toNon-Executive Director remuneration in accordance with the Policy and the Board makes finaldetermination on such matters.
Following Marco Levi’s appointment as CEO on 10 January 2020 and to the Board on15 January 2020, references to the application of the Policy to the CEO have been updatedthroughout to refer to the Policy as applied to Marco Levi. Marco is based at the Company’soperational headquarters in Madrid, Spain and his service contract is accordingly governed bySpanish law. The section below on Operation of the Policy has been updated to reflect the CEO’sterms of employment and to remove references to the terms of employment of Pedro LarreaPaguaga, as former CEO.
Aim of the Policy
The overall aim of the Policy is to provide appropriate incentives that reflect the Company’shigh-performance culture and values to maximise returns for shareholders.
In summary, our aim as regards Executive Directors is to provide remuneration which:
• attracts, retains and motivates high calibre, high performing employees;
• encourages strong performance and engagement, both in the short and the long term, toenable the Company to achieve its strategic objectives;
• link a very significant proportion of pay to performance conditions measured over the shortterm and longer term;
• set fixed pay levels at or around market norms to allow for a greater proportion of totalremuneration opportunity to be in variable pay; and
• create strong alignment between the interests of shareholders and executives through boththe use of equity in variable incentive plans and the setting of shareholding guidelines forExecutive Directors.
There are no material differences in the Policy for Executive Directors compared to that ofsenior management other than in terms of quantum and levels of participation in incentive plansreflecting the higher weighting to variable pay and ability to influence performance outcomes. Forthe wider employee population, the Company aims to provide remuneration structures and levelsthat reflect market norms for the location at which they are based.
Operation of the Policy
Throughout the Policy, reference is made to the authority, powers and discretions vested in theCommittee. It is the Committee’s practice that, in relation to any significant decision in relation to
33

the compensation of the Company’s Executive Directors or the second tier of executivemanagement below them, the Committee makes recommendations to the Board which determinesthe final decision of the Company on such matters.
The following table summarizes the Policy as applied to Executive Director remuneration:
Components of remuneration for Executive Directors
Purpose and link Operation and maximum PerformanceElement to strategy opportunity framework and recovery
Salary . . . . . . . . . . . . . . A fixed salary Reviewed annually, taking Not applicable.commensurate with the account of Groupindividual’s role, performance, individualresponsibilities and performance, changes inexperience, having regard responsibility, levels ofto broader market rates. increase for the broader
employee population andmarket salary levels.
Pension and retirementbenefits . . . . . . . . . . . Attraction and retention of Executive Directors may Not applicable.
top talent; providing be paid a cash allowancemechanism for the in lieu of pension.accumulation of retirement
The maximum cashbenefits.allowance is 20% of basesalary. This includescontributions to the U.S.tax-qualified definedcontribution 401(k) plan.
Benefits . . . . . . . . . . . . Attraction and retention of Benefits may include but Not applicable.top talent. are not limited to medical
cover, life assurance andincome protectioninsurance.
Relocation allowancesmay take into account ahousing allowance, schoolfees, adviser fees forassistance with tax affairsand an expatriateallowance to coveradditional expenditureincurred as a result of therelocation. Payment ofsuch relocationallowances will bereviewed by theCommittee on an annualbasis
34

Purpose and link Operation and maximum PerformanceElement to strategy opportunity framework and recovery
Benefits may include taxequalization provisionsapplicable if an Executivemoves betweenjurisdictions with differingtax regimes at theCompany’s request. If theExecutive moves to anarea of higher taxation,the Company may agreeto make an annual orother regular payment incash to compensate himor her for any additionaltax burden. Where theExecutive moves to ajurisdiction where his orher effective tax burden islower than that to whichhe or she was subjectprior to such move, theExecutive’s compensationmay be commensuratelyreduced to ensure that hisor her net pay remainsunaffected.
Benefits will be providedas the Committee deemsnecessary including totake into accountperquisites or benefitsreceived from a prioremployer or as iscustomary in the countryin which an executiveresides or is relocatedfrom.
Benefits provided by theCompany are subject tomarket rates and thereforethere is no prescribedmonetary maximum. TheCompany and theCommittee keep the costof the benefits underreview.
The Company provides allExecutive Directors withdirectors’ and officers’liability insurance and willprovide an indemnity tothe fullest extent permittedby the Companies Act.
35

Purpose and link Operation and maximum PerformanceElement to strategy opportunity framework and recovery
Annual and otherbonuses . . . . . . . . . . Short-term performance- The annual bonus plan The Committee will select
based incentive to reward and all payments and the most appropriateachievement of annual awards under it are at the performance measures forperformance objectives. discretion of the the annual bonus for each
Committee. Subject as performance period andaforesaid, the Committee will set appropriatelywill determine an demanding targets.Executive Director’s actual
Normally any bonusbonus amount, subject toearned in excess of thethe achievement oftarget amount will bequantitative and qualitativedeferred for three yearsperformance criteria.into shares in the
At least two-thirds of the Company. An Executivebonus will be based on Director may be grantedfinancial metrics with any an additional long-termbalance based on incentive award asnon-financial metrics. described below of equal
value (at maximum) to theThe maximum annual amount of annual bonusbonus opportunity that deferred.may be awarded to anExecutive Director is Recovery and recoupmentnormally 200% of salary. If will apply to all bonusthe Committee provides awards for misstatement,higher annual bonus error or gross misconduct.opportunities in any yearits rationale will be clearlyexplained in the AnnualReport on Remunerationfor the relevant year. Inthese and otherexceptional circumstancesthe limit will be 500% ofsalary.
No more than 25% of themaximum annual bonuspayable for eachperformance condition willbe payable for thresholdperformance.
In addition or in place ofan annual bonus, theCompany may pay aretention bonus where itconsiders it necessary toretain key Executives insituations where therelevant Executive wouldotherwise leave theCompany and his or herretention is critical to theCompany’s performanceand/or the achievement ofstrategic goals or keyprojects. The grant, termsand payment of anyretention bonus are at thediscretion of theCommittee.
36
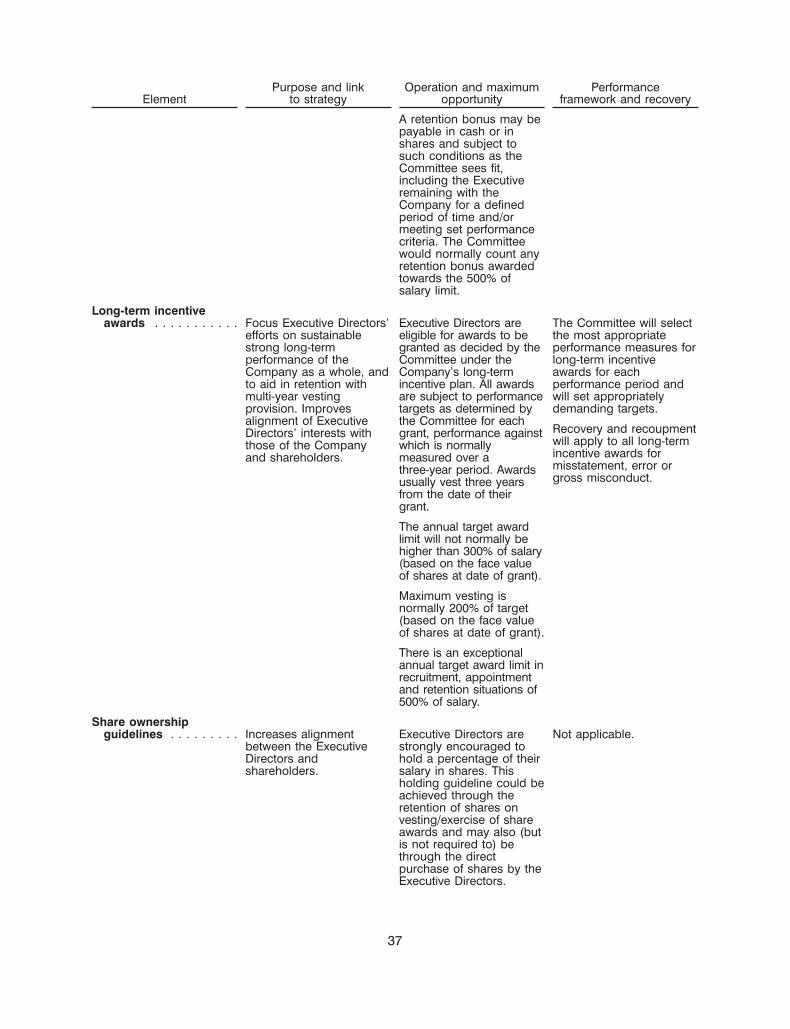
Purpose and link Operation and maximum PerformanceElement to strategy opportunity framework and recovery
A retention bonus may bepayable in cash or inshares and subject tosuch conditions as theCommittee sees fit,including the Executiveremaining with theCompany for a definedperiod of time and/ormeeting set performancecriteria. The Committeewould normally count anyretention bonus awardedtowards the 500% ofsalary limit.
Long-term incentiveawards . . . . . . . . . . . Focus Executive Directors’ Executive Directors are The Committee will select
efforts on sustainable eligible for awards to be the most appropriatestrong long-term granted as decided by the performance measures forperformance of the Committee under the long-term incentiveCompany as a whole, and Company’s long-term awards for eachto aid in retention with incentive plan. All awards performance period andmulti-year vesting are subject to performance will set appropriatelyprovision. Improves targets as determined by demanding targets.alignment of Executive the Committee for each
Recovery and recoupmentDirectors’ interests with grant, performance againstwill apply to all long-termthose of the Company which is normallyincentive awards forand shareholders. measured over amisstatement, error orthree-year period. Awardsgross misconduct.usually vest three years
from the date of theirgrant.
The annual target awardlimit will not normally behigher than 300% of salary(based on the face valueof shares at date of grant).
Maximum vesting isnormally 200% of target(based on the face valueof shares at date of grant).
There is an exceptionalannual target award limit inrecruitment, appointmentand retention situations of500% of salary.
Share ownershipguidelines . . . . . . . . . Increases alignment Executive Directors are Not applicable.
between the Executive strongly encouraged toDirectors and hold a percentage of theirshareholders. salary in shares. This
holding guideline could beachieved through theretention of shares onvesting/exercise of shareawards and may also (butis not required to) bethrough the directpurchase of shares by theExecutive Directors.
37

Performance Criteria and Discretions
Selection of Criteria
The Committee annually assesses at the beginning of the relevant performance period whichcorporate performance measures, or combination and weighting of performance measures, aremost appropriate for both annual bonus and long-term incentive awards to reflect the Company’sstrategic initiatives for the performance period. The Committee has the discretion to change theperformance measures for awards granted in future years based upon the strategic plans of theCompany. The Committee sets demanding targets for variable pay in the context of the Company’strading environment and strategic objectives and taking into account the Company’s internalfinancial planning and market forecasts. Any non-financial goals will be well defined andmeasurable.
Discretions retained by the Committee in operating its incentive plans
The Committee operates the Group’s various plans according to their respective rules. Inadministering these plans, the Committee may apply certain operational discretions. These includethe following:
• determine the extent of vesting based on the assessment of performance, includingexercising its discretion to reduce payout as and where appropriate;
• determine ‘‘good leaver’’ status (as described below) and where relevant extent of vesting;
• where relevant determine the extent of vesting in the case of share-based plans in the eventof a change of control in accordance with the rules of the various plans; and
• make the appropriate adjustments required in certain circumstances (e.g. rights issues,corporate restructuring events, variation of capital and special dividends).
The Committee, acting fairly and reasonably, and after consulting plan participants, may adjustthe targets and/or set different measures and alter weightings for the variable pay awards alreadygranted (in a way that the alterations are intended to create an equivalent outcome for planparticipants) only if (i) an unexpected event (whether a corporate or outside event) occurs whichcauses the Committee to reasonably consider that the performance conditions would not achievetheir original purpose without alteration and (ii) the varied conditions are materially no more or lessdifficult to satisfy than the original conditions. Any changes and the rationale for those changes willbe set out clearly in the Annual Report on Remuneration in respect of the year in which they aremade.
Remuneration scenarios for the Executive Directors
The charts below show the level of remuneration potentially payable to each of Javier LopezMadrid as Executive Chairman and Marco Levi as CEO under different performance scenarios forthe 2020 financial year.
38

2JUN202021203497
2JUN202021203338
In respect of the remuneration of the Executive Chairman:
In respect of the remuneration of the CEO:
39

Assumptions
1. Fixed pay comprises base salary for 2020, benefits and a pension contribution of 20% of basesalary for each of Javier Lopez Madrid and Marco Levi. Benefits comprise private health,income protection and life insurance arrangements at an estimated level of 5.02% of basesalary for Javier Lopez Madrid and 4.06% of base salary for Marco Levi salary (excluding theone-off contribution towards relocation costs incurred in 2019) and an expatriate allowance of20% of base salary in the case of Javier Lopez Madrid.
2. On-target performance comprises fixed pay plus annual bonus of 100% of base salary andlong-term incentives of 115% of base salary for the Executive Chairman and fixed pay plusannual bonus of 75% of base salary and long-term incentives of 100% of base salary for theCEO. Annual bonus awards and long-term incentive award levels have not yet beendetermined for 2020 and so are illustrated at the levels awarded in 2019.
3. Maximum performance comprises fixed pay plus annual bonus of 200% of base salary for theExecutive Chairman and 100% of base salary for the CEO and long-term incentives of 200% oftarget for each. Annual bonus awards and long-term inventive award levels have not yet beendetermined for 2020 and are illustrated at the levels awarded in 2019.
4. Maximum performance plus share price growth comprises the maximum performance scenariodescribed above plus an assumed 50% share price growth over the performance period of theLTIP.
5. As described in the Policy, an additional long-term incentive award may be granted if part ofthe annual bonus is deferred, with the maximum value of such award equal to the amount ofbonus deferred. As at 31 December 2019 no such awards have been made to the ExecutiveDirectors and none is to be made in respect of 2019.
6. The exchange rate used in these charts and throughout this report, save where statedotherwise, is the Group’s average GBP: USD exchange rate for the year to 31 December 2019of GBP1=USD1.2768.
Approach to Recruitment Remuneration
The Committee expects any new Executive Directors to be engaged on terms that areconsistent with the Policy as set out above.
The Committee recognises that it cannot always predict accurately the circumstances in whichany new directors may be recruited. The Committee may determine that it is in the interests of theCompany and shareholders to secure the services of a particular individual which may require theCommittee to take account of the terms of that individual’s existing employment and/or theirpersonal circumstances. Examples of circumstances in which the Committee expects it might needto do this are:
• where an existing employee is promoted to the Board, in which case the Company willhonour all existing contractual commitments including any outstanding annual bonus orlong-term incentive awards or pension entitlements and will provide other benefits consistentwith those provided to senior leaders in that employee’s home country or place of residenceprior to appointment to the Board;
• where an individual is relocating in order to take up the role, in which case the Companymay provide certain one-off benefits in addition to benefits set out in the policy table suchas reasonable relocation expenses, assistance with visa applications or other immigrationissues and ongoing arrangements such as flights home and cost of education; and
40
• where an individual would be forfeiting fixed or valuable variable remuneration in order tojoin the Company, in which case the Committee may award appropriate additionalcompensation in addition to the limit set out in the policy table. The Committee would lookto replicate the arrangements being forfeited as closely as possibly taking into account thenature of the remuneration, performance conditions, attributed expected value and the timeover which any variable pay would have vested or been paid.
In making any decision on any aspect of the remuneration package for a new recruit, theCommittee would balance shareholder expectations, current best practice and the requirements ofany new recruit and would strive not to pay more than is necessary to achieve the recruitment. TheCommittee would give full details of the terms of the package of any new recruit in the nextremuneration report. Award levels under the Company’s variable incentive plans would not exceedthose set out in the policy table, but their proportions can be altered for the first three years ofemployment.
Executive Directors’ Service Contracts and Policy on Cessation
In order to motivate and retain the Executive Directors and other senior executives, most ofwhose backgrounds are in the United States and Europe, the Committee has taken account ofmarket practices in those countries in formulating the Policy, including (a) determining the treatmentof annual and retention bonuses and long-term incentive awards in case of termination of theiremployment by the Company without cause, (b) referencing past annual bonuses in calculating theamount of payment in lieu of notice, (c) determining the extent of vesting of long-term incentiveawards in the event of a takeover or change of control and (d) determining that all long-termincentive awards granted to an executive in any financial year will be subject to achievement ofperformance targets.
Service contracts
Subject to the Approach to Recruitment Remuneration above, all Executive Directors haverolling service contracts for an indefinite term but a fixed period of notice of termination whichwould normally be 12 months. With respect to newly appointed directors, the Committee may, if itconsiders it necessary, agree a notice period in excess of 12 months (but not exceeding24 months), provided it reduces to 12 months within a specified transition period of not exceeding36 months. The service contract for Javier Lopez Madrid is in accordance with this policy and hisfixed period of notice of termination is 12 months. See below for more on Marco Levi’s servicecontract.
The Executive Chairman’s service contract may be terminated without notice and withoutfurther payment or compensation, except for sums accrued to the date of termination, for cause. Inother circumstances, the Company may terminate his employment with immediate effect and makea payment in lieu of notice in the amount equivalent to the aggregate of (i) base salary, (ii) theaverage of annual bonuses in the last three years prior to termination, (iii) pension allowance plus(iv) cost of benefits, for the notice period (or if a notice has been served, for the unserved noticeperiod). He would be entitled to an equivalent payment in the event of his resignation for goodreason (as defined in the service contract). Similar provisions may apply in the event that he leavesfollowing a change of control of the Company, but no additional entitlements would be expected tobe set out in the Executive Director’s service contract beyond those described above. An ExecutiveDirector may also be entitled to certain amounts with respect to annual or retention bonuses andlong-term incentive awards, as described below.
Marco Levi is employed under a service contract made under Spanish law (and in particular,the provisions of the Royal Decree 1382/1985 1st of August regarding senior management (‘‘Alta
41

Direccion’’)). Spanish employment law imposes a number of mandatory requirements, including inrelation to termination. The CEO’s service contract may be terminated without notice and withoutfurther payment or compensation, except for sums accrued to the date of termination, for cause (asdefined in the service contract by reference to Spanish statutory law). If the dismissal is declarednull or unfair by a definitive court or labour tribunal ruling, the CEO is entitled to receive aseverance payment equal to six (6) months’ salary plus a payment equal to the Company’s costs insuch six month period corresponding to the insurance and pension benefits in force at the time oftermination. This severance compensation includes and absorbs the compensation and anystatutory notice to which the Executive may otherwise be entitled by operation of law. In the eventthat the CEO is dismissed without cause, the CEO will similarly be entitled to receive a severancepayment equal to 6 months’ salary plus an amount equal to the costs the Company would haveincurred in providing pension, health insurance, income protection and life assurance benefits forthe period of notice, in lieu of any statutory notice to which the CEO would otherwise be entitled. Inaddition, in accordance with Spanish law and as contemplated in the section Generally below, theCEO has enhanced post termination restrictive covenants. Under these provisions, the Companymay be required to make an additional payment to ensure the enforceability of certainpost-employment restrictions on competition for a period of six months from termination on termswhich are customary in senior management employment relationships. The amount payable is 30%of the CEO’s salary at the date of termination and is deemed discharged at the rate of 15% ofsalary per annum throughout the employment relationship, such that on termination no further sumswill be payable if an amount equal to 30% of salary has already been paid. The total amountpayable on termination of the CEO’s service contract other than for cause is therefore less than12 months’ salary and benefits.
Where an Executive Director’s service contract is terminated for ‘‘cause’’ or ‘‘good reason’’ asdefined in the relevant director’s service contract, the provisions outlined below in relation to annualbonus awards and long-term incentive awards as described below will apply. Executive Directors’service contracts (or a memorandum of the terms where the contract is unwritten) are available forinspection at the Group’s office at 2nd Floor West, Lansdowne House, 57 Berkeley Square, London,W1J 6ER during normal business hours and at the Annual General Meeting.
Generally
As circumstances may require, the Committee may approve compensation payments inconsideration of statutory entitlements, for a release of claims, enhanced post-termination restrictivecovenants (for example, as outlined above) or transitional assistance, such as outplacementservices and payment of legal fees in connection with termination, the costs of short termaccommodation or leasing arrangements, home relocation expenses including tax related expensesand other ancillary payments thereto.
Annual bonus awards (including retention awards)
In the event that an Executive Director’s employment is terminated without cause, byresignation by the Executive Director for good reason, or by reason of death, injury, disability or hisemploying company or the business for which he works being sold out of the Group, the Companywill pay an annual bonus amount in respect of the financial year in which termination occurssubject to performance conditions being met at the end of the period and with pro-rating of theaward determined on the basis of the period of time served in employment during the normalvesting period but with the Committee retaining the discretion in exceptional circumstances toincrease the level of vesting within the maximum annual bonus amount as determined by theperformance conditions. The Committee may, if it considers it appropriate in exceptionalcircumstances, measure performance to the date of cessation. In other circumstances, payment will
42

be at the Committee’s discretion. The Committee will consider the period of the year worked andthe performance of the Executive Director during that period when considering how to exercise itsdiscretion.
The terms of any retention bonus agreed to be paid to an Executive Director may provide forsuch bonus to be payable on that Executive Director’s employment being terminated without cause,by resignation by the Executive Director for good reason, or by reason of death, injury, disability orhis employing company or the business for which he works being sold out of the Group. In anysuch case, the retention bonus will become payable in such circumstances.
Long-term incentive awards
As a general rule, any unvested long-term incentive award (except deferred bonus awards seebelow) will lapse upon an Executive Director ceasing to be an employee or director in the case ofvoluntary resignation or dismissal for cause. However, if the cessation is without cause, byresignation by the Executive Director for good reason, or because of his death, injury, disability orhis employing company or the business for which he works being sold out of the Group or in othercircumstances at the discretion of the Committee, then the award will normally vest in full on thedate when it would have ordinarily vested subject to the performance conditions being met. Wherean award vests at the discretion of the Committee that award may be pro-rated taking into accountthe period of time served in employment during the normal vesting period of the award. TheCommittee can for any cessation measure performance up to the date of cessation and permitawards to vest early.
Deferred bonus awards vest in full upon cessation, other than in case of voluntary resignationby an Executive Director without good reason or dismissal for cause. Vested but unexercisedawards held on cessation will remain capable of exercise for a limited period save in the case ofdismissal for cause.
In the event of a takeover all awards will vest early to the extent that the performanceconditions are determined as satisfied at that time on such basis as the Committee considersappropriate.
External appointments
Executive Directors may retain fees paid for external director appointments. Theseappointments are subject to disclosure to and approval by the Board and must be compatible withtheir duties as Executive Directors.
Matters taken into consideration in determining policy and differences in the remunerationpolicy of the Executive Directors and employees
It is not the Committee’s practice to consult with employees on matters relating to executivepay. However, the Committee will consider pay structures, practices and principles across theGroup on a regular basis and take these into account in any review of the Executive Directors’current Policy or implementation thereof.
The Committee will consider feedback from shareholders and take into account the results ofboth advisory and binding votes concerning executive pay at the Annual General Meeting as wellas ensuring it engages with shareholders on executive pay matters. The 2019 Policy has beenformulated taking into account the Company’s understanding of current shareholder views on theCompany’s remuneration policy and practices.
43
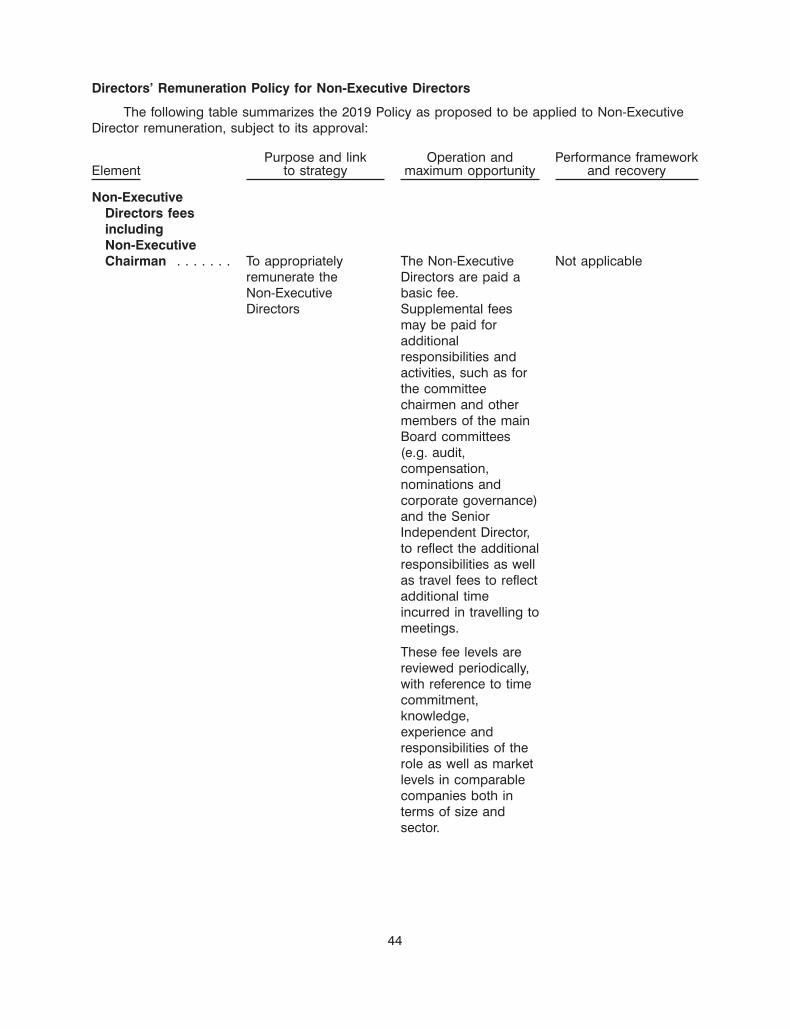
Directors’ Remuneration Policy for Non-Executive Directors
The following table summarizes the 2019 Policy as proposed to be applied to Non-ExecutiveDirector remuneration, subject to its approval:
Purpose and link Operation and Performance frameworkElement to strategy maximum opportunity and recovery
Non-ExecutiveDirectors feesincludingNon-ExecutiveChairman . . . . . . . To appropriately The Non-Executive Not applicable
remunerate the Directors are paid aNon-Executive basic fee.Directors Supplemental fees
may be paid foradditionalresponsibilities andactivities, such as forthe committeechairmen and othermembers of the mainBoard committees(e.g. audit,compensation,nominations andcorporate governance)and the SeniorIndependent Director,to reflect the additionalresponsibilities as wellas travel fees to reflectadditional timeincurred in travelling tomeetings.
These fee levels arereviewed periodically,with reference to timecommitment,knowledge,experience andresponsibilities of therole as well as marketlevels in comparablecompanies both interms of size andsector.
44

Purpose and link Operation and Performance frameworkElement to strategy maximum opportunity and recovery
The Company doesnot currently have aNon-ExecutiveChairman. If one wereappointed his feewould be set at a levelwith reference to timecommitment,knowledge,experience andresponsibilities of therole as well as marketlevels in comparablecompanies both interms of size andsector.
There is no maximumfee level or prescribedannual increase.
Payment of expensesand benefits . . . . . To support the Reasonable expenses Not applicable
Non-Executive incurred by theDirectors in the Non-Executivefulfilment of their Directors in carryingduties out their duties may
be reimbursed by theCompany includingany personal taxpayable by theNon-ExecutiveDirective as a result ofreimbursement ofthose expenses. TheCompany may alsopay an allowance inlieu of expenses andmay arrange and payfor the provision ofadvice or assistance inrelation to personaltaxes for which theNon-Executive Directormay be liable inconnection with his orher appointment to theBoard, if it deems thisappropriate.
45

Purpose and link Operation and Performance frameworkElement to strategy maximum opportunity and recovery
The CompanyprovidesNon-ExecutiveDirectors withdirectors’ and officers’liability insurance andan indemnity to thefullest extent permittedby the Companies Act.
Legacy Arrangements with Certain Non-Executive Directors
Prior to the Business Combination, in keeping with many other NASDAQ listed companies,Globe granted restricted stock units and share appreciation rights to its Non-Executive directors.Outstanding awards as at 31 December 2019 held by the Non-Executive Directors, who werepreviously Globe’s Non-Executive directors, are set out in the ARR.
It is noted that those Non-Executive Directors with restricted stock units and shareappreciation rights may be regarded as not being independent by U.K. based proxy votingagencies although the Board considers them to be fully independent. It is a provision of this Policythat the Company may accelerate the vesting of or repurchase of these awards based on anindependent valuation, if it deems it to be appropriate.
Letters of Appointment with Non-Executive Directors
The Company does not enter into service contracts with its Non-Executive Directors, rather theCompany enters into letters of appointment for a rolling period of 12 months with each annualrenewal being subject to re-election at each annual general meeting of the Company. Nocompensation for loss of office is payable in the event a Non-Executive Director is not re-elected.The Company may request that Non-Executive Directors resign with immediate effect in certaincircumstances (including material breach of their obligations) in which case their appointmentwould terminate without compensation to the Non-Executive Director for such termination but withaccrued fees and expenses payable up to the date of termination.
Appointment of Non-Executive Directors
For the appointment of a Non-Executive Chairman or other Non-Executive Directors, the feearrangement would be in accordance with the approved Directors’ Remuneration Policy in place atthat time.
Minor amendments
The Committee may make minor changes to the Policy, which do not have a materialadvantage or disadvantage overall to directors, to aid in its operation or implementation (includingto take account of any change in legislative or regulatory requirements applicable to the Company)without seeking shareholder approval for a revised version of the Policy.
46

Annual Report on Remuneration
Implementation of the Directors’ Remuneration Policy for the year ending 31 December 2020
This section sets out how the Committee intends to implement the Policy for the year ending31 December 2020.
Base salary
Javier Lopez Madrid was appointed as Executive Chairman with effect from 31 December2016. Javier Lopez Madrid’s salary was reviewed on his appointment and remains unchanged at£555,000 ($708,624) per annum.
Marco Levi was appointed as Chief Executive Officer on 10 January 2020 and to the Board ofDirectors on 15 January 2020. Marco Levi’s base salary as CEO is e600,000 ($671,760) per annum.
Neither Javier Lopez Madrid nor Marco Levi receive any additional fees or compensation fortheir respective roles on the Board.
Pension and benefits
In accordance with the Policy, both Executive Directors receive a pension contribution at therate of 20% of base salary, payable as a cash allowance, and health insurance, income protectionand life assurance benefits to the value of approximately 5.02% of salary for the ExecutiveChairman and 4.06% for the CEO. The Executive Chairman also receives an expatriate benefitsallowance equal to 20% of base salary. The exceptional additional expatriate allowance of a further20% of salary awarded to the Executive Chairman for a period of up to three years to 31 December2019 ceased to be paid from 1 January 2019. Expatriate allowances are reviewed by the Committeeon an annual basis. In the first year of his employment only, the CEO will receive a furtherallowance of up to e30,000 ($33,588) in respect of temporary housing and relocation costs.
The Company provides directors’ and officers’ liability insurance and an indemnity to thefullest extent permitted by the Companies Act.
Variable Remuneration
In light of the current level of uncertainty resulting from the COVID-19 pandemic referred to inthe Chairman’s letter on page 7 and, in the case of the Company’s long term incentive awards, theeffect which the pandemic has had on share prices, the Committee has decided to delay theimplementation of its variable compensation plans for 2020 until such time as it is feasible to setrelevant and stretching targets, appropriately aligned to the Company’s strategic priorities and keyfinancial performance indicators for 2020. As at the date of this report, the objectives for the AnnualBonus plan for 2020 and the performance conditions for any grant under the Company’s EquityIncentive Plan in 2020 remain to be determined.
Annual bonuses
In light of the uncertainties resulting from the COVID-19 pandemic, the bonus opportunity andperformance measures for the annual bonus in 2020 will be determined later in the year, when weexpect to have more clarity
Long-term incentives
In light of the uncertainties resulting from the COVID-19 pandemic and its impact on shareprices in recent months, the level of long-term incentive award as a percentage of base salary and
47

the performance conditions to be applied to awards in 2020 will be determined later in the yearwhen we expect to have more clarity.
Payments on Termination of Executive Director’s Employment
Pedro Larrea Paguaga left the Company on 10 January 2020 and resigned from theCompany’s Board on the same day. In accordance with the Policy and his service agreement withthe Company dated 28 June 2017, Pedro Larrea Paguaga has received or will receive during 2020a payment in lieu of notice (PILON) totaling £843,375 (before deductions for tax and social securitycontributions) payable:
(a) as to £506,085 within 2 working days of 10 January 2020; and
(b) as to £337,390 within 10 working days after the Company’s full year 2019 financialstatements have been concluded and audited and its Annual Report on Form 20-F hasbeen duly filed with the U.S. Securities and Exchange Commission.
The PILON comprises:
• Salary for the 12 months’ notice period in the Service Agreement (Notice Period) of£475,000;
• Contractual entitlement to a sum equal to the average of the annual bonus amounts paid toMr Larrea Paguaga during the last three completed financial years totalling £207,802
• Pension allowance for the Notice Period of £95,000
• The approximate cost to the Company of contractual private health and life insurance for theNotice Period of £20,000
• £45,673 in accrued holiday pay.
As a term of the settlement reached with Mr. Larrea Paguaga and as is customary in the U.K.to protect the interests of the Company, the Company contributed £25,000 excluding VAT in respectof the costs of Mr. Larrea Paguaga’s solicitor on advising on his termination of employment and hasagreed to assist with the reasonable costs of the provision of UK and Spanish tax advice toMr. Larrea Paguaga for tax years falling in financial years ending 31 December 2018 and 2019,subject to that advice being provided by the Company’s usual tax adviser. It was agreed that noannual bonus for 2019 and no retention bonus would be payable to Mr. Larrea Paguaga,notwithstanding any prior commitment of the Company to do so.
In accordance with the rules of the Equity Incentive Plan, Mr Larrea Paguaga will be treated asa good leaver in respect of his outstanding share awards. These are detailed on page 56.
Non-Executive Director share ownership guidelines
In 2018, the Non-Executive Directors reviewed the guidelines under which they had voluntarilyagreed to apply on a cumulative basis at least a quarter of their normal annual gross fees toacquire shares under arrangements designed to ensure that shares can be purchased on a regularbasis over a period of eight years and agreed several points of clarification, including that:
• Where more or fewer shares are acquired in any year, the value of shares to be acquired insubsequent years may be reduced or increased respectively such that on a cumulativebasis the 25% test is satisfied;
• Each Non-Executive Director agrees to retain his or her shares until the earlier of achievinga holding equal to twice his or her annual base fees being achieved or that director leavingthe Board;
48
• Where a director holds outstanding and exercisable share-based or phantom restrictedstock awards, the shares or notional shares under award are to be taken into account indetermining the relevant director’s holding and may be exercised and disposed of at anytime (with consequent effect on the director’s holding).
In light of the fall in the share price in 2018 and 2019 and the impact on the Company’s shareprice of the uncertainties arising from the COVID-19 pandemic in early 2020, a further review of theNon-Executive Director share ownership guidelines may be undertaken in 2020.
The holdings for Executive and Non-Executive Directors as at 31 December 2019 are set outbelow.
Fees for the Non-Executive Directors
The fee structure and levels were set following the Business Combination. Fees are set andpayable in Pounds sterling and are reviewed — but not necessarily increased — annually, withchanges normally effective from 1 January in each year. The fees for 2020 are the same as thosefor 2019 and have not changed since 2016:
Non-Executive Director base fee . . . . . . . . . . . . . . . . . . . . . . . . . . . . £70,000 ($89,376)Senior Independent Director . . . . . . . . . . . . . . . . . . . . . . . . . . . . . . . £35,000 ($44,688)Member of Audit Committee . . . . . . . . . . . . . . . . . . . . . . . . . . . . . . . £17,500 ($22,344)Member of Compensation Committee . . . . . . . . . . . . . . . . . . . . . . . . £15,500 ($19,790)Member of Corporate Governance Committee . . . . . . . . . . . . . . . . . . £12,000 ($15,322)Member of Nominations Committee . . . . . . . . . . . . . . . . . . . . . . . . . . £1,500 ($1,915 per
meeting, subject to anannual cap of £10,000($12,768))(1)
Committee Chairman . . . . . . . . . . . . . . . . . . . . . . . . . . . . . . . . . . . . Two times membership feeTravel fee (per meeting)Intercontinental travel . . . . . . . . . . . . . . . . . . . . . . . . . . . . . . . . . . . . £3,500 ($4,469)Continental travel . . . . . . . . . . . . . . . . . . . . . . . . . . . . . . . . . . . . . . . £1,500 ($1,915)
Notes:(1) No fees are payable to the Chair of the Nominations Committee while the individual in that role is also an Executive
Director
49
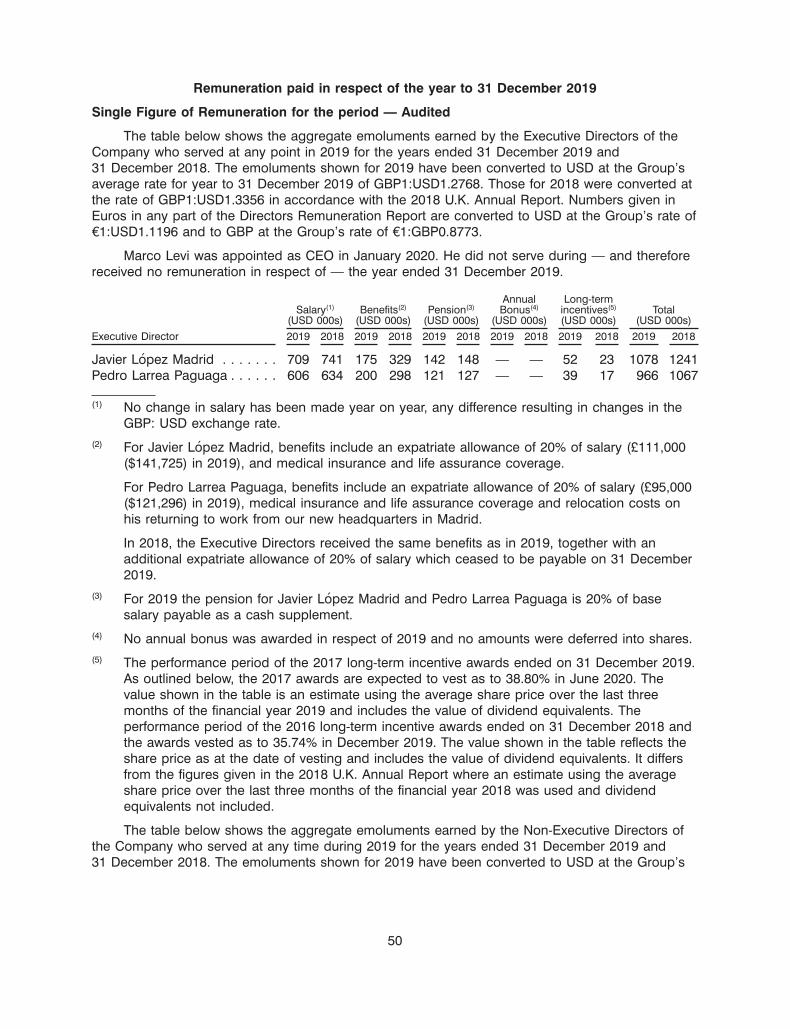
Remuneration paid in respect of the year to 31 December 2019
Single Figure of Remuneration for the period — Audited
The table below shows the aggregate emoluments earned by the Executive Directors of theCompany who served at any point in 2019 for the years ended 31 December 2019 and31 December 2018. The emoluments shown for 2019 have been converted to USD at the Group’saverage rate for year to 31 December 2019 of GBP1:USD1.2768. Those for 2018 were converted atthe rate of GBP1:USD1.3356 in accordance with the 2018 U.K. Annual Report. Numbers given inEuros in any part of the Directors Remuneration Report are converted to USD at the Group’s rate ofe1:USD1.1196 and to GBP at the Group’s rate of e1:GBP0.8773.
Marco Levi was appointed as CEO in January 2020. He did not serve during — and thereforereceived no remuneration in respect of — the year ended 31 December 2019.
Annual Long-termSalary(1) Benefits(2) Pension(3) Bonus(4) incentives(5) Total
(USD 000s) (USD 000s) (USD 000s) (USD 000s) (USD 000s) (USD 000s)
Executive Director 2019 2018 2019 2018 2019 2018 2019 2018 2019 2018 2019 2018
Javier Lopez Madrid . . . . . . . 709 741 175 329 142 148 — — 52 23 1078 1241Pedro Larrea Paguaga . . . . . . 606 634 200 298 121 127 — — 39 17 966 1067
(1) No change in salary has been made year on year, any difference resulting in changes in theGBP: USD exchange rate.
(2) For Javier Lopez Madrid, benefits include an expatriate allowance of 20% of salary (£111,000($141,725) in 2019), and medical insurance and life assurance coverage.
For Pedro Larrea Paguaga, benefits include an expatriate allowance of 20% of salary (£95,000($121,296) in 2019), medical insurance and life assurance coverage and relocation costs onhis returning to work from our new headquarters in Madrid.
In 2018, the Executive Directors received the same benefits as in 2019, together with anadditional expatriate allowance of 20% of salary which ceased to be payable on 31 December2019.
(3) For 2019 the pension for Javier Lopez Madrid and Pedro Larrea Paguaga is 20% of basesalary payable as a cash supplement.
(4) No annual bonus was awarded in respect of 2019 and no amounts were deferred into shares.(5) The performance period of the 2017 long-term incentive awards ended on 31 December 2019.
As outlined below, the 2017 awards are expected to vest as to 38.80% in June 2020. Thevalue shown in the table is an estimate using the average share price over the last threemonths of the financial year 2019 and includes the value of dividend equivalents. Theperformance period of the 2016 long-term incentive awards ended on 31 December 2018 andthe awards vested as to 35.74% in December 2019. The value shown in the table reflects theshare price as at the date of vesting and includes the value of dividend equivalents. It differsfrom the figures given in the 2018 U.K. Annual Report where an estimate using the averageshare price over the last three months of the financial year 2018 was used and dividendequivalents not included.
The table below shows the aggregate emoluments earned by the Non-Executive Directors ofthe Company who served at any time during 2019 for the years ended 31 December 2019 and31 December 2018. The emoluments shown for 2019 have been converted to USD at the Group’s
50
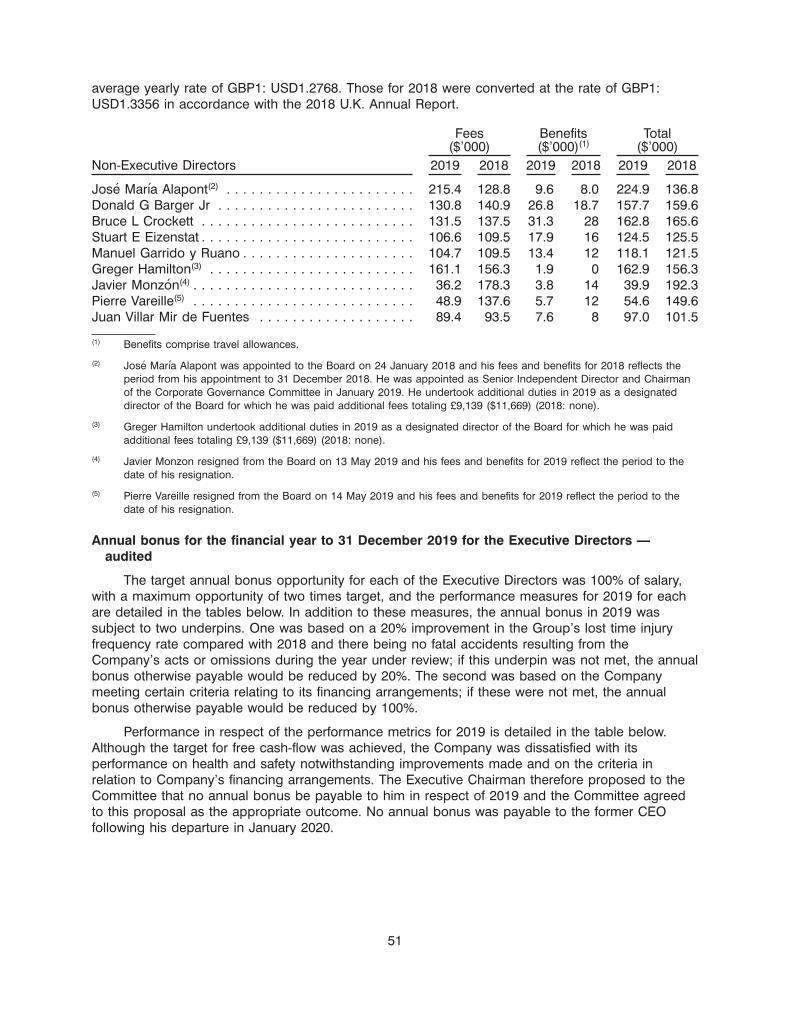
average yearly rate of GBP1: USD1.2768. Those for 2018 were converted at the rate of GBP1:USD1.3356 in accordance with the 2018 U.K. Annual Report.
Fees Benefits Total($’000) ($’000)(1) ($’000)
Non-Executive Directors 2019 2018 2019 2018 2019 2018
Jose Marıa Alapont(2) . . . . . . . . . . . . . . . . . . . . . . . 215.4 128.8 9.6 8.0 224.9 136.8Donald G Barger Jr . . . . . . . . . . . . . . . . . . . . . . . . 130.8 140.9 26.8 18.7 157.7 159.6Bruce L Crockett . . . . . . . . . . . . . . . . . . . . . . . . . . 131.5 137.5 31.3 28 162.8 165.6Stuart E Eizenstat . . . . . . . . . . . . . . . . . . . . . . . . . . 106.6 109.5 17.9 16 124.5 125.5Manuel Garrido y Ruano . . . . . . . . . . . . . . . . . . . . . 104.7 109.5 13.4 12 118.1 121.5Greger Hamilton(3) . . . . . . . . . . . . . . . . . . . . . . . . . 161.1 156.3 1.9 0 162.9 156.3Javier Monzon(4) . . . . . . . . . . . . . . . . . . . . . . . . . . . 36.2 178.3 3.8 14 39.9 192.3Pierre Vareille(5) . . . . . . . . . . . . . . . . . . . . . . . . . . . 48.9 137.6 5.7 12 54.6 149.6Juan Villar Mir de Fuentes . . . . . . . . . . . . . . . . . . . 89.4 93.5 7.6 8 97.0 101.5
(1) Benefits comprise travel allowances.
(2) Jose Marıa Alapont was appointed to the Board on 24 January 2018 and his fees and benefits for 2018 reflects theperiod from his appointment to 31 December 2018. He was appointed as Senior Independent Director and Chairmanof the Corporate Governance Committee in January 2019. He undertook additional duties in 2019 as a designateddirector of the Board for which he was paid additional fees totaling £9,139 ($11,669) (2018: none).
(3) Greger Hamilton undertook additional duties in 2019 as a designated director of the Board for which he was paidadditional fees totaling £9,139 ($11,669) (2018: none).
(4) Javier Monzon resigned from the Board on 13 May 2019 and his fees and benefits for 2019 reflect the period to thedate of his resignation.
(5) Pierre Vareille resigned from the Board on 14 May 2019 and his fees and benefits for 2019 reflect the period to thedate of his resignation.
Annual bonus for the financial year to 31 December 2019 for the Executive Directors —audited
The target annual bonus opportunity for each of the Executive Directors was 100% of salary,with a maximum opportunity of two times target, and the performance measures for 2019 for eachare detailed in the tables below. In addition to these measures, the annual bonus in 2019 wassubject to two underpins. One was based on a 20% improvement in the Group’s lost time injuryfrequency rate compared with 2018 and there being no fatal accidents resulting from theCompany’s acts or omissions during the year under review; if this underpin was not met, the annualbonus otherwise payable would be reduced by 20%. The second was based on the Companymeeting certain criteria relating to its financing arrangements; if these were not met, the annualbonus otherwise payable would be reduced by 100%.
Performance in respect of the performance metrics for 2019 is detailed in the table below.Although the target for free cash-flow was achieved, the Company was dissatisfied with itsperformance on health and safety notwithstanding improvements made and on the criteria inrelation to Company’s financing arrangements. The Executive Chairman therefore proposed to theCommittee that no annual bonus be payable to him in respect of 2019 and the Committee agreedto this proposal as the appropriate outcome. No annual bonus was payable to the former CEOfollowing his departure in January 2020.
51
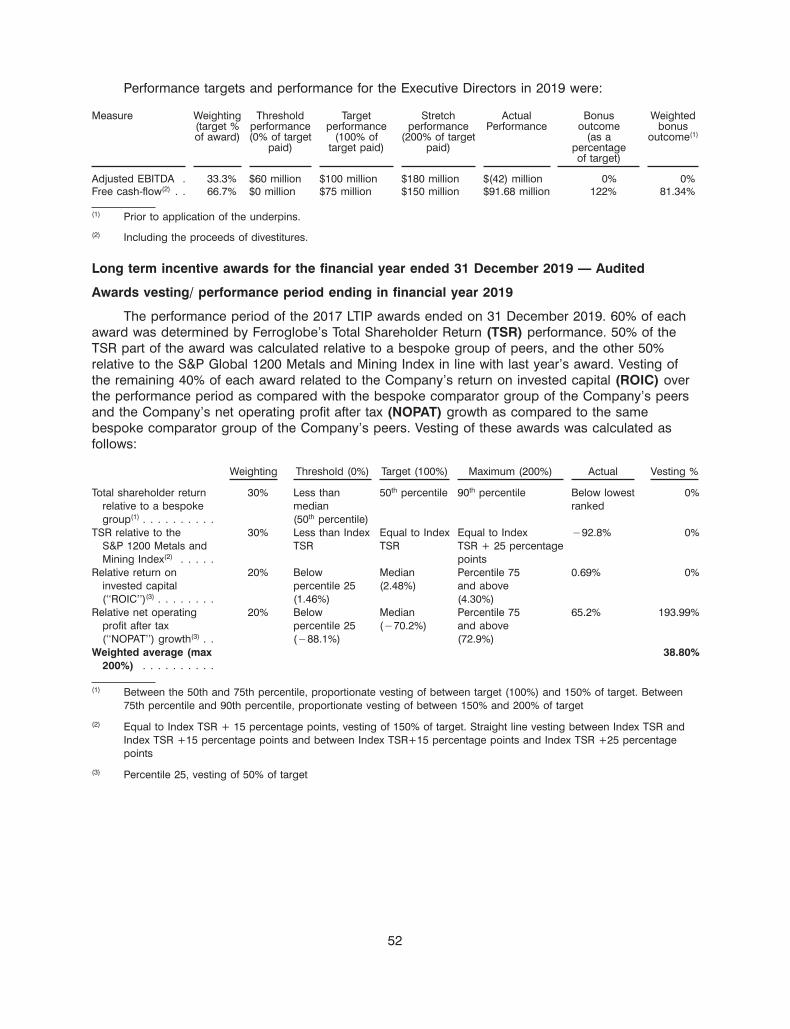
Performance targets and performance for the Executive Directors in 2019 were:
Measure Weighting Threshold Target Stretch Actual Bonus Weighted(target % performance performance performance Performance outcome bonusof award) (0% of target (100% of (200% of target (as a outcome(1)
paid) target paid) paid) percentageof target)
Adjusted EBITDA . 33.3% $60 million $100 million $180 million $(42) million 0% 0%Free cash-flow(2) . . 66.7% $0 million $75 million $150 million $91.68 million 122% 81.34%
(1) Prior to application of the underpins.
(2) Including the proceeds of divestitures.
Long term incentive awards for the financial year ended 31 December 2019 — Audited
Awards vesting/ performance period ending in financial year 2019
The performance period of the 2017 LTIP awards ended on 31 December 2019. 60% of eachaward was determined by Ferroglobe’s Total Shareholder Return (TSR) performance. 50% of theTSR part of the award was calculated relative to a bespoke group of peers, and the other 50%relative to the S&P Global 1200 Metals and Mining Index in line with last year’s award. Vesting ofthe remaining 40% of each award related to the Company’s return on invested capital (ROIC) overthe performance period as compared with the bespoke comparator group of the Company’s peersand the Company’s net operating profit after tax (NOPAT) growth as compared to the samebespoke comparator group of the Company’s peers. Vesting of these awards was calculated asfollows:
Weighting Threshold (0%) Target (100%) Maximum (200%) Actual Vesting %
Total shareholder return 30% Less than 50th percentile 90th percentile Below lowest 0%relative to a bespoke median rankedgroup(1) . . . . . . . . . . (50th percentile)
TSR relative to the 30% Less than Index Equal to Index Equal to Index �92.8% 0%S&P 1200 Metals and TSR TSR TSR + 25 percentageMining Index(2) . . . . . points
Relative return on 20% Below Median Percentile 75 0.69% 0%invested capital percentile 25 (2.48%) and above(‘‘ROIC’’)(3) . . . . . . . . (1.46%) (4.30%)
Relative net operating 20% Below Median Percentile 75 65.2% 193.99%profit after tax percentile 25 (�70.2%) and above(‘‘NOPAT’’) growth(3) . . (�88.1%) (72.9%)
Weighted average (max 38.80%200%) . . . . . . . . . .
(1) Between the 50th and 75th percentile, proportionate vesting of between target (100%) and 150% of target. Between75th percentile and 90th percentile, proportionate vesting of between 150% and 200% of target
(2) Equal to Index TSR + 15 percentage points, vesting of 150% of target. Straight line vesting between Index TSR andIndex TSR +15 percentage points and between Index TSR+15 percentage points and Index TSR +25 percentagepoints
(3) Percentile 25, vesting of 50% of target
52

As a result, the following awards are expected to vest in the normal course in 2020:
EstimatedPercentage of value to
Number of target award Number of of awardType of shares vesting shares to to vestaward Grant date Vesting date awarded (0% - 200%) vest(1) (USD)(2)
Javier Lopez Madrid . . . . . . . LTIP Nil-costoption 1 June 2017 1 June 2020 154,703 38.80% 60,025 51,792
Pedro Larrea Paguaga(3) . . . . . LTIP Nil-costoption 1 June 2017 1 June 2020 115,134 38.80% 44,672 38,545
(1) The number of shares shown excludes dividend equivalents to be awarded in the form of shares.
(2) The value shown in the table is an estimate using the average share price over the last three months of the financialyear and includes dividend equivalents.
(3) Pedro Larrea Paguaga is a ‘good leaver’ under the rules of the Equity Incentive Plan.
Deferred share bonus awards granted in financial year 2019
Under the terms of the Company’s annual bonus plan, where the annual bonus payable inany year exceeds 100% of the relevant Executive’s salary, the bonus is divided into 100% of salarypaid in cash and the balance deferred into shares for a period of three years. As no annualbonuses were awarded or paid in respect of the financial year ended 31 December 2019, noamounts were deferrable into shares and no deferred share bonus plan awards were granted in2019.
Long-term incentive awards granted in financial year 2019
On 14 March 2019, Javier Lopez Madrid and Pedro Larrea Paguaga were granted long-termincentive awards as set out in the table below. These awards were discounted by 50% comparedwith the target level of awards made in prior years to take account of the fall in the share price in2018 and 2019 and are subject to a cap on vesting at eight times the value of the target number ofshares at the share price at grant.
Face valueShare price Number of Face value of shares
Type of Basis of award at date of shares at of shares at Vesting at Performanceaward(1) (at target)(2) grant(3) target at target(4) maximum(5) threshold period(6)
Javier Lopez Madrid . . . . . . Nil-cost 115% of salary of $2.448 342,329 $838,031 $1,676,043 40% 3 years tooption $728,715 31 December 2021
Pedro Larrea Paguaga . . . . Nil-cost 100% of salary of $2.448 254,769 $623,675 $1,247,349 40% 3 years tooption $623,675 31 December 2021
(1) No price is normally payable on the exercise of the nil-cost option although the Company reserves the right to require the payment ofthe nominal cost of the shares as a condition of exercise if required to enable the issue or transfer of the shares.
(2) Converted at GBP1:USD1.313, being the exchange rate on the date of grant.
(3) This figure represents the average closing share price for the five days prior to the date of grant.
(4) The value shown in this column has been calculated by multiplying the number of shares that would vest at target by the averageclosing share price for the five days prior to the date of grant.
(5) The value shown in this column has been calculated by multiplying the number of shares that would vest at maximum (being 200% oftarget) by the average closing share price for the five days prior to the date of grant.
(6) See below for details of the performance conditions applicable to the awards.
Vesting of 60% of the award will be determined by Ferroglobe’s TSR. Performance will bemeasured over three years commencing 1 January 2019 with vesting as set out below. 50% of the
53

TSR part of the award will be determined by Ferroglobe’s TSR relative to the following bespokegroup of peer companies:
Commercial Metals Company BolidenAllegheny Technologies, Inc Morgan Advanced MaterialMaterion Corporation Minerals TechnologiesSteel Dynamics Inc Kaiser AluminiumAntofagasta plc VallourecSchnitzer Steel Industries Worthington IndustriesEramet Salzgitter AG
Norsk HydroAMG Advanced Metallurgical Group
TSR Performance Vesting scale
Less than median (50th percentile) . . . . . . . . . . . No vesting of awardsBetween the 50th and 75th percentile . . . . . . . . . Proportionate vesting of between target (100%)
and 150% of targetBetween 75th percentile and 90th percentile . . . . Proportionate vesting of between 150% and
200% of target90th percentile . . . . . . . . . . . . . . . . . . . . . . . . . 200% of target
The other 50% of the TSR part of the award will be determined by Ferroglobe’s TSR relative tothe S&P Global 1200 Metals and Mining Index.
TSR Performance Vesting scale
Less than Index TSR . . . . . . . . . . . . . . . . . . . . . . . . . . . . . . . . . . . . . . . . No vesting of awardsEqual to Index TSR . . . . . . . . . . . . . . . . . . . . . . . . . . . . . . . . . . . . . . . . . Target (100%)Equal to Index TSR + 15 percentage points . . . . . . . . . . . . . . . . . . . . . . . . 150% of targetEqual to Index TSR + 25 percentage points . . . . . . . . . . . . . . . . . . . . . . . . 200% of target
With straight line vesting between Index TSR and Index TSR +15 percentage points andbetween Index TSR+15 percentage points and Index TSR +25 percentage points.
The Committee determined that the measures applicable to the long-term incentive awardsgranted in 2018 remained appropriate, comparing (i) the Company’s return on invested capital(ROIC) over the three-year period with that of a bespoke comparator group of the Company’s peersusing a quarterly average for the calculation of Invested Capital and (ii) the Company’s netoperating profit after tax (NOPAT) growth with that of the same bespoke comparator group of theCompany’s peers set out above. Performance will be measured over three years with vesting as setout below.
ROIC over the performance period Vesting scale
Below percentile 25 . . . . . . . . . . . . . . . . . . . . . . . . . . . . . . . . . . . . . . . . . . . . . . . 0%Percentile 25 . . . . . . . . . . . . . . . . . . . . . . . . . . . . . . . . . . . . . . . . . . . . . . . . . . . . 50%Median . . . . . . . . . . . . . . . . . . . . . . . . . . . . . . . . . . . . . . . . . . . . . . . . . . . . . . . . 100%Percentile 75 and above . . . . . . . . . . . . . . . . . . . . . . . . . . . . . . . . . . . . . . . . . . . . 200%
54

NOPAT growth over the Performance Period Vesting scale
Below percentile 25 . . . . . . . . . . . . . . . . . . . . . . . . . . . . . . . . . . . . . . . . . . . . . . . 0%Percentile 25 . . . . . . . . . . . . . . . . . . . . . . . . . . . . . . . . . . . . . . . . . . . . . . . . . . . . 50%Median . . . . . . . . . . . . . . . . . . . . . . . . . . . . . . . . . . . . . . . . . . . . . . . . . . . . . . . . 100%Percentile 75 and above . . . . . . . . . . . . . . . . . . . . . . . . . . . . . . . . . . . . . . . . . . . . 200%
No portion of the ROIC component shall vest unless the Company’s ROIC over theperformance period is at least equal to the percentile 25 average ROIC for the members of thecomparator group over the performance period. No portion of the NOPAT component shall vestunless the ratio between the Company’s NOPAT for the twelve-month period ending 31 December2021 against the Company’s NOPAT for the twelve-month period ending 31 December 2018 is atleast equal to the Lower Quartile NOPAT growth ratio for the members of the comparator groupover the same period. There is straight line vesting between each vesting point (percentile 25,median and percentile 75).
Directors’ shareholding and share interests — Audited
The table below sets out the number of shares held or potentially held by directors (includingtheir connected persons where relevant) as at 31 December 2019.
TargetNumber of Number of shareholding Percentage
shares under shares under guideline (as of Executivelong term long term a % of salary Director’sincentive incentive or average salary held
Beneficially awards without awards with gross annual as shares as atowned performance performance fees as 31 December
Director shares conditions(1) conditions(2) applicable) 2019(3)
Javier Lopez Madrid . . . . . . . . . . . . . 42,500 22,829 634,650(4) 200% 5.64%Pedro Larrea Paguaga . . . . . . . . . . . 35,000 19,538 472,321(5) 200% 5.42%Jose Marıa Alapont . . . . . . . . . . . . . 15,000 — — —Donald G. Barger Jr . . . . . . . . . . . . . 20,636 26,044 — 200%Bruce L. Crockett . . . . . . . . . . . . . . 6,000 29,830 — 200%Stuart E. Eizenstat . . . . . . . . . . . . . . 24,972 2,303 — 200%Manuel Garrido y Ruano . . . . . . . . . . 870 — — 200%Greger Hamilton . . . . . . . . . . . . . . . 5425 — — 200%Juan Villar Mir de Fuentes . . . . . . . . . — — — 200%
(1) See page 56 for details.
(2) At target vesting. See page 56 for details.
(3) Measured by reference to beneficially owned shares only and using the closing share price at 31 December 2019 of$0.94 and the annual salaries of the Executive Directors in USD as disclosed in this U.K. Annual Report and Accounts.
(4) Including 24,497 shares awarded under the Equity Incentive Plan in 2016 which vested on 5 December 2019. Seepage 56 for details.
(5) Including 18,231 shares awarded under the Equity Incentive Plan in 2016 which vested on 5 December 2019. Seepage 56 for details.
55

The Directors’ outstanding share awards as at 31 December 2019 were as detailed below:
ExercisedExercisable during the
Subject to as of year toGrant performance 31 December 31 December Future Vesting
Director Award type date Outstanding(1) conditions(2) 2019 2019 vesting date
Javier Lopez Madrid . . LTIP Nil cost option 24.11.16 24,497 — Yes — — 5.12.19LTIP Nil cost option 01.06.17 154,703 Yes — — 60,025(2) 01.06.20LTIP Nil cost option 21.03.18 113,121 Yes — — 113,121 21.03.21Deferred Bonus Award:Nil cost option 14.06.18 22,829 No — — 22,829 14.06.21LTIP Nil cost option 14.03.19 342,239 Yes — — 342,239 14.03.21
Pedro Larrea Paguaga . LTIP Nil cost option 24.11.16 18,231 — — — 18,231 5.12.19LTIP Nil cost option 01.06.17 115,134 Yes — — 44,672(2) 01.06.20LTIP Nil cost option 21.03.18 84,187 Yes — — 84,187 21.03.21Deferred Share BonusAward 14.06.18 19,538 No — — 19,538 14.06.18LTIP Nil cost option 14.03.19 254,679 Yes — — 254,679 14.03.21
Donald G. Barger(3) . . . SAR Various 2,303 No Yes — — —RSU/C Various 23,741 No Yes — — —
Bruce L. Crockett(3) . . . NQ Various 25,000 No Yes —RSU/C Various 2,527 No Yes — — —SAR Various 2,303 No Yes — — —
Stuart E. Eizenstat(3) . . SAR Various 2,303 No Yes — — —
(1) Deferred share bonus awards at target granted to the Executive Directors only. Vested awards are shown withoutdividend equivalents.
(2) Subject to performance conditions and continued employment in the case of awards to the Executive Directors. See page 54 forperformance conditions applicable to the awards granted in 2019. As outlined earlier in this ARR, the 2017 awards are expected to vestas to 38.80% of target in June 2020.
(3) These incentive awards are legacy awards which the Company is authorised to honour following shareholder approval of the Policy inJune 2019.
Total pension entitlements — Audited
Details of the value of pension contributions are provided in the Pensions column of the SingleFigure of Remuneration table. Pension contributions are by way of a cash allowance or contributionto a 401(k) plan. There are therefore no specified retirement ages to disclose or consequences ofearly retirement.
56

2JUN202021203646
Performance graph
The graph below illustrates the Company’s TSR performance relative to the constituents of theS&P 1200 Metals & Mining index from the start of the first day of listing of Ferroglobe’s shares on24 December 2015 to 31 December 2019. The graph shows performance of a hypothetical $100invested and its performance over that period. The index has been chosen for this table as themost appropriate comparator for the Company in this period as the Company is a constituent ofthis index and uses the constituents of this index for one of the TSR comparator groups for thelong-term incentive awards.
Executive Chairman remuneration table
2019 2018(1) 2017(2) 2016(3) 2015(3)(4)
Javier Lopez Javier Lopez Javier Lopez Alan AlanMadrid Madrid Madrid Kestenbaum Kestenbaum
Executive Chairman’sremuneration(5) . . . . . . . . . . $1,086,784 $1,336,250 $2,106,244 $1,870,120 $225,551
Annual variable pay (includingas a % of maximum)(6) . . . . . $0 (0%) $0 (0%) $935,423 (65.5%) $738,886 (17.5%) $201,783
LTIP awards where vesting isdetermined by performancein the relevant year(7) . . . . . . 19.40% 17.87% N/A N/A N/A
(1) At the exchange rate of 1 GBP: 1.3356 USD used in the FY18 Report
(2) At the exchange rate of 1 GBP: 1.2886 USD used in the FY17 Report.
(3) At the exchange rate of 1 GBP: 1.3507 USD used in the FY16 Report.
(4) Reflecting the formation of the Company on completion of the Business Combination, the figures for 2015 are inrespect of the period from 23 December 2015 to 31 December 2015 only.
(5) Remuneration comprises total remuneration as shown in the single figure table in the ARA for 2019, in the 2018 U.K.Annual Report and Accounts for 2018, in the 2017 U.K. Annual Report and Accounts for 2017 and the 2016 U.K.
57

Annual Report and Accounts for 2016 and 2015. Remuneration reported for 2015 is for the period from consummationof the BCA on 24 December 2015 to 31 December 2015.
(6) Annual variable pay is the bonus amounts in respect of 2019 and 2018 shown in the single figure table on page 50and, for each of those years, the percentage of maximum award it represents. Figures elsewhere in this report showbonus as a percentage of target.
(7) The number of shares subject to long term incentive awards where final vesting is determined by reference toperformance ending in the year under review is shown as a percentage of maximum opportunity. No long-termincentive awards awarded to the relevant Executive Chairman vested in 2017, 2016 or 2015, save for those vesting onAlan Kestenbaum’s leaving the Company on 31 December 2016.
Percentage increase or reduction in the remuneration of the Executive Chairman
The following table shows the percentage reduction in 2019 in the Executive Chairman’s pay(1)
compared with 2018 and the average percentage change in the same period in amounts paid toEuropean employees of the Group as a whole. European employees have been chosen as anappropriate group against which to make the comparison as our Executive Chairman as at31 December 2019 is based in Europe.
Executive Chairman’s Average employeepay(1) pay
2018 to 2019 2018 to 2019(13.45)% 2.94%
(1) The components of pay for these purposes includes salary, taxable benefits and annualvariable pay
Relative importance of the spend on pay
The following table shows the Company’s actual spend on pay for all employees compared todistributions to shareholders in the financial year.
1 January 2019 to 1 January 2018 to31 December 2019 31 December 2018
Employee costs . . . . . . . . . . . . . . . . . . . . . . . . . . . . . . $285,029,000 $341,064,000(1)
Average number of employees . . . . . . . . . . . . . . . . . . . 3,736 4,471(2)
Distributions to shareholders . . . . . . . . . . . . . . . . . . . . . — $ 40,569,322
(1) Including the costs of employees employed in FerroAtlantica SAU, whose shares were sold by the Company in 2019,resulting in an adjustment to the staff costs to $338,862,000 for 2018.
(2) Including employees employed in FerroAtlantica SAU, as above.
External directorships during financial year 2019
Javier Lopez Madrid
• Chief Executive Officer of Grupo VM.
• Non-Executive Chairman and investor of Siacapital S.L..
The Board was satisfied that under these arrangements the Executive Chairman had thenecessary time to carry out his duties effectively during 2019.
Under the Policy, Executive Directors may retain fees paid for external director appointments.These appointments are subject to approval by the Board and must be compatible with their dutiesas Executive Directors.
58

Membership of the Committee
During the year to 31 December 2019, the Committee comprised Donald G. Barger, Jr aschairman and members Jose Marıa Alapont and Bruce L. Crockett.
The Executive Chairman, Chief Executive Officer and other members of the management teammay be invited to attend meetings to assist the Committee. Other Non-Executive Directors arenormally invited to attend meetings to assist the Committee in its deliberations as appropriate. NoExecutive, however, is present during any decision making in relation to their own remuneration.
External advisors
Aon provides independent advice to the Committee and was appointed by the Committee inearly 2016. The Committee seeks advice relating to Executive remuneration and Non-ExecutiveDirector remuneration and the wider senior management population from Aon. Aon also providedadvice to management, to enable their support of the Committee, primarily in relation toremuneration reporting and the operation of incentive plans but does not provide any other servicesto the Company except for insurance broking services.
The Committee is satisfied that the advice received from Aon in relation to executiveremuneration matters is objective and independent. Aon is a member of the UK RemunerationConsultants Group and abides by the Remuneration Consultants Group Code of Conduct, whichrequires its advice to be objective and impartial. The fees paid to Aon for advice provided directly tothe Committee in 2019 were £40,706 ($51,973) (2018: £168,499 ($225,047)) (excluding VAT).
Statement of shareholder voting
The following table shows the results of:
• the binding vote on the Policy commencing from Annual General Meeting of 28 June 2019;and
• the advisory vote on the 2019 Remuneration Report at the Annual General Meeting of28 June 2019.
% of votes % of votesFor cast Against cast Withheld
Directors’ Remuneration Policy . . . . . . . 125,949,908 91.07 12,268,746 8.87 83,069Remuneration Report . . . . . . . . . . . . . . 137,699,211 99.57 569,454 0.41 33,058
Approval
This Directors’ Remuneration Report, including both the Policy and Annual Report onRemuneration has been approved by the Board.
Signed on behalf of the Board.
Chairman of the Compensation Committee
5 June 2020
59

INDEPENDENT AUDITOR’S REPORT TO THE MEMBERS OF FERROGLOBE PLC
Report on the audit of the financial statements
1. Opinion
In our opinion:
• the financial statements of Ferroglobe plc (the ‘parent company’) and its subsidiaries(the ‘group’) give a true and fair view of the state of the group’s and of the parentcompany’s affairs as at 31 December 2019 and of the group’s loss for the year thenended;
• the group financial statements have been properly prepared in accordance withInternational Financial Reporting Standards (IFRSs) as issued by the InternationalAccounting Standards Board (IASB);
• the parent company financial statements have been properly prepared in accordancewith United Kingdom Generally Accepted Accounting Practice, including FinancialReporting Standard 101 ‘‘Reduced Disclosure Framework’’; and
• the financial statements have been prepared in accordance with the requirements ofthe Companies Act 2006 and, as regards the group financial statements, Article 4 ofthe IAS Regulation.
We have audited the financial statements which comprise:
• the consolidated income statement;
• the consolidated statement of comprehensive income;
• the consolidated and parent company statement of financial position;
• the consolidated and parent company statements of changes in equity;
• the consolidated cash flow statement;
• the related notes 1 to 30 in respect of the group financial statements; and
• the related notes 1 to 11 in respect of the parent company financial statements.
The financial reporting framework that has been applied in the preparation of the group financialstatements is applicable law and IFRSs as issued by the International Accounting Standards Board(IASB). The financial reporting framework that has been applied in the preparation of the parentcompany financial statements is applicable law and United Kingdom Accounting Standards,including FRS 101 ‘‘Reduced Disclosure Framework’’ (United Kingdom Generally AcceptedAccounting Practice).
2. Basis for opinion
We conducted our audit in accordance with International Standards on Auditing (UK) (ISAs (UK))and applicable law. Our responsibilities under those standards are further described in the auditor’sresponsibilities for the audit of the financial statements section of our report.
We are independent of the group and the parent company in accordance with the ethicalrequirements that are relevant to our audit of the financial statements in the UK, including theFinancial Reporting Council’s (the ‘FRC’s’) Ethical Standard as applied to listed entities, and wehave fulfilled our other ethical responsibilities in accordance with these requirements.
60

We believe that the audit evidence we have obtained is sufficient and appropriate to provide a basisfor our opinion.
3. Material uncertainty relating to going concern
We draw attention to the Accounting Policies on note 3.1 in the financial statements and thedetailed information on note 3.1, regarding the Group’s ability to operate as a going concern; theGroup is dependent on generating sufficient cash flow from trading activities to fund day to dayoperations, making scheduled interest and principal repayments and continuing to operate withinthe terms and conditions of the established debt facilities.
As discussed in note 3.1, the market for ferrometals is variable, and both price and volume canfluctuate significantly. Given the speed and frequency of continuously evolving developments withrespect to the COVID-19 pandemic and the uncertainties this may bring for the Company and thedemand for its products, it is difficult to forecast the level of trading activities and hence cash flowin the next twelve months and therefore there is a more than remote probability that the Groupdoes not have sufficient cash and/or debt facilities to meet its obligations during this period.
The Group is forecast to have limited cash headroom through the 12 months from the date of thisreport and shortfalls from forecast would increase the pressure on that headroom. The Groupcontinues to closely monitor operating cash flows, and are pursuing additional sources of financingto increase liquidity to fund operations. At this time, however, additional finance has not beensecured.
Additionally, as described in note 3.1, there is a more than remote risk that early settlement of the$350million of Senior Notes due 1 March 2022, could be requested in the event of a change ofcontrol of Ferroglobe or Grupo Villar Mir, Ferroglobe´s main shareholder. The indenture governingthe Senior Notes contains and defines change of control provisions which provide the noteholdersthe option to require the Company to redeem the notes in cash at 101% of the principal amountplus accrued interest.
In response to this, we obtained, challenged and assessed management’s going concern forecasts,and performed procedures, including:
• Testing the clerical accuracy of the model used to prepare the going concern forecasts;
• Assessing the historical accuracy of forecasts prepared by management;
• Verifying the consistency of key inputs relating to future costs, hedging and production tofinancial and operational information obtained during our audit;
• Agreeing the available facilities to underlying agreements and external confirmations fromdebt providers and testing covenant calculation forecasts performed by management;
• Challenging management as to the reasonableness of pricing assumptions applied, basedon benchmarking to market data;
• Performing sensitivity analysis on management’s forecasts, including applying downsidescenarios such as lower ferrometals prices and reduced production, and considering themitigating actions highlighted by management in the event that they were required;
• Challenging management on the likelihood of the potential early repayment of the SeniorLoan Notes as a result on a change of control; and
• Challenging management as to the adequacy of disclosures made in the Annual Report andAccounts.
61
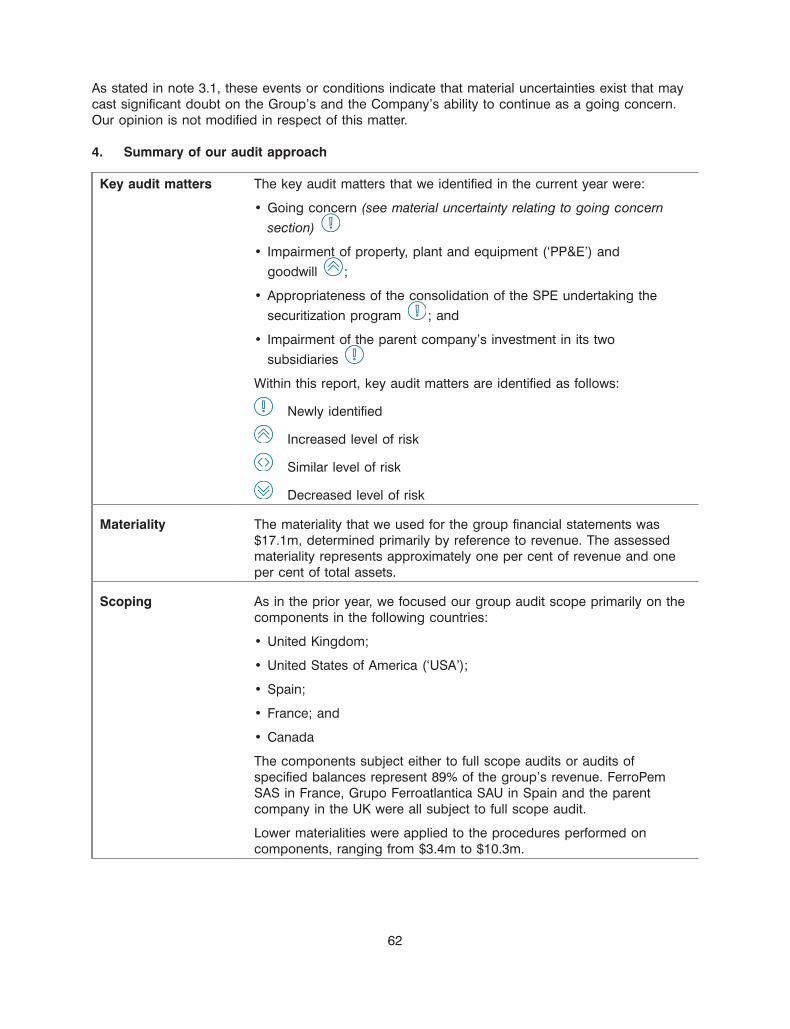
2JUN202021522370
2JUN202021522094
2JUN202021522370
2JUN202021522370
2JUN202021522370
2JUN202021522094
2JUN202021522506
2JUN202021521676
As stated in note 3.1, these events or conditions indicate that material uncertainties exist that maycast significant doubt on the Group’s and the Company’s ability to continue as a going concern.Our opinion is not modified in respect of this matter.
4. Summary of our audit approach
Key audit matters The key audit matters that we identified in the current year were:
• Going concern (see material uncertainty relating to going concernsection)
• Impairment of property, plant and equipment (‘PP&E’) and
goodwill ;
• Appropriateness of the consolidation of the SPE undertaking the
securitization program ; and
• Impairment of the parent company’s investment in its two
subsidiaries
Within this report, key audit matters are identified as follows:
Newly identified
Increased level of risk
Similar level of risk
Decreased level of risk
Materiality The materiality that we used for the group financial statements was$17.1m, determined primarily by reference to revenue. The assessedmateriality represents approximately one per cent of revenue and oneper cent of total assets.
Scoping As in the prior year, we focused our group audit scope primarily on thecomponents in the following countries:
• United Kingdom;
• United States of America (‘USA’);
• Spain;
• France; and
• Canada
The components subject either to full scope audits or audits ofspecified balances represent 89% of the group’s revenue. FerroPemSAS in France, Grupo Ferroatlantica SAU in Spain and the parentcompany in the UK were all subject to full scope audit.
Lower materialities were applied to the procedures performed oncomponents, ranging from $3.4m to $10.3m.
62

Significant changes Our audit approach is broadly consistent with the previous year,in our approach however:
• We identified a new key audit matter in relation to going concern dueto the existence of limited cash headroom, the vulnerability of futuretrading performance to fluctuations in market demand on the volumeand pricing of the group’s products and also the potential risk of anearly repayment of the Senior Loan notes being required.Additionally, subsequent to the period end, the uncertainties involvedin forecasting trading and cash flows through the forthcoming twelvemonths have increased as a result of the COVID-19 pandemic;
• Last year our audit report included a key audit matter in relation toimpairment of goodwill. We have included Property, plant andequipment (‘PP&E’) as part of this key audit matter because of thesignificant judgements and assumptions in the forecasts made bymanagement to evaluate their respective recoverable amounts, inlight of the losses made by the company during the year.
• We identified a new key audit matter in relation to the accountingtreatment of receivables in the securitisation programme due to thesignificant judgments and assumptions made by management, whichrequires the analysis of control over the ‘SPE’ (Ferrous ReceivablesDAC, a special purpose entity) and the consideration of the SPE’sconsolidation process.
• We identified a new key audit matter in relation to the impairment ofthe investments held by the parent company, Ferroglobe PLC, due tothe losses made during the year.
5. Key audit matters
Key audit matters are those matters that, in our professional judgement, were of mostsignificance in our audit of the financial statements of the current period and include the mostsignificant assessed risks of material misstatement (whether or not due to fraud) that we identified.These matters included those which had the greatest effect on: the overall audit strategy, theallocation of resources in the audit; and directing the efforts of the engagement team.
These matters were addressed in the context of our audit of the financial statements as awhole, and in forming our opinion thereon, and we do not provide a separate opinion on thesematters. In addition to the matter described in the material uncertainty relating to going concern
63

2JUN202021522094
section, we have determined the matters described below to be the key audit matters to becommunicated in our report.
5.1. Impairment of property, plant and equipment (‘PP&E’) and goodwill
As described in Notes 4.4, 7, and 9 to the financial statement, theCompany’s evaluation of property, plant and equipment and goodwill forimpairment involves the comparison of their carrying amounts with theirrecoverable amount at the end of the reporting period, or more frequentlyif there are indicators that the assets might have become impaired.
The recoverable amount is the higher of the fair value and the value inuse. If the asset itself does not generate cash flows that are independentfrom other assets, the company estimates the recoverable amount for theassets’ cash-generating unit (‘‘CGU’’)
The value in use of CGUs are developed by estimating the net presentvalue of the future cash flows expected to be derived, discounted at a ratewhich reflects the time value of money and the risks specific to the CGU.The assets involved in this analysis are located in the US, Canada, most ofthe European business and certain assets in South Africa. The estimationof recoverable value of individual CGUs requires significant judgment indeveloping and applying key underlying assumptions concerning futuremarket conditions, trading performance (sale prices, volumes, coststructure or ‘‘capex’’) as well as application of an appropriate discountrates (weighted average cost of capital or ‘‘WACC’’) and other factors(long-term growth rate). These inputs are estimated based onmanagement’s business plans, which are subject to change as businessconditions change, and therefore, could affect the fair values in the future.
As of December 31, 2019, the book value of the above-mentioned CGUswas $821,875 thousand, including goodwill and property, plant andequipment. The US CGU is the only CGU with a carrying value attributableto goodwill of $29,702 thousand. As described in Note 25 to the financialstatements an impairment charge of $175,899 thousand has beenrecognised in the year ended 31 December 2019.
We identified impairment of property, plant and equipment, and goodwillas a key audit matter because of the significant judgments involved in theassessment. A high degree of auditor judgment and an increased extent ofaudit effort, including the involvement of appropriate specialist support,was required to consider management’s estimates and assumptionsrelated to forecast of future cash flows, discount rates (WACC) and otherfactors (long-term growth rate).
64

How the scope of Our audit procedures related to management’s estimates and assumptionsour audit in developing future cash flows (mainly sale prices, volumes, cost structureresponded to the and capex), discount rates (WACC) and other factors (long-term growth)key audit matter included the following, among others:
• We assessed the design and implementation and tested the operatingeffectiveness of relevant controls over the development of theimpairment assessment of long-lived assets;
• We considered the accuracy of past forecasts developed bymanagement to aid assessment of the reliability of the forecastingprocess;
• We considered key assumptions applied in the development of thediscounted future cashflows, including their consistency with theforecasts used in the assessment of the carrying value of the individualCGUs, as discussed above. We confirmed the cashflow forecasts wereconsistent with the most recent forecasts approved by the Board ofDirectors;
• We discussed and challenged management on key assumptionsunderlying the forecast, including evaluation of management’s forecastsby reference to prior year and 2020 year to date results, current orderbook, comparison with the approved budget and changes in theregulatory environment;
• We evaluated the volumes and prices projected for the period2021-2024 using independent sources of information (such as analystand industry reports or prices reports, when available) and consideredinformation that could be potentially contradictory to management’sforecast;
• With the assistance of our fair value specialists, we evaluated thediscount rates (WACC), the long-term growth rates and the underlyingsource information. Our fair value specialists also assisted in testing themathematical accuracy of the calculations and developing a range ofindependent estimates and comparing those to management’s discountrates (WACC) and the long term growth rate; and
• We have evaluated the sensitivity analysis disclosed by the Companyover the US CGU by comparing the results of the impairment test withsignificant changes and modifications (10% variances) to the underlyinginputs such as the net cash flows, the discount rates (WACC) and thelong-term growth rates.
Key observations We are satisfied that the impairment of the group’s property, plant andequipment (‘PP&E’) and goodwill as at 31 December 2019 is appropriate.
65

2JUN2020215223705.2. Appropriateness of the consolidation of the SPE undertaking the securitization
program
Key audit matter As described in Notes 10 and 16 to the financial statements, on July 31,description 2017, the Company entered into an accounts receivable securitization
program (the ‘‘Program’’) where trade receivables held by the Company’ssubsidiaries in the US, Canada, Spain and France were sold to FerrousReceivables DAC, a special purpose entity domiciled and incorporated inIreland (the ‘‘SPE’’). On December 10, 2019, the Company refinanced theProgram and amended and restated its terms, maintaining the Company’sEuropean subsidiaries as senior subordinated and junior subordinatedlenders and creating a new interest in the senior and intermediatesubordinated loan tranches. On September 5, 2019 as a consequence ofcertain amendments to the contract, Management determined, afterconsidering the risk exposure for each lender, that Ferroglobe becameexposed to variable returns and had the ability to affect those returnsthrough its power over the investee. As such from this date it wasconcluded that Ferroglobe has control over the SPE and therefore that theSPE should be consolidated. This conclusion was maintained under theProgram amended and restated on December 10, 2019. The new seniorlender’s commitments under the amended and restated securitizationprogram are $150,000 thousand, of which $104,130 thousand was drawnat December 31, 2019.We identified the appropriateness of the consolidation of the SPEundertaking the securitization program as a key audit matter because ofthe significant judgment involved in evaluating the analysis of control overthe SPE. This required a high degree of the auditor judgment and anincreased extent of audit effort, including the need to involve our IFRStechnical specialists, when performing audit procedures to evaluate thereasonableness of management’s estimates and assumptions related tothe consolidation of the SPE.
How the scope of Our audit procedures related to the consolidation of the SPE undertakingour audit the securitisation program and the consolidation of the SPE included theresponded to the following, among others:key audit matter • We assessed the design and implementation and tested the operating
effectiveness of relevant controls governing the assessment;• We performed procedures , including inquiry to management and review
of relevant documentation, to obtain an understanding of the businesspurpose and economic substance of the transaction.
• We evaluated the control of the Company over the SPE, consideredwhether the consolidation of the entity is required by the applicableaccounting standards and assessed the appropriateness of theaccounting treatment.
• We used internal specialists to evaluate the assumptions used to assessthe variable returns and the ability of Ferroglobe PLC to affect thosereturns through its power over the investee, which determine the controlover the SPE, its risk exposure and therefore if its consolidation isrequired.
• We performed audit procedures over the account receivables sold to theSPE, including the reconciliation of balances, verification with third-partyreports and external confirmations.
• We performed audit procedures over the consolidation process,including the review of the journal entries and the subsequentconsolidation eliminations and adjustments.
Key observations We have concluded that the accounting treatment adopted is reasonable.
66
2JUN2020215223705.3. Carrying values of the parent company’s investments in its two subsidiaries
Key audit matter The total carrying value of the Parent Company’s investment in its twodescription subsidiaries, Globe Specialty Metals Inc and Grupo Ferroatlantica SAU, as
at 31 December 2019 is $611 million (2018: $1,068 million, as detailed atnote 3 to the parent company financial statements.
Net assets of the subsidiaries were lower than their carrying values in thebalance sheet of Ferroglobe PLC and the subsidiaries. This wasconsidered to be an indicator of impairment in the carrying values of theinvestments.
Management conducted an impairment assessment by preparingdiscounted future cashflows which reflected their estimates of future cashflows expected to be generated by each of the subsidiary undertakings.
The assumptions used in developing the future cashflows were consistentwith those applied in the group impairment assessment, discussed aboveand only including information related to events or conditions existing at31 December 2019.
The value in use assessment identified a total recoverable amount lowerthan the carrying value of the investments in subsidiaries. Therefore, thecompany recognised an impairment of $438 million as at 31 December2019.
The applied accounting policy and key sources of estimation uncertaintyare discussed at note 1 to the Parent Company financial statements.
How the scope of Our audit procedures related to management’s estimates and assumptionsour audit considered to determine future cash flows of the subsidiary undertakingsresponded to the included the following, among others:key audit matter • We assessed the design, implementation and operating effectiveness of
relevant controls relating to the preparation of the discounted futurecash flows;
• We considered key assumptions applied in the development of thediscounted future cashflows, including their consistency with theforecasts used in the assessment of the carrying value of the individualCGUs, as discussed above. We assessed that the cashflow forecastswere consistent with the most recent forecasts approved by the Board ofDirectors;
• We considered the accuracy of past forecasts developed bymanagement to aid assessment of the reliability of the forecastingprocess;
• We discussed and challenged management on key assumptionsunderlying the valuation, through review of the forecast revenues, growthrates and the pre-tax discount rate applied; and
• Working with our valuation specialists, we assessed the methodologyapplied in the valuation and the reasonableness of the applied discountrate.
Key observations The carrying value of the investments in subsidiaries at 31 December 2019is appropriate.
67
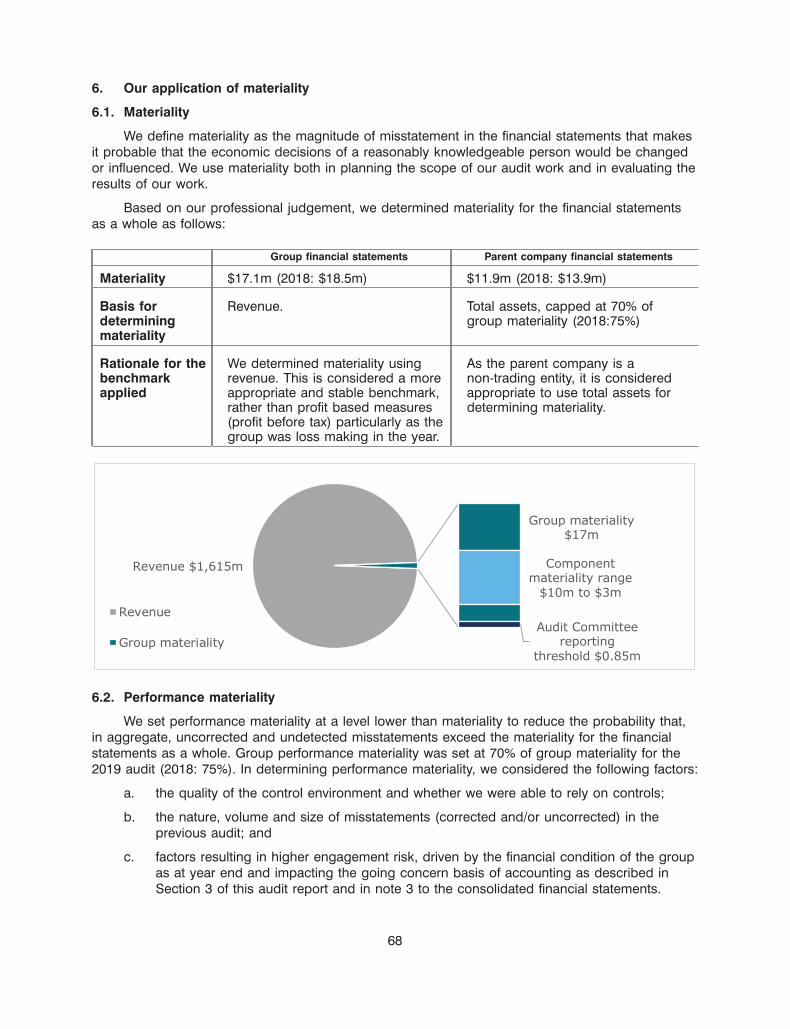
2JUN202021522231
6. Our application of materiality
6.1. Materiality
We define materiality as the magnitude of misstatement in the financial statements that makesit probable that the economic decisions of a reasonably knowledgeable person would be changedor influenced. We use materiality both in planning the scope of our audit work and in evaluating theresults of our work.
Based on our professional judgement, we determined materiality for the financial statementsas a whole as follows:
Group financial statements Parent company financial statements
Materiality $17.1m (2018: $18.5m) $11.9m (2018: $13.9m)
Basis for Revenue. Total assets, capped at 70% ofdetermining group materiality (2018:75%)materiality
Rationale for the We determined materiality using As the parent company is abenchmark revenue. This is considered a more non-trading entity, it is consideredapplied appropriate and stable benchmark, appropriate to use total assets for
rather than profit based measures determining materiality.(profit before tax) particularly as thegroup was loss making in the year.
Revenue $1,615m
Group materiality $17m
Component materiality range
$10m to $3m
Audit Committee reporting
threshold $0.85m
Revenue
Group materiality
6.2. Performance materiality
We set performance materiality at a level lower than materiality to reduce the probability that,in aggregate, uncorrected and undetected misstatements exceed the materiality for the financialstatements as a whole. Group performance materiality was set at 70% of group materiality for the2019 audit (2018: 75%). In determining performance materiality, we considered the following factors:
a. the quality of the control environment and whether we were able to rely on controls;
b. the nature, volume and size of misstatements (corrected and/or uncorrected) in theprevious audit; and
c. factors resulting in higher engagement risk, driven by the financial condition of the groupas at year end and impacting the going concern basis of accounting as described inSection 3 of this audit report and in note 3 to the consolidated financial statements.
68
6.3. Error reporting threshold
We agreed with the Audit Committee that we would report to the Committee all auditdifferences in excess of $0.85m (2018: $0.92m), as well as differences below that threshold that, inour view, warranted reporting on qualitative grounds. We also report to the Audit Committee ondisclosure matters that we identified when assessing the overall presentation of the financialstatements.
7. An overview of the scope of our audit
7.1. Identification and scoping of components
The group comprises three reportable segments (North America, Europe and South Africa)and the corporate business unit, each of which were included in our assessment of the risks ofmaterial misstatement.
As in the prior year, we focused our group audit scope primarily on the components in thefollowing countries:
• United Kingdom;
• United States of America (‘‘USA’’);
• Spain;
• France; and
• Canada
Full scope audits were performed on those components audited by the Group team and bythe component teams on Grupo Ferroatlantica S.A. in Spain, FerroPem SAS France and the parentcompany in the UK. Specified audit procedures were performed at the group’s other locations inUSA and Canada. The materialities applied to components ranged from $10.2 million to $3.4 million(2018: $11.1 million to $3.7 million). The coverage of our audit work is shown below in section 7.2.of this audit report.
7.2. Working with other auditors
The UK group audit team worked on an integrated basis with Deloitte Spain, directlyperforming and overseeing audit work performed in the UK and Spain, and overseeing the work ofcomponent auditors.
The integrated UK and Spanish audit team planned, supervised and reviewed work performedby component auditors in France, USA and Canada; the level of direct involvement varied bylocation and included, a review of the reports provided on the results of the work undertaken by thecomponent audit teams, attendance to meetings with local engagement teams and detailed reviewof their audit work documentation.
69

2JUN202021521537
The coverage of our audit work across the group is shown below:
58%31%
11%
Revenue
Full audit scope
Specified audit procedures
Review at group level
78%
8%
14%
Lossbefore tax
Full audit scope
Specified audit procedures
Review at group level
33%
56%
11%
Net Assets
Full audit scope
Specified audit procedures
Review at group level
8. Other information
The directors are responsible for the other information. The other information comprises theinformation included in the annual report, other than the financial statements and our auditor’sreport thereon.
Our opinion on the financial statements does not cover the other information and, except tothe extent otherwise explicitly stated in our report, we do not express any form of assuranceconclusion thereon.
In connection with our audit of the financial statements, our responsibility is to read the otherinformation and, in doing so, consider whether the other information is materially inconsistent withthe financial statements or our knowledge obtained in the audit or otherwise appears to bematerially misstated.
If we identify such material inconsistencies or apparent material misstatements, we arerequired to determine whether there is a material misstatement in the financial statements or amaterial misstatement of the other information. If, based on the work we have performed, weconclude that there is a material misstatement of this other information, we are required to reportthat fact.
We have nothing to report in respect of these matters.
9. Responsibilities of directors
As explained more fully in the directors’ responsibilities statement, the directors areresponsible for the preparation of the financial statements and for being satisfied that they give atrue and fair view, and for such internal control as the directors determine is necessary to enablethe preparation of financial statements that are free from material misstatement, whether due tofraud or error.
In preparing the financial statements, the directors are responsible for assessing the group’sand the parent company’s ability to continue as a going concern, disclosing as applicable, mattersrelated to going concern and using the going concern basis of accounting unless the directorseither intend to liquidate the group or the parent company or to cease operations, or have norealistic alternative but to do so.
70

10. Auditor’s responsibilities for the audit of the financial statements
Our objectives are to obtain reasonable assurance about whether the financial statements as awhole are free from material misstatement, whether due to fraud or error, and to issue an auditor’sreport that includes our opinion. Reasonable assurance is a high level of assurance, but is not aguarantee that an audit conducted in accordance with ISAs (UK) will always detect a materialmisstatement when it exists. Misstatements can arise from fraud or error and are consideredmaterial if, individually or in the aggregate, they could reasonably be expected to influence theeconomic decisions of users taken on the basis of these financial statements.
A further description of our responsibilities for the audit of the financial statements is locatedon the FRC’s website at: www.frc.org.uk/auditorsresponsibilities. This description forms part of ourauditor’s report.
Report on other legal and regulatory requirements
11. Opinions on other matters prescribed by the Companies Act 2006
In our opinion the part of the directors’ remuneration report to be audited has been properlyprepared in accordance with the Companies Act 2006.
In our opinion, based on the work undertaken in the course of the audit:
• the information given in the strategic report and the directors’ report for the financial year forwhich the financial statements are prepared is consistent with the financial statements; and
• the strategic report and the directors’ report have been prepared in accordance withapplicable legal requirements.
In the light of the knowledge and understanding of the group and the parent company andtheir environment obtained in the course of the audit, we have not identified any materialmisstatements in the strategic report or the directors’ report.
12. Matters on which we are required to report by exception
12.1.Adequacy of explanations received and accounting records
Under the Companies Act 2006 we are required to report to you if, in our opinion:
• we have not received all the information and explanations we require for our audit; or
• adequate accounting records have not been kept by the parent company, or returnsadequate for our audit have not been received from branches not visited by us; or
• the parent company financial statements are not in agreement with the accounting recordsand returns.
We have nothing to report in respect of these matters.
12.2.Directors’ remuneration
Under the Companies Act 2006 we are also required to report if in our opinion certaindisclosures of directors’ remuneration have not been made or the part of the directors’remuneration report to be audited is not in agreement with the accounting records and returns.
We have nothing to report in respect of these matters.
71

13. Use of our report
This report is made solely to the company’s members, as a body, in accordance withChapter 3 of Part 16 of the Companies Act 2006. Our audit work has been undertaken so that wemight state to the company’s members those matters we are required to state to them in anauditor’s report and for no other purpose. To the fullest extent permitted by law, we do not acceptor assume responsibility to anyone other than the company and the company’s members as abody, for our audit work, for this report, or for the opinions we have formed.
Graeme Sheils, CA (Senior statutory auditor)For and on behalf of Deloitte LLPStatutory AuditorLondon, UK5 June 2020
72

FERROGLOBE PLC
FINANCIAL STATEMENTS CONTENTS
Consolidated Statement of Financial Position as of December 31, 2019 and 2018 . . . . . . . . 74Consolidated Income Statement for the years ended December 31, 2019, 2018 and 2017 . . 75Consolidated Statement of Comprehensive Income (Loss) for the years ended
December 31, 2019, 2018 and 2017 . . . . . . . . . . . . . . . . . . . . . . . . . . . . . . . . . . . . . . . . 76Consolidated Statement of Changes in Equity for the years ended December 31, 2019, 2018
and 2017 . . . . . . . . . . . . . . . . . . . . . . . . . . . . . . . . . . . . . . . . . . . . . . . . . . . . . . . . . . . 77Consolidated Statement of Cash Flows for the years ended December 31, 2019, 2018 and
2017 . . . . . . . . . . . . . . . . . . . . . . . . . . . . . . . . . . . . . . . . . . . . . . . . . . . . . . . . . . . . . . 78Notes to the Consolidated Financial Statements . . . . . . . . . . . . . . . . . . . . . . . . . . . . . . . . . 79Parent Company Balance Sheet as of December 31, 2019 and 2018 . . . . . . . . . . . . . . . . . . 192Parent Company Statement of Changes in Equity for the years ended December 31, 2019
and 2018 . . . . . . . . . . . . . . . . . . . . . . . . . . . . . . . . . . . . . . . . . . . . . . . . . . . . . . . . . . . 193Notes to the Parent Company Financial Statements . . . . . . . . . . . . . . . . . . . . . . . . . . . . . . 194
73

FERROGLOBE PLC AND SUBSIDIARIESCONSOLIDATED STATEMENT OF FINANCIAL POSITION
AS OF DECEMBER 31, 2019 AND 2018Thousands of U.S. Dollars
2019 2018Notes $’000 $’000
ASSETSNon-current assets
Goodwill . . . . . . . . . . . . . . . . . . . . . . . . . . . . . . . . . . . . . . . . . . . . . . . . . . . . . . Note 7 29,702 202,848Other intangible assets . . . . . . . . . . . . . . . . . . . . . . . . . . . . . . . . . . . . . . . . . . . . . . Note 8 51,267 51,822Property, plant and equipment . . . . . . . . . . . . . . . . . . . . . . . . . . . . . . . . . . . . . . . . . . Note 9 740,906 888,862Other non-current financial assets . . . . . . . . . . . . . . . . . . . . . . . . . . . . . . . . . . . . . . . . Note 10 2,618 70,343Deferred tax assets . . . . . . . . . . . . . . . . . . . . . . . . . . . . . . . . . . . . . . . . . . . . . . . . Note 22 59,551 14,589Non-current receivables from related parties . . . . . . . . . . . . . . . . . . . . . . . . . . . . . . . . . . Note 23 2,247 2,288Other non-current assets . . . . . . . . . . . . . . . . . . . . . . . . . . . . . . . . . . . . . . . . . . . . . Note 12 1,597 10,486Non-current restricted cash and cash equivalents . . . . . . . . . . . . . . . . . . . . . . . . . . . . . . . Note 10 28,323 —
Total non-current assets . . . . . . . . . . . . . . . . . . . . . . . . . . . . . . . . . . . . . . . . . . . . . . 916,211 1,241,238Current assets
Inventories . . . . . . . . . . . . . . . . . . . . . . . . . . . . . . . . . . . . . . . . . . . . . . . . . . . . . Note 11 354,121 456,970Trade and other receivables . . . . . . . . . . . . . . . . . . . . . . . . . . . . . . . . . . . . . . . . . . . Note 10 309,064 155,996Current receivables from related parties . . . . . . . . . . . . . . . . . . . . . . . . . . . . . . . . . . . . Note 23 2,955 14,226Current income tax assets . . . . . . . . . . . . . . . . . . . . . . . . . . . . . . . . . . . . . . . . . . . . Note 22 27,930 27,404Other current financial assets . . . . . . . . . . . . . . . . . . . . . . . . . . . . . . . . . . . . . . . . . . Note 10 5,544 2,523Other current assets . . . . . . . . . . . . . . . . . . . . . . . . . . . . . . . . . . . . . . . . . . . . . . . . Note 12 23,676 8,813Cash and cash equivalents . . . . . . . . . . . . . . . . . . . . . . . . . . . . . . . . . . . . . . . . . . . . Note 10 94,852 216,647
Total current assets . . . . . . . . . . . . . . . . . . . . . . . . . . . . . . . . . . . . . . . . . . . . . . . . . 818,142 882,579
Total assets . . . . . . . . . . . . . . . . . . . . . . . . . . . . . . . . . . . . . . . . . . . . . . . . . . . . . . 1,734,353 2,123,817
EQUITY AND LIABILITIESEquity
Share capital . . . . . . . . . . . . . . . . . . . . . . . . . . . . . . . . . . . . . . . . . . . . . . . . . . . . 1,784 1,784Reserves . . . . . . . . . . . . . . . . . . . . . . . . . . . . . . . . . . . . . . . . . . . . . . . . . . . . . . 975,358 941,707Translation differences . . . . . . . . . . . . . . . . . . . . . . . . . . . . . . . . . . . . . . . . . . . . . . (210,152) (207,366)Valuation adjustments . . . . . . . . . . . . . . . . . . . . . . . . . . . . . . . . . . . . . . . . . . . . . . . (2,169) (11,559)Result attributable to the Parent . . . . . . . . . . . . . . . . . . . . . . . . . . . . . . . . . . . . . . . . . (280,601) 43,661Non-controlling interests . . . . . . . . . . . . . . . . . . . . . . . . . . . . . . . . . . . . . . . . . . . . . 118,077 116,145
Total equity . . . . . . . . . . . . . . . . . . . . . . . . . . . . . . . . . . . . . . . . . . . . . . . . . . . . . . Note 13 602,297 884,372Non-current liabilities
Deferred income . . . . . . . . . . . . . . . . . . . . . . . . . . . . . . . . . . . . . . . . . . . . . . . . . . 1,253 1,434Provisions . . . . . . . . . . . . . . . . . . . . . . . . . . . . . . . . . . . . . . . . . . . . . . . . . . . . . . Note 15 84,852 75,787Bank borrowings . . . . . . . . . . . . . . . . . . . . . . . . . . . . . . . . . . . . . . . . . . . . . . . . . . Note 16 144,388 132,821Lease liabilities . . . . . . . . . . . . . . . . . . . . . . . . . . . . . . . . . . . . . . . . . . . . . . . . . . . Note 17 16,972 53,472Debt instruments . . . . . . . . . . . . . . . . . . . . . . . . . . . . . . . . . . . . . . . . . . . . . . . . . . Note 18 344,014 341,657Other financial liabilities . . . . . . . . . . . . . . . . . . . . . . . . . . . . . . . . . . . . . . . . . . . . . . Note 19 43,157 32,788Other non-current liabilities . . . . . . . . . . . . . . . . . . . . . . . . . . . . . . . . . . . . . . . . . . . . Note 21 25,906 25,030Deferred tax liabilities . . . . . . . . . . . . . . . . . . . . . . . . . . . . . . . . . . . . . . . . . . . . . . . Note 22 74,057 77,379
Total non-current liabilities . . . . . . . . . . . . . . . . . . . . . . . . . . . . . . . . . . . . . . . . . . . . 734,599 740,368Current liabilities
Provisions . . . . . . . . . . . . . . . . . . . . . . . . . . . . . . . . . . . . . . . . . . . . . . . . . . . . . . Note 15 46,091 40,570Bank borrowings . . . . . . . . . . . . . . . . . . . . . . . . . . . . . . . . . . . . . . . . . . . . . . . . . . Note 16 14,611 8,191Lease liabilities . . . . . . . . . . . . . . . . . . . . . . . . . . . . . . . . . . . . . . . . . . . . . . . . . . . Note 17 8,900 12,999Debt instruments . . . . . . . . . . . . . . . . . . . . . . . . . . . . . . . . . . . . . . . . . . . . . . . . . . Note 18 10,937 10,937Other financial liabilities . . . . . . . . . . . . . . . . . . . . . . . . . . . . . . . . . . . . . . . . . . . . . . Note 19 23,382 52,524Payables to related parties . . . . . . . . . . . . . . . . . . . . . . . . . . . . . . . . . . . . . . . . . . . . Note 23 4,830 11,128Trade and other payables . . . . . . . . . . . . . . . . . . . . . . . . . . . . . . . . . . . . . . . . . . . . Note 20 189,229 256,823Current income tax liabilities . . . . . . . . . . . . . . . . . . . . . . . . . . . . . . . . . . . . . . . . . . . Note 22 3,048 2,335Other current liabilities . . . . . . . . . . . . . . . . . . . . . . . . . . . . . . . . . . . . . . . . . . . . . . Note 21 96,429 103,570
Total current liabilities . . . . . . . . . . . . . . . . . . . . . . . . . . . . . . . . . . . . . . . . . . . . . . . 397,457 499,077
Total equity and liabilities . . . . . . . . . . . . . . . . . . . . . . . . . . . . . . . . . . . . . . . . . . . . . 1,734,353 2,123,817
Notes 1 to 30 are an integral part of the consolidated financial statements
The financial statements were approved by the Board and authorized for issue on June 5,2020.
Signed on behalf of the Board.
Dr. Marco LeviDirector
74

FERROGLOBE PLC AND SUBSIDIARIES
CONSOLIDATED INCOME STATEMENT FOR 2019, 2018 AND 2017
Thousands of U.S. Dollars
2019 2018(*) 2017(*)Notes $’000 $’000 $’000
Sales . . . . . . . . . . . . . . . . . . . . . . . . . . . . . . . Note 25.1 1,615,222 2,242,002 1,732,276Cost of sales . . . . . . . . . . . . . . . . . . . . . . . . . . (1,214,397) (1,446,677) (1,043,275)Other operating income . . . . . . . . . . . . . . . . . . 54,213 45,844 18,100Staff costs . . . . . . . . . . . . . . . . . . . . . . . . . . . . Note 25.2 (285,029) (338,862) (300,035)Other operating expense . . . . . . . . . . . . . . . . . (225,705) (277,560) (234,399)Depreciation and amortization charges,
operating allowances and write-downs . . . . . . Note 25.3 (120,194) (113,837) (100,402)Impairment losses . . . . . . . . . . . . . . . . . . . . . . Note 25.5 (175,899) (58,919) (31,641)Net (loss) gain due to changes in the value of
assets . . . . . . . . . . . . . . . . . . . . . . . . . . . . . Note 25.5 (1,574) (7,623) 7,504(Loss) gain on disposal of non-current assets . . Note 25.6 (2,223) 14,564 (4,316)Bargain purchase gain . . . . . . . . . . . . . . . . . . . Note 5 — 40,142 —Other losses . . . . . . . . . . . . . . . . . . . . . . . . . . Note 29 — — (2,613)
Operating (loss) profit . . . . . . . . . . . . . . . . . . (355,586) 99,074 41,199Finance income . . . . . . . . . . . . . . . . . . . . . . . . Note 25.4 1,380 4,858 2,409Finance costs . . . . . . . . . . . . . . . . . . . . . . . . . Note 25.4 (63,225) (57,066) (59,969)Financial derivative gain (loss) . . . . . . . . . . . . . Note 19 2,729 2,838 (6,850)Exchange differences . . . . . . . . . . . . . . . . . . . . 2,884 (14,136) 8,214
(Loss) profit before tax . . . . . . . . . . . . . . . . . . (411,818) 35,568 (14,997)Income tax benefit (expense) . . . . . . . . . . . . . . Note 22 41,541 (20,459) 14,225
(Loss) profit for the year from continuingoperations . . . . . . . . . . . . . . . . . . . . . . . . . . (370,277) 15,109 (772)
(Loss) profit for the year from discontinuedoperations . . . . . . . . . . . . . . . . . . . . . . . . . . Note 29 84,637 9,464 (5,050)
(Loss) profit for the year . . . . . . . . . . . . . . . . (285,640) 24,573 (5,822)Loss attributable to non-controlling interests . . . Note 13 5,039 19,088 5,144
(Loss) profit attributable to the Parent . . . . . . (280,601) 43,661 (678)
Earnings per share
2019 2018(*) 2017(*)
(Loss) profit attributable to the Parent ($’000) . . . (280,601) 43,661 (678)Weighted average basic shares outstanding . . . . 169,152,905 171,406,272 171,949,128Basic (loss) earnings per ordinary share ($) . . Note 14 (1.66) 0.25 (0.00)Weighted average basic shares outstanding . . . . 169,152,905 171,406,272 171,949,128Effect of dilutive securities . . . . . . . . . . . . . . . . . — 123,340.00 —Weighted average dilutive shares outstanding . . . 169,152,905 171,529,612 171,949,128Diluted (loss) earnings per ordinary share ($) . Note 14 (1.66) 0.25 (0.00)
(*) The amounts for prior periods have been restated to reclassify the results of the Company´s Spanish hydroelectricassets within profit (loss) from discontinued operations.
Notes 1 to 30 are an integral part of the consolidated financial statements
75

FERROGLOBE PLC AND SUBSIDIARIES
CONSOLIDATED STATEMENT OF COMPREHENSIVE (LOSS) INCOMEFOR 2019, 2018 AND 2017
Thousands of U.S. Dollars
2019 2018(*) 2017(*)$’000 $’000 $’000
(Loss) profit for the year . . . . . . . . . . . . . . . . . . . . . . . . . . . . . (285,640) 24,573 (5,822)
Items that will not be reclassified subsequently to income orloss:Defined benefit obligation . . . . . . . . . . . . . . . . . . . . . . . . . . . (1,859) 3,568 4,511Tax effect . . . . . . . . . . . . . . . . . . . . . . . . . . . . . . . . . . . . . . . — (296) —
Total income and expense that will not be reclassifiedsubsequently to income or loss . . . . . . . . . . . . . . . . . . . . (1,859) 3,272 4,511
Items that may be reclassified subsequently to income orloss:Arising from cash flow hedges . . . . . . . . . . . . . . . . . . . . . . . . 9,663 10,006 (24,171)Translation differences . . . . . . . . . . . . . . . . . . . . . . . . . . . . . . (8,698) (45,435) 54,670Tax effect . . . . . . . . . . . . . . . . . . . . . . . . . . . . . . . . . . . . . . . — — —
Total income and expense that may be reclassifiedsubsequently to income or loss . . . . . . . . . . . . . . . . . . . . . . 965 (35,429) 30,499
Items that have been reclassified to income or loss in theperiod:Arising from cash flow hedges . . . . . . . . . . . . . . . . . . . . . . . . 2,390 (7,228) 15,138Tax effect . . . . . . . . . . . . . . . . . . . . . . . . . . . . . . . . . . . . . . . (805) (190) (390)
Total transfers to income or loss . . . . . . . . . . . . . . . . . . . . . . . 1,585 (7,418) 14,748
Other comprehensive income (loss) for the year, net ofincome tax . . . . . . . . . . . . . . . . . . . . . . . . . . . . . . . . . . . . . . 691 (39,575) 49,758
Total comprehensive (loss) income for the year . . . . . . . . . . . (284,949) (15,002) 43,936
Attributable to the Parent . . . . . . . . . . . . . . . . . . . . . . . . . . . . . (281,097) 4,976 47,158Attributable to non-controlling interests . . . . . . . . . . . . . . . . . . . (3,852) (19,978) (3,222)
(*) The amounts for prior periods have been restated to reclassify the results of the Company´s Spanish hydroelectricassets within profit (loss) from discontinued operations.
Notes 1 to 30 are an integral part of the consolidated financial statements
76
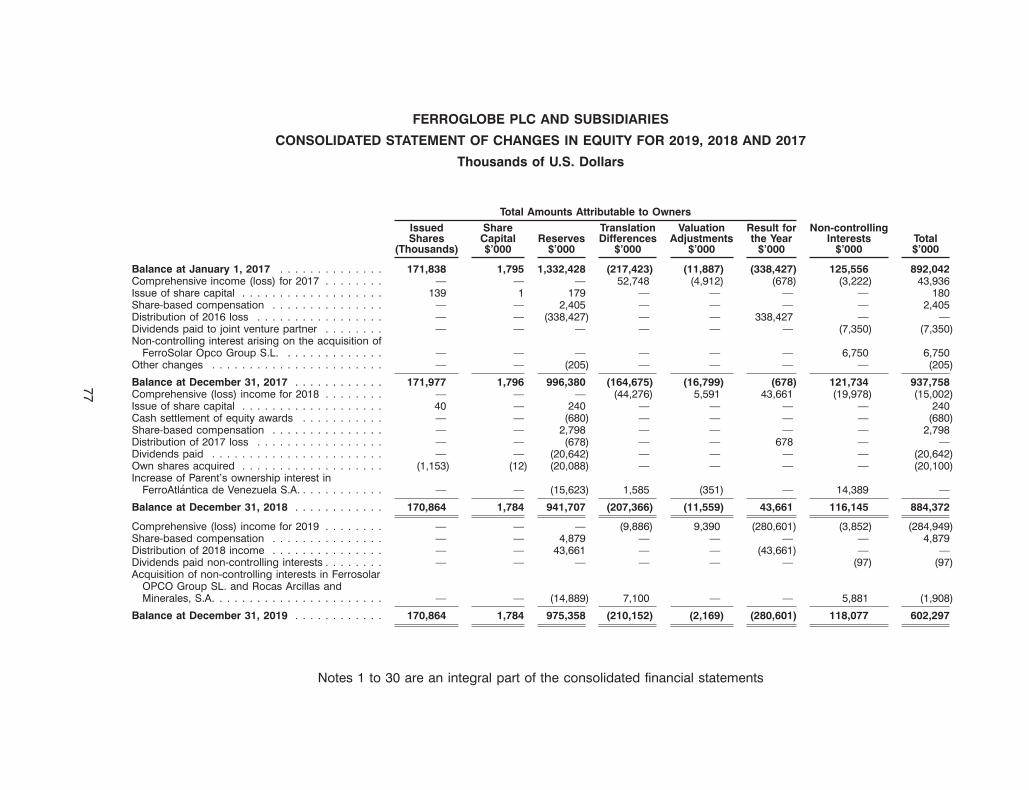
77
FERROGLOBE PLC AND SUBSIDIARIES
CONSOLIDATED STATEMENT OF CHANGES IN EQUITY FOR 2019, 2018 AND 2017
Thousands of U.S. Dollars
Total Amounts Attributable to OwnersIssued Share Translation Valuation Result for Non-controllingShares Capital Reserves Differences Adjustments the Year Interests Total
(Thousands) $’000 $’000 $’000 $’000 $’000 $’000 $’000
Balance at January 1, 2017 . . . . . . . . . . . . . . 171,838 1,795 1,332,428 (217,423) (11,887) (338,427) 125,556 892,042Comprehensive income (loss) for 2017 . . . . . . . . — — — 52,748 (4,912) (678) (3,222) 43,936Issue of share capital . . . . . . . . . . . . . . . . . . . 139 1 179 — — — — 180Share-based compensation . . . . . . . . . . . . . . . — — 2,405 — — — — 2,405Distribution of 2016 loss . . . . . . . . . . . . . . . . . — — (338,427) — — 338,427 — —Dividends paid to joint venture partner . . . . . . . . — — — — — — (7,350) (7,350)Non-controlling interest arising on the acquisition of
FerroSolar Opco Group S.L. . . . . . . . . . . . . . — — — — — — 6,750 6,750Other changes . . . . . . . . . . . . . . . . . . . . . . . — — (205) — — — — (205)
Balance at December 31, 2017 . . . . . . . . . . . . 171,977 1,796 996,380 (164,675) (16,799) (678) 121,734 937,758Comprehensive (loss) income for 2018 . . . . . . . . — — — (44,276) 5,591 43,661 (19,978) (15,002)Issue of share capital . . . . . . . . . . . . . . . . . . . 40 — 240 — — — — 240Cash settlement of equity awards . . . . . . . . . . . — — (680) — — — — (680)Share-based compensation . . . . . . . . . . . . . . . — — 2,798 — — — — 2,798Distribution of 2017 loss . . . . . . . . . . . . . . . . . — — (678) — — 678 — —Dividends paid . . . . . . . . . . . . . . . . . . . . . . . — — (20,642) — — — — (20,642)Own shares acquired . . . . . . . . . . . . . . . . . . . (1,153) (12) (20,088) — — — — (20,100)Increase of Parent’s ownership interest in
FerroAtlantica de Venezuela S.A. . . . . . . . . . . . — — (15,623) 1,585 (351) — 14,389 —
Balance at December 31, 2018 . . . . . . . . . . . . 170,864 1,784 941,707 (207,366) (11,559) 43,661 116,145 884,372
Comprehensive (loss) income for 2019 . . . . . . . . — — — (9,886) 9,390 (280,601) (3,852) (284,949)Share-based compensation . . . . . . . . . . . . . . . — — 4,879 — — — — 4,879Distribution of 2018 income . . . . . . . . . . . . . . . — — 43,661 — — (43,661) — —Dividends paid non-controlling interests . . . . . . . . — — — — — — (97) (97)Acquisition of non-controlling interests in Ferrosolar
OPCO Group SL. and Rocas Arcillas andMinerales, S.A. . . . . . . . . . . . . . . . . . . . . . . — — (14,889) 7,100 — — 5,881 (1,908)
Balance at December 31, 2019 . . . . . . . . . . . . 170,864 1,784 975,358 (210,152) (2,169) (280,601) 118,077 602,297
Notes 1 to 30 are an integral part of the consolidated financial statements
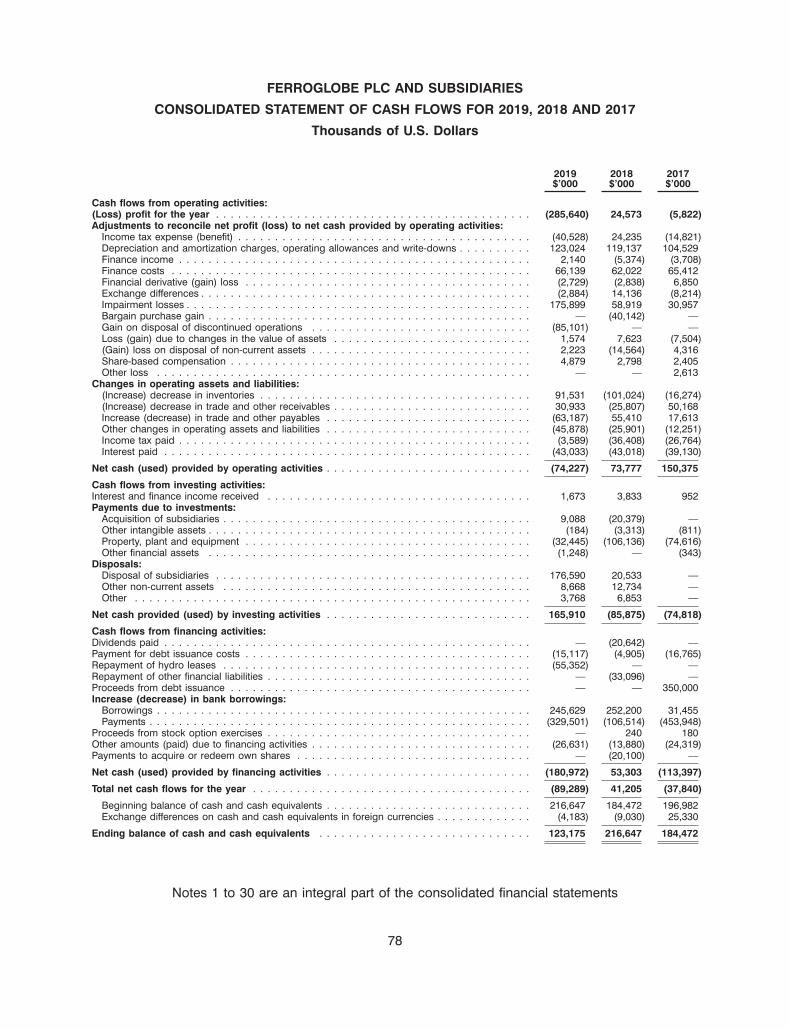
FERROGLOBE PLC AND SUBSIDIARIES
CONSOLIDATED STATEMENT OF CASH FLOWS FOR 2019, 2018 AND 2017
Thousands of U.S. Dollars
2019 2018 2017$’000 $’000 $’000
Cash flows from operating activities:(Loss) profit for the year . . . . . . . . . . . . . . . . . . . . . . . . . . . . . . . . . . . . . . . . . . . (285,640) 24,573 (5,822)Adjustments to reconcile net profit (loss) to net cash provided by operating activities:
Income tax expense (benefit) . . . . . . . . . . . . . . . . . . . . . . . . . . . . . . . . . . . . . . . . (40,528) 24,235 (14,821)Depreciation and amortization charges, operating allowances and write-downs . . . . . . . . . . 123,024 119,137 104,529Finance income . . . . . . . . . . . . . . . . . . . . . . . . . . . . . . . . . . . . . . . . . . . . . . . . 2,140 (5,374) (3,708)Finance costs . . . . . . . . . . . . . . . . . . . . . . . . . . . . . . . . . . . . . . . . . . . . . . . . . 66,139 62,022 65,412Financial derivative (gain) loss . . . . . . . . . . . . . . . . . . . . . . . . . . . . . . . . . . . . . . . (2,729) (2,838) 6,850Exchange differences . . . . . . . . . . . . . . . . . . . . . . . . . . . . . . . . . . . . . . . . . . . . . (2,884) 14,136 (8,214)Impairment losses . . . . . . . . . . . . . . . . . . . . . . . . . . . . . . . . . . . . . . . . . . . . . . . 175,899 58,919 30,957Bargain purchase gain . . . . . . . . . . . . . . . . . . . . . . . . . . . . . . . . . . . . . . . . . . . . — (40,142) —Gain on disposal of discontinued operations . . . . . . . . . . . . . . . . . . . . . . . . . . . . . . (85,101) — —Loss (gain) due to changes in the value of assets . . . . . . . . . . . . . . . . . . . . . . . . . . . 1,574 7,623 (7,504)(Gain) loss on disposal of non-current assets . . . . . . . . . . . . . . . . . . . . . . . . . . . . . . 2,223 (14,564) 4,316Share-based compensation . . . . . . . . . . . . . . . . . . . . . . . . . . . . . . . . . . . . . . . . . 4,879 2,798 2,405Other loss . . . . . . . . . . . . . . . . . . . . . . . . . . . . . . . . . . . . . . . . . . . . . . . . . . . — — 2,613
Changes in operating assets and liabilities:(Increase) decrease in inventories . . . . . . . . . . . . . . . . . . . . . . . . . . . . . . . . . . . . . 91,531 (101,024) (16,274)(Increase) decrease in trade and other receivables . . . . . . . . . . . . . . . . . . . . . . . . . . . 30,933 (25,807) 50,168Increase (decrease) in trade and other payables . . . . . . . . . . . . . . . . . . . . . . . . . . . . (63,187) 55,410 17,613Other changes in operating assets and liabilities . . . . . . . . . . . . . . . . . . . . . . . . . . . . (45,878) (25,901) (12,251)Income tax paid . . . . . . . . . . . . . . . . . . . . . . . . . . . . . . . . . . . . . . . . . . . . . . . . (3,589) (36,408) (26,764)Interest paid . . . . . . . . . . . . . . . . . . . . . . . . . . . . . . . . . . . . . . . . . . . . . . . . . . (43,033) (43,018) (39,130)
Net cash (used) provided by operating activities . . . . . . . . . . . . . . . . . . . . . . . . . . . . (74,227) 73,777 150,375
Cash flows from investing activities:Interest and finance income received . . . . . . . . . . . . . . . . . . . . . . . . . . . . . . . . . . . . 1,673 3,833 952Payments due to investments:
Acquisition of subsidiaries . . . . . . . . . . . . . . . . . . . . . . . . . . . . . . . . . . . . . . . . . . 9,088 (20,379) —Other intangible assets . . . . . . . . . . . . . . . . . . . . . . . . . . . . . . . . . . . . . . . . . . . . (184) (3,313) (811)Property, plant and equipment . . . . . . . . . . . . . . . . . . . . . . . . . . . . . . . . . . . . . . . (32,445) (106,136) (74,616)Other financial assets . . . . . . . . . . . . . . . . . . . . . . . . . . . . . . . . . . . . . . . . . . . . (1,248) — (343)
Disposals:Disposal of subsidiaries . . . . . . . . . . . . . . . . . . . . . . . . . . . . . . . . . . . . . . . . . . . 176,590 20,533 —Other non-current assets . . . . . . . . . . . . . . . . . . . . . . . . . . . . . . . . . . . . . . . . . . 8,668 12,734 —Other . . . . . . . . . . . . . . . . . . . . . . . . . . . . . . . . . . . . . . . . . . . . . . . . . . . . . . 3,768 6,853 —
Net cash provided (used) by investing activities . . . . . . . . . . . . . . . . . . . . . . . . . . . . 165,910 (85,875) (74,818)
Cash flows from financing activities:Dividends paid . . . . . . . . . . . . . . . . . . . . . . . . . . . . . . . . . . . . . . . . . . . . . . . . . . — (20,642) —Payment for debt issuance costs . . . . . . . . . . . . . . . . . . . . . . . . . . . . . . . . . . . . . . . (15,117) (4,905) (16,765)Repayment of hydro leases . . . . . . . . . . . . . . . . . . . . . . . . . . . . . . . . . . . . . . . . . . (55,352) — —Repayment of other financial liabilities . . . . . . . . . . . . . . . . . . . . . . . . . . . . . . . . . . . . — (33,096) —Proceeds from debt issuance . . . . . . . . . . . . . . . . . . . . . . . . . . . . . . . . . . . . . . . . . — — 350,000Increase (decrease) in bank borrowings:
Borrowings . . . . . . . . . . . . . . . . . . . . . . . . . . . . . . . . . . . . . . . . . . . . . . . . . . . 245,629 252,200 31,455Payments . . . . . . . . . . . . . . . . . . . . . . . . . . . . . . . . . . . . . . . . . . . . . . . . . . . . (329,501) (106,514) (453,948)
Proceeds from stock option exercises . . . . . . . . . . . . . . . . . . . . . . . . . . . . . . . . . . . . — 240 180Other amounts (paid) due to financing activities . . . . . . . . . . . . . . . . . . . . . . . . . . . . . . (26,631) (13,880) (24,319)Payments to acquire or redeem own shares . . . . . . . . . . . . . . . . . . . . . . . . . . . . . . . . — (20,100) —
Net cash (used) provided by financing activities . . . . . . . . . . . . . . . . . . . . . . . . . . . . (180,972) 53,303 (113,397)
Total net cash flows for the year . . . . . . . . . . . . . . . . . . . . . . . . . . . . . . . . . . . . . . (89,289) 41,205 (37,840)
Beginning balance of cash and cash equivalents . . . . . . . . . . . . . . . . . . . . . . . . . . . . 216,647 184,472 196,982Exchange differences on cash and cash equivalents in foreign currencies . . . . . . . . . . . . . (4,183) (9,030) 25,330
Ending balance of cash and cash equivalents . . . . . . . . . . . . . . . . . . . . . . . . . . . . . 123,175 216,647 184,472
Notes 1 to 30 are an integral part of the consolidated financial statements
78

Ferroglobe PLC and Subsidiaries
Notes to the Consolidated Financial Statements
December 31, 2019, 2018 and 2017
(U.S. Dollars in thousands, except share and per share data)
1. General information
Ferroglobe PLC and subsidiaries (the ‘‘Company’’ or ‘‘Ferroglobe’’) is among the world’slargest producers of silicon metal and silicon-based alloys, important ingredients in a variety ofindustrial and consumer products. The Company’s customers include major silicone chemical,aluminum and steel manufacturers, auto companies and their suppliers, ductile iron foundries,manufacturers of photovoltaic solar cells and computer chips, and concrete producers. Additionally,the Company has been operating hydroelectric plants (hereinafter ‘‘energy business’’) in Spain untilAugust 30, 2019 and France.
Ferroglobe PLC (the ‘‘Parent Company’’ or ‘‘the Parent’’) is a public limited company that wasincorporated in the United Kingdom on February 5, 2015 (formerly named ‘Velonewco Limited’). TheParent’s registered office is 5 Fleet Place, London (United Kingdom).
On December 23, 2015, Ferroglobe PLC consummated the acquisition (‘‘BusinessCombination’’) of Globe Specialty Metals, Inc. and subsidiaries (‘‘GSM’’ or ‘‘Globe’’) and GrupoFerroAtlantica, S.A.U. (‘‘FerroAtlantica’’).
Presentation of results of Spanish energy business
As described in Note 29 of these financial statements, on June 2, 2019 the Company enteredinto an agreement with Kehlen Industries Management, S.L., a wholly-owned subsidiary of TSSPAdjacent Opportunities Partners, L.P., for the sale of the entire share capital of FerroAtlantica, S.A.U(‘‘FAU’’), the owner and operator of the Group’s hydro-electric assets in Galicia, Spain (the‘‘Spanish Hydro-electric Business’’) and its smelting facility at Cee-Dumbria and effectively sold atAugust 30, 2019. The Spanish Hydroelectric Business was classified as disposal group held for saleand accounted for as a discontinued operation in the second quarter of 2019. Accordingly, theresults of Spanish energy business are presented as discontinuing operations for the year endedDecember 31, 2019 and the consolidated income statement for the prior years ended 2018 and2017 have been restated to reclassify the results of the Company’s Spanish hydro-electric plants orassets within profit (loss) for the year from discontinued operations.
2. Organization and Subsidiaries
Ferroglobe has a diversified production base consisting of production facilities across theNorth America, Europe, South America, South Africa and Asia.
The subsidiaries of Ferroglobe as of December 31, 2019, classified by business activity, wereas follows:
Percentageof
OwnershipDirect Total Line of Business Registered
Alabama Sand and Gravel, Inc. . . . . . . . — 100.0 Electrometallurgy — North America Delaware — USAAlden Resources, LLC . . . . . . . . . . . . . — 100.0 Electrometallurgy — North America Delaware — USAAlden Sales Corporation, LLC . . . . . . . . . — 100.0 Electrometallurgy — North America Delaware — USAARL Resources, LLC . . . . . . . . . . . . . . . — 100.0 Electrometallurgy — North America Delaware — USA
79

Ferroglobe PLC and Subsidiaries
Notes to the Consolidated Financial Statements (Continued)
December 31, 2019, 2018 and 2017
(U.S. Dollars in thousands, except share and per share data)
2. Organization and Subsidiaries (Continued)
Percentageof
OwnershipDirect Total Line of Business Registered
ARL Services, LLC . . . . . . . . . . . . . . . . — 100.0 Electrometallurgy — North America Delaware — USACore Metals Group Holdings, LLC . . . . . . — 100.0 Electrometallurgy — North America Delaware — USACore Metals Group, LLC . . . . . . . . . . . . — 100.0 Electrometallurgy — North America Delaware — USAGatliff Services, LLC . . . . . . . . . . . . . . . — 100.0 Electrometallurgy — North America Delaware — USAGlobe Metallurgical Inc. . . . . . . . . . . . . — 100.0 Electrometallurgy — North America Delaware — USAGlobe Metals Enterprises, Inc. . . . . . . . . — 100.0 Electrometallurgy — North America Delaware — USAGSM Alloys I, Inc. . . . . . . . . . . . . . . . . — 100.0 Electrometallurgy — North America Delaware — USAGSM Alloys II, Inc. . . . . . . . . . . . . . . . . — 100.0 Electrometallurgy — North America Delaware — USAGSM Enterprises Holdings, Inc. . . . . . . . — 100.0 Electrometallurgy — North America Delaware — USAGSM Enterprises, LLC . . . . . . . . . . . . . . — 100.0 Electrometallurgy — North America Delaware — USAGSM Sales, Inc. . . . . . . . . . . . . . . . . . — 100.0 Electrometallurgy — North America Delaware — USALF Resources, Inc. . . . . . . . . . . . . . . . — 100.0 Electrometallurgy — North America Delaware — USAMetallurgical Process Materials, LLC . . . . — 100.0 Electrometallurgy — North America Delaware — USANorchem, Inc. . . . . . . . . . . . . . . . . . . . — 100.0 Electrometallurgy — North America Florida — USAQSIP Canada ULC . . . . . . . . . . . . . . . . — 100.0 Electrometallurgy — North America CanadaQuebec Silicon General Partner . . . . . . . — 51.0 Electrometallurgy — North America CanadaQuebec Silicon Limited Partnership . . . . . — 51.0 Electrometallurgy — North America CanadaTennessee Alloys Company, LLC . . . . . . . — 100.0 Electrometallurgy — North America Delaware — USAWest Virginia Alloys, Inc. . . . . . . . . . . . . — 100.0 Electrometallurgy — North America Delaware — USAWVA Manufacturing, LLC . . . . . . . . . . . . — 51.0 Electrometallurgy — North America Delaware — USACuarzos Industriales, S.A.U. . . . . . . . . . — 100.0 Electrometallurgy — Europe A Coruna — SpainFerroatlantica del Cinca, S.L. . . . . . . . . . — 99.9 Electrometallurgy — Europe Madrid — SpainFerroatlantica de Sabon, S.L.U.(1) . . . . . . — 100.0 Electrometallurgy — Europe Madrid — SpainFerroatlantica de Boo, S.L.U.(1) . . . . . . . . — 100.0 Electrometallurgy — Europe Madrid — SpainFerroglobe Mangan Norge AS . . . . . . . . — 100.0 Electrometallurgy — Europe NorwayFerroglobe Manganese France SAS . . . . . — 100.0 Electrometallurgy — Europe FranceFerroPem, S.A.S. . . . . . . . . . . . . . . . . — 100.0 Electrometallurgy — Europe FranceFerrous Receivables DAC.(1) . . . . . . . . . . — 100.0 Electrometallurgy — Europe IrelandGrupo FerroAtlantica, S.A.U . . . . . . . . . . 100 100.0 Electrometallurgy — Europe Madrid — SpainIslenska Kisilfelagio EHF (Icelandic Silicon
Corp.) . . . . . . . . . . . . . . . . . . . . . . . — 20.1 Electrometallurgy — Europe IrelandKintuck (France) SAS . . . . . . . . . . . . . . — 100.0 Electrometallurgy — Europe FranceKintuck AS . . . . . . . . . . . . . . . . . . . . . — 100.0 Electrometallurgy — Europe NorwayRocas, Arcillas y Minerales, S.A. . . . . . . — 100.0 Electrometallurgy — Europe A Coruna — SpainRebone Mining (Pty.), Ltd. . . . . . . . . . . . — 74.0 Electrometallurgy — South Africa Polokwane — South
AfricaSilicon Smelters (Pty.), Ltd. . . . . . . . . . . — 100.0 Electrometallurgy — South Africa Polokwane — South
AfricaSilicon Technology (Pty.), Ltd. . . . . . . . . — 100.0 Electrometallurgy — South Africa South AfricaThaba Chueu Mining (Pty.), Ltd. . . . . . . . — 74.0 Electrometallurgy — South Africa Polokwane — South
Africa16 Front Street, LLC . . . . . . . . . . . . . . . — 100.0 Other segments Delaware — USAActifs Solaires Becancour, Inc . . . . . . . . . — 100.0 Other segments CanadaCuarzos Indus. de Venezuela
(Cuarzoven), S.A. . . . . . . . . . . . . . . . — 100.0 Other segments VenezuelaEmix, S.A.S. . . . . . . . . . . . . . . . . . . . . — 100.0 Other segments FranceECPI, Inc. . . . . . . . . . . . . . . . . . . . . . — 100.0 Other segments Delaware — USA
80

Ferroglobe PLC and Subsidiaries
Notes to the Consolidated Financial Statements (Continued)
December 31, 2019, 2018 and 2017
(U.S. Dollars in thousands, except share and per share data)
2. Organization and Subsidiaries (Continued)
Percentageof
OwnershipDirect Total Line of Business Registered
Ferroatlantica de Mexico, S.A. de C.V. . . . — 100.0 Other segments Nueva Leon —Mexico
Ferroatlantica de Venezuela(FerroVen), S.A. . . . . . . . . . . . . . . . . — 99.9 Other segments Venezuela
Ferroatlantica Deutschland, GmbH . . . . . — 100.0 Other segments GermanyFerroatlantica do Brasil Mineracao Ltda. . — 70.0 Other segments BrazilFerroatlantica I+D, S.L.U. . . . . . . . . . . . — 100.0 Other segments Madrid — SpainFerroatlantica Participaciones, S.L.U.(1) . . . — 100.0 Other segments Madrid — SpainFerroAtlantica International Ltd(2) . . . . . . . — 100.0 Other segments United KingdomFerroglobe Services (UK) PLC(2) . . . . . . . 100 100.0 Other segments United KingdomFerroManganese Mauritania SARL . . . . . . — 90.0 Other segments MauritaniaFerroquartz Holdings, Ltd (Hong Kong) . . — 100.0 Other segments Hong KongFerroQuartz Mauritania SARL . . . . . . . . . — 90.0 Other segments MauritaniaFerrosolar OPCO Group SL. . . . . . . . . . — 100.0 Other segments SpainFerrosolar R&D SL. . . . . . . . . . . . . . . . — 50.0 Other segments SpainFerroTambao, SARL . . . . . . . . . . . . . . . — 90.0 Other segments Burkina FasoGBG Financial LLC . . . . . . . . . . . . . . . . — 100.0 Other segments Delaware — USAGBG Holdings, LLC . . . . . . . . . . . . . . . — 100.0 Other segments Delaware — USAGlobe Argentina Holdco, LLC . . . . . . . . . — 100.0 Other segments Delaware — USAGlobe BG, LLC . . . . . . . . . . . . . . . . . . — 100.0 Other segments Delaware — USAGlobe LSE, Inc. . . . . . . . . . . . . . . . . . — 100.0 Other segments Delaware — USAGlobe Metales S.R.L. . . . . . . . . . . . . . . — 100.0 Other segments ArgentinaGlobe Metallurgical Carbon, LLC . . . . . . . — 100.0 Other segments Delaware — USAGlobe Specialty Metals, Inc. . . . . . . . . . 100 100.0 Other segments Delaware — USAGrupo FerroAtlantica de Servicios, S.L.U.(1) — 100.0 Other segments Madrid — SpainGSM Financial, Inc. . . . . . . . . . . . . . . . — 100.0 Other segments Delaware — USAGSM Netherlands, BV . . . . . . . . . . . . . . — 100.0 Other segments NetherlandsHidroelectricite de Saint Beron, S.A.S(1) . . — 100.0 Other segments FranceLaurel Ford Resources, Inc. . . . . . . . . . . — 100.0 Other segments Delaware — USAMangshi FerroAtlantica Mining Indus.
Serv. Ltd . . . . . . . . . . . . . . . . . . . . . — 100.0 Other segments Mangshi, Dehong-Yunnan -China
Mangshi Sinice Silicon Industry CompanyLimited . . . . . . . . . . . . . . . . . . . . . . — 100.0 Other segments Mangshi, Dehong
-Yunnan -ChinaMST Financial Holdings, LLC . . . . . . . . . — 100.0 Other segments Delaware — USAMST Financial, LLC . . . . . . . . . . . . . . . — 100.0 Other segments Delaware — USAMST Resources, LLC . . . . . . . . . . . . . . — 100.0 Other segments Delaware — USANingxia Yonvey Coal Industrial Co., Ltd. . . — 98.0 Other segments ChinaPhotosil Industries, SAS . . . . . . . . . . . . — 100.0 Other segments FranceSilicio Ferrosolar, SLU . . . . . . . . . . . . . . — 100.0 Other segments SpainSolsil, Inc. . . . . . . . . . . . . . . . . . . . . . — 92.4 Other segments Delaware — USAUltracore Energy SA . . . . . . . . . . . . . . . — 100.0 Other segments Argentina
(1) Entered into the scope of consolidation during 2019.(2) These UK subsidiaries will take advantage of the audit exemption set out within section 479A of the Companies Act
2006 for the year ended 31 December 2019. The registered number of Ferroglobe Services (UK) Ltd is 10013945 andFerroAtlantica International Limited is 09150581.
81
Ferroglobe PLC and Subsidiaries
Notes to the Consolidated Financial Statements (Continued)
December 31, 2019, 2018 and 2017
(U.S. Dollars in thousands, except share and per share data)
2. Organization and Subsidiaries (Continued)
Subsidiaries are all companies over which Ferroglobe has control.
Control is achieved when the Company:
• has power over the investee;
• is exposed, or has rights, to variable returns from its involvement with the investee; and
• has the ability to use its power over the investee to affect the amount of the investor’sreturns.
The Company has power over the investee when the voting rights are sufficient to give it thepractical ability to direct the relevant activities of the investee unilaterally. The Company considersall relevant facts and circumstances in assessing whether or not the Company’s voting rights in aninvestee are sufficient to give it power, including:
• the total voting rights held by the Company relative to the size and dispersion of holdings ofthe other vote holders;
• potential voting rights held by the Company, other vote holders or other parties;
• rights arising from other contractual arrangements; and
• any additional facts and circumstances that indicate that the Company has, or does nothave, the current ability to direct the relevant activities at the time these decisions need tobe made, including voting patterns at previous shareholders’ meetings.
Consolidation of a subsidiary begins when the Company obtains control over the subsidiaryand ceases when the Company loses control of the subsidiary.
The Company uses the acquisition method to account for the acquisition of subsidiaries.According to this method, the consideration transferred for the acquisition of a subsidiarycorresponds to the fair value of the assets transferred, the liabilities incurred and the equity interestsissued by the Company. The consideration transferred also includes the fair value of any asset orliability resulting from a contingent consideration arrangement. Any contingent considerationtransferred by the Company is recognized at fair value at the date of acquisition. Subsequentchanges in the fair value of the contingent consideration classified as an asset or a liability arerecognized in accordance with IAS 39 either in the income statement or in the statement ofcomprehensive (loss) income. The costs related to the acquisition are recognized as expenses inthe years incurred. The identifiable assets acquired and the liabilities and contingent liabilitiesassumed in a business combination are initially recognized at their fair value at the date ofacquisition. The Company recognizes any non-controlling interest in the acquiree at thenon-controlling interest’s proportionate share of the acquiree’s identifiable net assets.
Profit or loss for the period and each component of other comprehensive (loss) income areattributed to the owners of the Company and to the non-controlling interests. The Companyattributes total comprehensive (loss) income to the owners of the Company and to the
82

Ferroglobe PLC and Subsidiaries
Notes to the Consolidated Financial Statements (Continued)
December 31, 2019, 2018 and 2017
(U.S. Dollars in thousands, except share and per share data)
2. Organization and Subsidiaries (Continued)
non-controlling interests even if the profit or loss of the non-controlling interests gives rise to abalance receivable.
All assets and liabilities, equity, income, expenses and cash flows relating to transactionsbetween subsidiaries are eliminated in full in consolidation.
3. Basis of presentation and basis of consolidation
3.1 Basis of presentation
These consolidated financial statements have been issued in accordance with InternationalFinancial Reporting Standards as issued by the International Accounting Standards Board andinterpretations issued by the International Financial Reporting Interpretations Committee (collectively‘‘IFRS’’).
All accounting policies and measurement bases with effect on the consolidated financialstatements were applied in their preparation.
The consolidated financial statements were prepared on a historical cost basis, with theexceptions disclosed in the notes to the consolidated financial statements, where applicable, and inthose situations where IFRS requires that financial assets and financial liabilities are valued at fairvalue.
The accompanying consolidated financial statements for the year ended December 31, 2019have been prepared on a going concern basis, which contemplates the realization of assets andsettlement of liabilities in the normal course of business. In connection with the preparation of ourconsolidated financial statements, we conducted an evaluation as to whether there were conditionsand events, considered in the aggregate, which raised substantial doubt as to the entity’s ability tocontinue as a going concern within one year after the date of the issuance of our consolidatedfinancial statements. As of December 31, 2019, as reflected in our consolidated financialstatements, the Company had cash and cash equivalents of $123.2 million, of which $28.3 isrestricted. The Company had an operating loss of $355.6 million and a net loss of $285.6 million forthe year ended December 31, 2019.
Our business has historically been subject to fluctuations in the prices of our products and themarket demand for them, caused by general and regional economic cycles, raw material and energyprice fluctuations, competition and other factors. During the second half of 2018 and throughout2019, we experienced the most dramatic decline in prevailing prices of our products, which adverselyaffected our results. The timing, magnitude and duration of these cycles and the resulting pricefluctuations are difficult to predict. Prior to the uncertainties described in this note managementassessed that the Company had adequate financial resources, albeit with limited cash headroom, tooperate as a going concern in the forthcoming twelve months. Management continue to closelymonitor operating cash flows, and are pursuing additional sources of financing to increase liquidity tofund operations. At this time, however, additional financing has not been secured.
83

Ferroglobe PLC and Subsidiaries
Notes to the Consolidated Financial Statements (Continued)
December 31, 2019, 2018 and 2017
(U.S. Dollars in thousands, except share and per share data)
3. Basis of presentation and basis of consolidation (Continued)
In early 2020, the outbreak of coronavirus disease (‘‘COVID-19’’) in China spread to otherjurisdictions, including locations where the Company conducts business. As of the date of theissuance of the consolidated financial statements, the COVID-19 outbreak has not yet had amaterial effect on the Company’s liquidity or financial position. Management continue to monitor theimpact that the COVID-19 pandemic is having on the Company, the specialty chemical industry andthe economies in which the Company operates. Given the speed and frequency of continuouslyevolving developments with respect to this pandemic and the uncertainties this may bring for theCompany and the demand for its products it is difficult to forecast the level of trading activities andhence cash flow in the next twelve months. Management have developed an impact assessment tostress test and assess potential responses to a downside scenario. The assessment involvesapplication of key assumptions around market demand and prices, including the extent of thedecrease that might be experienced in summer 2020 and the subsequent timing and level ofrecovery. Additionally, judgment is required around the level and extent of mitigating actions suchas reductions in operating costs and capital expenditure. Developing a reliable estimate of thepotential impact on the results of operations and cash flow at this time is difficult as markets andindustries react to the pandemic and the measures implemented in response to it, but thedownside scenario analysis supports an expectation that the Company will have cash headroom tocontinue to operate throughout the following twelve months. The key assumption underlying thisassessment is a recovery in forecast trading activity in the latter part of 2020.
Additionally, as discussed in Note 27, the Indenture governing the Notes includes provisionswhich, in the event of a change of control, would require the Company to offer to redeem theoutstanding senior Notes at a cash purchase price equal to 101% of the principal amount of theNotes, plus any accrued and unpaid interest. GVM currently owns approximately 54% of theCompany’s voting stock, and a significant majority of GVM’s shares in the Company are pledged ascollateral for GVM’s obligations to certain of its lenders. A change of control may occur if a personother than a Permitted Holder (as defined in Note 27) were to acquire 35% or more of theCompany’s outstanding shares at a time when the Permitted Holders held an equal or lesserpercentage. While GVM maintains its current shareholding, a change of control cannot occur.Based on the provisions cited above, a change of control as defined in the Indenture is unlikely tooccur but the matter it is beyond the Company’s control. If a change of control were to occur, thecompany may not have sufficient financial resources available to satisfy all of its obligations.
Management acknowledges that the material uncertainties, previously described, the mostsignificant in value terms being the potential repayment of the outstanding balance of the SeniorNotes should there be a change of control, raise substantial doubt as to the ability of the Companyto continue as a going concern for a period of twelve months following the date our consolidatedfinancial statements are issued. Nevertheless, as described above, management believes that theGroup has adequate resources to continue in operational existence for the foreseeable future. Theconsolidated financial statements do not include any adjustments that might be necessary if theCompany is unable to continue as going concern.
84
Ferroglobe PLC and Subsidiaries
Notes to the Consolidated Financial Statements (Continued)
December 31, 2019, 2018 and 2017
(U.S. Dollars in thousands, except share and per share data)
3. Basis of presentation and basis of consolidation (Continued)
3.2 International financial reporting standards
Application of new accounting standards
New and amended standards and interpretations adopted by the Company
Standards, interpretations and amendments effective from January 1, 2019, applied by theCompany in the preparation of these consolidated financial statements:
• IFRS 9 (Amendment) ‘Financial Instruments’
• IFRS 16 ‘Leases’
• IAS 19 (Amendment) ‘ Employee Benefits’
• IAS 28 (Amendment) ‘Interests in Associates and Joint Ventures’
• IFRIC Interpretation 23 ‘Uncertainty over Income Tax Treatments’
• Annual improvements cycle to IFRS 2015-2017
The impacts of applying IFRS 16 for the first time is discussed further below. The applicationsof the other amendments and interpretations above did not have an impact on the consolidatedfinancial statements of the Company. The Company has not early adopted any standards,interpretations or amendments that have been issued but are not yet effective.
Adoption of IFRS 16 — Leases
IFRS 16 Leases replaces the existing standard on accounting for leases, IAS 17, and therelated interpretations. The Company applied the standard from its mandatory adoption date ofJanuary 1, 2019 and transitioned to the standard in accordance with the modified retrospectiveapproach; the prior year figures have not been adjusted. The Company elected the practicalexpedient in paragraph IFRS 16:C3 that permits an entity not to reassess whether a contract is, orcontains, a lease at the date of initial application.
85

Ferroglobe PLC and Subsidiaries
Notes to the Consolidated Financial Statements (Continued)
December 31, 2019, 2018 and 2017
(U.S. Dollars in thousands, except share and per share data)
3. Basis of presentation and basis of consolidation (Continued)
IFRS 16 has had the following effect on components of the consolidated financial statements:
January 1,2019$’000
Operating lease obligations at December 31, 2018 . . . . . . . . . . . . . 31,263Minimum lease payments on finance lease liabilities at
December 31, 2018 . . . . . . . . . . . . . . . . . . . . . . . . . . . . . . . . . . 74,918
Gross lease liabilities at January 1, 2019 . . . . . . . . . . . . . . . . . . . . . 106,181Discounting . . . . . . . . . . . . . . . . . . . . . . . . . . . . . . . . . . . . . . . . . . 9,238
Lease liabilities at January 1, 2019 . . . . . . . . . . . . . . . . . . . . . . . . . 96,943Present value of finance lease liabilities at December 31, 2018 . . . . . 66,471
Additional lease liabilities as a result of the initial application ofIFRS 16 as at January 1, 2019 . . . . . . . . . . . . . . . . . . . . . . . . . . 30,472
2019$’000
Balance at December 31, 2018 . . . . . . . . . . . . . . . . . . . . . . . . . . . . . (66,471)Adoption of IFRS 16 . . . . . . . . . . . . . . . . . . . . . . . . . . . . . . . . . . . . . (30,472)Additions . . . . . . . . . . . . . . . . . . . . . . . . . . . . . . . . . . . . . . . . . . . . . (4,858)Disposals and other . . . . . . . . . . . . . . . . . . . . . . . . . . . . . . . . . . . . . 163Interest . . . . . . . . . . . . . . . . . . . . . . . . . . . . . . . . . . . . . . . . . . . . . . . (1,972)Lease payments . . . . . . . . . . . . . . . . . . . . . . . . . . . . . . . . . . . . . . . . 75,807Exchange differences . . . . . . . . . . . . . . . . . . . . . . . . . . . . . . . . . . . . 1,931
Balance at December 31, 2019 . . . . . . . . . . . . . . . . . . . . . . . . . . . . . (25,872)
On January 1, 2019, on adoption of IFRS 16, lease liabilities were discounted at the weightedaverage borrowing rate. The weighted average discount rate was 5.5% for the year endedDecember 31, 2019.
Leases are presented as follows in the Statement of financial position:
2019$’000
Non-current assetsLeased land and buildings . . . . . . . . . . . . . . . . . . . . . . . . . . . . . . . . . 13,298Leased plant and machinery . . . . . . . . . . . . . . . . . . . . . . . . . . . . . . . . 24,025Accumulated depreciation . . . . . . . . . . . . . . . . . . . . . . . . . . . . . . . . . . (12,386)
Non-current liabilitiesLease liabilities . . . . . . . . . . . . . . . . . . . . . . . . . . . . . . . . . . . . . . . . . . (16,972)
Current liabilitiesLease liabilities . . . . . . . . . . . . . . . . . . . . . . . . . . . . . . . . . . . . . . . . . . (8,900)
86

Ferroglobe PLC and Subsidiaries
Notes to the Consolidated Financial Statements (Continued)
December 31, 2019, 2018 and 2017
(U.S. Dollars in thousands, except share and per share data)
3. Basis of presentation and basis of consolidation (Continued)
Leases are presented as follows in the Consolidated income statement:
2019$’000
Depreciation and amortization charges, operating allowances andwrite-downs
Depreciation of right of use assets . . . . . . . . . . . . . . . . . . . . . . . . . . . . 15,098Finance costsInterest expense on lease liabilities . . . . . . . . . . . . . . . . . . . . . . . . . . . . 1,972Exchange differencesCurrency translation gains on lease liabilities . . . . . . . . . . . . . . . . . . . . . 1,931Currency translation losses on right of use assets . . . . . . . . . . . . . . . . . (2,686)
Leases are presented as follows in the Statement of cash flows:
2019$’000
Payments for:Principal . . . . . . . . . . . . . . . . . . . . . . . . . . . . . . . . . . . . . . . . . . . . . . . 73,835Interest . . . . . . . . . . . . . . . . . . . . . . . . . . . . . . . . . . . . . . . . . . . . . . . . 1,972
New and amended standards and interpretations not yet adopted
Certain new accounting standards and interpretations have been published that are notmandatory for the reporting period ended December 31, 2019 and have not been early adopted bythe Company. Standards, interpretations and amendments published by the IASB that will beeffective for periods beginning on or after January 1, 2020:
• IFRS 17 ‘Insurance Contracts’
• IFRS 3 (Amendment) ‘Definition of Business’
• IAS 1 and IAS 8 (Amendment) ‘Definition of Material’
• IAS 1 (Amendment) ‘Classification of liabilities’
• IFRS 7 and IFRS 9. Amendments regarding pre-replacement issues in the context of theIBOR reform
• Amendments to References to the Conceptual Frameworks in IFRS Standards
None of these standards or interpretations that are not yet effective are expected to have amaterial impact on the entity in the current or future reporting periods and on foreseeable futuretransactions.
87
Ferroglobe PLC and Subsidiaries
Notes to the Consolidated Financial Statements (Continued)
December 31, 2019, 2018 and 2017
(U.S. Dollars in thousands, except share and per share data)
3. Basis of presentation and basis of consolidation (Continued)
3.3 Currency
The Parent’s functional currency is the Euro. The functional currencies of subsidiaries aredetermined by the primary economic environment in which each subsidiary operates.
The reporting currency of the Company is U.S. Dollars and as such the accompanying resultsand financial position have been translated pursuant to the provisions indicated in IAS 21.
All differences arising from the aforementioned translation are recognized in equity under‘‘Translation differences.’’
Upon the disposal of a foreign operation, the translation differences relating to that operationdeferred as a separate component of consolidated equity are recognized in the consolidatedincome statement when the gain or loss on disposal is recognized.
3.4 Responsibility for the information and use of estimates
The information in these consolidated financial statements is the responsibility of Ferroglobe’smanagement.
Certain assumptions and estimates were made by management in the preparation of theseconsolidated financial statements, including:
• The impairment losses on certain assets, including property, plant and equipment andgoodwill.
• The useful life of property, plant and equipment and intangible assets.
• The fair value of certain unquoted financial assets.
• The assumptions used in the actuarial calculation of pension liabilities.
• The discount rate used to calculate the present value of certain collection rights andpayment obligations.
• Provisions for contingencies and environmental liabilities.
• The calculation of income tax and of deferred tax assets and liabilities.
The Company based its estimates and judgments on historical experience, known or expectedtrends and other factors that are believed to be reasonable under the circumstances. Actual resultsmay differ materially from these estimates. Changes in accounting estimates are applied inaccordance with IAS 8.
At the date of preparation of these consolidated financial statements no events had takenplace that might constitute a significant source of uncertainty regarding the accounting effect thatsuch events might have in future reporting periods.
88

Ferroglobe PLC and Subsidiaries
Notes to the Consolidated Financial Statements (Continued)
December 31, 2019, 2018 and 2017
(U.S. Dollars in thousands, except share and per share data)
3. Basis of presentation and basis of consolidation (Continued)
3.5 Basis of consolidation
The financial statements of the subsidiaries are fully consolidated with those of the Parent.Accordingly, all balances and effects of the transactions between consolidated companies areeliminated in consolidation.
Non-controlling interests are presented in ‘‘Equity — Non-controlling interests’’ in theconsolidated statement of financial position, separately from the consolidated equity attributable tothe Parent. The share of non-controlling interests in the profit or loss for the year is presented under‘‘Loss attributable to non-controlling interests’’ in the consolidated income statement.
When necessary, adjustments are made to the financial statements of subsidiaries to align theaccounting policies used to the accounting policies of the Company.
3.6 Critical accounting judgements and key sources of estimation uncertainty
In the application of the Company’s accounting policies, which are described in Note 4, thedirectors are required to make judgements, estimates and assumptions about the carrying amountsof assets and liabilities that are not readily apparent from other sources. The estimates andassociated assumptions are based on historical experience and other factors that are considered tobe relevant. Actual results may differ from these estimates.
The estimates and underlying assumptions are reviewed on an ongoing basis. Revisions toaccounting estimates are recognized in the period in which the estimate is revised if the revisionaffects only that period, or in the period of the revision and future periods if the revision affects bothcurrent and future periods.
Critical judgements in applying the Company’s accounting policies
The following are the critical judgements, apart from those involving estimations (which aredealt with separately below), that the directors have made in the process of applying theCompany’s accounting policies and that have the most significant effect on the amounts recognizedin financial statements.
Going concern
The accompanying consolidated financial statements for the year ended December 31, 2019have been prepared on a going concern basis (see note 3.1).
Accounts receivable securitization
On July 31, 2017, the Company entered into an accounts receivable securitization program(the ‘‘Program’’) where trade receivables held by the Company’s subsidiaries in the US, Canada,Spain and France are sold to Ferrous Receivables DAC, a special purpose entity domiciled andincorporated in Ireland (the ‘‘SPE’’). On October 11, 2019, the Company’s subsidiaries in the UnitedStates and Canada repurchased all outstanding receivables that had they had previously sold to
89

Ferroglobe PLC and Subsidiaries
Notes to the Consolidated Financial Statements (Continued)
December 31, 2019, 2018 and 2017
(U.S. Dollars in thousands, except share and per share data)
3. Basis of presentation and basis of consolidation (Continued)
the SPE so that they could form part of the borrowing base for the North American asset-basedrevolving credit facility (the ‘‘ABL Revolver’’).
Ferroglobe is now considered to have control over the SPE as it is exposed to variable returnsand has the ability to affect those returns through its power over the investee. Accordingly,Ferroglobe has consolidated the SPE with effect from September 5, 2019.
Further details of the Program and the Company’s judgements in relation to control of the SPEand derecognition of trade receivables are set out in Note 10.
Key sources of estimation of uncertainty
The key assumptions concerning the future, and other key sources of estimating uncertainty atthe reporting period that may have a significant risk of causing a material adjustment to the carryingamount of assets and liabilities within the next financial year, are discussed below.
Impairment of goodwill
Determining whether goodwill is impaired requires an estimation of the value in use of thecash-generating units to which goodwill has been allocated. Impairment testing for goodwill iscarried out at a cash-generating unit level, and the Company performs its annual impairment test atthe end of each annual reporting period (December 31). The estimate of the recoverable value ofcash-generating units requires significant judgment in the evaluation of overall market conditions,estimated future cash flows, discount rates and other factors, and are calculated based on businessplans most recently approved by the Board of Directors. The carrying amount of goodwill at thebalance sheet date was $29,702 thousand with an impairment loss of $174,008 thousandimpairment loss recorded during the period. Details of the impairment assessment and its sensitivityto changes in assumptions are set out in Note 7.
Contingent consideration arising from business combinations
Contingent consideration, resulting from business combinations, is valued at fair value at theacquisition date as part of the business combination. When the contingent consideration meets thedefinition of a financial liability, it is subsequently remeasured to fair value at each reporting date.The determination of the fair value is based on discounted cash flows.
The Company has a contingent consideration arrangement with the former owners of Kintuck(France) SAS and Kintuck AS based on a sliding scale commission based on the silicomanganeseand ferromanganese sales spreads of Ferroglobe Mangan Norge and Ferroglobe ManganeseFrance, up to a maximum amount of $60,000 thousand (undiscounted).
The contingent consideration applies to sales made up to eight and a half years from the dateof acquisition. The fair value of the contingent consideration arrangement of $21,964 thousand wasestimated by applying the income approach based on a Monte Carlo simulation considering variousscenarios of fluctuation of future manganese alloy spreads as well at the cyclicality of manganese
90

Ferroglobe PLC and Subsidiaries
Notes to the Consolidated Financial Statements (Continued)
December 31, 2019, 2018 and 2017
(U.S. Dollars in thousands, except share and per share data)
3. Basis of presentation and basis of consolidation (Continued)
alloy pricing. Future developments may require further revisions to the estimate. For furtherinformation see Note 21.
Pension obligations
The present value of pension obligations depends on a number of factors that are determinedon an actuarial basis using a number of assumptions. The assumptions used in determining the netcost (income) for pensions include the discount rate. Any changes in these assumptions will impactthe carrying amount of the pension obligations. The carrying value of the Company’s provision forpensions at December 31, 2019 was $57,729 thousand. Further details on the assumptions usedare set out in Note 15.
Provisions and contingent liabilities
In the ordinary course of its business, Ferroglobe is subject to lawsuits, investigations, claimsand proceedings, including, but not limited to, contractual disputes and employment,environmental, health and safety matters.
The Company recognizes a provision when it has a present obligation as a result of a pastevent, it is probable that an outflow of resources embodying economic benefits will be required tosettle the obligation and a reliable estimate can be made of the amount of the obligation.
Contingent liabilities are disclosed and not recognized.
Contingent liabilities may develop in a way not initially expected. Therefore, they are assessedcontinually to determine whether an outflow of resources embodying economic benefits hasbecome probable. If such an outflow becomes probable, a provision is recognized in the financialstatements in the period in which the change in probability occurs.
Provisions are disclosed in Note 15 and contingent liabilities are disclosed in Note 24.
4. Accounting policies
The principal IFRS accounting policies applied in preparing these consolidated financialstatements were in effect at the date of preparation are described below.
4.1 Goodwill
Goodwill arising on consolidation represents the excess of the cost of acquisition over theCompany’s interest in the fair value of the identifiable assets and liabilities of a subsidiary at thedate of acquisition.
Any excess of the cost of the investments in the consolidated companies over thecorresponding underlying carrying amounts acquired, adjusted at the date of first-timeconsolidation, is allocated as follows:
1. If it is attributable to specific assets and liabilities of the companies acquired, increasingthe value of the assets (or reducing the value of the liabilities) whose market values were
91

Ferroglobe PLC and Subsidiaries
Notes to the Consolidated Financial Statements (Continued)
December 31, 2019, 2018 and 2017
(U.S. Dollars in thousands, except share and per share data)
4. Accounting policies (Continued)
higher (lower) than the carrying amounts at which they had been recognized in theirbalance sheets and whose accounting treatment was similar to that of the same assets(liabilities) of the Company amortization, accrual, etc.
2. If it is attributable to specific intangible assets, recognizing it explicitly in the consolidatedstatement of financial position provided that the fair value at the date of acquisition canbe measured reliably.
3. The remaining amount is recognized as goodwill, which is allocated to one or morespecific cash-generating units.
Goodwill is only recognized when it has been acquired for consideration and represents,therefore, a payment made by the acquirer for future economic benefits from assets of the acquiredcompany that are not capable of being individually identified and separately recognized.
On disposal of a subsidiary, the attributable amount of goodwill is included in thedetermination of the gain or loss on disposal.
4.2 Other intangible assets
Other intangible assets are assets without physical substance which can be individuallyidentified either because they are separable or because they arise as a result of a legal orcontractual right or of a legal transaction or were developed by the consolidated companies. Onlyintangible assets whose value can be measured reliably and from which the Company expects toobtain future economic benefits are recognized in the consolidated statement of financial position.
Intangible assets are recognized initially at acquisition or production cost. The aforementionedcost is amortized systematically over each asset’s useful life. At each reporting date, these assetsare measured at acquisition cost less accumulated amortization and any accumulated impairmentlosses, if any. The Company reviews amortization periods and amortization methods for finite-livedintangible assets at the end of each fiscal year.
The Company’s main intangible assets are as follows:
Development expenditures
Development expenditures are capitalized if they meet the requirements of identifiability,reliability in cost measurement and high probability that the assets created will generate economicbenefits. Developmental expenditures are amortized on a straight-line basis over the useful lives ofthe assets, which are between four and ten years.
Expenditures on research activities are recognized as expenses in the years in which they areincurred.
Power supply agreements
Power supply agreements are amortized on a straight-line basis over the term in which theagreement is effective.
92
Ferroglobe PLC and Subsidiaries
Notes to the Consolidated Financial Statements (Continued)
December 31, 2019, 2018 and 2017
(U.S. Dollars in thousands, except share and per share data)
4. Accounting policies (Continued)
Rights of use
Rights of use granted are amortized on a straight-line basis over the term in which the right ofuse was granted from the date it is considered that use commenced. Rights of use are generallyamortized over a period ranging from 10 to 20 years.
Computer software
Computer software includes the costs incurred in acquiring or developing computer software,including the related installation. Computer software is amortized on a straight-line basis over two tofive years.
Computer system maintenance costs are recognized as expenses in the years in which theyare incurred.
Other intangible assets
Other intangible assets include:
• Supply agreements which are amortized in accordance with their estimated useful lives (seeNote 8).
• CO2 emissions allowances (‘‘rights held emit greenhouse gasses’’) which are not amortized,but rather are expensed when used (see Note 4.21).
4.3 Property, plant and equipment
Cost
Property, plant and equipment for our own use are initially recognized at acquisition orproduction cost and are subsequently measured at acquisition or production cost less accumulateddepreciation and any accumulated impairment losses.
When the construction and start-up of non-current assets require a substantial period of time,the borrowing costs incurred over that period are capitalized. In 2019, 2018 and 2017 no materialborrowing cost were capitalized.
The costs of expansion, modernization or improvements leading to increased productivity,capacity or efficiency or to a lengthening of the useful lives of the assets are capitalized. Repair,upkeep and maintenance expenses are recognized in the consolidated income statement for theyear in which they are incurred.
Mineral reserves are recorded at fair value at the date of acquisition. Depletion of mineralreserves is computed using the units-of-production method utilizing only proven and probablereserves (as adjusted for recoverability factors) in the depletion base.
Property, plant and equipment in the course of construction are transferred to property, plantand equipment in use at the end of the related development period.
93

Ferroglobe PLC and Subsidiaries
Notes to the Consolidated Financial Statements (Continued)
December 31, 2019, 2018 and 2017
(U.S. Dollars in thousands, except share and per share data)
4. Accounting policies (Continued)
Depreciation
The Company depreciates property, plant and equipment using the straight-line method atannual rates based on the following years of estimated useful life:
Years ofEstimatedUseful Life
Properties for own use . . . . . . . . . . . . . . . . . . . . . . . . . . . . . . . . . 25 - 50Plant and machinery . . . . . . . . . . . . . . . . . . . . . . . . . . . . . . . . . . . 8 - 20Tools . . . . . . . . . . . . . . . . . . . . . . . . . . . . . . . . . . . . . . . . . . . . . . 12.5 - 15Furniture and fixtures . . . . . . . . . . . . . . . . . . . . . . . . . . . . . . . . . . . 10 - 15Computer hardware . . . . . . . . . . . . . . . . . . . . . . . . . . . . . . . . . . . 4 - 8Transport equipment . . . . . . . . . . . . . . . . . . . . . . . . . . . . . . . . . . . 10 - 15
Land included within property, plant and equipment is considered to be an asset with anindefinite useful life and, as such, is not depreciated, but rather it is tested for impairment annually.The Company reviews residual value, useful lives, and the depreciation method for property, plantand equipment annually.
Environment
The costs arising from the activities aimed at protecting and improving the environment areaccounted for as an expense for the year in which they are incurred. When they represent additionsto property, plant and equipment aimed at minimizing the environmental impact and protecting andenhancing the environment, they are capitalized to non-current assets.
4.4 Impairment of property, plant and equipment, intangible assets and goodwill
In order to ascertain whether its assets have become impaired, the Company compares theircarrying amount with their recoverable amount at the end of the reporting period, or morefrequently if there are indications that the assets might have become impaired. Where the assetitself does not generate cash flows that are independent from other assets, the Company estimatesthe recoverable amount of the cash-generating unit to which the asset belongs.
Recoverable amount is the higher of:
• Fair value: the price that would be agreed upon by two independent parties, less estimatedcosts to sell, and
• Value in use: the present value of the future cash flows that are expected to be derived fromcontinuing use of the asset and from its ultimate disposal at the end of its useful life,discounted at a rate which reflects the time value of money and the risks specific to thebusiness to which the asset belongs.
94
Ferroglobe PLC and Subsidiaries
Notes to the Consolidated Financial Statements (Continued)
December 31, 2019, 2018 and 2017
(U.S. Dollars in thousands, except share and per share data)
4. Accounting policies (Continued)
If the recoverable amount of an asset (or cash-generating unit) is less than its carryingamount, the carrying amount of the asset is reduced to its recoverable amount, and an impairmentloss is recognized as an expense under ‘‘Impairment losses’’ in the consolidated income statement.
Where an impairment loss subsequently reverses (not permitted in the case of goodwill), thecarrying amount of the asset is increased to the revised estimate of its recoverable amount, but sothat the increased carrying amount does not exceed the carrying amount that would have beendetermined had no impairment loss been recognized for the asset in prior years. A reversal of animpairment loss is recognized as ‘‘Other income’’ in the consolidated income statement.
The basis for depreciation is the carrying amount of the assets, deemed to be the acquisitioncost less any accumulated impairment losses.
4.5 Financial instruments
Financial assets and financial liabilities are recognized in the Company’s statement of financialposition when the Company becomes a party to the contractual provisions of the instrument.
Financial assets and financial liabilities are initially measured at fair value. Transaction coststhat are directly attributable to the acquisition or issue of financial assets and financial liabilities(other than financial assets and financial liabilities at fair value through profit or loss) are added toor deducted from the fair value of the financial assets or financial liabilities, on initial recognition.Transaction costs directly attributable to the acquisition of financial assets or financial liabilities atfair value through profit or loss are recognized immediately in profit or loss.
The Company has elected to apply the limited exemption in IFRS 9 relating to classification,measurement and impairment requirements for financial instruments, and accordingly comparativeperiods have not been restated and remain in line with the previous standard IAS 39 ‘‘FinancialInstruments: Recognition and Measurement.’’
Financial assets
From January 1, 2018, the Company classifies its financial assets into the following categories:those to be measured subsequently at fair value (either through other comprehensive income orthrough profit or loss) and those to be measured at amortized cost. The classification depends onthe entity’s business model for managing the financial assets and the contractual terms of the cashflows.
Financial assets measured at amortized cost
Financial assets are classified as measured at amortized cost when they are held in abusiness model whose objective is to collect contractual cash flows and the contractual terms ofthe financial asset give rise on specific dates to cash flows that are solely payments of principal andinterest on the principal amount outstanding. Such assets are carried at amortized cost using theeffective interest method if the time value of money is significant. Gains and losses are recognizedin profit or loss when the assets are derecognized or impaired and when interest is recognized
95

Ferroglobe PLC and Subsidiaries
Notes to the Consolidated Financial Statements (Continued)
December 31, 2019, 2018 and 2017
(U.S. Dollars in thousands, except share and per share data)
4. Accounting policies (Continued)
using the effective interest method. This category of financial assets includes trade receivables,receivables from related parties and cash and cash equivalents.
Financial assets measured at fair value through other comprehensive income
Debt instruments are classified as measured at fair value through other comprehensive incomewhen they are held in a business model whose objective is achieved by both collecting contractualcash flows and selling the financial assets, and the contractual terms of the financial asset give riseon specified dates to cash flows that are solely payments of principal and interest on the principalamount outstanding. All movements in the fair value of these financial assets are taken throughother comprehensive income, except for the recognition of impairment gains or losses, interestincome calculated using the effective interest method and foreign exchange gains and losses.When the financial asset is derecognized, the cumulative fair value gain or loss previouslyrecognized in other comprehensive income is reclassified to the income statement.
Equity instruments are classified as measured at fair value through other comprehensiveincome if, on initial recognition, the Company makes an irrevocable election to designate theinstrument as at fair value through other comprehensive income. The election is made on aninstrument-by-instrument basis and is not permitted if the equity investment is held for trading. Fairvalue gains or losses on revaluation of such equity investments are recognized in othercomprehensive income and accumulated in the valuation adjustments reserve. When the equityinvestment is derecognized, there is no reclassification of fair value gains or losses previouslyrecognized in other comprehensive income to the income statement. Dividends are recognized inthe income statement when the right to receive payment is established.
Financial assets measured at fair value through profit or loss
Financial assets are classified as measured at fair value through profit or loss when the assetdoes not meet the criteria to be measured at amortized cost or at fair value through othercomprehensive income. Such assets are carried on the balance sheet at fair value with gains orlosses recognized in the income statement. This category includes loans associated with theCompany’s accounts receivable securitization program and certain equity investments in listedcompanies.
Derecognition of financial assets
The Company derecognizes a financial asset when:
• the rights to receive cash flows from the asset have expired; or
• the Company has transferred its rights to receive cash flows from the asset or has assumedan obligation to pay the received cash flows in full without material delay to a third partyunder a ‘pass-through’ arrangement; and either (a) the Company has transferredsubstantially all the risks and rewards of the asset, or (b) the Company has neither
96

Ferroglobe PLC and Subsidiaries
Notes to the Consolidated Financial Statements (Continued)
December 31, 2019, 2018 and 2017
(U.S. Dollars in thousands, except share and per share data)
4. Accounting policies (Continued)
transferred nor retained substantially all the risks and rewards of the asset, but hastransferred control of the asset.
On derecognition of a financial asset in its entirety, the difference between the asset’s carryingamount and the sum of the consideration received and receivable is recognized in profit or loss.
If the Company retains substantially all of the risks and rewards of ownership of a transferredfinancial asset, the Company continues to recognize the financial asset and also recognizes acollateralized borrowing for the proceeds received.
Impairment of financial assets
The expected credit loss model is applied for recognition and measurement of impairments infinancial assets measured at amortized cost and debt instruments held at fair value through othercomprehensive income. The loss allowance for the financial asset is measured at an amount equalto the 12-month expected credit losses. If the credit risk on the financial asset has increasedsignificantly since initial recognition, the loss allowance for the financial asset is measured at anamount equal to the lifetime expected credit losses. Changes in loss allowances are recognized inprofit and loss. For trade receivables, a simplified impairment approach is applied recognizingexpected lifetime losses from initial recognition. For this purpose, the Company has established aprovision matrix that is based on its historical credit loss experience, adjusted for forward-lookingfactors specific to the debtors and the economic environment.
The Company writes off a financial asset when there is information indicating that the debtor isin severe financial difficulty and there is no realistic prospect of recovery, e.g. when the debtor hasbeen placed under liquidation or has entered into bankruptcy proceedings, or in the case of tradereceivables, when the amounts are over two years past due, whichever occurs sooner. Financialassets written off may still be subject to enforcement activities under the Company’s recoveryprocedures, considering legal advice where appropriate. Any recoveries made are recognized inprofit or loss.
Financial liabilities
The subsequent measurement of financial liabilities depends on their classification, asdescribed below:
Financial liabilities measured at fair value through profit or loss
Financial liabilities that meet the definition of held for trading are classified as measured at fairvalue through profit or loss. Such liabilities are carried on the balance sheet at fair value with gainsor losses recognized in the income statement. This category includes contingent consideration andderivatives, other than those designated as hedging instruments in an effective hedge.
97
Ferroglobe PLC and Subsidiaries
Notes to the Consolidated Financial Statements (Continued)
December 31, 2019, 2018 and 2017
(U.S. Dollars in thousands, except share and per share data)
4. Accounting policies (Continued)
Derivatives designated as hedging instruments in an effective hedge
These derivatives are carried on the balance sheet at fair value. The treatment of gains andlosses arising from revaluation is described below in the accounting policy for derivative financialinstruments and hedging activities.
Financial liabilities measured at amortized cost
This is the category most relevant to the Company and comprises all other financial liabilities,including bank borrowings, debt instruments, financial loans from government agencies, payablesto related parties and trade and other payables.
After initial recognition, other financial liabilities are subsequently measured at amortized costusing the effective interest method. Amortized cost is calculated by considering any issue costs andany discount or premium on settlement.
Derecognition of financial liabilities
The Company derecognizes financial liabilities when, and only when, the Company’sobligations are discharged, cancelled or have expired. The difference between the carrying amountof the financial liability derecognized and the consideration paid and payable is recognized in profitor loss. When the Company exchanges with the existing lender one debt instrument into anotherone with substantially different terms, such exchange is accounted for as an extinguishment of theoriginal financial liability and the recognition of a new financial liability. Similarly, the Companyaccounts for substantial modification of terms of an existing liability or part of it as anextinguishment of the original financial liability and the recognition of a new liability. It is assumedthat the terms are substantially different if the discounted present value of the cash flows under thenew terms, including any fees paid net of any fees received and discounted using the originaleffective rate is at least 10 per cent different from the discounted present value of the remainingcash flows of the original financial liability. If the modification is not substantial, the differencebetween the carrying amount of the liability before the modification and the present value of thecash flows after modification are recognized in profit or loss as a modification gain or loss.
4.6 Derivative financial instruments and hedging activities
In order to mitigate the economic effects of exchange rate and interest rate fluctuations towhich it is exposed as a result of its business activities, the Company uses derivative financialinstruments, such as cross currency swaps and interest rate swaps.
The Company’s derivative financial instruments are set out in Note 19 to these consolidatedfinancial statements and the Company’s financial risk management policies are set out in Note 27.
Derivatives are initially recognized at fair value at the date a derivative contract is entered intoand are subsequently remeasured to their fair value at each balance sheet date. The resulting gainor loss is recognized in profit or loss immediately unless the derivative is designated and effectiveas a hedging instrument, in which event the timing of the recognition of profit or loss depends on
98
Ferroglobe PLC and Subsidiaries
Notes to the Consolidated Financial Statements (Continued)
December 31, 2019, 2018 and 2017
(U.S. Dollars in thousands, except share and per share data)
4. Accounting policies (Continued)
the nature of the hedge relationship. The gain or loss recognized in respect of derivatives that arenot designated and effective as a hedging instrument is recognized in the consolidated incomestatement in the line item financial derivative gain (loss).
A derivative with a positive fair value is recognized as a financial asset within the line itemother financial assets whereas a derivative with a negative fair value is recognized as a financialliability within the line item other financial liabilities. A derivative is presented as a non-current assetor non-current liability if the remaining maturity of the instrument is more than 12 months and it isnot expected to be realized or settled within 12 months.
Hedge accounting
The Company designates certain derivatives as cash flow hedges. For further details, seeNote 19 of the consolidated financial statements.
At the inception of the hedge relationship, the Company documents the relationship betweenthe hedging instrument and the hedged item, along with its risk management objectives and itsstrategy for undertaking the hedge transaction. Furthermore, at the inception of the hedge and onan ongoing basis, the Company documents whether the hedging instrument is effective in offsettingchanges in fair values or cash flows of the hedged item attributable to the hedged risk.
The effective portion of changes in the fair value of derivatives that are designated and qualifyas cash flow hedges is recognized in other comprehensive income. The gain or loss relating to anyineffective portion is recognized immediately in profit or loss and is included in the financialderivative gain (loss) line item.
Amounts previously recognized in other comprehensive income and accumulated in equity inthe valuation adjustments reserve are reclassified to profit or loss in the periods when the hedgeditem is recognized in profit or loss, in the same line of the income statement as the recognizedhedged item.
Hedge accounting is discontinued when the Company revokes the hedging relationship, thehedging instrument expires or is sold, terminated, or exercised, or no longer qualifies for hedgeaccounting. Any gain or loss recognized in other comprehensive income at that time isaccumulated in equity and is recognized when the forecast transaction is ultimately recognized inprofit or loss. When a forecast transaction is no longer expected to occur, the gain or lossaccumulated in equity is recognized immediately in profit or loss.
4.7 Fair value measurement
Fair value is the price that would be received to sell an asset or paid to transfer a liability in anorderly transaction between market participants at the measurement date. The fair valuemeasurement is based on the presumption that the transaction to sell the asset or transfer theliability takes place either: in the principal market for the asset or liability; or in the absence of aprincipal market, in the most advantageous market for the asset or liability.
99

Ferroglobe PLC and Subsidiaries
Notes to the Consolidated Financial Statements (Continued)
December 31, 2019, 2018 and 2017
(U.S. Dollars in thousands, except share and per share data)
4. Accounting policies (Continued)
The fair value of an asset or a liability is measured using the assumptions that marketparticipants would use when pricing the asset or liability, assuming that market participants act intheir economic best interest.
The Company uses valuation techniques that are appropriate in the circumstances and forwhich sufficient data are available to measure fair value, maximizing the use of relevant observableinputs and minimizing the use of unobservable inputs.
All assets and liabilities for which fair value is measured or disclosed in the financialstatements are categorized within the fair value hierarchy, described as follows, based on the lowestlevel input that is significant to the fair value measurement as a whole:
• Level 1 — Quoted (unadjusted) market prices in active markets for identical assets orliabilities.
• Level 2 — Valuation techniques for which the lowest level input that is significant to the fairvalue measurement is directly or indirectly observable.
• Level 3 — Valuation techniques for which the lowest level input that is significant to the fairvalue measurement is unobservable.
For those assets and liabilities measured at fair value at the balance sheet date, furtherinformation on fair value measurement is provided in Note 28.
4.8 Inventories
Inventories comprise assets (goods) which:
• Are held for sale in the ordinary course of business (finished goods); or
• Are in the process of production for such sale (work in progress); or
• Will be consumed in the production process or in the rendering of services (raw materialsand spare parts).
Inventories are stated at the lower of acquisition or production cost and net realizable value.The cost of each inventory item is generally calculated as follows:
• Raw materials, spare parts and other consumables and replacement parts: the lower ofweighted average acquisition cost and net realizable value.
• Work in progress, finished goods and semi-finished goods: the lower of production cost(which includes the cost of materials, labor costs, direct and indirect manufacturingexpenses) or net realizable value in the market.
Obsolete, defective or slow-moving inventories have been reduced to net realizable value.
Net realizable value is the estimated selling price less all the estimated costs of selling anddistribution.
100
Ferroglobe PLC and Subsidiaries
Notes to the Consolidated Financial Statements (Continued)
December 31, 2019, 2018 and 2017
(U.S. Dollars in thousands, except share and per share data)
4. Accounting policies (Continued)
The amount of any write-down of inventories (as a result of damage, obsolescence ordecrease in the selling price) to their net realizable value and all losses of inventories arerecognized as expenses in the year in which the write-down or loss occurs. Any subsequentreversals are recognized as income in the year in which they arise.
The consumption of inventories is recognized as an expense in ‘‘Cost of sales’’ in theconsolidated income statement in the period in which the revenue from their sale is recognized.
4.9 Biological assets
The Company recognizes biological assets when:
• It controls the asset as a result of past events;
• It is probable that future economic benefits associated with the asset will flow to the entity;and
• The fair value or cost of the asset can be measured reliably.
Biological assets are measured at fair value less estimated costs to sell.
The gains or losses arising on the initial recognition of a biological asset at fair value lesscosts to sell are included in the consolidated income statement for the period in which they arise.
4.10 Cash and cash equivalents
The Company classifies under ‘‘Cash and cash equivalents’’ any liquid financial assets, suchas for example cash on hand and at banks, deposits and liquid investments, that can be convertedinto cash within three months and are subject to an insignificant risk of changes in value.
4.11 Restricted cash and cash equivalents
The Company classifies under ‘‘restricted cash and cash equivalents’’ any liquid financialassets, which meet the definition of cash and cash equivalents but the use is restricted by financialagreements.
4.12 Provisions and contingencies
When preparing the consolidated financial statements, the Parent’s directors made adistinction between:
• Provisions: present obligations, either legal, contractual, constructive or assumed by theCompany, arising from past events, the settlement of which is expected to give rise to anoutflow of economic benefits the amount or timing of which are uncertain; and
• Contingent liabilities: possible obligations that arise from past events and whose existencewill be confirmed only by the occurrence or non-occurrence of one or more future eventsnot wholly within the control of the Company, or present obligations arising from past events
101

Ferroglobe PLC and Subsidiaries
Notes to the Consolidated Financial Statements (Continued)
December 31, 2019, 2018 and 2017
(U.S. Dollars in thousands, except share and per share data)
4. Accounting policies (Continued)
the amount of which cannot be estimated reliably or whose settlement is not likely to giverise to an outflow of economic benefits.
• Contingent assets: possible assets that arise from past events and whose existence will beconfirmed only by the occurrence or non-occurrence of one or more uncertain future eventsnot wholly within the control of the entity.
The consolidated financial statements include all the material provisions with respect to whichit is considered that it is probable that the obligation will have to be settled. Contingent liabilities arenot recognized in the consolidated financial statements, but rather are disclosed, as required byIAS 37 (see Note 24).
Provisions are classified as current or non-current based on the estimated period of time inwhich the obligations covered by them will have to be met. They are recognized when the liabilityor obligation giving rise to the indemnity or payment arises, to the extent that its amount can beestimated reliably.
‘‘Provisions’’ includes the provisions for pension and similar obligations assumed; provisionsfor contingencies and charges, such as for example those of an environmental nature and thosearising from litigation in progress or from outstanding indemnity payments or obligations, andcollateral and other similar guarantees provided by the Company; and provisions for medium- andlong- term employee incentives.
Contingent assets are not recognized, but are disclosed where an inflow of economic benefitsis probable. If it has become virtually certain that an inflow of economic benefits will arise, the assetand the related income are recognized in the financial statements in the period in which the changeoccurs.
Defined contribution plans
Certain employees have defined contribution plans which conform to the Spanish PensionPlans and Funds Law. The main features of these plans are as follows:
• They are mixed plans covering the benefits for retirement, disability and death of theparticipants.
• The sponsor undertakes to make monthly contributions of certain percentages of currentemployees’ salaries to external pension funds.
The annual cost of these plans is recognized under Staff costs in the consolidated incomestatement.
Defined benefit plans
IAS 19, Employee Benefits requires defined benefit plans to be accounted for:
• Using actuarial techniques to make a reliable estimate of the amount of benefits thatemployees have earned in return for their service in the current and prior periods.
102

Ferroglobe PLC and Subsidiaries
Notes to the Consolidated Financial Statements (Continued)
December 31, 2019, 2018 and 2017
(U.S. Dollars in thousands, except share and per share data)
4. Accounting policies (Continued)
• Discounting those benefits in order to determine the present value of the obligation.
• Determining the fair value of any plan assets.
• Determining the total amount of actuarial gains and losses and the amount of thoseactuarial gains and losses that must be recognized.
The amount recognized as a benefit liability arising from a defined benefit plan is the total netsum of:
• The present value of the obligations.
• Minus the fair value of plan assets (if any) out of which the obligations are to be settleddirectly.
The Company recognizes provisions for these benefits as the related rights vest and on thebasis of actuarial studies. These amounts are recognized under ‘‘Provisions’’ in the consolidatedstatement of financial position, on the basis of their expected due payment dates. All plan assetsare held separately from the rest of the Company’s assets.
Environmental provisions
Provisions for environmental obligations are estimated by analyzing each case separately andobserving the relevant legal provisions. The best possible estimate is made on the basis of theinformation available and a provision is recognized provided that the aforementioned informationsuggests that it is probable that the loss or expense will arise and it can be estimated in asufficiently reliable manner.
The balance of provisions and disclosures disclosed in Notes 15 and 24 reflects the bestestimation of the potential exposure as of the date of preparation of these financial statements.
4.13 Leases
As a lessee, the Company assesses if a contract is or contains a lease at inception of thecontract. A contract is or contains a lease if the contract conveys the right to control the use of anidentified asset for a period of time in exchange for consideration.
The Company recognizes a right-of-use asset and a lease liability at the commencement date.
The lease liability is initially measured at the present value of the minimum future leasepayments, discounted using the interest rate implicit in the lease, or, if not readily determinable, theincremental borrowing rate. Lease payments include fixed payments, variable payments, as well asany extension or purchase options, if the Company is reasonably certain to exercise these options.The lease liability is subsequently measured at amortized cost using the effective interest methodand remeasured with a corresponding adjustment to the related right-of-use asset when there is achange in future lease payments.
103

Ferroglobe PLC and Subsidiaries
Notes to the Consolidated Financial Statements (Continued)
December 31, 2019, 2018 and 2017
(U.S. Dollars in thousands, except share and per share data)
4. Accounting policies (Continued)
The right-of-use asset comprises, at inception, the initial lease liability, any initial direct costsand, when applicable, the obligations to refurbish the asset, less any incentives granted by thelessors. The right-of-use asset is subsequently depreciated, on a straight-line basis, over the leaseterm or, if the lease transfers the ownership of the underlying asset to the Company at the end ofthe lease term or, if the cost of the right-of-use asset reflects that the lessee will exercise a purchaseoption, over the estimated useful life of the underlying asset. Right-of-use assets are also subject totesting for impairment if there is an indicator for impairment.
Variable lease payments not included in the measurement of the lease liabilities are expensedto the consolidated statement of operations in the period in which the events or conditions whichtrigger those payments occur.
In the statement of financial position, right-of-use assets and lease liabilities are classified,respectively, as part of property, plant and equipment and current and non-current lease liabilities.
4.14 Current assets and liabilities
In general, assets and liabilities are classified as current or non-current based on theCompany’s operating cycle. However, in view of the diverse nature of the activities carried on by theCompany, in which the duration of the operating cycle differs from one activity to the next, ingeneral assets and liabilities expected to be settled or fall due within twelve months from the end ofthe reporting period are classified as current items and those which fall due or will be settled withinmore than twelve months are classified as non-current items.
4.15 Income taxes
Income tax expense represents the sum of current tax and deferred tax. Income tax isrecognized in the income statement except to the extent that it relates to items recognized in othercomprehensive income or directly in equity, in which case the related tax is recognized in othercomprehensive income or directly in equity.
The current income tax expense is based on domestic and international statutory income taxrates in the tax jurisdictions where the Company operates related to taxable profit for the period.The taxable profit differs from net profit as reported in the income statement because it isdetermined in accordance with the rules established by the applicable taxation authorities whichincludes temporary differences, permanent differences, and available credits and incentives.
The Company’s deferred tax assets and liabilities are provided on temporary differences at thebalance sheet date between financial reporting and the tax basis of assets and liabilities, thenapplying enacted tax rates expected to be in effect for the year in which the differences areexpected to reverse. Deferred tax assets are recognized for deductible temporary differences, carry-forward of unused tax credits and losses, to the extent that it is probable that taxable profit will beavailable against which the deductible temporary difference and carryforwards of unused tax creditsand losses can be utilized. The deferred tax assets and liabilities that have been recognized are
104

Ferroglobe PLC and Subsidiaries
Notes to the Consolidated Financial Statements (Continued)
December 31, 2019, 2018 and 2017
(U.S. Dollars in thousands, except share and per share data)
4. Accounting policies (Continued)
reassessed at the end of each reporting period in order to ascertain whether they still exist, andadjustments are made on the basis of the findings of the analyses performed.
Income tax payable is the result of applying the applicable tax rate in force to each tax-payingentity, in accordance with the tax laws in force in the country in which the entity is registered.Additionally, tax deductions and credits are available to certain entities, primarily relating to inter-company trades and tax treaties between various countries to prevent double taxation.
Income tax expense is recognized in the consolidated income statement, except to the extentthat it arises from a transaction which is recognized directly to ‘‘consolidated equity’’, in which casethe tax is recognized directly to ‘‘consolidated equity.’’
Deferred tax assets and liabilities are offset only when there is a legally enforceable right to setoff current tax assets against current tax liabilities and when the deferred tax assets and liabilitiesrelate to income taxes levied by the same taxation authority or either the same taxable entity ordifferent taxable entities where there is an intention to settle the current tax assets and liabilities ona net basis or to realize the assets and settle the liabilities simultaneously.
4.16 Foreign currency transactions
Foreign currency transactions are initially recognized in the functional currency of thesubsidiary by applying the exchange rates prevailing at the date of the transaction.
Subsequently, at each reporting date, monetary assets and liabilities denominated in foreigncurrencies are translated to the functional currency at the rates prevailing on that date.
Any exchange differences arising on settlement or translation at the closing rates of monetaryitems are recognized in the consolidated income statement for the year.
Note 4.6 details the Company’s accounting policies for these derivative financial instruments.Also, Note 27 to these consolidated financial statements details the financial risk policies ofFerroglobe.
4.17 Revenue recognition
The Company recognizes sales revenue related to the transfer of promised goods or serviceswhen control of the goods or services passes to the customer. The amount of revenue recognizedreflects the consideration to which the Company is or expects to be entitled in exchange for thosegoods or services.
In the Company’s electrometallurgy business, revenue is principally generated from the sale ofgoods, including silicon metal and silicon- and manganese-based specialty alloys. The Companymainly satisfies its performance obligations at a point in time; the amounts of revenue recognizedrelating to performance obligations satisfied over time are not significant. The point in time at whichcontrol is transferred to the buyer is determined based on the agreed delivery terms, which followIncoterms 2010 issued by International Chamber of Commerce.
105
Ferroglobe PLC and Subsidiaries
Notes to the Consolidated Financial Statements (Continued)
December 31, 2019, 2018 and 2017
(U.S. Dollars in thousands, except share and per share data)
4. Accounting policies (Continued)
In most instances, control passes and sales revenue is recognized when the product isdelivered to the vessel or vehicle on which it will be transported, the destination port or thecustomer’s premises. There may be circumstances when judgment is required based on the fiveindicators of control below.
• The customer has the significant risks and rewards of ownership and has the ability to directthe use of, and obtain substantially all of the remaining benefits from, the goods or service.
• The customer has a present obligation to pay in accordance with the terms of the salescontract.
• The customer has accepted the asset. Sales revenue may be subject to adjustment if theproduct specification does not conform to the terms specified in the sales contract, but thisdoes not impact the passing of control. Specification adjustments have been immaterialhistorically.
• The customer has legal title to the asset. The Company may retain legal title until paymentis received but this is for credit risk purposes only.
• The customer has physical possession of the asset. This indicator may be less important asthe customer may obtain control of an asset prior to obtaining physical possession, whichmay be the case for goods in transit.
Where the Company sells on ‘C’ terms (e.g., CIF, CIP, CFR and CPT), the Company isresponsible (acts as principal) for providing shipping services and, in some instances, insuranceafter the date at which control of goods passes to the customer at the loading point. The Companytherefore has separate performance obligations for freight and insurance services that are providedsolely to facilitate sale of the commodities it produces. Revenue attributable to freight and insuranceservices is not usually material.
Where the Company sells on ‘D’ terms (e.g., DDP, DAP and DAT), the Company arranges andpays for the carriage and retains the risk of the goods until delivery at an agreed destination, whereownership and control is transferred.
Where the Company sells on ‘F’ terms (e.g., FCA and FOB), the customer arranges and paysfor the main transportation. Risk and control are transferred to the customer when the goods arehanded to the carrier engaged by the customer.
The Company’s products are sold to customers under contracts which vary in tenure andpricing mechanisms. The majority of pricing terms are either fixed or index-based for monthly,quarterly or annual periods, with a smaller proportion of volumes being sold on the spot market.
Within each sales contract, each unit of product shipped is a separate performance obligation.Revenue is generally recognized at the contracted price as this reflects the stand-alone sellingprice. Sales revenue excludes any applicable sales taxes.
106

Ferroglobe PLC and Subsidiaries
Notes to the Consolidated Financial Statements (Continued)
December 31, 2019, 2018 and 2017
(U.S. Dollars in thousands, except share and per share data)
4. Accounting policies (Continued)
Physical exchanges with counterparties in the same line of business in order to facilitate salesto customers are reported net, as are sales and purchases made with a common counterparty, aspart of an arrangement similar to a physical exchange.
Revenue from the energy business is based on the power generated and put on the market atregulated prices and is recognized when the energy produced is transferred to the power network.
Interest income is recognized as the interest accrues using the effective interest rate, the ratethat exactly discounts estimated future cash receipts through the expected life of the financialinstrument to the net carrying amount of the financial asset.
Dividend income from investments is recognized when the shareholders’ right to receive thepayment is established.
4.18 Expense recognition
Expenses are recognized on an accrual basis, i.e. when the actual flow of the related goodsand services occurs, regardless of when the resulting monetary or financial flow arises.
An expense is recognized in the consolidated income statement when there is a decrease inthe future economic benefits related to a reduction of an asset, or an increase in a liability, whichcan be measured reliably. This means that an expense is recognized simultaneously with therecognition of the increase in a liability or the reduction of an asset. Additionally, an expense isrecognized immediately in the consolidated income statement when a disbursement does not giverise to future economic benefits or when the requirements for recognition as an asset are not met.Also, an expense is recognized when a liability is incurred and no asset is recognized, as in thecase of a liability relating to a guarantee.
4.19 Grants
Government grants are recognized where there is reasonable assurance that the grant will bereceived and all attached conditions will be complied with. When the grant relates to an expenseitem, it is recognized as income on a systematic basis over the periods that the related costs, forwhich it is intended to compensate, are expensed. When the grant relates to an asset, it isrecognized as income in equal amounts over the expected useful life of the related asset.
4.20 Termination benefits
Under current labour legislation, the Company is required to pay termination benefits toemployees whose employment relationship is terminated under certain conditions. The paymentsfor termination benefits, when they arise, are charged as an expense when the decision toterminate the employment relationship is taken.
107

Ferroglobe PLC and Subsidiaries
Notes to the Consolidated Financial Statements (Continued)
December 31, 2019, 2018 and 2017
(U.S. Dollars in thousands, except share and per share data)
4. Accounting policies (Continued)
4.21 CO2 emission allowances
CO2 emission allowances are measured at cost of acquisition. Allowances acquired free ofcharge under governmental schemes are initially measured at market value at the date received. Atthe same time, a grant is recognized for the same amount under ‘‘deferred income.’’
Emissions allowances are not amortized, but rather are expensed when used.
At year end, the Company assesses whether the carrying amount of the allowances exceedstheir market value in order to determine whether there are indicators of impairment. If there aresuch indicators, the Company determines whether these allowances will be used in the productionprocess or earmarked for sale, in which case the necessary impairment losses would berecognized. Provisions are released when the factors leading to the valuation adjustment haveceased to exist.
A provision for liabilities and charges is recognized for expenses related to the emission ofgreenhouse gases. This provision is maintained until the company is required to settle the liabilityby surrendering the corresponding emission allowances. These expenses are accrued asgreenhouse gases are emitted.
When an expense is recognized for allowances acquired free of charge, the corresponding‘‘deferred income’’ is taken to operating income. The Company derecognizes allowancessurrendered at their carrying amount and recognizes those received at their fair value whenreceived. The difference between both values is recognized as ‘‘deferred income.’’
4.22 Share-based compensation
The Company recognizes share-based compensation expense based on the estimated grantdate fair value of share-based awards using a Black-Scholes option pricing model. Prior to vesting,cumulative compensation cost equals the proportionate amount of the award earned to date. TheCompany has elected to treat each award as a single award and recognize compensation cost ona straight-line basis over the requisite service period of the entire award. If the terms of an awardare modified in a manner that affects both the fair value and vesting of the award, the total amountof remaining unrecognized compensation cost (based on the grant-date fair value) and theincremental fair value of the modified award are recognized over the amended vesting period.
4.23 Assets and disposal groups classified as held for sale, liabilities associated with assetsheld for sale and discontinued operations
Assets and disposal groups classified as held for sale include the carrying amount ofindividual items, disposal groups or items forming part of a business unit earmarked for disposal(discontinued operations), whose sale in their present condition is highly likely to be completedwithin one year from the reporting date. Therefore, the carrying amount of these items, which mayor may not be of a financial nature, will likely be recovered through the proceeds from theirdisposal.
108

Ferroglobe PLC and Subsidiaries
Notes to the Consolidated Financial Statements (Continued)
December 31, 2019, 2018 and 2017
(U.S. Dollars in thousands, except share and per share data)
4. Accounting policies (Continued)
Liabilities associated with non-current assets held for sale include the balances payable arisingfrom the assets held for sale or disposal groups and from discontinued operations.
Assets and disposal groups classified as held for sale are measured at the lower of fair valueless costs to sell and their carrying amount at the date of classification in this category. Non-currentassets held for sale are not depreciated as long as they remain in this category.
4.24 Consolidated statement of cash flows
The following terms are used in the consolidated statement of cash flows, prepared using theindirect method, with the meanings specified as follows:
1. Cash flows: inflows and outflows of cash and cash equivalents, which are short-term,highly liquid investments that are subject to an insignificant risk of changes in value.
2. Operating activities: activities constituting the object of the subsidiaries forming part ofthe consolidated Company and other activities that are not investing or financingactivities.
3. Investing activities: the acquisition and disposal of long-term assets and otherinvestments not included in cash and cash equivalents.
4. Financing activities: activities that result in changes in the size and composition of theequity and borrowings of the Company that are not operating or investing activities.
5. Business Combinations
Business combinations are accounted for using the acquisition method. The identifiable assetsacquired and liabilities assumed are recognized at their fair values at the acquisition date.Acquisition costs are recognized in profit or loss as incurred.
Goodwill is initially measured as the excess of the aggregate of the consideration transferred,the amount recognized for any non-controlling interest and the acquisition-date fair values of anypreviously held interest in the acquiree over the fair value of the identifiable assets acquired andliabilities assumed at the acquisition date. If, after reassessment, the net of the acquisition dateamounts of the identifiable assets acquired and liabilities assumed exceeds the sum of theconsideration transferred, the excess is recognized immediately in profit or loss as a bargainpurchase gain.
When the consideration transferred by the Company in a business combination includes anasset or liability resulting from a contingent consideration arrangement, the contingent considerationis measured at its acquisition-date fair value and included as part of the consideration transferred ina business combination.
Contingent consideration that is classified as equity is not remeasured at subsequent reportingdates and its subsequent settlement is accounted for within equity. Contingent consideration that isclassified as an asset or a liability is remeasured at subsequent reporting dates at fair value with the
109

Ferroglobe PLC and Subsidiaries
Notes to the Consolidated Financial Statements (Continued)
December 31, 2019, 2018 and 2017
(U.S. Dollars in thousands, except share and per share data)
5. Business Combinations (Continued)
corresponding gain or loss being recognized in profit or loss. Changes in fair value of thecontingent consideration that qualify as measurement period adjustments are adjustedretrospectively, with corresponding adjustments against goodwill. Measurement period adjustmentsare adjustments that arise from additional information obtained during the ‘measurement period’(which cannot exceed one year from the acquisition date) about facts and circumstances thatexisted at the acquisition date.
On February 1, 2018 the Company acquired 100% of the outstanding ordinary shares ofKintuck (France) SAS and Kintuck AS from a wholly-owned subsidiary of Glencore International AG(‘‘Glencore’’) and obtained control of both entities. The new subsidiaries were renamed asFerroglobe Mangan Norge AS and Ferroglobe Manganese France SAS. The Company completedthe acquisition through its wholly-owned subsidiary Ferroatlantica.
Simultaneously with the acquisition, Glencore and Ferroglobe have entered into exclusiveagency arrangements for the marketing of Ferroglobe’s manganese alloys worldwide and theprocurement of manganese ores to supply Ferroglobe’s plants, in both cases for a period of tenyears.
The business combination was recorded during the year ended December, 31, 2018 followingIFRS 3 Business Combinations, with identifiable assets acquired and liabilities assumedprovisionally recorded at their estimated fair values on the acquisition date while costs associatedwith the acquisition are expensed as incurred. The Company utilized the services of third-partyvaluation consultants, along with internal estimates and assumptions, to estimate the initial fair valueof the assets acquired. The third-party valuation consultants utilized several appraisalmethodologies including market and cost approaches to estimate the fair value of the identifiablenet assets acquired.
110

Ferroglobe PLC and Subsidiaries
Notes to the Consolidated Financial Statements (Continued)
December 31, 2019, 2018 and 2017
(U.S. Dollars in thousands, except share and per share data)
5. Business Combinations (Continued)
The following is an estimate of the fair value of assets acquired and the liabilities assumed byFerroglobe reconciled to the value of the acquisition consideration.
Balances$’000
ASSETSNon-current assets
Other intangible assets . . . . . . . . . . . . . . . . . . . . . . . . . . . . . . . . . . . . . . . . . . . . . . . . 45Property, plant and equipment . . . . . . . . . . . . . . . . . . . . . . . . . . . . . . . . . . . . . . . . . . . 62,487Other non-current financial assets . . . . . . . . . . . . . . . . . . . . . . . . . . . . . . . . . . . . . . . . 50
Total non-current assets acquired . . . . . . . . . . . . . . . . . . . . . . . . . . . . . . . . . . . . . . . . 62,582Current assets
Inventories . . . . . . . . . . . . . . . . . . . . . . . . . . . . . . . . . . . . . . . . . . . . . . . . . . . . . . . . 21,314Trade and other receivables . . . . . . . . . . . . . . . . . . . . . . . . . . . . . . . . . . . . . . . . . . . . 24,785Other current assets . . . . . . . . . . . . . . . . . . . . . . . . . . . . . . . . . . . . . . . . . . . . . . . . . . 1,397Cash and cash equivalents . . . . . . . . . . . . . . . . . . . . . . . . . . . . . . . . . . . . . . . . . . . . . 29,530
Total current assets acquired . . . . . . . . . . . . . . . . . . . . . . . . . . . . . . . . . . . . . . . . . . . . 77,026
Total assets acquired . . . . . . . . . . . . . . . . . . . . . . . . . . . . . . . . . . . . . . . . . . . . . . . . . . 139,608LIABILITIESNon-current liabilities
Deferred tax liabilities . . . . . . . . . . . . . . . . . . . . . . . . . . . . . . . . . . . . . . . . . . . . . . . . . 90
Total non-current liabilities assumed . . . . . . . . . . . . . . . . . . . . . . . . . . . . . . . . . . . . . . 90Current liabilities
Trade and other payables . . . . . . . . . . . . . . . . . . . . . . . . . . . . . . . . . . . . . . . . . . . . . . 18,048Provisions . . . . . . . . . . . . . . . . . . . . . . . . . . . . . . . . . . . . . . . . . . . . . . . . . . . . . . . . . 735Current income tax liabilities . . . . . . . . . . . . . . . . . . . . . . . . . . . . . . . . . . . . . . . . . . . . 396Other current liabilities . . . . . . . . . . . . . . . . . . . . . . . . . . . . . . . . . . . . . . . . . . . . . . . . 4,066
Total current liabilities assumed . . . . . . . . . . . . . . . . . . . . . . . . . . . . . . . . . . . . . . . . . . 23,245
Total liabilities assumed . . . . . . . . . . . . . . . . . . . . . . . . . . . . . . . . . . . . . . . . . . . . . . . . 23,335
Net assets acquired . . . . . . . . . . . . . . . . . . . . . . . . . . . . . . . . . . . . . . . . . . . . . . . . . . . 116,273
Satisfied by:Cash . . . . . . . . . . . . . . . . . . . . . . . . . . . . . . . . . . . . . . . . . . . . . . . . . . . . . . . . . . . . 49,909Contingent consideration . . . . . . . . . . . . . . . . . . . . . . . . . . . . . . . . . . . . . . . . . . . . . . 26,222
Total consideration transferred . . . . . . . . . . . . . . . . . . . . . . . . . . . . . . . . . . . . . . . . . . . 76,131
Gain on bargain purchase . . . . . . . . . . . . . . . . . . . . . . . . . . . . . . . . . . . . . . . . . . . . . . 40,142
Net cash outflow arising on acquisitionCash consideration . . . . . . . . . . . . . . . . . . . . . . . . . . . . . . . . . . . . . . . . . . . . . . . . . . 49,909Less: cash and cash equivalent balances acquired . . . . . . . . . . . . . . . . . . . . . . . . . . . . (29,530)
20,379
111
Ferroglobe PLC and Subsidiaries
Notes to the Consolidated Financial Statements (Continued)
December 31, 2019, 2018 and 2017
(U.S. Dollars in thousands, except share and per share data)
5. Business Combinations (Continued)
The gain on bargain purchase was primarily attributable to the fact that the production ofmanganese alloys was considered an ancillary business to the seller, coupled with previous weakermanganese alloy pricing in the marketplace. The gain is recorded in the caption ‘Bargain purchasegain’ in the consolidated income statement.
The fair value of Trade and other receivables includes trade receivables with a fair value of$11,900 thousand. There is no difference between the gross contractual value and fair value.
The fair value of the contingent consideration arrangement of $26,222 thousand was estimatedby applying the income approach based on a Monte Carlo simulation considering various scenariosof fluctuation of future manganese alloy spreads as well at the cyclicality of manganese alloypricing. Contingent consideration is presented in Other liabilities and is assessed in eachsubsequent reporting period (see Note 21).
Ferroglobe Mangan Norge and Ferroglobe Manganese France contributed $112,445 thousandand $117,852 thousand respectively to the Company’s revenue, and incurred losses of$10,148 thousand and $10,436 thousand respectively for the period between the date of acquisitionand December 31, 2018.
If the acquisition of Ferroglobe Mangan Norge and Ferroglobe Manganese France had beencompleted on the first day of the financial year, Company revenues for the period would have been$2,289,931 thousand and Company profit would have been $45,007 thousand.
6. Segment reporting
Operating segments are based upon the Company’s management reporting structure. TheCompany’s operating segments are primarily at a country level as this is how the Chief OperatingDecision Maker (CODM) assesses performance and makes decisions about resource allocation.This is due to the integrated operations within each country and the ability to reallocate productionbased on the individual capacity of each plant. Additionally, economic factors that may impact ourresults of operations, such as currency fluctuations and energy costs, are also assessed at acountry level.
The Company’s North America reportable segment is the result of the aggregation of theoperating segments of the United States and Canada. These operating segments have beenaggregated as they have similar long-term economic characteristics and there is similarity ofcompetitive and operating risks and the political environment in the United States and Canada. TheCompany’s Europe reportable segment is the result of the aggregation of the operating segmentsof Spain, France and Norway. Similar to our United States and Canada operating segments, ourSpain, France and Norway operating segments are grouped together based on the relativesimilarity of the EBITDA margins, competitive risks, currency risks (i.e. risks relating to the Euro),operating risks and, given they are each part of the European Union and the European EconomicCommunity, the political and economic environment.
112

Ferroglobe PLC and Subsidiaries
Notes to the Consolidated Financial Statements (Continued)
December 31, 2019, 2018 and 2017
(U.S. Dollars in thousands, except share and per share data)
6. Segment reporting (Continued)
The consolidated income statements at December 31, 2019, 2018 and 2017, by reportablesegment, are as follows:
2019
Electrometallurgy — Electrometallurgy — Electrometallurgy — Other Adjustments/North America Europe South Africa segments Eliminations(**) Total
$’000 $’000 $’000 $’000 $’000 $’000
Sales . . . . . . . . . . . . . . . . . . . . 551,500 1,049,576 136,292 43,147 (165,293) 1,615,222Cost of sales . . . . . . . . . . . . . . . . (366,711) (868,654) (108,823) (35,923) 165,714 (1,214,397)Other operating income . . . . . . . . . . 10,418 47,672 1,323 19,413 (24,613) 54,213Staff costs . . . . . . . . . . . . . . . . . (87,954) (145,712) (20,333) (31,030) — (285,029)Other operating expense . . . . . . . . . (60,105) (142,929) (19,457) (27,406) 24,192 (225,705)Depreciation and amortization charges,
operating allowances and write-downs . (72,251) (39,844) (6,459) (1,640) — (120,194)Impairment losses . . . . . . . . . . . . . (174,013) (465) — (1,421) — (175,899)Net loss due to changes in the value of
assets . . . . . . . . . . . . . . . . . . — — (530) (1,044) — (1,574)(Loss) gain on disposal of non-current
assets . . . . . . . . . . . . . . . . . . (1,601) 180 — (802) — (2,223)Bargain purchase gain . . . . . . . . . . . — — — — — —
Operating (loss) profit . . . . . . . . . . (200,717) (100,176) (17,987) (36,706) — (355,586)Finance income . . . . . . . . . . . . . . 529 9,220 156 14,483 (23,008) 1,380Finance costs . . . . . . . . . . . . . . . (3,914) (22,547) (4,507) (55,265) 23,008 (63,225)Financial derivative gain . . . . . . . . . . — — — 2,729 — 2,729Exchange differences . . . . . . . . . . . (407) 3,139 (1,179) 1,331 — 2,884
(Loss) Profit before tax . . . . . . . . . . (204,509) (110,364) (23,517) (73,428) — (411,818)Income tax (expense) benefit . . . . . . . 8,520 22,470 7,761 2,790 — 41,541
(Loss) profit for the year fromcontinuing operations . . . . . . . . . (195,989) (87,894) (15,756) (70,638) — (370,277)
Profit for the year from discontinuedoperations . . . . . . . . . . . . . . . . — 3,280 — 81,357 — 84,637
(Loss) profit for the year . . . . . . . . . (195,989) (84,614) (15,756) 10,719 — (285,640)Loss (profit) attributable to
non-controlling interests . . . . . . . . . 5,123 — (368) 284 — 5,039
(Loss) profit attributable to the Parent . (190,866) (84,614) (16,124) 11,003 — (280,601)
113

Ferroglobe PLC and Subsidiaries
Notes to the Consolidated Financial Statements (Continued)
December 31, 2019, 2018 and 2017
(U.S. Dollars in thousands, except share and per share data)
6. Segment reporting (Continued)2018(*)
Electrometallurgy — Electrometallurgy — Electrometallurgy — Other Adjustments/North America Europe South Africa segments Eliminations(**) Total
$’000 $’000 $’000 $’000 $’000 $’000
Sales . . . . . . . . . . . . . . . . . . . . 710,716 1,447,973 208,543 62,075 (187,305) 2,242,002Cost of sales . . . . . . . . . . . . . . . . (394,044) (1,059,474) (137,177) (43,194) 187,212 (1,446,677)Other operating income . . . . . . . . . . 4,943 39,817 3,420 16,666 (19,002) 45,844Staff costs . . . . . . . . . . . . . . . . . (115,555) (177,047) (23,735) (22,525) — (338,862)Other operating expense . . . . . . . . . (77,670) (146,143) (26,353) (46,489) 19,095 (277,560)Depreciation and amortization charges,
operating allowances and write-downs . (69,009) (34,974) (5,526) (4,328) — (113,837)Impairment losses . . . . . . . . . . . . . — — — (58,919) — (58,919)Net loss due to changes in the value of
assets . . . . . . . . . . . . . . . . . . — (7) (7,616) — — (7,623)(Loss) gain on disposal of non-current
assets . . . . . . . . . . . . . . . . . . (208) (8,369) (261) 23,402 — 14,564Bargain purchase gain . . . . . . . . . . . — 40,142 — — — 40,142
Operating profit (loss) . . . . . . . . . . 59,173 101,918 11,295 (73,312) — 99,074Finance income . . . . . . . . . . . . . . 804 11,035 199 32,040 (39,220) 4,858Finance costs . . . . . . . . . . . . . . . (4,109) (40,831) (5,298) (46,048) 39,220 (57,066)Financial derivative gain . . . . . . . . . . — — — 2,838 — 2,838Exchange differences . . . . . . . . . . . (1,194) (10,561) 2,284 (4,665) — (14,136)
Profit (loss) before tax . . . . . . . . . . 54,674 61,561 8,480 (89,147) — 35,568Income tax (expense) benefit . . . . . . . 4,949 (15,048) (3,582) (6,778) — (20,459)
Profit (loss) for the year fromcontinuing operations . . . . . . . . . 59,623 46,513 4,898 (95,925) — 15,109
Profit for the year from discontinuedoperations . . . . . . . . . . . . . . . . — — — 9,464 — 9,464
Profit (loss) for the year . . . . . . . . . 59,623 46,513 4,898 (86,461) — 24,573Loss (profit) attributable to
non-controlling interests . . . . . . . . . 4,785 (332) 358 14,277 — 19,088
Profit (loss) attributable to the Parent . 64,408 46,181 5,256 (72,184) — 43,661
114

Ferroglobe PLC and Subsidiaries
Notes to the Consolidated Financial Statements (Continued)
December 31, 2019, 2018 and 2017
(U.S. Dollars in thousands, except share and per share data)
6. Segment reporting (Continued)2017(*)
Electrometallurgy — Electrometallurgy — Electrometallurgy — Other Adjustments/North America Europe South Africa segments Eliminations(**) Total
$’000 $’000 $’000 $’000 $’000 $’000
Sales . . . . . . . . . . . . . . . . . . . . 541,143 1,083,200 122,504 50,782 (65,353) 1,732,276Cost of sales . . . . . . . . . . . . . . . . (303,096) (690,589) (81,744) (33,496) 65,650 (1,043,275)Other operating income . . . . . . . . . . 2,701 12,681 2,868 15,520 (15,670) 18,100Staff costs . . . . . . . . . . . . . . . . . (90,802) (147,595) (23,495) (37,923) (220) (300,035)Other operating expense . . . . . . . . . (68,537) (107,130) (24,462) (50,428) 16,158 (234,399)Depreciation and amortization charges,
operating allowances and write-downs . (66,789) (27,404) (5,788) (430) 9 (100,402)Impairment losses . . . . . . . . . . . . . (30,618) — — (1,007) (16) (31,641)Net gain due to changes in the value of
assets . . . . . . . . . . . . . . . . . . — — 7,222 — 282 7,504Gain (loss) on disposal of non-current
assets . . . . . . . . . . . . . . . . . . (3,718) 301 (138) (818) 57 (4,316)Bargain purchase gain . . . . . . . . . . .Other (loss) gain . . . . . . . . . . . . . . — (13,604) — (2,625) 13,616 (2,613)
Operating (loss) profit . . . . . . . . . . (19,716) 109,860 (3,033) (60,425) 14,513 41,199Finance income . . . . . . . . . . . . . . 448 6,733 404 189,962 (195,138) 2,409Finance costs . . . . . . . . . . . . . . . (4,567) (40,106) (7,361) (43,043) 35,108 (59,969)Financial derivative loss . . . . . . . . . . — — — (6,850) — (6,850)Exchange differences . . . . . . . . . . . (191) 5,938 (1,197) 3,730 (66) 8,214
(Loss) profit before tax . . . . . . . . . . (24,026) 82,425 (11,187) 83,374 (145,583) (14,997)Income tax benefit (expense) . . . . . . . 29,386 (26,031) 2,068 9,096 (294) 14,225
Profit (loss) for the year fromcontinuing operations . . . . . . . . . 5,360 56,394 (9,119) 92,470 (145,877) (772)
(Loss) profit for the year fromdiscontinued operations . . . . . . . . . — — — (5,050) — (5,050)
Profit (loss) for the year . . . . . . . . . 5,360 56,394 (9,119) 87,420 (145,877) (5,822)Loss (profit) attributable to
non-controlling interests . . . . . . . . . 4,734 (370) (147) 951 (24) 5,144
(Loss) profit attributable to the Parent . 10,094 56,024 (9,266) 88,371 (145,901) (678)
(*) The consolidated Income Statements for the periods ended December 31, 2018 and 2017 have been restated to reclassify the results of theSpanish energy assets within profit (loss) for the year from discontinued operations.as part of the Other segments, as described in Note 1 to theconsolidated financial statements.
(**) The amounts correspond to transactions between segments that are eliminated in the consolidation process.
115

Ferroglobe PLC and Subsidiaries
Notes to the Consolidated Financial Statements (Continued)
December 31, 2019, 2018 and 2017
(U.S. Dollars in thousands, except share and per share data)
6. Segment reporting (Continued)
The consolidated statements of financial position at December 31, 2019 and 2018, byreportable segment are as follows:
2019
ConsolidationElectrometallurgy — Electrometallurgy — Electrometallurgy — Other Adjustments/
North America Europe South Africa segments Eliminations(*) Total$’000 $’000 $’000 $’000 $’000 $’000
Goodwill . . . . . . . . . . . . . . . . . . . 29,702 — — — — 29,702Other intangible assets . . . . . . . . . . . 18,504 30,248 1,322 1,193 — 51,267Property, plant and equipment . . . . . . . 419,695 216,809 53,650 50,752 — 740,906Inventories . . . . . . . . . . . . . . . . . . 91,619 215,509 32,886 14,107 — 354,121Trade and other receivables (**) . . . . . . 427,871 504,294 47,755 764,532 (1,430,186) 314,266Cash, restricted cash and cash
equivalents . . . . . . . . . . . . . . . . 25,194 65,216 3,321 29,444 — 123,175Other . . . . . . . . . . . . . . . . . . . . . 11,932 60,619 14,921 33,444 — 120,916
Total assets . . . . . . . . . . . . . . . . . 1,024,517 1,092,695 153,855 893,472 (1,430,186) 1,734,353
Equity . . . . . . . . . . . . . . . . . . . . 459,637 307,131 43,466 (207,937) — 602,297Provisions . . . . . . . . . . . . . . . . . . 31,220 85,167 7,108 7,448 — 130,943Bank borrowings . . . . . . . . . . . . . . — 100,070 — 58,929 — 158,999Obligations under finance leases . . . . . 6,473 18,128 14 1,257 — 25,872Debt instruments . . . . . . . . . . . . . . — — — 354,951 — 354,951Other financial liabilities . . . . . . . . . . — 454 — 66,085 — 66,539Trade and other payables (***) . . . . . . 464,592 520,937 86,837 587,552 (1,465,859) 194,059Other . . . . . . . . . . . . . . . . . . . . . 62,595 60,808 16,430 25,187 35,673 200,693
Total equity and liabilities . . . . . . . . . 1,024,517 1,092,695 153,855 893,472 (1,430,186) 1,734,353
2018
ConsolidationElectrometallurgy — Electrometallurgy — Electrometallurgy — Other Adjustments/
North America Europe South Africa segments Eliminations(*) Total$’000 $’000 $’000 $’000 $’000 $’000
Goodwill . . . . . . . . . . . . . . . . . . . 202,848 — — — — 202,848Other intangible assets . . . . . . . . . . . 22,798 26,476 1,292 1,256 — 51,822Property, plant and equipment . . . . . . . 467,616 219,520 56,679 145,047 — 888,862Inventories . . . . . . . . . . . . . . . . . . 113,673 288,669 35,944 18,684 — 456,970Trade and other receivables (**) . . . . . . 267,974 274,291 50,665 834,515 (1,254,935) 172,510Cash, restricted cash and cash
equivalents . . . . . . . . . . . . . . . . 76,791 110,523 19,483 9,850 — 216,647Other . . . . . . . . . . . . . . . . . . . . . 15,341 85,905 8,692 24,220 — 134,158
Total assets . . . . . . . . . . . . . . . . . 1,167,041 1,005,384 172,755 1,033,572 (1,254,935) 2,123,817
Equity . . . . . . . . . . . . . . . . . . . . 646,851 206,781 58,294 (27,554) — 884,372Provisions . . . . . . . . . . . . . . . . . . 29,644 71,163 7,889 7,661 — 116,357Bank borrowings . . . . . . . . . . . . . . — 6,914 — 134,098 — 141,012Obligations under finance leases . . . . . 1,466 — — 65,005 — 66,471Debt instruments . . . . . . . . . . . . . . — — — 352,594 — 352,594Other financial liabilities . . . . . . . . . . — 3,841 — 81,471 — 85,312Trade and other payables (***) . . . . . . 414,022 662,667 93,970 379,468 (1,282,176) 267,951Other . . . . . . . . . . . . . . . . . . . . . 75,058 54,018 12,602 40,829 27,241 209,748
Total equity and liabilities . . . . . . . . . 1,167,041 1,005,384 172,755 1,033,572 (1,254,935) 2,123,817
(*) These amounts correspond to balances between segments that are eliminated at consolidation.
(**) Trade and other receivables includes non-current and current receivables from group that eliminated in the consolidated process.
(***) Trade and other payables includes non-current and current payables from group that are eliminated in the consolidated process.
116

Ferroglobe PLC and Subsidiaries
Notes to the Consolidated Financial Statements (Continued)
December 31, 2019, 2018 and 2017
(U.S. Dollars in thousands, except share and per share data)
6. Segment reporting (Continued)
Other disclosures
Sales by product line
Sales by product line are as follows:
2019 2018 2017$’000 $’000 $’000
Silicon metal . . . . . . . . . . . . . . . . . . . . . . . 539,872 933,366 739,618Manganese-based alloys . . . . . . . . . . . . . . 447,311 527,757 363,644Ferrosilicon . . . . . . . . . . . . . . . . . . . . . . . . 275,368 359,374 266,862Other silicon-based alloys . . . . . . . . . . . . . . 181,736 215,697 188,183Silica fume . . . . . . . . . . . . . . . . . . . . . . . . 33,540 37,061 36,338Energy . . . . . . . . . . . . . . . . . . . . . . . . . . . — 12,149 7,244Other . . . . . . . . . . . . . . . . . . . . . . . . . . . . 137,395 156,598 130,387
Total . . . . . . . . . . . . . . . . . . . . . . . . . . . . . 1,615,222 2,242,002 1,732,276
Information about major customers
Total sales of $643,689 thousand, $758,894 thousand, and $820,987 thousand wereattributable to the Company’s top ten customers in 2019, 2018, and 2017 respectively. During 2019and 2018, there was no single customer representing greater than 10% of the Company’s sales.During 2017, sales corresponding to Dow Corning Corporation represented 12.2% of theCompany’s sales, respectively. Sales to Dow Corning Corporation are included partially in theElectrometallurgy — North America segment and partially in the Electrometallurgy — Europesegment.
7. Goodwill
Changes in the carrying amount of goodwill during the years ended December 31, are asfollows:
January 1, Impairment Exchange December 31, Impairment Exchange December 31,2018 (Note 25.5) differences 2018 (Note 25.5) differences 2019$’000 $’000 $’000 $’000 $’000 $’000 $’000
Globe SpecialtyMetals, Inc. . . . . . . . . 205,287 — (2,439) 202,848 (174,008) 862 29,702
Total . . . . . . . . . . . . . . 205,287 — (2,439) 202,848 (174,008) 862 29,702
In accordance with the requirements of IAS 36, goodwill is tested for impairment annually andis tested for impairment between annual tests if a triggering event occurs that would indicate thecarrying amount of a cash-generating unit may be impaired. Impairment testing for goodwill is doneat a cash-generating unit level, and the Company performs its annual impairment test at the end ofthe annual reporting period (December 31). The estimate of the recoverable value of thecash-generating units requires significant judgment in evaluation of overall market conditions,
117

Ferroglobe PLC and Subsidiaries
Notes to the Consolidated Financial Statements (Continued)
December 31, 2019, 2018 and 2017
(U.S. Dollars in thousands, except share and per share data)
7. Goodwill (Continued)
estimated future cash flows, discount rates and other factors, and are calculated based onmanagement’s business plans.
On December 23, 2015, Ferroglobe PLC consummated the acquisition of 100% of the equityinterests of Globe Specialty Metals, Inc. (GSM) and subsidiaries and FerroAtlantica. This BusinessCombination was accounted for using the acquisition method of accounting for businesscombinations under IFRS 3 Business Combinations, with FerroAtlantica treated as the accountingacquirer and GSM as the acquiree. The aggregate of the fair values as of the closing date of theBusiness Combination of the assets acquired and liabilities assumed was recorded as goodwill.
During the year ended December 31, 2019, the Company recognized an impairment charge of$174,008 thousand related to the complete impairment of goodwill in Canada and partialimpairment of goodwill in the United States, resulting from a decline in future estimated projectionsand increase of the discount rate which caused the Company to revise its expected future cashflows from its Canadian and United States business operations. The impairment charge is recordedwithin the Electrometallurgy — North America reportable segment.
During the year ended December 31, 2018, in connection with our annual goodwill impairmenttest, the Company did not recognize an impairment charge.
Ferroglobe operates in a cyclical market, and silicon and silicon-based alloy index pricing andforeign import pressure into the U.S. and Canadian markets impact the future projected cash flowsused in our impairment analysis. Recoverable value was estimated based on discounted cashflows. Estimates under the Company’s discounted income based approach involve numerousvariables including anticipated sales price and volumes, cost structure, discount rates and longterm growth that are subject to change as business conditions change, and therefore could impactfair values in the future. As of December 31, 2019, the remaining goodwill for the U.S and Canadiancash-generating units is $29,702 thousand and nil, respectively.
Key assumptions used in the determination of recoverable value
In determining the asset recoverability through value in use, estimates, judgments andassumptions on uncertain matters are required. For each cash-generating unit, the value in use isdetermined based on economic assumptions and forecasted operating conditions as follows:
2019 2018U.S. Canada U.S. Canada
Weighted average cost of capital . . . . . . . . . . . . . . . . . . . . . . . 11.1% 11.5% 11.0% 10.5%Long-term growth rate . . . . . . . . . . . . . . . . . . . . . . . . . . . . . . . 2.0% 2.0% 2.0% 2.0%Normalized tax rate . . . . . . . . . . . . . . . . . . . . . . . . . . . . . . . . . 21.0% 26.6% 22.0% 26.5%
The Company has defined a financial model which considers the revenues, expenditures, cashflows, net tax payments and capital expenditures on a five year period (2020-2024), and perpetuitybeyond this tranche. The financial projections to determine the net present value of future cashflows are modeled considering the principal variables that determine the historic flows of eachgroup of cash-generating unit.
118

Ferroglobe PLC and Subsidiaries
Notes to the Consolidated Financial Statements (Continued)
December 31, 2019, 2018 and 2017
(U.S. Dollars in thousands, except share and per share data)
7. Goodwill (Continued)
Sensitivity to changes in assumptions
Changing management’s assumptions, could significantly affect the evaluation of the value inuse of our cash generating units and, therefore, the impairment result. As of December 31, 2019,there is $5,266 thousand headroom between the carrying value of goodwill and the recoverablevalue of the U.S cash-generating unit. The following changes to the assumptions used in theimpairment test lead to the following changes in recoverable value:
Sensitivity onExcess of Sensitivity on long-term growth Sensitivity on cashrecoverable discount rate rate flowsvalue overcarrying Decrease Increase Decrease Increase Decrease Increase
Goodwill value by 10% by 10% by 10% by 10% by 10% by 10%(in millions of $)
Electrometallurgy —U.S. . . . . . . . . . . 29.7 5.3 44.1 (35.0) (4.5) 4.5 (62.0) 62.0
Total . . . . . . . . . . . 29.7
8. Other intangible assets
Changes in the carrying amount of other intangible assets during the years endedDecember 31 are as follows:
Power Other AccumulatedDevelopment Supply Rights of Computer Intangible Depreciation ImpairmentExpenditure Agreements Use Software Assets (Note 25.3) (Note 25.5) Total
$’000 $’000 $’000 $’000 $’000 $’000 $’000 $’000
Balance at January 1,2018 . . . . . . . . . . . 50,482 37,836 23,039 6,047 24,263 (72,751) (10,258) 58,658
Additions . . . . . . . . . . 992 — — — 26,385 (9,312) (16,073) 1,992Disposals . . . . . . . . . — — — (64) (7,260) — — (7,324)Business combinations
(Note 5) . . . . . . . . . — — — 45 — — — 45Transfers from/(to) other
accounts . . . . . . . . 1,919 — — — (1,919) — — —Exchange differences . . (2,408) — (648) (101) (1,656) 2,546 718 (1,549)
Balance atDecember 31, 2018 . 50,985 37,836 22,391 5,927 39,813 (79,517) (25,613) 51,822
Additions . . . . . . . . . . 870 — — — 22,842 (7,305) (211) 16,196Disposals . . . . . . . . . (553) — (5,595) (780) (8,295) 3,845 5,281 (6,097)Exchange differences . . (976) — (263) 2 (142) 694 468 (217)Business disposal . . . . — — — — (11,548) — 1,111 (10,437)
Balance atDecember 31, 2019 . 50,326 37,836 16,533 5,149 42,670 (82,283) (18,964) 51,267
119

Ferroglobe PLC and Subsidiaries
Notes to the Consolidated Financial Statements (Continued)
December 31, 2019, 2018 and 2017
(U.S. Dollars in thousands, except share and per share data)
8. Other intangible assets (Continued)
Additions and disposals in other intangible asset in 2019 and 2018 primarily relate to theacquisition, use and expiration of rights held to emit greenhouse gasses by certain Spanish, Frenchand Canadian subsidiaries (see Note 4.21).
As a result of the Business Combination, the Company acquired a power supply agreementwhich provides favorable below-market power rates to the Alloy, West Virginia facility, whichterminates in December 2021.
During 2019 the Company disposed of FerroAtlantica, S.A.U., which resulted in a net reductionof other intangible assets of $10,437 thousand, the net gain on the disposal ofFerroAtlantica, S.A.U. is disclosed in Note 29. During 2018 the Company recognised an impairmentof $13,947 thousand of development expenditures in relation to our solar-grade silicon metal projectbased in Puertollano, Spain. Refer to Note 9 for further details.
At December 31, 2019, the Company has no intangible assets pledged as security foroutstanding bank loans and other payables. At December 31, 2018 the company has otherintangible assets of $26,948 thousands pledged as security for outstanding bank loans and otherpayables.
120

121
Ferroglobe PLC and Subsidiaries
Notes to the Consolidated Financial Statements (Continued)
December 31, 2019, 2018 and 2017
(U.S. Dollars in thousands, except share and per share data)
9. Property, plant and equipment
The detail of property, plant and equipment, net of the related accumulated depreciation and impairment in 2019 and 2018 is asfollows:
Advances andProperty,Plant and Other Items of Other Items of Other Items of
Other Fixtures, Equipment in Property, Leased Leased AccumulatedLand and Plant and Tools and the Course of Mineral Plant and Land and Plant and Depreciation ImpairmentBuildings Machinery Furniture Construction Reserves Equipment Buildings machinery (Note 25.3) (Note 25.5) Total
$’000 $’000 $’000 $’000 $’000 $’000 $’000 $’000 $’000 $’000 $’000
Balance at January 1, 2018 . . . . . . . . . 251,298 1,490,804 8,533 128,584 60,359 32,364 — — (936,325) (117,643) 917,974Additions . . . . . . . . . . . . . . . . . . . . 2,983 9,104 12 99,016 — 4,293 — — (104,532) (42,846) (31,970)Disposals and other . . . . . . . . . . . . . . (4,687) (34,612) (1,084) (2,657) — (587) — — 35,921 — (7,706)Transfers from/(to) other accounts . . . . . . 24,823 69,439 4,850 (97,086) — 222 — — (2,248) — —Exchange differences . . . . . . . . . . . . . (10,743) (74,554) (405) (5,941) (951) (383) — — 48,455 3,292 (41,230)Business combinations (Note 5) . . . . . . . . 6,846 53,337 82 1,790 — 432 — — — — 62,487Business disposals . . . . . . . . . . . . . . . (35,211) (26,471) (43) (342) — — — — 56,674 — (5,393)Discounted operations . . . . . . . . . . . . . — — — — — — — — (5,300) — (5,300)
Balance at December 31, 2018 . . . . . . . 235,309 1,487,047 11,945 123,364 59,408 36,341 — — (907,355) (157,197) 888,862IFRS 16 Adjustments at 1 January 2019 . . . — — — — — — 12,417 18,055 (9,703) — 20,769Additions . . . . . . . . . . . . . . . . . . . . 74 1,409 32 34,039 — — 777 3,089 (103,121) (1,224) (64,925)Disposals and other . . . . . . . . . . . . . . (13,160) (78,774) (3,399) (7,426) — (2,195) — — 48,560 48,775 (7,619)Transfers from/(to) other accounts . . . . . . 408 38,445 220 (39,073) — — — — — — —Exchange differences . . . . . . . . . . . . . (2,822) (8,908) 36 (1,881) 94 317 104 189 9,091 2,000 (1,780)Business disposals . . . . . . . . . . . . . . . (23,223) (165,382) (15) (2,372) — — — — 96,591 — (94,401)
Balance at December 31, 2019 . . . . . . . 196,586 1,273,837 8,819 106,651 59,502 34,463 13,298 21,333 (865,937) (107,646) 740,906

Ferroglobe PLC and Subsidiaries
Notes to the Consolidated Financial Statements (Continued)
December 31, 2019, 2018 and 2017
(U.S. Dollars in thousands, except share and per share data)
9. Property, plant and equipment (Continued)
Additions in the captions leased Land and Building and Leased Plant and Machineryrepresents the adoption of IFRS 16 from January 1, 2019, see Note 3.
During 2019 the Company disposed of FerroAtlantica, S.A.U. and Ultracore Polska Zoo, whichresulted in a net reduction of property, plant and equipment of $94,401 thousand. The net gain onthe disposal of FerroAtlantica, S.A.U. is disclosed in Note 29 and the net loss on disposal ofUltracore Polska ZOO is included in Note 25.6.
During 2019 the Company liquidated Ganzi Ferroatlantica Silicon Industry Company, Ltd. andstarted the process of liquidation of Mangshi Sinice Silicon Industry Company Limited, whichresulted in the reduction of impairment of $48,775 thousand.
Business combinations in 2018 relate to the assets acquired as part of the acquisition of theGlencore plants in France and Norway, see Note 5.
During 2018 the Company disposed of Hidro Nitro Espanola S.A. which resulted in a netreduction of property, plant and equipment of $5,393 thousand. The net gain on the disposal of thebusiness is disclosed in Note 25.6.
During 2018 the Company recognised an impairment of $40,537 thousand in Impairmentlosses (Electrometallurgy — Other segment) in relation to our solar-grade silicon metal projectbased in Puertollano, Spain. At the end of 2018 the Company has decided to temporarily suspendinvestment in the project due to deterioration in the market environment for solar grade silicon (orpolysilicon) worldwide. The Company is preserving the technology and know-how in order to beable to finalize the construction of the factory as soon as market circumstances change. As ofDecember 31, 2019, the Company continues to recognize these project assets as$40,590 thousand based on the higher of fair value less costs of disposal and value in use. Fairvalue less costs of disposal related to land and buildings was determined based on recent sales ofcomparable industrial properties located near the project. Fair value less costs of disposal related tomachinery and equipment was determined by assessing the recoverability of the assets to a marketparticipant. In 2019 the valuation of these assets has been reassessed and no changes in theimpairment recorded were needed.
As at December 31, 2019 the Company tested property, plant and equipment for impairment,estimating the recoverable value of the cash-generating units requires significant judgment inevaluation of overall market conditions, estimated future cash flows, discount rates and otherfactors, based on management’s business plans. Recoverable values were estimated bydetermining the value in use for all assets, with the exception of our solar-grade silicon metalproject based in Puertollano, Spain, and our silicon metal plant in Polokwane, South Africa forwhich the recoverable value was determined by independent valuation experts. No impairment forproperty, plant and equipment was recognized during the year ended December 31, 2019.
At December 31, 2019, the Company has no property, plant and equipment pledged assecurity for outstanding bank loans and other payables. At December 31, 2018, the Company hasproperty, plant and equipment of $514,625 thousands pledged as security for outstanding bankloans.
122

Ferroglobe PLC and Subsidiaries
Notes to the Consolidated Financial Statements (Continued)
December 31, 2019, 2018 and 2017
(U.S. Dollars in thousands, except share and per share data)
9. Property, plant and equipment (Continued)
Finance leases
Finance leases held by the Company included in Plant and Machinery at December 31 are asfollows:
Historical Carrying LeaseTime Cost Accumulated Amount Interest Payments
Life Elapsed EUR Cost Depreciation US Payable Outstanding(Years) (Years) g’000 US $’000 US $’000 $’000 US $’000 US $’000
December 31, 2018Hydroelectrical installations . . 10 6.6 109,047 124,859 (82,940) 41,918 — 65,005
The leases of the Hydroelectrical installation have been canceled before the sale of FAU.
Commitments
At December 31, 2019 and 2018, the Company has capital expenditure commitments totaling$15,635 thousand and $26,935 thousand, respectively, primarily related to maintenance andimprovement works at plants.
10. Financial assets and other receivables
The company’s financial assets and their classification under IFRS 9 are as follows:
2019 classificationFair value Fair value
through profit through otheror loss — comprehensive
mandatorily income —Amortised cost measured designated Total
Note $’000 $’000 $’000 $’000
Other financial assets . . . . 10.1 2,618 5,544 — 8,162Receivables from related
parties . . . . . . . . . . . . . 23 5,202 — — 5,202Trade receivables . . . . . . . 10.2 232,479 — — 232,479Other receivables . . . . . . . 10.2 10,889 — — 10,889Cash and cash equivalents 94,852 — — 94,852Restricted cash . . . . . . . . . 28,323 — — 28,323
Total financial assets . . . . 374,363 5,544 — 379,907
123

Ferroglobe PLC and Subsidiaries
Notes to the Consolidated Financial Statements (Continued)
December 31, 2019, 2018 and 2017
(U.S. Dollars in thousands, except share and per share data)
10. Financial assets and other receivables (Continued)
2018 classificationFair value Fair value
through profit through otheror loss — comprehensive
mandatorily income —Amortised cost measured designated Total
Note $’000 $’000 $’000 $’000
Other financial assets . . . . 10.1 3,264 69,602 — 72,866Receivables from related
parties . . . . . . . . . . . . . 23 16,514 — — 16,514Trade receivables . . . . . . . 10.2 70,755 — — 70,755Other receivables . . . . . . . 10.2 7,784 — — 7,784Cash and cash equivalents 216,647 — — 216,647
Total financial assets . . . . 314,964 69,602 — 384,566
As of year ended December 31, 2019, Cash and cash equivalents and restricted cashcomprise the following:
2019 2018$’000 $’000
Cash and cash equivalents . . . . . . . . . . . . . . . . . . . . . . . . . 94,852 216,647Current restricted cash presented as Cash . . . . . . . . . . . . . . 28,323 —
Escrow: Hydro-electric assets sale . . . . . . . . . . . . . . . . . . . 5,617 —ABL . . . . . . . . . . . . . . . . . . . . . . . . . . . . . . . . . . . . . . . . . 22,500 —Others . . . . . . . . . . . . . . . . . . . . . . . . . . . . . . . . . . . . . . . . 206 —
Total . . . . . . . . . . . . . . . . . . . . . . . . . . . . . . . . . . . . . . . . . 123,175 216,647
The escrow was constituted in August 30, 2019, in consideration of FAU sale; underagreement terms, the Purchaser and the Seller deposited in a restricted bank account a part of theshare purchase price, guaranteeing any compensation to the purchaser for any claim under thecontract. In relation to the ABL Restricted cash, the amount constituted is fixed by agreement asliquidity covenants, see ‘‘Note 16’’.
124

Ferroglobe PLC and Subsidiaries
Notes to the Consolidated Financial Statements (Continued)
December 31, 2019, 2018 and 2017
(U.S. Dollars in thousands, except share and per share data)
10. Financial assets and other receivables (Continued)
10.1 Other financial assets
At December 31, 2019, other financial assets comprise the following:
2019Non-Current Current Total
$’000 $’000 $’000
Other financial assets held with third parties:Other financial assets at amortised cost . . . . . 2,618 — 2,618Listed equity securities . . . . . . . . . . . . . . . . . — 5,544 5,544
Total . . . . . . . . . . . . . . . . . . . . . . . . . . . . . . . 2,618 5,544 8,162
Listed equity securities comprises investments held by Globe Argentina Metales in PampaEnergıa.
At December 31, 2018, other financial assets comprise the following:
2018Non-Current Current Total
$’000 $’000 $’000
Other financial assets held with third parties:Other financial assets at amortised cost . . . . 3,264 — 3,264Listed equity securities . . . . . . . . . . . . . . . . — 2,523 2,523Debt investments at fair value through profit
or loss . . . . . . . . . . . . . . . . . . . . . . . . . . 67,079 — 67,079
Total . . . . . . . . . . . . . . . . . . . . . . . . . . . . . . . 70,343 2,523 72,866
Debt instruments at fair value through profit or loss comprised an investment in subordinatedloan notes issued by a special purpose entity that purchased accounts receivable from theCompany pursuant to a securitization program (see ‘Securitization of trade receivables’ below).There is no equivalent amount at December 31, 2019 as the Irish SPE (see’Securitization of tradereceivables’) is now consolidated and the investment in subordinated loan notes were eliminated onconsolidation.
Securitization of trade receivables
On July 31, 2017, the Company entered into an accounts receivable securitization program(the ‘‘Program’’) where trade receivables generated by the Company’s subsidiaries in the UnitedStates, Canada, Spain and France were sold to Ferrous Receivables DAC, a special purpose entitydomiciled and incorporated in Ireland (the ‘‘SPE’’). As sales of the Company’s products tocustomers occurred, eligible trade receivables were sold to the SPE at an agreed upon purchaseprice. Part of the consideration was received upfront in cash and part was deferred in the form ofsenior subordinated and junior subordinated loans notes issued by the SPE to the selling entities.
125

Ferroglobe PLC and Subsidiaries
Notes to the Consolidated Financial Statements (Continued)
December 31, 2019, 2018 and 2017
(U.S. Dollars in thousands, except share and per share data)
10. Financial assets and other receivables (Continued)
The SPE purchased the receivables at a slight discount to invoice value in order to pay certainexpenses and fees related to the receivables including the costs of servicing the portfolio, the costsservicing the debt incurred to fund the purchase and any administrative costs. This discount wassized to adequately to cover any and all expenses required of the SPE.
At December 31, 2018, up to $303,000 thousand of upfront cash consideration could beprovided by the SPE under the Program, financed by ING Bank N.V. (‘‘ING’’), as senior lender andFinacity Capital Management Inc. (‘‘Finacity’’), as intermediate subordinated lender and controlparty. In respect of trade receivables outstanding at December 31, 2018, the SPE provided upfrontcash consideration of approximately $227,360 thousand.
On October 11, 2019, the Company’s subsidiaries in the United States and Canadarepurchased all outstanding receivables that had they had previously sold to the SPE so that theycould form part of the borrowing base for the North American asset-based revolving credit facility(the ‘‘ABL Revolver’’).
During 2019, following certain termination events under the Program, ING’s senior loancommitments were reduced to $75,000 thousand and the Company and ING agreed the Programwould terminate during the fourth quarter of 2019, unless otherwise refinanced.
On December 10, 2019, the Company refinanced the Program and amended and restated itsterms. The SPE repaid the remaining senior loans to ING with the proceeds of new senior loansissued by an affiliate of Sound Point Capital Management LP. The new senior lender’s commitmentsunder the amended and restated securitization program are $150,000 thousand, of which $104,130was drawn at December 31, 2019. Finacity remains an intermediate subordinated lender and theCompany’s European subsidiaries continue as senior subordinated and junior subordinated lendersas well as having a new interest in the senior and intermediate subordinated loan tranches. TheProgram has a two-year term until December 10, 2021.
Judgements relating to the consolidation of the SPE
The Company does not own shares in the SPE or have the ability to appoint its directors. Indetermining whether to consolidate the SPE, the Company evaluated whether it has control overthe SPE, in particular, whether it is exposed, or has rights, to variable returns from its involvementwith the investee and has the ability to affect those returns through its power over the investee.
Receivables are sold to the SPE under a true sale opinion with legal interest transferred fromthe Company to the SPE. While the sale of receivables to the SPE is without credit recourse, theCompany continues to be exposed to the variable returns from its involvement in the SPE as it isexposed to credit risk as a subordinated lender to the SPE and it earns a variable amount ofremuneration as master servicer of the receivables, as well as any excess return from additionalservice fee, including the loss or gain due to the effect of foreign exchange rates.
As master servicer, Ferroglobe is responsible for the cash collection and management of anyimpaired receivables. Finacity, in addition to being intermediate subordinated lender, is the backupservicer and has the unilateral right to remove Ferroglobe as master servicer and manage impaired
126

Ferroglobe PLC and Subsidiaries
Notes to the Consolidated Financial Statements (Continued)
December 31, 2019, 2018 and 2017
(U.S. Dollars in thousands, except share and per share data)
10. Financial assets and other receivables (Continued)
receivables. Until September 5, 2019, this right was considered to be substantive and it wasconcluded that Finacity had power and control over the SPE and that the SPE should not beconsolidated by Ferroglobe. Considering the risk exposure for each lender at September 5, 2019and subsequently, including under the amended and restated program effective December 10,2019, it is not considered that Finacity has a risk exposure such as to be considered substantive.Therefore, Ferroglobe is now considered to have control over the SPE as it is exposed to variablereturns and has the ability to affect those returns through its power over the investee. Accordingly,Ferroglobe has consolidated the SPE with effect from September 5, 2019.
As a result of consolidating the SPE, the trade receivables purchased by the SPE are includedin the Company’s consolidated statement of financial position, along with loans (see Note 16) andcash held by the SPE.
Transactions with the SPE prior to consolidation
Prior to the consolidation of the SPE on September 5, 2019, Company sold approximately$1,127 million of trade receivables to the SPE during the year ended December 31, 2019 (2018:approximately $2,059 million). The loss on transfer of the receivables, or purchase discount, whichequates to difference between the carrying amount of the receivable and the purchaseconsideration, was $12,210 thousand and has been recognized within finance costs in theconsolidated income statement (2018: $22,647 thousand).
As a lender to the SPE, the Company earned interest on its senior subordinated and juniorsubordinated loan receivables. During the year ended December 31, 2019, the Company earnedinterest of $1,130 thousand in respect of these loan receivables, recognized within finance incomein the consolidated income statement (2018: $3,403 thousand).
The Company is engaged as master servicer to the SPE whereby the Company is responsiblefor the cash collection, reporting and cash application of the sold receivables. As master servicer,the Company earns a fixed rate management fee due to the percentage but depends on thevolume of assets and an additional servicing fee which entitles the Company to a residual interestupon monthly liquidation of the SPE. The additional servicing fee will only be paid out on monthlyliquidation of the SPE and from any excess cash flows remaining after all lenders to the SPE havebeen repaid. This results in the Company being exposed to variable returns. During the year endedDecember 31, 2019, the Company earned fixed-rate servicing fees of $1,531 thousand (2018:$2,961 thousand) and additional servicing fees of $4,790 thousand (2018: $11,174 thousand).
Restrictions on the use of group assets
At December 31, 2019, the SPE held cash of $38,778 thousand and this is consolidated bythe Company and included in the cash and cash equivalents balance (2018: the SPE was notconsolidated). Cash held by the SPE can be used to repay the SPE’s borrowings (see Note 16),pay interest and expenses incurred by the SPE, purchase new trade receivables from theFerroglobe entities participating in the Program and repay loan notes issued to Ferroglobe entities,subject to continuing to meet the Program’s collateral and minimum liquidity requirements. At
127

Ferroglobe PLC and Subsidiaries
Notes to the Consolidated Financial Statements (Continued)
December 31, 2019, 2018 and 2017
(U.S. Dollars in thousands, except share and per share data)
10. Financial assets and other receivables (Continued)
December 31, 2019, $3,448 thousand of cash held by the SPE was available to repay subordinatedloan notes to Ferroglobe entities and therefore available for use by the wider group.
At December 31, 2019, the SPE held trade receivables of $90,108 thousand and these wereconsolidated by the Company (2018: the SPE was not consolidated). The proceeds from thecollection of the SPE’s receivables can be used to repay the SPE’s borrowings.
Amount Interest$’000 Rate Currency
Senior Subordinated Loan . . . . . . . . . . . . . . — 0% U.S. DollarsJunior Subordinated Loan . . . . . . . . . . . . . . . — 0% U.S. Dollars
10.2 Trade and other receivables
Trade and other receivables comprise the following at December 31:
2019 2018$’000 $’000
Trade receivables . . . . . . . . . . . . . . . . . . . . . . . . . . . . . . . . 237,022 75,719Less — allowance for doubtful debts . . . . . . . . . . . . . . . . . . (4,543) (4,964)
232,479 70,755Tax receivables(1) . . . . . . . . . . . . . . . . . . . . . . . . . . . . . . . . 45,948 60,851Government grant receivables . . . . . . . . . . . . . . . . . . . . . . . 19,748 16,606Other receivables . . . . . . . . . . . . . . . . . . . . . . . . . . . . . . . . 10,889 7,784
Total . . . . . . . . . . . . . . . . . . . . . . . . . . . . . . . . . . . . . . . . . 309,064 155,996
(1) ‘‘Tax receivables’’ is primarily related to VAT receivables, which are recovered either by offsetting againstVAT payables or are expected to be refunded by the tax authorities in the relevant jurisdictions.
The trade and other receivables disclosed above are short-term in nature and therefore theircarrying amount is considered to approximate their fair value.
128

Ferroglobe PLC and Subsidiaries
Notes to the Consolidated Financial Statements (Continued)
December 31, 2019, 2018 and 2017
(U.S. Dollars in thousands, except share and per share data)
10. Financial assets and other receivables (Continued)
The changes in the allowance for doubtful debts during 2019 and 2018 were as follows:
Allowance$’000
Balance at January 1, 2018 . . . . . . . . . . . . . . . . . . . . . . . . . . . . . 17,346Impairment losses recognized . . . . . . . . . . . . . . . . . . . . . . . . . . . . 3,190Amounts written off as uncollectible . . . . . . . . . . . . . . . . . . . . . . . . (15,118)Exchange differences . . . . . . . . . . . . . . . . . . . . . . . . . . . . . . . . . . . (454)
Balance at December 31, 2018 . . . . . . . . . . . . . . . . . . . . . . . . . . . 4,964Impairment losses recognized . . . . . . . . . . . . . . . . . . . . . . . . . . . . 2,517Amounts written off as uncollectible . . . . . . . . . . . . . . . . . . . . . . . . (100)Changes in the scope of consolidation . . . . . . . . . . . . . . . . . . . . . . (2,750)Exchange differences . . . . . . . . . . . . . . . . . . . . . . . . . . . . . . . . . . . (88)
Balance at December 31, 2019 . . . . . . . . . . . . . . . . . . . . . . . . . . . 4,543
Government grants
The Company has been awarded government grants in relation to its operations in France,Spain and Norway, including grants in relation to the compensation of costs associated with theemission of CO2.
During the year ended December 31, 2019, the Company recognized $33,327 thousand ofincome related to government grants, of which $33,327 thousand was deducted against the relatedexpense in cost of sales (2018: $26,369 thousand of income, of which $18,923 thousand wasdeducted against the related expense in cost of sales and $7,446 thousand was recognized asother operating income). The Company has no unfulfilled conditions in relation to governmentgrants, but certain grants would be repayable if the Company were to substantially curtailproduction or employment at certain plants.
At December 31, 2019, no factoring arrengements were in place. At December 31, 2018, thecarrying amounts of the government grant receivables include receivables which were subject to afactoring arrangement. Under this arrangement, the Company transferred receivables to the factorin exchange for cash and was prevented from selling or pledging the receivables. However, theCompany retained late payment and credit risk. The Company therefore continues to recognise thetransferred assets in their entirety in its balance sheet. The amount repayable under the factoringagreement is presented as secured borrowing. At December 31, 2018, the carrying amount of boththe factored receivables and the secured borrowings was $6,913 thousand.
Factoring of other receivables
The Company has no factoring without recourse arrangements for receivables as ofDecember 31, 2019. There were $6,102 thousand of factored receivables outstanding as ofDecember 31, 2018. These factoring arrangements transfer substantially all the economic risks and
129

Ferroglobe PLC and Subsidiaries
Notes to the Consolidated Financial Statements (Continued)
December 31, 2019, 2018 and 2017
(U.S. Dollars in thousands, except share and per share data)
10. Financial assets and other receivables (Continued)
rewards associated with the ownership of accounts receivable to a third party and therefore areaccounted for by derecognizing the accounts receivable upon receiving the cash proceeds of thefactoring arrangement.
11. Inventories
Inventories comprise the following at December 31:
2019 2018$’000 $’000
Finished goods . . . . . . . . . . . . . . . . . . . . . . . . . . . . . . . . . 158,056 197,982Raw materials in progress and industrial supplies . . . . . . . . . 140,689 222,912Other inventories . . . . . . . . . . . . . . . . . . . . . . . . . . . . . . . . 54,564 34,887Advances to suppliers . . . . . . . . . . . . . . . . . . . . . . . . . . . . 812 1,189
Total . . . . . . . . . . . . . . . . . . . . . . . . . . . . . . . . . . . . . . . . . 354,121 456,970
During 2019 the Company recognised an expense of $4,295 thousand (2018:$11,376 thousand) in respect of write-downs of inventory to net realisable value. The Companyrecords expense for the write-down of inventories to Cost of sales in the consolidated incomestatement.
At December 31, 2019, approximately $33 million of inventories in the Company’s subsidiariesin the United States and Canada were pledged forming part of the borrowing base for the NorthAmerican asset-based revolving credit facility (the ‘‘ABL Revolver’’). At December 31, 2018,approximately $314 million of inventories were secured as collateral for then outstanding loanagreements.
12. Other assets
Other assets comprise the following at December 31:
2019 2018Non-Current Current Total Non-Current Current Total
$’000 $’000 $’000 $’000 $’000 $’000
Guarantees and depositsgiven . . . . . . . . . . . . . . . . 1,100 9 1,109 2,208 11 2,219
Prepayments and accruedincome . . . . . . . . . . . . . . 10 13,415 13,425 16 3,672 3,688
Biological assets . . . . . . . . . — — — 7,790 — 7,790Other assets . . . . . . . . . . . . 487 10,252 10,739 472 5,130 5,602
Total . . . . . . . . . . . . . . . . . 1,597 23,676 25,273 10,486 8,813 19,299
Biological assets comprise timber farms in South Africa, which are a source of raw materialsused for the production of silicon metal. The biological assets were sold during 2019 for netproceeds of ZAR 130 million.
130

Ferroglobe PLC and Subsidiaries
Notes to the Consolidated Financial Statements (Continued)
December 31, 2019, 2018 and 2017
(U.S. Dollars in thousands, except share and per share data)
13. Equity
Share capital
Ferroglobe PLC was incorporated on February 5, 2015 and issued one ordinary share with aface value of $1.00. The share was issued but uncalled. On October 13, 2015, the Companyincreased its share capital by £50,000 by issuing 50,000 sterling non-voting redeemable preferenceshares (the ‘‘Non-voting Shares’’) as well as 14 ordinary shares with a par value of $1.00.Subsequently on October 13, 2015, the Company consolidated the 15 ordinary shares at a parvalue of $1.00 to two ordinary shares with a par value of $7.50, for a total amount of $15.00.
On December 23, 2015, the Company acquired all of the issued and outstanding ordinaryshares from Grupo Villar Mir, S.A.U., par value e1,000 per share, of Grupo FerroAtlantica, S.A.U. inexchange for 98,078,161 newly-issued Ferroglobe Class A ordinary shares, nominal value $7.50 pershare, making Grupo FerroAtlantica, S.A.U. a wholly-owned subsidiary of the Company. Thecompany subsequently redeemed all Non-voting Shares.
Subsequently on December 23, 2015, Gordon Merger Sub, Inc., a wholly owned subsidiary ofthe Company, merged with Globe Specialty Metals, Inc., and all outstanding shares of GSMcommon stock, par value $0.0001 per share were converted to the right to receive one newly-issued Ferroglobe ordinary share, nominal value $7.50 per share. The ordinary shares wereregistered by the Company pursuant to a registration statement on Form F-4, which was declaredeffective by the SEC on August 11, 2015, and trade on the NASDAQ Global Select Market underthe ticker symbol ‘‘GSM.’’
On June 22, 2016 the Company completed a reduction of the share capital and as such thenominal value of each share has been reduced from $7.50 to $0.01, with the amount of the capitalreduction being credited to a distributable reserve.
On November 18, 2016, Class A Ordinary Shares were converted into ordinary shares ofFerroglobe as a result of the distribution of beneficial interest units in the Ferroglobe Representationand Warranty Insurance Trust to certain Ferroglobe shareholders.
During the year ended December 31, 2018, the Company issued 40,000 new ordinary shareupon exercise of stock options and cancelled 1,152,958 ordinary shares pursuant to a sharerepurchase program (see below).
During the year ended December 31, 2019, the Company did not issue new ordinary sharesof any class.
At December 31, 2019, there were 170,863,773 ordinary shares in issue with a par value of$0.01, for a total issued share capital of $1,784 thousand, (2018: 170,863,773 ordinary shares inissue with a par value of $0.01, for a total issued share capital of $1,784 thousand).
131

Ferroglobe PLC and Subsidiaries
Notes to the Consolidated Financial Statements (Continued)
December 31, 2019, 2018 and 2017
(U.S. Dollars in thousands, except share and per share data)
13. Equity (Continued)
At December 31, 2019, the Company’s largest shareholder is as follows:
Number of SharesBeneficially Percentage of
Name Owned Outstanding Shares(*)
Grupo Villar Mir, S.A.U. . . . . . . . . 91,125,521 53.8%
(*) 169,224,766 ordinary shares were outstanding at 31 December 2019, comprising 170,863,773 shares inissue less 1,733,051 shares held in treasury
Valuation adjustments
Valuation adjustments comprise the following at December 31:
2019 2018$’000 $’000
Actuarial gains and losses . . . . . . . . . . . . . . . . . . . . . . . . . . . 1,248 (390)Hedging instruments and other . . . . . . . . . . . . . . . . . . . . . . . (3,417) (11,169)
Total . . . . . . . . . . . . . . . . . . . . . . . . . . . . . . . . . . . . . . . . . . (2,169) (11,559)
Capital management
The Company’s primary objective is to maintain a balanced and sustainable capital structurethrough the industry’s economic cycles, while keeping the cost of capital at competitive levels so asto fund the Company’s growth. The main sources of financing are as follows:
1. cash flow from operations;
2. bank borrowings, including asset-based loans;
3. debt instruments, including the senior Notes due 2022.
Although the securitization program has been part of the Company’s consolidated Balancesince September 5, 2019, the Company continues in its efforts to focus on optimizing its workingcapital.
The Company manages its capital structure and makes adjustments in light of changes ineconomic conditions and the requirements of financial covenants. To maintain or adjust the capitalstructure, the Company may restructure or issue new borrowings or debt, make dividend payments,
132

Ferroglobe PLC and Subsidiaries
Notes to the Consolidated Financial Statements (Continued)
December 31, 2019, 2018 and 2017
(U.S. Dollars in thousands, except share and per share data)
13. Equity (Continued)
return capital to shareholders or issue new shares. Management’s review of the Company’s capitalstructure includes monitoring of the leverage ratio, which was as follows at December 31:
2019 2018 2017$’000 $’000 $’000
Gross financial debt(*) . . . . . . . . . . . . . . . . . . . 606,361 645,389 571,337Cash, restricted cash and cash equivalents . . . (123,175) (216,647) (184,472)
Total net financial debt . . . . . . . . . . . . . . . . . 483,186 428,742 386,865
Total equity(**) . . . . . . . . . . . . . . . . . . . . . . . . 602,297 884,372 937,758Total net financial debt / total equity . . . . . . . 80.22% 48.48% 41.25%
(*) Gross financial debt comprises bank borrowings, obligations under leases, debt instruments and otherfinancial liabilities.
(**) Total equity comprises all capital and reserves of Company as stated in the consolidated statement offinancial position.
The classification of the Company’s gross financial debt between non-current and current atDecember 31 is as follows:
2019 2018 2017Balance Balance Balance
$’000 % $’000 % $’000 %
Non-current gross financial debt . . . . . 548,531 90.46% 560,738 86.88% 458,056 80.17%Current gross financial debt . . . . . . . . 57,830 9.54% 84,651 13.12% 113,281 19.83%
Total gross financial debt . . . . . . . . . 606,361 100.00% 645,389 100.00% 571,337 100.00%
Share Repurchase Program
At a general meeting of its shareholders held on August 3, 2018, shareholders grantedauthority to the Company to effect share repurchases. The Company is accordingly authorised for aperiod of five years to enter into contracts with appointed brokers under which the Company mayundertake purchases of its ordinary shares — acquired by the brokers on the NASDAQ andthrough other permitted channels of up to approximately 10% of its issued ordinary share capital, ata minimum price of $0.01 per share, at a maximum price for such shares of 5% above the averagevolume-weighted average price of the Company’s shares over the five business days prior topurchase and subject to additional restrictions (including as to pricing, volume, timing and the useof brokers or dealers) under applicable U.S. securities laws.
Subsequently, the Company’s Board of Directors authorised the repurchase of up to$20,000 thousand of the Company’s ordinary shares in the period ending December 31, 2018. OnNovember 7, 2018, the Company completed this repurchase program, resulting in the acquisition ofa total of 2,894,049 ordinary shares for total consideration of $20,100 thousand, including
133

Ferroglobe PLC and Subsidiaries
Notes to the Consolidated Financial Statements (Continued)
December 31, 2019, 2018 and 2017
(U.S. Dollars in thousands, except share and per share data)
13. Equity (Continued)
applicable stamp duty of $100 thousand. The average price paid per share was $6.89. The sharerepurchase program resulted in 1,152,958 ordinary shares purchased and cancelled and 1,741,091ordinary shares purchased into treasury, all of which remained held in treasury at December 31,2018.
During the year ended December 31, 2019, there are not new shares repurchased by theCompany.
Dividends
There have not been dividends paid or proposed by the Company during the year endedDecember 31, 2019.
On May 21, 2018, the Board of Directors approved an interim dividend per ordinary share of$0.06. The dividend totaling $10,321 thousand, was paid on June 29, 2018 to shareholders ofrecord at the close of business on June 8, 2018.
On August 20, 2018, the Board of Directors approved an interim dividend per ordinary shareof $0.06. The dividend totaling $10,321 thousand, was paid on September 20, 2018 to shareholdersof record at the close of business on September 5, 2018.
There were no dividends paid or proposed by the Company during the year endedDecember 31, 2017.
Non-controlling interests
The changes in non-controlling interests in the consolidated statements of financial position in2019 and 2018 were as follows:
Balance$’000
Balance at January 1, 2018 . . . . . . . . . . . . . . . . . . . . . . . . . . . . . . . 121,734Loss for the year . . . . . . . . . . . . . . . . . . . . . . . . . . . . . . . . . . . . . . . . (19,088)Increase of Parent’s indirect ownership interest in FerroAtlantica de
Venezuela S.A. . . . . . . . . . . . . . . . . . . . . . . . . . . . . . . . . . . . . . . . 14,389Translation differences and other . . . . . . . . . . . . . . . . . . . . . . . . . . . . (890)
Balance at December 31, 2018 . . . . . . . . . . . . . . . . . . . . . . . . . . . . . 116,145
Loss for the year . . . . . . . . . . . . . . . . . . . . . . . . . . . . . . . . . . . . . . . . (5,039)Increase of Parent’s indirect ownership interest in Ferrosolar OPCO
Group SL. and Rocas, Arcillas y Minerales, S.A. . . . . . . . . . . . . . . . 5,881Translation differences and other . . . . . . . . . . . . . . . . . . . . . . . . . . . . 1,090
Balance at December 31, 2019 . . . . . . . . . . . . . . . . . . . . . . . . . . . . . 118,077
134
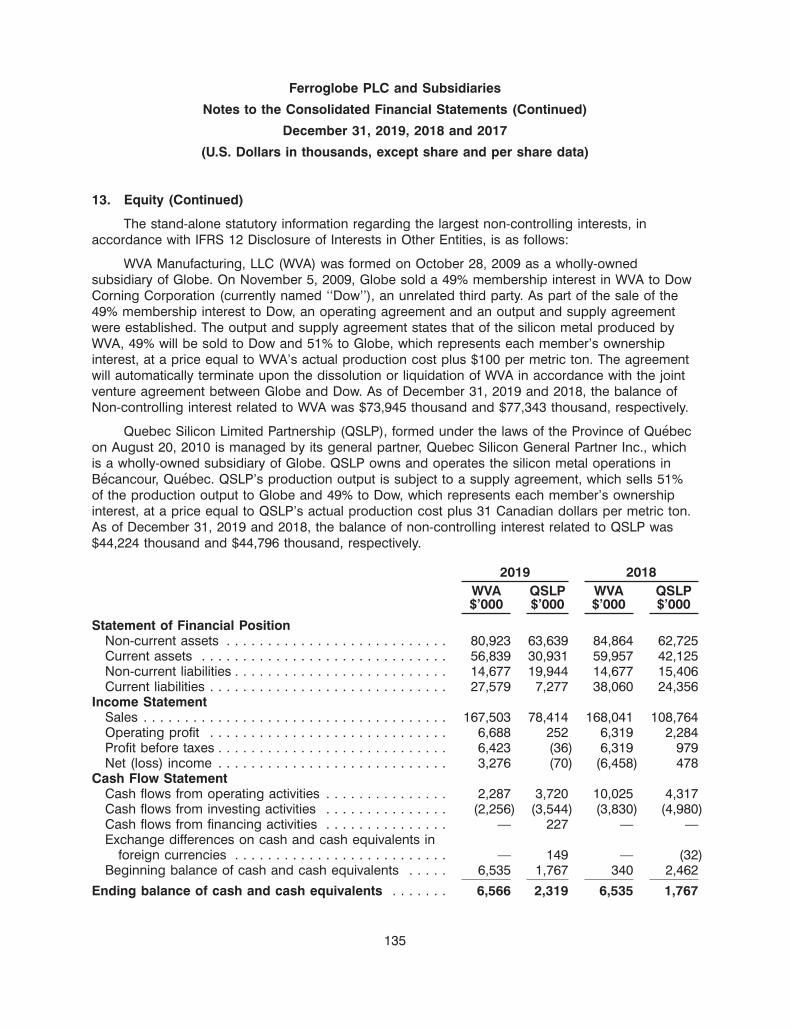
Ferroglobe PLC and Subsidiaries
Notes to the Consolidated Financial Statements (Continued)
December 31, 2019, 2018 and 2017
(U.S. Dollars in thousands, except share and per share data)
13. Equity (Continued)
The stand-alone statutory information regarding the largest non-controlling interests, inaccordance with IFRS 12 Disclosure of Interests in Other Entities, is as follows:
WVA Manufacturing, LLC (WVA) was formed on October 28, 2009 as a wholly-ownedsubsidiary of Globe. On November 5, 2009, Globe sold a 49% membership interest in WVA to DowCorning Corporation (currently named ‘‘Dow’’), an unrelated third party. As part of the sale of the49% membership interest to Dow, an operating agreement and an output and supply agreementwere established. The output and supply agreement states that of the silicon metal produced byWVA, 49% will be sold to Dow and 51% to Globe, which represents each member’s ownershipinterest, at a price equal to WVA’s actual production cost plus $100 per metric ton. The agreementwill automatically terminate upon the dissolution or liquidation of WVA in accordance with the jointventure agreement between Globe and Dow. As of December 31, 2019 and 2018, the balance ofNon-controlling interest related to WVA was $73,945 thousand and $77,343 thousand, respectively.
Quebec Silicon Limited Partnership (QSLP), formed under the laws of the Province of Quebecon August 20, 2010 is managed by its general partner, Quebec Silicon General Partner Inc., whichis a wholly-owned subsidiary of Globe. QSLP owns and operates the silicon metal operations inBecancour, Quebec. QSLP’s production output is subject to a supply agreement, which sells 51%of the production output to Globe and 49% to Dow, which represents each member’s ownershipinterest, at a price equal to QSLP’s actual production cost plus 31 Canadian dollars per metric ton.As of December 31, 2019 and 2018, the balance of non-controlling interest related to QSLP was$44,224 thousand and $44,796 thousand, respectively.
2019 2018WVA QSLP WVA QSLP$’000 $’000 $’000 $’000
Statement of Financial PositionNon-current assets . . . . . . . . . . . . . . . . . . . . . . . . . . . 80,923 63,639 84,864 62,725Current assets . . . . . . . . . . . . . . . . . . . . . . . . . . . . . . 56,839 30,931 59,957 42,125Non-current liabilities . . . . . . . . . . . . . . . . . . . . . . . . . . 14,677 19,944 14,677 15,406Current liabilities . . . . . . . . . . . . . . . . . . . . . . . . . . . . . 27,579 7,277 38,060 24,356
Income StatementSales . . . . . . . . . . . . . . . . . . . . . . . . . . . . . . . . . . . . . 167,503 78,414 168,041 108,764Operating profit . . . . . . . . . . . . . . . . . . . . . . . . . . . . . 6,688 252 6,319 2,284Profit before taxes . . . . . . . . . . . . . . . . . . . . . . . . . . . . 6,423 (36) 6,319 979Net (loss) income . . . . . . . . . . . . . . . . . . . . . . . . . . . . 3,276 (70) (6,458) 478
Cash Flow StatementCash flows from operating activities . . . . . . . . . . . . . . . 2,287 3,720 10,025 4,317Cash flows from investing activities . . . . . . . . . . . . . . . (2,256) (3,544) (3,830) (4,980)Cash flows from financing activities . . . . . . . . . . . . . . . — 227 — —Exchange differences on cash and cash equivalents in
foreign currencies . . . . . . . . . . . . . . . . . . . . . . . . . . — 149 — (32)Beginning balance of cash and cash equivalents . . . . . 6,535 1,767 340 2,462
Ending balance of cash and cash equivalents . . . . . . . 6,566 2,319 6,535 1,767
135

Ferroglobe PLC and Subsidiaries
Notes to the Consolidated Financial Statements (Continued)
December 31, 2019, 2018 and 2017
(U.S. Dollars in thousands, except share and per share data)
14. (Loss) earnings per ordinary share
Basic (loss) earnings per ordinary share are calculated by dividing the consolidated profit(loss) for the year attributable to the Parent by the weighted average number of ordinary sharesoutstanding during the year, excluding the average number of treasury shares held in the year, ifany. Dilutive (loss) earnings per share assumes the exercise of stock options, provided that theeffect is dilutive.
2019 2018 2017
Basic (loss) earnings per ordinary sharecomputation
Numerator:Profit (loss) attributable to the Parent ($’000) . . . . . . (280,601) 43,661 (678)
Denominator:Weighted average basic shares outstanding . . . . . . 169,152,905 171,406,272 171,949,128
Basic (loss) earnings per ordinary share ($) . . . . . . (1.66) 0.25 —
Diluted (loss) earnings per ordinary sharecomputation
Numerator:Profit (loss) attributable to the Parent ($’000) . . . . . . (280,601) 43,661 (678)
Denominator:Weighted average basic shares outstanding . . . . . . 169,152,905 171,406,272 171,949,128Effect of dilutive securities . . . . . . . . . . . . . . . . . . . — 123,340 —
Weighted average dilutive shares outstanding . . . . . . . 169,152,905 171,529,612 171,949,128
Diluted (loss) earnings per ordinary share ($) . . . . . (1.66) 0.25 —
Potential ordinary shares of 445,008, of 269,116, and of 70,673 were excluded from thecalculation of diluted (loss) earnings per ordinary share in 2019, 2018, and 2017 respectivelybecause their effect would be anti-dilutive.
136

Ferroglobe PLC and Subsidiaries
Notes to the Consolidated Financial Statements (Continued)
December 31, 2019, 2018 and 2017
(U.S. Dollars in thousands, except share and per share data)
15. Provisions
Provisions comprise the following at December 31:
2019 2018Non- Current Current Total Non- Current Current Total
$’000 $’000 $’000 $’000 $’000 $’000
Provision for pensions . . . . . . . . . . . . . 56,679 1,050 57,729 52,529 197 52,726Environmental provision . . . . . . . . . . . . 2,923 1,185 4,108 2,880 331 3,211Provisions for litigation . . . . . . . . . . . . . — 3,905 3,905 — 2,399 2,399Provisions for third-party liability . . . . . . 9,263 — 9,263 7,270 — 7,270Provisions for C02 emissions
allowances . . . . . . . . . . . . . . . . . . . . 5,776 29,162 34,938 2,859 25,111 27,970Other provisions . . . . . . . . . . . . . . . . . 10,211 10,789 21,000 10,249 12,532 22,781
Total . . . . . . . . . . . . . . . . . . . . . . . . . . 84,852 46,091 130,943 75,787 40,570 116,357
The changes in the various line items of provisions in 2019 and 2018 were as follows:
Provisions forProvisions for Provisions for CO2
Provision for Environmental Litigation Third Party Emissions OtherPensions Provision in Progress Liability Allowances Provisions Total
$’000 $’000 $’000 $’000 $’000 $’000 $’000
Balance at January 1, 2018 . . . . . . . . . . . 59,195 3,467 11,732 7,639 7,281 26,178 115,492
Charges for the year . . . . . . . . . . . . . . . 4,611 103 392 229 26,348 2,483 34,166Provisions reversed with a credit to income . . . (36) — — (9) — (1,524) (1,569)Amounts used . . . . . . . . . . . . . . . . . . . (2,076) — (9,595) (239) (5,470) (3,039) (20,419)Provision against equity . . . . . . . . . . . . . . (3,568) — — — — — (3,568)Transfers from/(to) other accounts . . . . . . . . 277 — — — — — 277Exchange differences and others . . . . . . . . (5,677) (359) (130) (350) (189) (2,035) (8,740)Additions from business combinations (see
Note 5) . . . . . . . . . . . . . . . . . . . . . — — — — — 735 735Disposals from business divestitures . . . . . . — — — — — (17) (17)
Balance at December 31, 2018 . . . . . . . . . 52,726 3,211 2,399 7,270 27,970 22,781 116,357
Charges for the year . . . . . . . . . . . . . . . 7,444 820 2,166 2,361 18,794 2,958 34,543Provisions reversed with a credit to income . . . (1,798) — — (74) — (1,101) (2,973)Amounts used . . . . . . . . . . . . . . . . . . . (2,019) — (650) (179) (9,452) (723) (13,023)Provision against equity . . . . . . . . . . . . . . 2,244 — — — — — 2,244Exchange differences and others . . . . . . . . (868) 77 (10) (115) (249) (441) (1,606)Disposals from business divestitures . . . . . . — — — — (2,125) (2,474) (4,599)
Balance at December 31, 2019 . . . . . . . . . 57,729 4,108 3,905 9,263 34,938 21,000 130,943
The main provisions relating to employee pension obligations are as follows:
France
These relate to various obligations assumed by FerroPem, SAS with various groups ofemployees relate to long-service benefits, medical insurance supplements and retirement
137

Ferroglobe PLC and Subsidiaries
Notes to the Consolidated Financial Statements (Continued)
December 31, 2019, 2018 and 2017
(U.S. Dollars in thousands, except share and per share data)
15. Provisions (Continued)
obligations, all of which are unfunded defined benefit obligations, whose changes in 2019 and 2018were as follows:
2019 2018$’000 $’000
Obligations at the beginning of year . . . . . . . . . . . . . . . . . . 28,049 29,768Current service cost . . . . . . . . . . . . . . . . . . . . . . . . . . . . . . . . 1,951 1,678Borrowing costs . . . . . . . . . . . . . . . . . . . . . . . . . . . . . . . . . . 524 470Actuarial differences . . . . . . . . . . . . . . . . . . . . . . . . . . . . . . . . 4,432 (700)Benefits paid . . . . . . . . . . . . . . . . . . . . . . . . . . . . . . . . . . . . . (1,581) (1,818)Exchange differences . . . . . . . . . . . . . . . . . . . . . . . . . . . . . . . (580) (1,349)
Obligations at the end of year . . . . . . . . . . . . . . . . . . . . . . . 32,795 28,049
At December 31, 2019 and 2018, the effect of a 1% change in discount rate would haveresulted in a change to the provision of approximately $4,767 thousand and $3,664 thousand,respectively.
The following table reflects the gross benefit payments that are expected to be paid for thebenefit plans for the year ended December 31, 2019:
2019$’000
2020 . . . . . . . . . . . . . . . . . . . . . . . . . . . . . . . . . . . . . . . . . . . . . . . . . . . 1,0202021 . . . . . . . . . . . . . . . . . . . . . . . . . . . . . . . . . . . . . . . . . . . . . . . . . . . 9092022 . . . . . . . . . . . . . . . . . . . . . . . . . . . . . . . . . . . . . . . . . . . . . . . . . . . 1,4002023 . . . . . . . . . . . . . . . . . . . . . . . . . . . . . . . . . . . . . . . . . . . . . . . . . . . 2,0412024 . . . . . . . . . . . . . . . . . . . . . . . . . . . . . . . . . . . . . . . . . . . . . . . . . . . 2,249Years 2025 - 2029 . . . . . . . . . . . . . . . . . . . . . . . . . . . . . . . . . . . . . . . . . 8,336
The subsidiary recognized provisions in this connection based on an actuarial studyperformed by an independent expert.
South Africa
Defined benefit plans relate to Retirement medical aid obligations and Retirement benefits.Actuarial valuations are performed periodically by independent third parties and in the actuary’sopinion the fund was in a sound financial position. The valuation was based upon the amounts asper the latest valuation report received from third party experts.
Retirement medical aid obligations
The Company provides post-retirement benefits by way of medical aid contributions foremployees and dependents.
138

Ferroglobe PLC and Subsidiaries
Notes to the Consolidated Financial Statements (Continued)
December 31, 2019, 2018 and 2017
(U.S. Dollars in thousands, except share and per share data)
15. Provisions (Continued)
Retirement benefits
It is the policy of the Company to provide retirement benefits to all its employees andtherefore membership of the retirement fund is compulsory. The Company has both definedcontribution and defined benefit plans. The pension fund obligation is recognized in currentprovisions as the Company will contribute the difference to the plan assets within the next12 months.
In this regard, the changes of this provision in 2019 and 2018 were as follows:
2019 2018$’000 $’000
Obligations at beginning of year . . . . . . . . . . . . . . . . . . . . 5,429 7,872Current service cost . . . . . . . . . . . . . . . . . . . . . . . . . . . . . . 90 139Borrowing costs . . . . . . . . . . . . . . . . . . . . . . . . . . . . . . . . . 511 740Actuarial differences . . . . . . . . . . . . . . . . . . . . . . . . . . . . . . (1,291) (2,000)Benefits paid . . . . . . . . . . . . . . . . . . . . . . . . . . . . . . . . . . . . (254) (226)Exchange differences . . . . . . . . . . . . . . . . . . . . . . . . . . . . . 116 (1,096)
Obligations at end of year . . . . . . . . . . . . . . . . . . . . . . . . . 4,601 5,429
At December 31, 2019 and 2018, the effect of a 1% change in the cost of the medical aidwould have resulted in a change to the provision of approximately $562 thousand and$216 thousand, respectively.
The breakdown, in percentage, of the plan assets are as follows:
2019 2018
Cash . . . . . . . . . . . . . . . . . . . . . . . . . . . . . . . . . . . . . . . . . . 1.50% 1.72%Equity . . . . . . . . . . . . . . . . . . . . . . . . . . . . . . . . . . . . . . . . . . 42.25% 47.42%Bond . . . . . . . . . . . . . . . . . . . . . . . . . . . . . . . . . . . . . . . . . . 15.64% 13.62%Property . . . . . . . . . . . . . . . . . . . . . . . . . . . . . . . . . . . . . . . . 2.78% 2.67%International . . . . . . . . . . . . . . . . . . . . . . . . . . . . . . . . . . . . . 32.51% 30.27%Others . . . . . . . . . . . . . . . . . . . . . . . . . . . . . . . . . . . . . . . . . 5.32% 4.30%
Total . . . . . . . . . . . . . . . . . . . . . . . . . . . . . . . . . . . . . . . . . . . 100.00% 100.00%
139

Ferroglobe PLC and Subsidiaries
Notes to the Consolidated Financial Statements (Continued)
December 31, 2019, 2018 and 2017
(U.S. Dollars in thousands, except share and per share data)
15. Provisions (Continued)
As of December 31, 2019 and 2018 the Plan assets amounted to $2,126 thousand and$1,906 thousand, respectively. Changes in the fair value of plan assets linked to the defined benefitplans in South Africa were as set forth in the following table:
2019 2018$’000 $’000
Fair value of plan assets at the beginning of the year . . . . . 1,906 2,248Interest income on assets . . . . . . . . . . . . . . . . . . . . . . . . . . . 194 216Benefits paid . . . . . . . . . . . . . . . . . . . . . . . . . . . . . . . . . . . . . — (50)Actuarial differences . . . . . . . . . . . . . . . . . . . . . . . . . . . . . . . . (81) (228)Other . . . . . . . . . . . . . . . . . . . . . . . . . . . . . . . . . . . . . . . . . . 107 (280)
Fair value of plan assets at the end of the year . . . . . . . . . . 2,126 1,906
Actual return on assets . . . . . . . . . . . . . . . . . . . . . . . . . . . . 113 (11)
Venezuela
Benefit Plan
The company FerroVen has pension obligations to all of its employees who, once reachingretirement age, have accumulated at least 15 years of service to the company and receive aVenezuelan Social Security Institute (IVSS) pension. In addition to the pension paid by the IVSS,80% of the basic salary accrued when the pension benefit is awarded is guaranteed and paid bymeans of a lifelong monthly pension.
The most recent of the present value of the defined benefit obligation actuarial valuation wasdetermined at December 31, 2019 by independent actuaries. The present value of the unfundedobligation for defined benefit cost, the current service cost and past service cost were determinedusing the projected unit credit method.
In this regards, the changes of this provision in 2019 and 2018 were as follows:
2019 2018$’000 $’000
Obligations at the beginning of year . . . . . . . . . . . . . . . . . 534 1,883Current service cost . . . . . . . . . . . . . . . . . . . . . . . . . . . . . . 50 775Borrowing costs . . . . . . . . . . . . . . . . . . . . . . . . . . . . . . . . . 1,128 —Benefits paid . . . . . . . . . . . . . . . . . . . . . . . . . . . . . . . . . . . . (3) (35)Exchange differences . . . . . . . . . . . . . . . . . . . . . . . . . . . . . (1,200) (2,089)Other . . . . . . . . . . . . . . . . . . . . . . . . . . . . . . . . . . . . . . . . . 2,068 —
Obligations at the end of year . . . . . . . . . . . . . . . . . . . . . . 2,577 534
140
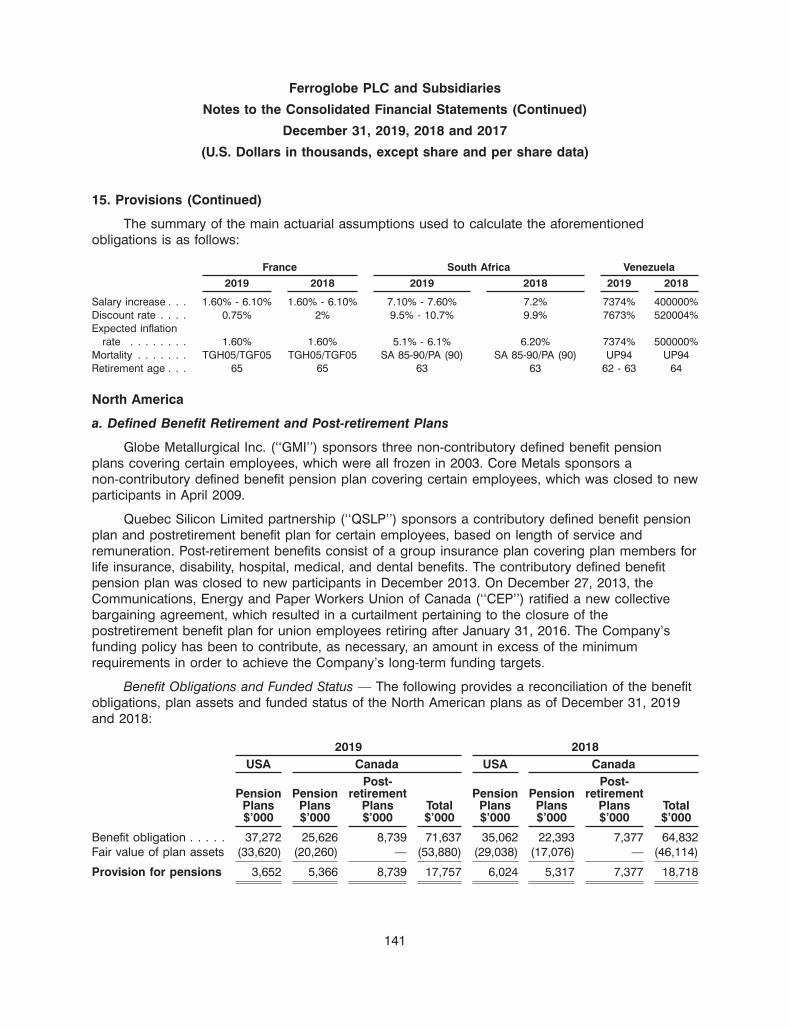
Ferroglobe PLC and Subsidiaries
Notes to the Consolidated Financial Statements (Continued)
December 31, 2019, 2018 and 2017
(U.S. Dollars in thousands, except share and per share data)
15. Provisions (Continued)
The summary of the main actuarial assumptions used to calculate the aforementionedobligations is as follows:
France South Africa Venezuela2019 2018 2019 2018 2019 2018
Salary increase . . . 1.60% - 6.10% 1.60% - 6.10% 7.10% - 7.60% 7.2% 7374% 400000%Discount rate . . . . 0.75% 2% 9.5% - 10.7% 9.9% 7673% 520004%Expected inflation
rate . . . . . . . . 1.60% 1.60% 5.1% - 6.1% 6.20% 7374% 500000%Mortality . . . . . . . TGH05/TGF05 TGH05/TGF05 SA 85-90/PA (90) SA 85-90/PA (90) UP94 UP94Retirement age . . . 65 65 63 63 62 - 63 64
North America
a. Defined Benefit Retirement and Post-retirement Plans
Globe Metallurgical Inc. (‘‘GMI’’) sponsors three non-contributory defined benefit pensionplans covering certain employees, which were all frozen in 2003. Core Metals sponsors anon-contributory defined benefit pension plan covering certain employees, which was closed to newparticipants in April 2009.
Quebec Silicon Limited partnership (‘‘QSLP’’) sponsors a contributory defined benefit pensionplan and postretirement benefit plan for certain employees, based on length of service andremuneration. Post-retirement benefits consist of a group insurance plan covering plan members forlife insurance, disability, hospital, medical, and dental benefits. The contributory defined benefitpension plan was closed to new participants in December 2013. On December 27, 2013, theCommunications, Energy and Paper Workers Union of Canada (‘‘CEP’’) ratified a new collectivebargaining agreement, which resulted in a curtailment pertaining to the closure of thepostretirement benefit plan for union employees retiring after January 31, 2016. The Company’sfunding policy has been to contribute, as necessary, an amount in excess of the minimumrequirements in order to achieve the Company’s long-term funding targets.
Benefit Obligations and Funded Status — The following provides a reconciliation of the benefitobligations, plan assets and funded status of the North American plans as of December 31, 2019and 2018:
2019 2018USA Canada USA Canada
Post- Post-Pension Pension retirement Pension Pension retirement
Plans Plans Plans Total Plans Plans Plans Total$’000 $’000 $’000 $’000 $’000 $’000 $’000 $’000
Benefit obligation . . . . . 37,272 25,626 8,739 71,637 35,062 22,393 7,377 64,832Fair value of plan assets (33,620) (20,260) — (53,880) (29,038) (17,076) — (46,114)
Provision for pensions 3,652 5,366 8,739 17,757 6,024 5,317 7,377 18,718
141

Ferroglobe PLC and Subsidiaries
Notes to the Consolidated Financial Statements (Continued)
December 31, 2019, 2018 and 2017
(U.S. Dollars in thousands, except share and per share data)
15. Provisions (Continued)
All North American pension and post-retirement plans are underfunded. At December 31, 2019and 2018, the accumulated benefit obligation was $62,898 thousand and $57,455 thousand for thedefined pension plan and $8,739 thousand and $7,377 thousand for the post-retirement plans,respectively.
The assumptions used to determine benefit obligations at December 31, 2019 and 2018 forthe North American plans are as follows:
North America — 2019 North America — 2018
USA Canada USA Canada
Pension Pension Postretirement Pension Pension PostretirementPlan Plan Plan Plan Plan Plan
Salary increase . . . . . . . . . . N/A 2.75% - 3.00% N/A N/A 2.75% - 3.00% N/ADiscount rate . . . . . . . . . . . 3.00% 3.15% 3.15% 4.00% 3.80% 3.90%Expected inflation rate . . . . . . N/A N/A N/A N/A N/A N/AMortality . . . . . . . . . . . . . . Pri-2012 CPM2014- CPM2014- SOA RP-2014 CPM2014- CPM2014-
Blue Collar Private Private Scale Blue Collar Private PrivateMortality CPM-B Mortality
Retirement age . . . . . . . . . . 65 58 - 60 58 - 60 65 62 62
The discount rate used in calculating the present value of our pension plan obligations isdeveloped based on the BPS&M Pension Discount Curve for 2019 and 2018 and the MercerProprietary Yield Curve for 2019 and 2018 for QSLP Pension and post-retirement benefit plans andthe expected cash flows of the benefit payments.
The Company expects to make discretionary contributions of approximately $1,159 thousandto the defined benefit pension and post-retirement plans for the year ending December 31, 2020.
142

Ferroglobe PLC and Subsidiaries
Notes to the Consolidated Financial Statements (Continued)
December 31, 2019, 2018 and 2017
(U.S. Dollars in thousands, except share and per share data)
15. Provisions (Continued)
The following reflects the gross benefit payments that are expected to be paid in future yearsfor the benefit plans for the year ended December 31:
Non-pensionPostretirement
Pension Plans Plans$’000 $’000
2020 . . . . . . . . . . . . . . . . . . . . . . . . . . . . . . . . . . . 2,290 1932021 . . . . . . . . . . . . . . . . . . . . . . . . . . . . . . . . . . . 2,286 1982022 . . . . . . . . . . . . . . . . . . . . . . . . . . . . . . . . . . . 2,253 1952023 . . . . . . . . . . . . . . . . . . . . . . . . . . . . . . . . . . . 2,313 2112024 . . . . . . . . . . . . . . . . . . . . . . . . . . . . . . . . . . . 2,353 220Years 2025 - 2029 . . . . . . . . . . . . . . . . . . . . . . . . . 12,494 1,477
The accumulated non-pension postretirement benefit obligation has been determined byapplication of the provisions of the Company’s health care and life insurance plans includingestablished maximums, relevant actuarial assumptions and health care cost trend rates projected at5.3% for 2019 and decreasing to an ultimate rate of 4.0% in fiscal 2040. At December, 31 2019 and2018, the effect of a 1% increase in health care cost trend rate on the non-pension postretirementbenefit obligation is $1,809 thousand and $1,535 thousand, respectively. At December, 31 2019 and2018 the effect of a 1% decrease in health care cost trend rate on the non-pension postretirementbenefit obligation is ($1,374) thousand and ($1,194) thousand.
The changes to these obligations in the current year ended December 31, 2019 were asfollows:
2019USA Canada
Pension Plans Pension Plans Post-retirement Total$’000 $’000 Plans $’000 $’000
Obligations at the beginning ofyear . . . . . . . . . . . . . . . . . . . . . . 35,062 22,393 7,377 64,832
Service cost . . . . . . . . . . . . . . . . . . 136 131 287 554Borrowing cost . . . . . . . . . . . . . . . . 1,359 852 291 2,502Actuarial differences . . . . . . . . . . . . 2,842 1,971 563 5,376Benefits paid . . . . . . . . . . . . . . . . . (2,036) (864) (162) (3,062)Exchange differences . . . . . . . . . . . — 1,143 383 1,526Expenses . . . . . . . . . . . . . . . . . . . . (91) — — (91)
Obligations at the end of year . . . . 37,272 25,626 8,739 71,637
143
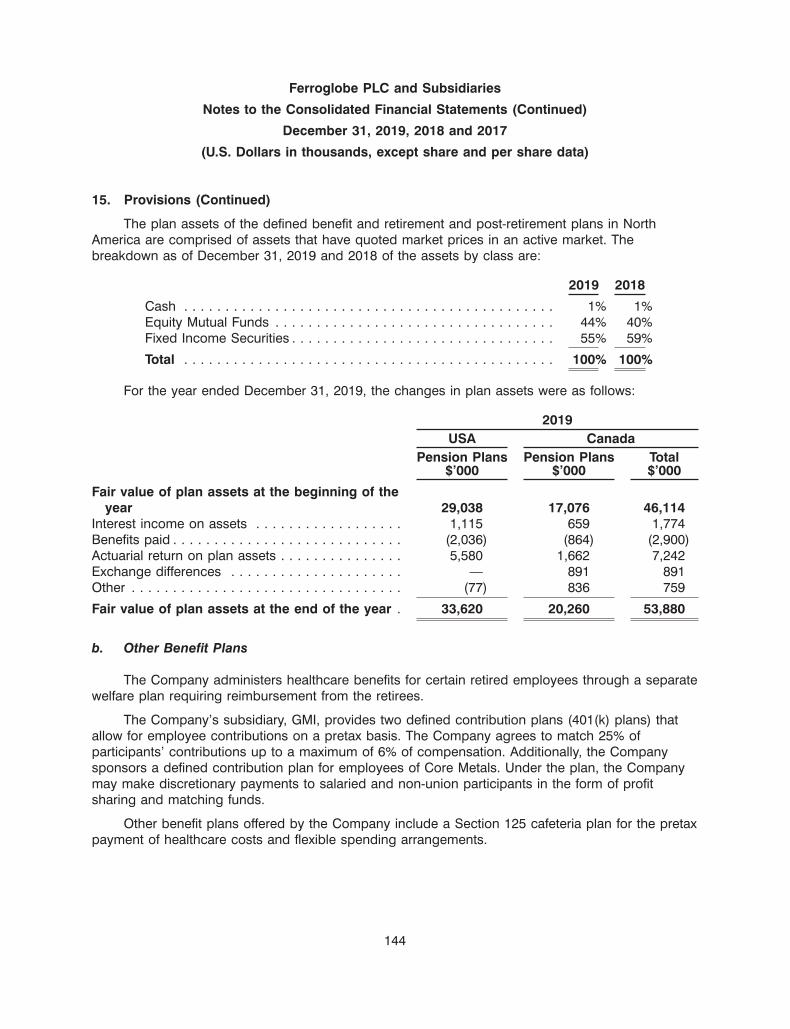
Ferroglobe PLC and Subsidiaries
Notes to the Consolidated Financial Statements (Continued)
December 31, 2019, 2018 and 2017
(U.S. Dollars in thousands, except share and per share data)
15. Provisions (Continued)
The plan assets of the defined benefit and retirement and post-retirement plans in NorthAmerica are comprised of assets that have quoted market prices in an active market. Thebreakdown as of December 31, 2019 and 2018 of the assets by class are:
2019 2018
Cash . . . . . . . . . . . . . . . . . . . . . . . . . . . . . . . . . . . . . . . . . . . . . 1% 1%Equity Mutual Funds . . . . . . . . . . . . . . . . . . . . . . . . . . . . . . . . . . 44% 40%Fixed Income Securities . . . . . . . . . . . . . . . . . . . . . . . . . . . . . . . . 55% 59%
Total . . . . . . . . . . . . . . . . . . . . . . . . . . . . . . . . . . . . . . . . . . . . . 100% 100%
For the year ended December 31, 2019, the changes in plan assets were as follows:
2019USA Canada
Pension Plans Pension Plans Total$’000 $’000 $’000
Fair value of plan assets at the beginning of theyear 29,038 17,076 46,114
Interest income on assets . . . . . . . . . . . . . . . . . . 1,115 659 1,774Benefits paid . . . . . . . . . . . . . . . . . . . . . . . . . . . . (2,036) (864) (2,900)Actuarial return on plan assets . . . . . . . . . . . . . . . 5,580 1,662 7,242Exchange differences . . . . . . . . . . . . . . . . . . . . . — 891 891Other . . . . . . . . . . . . . . . . . . . . . . . . . . . . . . . . . (77) 836 759
Fair value of plan assets at the end of the year . 33,620 20,260 53,880
b. Other Benefit Plans
The Company administers healthcare benefits for certain retired employees through a separatewelfare plan requiring reimbursement from the retirees.
The Company’s subsidiary, GMI, provides two defined contribution plans (401(k) plans) thatallow for employee contributions on a pretax basis. The Company agrees to match 25% ofparticipants’ contributions up to a maximum of 6% of compensation. Additionally, the Companysponsors a defined contribution plan for employees of Core Metals. Under the plan, the Companymay make discretionary payments to salaried and non-union participants in the form of profitsharing and matching funds.
Other benefit plans offered by the Company include a Section 125 cafeteria plan for the pretaxpayment of healthcare costs and flexible spending arrangements.
144

Ferroglobe PLC and Subsidiaries
Notes to the Consolidated Financial Statements (Continued)
December 31, 2019, 2018 and 2017
(U.S. Dollars in thousands, except share and per share data)
15. Provisions (Continued)
Environmental provision
Environmental provisions relate to $2,923 thousand of non-current environmental rehabilitationobligations (2018: $2,880 thousand) and $1,185 thousand of current environmental rehabilitationobligations (2018: $331 thousand).
Provisions for litigation
Certain employees of FerroPem, SAS, then known as Pechiney Electrometallurgie, S.A., mayhave been exposed to asbestos at its plants in France in the decades prior to FerroAtlantica’spurchase of that business in December 2004. The Company has recognized a provision of$1,166 thousand during the year ended December 31, 2019 as part of the current portion ofProvisions for litigation (2018: $1,775 thousand). The associated expense has been recorded toStaff costs in the Consolidated Income Statement. See Note 24 for further information.
The timing and amounts potential liabilities arising from such exposures is uncertain. Theprovision reflects the Company’s best estimate of the expenditure required to meet resultingobligations.
Grupo FerroAtlantica, S.A.U. assumes expenses for litigation provisions of FerroManganeseFrance, in relation to the dismissal of two employees of the latter company. The amount of theprovision recognised as of December 31, 2019 is $1,161 thousand.
FerroManganese Norway registers a provision for litigation in December 2019, based on thesettlement of the lawsuit against a crane supplier. The amount of the provision recognized as ofDecember 31, 2019 is $1,048 thousand.
Provisions for third-party liability
Provisions for third-party liability relate to current obligations ($9,263 thousand) relating tohealth costs for retired employees (2018: $7,270 thousand).
Other provisions
Included in other provisions are current obligations arising from past actions that involve aprobable outflow of resources that can be reliably estimated. Other provisions include taxes of$4,866 thousand (2018: $7,323 thousand) and other provisions of $16,134 thousand (2018:$15,458 thousand).
145

Ferroglobe PLC and Subsidiaries
Notes to the Consolidated Financial Statements (Continued)
December 31, 2019, 2018 and 2017
(U.S. Dollars in thousands, except share and per share data)
16. Bank borrowings
Bank borrowings comprise the following at December 31:
2019Non-Current Current
Limit Amount Amount Total$’000 $’000 $’000 $’000
Borrowings carried at amortised cost:Credit facilities . . . . . . . . . . . . . . . . . . . . . . . . . . . 100,000 45,449 12,600 58,049Other loans . . . . . . . . . . . . . . . . . . . . . . . . . . . . . . 150,000 98,939 2,011 100,950
Total . . . . . . . . . . . . . . . . . . . . . . . . . . . . . . . . . . 144,388 14,611 158,999
2018Non-Current Current
Limit Amount Amount Total$’000 $’000 $’000 $’000
Borrowings carried at amortised cost:Credit facilities . . . . . . . . . . . . . . . . . . . . . . . . . . . 250,000 132,821 493 133,314Other loans . . . . . . . . . . . . . . . . . . . . . . . . . . . . . . — 7,698 7,698
Total . . . . . . . . . . . . . . . . . . . . . . . . . . . . . . . . . . 132,821 8,191 141,012
Credit facilities
Credit facilities comprise the following at December 31:
2019 2018$’000 $’000
Secured loans carried at amortised costPrincipal amount . . . . . . . . . . . . . . . . . . . . . . . . . . . . . . . . . 62,835 135,919Unamortised issuance costs . . . . . . . . . . . . . . . . . . . . . . . . . (4,786) (3,098)Accrued interest . . . . . . . . . . . . . . . . . . . . . . . . . . . . . . . . . . — 493
Total . . . . . . . . . . . . . . . . . . . . . . . . . . . . . . . . . . . . . . . . . . 58,049 133,314
Amount due for settlement within 12 months . . . . . . . . . . . . . 12,600 493Amount due for settlement after 12 months . . . . . . . . . . . . . . 45,449 132,821
Total . . . . . . . . . . . . . . . . . . . . . . . . . . . . . . . . . . . . . . . . . . 58,049 133,314
On February 27, 2018, Ferroglobe entered into a revolving credit facility that provided forborrowings up to an aggregate principal amount of $250,000 thousand (the ‘‘Revolving CreditFacility’’). The Revolving Credit Facility was amended on February 22, 2019, which included areduction in the size of the facility from $250,000 thousand to $200,000 thousand. The RevolvingCredit Facility was amended further on September 30, 2019, reducing the size of the facility from
146

Ferroglobe PLC and Subsidiaries
Notes to the Consolidated Financial Statements (Continued)
December 31, 2019, 2018 and 2017
(U.S. Dollars in thousands, except share and per share data)
16. Bank borrowings (Continued)
$200,000 thousand to $150,000 thousand. On October 11, 2019, the Revolving Credit Facility wasrepaid using the proceeds from the ABL Revolver and existing cash and cash equivalents, in theamounts of $134,570 thousand.
On October, 11, 2019, Ferroglobe subsidiaries Globe Specialty Metals, Inc., and QSIPCanada ULC, as borrowers, entered into a Credit and Security Agreement for a new $100 millionnorth American asset-based revolving credit facility (the ‘‘ABL Revolver’’), with PNC Bank, N.A., aslender.
The maximum advances granted by the lender are up to the lesser of (a) $100 million and(b) the Formula Amount. The Formula Amount at any time will be determined by reference to themost recent Borrowing Base Certificate delivered to PNC Bank, N.A. (the Agent), and is equal to(a) up to 85% of Eligible Receivables plus (b) the lesser of:
• up to 75% of the cost of Eligible Inventory and eligible foreign-in transit inventory;
• up to 85% of the appraised net orderly liquidation value of Eligible inventory, minus(c) Reserves, if any.
The Formula Amount is subject to the following limits:
• inventory to account for up to 65% of the Formula Amount;
• Canadian inventory up to $20 million;
• eligible in-transit inventory of up to $10 million;
• consigned inventory of up to $10 million;
• consigned inventory of up to $7.5 million;
• stores and spare parts inventory of up to $2 million;
• packaging materials inventory of up to $500 thousand; and
• receivables aged 90 to 120 days due of up to $5 million.
Subject to certain exceptions, loans under the ABL Revolver may be borrowed, repaid andreborrowed at any time until the facility’s expiration date. The legal maturity date of the ABLRevolver is October 11, 2024, which is five years after the initial drawdown under the facility.Notwithstanding this, the terms of the facility provide a spring forward provision which requires theABL Revolver to be repaid on the date which is three (3) months prior to the maturity date of thesenior Notes (March 1, 2022), which would currently imply a facility repayment date of December 1,2021. This spring forward provision would adjust in respect of a refinancing of the senior Notes tobe the date which is three (3) months prior to the date of any permitted refinancing of the Notes.There is a provision in the ABL Revolver credit agreement which requires the approval of PNCBank, as agent on behalf of the lender, to the terms of any refinancing of the senior unsecuredNotes and provides, inter alia, that the maturity date of such of refinancing shall be no earlier thanJanuary 9, 2025.
147

Ferroglobe PLC and Subsidiaries
Notes to the Consolidated Financial Statements (Continued)
December 31, 2019, 2018 and 2017
(U.S. Dollars in thousands, except share and per share data)
16. Bank borrowings (Continued)
Interest Rates
Under the ABL Revolver, and in respect of LIBOR Rate Loans, the interest to be paid will beLIBOR plus aplicable margin, and in respect of Domestic Rate Loans, the interest will be ABR plusaplicable margin. ABR shall mean the highest of (i) the PNC Bank prime rate, (ii) overnight bankfunding rate plus 0.5% and (iii) daily LIBOR plus 1.0%.
The applicable margin is based on the average undrawn availability of the ABL Revolver. Theundrawn availability is an amount equal to:
• the lesser of (i) $100 million and (ii) the Formula Amount; minus
• the maximum undrawn amount of $10 million all outstanding letters of credit; minus
• the outstanding amount of revolving advances and swing loans, with a limit of $45 million
Therefore, three levels are established depending on the average undrawn availabity. TheLevel I means that the average undrawn availability is higher than 66.7%, the applicable LIBOR ratemargin will be 2.50% and the aplicable Domestic rate margin will be 1.50%. The Level II means thatthe average undrawn availability is more than 33.3% to less or equal 66.7%, the applicable LIBORrate margin will be 2.75% and the applicable Domestic rate margin will be 1.75%. The Level IIImeans if average undrawn availability is lower or equal to 33.3%, the applicable LIBOR rate marginwill be 3.00% and the Domestic rate margin will be 2.00%. As a result, the applicable margin fromthe Closing date of the ABL Revolver to January 1, 2020, will be Level III rate. Thereafter, effectiveas of the first day of each calendar quarter, the rate corresponding to the average daily undrawnavailability for the most recently completed calendar quarter.
Guarantees and security
Ferroglobe PLC was not required to provide a guarantee of the ABL Revolver, but entered intoa Non-Recourse Pledge Agreement with lender in respect of its shares in Globe SpecialtyMetals, Inc.
Covenants
The ABL Revolver contains certain affirmative covenants relating to, among other things:(i) preservation of existence; (ii) payment of taxes; (iii) continuation of business; (iv) maintenance ofinsurance on its properties and assets; (v) maintenance and protection of rights of properties;(vi) visitation rights granted to the Administrative Agent and (vii) maintain and keep proper books ofrecord and account. The ABL Revolver also contains certain negative covenants, relating to, amongother things: (i) debt; (ii) liens; (iii) liquidations, mergers or consolidation; (iv) amendment oforganizational documents; (v) restricted payments (including dividends, distributions, issuances ofequity interests, redemptions and repurchases of equity interests); (vi) sale and leasebacktransactions and (vii) further negative pledges. The ABL Revolver does not contain any leverage-based or financial ratio-based covenants, but requires minimum undrawn availability of$10,000 thousand and a restricted cash reserve of $22,500 thousand. See ‘‘Note 10.’’
148

Ferroglobe PLC and Subsidiaries
Notes to the Consolidated Financial Statements (Continued)
December 31, 2019, 2018 and 2017
(U.S. Dollars in thousands, except share and per share data)
16. Bank borrowings (Continued)
Under the ABL Revolver, Globe Specialty Metals, Inc., and QSIP Canada ULC pledged assetsas collateral to PNC Bank as follows: eligible third party receivables in the sum of $31.5M, andeligible inventory including raw materials, WIP, finished goods, spare parts and packaging in thesum of $33M. Deducted from the eligible assets are outstanding letters of credit equaling $4.5Mand a minimum undrawn availability of $10M, leaving a total ABL Revolver balance of $50.2M as atDecember 31, 2019.
Other Loans
As a result of the consolidation of the SPE since September 5, 2019, that part of the purchaseprice of the accounts receivable sold into the receivables securitization program not received incash is deferred in the form of loans, in senior and subordinated tranches, held by the Company.
During 2019, following certain termination events under the current accounts receivableprogram, ING’s senior loan commitments were reduced to $75,000 thousand and the Company andING agreed the program would terminate during the fourth quarter of 2019, unless otherwiserefinanced.
On December 10, 2019, the Company refinanced the program and amended and restated itsterms. The SPE repaid the remaining senior loans to ING with the proceeds of new senior loansissued by an affiliate of Sound Point Capital Management LP. The new senior lender’s commitmentsunder the amended and restated securitization program are $150,000 thousand, of which $104,130was drawn at December 31, 2019. Finacity remain an intermediate subordinated lender and theCompany’s European subsidiaries continue as senior subordinated and junior subordinated lendersas well as having a new interest in the senior and intermediate subordinated loan tranches. Thereconstituted program has a two-year term until December 10, 2021. See Note 10.
Foreign currency exposure of bank borrowings
The breakdown by currency of bank borrowings at December 31, is as follows:
2019Non-Current Current
Principal PrincipalAmount Amount Total
$’000 $’000 $’000
Borrowings in US Dollars . . . . . . . . . . . . . . . . . . . . . . . . . . . 144,388 14,611 158,999Borrowings in Euros . . . . . . . . . . . . . . . . . . . . . . . . . . . . . . — — —
Total . . . . . . . . . . . . . . . . . . . . . . . . . . . . . . . . . . . . . . . . . 144,388 14,611 158,999
149
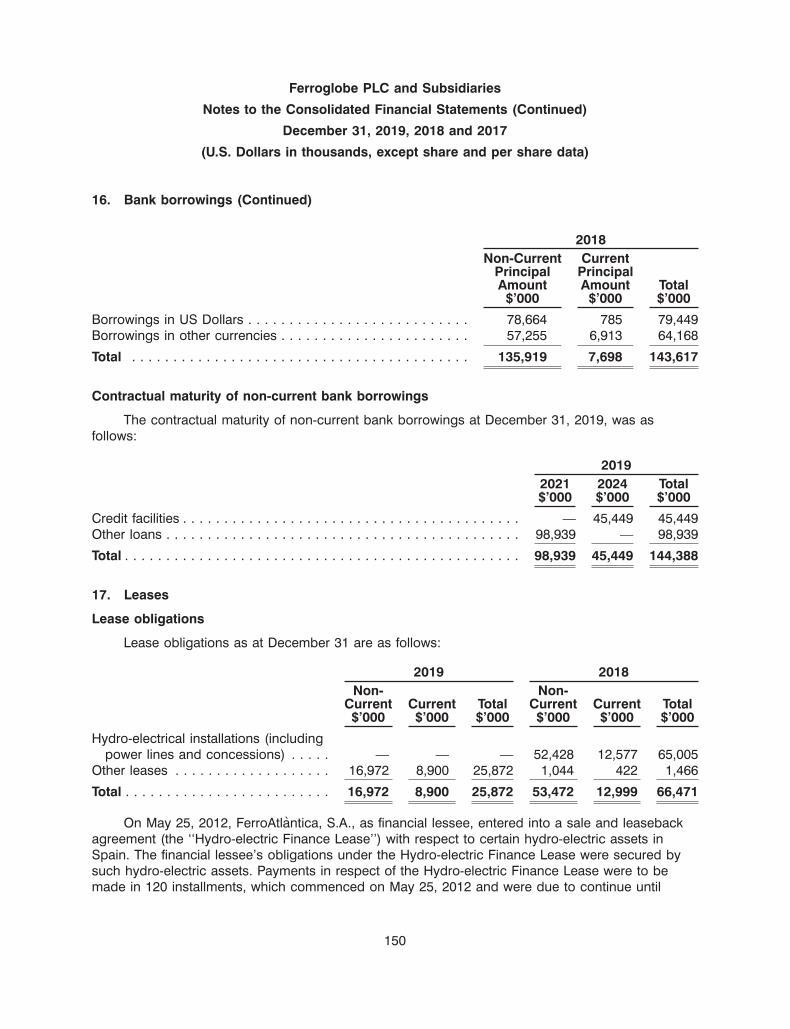
Ferroglobe PLC and Subsidiaries
Notes to the Consolidated Financial Statements (Continued)
December 31, 2019, 2018 and 2017
(U.S. Dollars in thousands, except share and per share data)
16. Bank borrowings (Continued)
2018Non-Current Current
Principal PrincipalAmount Amount Total
$’000 $’000 $’000
Borrowings in US Dollars . . . . . . . . . . . . . . . . . . . . . . . . . . . 78,664 785 79,449Borrowings in other currencies . . . . . . . . . . . . . . . . . . . . . . . 57,255 6,913 64,168
Total . . . . . . . . . . . . . . . . . . . . . . . . . . . . . . . . . . . . . . . . . 135,919 7,698 143,617
Contractual maturity of non-current bank borrowings
The contractual maturity of non-current bank borrowings at December 31, 2019, was asfollows:
20192021 2024 Total$’000 $’000 $’000
Credit facilities . . . . . . . . . . . . . . . . . . . . . . . . . . . . . . . . . . . . . . . . . — 45,449 45,449Other loans . . . . . . . . . . . . . . . . . . . . . . . . . . . . . . . . . . . . . . . . . . . 98,939 — 98,939
Total . . . . . . . . . . . . . . . . . . . . . . . . . . . . . . . . . . . . . . . . . . . . . . . . 98,939 45,449 144,388
17. Leases
Lease obligations
Lease obligations as at December 31 are as follows:
2019 2018Non- Non-
Current Current Total Current Current Total$’000 $’000 $’000 $’000 $’000 $’000
Hydro-electrical installations (includingpower lines and concessions) . . . . . — — — 52,428 12,577 65,005
Other leases . . . . . . . . . . . . . . . . . . . 16,972 8,900 25,872 1,044 422 1,466
Total . . . . . . . . . . . . . . . . . . . . . . . . . 16,972 8,900 25,872 53,472 12,999 66,471
On May 25, 2012, FerroAtlantica, S.A., as financial lessee, entered into a sale and leasebackagreement (the ‘‘Hydro-electric Finance Lease’’) with respect to certain hydro-electric assets inSpain. The financial lessee’s obligations under the Hydro-electric Finance Lease were secured bysuch hydro-electric assets. Payments in respect of the Hydro-electric Finance Lease were to bemade in 120 installments, which commenced on May 25, 2012 and were due to continue until
150

Ferroglobe PLC and Subsidiaries
Notes to the Consolidated Financial Statements (Continued)
December 31, 2019, 2018 and 2017
(U.S. Dollars in thousands, except share and per share data)
17. Leases (Continued)
maturity on May 25, 2022. The outstanding amounts under this loan accrued interest at a rate equalto six-month EURIBOR plus 3.5%. FAU prepaid the outstanding installments before the Companysold that entity on August 30, 2019.
During the year ended December, 31, 2019 the Company likewise terminated the leases of itsSpanish hydroelectric facilities pursuant to the sale of FAU.
The detail, by maturity, of the non-current payment obligations under finance leases as ofDecember 31, 2019 is as follows:
2021 2022 2023 2024 2025 and after Total$’000 $’000 $’000 $’000 $’000 $’000
Other leases . . . . . . . . . . . . . . . . . . . . 6,898 4,835 3,603 920 716 16,972
Total . . . . . . . . . . . . . . . . . . . . . . . . . 6,898 4,835 3,603 920 716 16,972
Future net minimum lease payments are as follows:
Present valueUndiscounted of
minimum lease minimum leasepayments payments
2019 2018 2019 2018$’000 $’000 $’000 $’000
Within 1 year . . . . . . . . . . . . . . . . . . . . . . . . . . . . . . . . . . . . 10,161 13,362 8,900 12,999Between 1 and 5 years . . . . . . . . . . . . . . . . . . . . . . . . . . . . 17,569 61,556 16,256 53,472After 5 years . . . . . . . . . . . . . . . . . . . . . . . . . . . . . . . . . . . . 911 — 716 —
Total minimum lease payments . . . . . . . . . . . . . . . . . . . . . 28,641 74,918 25,872 66,471Less: amounts representing finance lease charges . . . . . . . . . 2,769 8,447 — —
Present value of minimum lease payments . . . . . . . . . . . . . 25,872 66,471 25,872 66,471
151

Ferroglobe PLC and Subsidiaries
Notes to the Consolidated Financial Statements (Continued)
December 31, 2019, 2018 and 2017
(U.S. Dollars in thousands, except share and per share data)
18. Debt instruments
Debt instruments comprise the following at December 31:
2019 2018$’000 $’000
Unsecured notes carried at amortised costPrincipal amount . . . . . . . . . . . . . . . . . . . . . . . . . . . . . . . . . . . . . . . . . . . . . 350,000 350,000Unamortised issuance costs . . . . . . . . . . . . . . . . . . . . . . . . . . . . . . . . . . . . . (5,986) (8,343)Accrued coupon interest . . . . . . . . . . . . . . . . . . . . . . . . . . . . . . . . . . . . . . . 10,937 10,937
Total . . . . . . . . . . . . . . . . . . . . . . . . . . . . . . . . . . . . . . . . . . . . . . . . . . . . . . 354,951 352,594
Amount due for settlement within 12 months . . . . . . . . . . . . . . . . . . . . . . . . . 10,937 10,937Amount due for settlement after 12 months . . . . . . . . . . . . . . . . . . . . . . . . . . 344,014 341,657
Total . . . . . . . . . . . . . . . . . . . . . . . . . . . . . . . . . . . . . . . . . . . . . . . . . . . . . . 354,951 352,594
On February 15, 2017, Ferroglobe and Globe (together, the ‘‘Issuers’’) issued$350,000 thousand aggregate principal amount of 9.375% senior unsecured notes due March 1,2022 (the ‘‘Notes’’). The proceeds were used primarily to repay existing indebtedness, includingborrowings, certain credit facilities and other loans. Issuance costs of $12,116 thousand wereincurred. The principal amounts of the senior Notes issued by each of Ferroglobe and Globe were$150,000 thousand and $200,000 thousand, respectively. Interest on the Notes is payablesemi-annually on March 1 and September 1 of each year, commencing on September 1, 2017.
At any time prior to March 1, 2019, the Issuers might have redeemed all or a portion of theNotes at a redemption price based on a ‘‘make-whole’’ premium. At any time on or after March 1,2019, the Issuers might redeem all or a portion of the Notes at redemption prices varying based onthe period during which the redemption occurs. In addition, at any time prior to March 1, 2019, theIssuers might have redeemed up to 35% of the aggregate principal amount of the Notes with thenet proceeds from certain equity offerings at a redemption price of 109.375% of the principalamount of the Notes, plus accrued and unpaid interest.
The Notes are senior unsecured obligations of the Issuers and are guaranteed on a seniorbasis by certain subsidiaries of Ferroglobe. The Notes are listed on the Irish Stock Exchange. Theassociated Indenture contains certain negative covenants. Additionally, if the Issuers experience achange of control the Indenture requires the Issuers to offer to redeem the Notes at 101% of theirprincipal amount. Grupo Villar Mir S.A.U. owns 53.9% of the Company’s outstanding shares andhas pledged them to secure its obligations to certain banks. The Company would experience achange in control and would be required to offer redemption of bonds in accordance with theIndenture if Grupo Villar Mir S.A.U. defaults on the underlying loan. See Note 27 for furtherinformation.
The fair value of the Notes, determined by reference to the closing market price on the lasttrading day of the year, was $219,118 thousand as at December 31, 2019 (December 31, 2018:$288,022 thousand).
152

Ferroglobe PLC and Subsidiaries
Notes to the Consolidated Financial Statements (Continued)
December 31, 2019, 2018 and 2017
(U.S. Dollars in thousands, except share and per share data)
19. Other financial liabilities
Other financial liabilities comprise the following at December 31:
2019 2018Non- Non-
Current Current Total Current Current Total$’000 $’000 $’000 $’000 $’000 $’000
Financial loans from governmentagencies . . . . . . . . . . . . . . . . . . . . 33,557 23,382 56,939 9,325 52,524 61,849
Derivative financial instruments . . . . . . 9,600 — 9,600 23,463 — 23,463
Total . . . . . . . . . . . . . . . . . . . . . . . . . 43,157 23,382 66,539 32,788 52,524 85,312
Financial loans from government agencies
On September 8, 2016, FerroAtlantica, S.A.U, as borrower, and the Spanish Ministry ofIndustry, Tourism and Commerce (the ‘‘Ministry’’), as lender, entered into two loan agreementsunder which the Ministry made available to the borrower loans in aggregate principal amount ofe44,999 thousand and e26,909 thousand, respectively, in connection with industrial developmentprojects relating to the Company’s solar grade silicon project. The loan of e44,999 thousand iscontractually due to be repaid in 7 installments over a 10-year period with the first three years as agrace period. The loan of e26,909 thousand was repaid in April 2018. Interest on outstandingamounts under each loan accrues at an annual rate of 2.29%. As of December 31, 2019, theamortized cost of the loan was e44,765 thousand (equivalent to $50,289 thousand) (2018:e44,706 thousand and $51,189 thousand). In November 2018, FAU agreed to transfer to OpCocertain assets which had been acquired with the proceeds of the REINDUS Loan and usedexclusively by OpCo in connection with the joint venture in consideration of OpCo assuming liabilityfor the REINDUS Loan.
The agreements governing the loans contain the following limitations on the use of theproceeds of the outstanding loan: (1) the investment of the proceeds must occur betweenJanuary 1, 2016 and February 24, 2019; (2) the allocation of the proceeds must adhere to certainapproved budget categories; (3) if the final investment cost is lower than the budgeted amount, theborrower must reimburse the Ministry proportionally; and (4) the borrower must comply with certainstatutory restrictions regarding related party transactions and the procurement of goods andservices. On May 24, 2019, a report on uses of the loan was presented to the Ministry. As ofDecember 31, 2019, the balance of these loans have been presented in current liabilities for theamount due to non-compliance with the loan conditions ($22,961 thousand) and the rest asnon-current liabilities ($27,328 thousand), the split of the loan between current and non currentliabilities has been done according to the report of uses presented to the Ministery, the portionrelated to the amount not used are showed in current liabilities.
The remaining non-current and current balances are related to loans granted mainly by Frenchand Spanish government agencies.
153

Ferroglobe PLC and Subsidiaries
Notes to the Consolidated Financial Statements (Continued)
December 31, 2019, 2018 and 2017
(U.S. Dollars in thousands, except share and per share data)
19. Other financial liabilities (Continued)
Derivative financial instruments
Derivative financial instruments comprise the following at December 31:
2019 2018$’000 $’000
Derivatives designated as hedging instrumentsCross currency swap . . . . . . . . . . . . . . . . . . . . . . . . . . . . . . . . . . . . . . . . . . . . . 7,481 15,883Derivatives not designated as hedging instrumentsCross currency swap . . . . . . . . . . . . . . . . . . . . . . . . . . . . . . . . . . . . . . . . . . . . . 2,119 4,501Interest rate swaps . . . . . . . . . . . . . . . . . . . . . . . . . . . . . . . . . . . . . . . . . . . . . . — 3,079
9,600 23,463
Cross currency swap
The Company’s operations generate cash flows predominantly in Euros and US dollars. TheCompany is exposed to exchange rate fluctuations between these currencies as it expects toconvert Euros into US dollars to settle a proportion of the interest and principal of the Notes (seeNote 18). To manage this currency risk, the Parent Company entered a cross-currency swap (the‘‘CCS’’) on May 12, 2017 where on a semi-annual basis it will receive interest of 9.375% on anotional of $192,500 thousand and pay interest of 8.062% on a notional of e176,638 thousand andit will exchange these Euro and US dollar notional amounts at maturity of the Notes in 2022. Thetiming of payments of interest and principal under the CCS coincide exactly with those of theNotes.
The fair value of the CCS at December 31, 2019 was $9,600 thousand (2018:$20,384 thousand) (see Note 28).
The Parent Company, which has a Euro functional currency, has designated$150,000 thousand of the notional amount of the CCS as a cash flow hedge of the variability of theEuro functional currency equivalents of the future US dollar cash flows of $150,000 thousand of theprincipal amount of the Notes. During the year ended December 31, 2019, the change in fair valueof the CCS has resulted in a gain of $9,663 thousand recognized through other comprehensiveincome in the valuation adjustments reserve (2018: $10,006 thousand loss). During the year endedDecember 31, 2019, the change in value of the hedged item used as the basis for recognizinghedge ineffectiveness for the period was a gain of $8,401 thousand. This cash flow hedge wasassessed to be highly effective at December 31, 2019 and therefore no ineffectiveness wasrecognized in the income statement. Amounts transferred from the valuation adjustments reserve tothe income statement comprise a gain of $2,874 thousand transferred to exchange differences(2018: $7,024 thousand) and a gain of $1,639 thousand transferred to finance costs (2018:$951 thousand). At December 31, 2019, a balance of $3,417 thousand in respect of the cash flowhedge of the CCS remained in the valuation adjustment reserve and will be reclassified to theincome statement as the hedged item affects profit or loss over the period to maturity of the Notes(2018: $8,567 thousand).
154

Ferroglobe PLC and Subsidiaries
Notes to the Consolidated Financial Statements (Continued)
December 31, 2019, 2018 and 2017
(U.S. Dollars in thousands, except share and per share data)
19. Other financial liabilities (Continued)
The remaining $42,500 thousand of the notional amount of the CCS is not designated as acash flow hedge and is accounted for at fair value through profit or loss, resulting in a gain of$2,729 thousand for the year ended December 31, 2019, which is recorded in financial derivativegain in the consolidated income statement (2018: $2,838 thousand), see Note 30.
Interest rate swaps
The Company previously entered into interest rate swaps to manage the risk of changes ininterest rates on certain non-current and current obligations. Since June 30, 2015, the interest rateswaps have been considered as ineffective hedges and as a result the changes in fair value ofthese derivatives are recognized through profit or loss. During the year ended December, 31, 2019the Company disposed of the swap relating to the lease of hydroelectrical installations as part ofthe sale of its 100% interest in subsidiary FerroAtlantica, S.A.U. (‘‘FAU’’) to investment vehiclesaffiliated with TPG Sixth Street Partners. At December 31, 2018, valuation adjustments reserveincludes $2,602 thousand that relates hedgeaccounting, interest rate swap has been cancelledbefore FAU sale on August 30, 2019.
The following interest rate swaps were outstanding at December 31:
2018Nominal Fixed Reference FairAmount Interest Floating Value
$’000 Maturity Rate Interest Rate $’000
Lease of hydroelectrical installations . . . 137,400 2022 2.05 6-month Euribor (3,079)
Total . . . . . . . . . . . . . . . . . . . . . . . . . . (3,079)
20. Trade and other payables
Trade and other payables compose the following at December 31:
2019 2018$’000 $’000
Payable to suppliers . . . . . . . . . . . . . . . . . . . . . . . . . . . . . . . . . . . . . . . . . . 189,092 241,936Trade notes and bills payable . . . . . . . . . . . . . . . . . . . . . . . . . . . . . . . . . . . . 137 14,887
Total . . . . . . . . . . . . . . . . . . . . . . . . . . . . . . . . . . . . . . . . . . . . . . . . . . . . . . 189,229 256,823
155

Ferroglobe PLC and Subsidiaries
Notes to the Consolidated Financial Statements (Continued)
December 31, 2019, 2018 and 2017
(U.S. Dollars in thousands, except share and per share data)
21. Other liabilities
Other liabilities comprise the following at December 31:
2019 2018Non- Non-
Current Current Total Current Current Total$’000 $’000 $’000 $’000 $’000 $’000
Payable to non-current assetsuppliers . . . . . . . . . . . . . . . . . . 182 6,989 7,171 99 11,648 11,747
Guarantees and deposits . . . . . . . . 18 — 18 16 — 16Remuneration payable . . . . . . . . . . 38 33,003 33,041 55 45,705 45,760Tax payables . . . . . . . . . . . . . . . . . — 22,459 22,459 — 20,799 20,799Contingent consideration . . . . . . . . 20,338 1,626 21,964 23,119 3,103 26,222Other liabilities . . . . . . . . . . . . . . . . 5,330 32,352 37,682 1,741 22,315 24,056
Total . . . . . . . . . . . . . . . . . . . . . . . 25,906 96,429 122,335 25,030 103,570 128,600
Tax payables
Tax payables comprise the following at December 31:
2019 2018Current Total Current Total$’000 $’000 $’000 $’000
VAT . . . . . . . . . . . . . . . . . . . . . . . . . . . . . . . . . . . . . . . . . 8,234 8,234 6,491 6,491Accrued social security taxes payable . . . . . . . . . . . . . . . . 7,781 7,781 5,001 5,001Personal income tax withholding payable . . . . . . . . . . . . . . 1,351 1,351 1,436 1,436Other . . . . . . . . . . . . . . . . . . . . . . . . . . . . . . . . . . . . . . . . 5,093 5,093 7,871 7,871
Total . . . . . . . . . . . . . . . . . . . . . . . . . . . . . . . . . . . . . . . . 22,459 22,459 20,799 20,799
Share-based compensation
a. Equity Incentive Plan
On May 29, 2016, the board of Ferroglobe PLC adopted the Ferroglobe PLC Equity IncentivePlan (the ‘‘Plan’’) and on June 29, 2016 the Plan was approved by the shareholders of theCompany. The Plan is a discretionary benefit offered by Ferroglobe PLC for the benefit of selectedsenior employees of Ferroglobe PLC and its subsidiaries. The Plan’s main purpose is to reward andfoster performance through share ownership. Awards under the plan may be structured either asconditional share awards or options with a $nil exercise price (nil cost options). The awards aresubject to a service condition of three years from the date of grant.
156
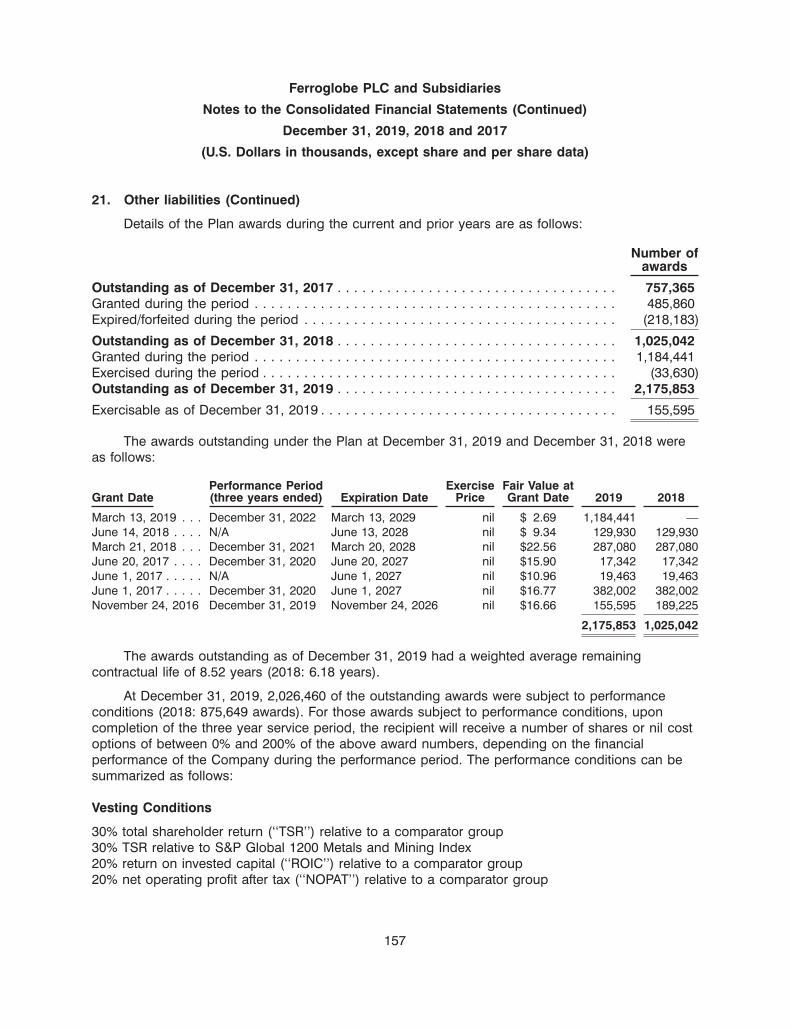
Ferroglobe PLC and Subsidiaries
Notes to the Consolidated Financial Statements (Continued)
December 31, 2019, 2018 and 2017
(U.S. Dollars in thousands, except share and per share data)
21. Other liabilities (Continued)
Details of the Plan awards during the current and prior years are as follows:
Number ofawards
Outstanding as of December 31, 2017 . . . . . . . . . . . . . . . . . . . . . . . . . . . . . . . . . . 757,365Granted during the period . . . . . . . . . . . . . . . . . . . . . . . . . . . . . . . . . . . . . . . . . . . . 485,860Expired/forfeited during the period . . . . . . . . . . . . . . . . . . . . . . . . . . . . . . . . . . . . . . (218,183)
Outstanding as of December 31, 2018 . . . . . . . . . . . . . . . . . . . . . . . . . . . . . . . . . . 1,025,042Granted during the period . . . . . . . . . . . . . . . . . . . . . . . . . . . . . . . . . . . . . . . . . . . . 1,184,441Exercised during the period . . . . . . . . . . . . . . . . . . . . . . . . . . . . . . . . . . . . . . . . . . . (33,630)Outstanding as of December 31, 2019 . . . . . . . . . . . . . . . . . . . . . . . . . . . . . . . . . . 2,175,853
Exercisable as of December 31, 2019 . . . . . . . . . . . . . . . . . . . . . . . . . . . . . . . . . . . . 155,595
The awards outstanding under the Plan at December 31, 2019 and December 31, 2018 wereas follows:
Performance Period Exercise Fair Value atGrant Date (three years ended) Expiration Date Price Grant Date 2019 2018
March 13, 2019 . . . December 31, 2022 March 13, 2029 nil $ 2.69 1,184,441 —June 14, 2018 . . . . N/A June 13, 2028 nil $ 9.34 129,930 129,930March 21, 2018 . . . December 31, 2021 March 20, 2028 nil $22.56 287,080 287,080June 20, 2017 . . . . December 31, 2020 June 20, 2027 nil $15.90 17,342 17,342June 1, 2017 . . . . . N/A June 1, 2027 nil $10.96 19,463 19,463June 1, 2017 . . . . . December 31, 2020 June 1, 2027 nil $16.77 382,002 382,002November 24, 2016 December 31, 2019 November 24, 2026 nil $16.66 155,595 189,225
2,175,853 1,025,042
The awards outstanding as of December 31, 2019 had a weighted average remainingcontractual life of 8.52 years (2018: 6.18 years).
At December 31, 2019, 2,026,460 of the outstanding awards were subject to performanceconditions (2018: 875,649 awards). For those awards subject to performance conditions, uponcompletion of the three year service period, the recipient will receive a number of shares or nil costoptions of between 0% and 200% of the above award numbers, depending on the financialperformance of the Company during the performance period. The performance conditions can besummarized as follows:
Vesting Conditions
30% total shareholder return (‘‘TSR’’) relative to a comparator group30% TSR relative to S&P Global 1200 Metals and Mining Index20% return on invested capital (‘‘ROIC’’) relative to a comparator group20% net operating profit after tax (‘‘NOPAT’’) relative to a comparator group
157
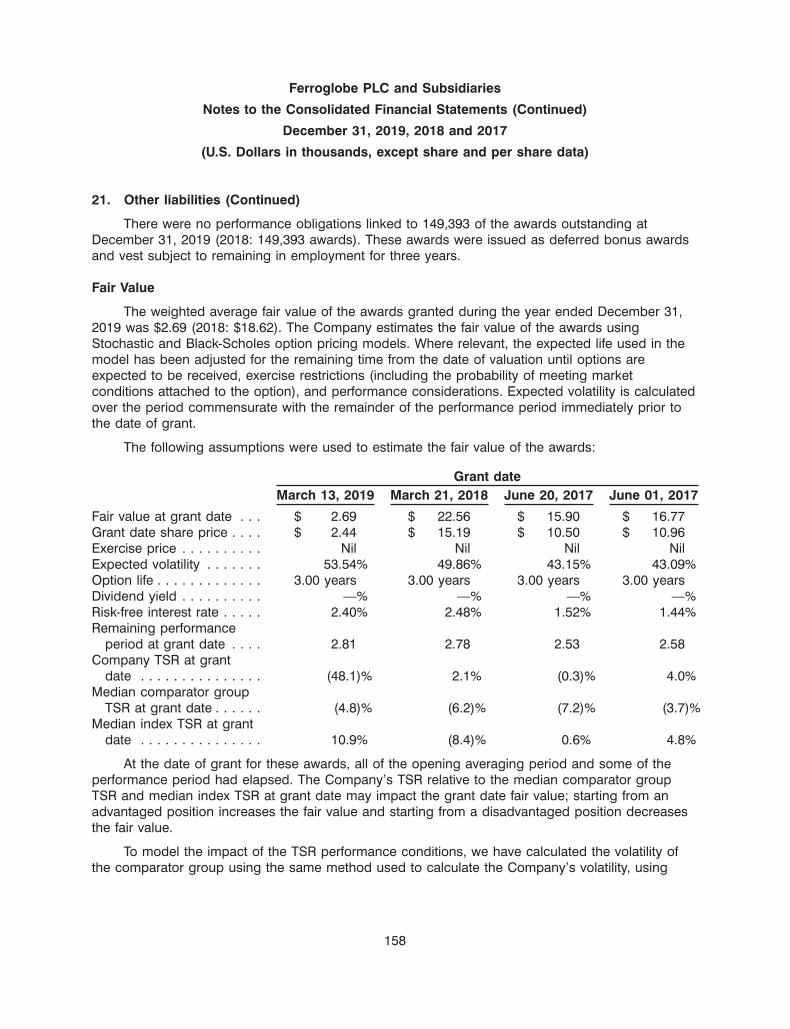
Ferroglobe PLC and Subsidiaries
Notes to the Consolidated Financial Statements (Continued)
December 31, 2019, 2018 and 2017
(U.S. Dollars in thousands, except share and per share data)
21. Other liabilities (Continued)
There were no performance obligations linked to 149,393 of the awards outstanding atDecember 31, 2019 (2018: 149,393 awards). These awards were issued as deferred bonus awardsand vest subject to remaining in employment for three years.
Fair Value
The weighted average fair value of the awards granted during the year ended December 31,2019 was $2.69 (2018: $18.62). The Company estimates the fair value of the awards usingStochastic and Black-Scholes option pricing models. Where relevant, the expected life used in themodel has been adjusted for the remaining time from the date of valuation until options areexpected to be received, exercise restrictions (including the probability of meeting marketconditions attached to the option), and performance considerations. Expected volatility is calculatedover the period commensurate with the remainder of the performance period immediately prior tothe date of grant.
The following assumptions were used to estimate the fair value of the awards:
Grant dateMarch 13, 2019 March 21, 2018 June 20, 2017 June 01, 2017
Fair value at grant date . . . $ 2.69 $ 22.56 $ 15.90 $ 16.77Grant date share price . . . . $ 2.44 $ 15.19 $ 10.50 $ 10.96Exercise price . . . . . . . . . . Nil Nil Nil NilExpected volatility . . . . . . . 53.54% 49.86% 43.15% 43.09%Option life . . . . . . . . . . . . . 3.00 years 3.00 years 3.00 years 3.00 yearsDividend yield . . . . . . . . . . —% —% —% —%Risk-free interest rate . . . . . 2.40% 2.48% 1.52% 1.44%Remaining performance
period at grant date . . . . 2.81 2.78 2.53 2.58Company TSR at grant
date . . . . . . . . . . . . . . . (48.1)% 2.1% (0.3)% 4.0%Median comparator group
TSR at grant date . . . . . . (4.8)% (6.2)% (7.2)% (3.7)%Median index TSR at grant
date . . . . . . . . . . . . . . . 10.9% (8.4)% 0.6% 4.8%
At the date of grant for these awards, all of the opening averaging period and some of theperformance period had elapsed. The Company’s TSR relative to the median comparator groupTSR and median index TSR at grant date may impact the grant date fair value; starting from anadvantaged position increases the fair value and starting from a disadvantaged position decreasesthe fair value.
To model the impact of the TSR performance conditions, we have calculated the volatility ofthe comparator group using the same method used to calculate the Company’s volatility, using
158

Ferroglobe PLC and Subsidiaries
Notes to the Consolidated Financial Statements (Continued)
December 31, 2019, 2018 and 2017
(U.S. Dollars in thousands, except share and per share data)
21. Other liabilities (Continued)
historical data, where available, which matches the length of the remaining performance periodgrant date.
The Company’s correlation with its comparator group was assessed on the basis of allcomparator group correlations, regardless of the degree of correlation, have been incorporated intothe valuation model.
For the year ended December 31, 2019, share-based compensation expense related to thisstock plan amounted to $4,881 thousand, which is recorded in staff costs (2018: $2,798 thousand).
Prior to the business combination, shares of Globe Specialty Metals common stock wereregistered pursuant to Section 12(b) of the Exchange Act and listed on NASDAQ. As a result of thebusiness combination between Ferroglobe and Globe, each share of Globe common stock wasconverted into the right to receive one Ferroglobe ordinary share. The shares of Globe commonstock were suspended from trading on NASDAQ effective as of the opening of trading onDecember 24, 2015. Ferroglobe ordinary shares were approved for listing on The NASDAQ GlobalMarket. At the effective time of the business combination, GSM stock and stock-based awards werereplaced with stock and stock-based awards of Ferroglobe in a one to one exchange.
There were not options that were exercised and 78,630 share options that expired during theyear ended December 31, 2019 (2018: 59,980 options were exercised and 167,990 share optionsexpired)
A summary of options outstanding is as follows:
Weighted-Average
Weighted- RemainingAverage Contractual Aggregate
Number of Exercise Term in IntrinsicOptions Price Years Value
Outstanding as of December 31, 2017 . . . . . 523,361 $15.12 0.89 $ 580Exercised during the period . . . . . . . . . . . . (59,980) 5.89Expired/forfeited during the period . . . . . . . . (167,990) 17.99Cancelled in lieu of cash settlement . . . . . . . (191,761) 12.54
Outstanding as of December 31, 2018 . . . . . 103,630 $19.40 0.44 $1,774
Expired/forfeited during the period . . . . . . . . (78,630) 20.25Outstanding as of December 31, 2019 . . . . . 25,000 $ 16.7 0.16 $ —
Exercisable as of December 31, 2019 . . . . . 25,000 $ 16.7 0.16 $ —
As of December 31, 2019 there are total vested options of 25,000 and no unvested optionsoutstanding (2018: vested options of 103,630 and no unvested options).
159
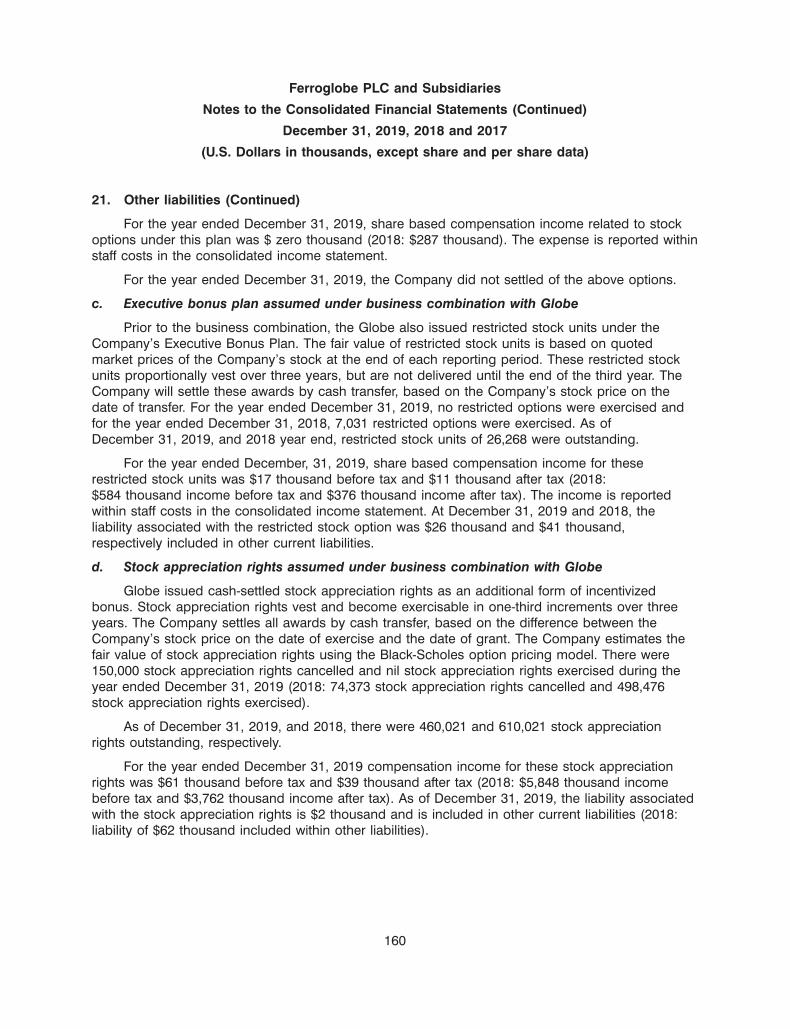
Ferroglobe PLC and Subsidiaries
Notes to the Consolidated Financial Statements (Continued)
December 31, 2019, 2018 and 2017
(U.S. Dollars in thousands, except share and per share data)
21. Other liabilities (Continued)
For the year ended December 31, 2019, share based compensation income related to stockoptions under this plan was $ zero thousand (2018: $287 thousand). The expense is reported withinstaff costs in the consolidated income statement.
For the year ended December 31, 2019, the Company did not settled of the above options.
c. Executive bonus plan assumed under business combination with Globe
Prior to the business combination, the Globe also issued restricted stock units under theCompany’s Executive Bonus Plan. The fair value of restricted stock units is based on quotedmarket prices of the Company’s stock at the end of each reporting period. These restricted stockunits proportionally vest over three years, but are not delivered until the end of the third year. TheCompany will settle these awards by cash transfer, based on the Company’s stock price on thedate of transfer. For the year ended December 31, 2019, no restricted options were exercised andfor the year ended December 31, 2018, 7,031 restricted options were exercised. As ofDecember 31, 2019, and 2018 year end, restricted stock units of 26,268 were outstanding.
For the year ended December, 31, 2019, share based compensation income for theserestricted stock units was $17 thousand before tax and $11 thousand after tax (2018:$584 thousand income before tax and $376 thousand income after tax). The income is reportedwithin staff costs in the consolidated income statement. At December 31, 2019 and 2018, theliability associated with the restricted stock option was $26 thousand and $41 thousand,respectively included in other current liabilities.
d. Stock appreciation rights assumed under business combination with Globe
Globe issued cash-settled stock appreciation rights as an additional form of incentivizedbonus. Stock appreciation rights vest and become exercisable in one-third increments over threeyears. The Company settles all awards by cash transfer, based on the difference between theCompany’s stock price on the date of exercise and the date of grant. The Company estimates thefair value of stock appreciation rights using the Black-Scholes option pricing model. There were150,000 stock appreciation rights cancelled and nil stock appreciation rights exercised during theyear ended December 31, 2019 (2018: 74,373 stock appreciation rights cancelled and 498,476stock appreciation rights exercised).
As of December 31, 2019, and 2018, there were 460,021 and 610,021 stock appreciationrights outstanding, respectively.
For the year ended December 31, 2019 compensation income for these stock appreciationrights was $61 thousand before tax and $39 thousand after tax (2018: $5,848 thousand incomebefore tax and $3,762 thousand income after tax). As of December 31, 2019, the liability associatedwith the stock appreciation rights is $2 thousand and is included in other current liabilities (2018:liability of $62 thousand included within other liabilities).
160

Ferroglobe PLC and Subsidiaries
Notes to the Consolidated Financial Statements (Continued)
December 31, 2019, 2018 and 2017
(U.S. Dollars in thousands, except share and per share data)
21. Other liabilities (Continued)
Contingent consideration
On February 1, 2018 the Company acquired 100% of the outstanding ordinary shares ofKintuck (France) SAS and Kintuck AS from a wholly-owned subsidiary of Glencore International AG(‘‘Glencore’’) and obtained control of both entities. The new subsidiaries were renamed asFerroglobe Mangan Norge AS and Ferroglobe Manganese France SAS. The Company completedthe acquisition through its wholly-owned subsidiary Ferroatlantica., see Note 5. Considerationincluded both cash and contingent consideration.
The contingent consideration arrangement requires the Company to pay the former owners ofKintuck (France) SAS and Kintuck AS a sliding scale commission based on the silicomanganeseand ferromanganese sales spreads of Ferroglobe Mangan Norge and Ferroglobe ManganeseFrance, up to a maximum amount of $60,000 thousand (undiscounted). The contingentconsideration applies to sales made up to eight and a half years from the date of acquisition.
The potential undiscounted amount of all future payments that the Company could berequired to make under the contingent consideration arrangement is between nil and$60,000 thousand.
The fair value of the contingent consideration arrangement as at December, 31, 2019 of$21,965 thousand (2018: $26,222 thousand) was estimated by applying the income approachbased on a Monte Carlo simulation considering various scenarios of fluctuation of futuremanganese alloy spreads as well at the cyclicality of manganese alloy pricing. The fair valuemeasurement is based on significant inputs that are not observable in the market, which IFRS 13Fair Value Measurement refers to as Level 3 inputs. Key assumptions include discount rates of11.5 percent and 11.0 percent for Ferroglobe Mangan Norge and Ferroglobe Manganese Francerespectively (2018: 11.5 percent and 11.0 percent). Average simulated revenues in FerroglobeMangan Norge and Ferroglobe Manganese France combined are between $157,276 thousand and$317,507 thousand per year (2018: between $269,256 thousand and $312,526 thousand).
161

Ferroglobe PLC and Subsidiaries
Notes to the Consolidated Financial Statements (Continued)
December 31, 2019, 2018 and 2017
(U.S. Dollars in thousands, except share and per share data)
22. Tax matters
The components of current and deferred income tax expense (benefit) are as follows:
2019 2018 2017$’000 $’000 $’000
Consolidated income statementCurrent income taxCurrent income tax charge . . . . . . . . . . . . . . . . . . . . . . . . . . . . . . . . 2,133 22,795 30,491Adjustments in current income tax in respect of prior years . . . . . . . . 4,753 (865) 753Adjustments in current income tax due to discounted operations . . . . — (3,776) 596
Total . . . . . . . . . . . . . . . . . . . . . . . . . . . . . . . . . . . . . . . . . . . . . . . 6,886 18,154 31,840
Deferred taxOrigination and reversal of temporary differences . . . . . . . . . . . . . . . (48,618) 2,500 (14,857)Impact of tax rate changes . . . . . . . . . . . . . . . . . . . . . . . . . . . . . . . (46) 98 (31,688)Adjustments in deferred tax in respect of prior years . . . . . . . . . . . . . 237 (293) 480
Total . . . . . . . . . . . . . . . . . . . . . . . . . . . . . . . . . . . . . . . . . . . . . . . (48,427) 2,305 (46,065)
Income tax expense (benefit) . . . . . . . . . . . . . . . . . . . . . . . . . . . . . (41,541) 20,459 (14,225)
As the Company has significant business operations in Spain, France, South Africa and theUnited States, a weighted effective tax rate is considered to be appropriate in estimating theCompany’s expected tax rate.
162
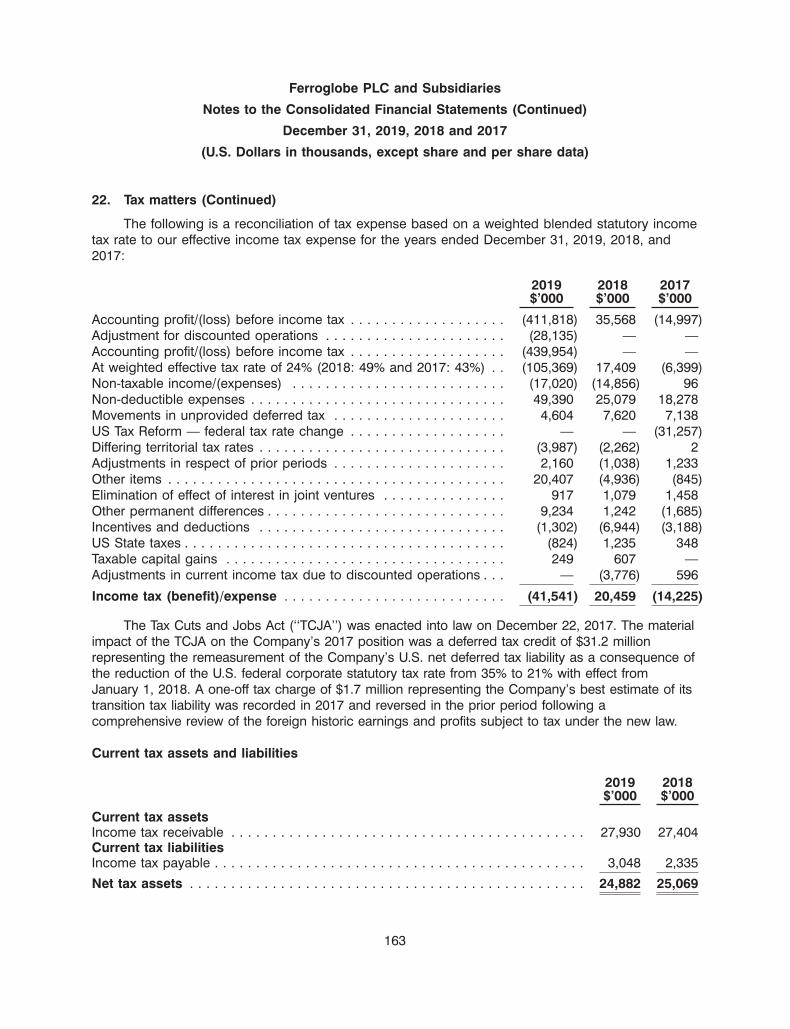
Ferroglobe PLC and Subsidiaries
Notes to the Consolidated Financial Statements (Continued)
December 31, 2019, 2018 and 2017
(U.S. Dollars in thousands, except share and per share data)
22. Tax matters (Continued)
The following is a reconciliation of tax expense based on a weighted blended statutory incometax rate to our effective income tax expense for the years ended December 31, 2019, 2018, and2017:
2019 2018 2017$’000 $’000 $’000
Accounting profit/(loss) before income tax . . . . . . . . . . . . . . . . . . . (411,818) 35,568 (14,997)Adjustment for discounted operations . . . . . . . . . . . . . . . . . . . . . . (28,135) — —Accounting profit/(loss) before income tax . . . . . . . . . . . . . . . . . . . (439,954) — —At weighted effective tax rate of 24% (2018: 49% and 2017: 43%) . . (105,369) 17,409 (6,399)Non-taxable income/(expenses) . . . . . . . . . . . . . . . . . . . . . . . . . . (17,020) (14,856) 96Non-deductible expenses . . . . . . . . . . . . . . . . . . . . . . . . . . . . . . . 49,390 25,079 18,278Movements in unprovided deferred tax . . . . . . . . . . . . . . . . . . . . . 4,604 7,620 7,138US Tax Reform — federal tax rate change . . . . . . . . . . . . . . . . . . . — — (31,257)Differing territorial tax rates . . . . . . . . . . . . . . . . . . . . . . . . . . . . . . (3,987) (2,262) 2Adjustments in respect of prior periods . . . . . . . . . . . . . . . . . . . . . 2,160 (1,038) 1,233Other items . . . . . . . . . . . . . . . . . . . . . . . . . . . . . . . . . . . . . . . . . 20,407 (4,936) (845)Elimination of effect of interest in joint ventures . . . . . . . . . . . . . . . 917 1,079 1,458Other permanent differences . . . . . . . . . . . . . . . . . . . . . . . . . . . . . 9,234 1,242 (1,685)Incentives and deductions . . . . . . . . . . . . . . . . . . . . . . . . . . . . . . (1,302) (6,944) (3,188)US State taxes . . . . . . . . . . . . . . . . . . . . . . . . . . . . . . . . . . . . . . . (824) 1,235 348Taxable capital gains . . . . . . . . . . . . . . . . . . . . . . . . . . . . . . . . . . 249 607 —Adjustments in current income tax due to discounted operations . . . — (3,776) 596
Income tax (benefit)/expense . . . . . . . . . . . . . . . . . . . . . . . . . . . (41,541) 20,459 (14,225)
The Tax Cuts and Jobs Act (‘‘TCJA’’) was enacted into law on December 22, 2017. The materialimpact of the TCJA on the Company’s 2017 position was a deferred tax credit of $31.2 millionrepresenting the remeasurement of the Company’s U.S. net deferred tax liability as a consequence ofthe reduction of the U.S. federal corporate statutory tax rate from 35% to 21% with effect fromJanuary 1, 2018. A one-off tax charge of $1.7 million representing the Company’s best estimate of itstransition tax liability was recorded in 2017 and reversed in the prior period following acomprehensive review of the foreign historic earnings and profits subject to tax under the new law.
Current tax assets and liabilities
2019 2018$’000 $’000
Current tax assetsIncome tax receivable . . . . . . . . . . . . . . . . . . . . . . . . . . . . . . . . . . . . . . . . . . . 27,930 27,404Current tax liabilitiesIncome tax payable . . . . . . . . . . . . . . . . . . . . . . . . . . . . . . . . . . . . . . . . . . . . . 3,048 2,335
Net tax assets . . . . . . . . . . . . . . . . . . . . . . . . . . . . . . . . . . . . . . . . . . . . . . . . 24,882 25,069
163

Ferroglobe PLC and Subsidiaries
Notes to the Consolidated Financial Statements (Continued)
December 31, 2019, 2018 and 2017
(U.S. Dollars in thousands, except share and per share data)
22. Tax matters (Continued)
Deferred tax assets and liabilities
For the year ended December 31, 2019:
Opening Prior Year Recognised in Recognised in Acquisitions/ Exchange ClosingBalance Charge P&L Equity/OCI Disposals Differences Balance
$’000 $’000 $’000 $’000 $’000 $’000 $’000
Intangible assets . . . (419) 34 (29) — — — (414)Biological assets . . . (2,840) — 2,785 — — 55 —Provisions . . . . . . . 19,950 (85) (2,552) (616) (727) (42) 15,928Property, plant &
equipment . . . . . . (78,285) 748 5,974 — 9,599 (2,733) (64,697)Inventories . . . . . . . (2,633) — 320 (14) — (216) (2,543)Hedging Instruments 1,010 — — — (974) (36) —Tax losses,
incentives &credits . . . . . . . . 13,630 1,077 34,084 (46) (5,408) 530 43,867
Partnership interest . (12,525) — 2,850 — — (215) (9,890)Other . . . . . . . . . . (678) (1,965) 5,186 — 8 692 3,243
Total . . . . . . . . . . . (62,790) (191) 48,618 (676) 2,498 (1,965) (14,506)
Presented in the statement of financial position as follows:
2019 2018$’000 $’000
Deferred tax assets . . . . . . . . . . . . . . . . . . . . . . . . . . . . . . . . . . . . . . . . . . . . 59,551 14,589Deferred tax liabilities . . . . . . . . . . . . . . . . . . . . . . . . . . . . . . . . . . . . . . . . . . (74,057) (77,379)
Net Total Deferred Tax (Liability) . . . . . . . . . . . . . . . . . . . . . . . . . . . . . . . . . (14,506) (62,790)
Unrecognised deductible temporary differences, unused tax losses and unused tax credits
2019 2018$’000 $’000
Unused tax losses . . . . . . . . . . . . . . . . . . . . . . . . . . . . . . . . . . . . . . . . . . . . 428,665 396,119Unused tax credits . . . . . . . . . . . . . . . . . . . . . . . . . . . . . . . . . . . . . . . . . . . . 7,949 7,963Unrecognised deductible temporary differences . . . . . . . . . . . . . . . . . . . . . . . 79,733 79,377
Total . . . . . . . . . . . . . . . . . . . . . . . . . . . . . . . . . . . . . . . . . . . . . . . . . . . . . . 516,347 483,459
164
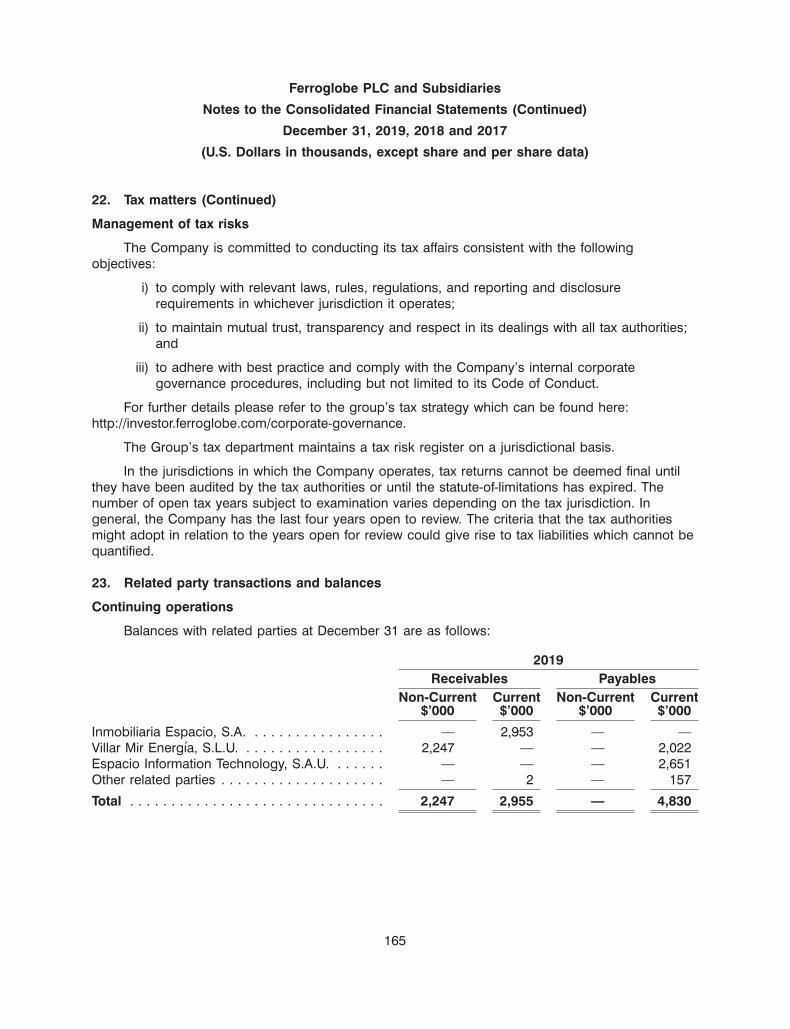
Ferroglobe PLC and Subsidiaries
Notes to the Consolidated Financial Statements (Continued)
December 31, 2019, 2018 and 2017
(U.S. Dollars in thousands, except share and per share data)
22. Tax matters (Continued)
Management of tax risks
The Company is committed to conducting its tax affairs consistent with the followingobjectives:
i) to comply with relevant laws, rules, regulations, and reporting and disclosurerequirements in whichever jurisdiction it operates;
ii) to maintain mutual trust, transparency and respect in its dealings with all tax authorities;and
iii) to adhere with best practice and comply with the Company’s internal corporategovernance procedures, including but not limited to its Code of Conduct.
For further details please refer to the group’s tax strategy which can be found here:http://investor.ferroglobe.com/corporate-governance.
The Group’s tax department maintains a tax risk register on a jurisdictional basis.
In the jurisdictions in which the Company operates, tax returns cannot be deemed final untilthey have been audited by the tax authorities or until the statute-of-limitations has expired. Thenumber of open tax years subject to examination varies depending on the tax jurisdiction. Ingeneral, the Company has the last four years open to review. The criteria that the tax authoritiesmight adopt in relation to the years open for review could give rise to tax liabilities which cannot bequantified.
23. Related party transactions and balances
Continuing operations
Balances with related parties at December 31 are as follows:
2019Receivables Payables
Non-Current Current Non-Current Current$’000 $’000 $’000 $’000
Inmobiliaria Espacio, S.A. . . . . . . . . . . . . . . . . — 2,953 — —Villar Mir Energıa, S.L.U. . . . . . . . . . . . . . . . . . 2,247 — — 2,022Espacio Information Technology, S.A.U. . . . . . . — — — 2,651Other related parties . . . . . . . . . . . . . . . . . . . . — 2 — 157
Total . . . . . . . . . . . . . . . . . . . . . . . . . . . . . . . 2,247 2,955 — 4,830
165
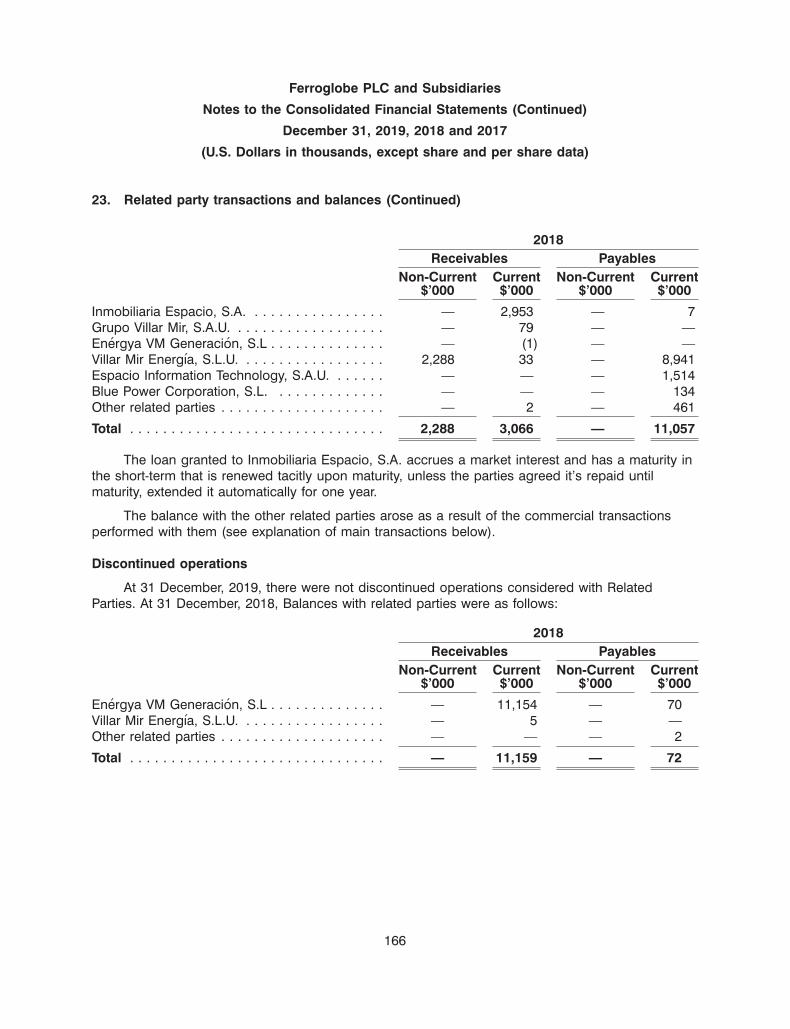
Ferroglobe PLC and Subsidiaries
Notes to the Consolidated Financial Statements (Continued)
December 31, 2019, 2018 and 2017
(U.S. Dollars in thousands, except share and per share data)
23. Related party transactions and balances (Continued)
2018Receivables Payables
Non-Current Current Non-Current Current$’000 $’000 $’000 $’000
Inmobiliaria Espacio, S.A. . . . . . . . . . . . . . . . . — 2,953 — 7Grupo Villar Mir, S.A.U. . . . . . . . . . . . . . . . . . . — 79 — —Energya VM Generacion, S.L . . . . . . . . . . . . . . — (1) — —Villar Mir Energıa, S.L.U. . . . . . . . . . . . . . . . . . 2,288 33 — 8,941Espacio Information Technology, S.A.U. . . . . . . — — — 1,514Blue Power Corporation, S.L. . . . . . . . . . . . . . — — — 134Other related parties . . . . . . . . . . . . . . . . . . . . — 2 — 461
Total . . . . . . . . . . . . . . . . . . . . . . . . . . . . . . . 2,288 3,066 — 11,057
The loan granted to Inmobiliaria Espacio, S.A. accrues a market interest and has a maturity inthe short-term that is renewed tacitly upon maturity, unless the parties agreed it’s repaid untilmaturity, extended it automatically for one year.
The balance with the other related parties arose as a result of the commercial transactionsperformed with them (see explanation of main transactions below).
Discontinued operations
At 31 December, 2019, there were not discontinued operations considered with RelatedParties. At 31 December, 2018, Balances with related parties were as follows:
2018Receivables Payables
Non-Current Current Non-Current Current$’000 $’000 $’000 $’000
Energya VM Generacion, S.L . . . . . . . . . . . . . . — 11,154 — 70Villar Mir Energıa, S.L.U. . . . . . . . . . . . . . . . . . — 5 — —Other related parties . . . . . . . . . . . . . . . . . . . . — — — 2
Total . . . . . . . . . . . . . . . . . . . . . . . . . . . . . . . — 11,159 — 72
166

Ferroglobe PLC and Subsidiaries
Notes to the Consolidated Financial Statements (Continued)
December 31, 2019, 2018 and 2017
(U.S. Dollars in thousands, except share and per share data)
23. Related party transactions and balances (Continued)
Continuing operations
Transactions with related parties in 2019, 2018 and 2017 are as follows:
2019Sales and Other FinanceOperating Operating Income
Income Cost of Sales Expenses (Note 25.4)$’000 $’000 $’000 $’000
Inmobiliaria Espacio, S.A. . . . . . . . . . . . . — — 1 68Villar Mir Energıa, S.L.U. . . . . . . . . . . . . . — 65,406 681 —Espacio Information Technology, S.A.U. . . — — 3,566 —Energya VM Generacion, S.L . . . . . . . . . . 1 — 1 —Energya VM Gestion, S.L . . . . . . . . . . . . . — 1 89 —Aurinka . . . . . . . . . . . . . . . . . . . . . . . . . . — — 3,206 —Other related parties . . . . . . . . . . . . . . . . 143 — 7 —
Total . . . . . . . . . . . . . . . . . . . . . . . . . . . . 144 65,407 7,551 68
2018Sales and Other FinanceOperating Operating Income
Income Cost of Sales Expenses (Note 25.4)$’000 $’000 $’000 $’000
Inmobiliaria Espacio, S.A. . . . . . . . . . . . . — — 6 72Villar Mir Energıa, S.L.U. . . . . . . . . . . . . . — 99,939 803 —Espacio Information Technology, S.A.U. . . — — 4,226 —Energya VM Generacion, S.L . . . . . . . . . . 11,874 — 48 —Energya VM Gestion, S.L . . . . . . . . . . . . . — — 76 —Other related parties . . . . . . . . . . . . . . . . 20 — 119 —
Total . . . . . . . . . . . . . . . . . . . . . . . . . . . . 11,894 99,939 5,278 72
167

Ferroglobe PLC and Subsidiaries
Notes to the Consolidated Financial Statements (Continued)
December 31, 2019, 2018 and 2017
(U.S. Dollars in thousands, except share and per share data)
23. Related party transactions and balances (Continued)
2017Sales and Other FinanceOperating Operating Income
Income Cost of Sales Expenses (Note 25.4)$’000 $’000 $’000 $’000
Inmobiliaria Espacio, S.A. . . . . . . . . . . . . — — 2 70Villar Mir Energıa, S.L.U. . . . . . . . . . . . . . — 94,049 1,697 —Espacio Information Technology, S.A.U. . . — — 3,807 —Energya VM Generacion, S.L . . . . . . . . . . 7,420 — 112 —Energya VM Gestion, S.L . . . . . . . . . . . . . — — 14 —Other related parties . . . . . . . . . . . . . . . . — — 1,440 154
Total . . . . . . . . . . . . . . . . . . . . . . . . . . . . 7,420 94,049 7,072 224
‘‘Cost of sales’’ of the related parties vis-a-vis Villar Mir Energıa, S.L.U. relates to the purchaseof energy from the latter by the Company’s Electrometallurgy — Europe segment. FerroAtlanticapays VM Energıa a service charge in addition to paying for the cost of energy purchase from themarket. Under contracts entered into with FAU on June 22, 2010 and December 29, 2010 (assignedto FerroAtlantica de Boo, S.L.U. (‘‘FAU Boo’’) and to FerroAtlantica de Sabon, S.L.U. (‘‘FAU Sabon’’)in August 2019 in anticipation of the FAU Disposal), and with Hidro Nitro Espanola onDecember 27, 2012 (assigned to FerroAtlantica del Cinca when Hidro Nitro Espanola was sold inDecember 2018), VM Energıa supplies the energy needs of the Boo, Sabon and Monzonelectrometallurgy facilities, as a broker for FAU (now FAU Boo or FAU Sabon, as appropriate) andHidro Nitro Espanola (now FerroAtlantica del Cinca) in the wholesale power market. The contractsallow FAU (now FAU Boo or FAU Sabon, as appropriate) and Hidro Nitro Espanola (nowFerroAtlantica del Cinca) to buy energy from the grid at market conditions without incurring costsnormally associated with operating in the complex wholesale power market, as well as to apply forfixed price arrangements in advance from VM Energıa, based on the energy markets for the power,period and profile applied for. For the fiscal year ended December 31, 2019, FAU Boo, FAU Sabonand FerroAtlantica del Cinca’s obligations to make payments to VM Energıa under their respectiveagreements for the purchase of energy plus the service charge amounted to $27,355 thousand,$16,939 thousand and $20,736 thousand, respectively. For the period from January 1, 2019 toAugust 30, 2019 FAUs obligations to make payments to VM Energıa under their respectiveagreements for the purchase of energy plus the service charge amounted to $376 thousand.
For the fiscal years ended December 31, 2018 and 2017, FAU and Hidro Nitro Espanola’sobligations to make payments to VM Energıa under their respective agreements — for the purchaseof energy plus the service charge — amounted to $99,939 thousand and $94,949 thousand,respectively. These contracts are similar to contracts FerroAtlantica signs with other third-partybrokers.
‘‘Other operating expenses’’ relates to service fees paid to Espacio InformationTechnology, S.A.U. for managing and maintenance services rendered related, basically, to theenterprise resource planning (‘ERP’) that some Company entities use; and other IT development
168

Ferroglobe PLC and Subsidiaries
Notes to the Consolidated Financial Statements (Continued)
December 31, 2019, 2018 and 2017
(U.S. Dollars in thousands, except share and per share data)
23. Related party transactions and balances (Continued)
projects. Additionally, in 2019 FerroAtlantica paid the sum of $2,800 thousand to Aurinka insatisfaction of any claim Aurinka PV might otherwise have in relation to the termination of the SolarJV.
‘‘Sales and operating income’’ relates mainly to sales from Hidro Nitro Espanola to EnergyaVM for the sales made by its hydroelectric plant of $11,874 thousand and $7,419 thousand for thefiscal years ended December 31, 2018 and 2017, Hidro Nitro Espanola was sold out of theCompany on December 31, 2018. FerroAtlantica sales to Energya VM for the sales made by itshydroelectric plant of $31,898 thousand and $9,803 thousand for the fiscal years endedDecember 31, 2018 and 2017.
During 2018 and 2017, under the solar joint venture agreement FerroAtlantica and othersubsidiaries have purchased property, plant and equipment of $4,252 thousand and$3,611 thousand respectively, from Aurinka and Blue Power Corporation, S.L. In July 2019, theSolar JV was unwound. See ‘‘Item 7.B. — Related Party Transactions — Aurinka and the Solar JV.’’
Discontinued operations
Transactions with related parties in 2019, 2018 and 2017 are as follows:
2019Sales and OtherOperating Operating
Income Cost of Sales Expenses$’000 $’000 $’000
Villar Mir Energıa, S.L.U. . . . . . . . . . . . . . . . . . . . . . . . . — — 373Energya VM Generacion, S.L . . . . . . . . . . . . . . . . . . . . 12,635 — 117Energya VM Gestion, S.L . . . . . . . . . . . . . . . . . . . . . . . — 66 —
Total . . . . . . . . . . . . . . . . . . . . . . . . . . . . . . . . . . . . . . 12,635 66 490
2018Sales and OtherOperating Operating
Income Cost of Sales Expenses$’000 $’000 $’000
Villar Mir Energıa, S.L.U. . . . . . . . . . . . . . . . . . . . . . . . . — — 664Energya VM Generacion, S.L . . . . . . . . . . . . . . . . . . . . 31,898 — 224Energya VM Gestion, S.L . . . . . . . . . . . . . . . . . . . . . . . — 42 43
Total . . . . . . . . . . . . . . . . . . . . . . . . . . . . . . . . . . . . . . 31,898 42 931
169
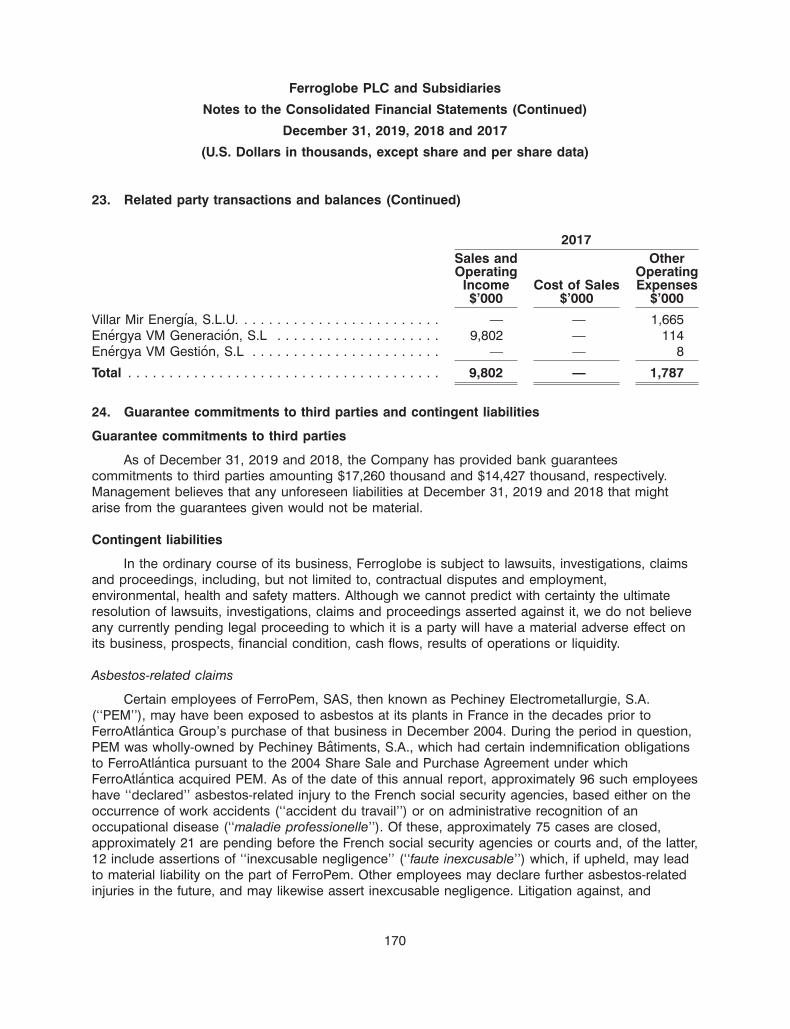
Ferroglobe PLC and Subsidiaries
Notes to the Consolidated Financial Statements (Continued)
December 31, 2019, 2018 and 2017
(U.S. Dollars in thousands, except share and per share data)
23. Related party transactions and balances (Continued)
2017Sales and OtherOperating Operating
Income Cost of Sales Expenses$’000 $’000 $’000
Villar Mir Energıa, S.L.U. . . . . . . . . . . . . . . . . . . . . . . . . — — 1,665Energya VM Generacion, S.L . . . . . . . . . . . . . . . . . . . . 9,802 — 114Energya VM Gestion, S.L . . . . . . . . . . . . . . . . . . . . . . . — — 8
Total . . . . . . . . . . . . . . . . . . . . . . . . . . . . . . . . . . . . . . 9,802 — 1,787
24. Guarantee commitments to third parties and contingent liabilities
Guarantee commitments to third parties
As of December 31, 2019 and 2018, the Company has provided bank guaranteescommitments to third parties amounting $17,260 thousand and $14,427 thousand, respectively.Management believes that any unforeseen liabilities at December 31, 2019 and 2018 that mightarise from the guarantees given would not be material.
Contingent liabilities
In the ordinary course of its business, Ferroglobe is subject to lawsuits, investigations, claimsand proceedings, including, but not limited to, contractual disputes and employment,environmental, health and safety matters. Although we cannot predict with certainty the ultimateresolution of lawsuits, investigations, claims and proceedings asserted against it, we do not believeany currently pending legal proceeding to which it is a party will have a material adverse effect onits business, prospects, financial condition, cash flows, results of operations or liquidity.
Asbestos-related claims
Certain employees of FerroPem, SAS, then known as Pechiney Electrometallurgie, S.A.(‘‘PEM’’), may have been exposed to asbestos at its plants in France in the decades prior toFerroAtlantica Group’s purchase of that business in December 2004. During the period in question,PEM was wholly-owned by Pechiney Batiments, S.A., which had certain indemnification obligationsto FerroAtlantica pursuant to the 2004 Share Sale and Purchase Agreement under whichFerroAtlantica acquired PEM. As of the date of this annual report, approximately 96 such employeeshave ‘‘declared’’ asbestos-related injury to the French social security agencies, based either on theoccurrence of work accidents (‘‘accident du travail’’) or on administrative recognition of anoccupational disease (‘‘maladie professionelle’’). Of these, approximately 75 cases are closed,approximately 21 are pending before the French social security agencies or courts and, of the latter,12 include assertions of ‘‘inexcusable negligence’’ (‘‘faute inexcusable’’) which, if upheld, may leadto material liability on the part of FerroPem. Other employees may declare further asbestos-relatedinjuries in the future, and may likewise assert inexcusable negligence. Litigation against, and
170

Ferroglobe PLC and Subsidiaries
Notes to the Consolidated Financial Statements (Continued)
December 31, 2019, 2018 and 2017
(U.S. Dollars in thousands, except share and per share data)
24. Guarantee commitments to third parties and contingent liabilities (Continued)
material liability on the part of, FerroPem will not necessarily arise in each case, and to date amajority of such declared injuries have been minor and have not led to significant liability onFerropem’s part. Whether material liability will arise is determined case-by-case, often over a periodof years, depending on, inter alia, the evolution of the claimant’s asbestos-related condition, thepossibility that the claimant was exposed while working for other employers and, where asserted,the claimant’s ability to prove inexcusable negligence on PEM’s part. Because of these and otheruncertainties, no reliable estimate can be made of FerroPem’s eventual liability in these matters,with exception of three grave cases that were litigated through the appeal process and in whichclaimants’ assertions of inexcusable negligence were upheld against FerroPem. Liabilities in respectto asbestos-related claims have been recorded at December 31, 2019 at an estimated amount of$1,166 thousand in Provisions for litigation in progress.
Environmental matters
On August 31, 2016, the U.S. Department of Justice (the ‘‘DOJ’’) requested a meeting withGMI to discuss potential resolution of a July 1, 2015 NOV/FOV that GMI received from the U.S.Environmental Protection Agency (the ‘‘EPA’’) alleging certain violations of the Prevention ofSignificant Deterioration (‘‘PSD’’) and New Source Performance Standards provisions of the CleanAir Act associated with a 2013 project performed at GMI’s Beverly facility. Specifically, the July 2015NOV/FOV alleges violations of the facility’s existing operating and construction permits, includingallegations related to opacity emissions, sulfur dioxide and particulate matter emissions, and failureto keep necessary records and properly monitor certain equipment. On January 4, 2017, GMIreceived a second NOV/FOV dated December 6, 2016, arising from the same facts as the July 2015NOV/FOV and subsequent EPA inspections. The second NOV/FOV alleges opacity exceedances atcertain units, failure to prevent the release of particulate emissions through the use of furnacehoods at a certain unit, and the failure to install Reasonably Available Control Measures (as defined)at certain emission units at the Beverly facility. Since that time, GMI and the authorities haveexchanged information and engaged in negotiations regarding potential resolution of theNOV/FOVs, which negotiations are ongoing. To resolve the NOVs/FOVs, GMI may be required toinstall additional pollution control equipment or implement other measures to reduce emissionsfrom the facility as well as a pay civil penalty. At this time, however, GMI is unable to determine theextent of potential injunctive relief or the amount of civil penalty a negotiated resolution of thismatter may entail. Should the DOJ and GMI be unable to reach a negotiated resolution of theNOVs/FOVs, the authorities could institute formal legal proceedings for injunctive relief and civilpenalties. The statutory maximum penalty is $93,750 per day per violation, from April 2013 to thepresent.
171
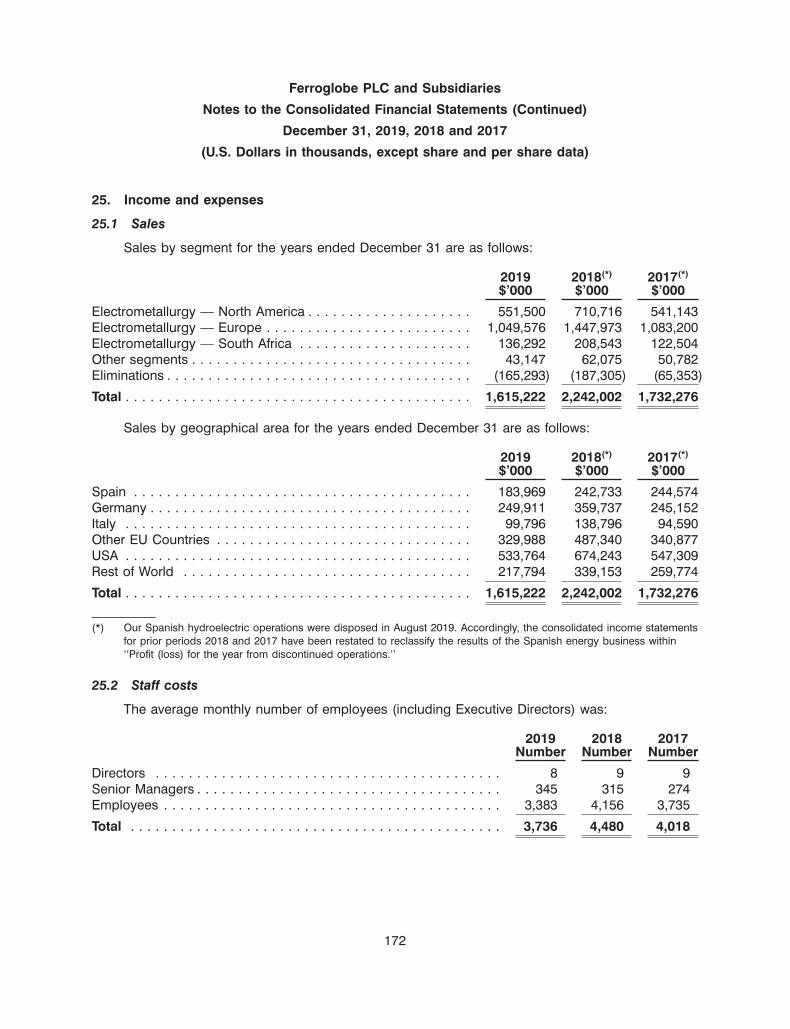
Ferroglobe PLC and Subsidiaries
Notes to the Consolidated Financial Statements (Continued)
December 31, 2019, 2018 and 2017
(U.S. Dollars in thousands, except share and per share data)
25. Income and expenses
25.1 Sales
Sales by segment for the years ended December 31 are as follows:
2019 2018(*) 2017(*)
$’000 $’000 $’000
Electrometallurgy — North America . . . . . . . . . . . . . . . . . . . . 551,500 710,716 541,143Electrometallurgy — Europe . . . . . . . . . . . . . . . . . . . . . . . . . 1,049,576 1,447,973 1,083,200Electrometallurgy — South Africa . . . . . . . . . . . . . . . . . . . . . 136,292 208,543 122,504Other segments . . . . . . . . . . . . . . . . . . . . . . . . . . . . . . . . . . 43,147 62,075 50,782Eliminations . . . . . . . . . . . . . . . . . . . . . . . . . . . . . . . . . . . . . (165,293) (187,305) (65,353)
Total . . . . . . . . . . . . . . . . . . . . . . . . . . . . . . . . . . . . . . . . . . 1,615,222 2,242,002 1,732,276
Sales by geographical area for the years ended December 31 are as follows:
2019 2018(*) 2017(*)
$’000 $’000 $’000
Spain . . . . . . . . . . . . . . . . . . . . . . . . . . . . . . . . . . . . . . . . . 183,969 242,733 244,574Germany . . . . . . . . . . . . . . . . . . . . . . . . . . . . . . . . . . . . . . . 249,911 359,737 245,152Italy . . . . . . . . . . . . . . . . . . . . . . . . . . . . . . . . . . . . . . . . . . 99,796 138,796 94,590Other EU Countries . . . . . . . . . . . . . . . . . . . . . . . . . . . . . . . 329,988 487,340 340,877USA . . . . . . . . . . . . . . . . . . . . . . . . . . . . . . . . . . . . . . . . . . 533,764 674,243 547,309Rest of World . . . . . . . . . . . . . . . . . . . . . . . . . . . . . . . . . . . 217,794 339,153 259,774
Total . . . . . . . . . . . . . . . . . . . . . . . . . . . . . . . . . . . . . . . . . . 1,615,222 2,242,002 1,732,276
(*) Our Spanish hydroelectric operations were disposed in August 2019. Accordingly, the consolidated income statementsfor prior periods 2018 and 2017 have been restated to reclassify the results of the Spanish energy business within‘‘Profit (loss) for the year from discontinued operations.’’
25.2 Staff costs
The average monthly number of employees (including Executive Directors) was:
2019 2018 2017Number Number Number
Directors . . . . . . . . . . . . . . . . . . . . . . . . . . . . . . . . . . . . . . . . . . 8 9 9Senior Managers . . . . . . . . . . . . . . . . . . . . . . . . . . . . . . . . . . . . . 345 315 274Employees . . . . . . . . . . . . . . . . . . . . . . . . . . . . . . . . . . . . . . . . . 3,383 4,156 3,735
Total . . . . . . . . . . . . . . . . . . . . . . . . . . . . . . . . . . . . . . . . . . . . . 3,736 4,480 4,018
172

Ferroglobe PLC and Subsidiaries
Notes to the Consolidated Financial Statements (Continued)
December 31, 2019, 2018 and 2017
(U.S. Dollars in thousands, except share and per share data)
25. Income and expenses (Continued)
Staff costs are comprised of the following for the years ended December 31:
2019 2018(*) 2017(*)
$’000 $’000 $’000
Wages, salaries and similar expenses . . . . . . . . . . . . . . . . . . . . . . 208,317 263,794 221,341Pension plan contributions . . . . . . . . . . . . . . . . . . . . . . . . . . . . . . 12,787 12,084 13,582Employee benefit costs . . . . . . . . . . . . . . . . . . . . . . . . . . . . . . . . 63,925 62,984 65,112
Total . . . . . . . . . . . . . . . . . . . . . . . . . . . . . . . . . . . . . . . . . . . . . . 285,029 338,862 300,035
(*) Our Spanish hydroelectric operations were disposed in August 2019. Accordingly, the consolidated income statementsfor prior periods 2018 and 2017 have been restated to reclassify the results of the Spanish energy business within‘‘Profit (loss) for the year from discontinued operations.’’
25.3 Depreciation and amortization charges, operating allowances and write-downs
Depreciation and amortization charges, operating allowances and write-downs are comprisedof the following for the years ended December 31:
2019 2018(*) 2017(*)
$’000 $’000 $’000
Amortization of intangible assets (Note 8) . . . . . . . . . . . . . . . . . . . 7,305 9,312 8,440Depreciation of property, plant and equipment (Note 9) . . . . . . . . . 112,824 104,532 89,924Other write-downs and reversals . . . . . . . . . . . . . . . . . . . . . . . . . . 65 (7) 2,038
Total . . . . . . . . . . . . . . . . . . . . . . . . . . . . . . . . . . . . . . . . . . . . . . 120,194 113,837 100,402
(*) Our Spanish hydroelectric operations were disposed in August 2019. Accordingly, the consolidated income statementsfor prior periods 2018 and 2017 have been restated to reclassify the results of the Spanish energy business within‘‘Profit (loss) for the year from discontinued operations.’’
Included within other write-downs and reversals for the year ended December 31, 2017 are$1,784 thousand, relating to the change in impairment losses on uncollectible trade receivables.
173
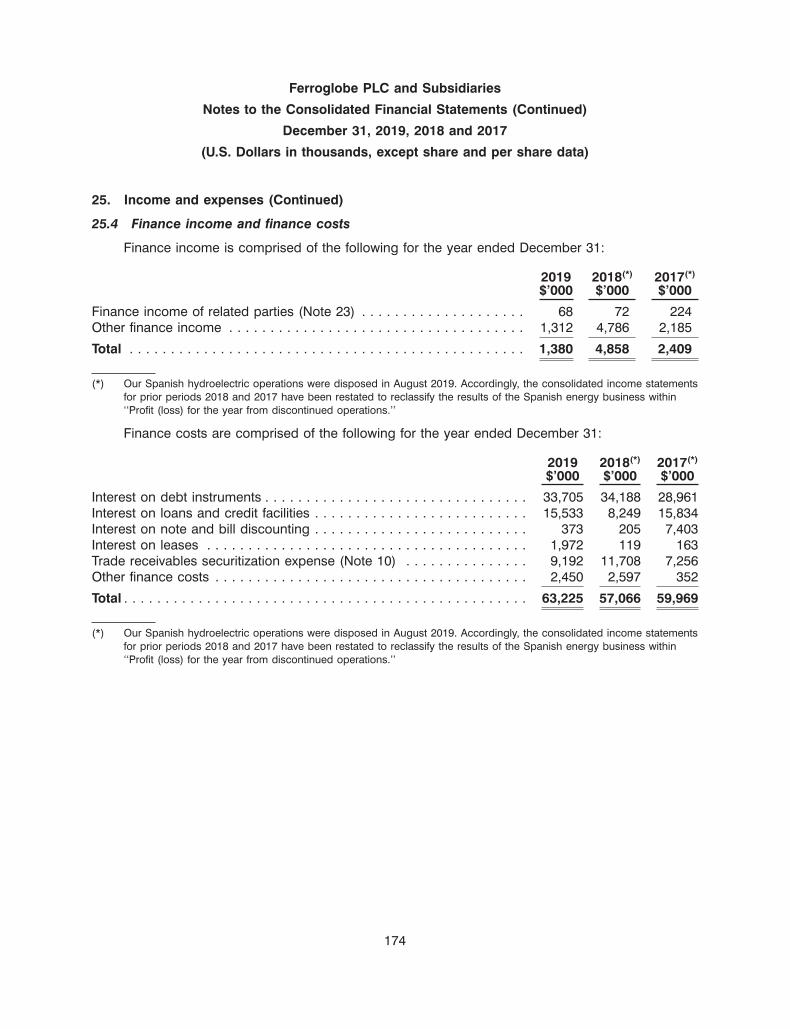
Ferroglobe PLC and Subsidiaries
Notes to the Consolidated Financial Statements (Continued)
December 31, 2019, 2018 and 2017
(U.S. Dollars in thousands, except share and per share data)
25. Income and expenses (Continued)
25.4 Finance income and finance costs
Finance income is comprised of the following for the year ended December 31:
2019 2018(*) 2017(*)
$’000 $’000 $’000
Finance income of related parties (Note 23) . . . . . . . . . . . . . . . . . . . . 68 72 224Other finance income . . . . . . . . . . . . . . . . . . . . . . . . . . . . . . . . . . . . 1,312 4,786 2,185
Total . . . . . . . . . . . . . . . . . . . . . . . . . . . . . . . . . . . . . . . . . . . . . . . . 1,380 4,858 2,409
(*) Our Spanish hydroelectric operations were disposed in August 2019. Accordingly, the consolidated income statementsfor prior periods 2018 and 2017 have been restated to reclassify the results of the Spanish energy business within‘‘Profit (loss) for the year from discontinued operations.’’
Finance costs are comprised of the following for the year ended December 31:
2019 2018(*) 2017(*)
$’000 $’000 $’000
Interest on debt instruments . . . . . . . . . . . . . . . . . . . . . . . . . . . . . . . . 33,705 34,188 28,961Interest on loans and credit facilities . . . . . . . . . . . . . . . . . . . . . . . . . . 15,533 8,249 15,834Interest on note and bill discounting . . . . . . . . . . . . . . . . . . . . . . . . . . 373 205 7,403Interest on leases . . . . . . . . . . . . . . . . . . . . . . . . . . . . . . . . . . . . . . . 1,972 119 163Trade receivables securitization expense (Note 10) . . . . . . . . . . . . . . . 9,192 11,708 7,256Other finance costs . . . . . . . . . . . . . . . . . . . . . . . . . . . . . . . . . . . . . . 2,450 2,597 352
Total . . . . . . . . . . . . . . . . . . . . . . . . . . . . . . . . . . . . . . . . . . . . . . . . . 63,225 57,066 59,969
(*) Our Spanish hydroelectric operations were disposed in August 2019. Accordingly, the consolidated income statementsfor prior periods 2018 and 2017 have been restated to reclassify the results of the Spanish energy business within‘‘Profit (loss) for the year from discontinued operations.’’
174
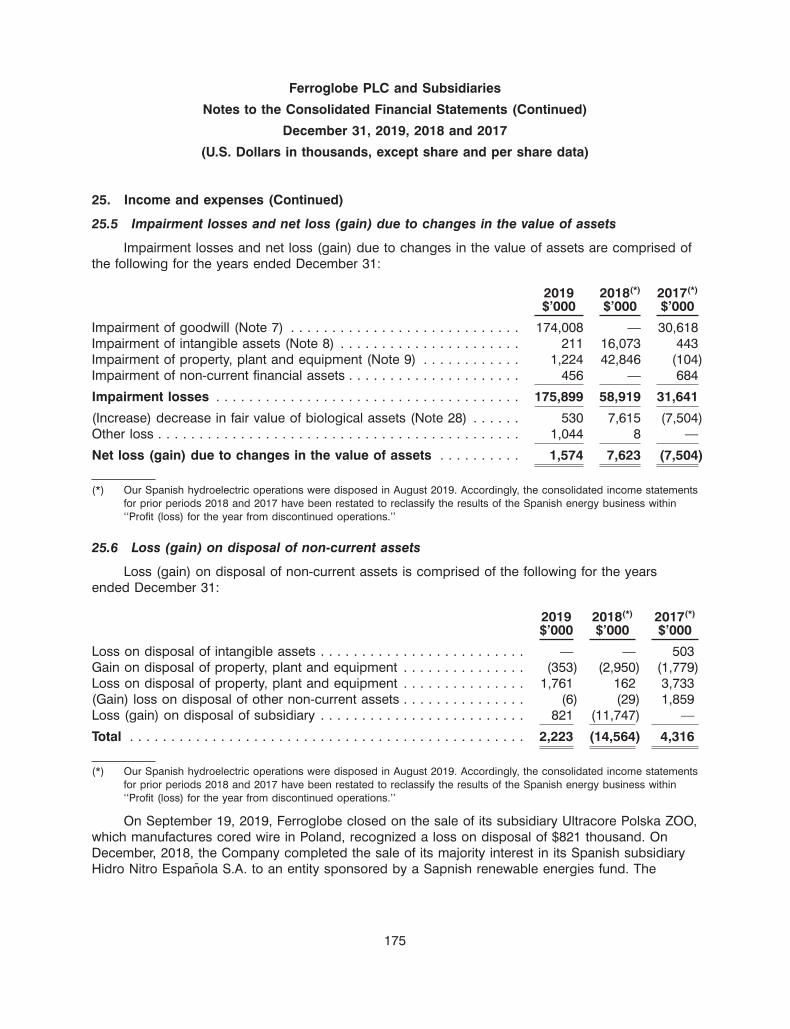
Ferroglobe PLC and Subsidiaries
Notes to the Consolidated Financial Statements (Continued)
December 31, 2019, 2018 and 2017
(U.S. Dollars in thousands, except share and per share data)
25. Income and expenses (Continued)
25.5 Impairment losses and net loss (gain) due to changes in the value of assets
Impairment losses and net loss (gain) due to changes in the value of assets are comprised ofthe following for the years ended December 31:
2019 2018(*) 2017(*)
$’000 $’000 $’000
Impairment of goodwill (Note 7) . . . . . . . . . . . . . . . . . . . . . . . . . . . . 174,008 — 30,618Impairment of intangible assets (Note 8) . . . . . . . . . . . . . . . . . . . . . . 211 16,073 443Impairment of property, plant and equipment (Note 9) . . . . . . . . . . . . 1,224 42,846 (104)Impairment of non-current financial assets . . . . . . . . . . . . . . . . . . . . . 456 — 684
Impairment losses . . . . . . . . . . . . . . . . . . . . . . . . . . . . . . . . . . . . . 175,899 58,919 31,641
(Increase) decrease in fair value of biological assets (Note 28) . . . . . . 530 7,615 (7,504)Other loss . . . . . . . . . . . . . . . . . . . . . . . . . . . . . . . . . . . . . . . . . . . . 1,044 8 —
Net loss (gain) due to changes in the value of assets . . . . . . . . . . 1,574 7,623 (7,504)
(*) Our Spanish hydroelectric operations were disposed in August 2019. Accordingly, the consolidated income statementsfor prior periods 2018 and 2017 have been restated to reclassify the results of the Spanish energy business within‘‘Profit (loss) for the year from discontinued operations.’’
25.6 Loss (gain) on disposal of non-current assets
Loss (gain) on disposal of non-current assets is comprised of the following for the yearsended December 31:
2019 2018(*) 2017(*)
$’000 $’000 $’000
Loss on disposal of intangible assets . . . . . . . . . . . . . . . . . . . . . . . . . — — 503Gain on disposal of property, plant and equipment . . . . . . . . . . . . . . . (353) (2,950) (1,779)Loss on disposal of property, plant and equipment . . . . . . . . . . . . . . . 1,761 162 3,733(Gain) loss on disposal of other non-current assets . . . . . . . . . . . . . . . (6) (29) 1,859Loss (gain) on disposal of subsidiary . . . . . . . . . . . . . . . . . . . . . . . . . 821 (11,747) —
Total . . . . . . . . . . . . . . . . . . . . . . . . . . . . . . . . . . . . . . . . . . . . . . . . 2,223 (14,564) 4,316
(*) Our Spanish hydroelectric operations were disposed in August 2019. Accordingly, the consolidated income statementsfor prior periods 2018 and 2017 have been restated to reclassify the results of the Spanish energy business within‘‘Profit (loss) for the year from discontinued operations.’’
On September 19, 2019, Ferroglobe closed on the sale of its subsidiary Ultracore Polska ZOO,which manufactures cored wire in Poland, recognized a loss on disposal of $821 thousand. OnDecember, 2018, the Company completed the sale of its majority interest in its Spanish subsidiaryHidro Nitro Espanola S.A. to an entity sponsored by a Sapnish renewable energies fund. The
175

Ferroglobe PLC and Subsidiaries
Notes to the Consolidated Financial Statements (Continued)
December 31, 2019, 2018 and 2017
(U.S. Dollars in thousands, except share and per share data)
25. Income and expenses (Continued)
Company received net cash proceeds of $20,533 thousand and recognized a gain on disposal of$11,747 thousand.
25.7 Auditor’s remuneration
The total remuneration of the Company’s auditor, Deloitte, and other member firms of Deloitte,for services provided to the Company during the year is set out below:
2019 2018 2017$’000 $’000 $’000
Audit of the parent company and consolidated financial statements . . . . . . 4,192 5,552 4,556Audit of the financial statements of the Company’s subsidiaries . . . . . . . . . 544 455 298
Audit fees . . . . . . . . . . . . . . . . . . . . . . . . . . . . . . . . . . . . . . . . . . . . . . . 4,736 6,007 4,854Audit-related fees . . . . . . . . . . . . . . . . . . . . . . . . . . . . . . . . . . . . . . . . . . 481 20 507Tax fees . . . . . . . . . . . . . . . . . . . . . . . . . . . . . . . . . . . . . . . . . . . . . . . . . 29 84 91Non-audit fees . . . . . . . . . . . . . . . . . . . . . . . . . . . . . . . . . . . . . . . . . . . . 510 104 598
Total fees . . . . . . . . . . . . . . . . . . . . . . . . . . . . . . . . . . . . . . . . . . . . . . . 5,246 6,111 5,452
26. Remuneration of key management personnel
The remuneration of the key management personnel, which comprises the Company’smanagement committee, during the years ended December 31 is as follows:
2019 2018 2017$’000 $’000 $’000
Fixed remuneration . . . . . . . . . . . . . . . . . . . . . . . . . . . . . . . . . . . . . . 5,404 6,068 5,625Variable remuneration . . . . . . . . . . . . . . . . . . . . . . . . . . . . . . . . . . . . 254 — 3,710Contributions to pension plans and insurance policies . . . . . . . . . . . . . 350 379 215Share-based compensation . . . . . . . . . . . . . . . . . . . . . . . . . . . . . . . . 4,882 1,777 1,738Termination benefits . . . . . . . . . . . . . . . . . . . . . . . . . . . . . . . . . . . . . . 1,147 2,284 —Other remuneration . . . . . . . . . . . . . . . . . . . . . . . . . . . . . . . . . . . . . . 7 23 17
Total . . . . . . . . . . . . . . . . . . . . . . . . . . . . . . . . . . . . . . . . . . . . . . . . . 12,044 10,531 11,305
During 2019, 2018 and 2017, no loans and advances have been granted to key managementpersonnel.
27. Financial risk management
Ferroglobe operates in an international and cyclical industry which exposes it to a variety offinancial risks such as currency risk, liquidity risk, interest rate risk, credit risk and risks relating tothe price of finished goods, raw materials and power.
176
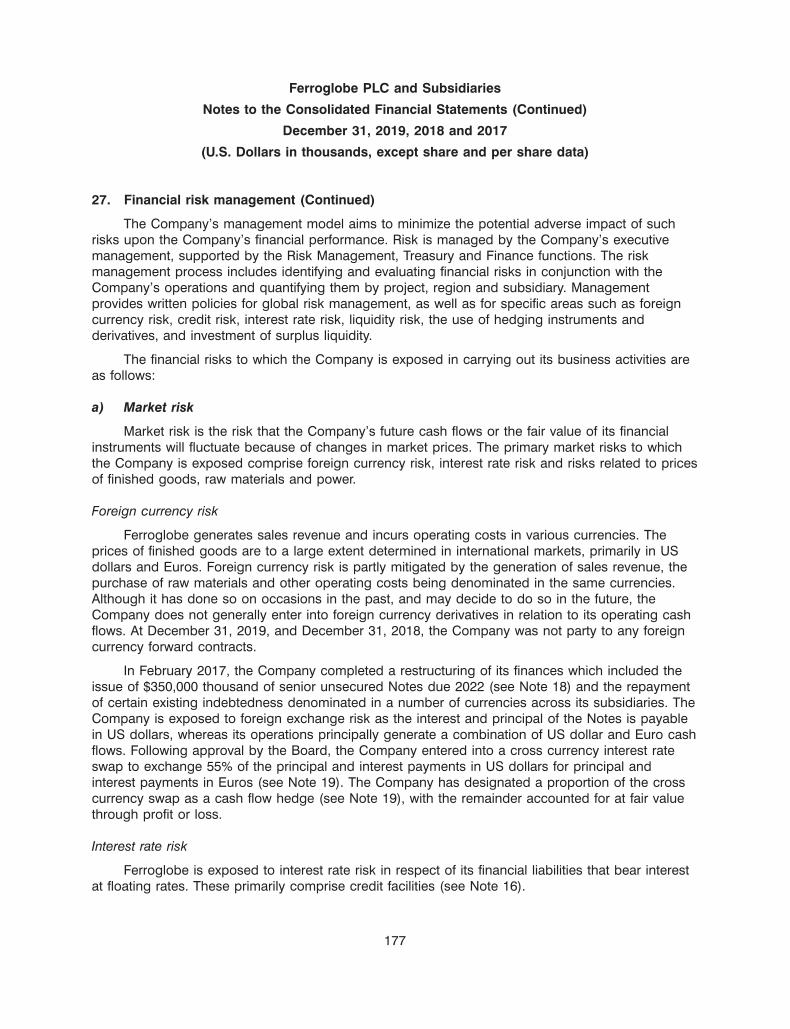
Ferroglobe PLC and Subsidiaries
Notes to the Consolidated Financial Statements (Continued)
December 31, 2019, 2018 and 2017
(U.S. Dollars in thousands, except share and per share data)
27. Financial risk management (Continued)
The Company’s management model aims to minimize the potential adverse impact of suchrisks upon the Company’s financial performance. Risk is managed by the Company’s executivemanagement, supported by the Risk Management, Treasury and Finance functions. The riskmanagement process includes identifying and evaluating financial risks in conjunction with theCompany’s operations and quantifying them by project, region and subsidiary. Managementprovides written policies for global risk management, as well as for specific areas such as foreigncurrency risk, credit risk, interest rate risk, liquidity risk, the use of hedging instruments andderivatives, and investment of surplus liquidity.
The financial risks to which the Company is exposed in carrying out its business activities areas follows:
a) Market risk
Market risk is the risk that the Company’s future cash flows or the fair value of its financialinstruments will fluctuate because of changes in market prices. The primary market risks to whichthe Company is exposed comprise foreign currency risk, interest rate risk and risks related to pricesof finished goods, raw materials and power.
Foreign currency risk
Ferroglobe generates sales revenue and incurs operating costs in various currencies. Theprices of finished goods are to a large extent determined in international markets, primarily in USdollars and Euros. Foreign currency risk is partly mitigated by the generation of sales revenue, thepurchase of raw materials and other operating costs being denominated in the same currencies.Although it has done so on occasions in the past, and may decide to do so in the future, theCompany does not generally enter into foreign currency derivatives in relation to its operating cashflows. At December 31, 2019, and December 31, 2018, the Company was not party to any foreigncurrency forward contracts.
In February 2017, the Company completed a restructuring of its finances which included theissue of $350,000 thousand of senior unsecured Notes due 2022 (see Note 18) and the repaymentof certain existing indebtedness denominated in a number of currencies across its subsidiaries. TheCompany is exposed to foreign exchange risk as the interest and principal of the Notes is payablein US dollars, whereas its operations principally generate a combination of US dollar and Euro cashflows. Following approval by the Board, the Company entered into a cross currency interest rateswap to exchange 55% of the principal and interest payments in US dollars for principal andinterest payments in Euros (see Note 19). The Company has designated a proportion of the crosscurrency swap as a cash flow hedge (see Note 19), with the remainder accounted for at fair valuethrough profit or loss.
Interest rate risk
Ferroglobe is exposed to interest rate risk in respect of its financial liabilities that bear interestat floating rates. These primarily comprise credit facilities (see Note 16).
177

Ferroglobe PLC and Subsidiaries
Notes to the Consolidated Financial Statements (Continued)
December 31, 2019, 2018 and 2017
(U.S. Dollars in thousands, except share and per share data)
27. Financial risk management (Continued)
During the year ended December 31, 2019 and 2018, the Company did not enter into anyinterest rate derivatives in relation to its interest bearing credit facilities. At December 31, 2019, theCompany had drawn down $62,835 thousand under its credit facilities (2018: $135,919).
b) Credit risk
Credit risk refers to the risk that a customer or counterparty will default on its contractualobligations resulting in financial loss. The Company’s main credit risk exposure related to financialassets is set out in Note 10 and includes trade receivables, other receivables and other financialassets.
Trade receivables consist of a large number of customers, spread across diverse industriesand geographical areas. The Company has established policies, procedures and controls relating tocustomer credit risk management. Ongoing credit evaluation is performed on the financial conditionof accounts receivable and, where appropriate, the Company insures its trade receivables withreputable credit insurance companies.
Since August 2017, the Company has operated an accounts receivable securitization program(see Note 10).
c) Liquidity risk
The purpose of the Company’s liquidity and financing policy is to ensure that the Companykeeps sufficient funds available to meet its financial obligations as they fall due. The Company’smain sources of financing are as follows:
• $350,000 thousand aggregate principal amount of 9.375% senior unsecured notes dueMarch 1, 2022 (the ‘‘Notes’’). The proceeds from the Notes, issued by Ferroglobe andGlobe (together, the ‘‘Issuers’’) on February 15, 2017, were primarily used to repay certainexisting indebtedness of the Parent Company and its subsidiaries. Interest is payablesemi-annually on March 1 and September 1 of each year. If Ferroglobe experiences achange of control, the Company is required to offer to redeem the Notes at 101% of theirprincipal amount (further information below).
• $150,000 thousand Accounts Receivables Securitization Program. Trade receivables held bythe Company’s subsidiaries in Spain and France are sold to a special purpose ‘‘designatedactivity company’’ domiciled and incorporated in Ireland (the ‘‘SPE’’). Eligible receivablesare sold to the SPE on an on-going basis at an agreed upon purchase price ofapproximately 98% (2018: 99%) of their invoiced amount. The program has a two-year termuntil December 10, 2021. In respect of trade receivables outstanding at December 31, 2019the SPE had provided upfront cash consideration of approximately $58,339 thousand (2018:$227,360 thousand).
• $100,000 thousand North-American asset-based, revolving credit facility. Loans under theABL Revolver may be borrowed, repaid and reborrowed at any time until the facility’sexpiration date. The legal final maturity date of the ABL Revolver is October 11, 2024. The
178

Ferroglobe PLC and Subsidiaries
Notes to the Consolidated Financial Statements (Continued)
December 31, 2019, 2018 and 2017
(U.S. Dollars in thousands, except share and per share data)
27. Financial risk management (Continued)
terms of the facility provide a spring forward provision which requires the ABL Revolver tobe repaid on the date which is three months prior to the maturity date of the seniorunsecured Notes (March 1, 2022), which would currently imply a facility repayment date ofDecember 1, 2021. At December 31, 2019 $58,049 thousand was utilized.
The Indenture governing the Notes includes change of control provisions that would requirethe Company to offer to redeem the outstanding Notes at a purchase price in cash equal to 101%of the principal amount of the Notes, plus any accrued and unpaid interest in the event of a changeof control. A change in control is defined in the indenture as the occurrence of any of the following:
• If the Company becomes aware, that any person or group, other than one of the PermittedHolders (which is defined as Grupo Villar Mir (GVM), Alan Kestenbaum or members ofsenior management) or affiliates of those Permitted Holders, directly or indirectly controls35% or more of the Company’s voting stock and the aggregate voting stock of thePermitted Holders is the same or a lesser percentage;
• If the Company sells or otherwise disposes of all or substantially all of its assets;
• If the Company ceases to hold directly or indirectly 100% of the capital stock of Globe; or
• If the shareholders or the Company or the U.S. subsidiary approve the liquidation ordissolution of either the Company or Globe.
GVM currently owns approximately 54% of the Company’s voting stock, and a significantmajority of GVM’s shares in the Company are pledged as collateral for GVM’s obligations to certainof its lenders. A change of control may occur if a person other than a Permitted Holder were toacquire 35% or more of the Company’s outstanding shares at a time when the Permitted Holdersheld an equal or lesser percentage. While GVM maintains its current shareholding, a change ofcontrol cannot occur. Based on the provisions cited above, a change of control as defined in theIndenture is unlikely to occur but the matter it is beyond the Company’s control. If a change ofcontrol were to occur, the company may not have sufficient financial resources available to satisfyall of its obligations.
Management has evaluated the potential impact from the coronavirus outbreak on theCompany results of operations and liquidity finding difficult to develop a reliable estimate of thepotential impact on the results of operations and cash flow at this time, but the downside scenarioanalysis supports an expectation that the Company will have cash headroom to continue to operatethroughout the following twelve months (see Note 3).
179

Ferroglobe PLC and Subsidiaries
Notes to the Consolidated Financial Statements (Continued)
December 31, 2019, 2018 and 2017
(U.S. Dollars in thousands, except share and per share data)
27. Financial risk management (Continued)
Quantitative information
i) Interest rate risk:
At December 31, the Company’s interest-bearing financial liabilities were as follows:
2019Fixed rate Floating rate Total
$’000 $’000 $’000
Bank borrowings . . . . . . . . . . . . . . . . . . . . . . . . . . . . . . . . — 158,999 158,999Obligations under lease agreements . . . . . . . . . . . . . . . . . . — 25,872 25,872Debt instruments . . . . . . . . . . . . . . . . . . . . . . . . . . . . . . . . 354,951 — 354,951Other financial liabilities(*) . . . . . . . . . . . . . . . . . . . . . . . . . . 56,939 — 56,939
411,890 184,871 596,761
(*) Other financial liabilities comprise loans from government agencies and exclude derivative financial instruments (seeNote 19).
2018Fixed rate Floating rate Total
$’000 $’000 $’000
Bank borrowings . . . . . . . . . . . . . . . . . . . . . . . . . . . . . . . . — 141,012 141,012Obligations under finance leases . . . . . . . . . . . . . . . . . . . . — 66,471 66,471Debt instruments . . . . . . . . . . . . . . . . . . . . . . . . . . . . . . . . 352,594 — 352,594Other financial liabilities(*) . . . . . . . . . . . . . . . . . . . . . . . . . . 61,849 — 61,849
414,443 207,483 621,926
(*) Other financial liabilities comprise loans from government agencies and exclude derivative financial instruments (seeNote 19).
In respect of the above financial liabilities, at December 31, 2019, the Company had nofloating to fixed interest rate swaps in place covering its exposure to floating interest rates (2018:31%).
Analysis of sensitivity to interest rates
At December 31, 2019, an increase of 1% in interest rates would have given rise to additionalborrowing costs of $2,232 thousand (2018: $1,425 thousand).
ii) Foreign currency risk:Notes and cross currency swap
The Parent Company is exposed to exchange rate fluctuations as it has a Euro functionalcurrency and future commitments to pay interest and principal in US dollars in respect of its
180

Ferroglobe PLC and Subsidiaries
Notes to the Consolidated Financial Statements (Continued)
December 31, 2019, 2018 and 2017
(U.S. Dollars in thousands, except share and per share data)
27. Financial risk management (Continued)
outstanding debt instruments of $150,000 thousand (see Note 18). To manage this foreign currencyrisk, the Parent Company has entered into a cross currency swap and designated a portion of thisas an effective cash flow hedge of the future interest and principal amounts due on its debtinstruments. As discussed in Note 19, the notional amount of the cross currency swap exceeds theprincipal amount of the Parent Company’s debt instruments by $42,500 thousand and therefore aportion of the cross currency swap is not designated as a hedge and is accounted for at fair valuethrough profit or loss. The Company has performed a sensitivity analysis that indicates that if theEuro was to strengthen (weaken) against the US Dollar by 10% it would record a loss (gain) of$4,724 thousand in respect of the portion of the cross currency swap accounted for at fair valuethrough profit or loss (2018: $4,615 thousand).
In March, 2020, the Company closed out the cross currency swap (see note 30).
Foreign currency swaps in relation to trade receivables and trade payables
At December 31, 2019 and 2018, the Company has no foreign currency swaps in place inrespect of foreign currency accounts receivable and accounts payable.
iii) Liquidity risk:
The table below summarizes the maturity profile of the Company’s financial liabilities atDecember 31, 2019, based on contractual undiscounted payments. The table includes both interestand principal cash flows. The cash flows for debt instruments assume that principal of the Notes isrepaid at maturity in March 2022 (see Note 18).
2019Less than 1 year Between 1-2 years Between 2-5 years After 5 years Total
$’000 $’000 $’000 $’000 $’000
Bank borrowings . . . . . . . . . . 23,743 163,154 — — 186,897Leases . . . . . . . . . . . . . . . . 10,161 7,356 10,213 911 28,641Debt instruments . . . . . . . . . . 32,813 32,813 366,406 — 432,032Financial loans from
government agencies . . . . . 27,311 10,527 15,992 9,513 63,343Derivative financial instruments . 2,049 2,049 (4,911) — (813)Payables to related parties . . . 4,830 — — — 4,830Payable to non-current asset
suppliers . . . . . . . . . . . . . . 7,283 182 — — 7,465Contingent consideration . . . . . 1,626 5,006 18,170 8,916 33,718Trade and other payables . . . . 189,229 — — — 189,229
299,045 221,087 405,870 19,340 945,342
181
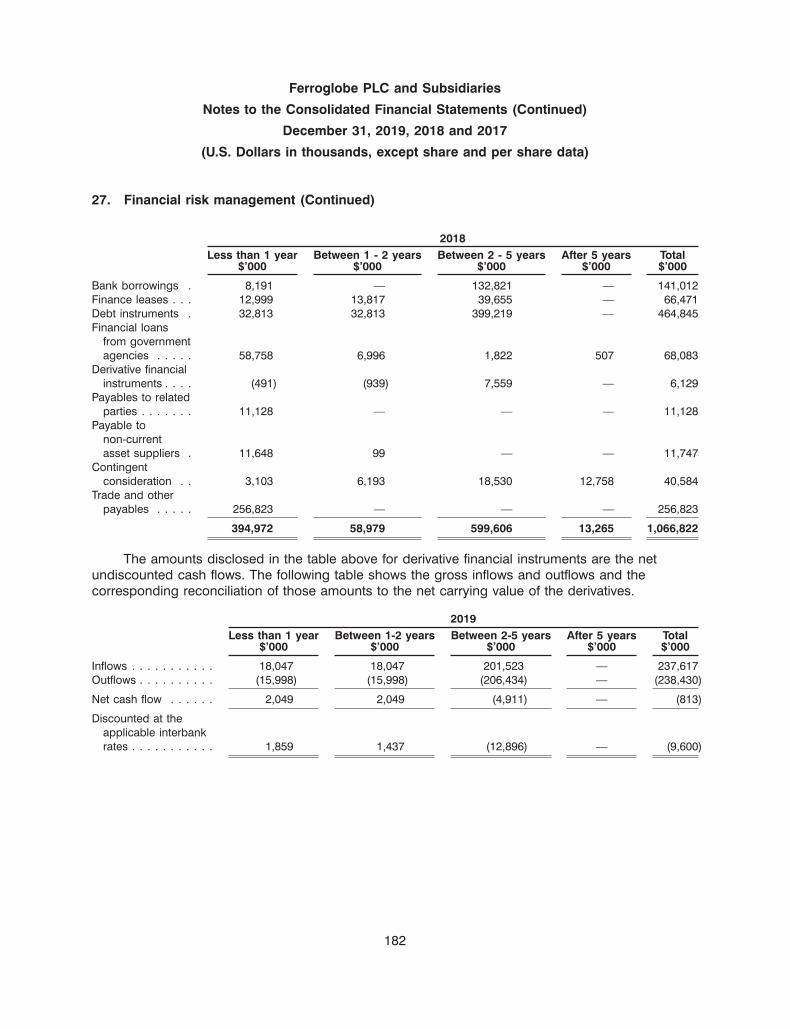
Ferroglobe PLC and Subsidiaries
Notes to the Consolidated Financial Statements (Continued)
December 31, 2019, 2018 and 2017
(U.S. Dollars in thousands, except share and per share data)
27. Financial risk management (Continued)
2018Less than 1 year Between 1 - 2 years Between 2 - 5 years After 5 years Total
$’000 $’000 $’000 $’000 $’000
Bank borrowings . 8,191 — 132,821 — 141,012Finance leases . . . 12,999 13,817 39,655 — 66,471Debt instruments . 32,813 32,813 399,219 — 464,845Financial loans
from governmentagencies . . . . . 58,758 6,996 1,822 507 68,083
Derivative financialinstruments . . . . (491) (939) 7,559 — 6,129
Payables to relatedparties . . . . . . . 11,128 — — — 11,128
Payable tonon-currentasset suppliers . 11,648 99 — — 11,747
Contingentconsideration . . 3,103 6,193 18,530 12,758 40,584
Trade and otherpayables . . . . . 256,823 — — — 256,823
394,972 58,979 599,606 13,265 1,066,822
The amounts disclosed in the table above for derivative financial instruments are the netundiscounted cash flows. The following table shows the gross inflows and outflows and thecorresponding reconciliation of those amounts to the net carrying value of the derivatives.
2019Less than 1 year Between 1-2 years Between 2-5 years After 5 years Total
$’000 $’000 $’000 $’000 $’000
Inflows . . . . . . . . . . . 18,047 18,047 201,523 — 237,617Outflows . . . . . . . . . . (15,998) (15,998) (206,434) — (238,430)
Net cash flow . . . . . . 2,049 2,049 (4,911) — (813)
Discounted at theapplicable interbankrates . . . . . . . . . . . 1,859 1,437 (12,896) — (9,600)
182
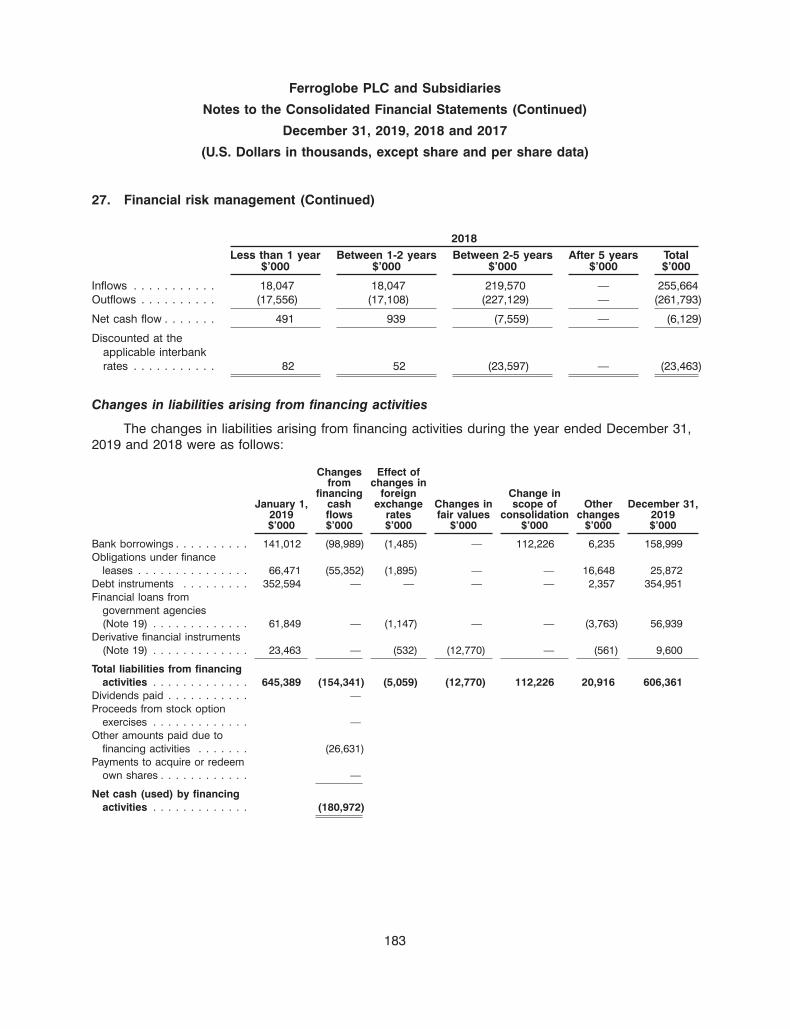
Ferroglobe PLC and Subsidiaries
Notes to the Consolidated Financial Statements (Continued)
December 31, 2019, 2018 and 2017
(U.S. Dollars in thousands, except share and per share data)
27. Financial risk management (Continued)
2018Less than 1 year Between 1-2 years Between 2-5 years After 5 years Total
$’000 $’000 $’000 $’000 $’000
Inflows . . . . . . . . . . . 18,047 18,047 219,570 — 255,664Outflows . . . . . . . . . . (17,556) (17,108) (227,129) — (261,793)
Net cash flow . . . . . . . 491 939 (7,559) — (6,129)
Discounted at theapplicable interbankrates . . . . . . . . . . . 82 52 (23,597) — (23,463)
Changes in liabilities arising from financing activities
The changes in liabilities arising from financing activities during the year ended December 31,2019 and 2018 were as follows:
Changes Effect offrom changes in
financing foreign Change inJanuary 1, cash exchange Changes in scope of Other December 31,
2019 flows rates fair values consolidation changes 2019$’000 $’000 $’000 $’000 $’000 $’000 $’000
Bank borrowings . . . . . . . . . . 141,012 (98,989) (1,485) — 112,226 6,235 158,999Obligations under finance
leases . . . . . . . . . . . . . . . 66,471 (55,352) (1,895) — — 16,648 25,872Debt instruments . . . . . . . . . 352,594 — — — — 2,357 354,951Financial loans from
government agencies(Note 19) . . . . . . . . . . . . . 61,849 — (1,147) — — (3,763) 56,939
Derivative financial instruments(Note 19) . . . . . . . . . . . . . 23,463 — (532) (12,770) — (561) 9,600
Total liabilities from financingactivities . . . . . . . . . . . . . 645,389 (154,341) (5,059) (12,770) 112,226 20,916 606,361
Dividends paid . . . . . . . . . . . —Proceeds from stock option
exercises . . . . . . . . . . . . . —Other amounts paid due to
financing activities . . . . . . . (26,631)Payments to acquire or redeem
own shares . . . . . . . . . . . . —
Net cash (used) by financingactivities . . . . . . . . . . . . . (180,972)
183

Ferroglobe PLC and Subsidiaries
Notes to the Consolidated Financial Statements (Continued)
December 31, 2019, 2018 and 2017
(U.S. Dollars in thousands, except share and per share data)
27. Financial risk management (Continued)
Changes Effect offrom changes in
financing foreign Change inJanuary 1, cash exchange Changes in scope of Other December 31,
2018 flows rates fair values consolidation changes 2018$’000 $’000 $’000 $’000 $’000 $’000 $’000
Bank borrowings . . . . . . . . . . 1,003 140,781 (772) — — — 141,012Obligations under finance
leases . . . . . . . . . . . . . . . 82,633 (12,948) (3,214) — — — 66,471Debt instruments . . . . . . . . . 350,270 — — — — 2,324 352,594Financial loans from
government agencies(Note 19) . . . . . . . . . . . . . 99,391 (33,096) (4,446) — — — 61,849
Derivative financial instruments(Note 19) . . . . . . . . . . . . . 38,040 — (1,677) (12,841) — (59) 23,463
Total liabilities from financingactivities . . . . . . . . . . . . . 571,337 94,737 (10,109) (12,841) — 2,265 645,389
Dividends paid . . . . . . . . . . . (20,642)Proceeds from stock option
exercises . . . . . . . . . . . . . 240Other amounts paid due to
financing activities . . . . . . . (932)Payments to acquire or redeem
own shares . . . . . . . . . . . . (20,100)
Net cash provided byfinancing activities . . . . . . 53,303
184
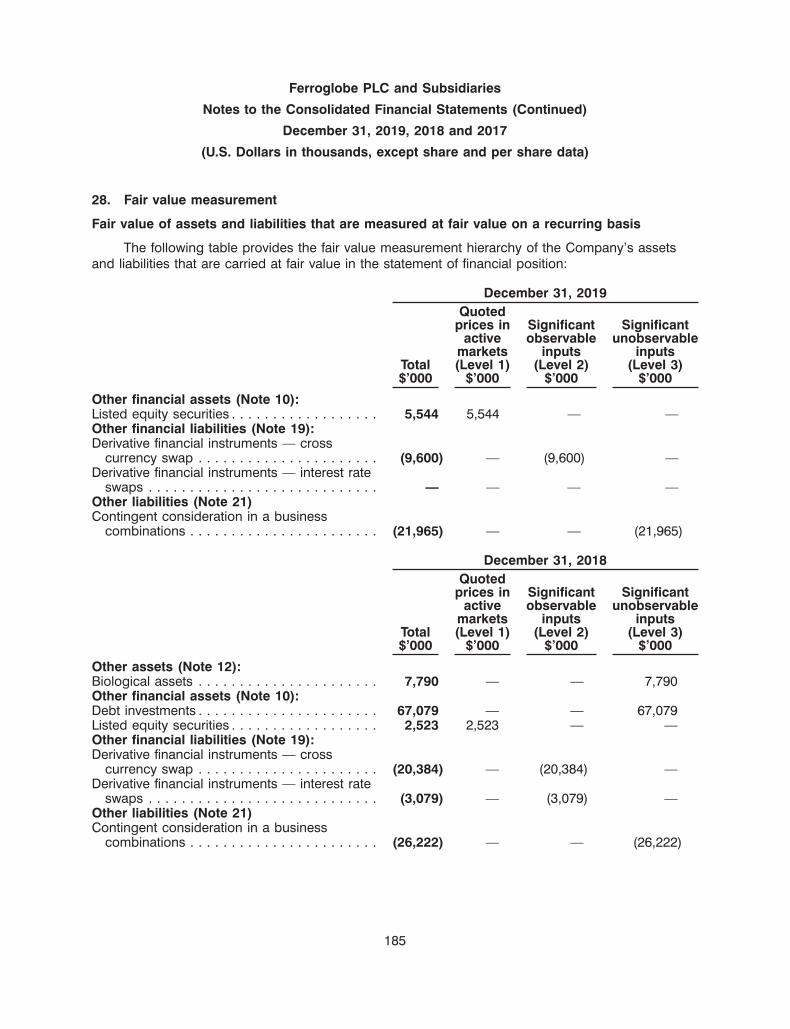
Ferroglobe PLC and Subsidiaries
Notes to the Consolidated Financial Statements (Continued)
December 31, 2019, 2018 and 2017
(U.S. Dollars in thousands, except share and per share data)
28. Fair value measurement
Fair value of assets and liabilities that are measured at fair value on a recurring basis
The following table provides the fair value measurement hierarchy of the Company’s assetsand liabilities that are carried at fair value in the statement of financial position:
December 31, 2019Quoted
prices in Significant Significantactive observable unobservable
markets inputs inputsTotal (Level 1) (Level 2) (Level 3)$’000 $’000 $’000 $’000
Other financial assets (Note 10):Listed equity securities . . . . . . . . . . . . . . . . . . 5,544 5,544 — —Other financial liabilities (Note 19):Derivative financial instruments — cross
currency swap . . . . . . . . . . . . . . . . . . . . . . (9,600) — (9,600) —Derivative financial instruments — interest rate
swaps . . . . . . . . . . . . . . . . . . . . . . . . . . . . — — — —Other liabilities (Note 21)Contingent consideration in a business
combinations . . . . . . . . . . . . . . . . . . . . . . . (21,965) — — (21,965)
December 31, 2018Quoted
prices in Significant Significantactive observable unobservable
markets inputs inputsTotal (Level 1) (Level 2) (Level 3)$’000 $’000 $’000 $’000
Other assets (Note 12):Biological assets . . . . . . . . . . . . . . . . . . . . . . 7,790 — — 7,790Other financial assets (Note 10):Debt investments . . . . . . . . . . . . . . . . . . . . . . 67,079 — — 67,079Listed equity securities . . . . . . . . . . . . . . . . . . 2,523 2,523 — —Other financial liabilities (Note 19):Derivative financial instruments — cross
currency swap . . . . . . . . . . . . . . . . . . . . . . (20,384) — (20,384) —Derivative financial instruments — interest rate
swaps . . . . . . . . . . . . . . . . . . . . . . . . . . . . (3,079) — (3,079) —Other liabilities (Note 21)Contingent consideration in a business
combinations . . . . . . . . . . . . . . . . . . . . . . . (26,222) — — (26,222)
185

Ferroglobe PLC and Subsidiaries
Notes to the Consolidated Financial Statements (Continued)
December 31, 2019, 2018 and 2017
(U.S. Dollars in thousands, except share and per share data)
28. Fair value measurement (Continued)
Cross currency swap
The cross currency swap is valued using a discounted cash flow technique. The valuationmodel incorporates foreign exchange spot and forward rates, yield curves of the respectivecurrencies, currency basis spreads between the respective currencies and forward interest rates.The valuation also incorporates a credit risk adjustment, calculated based on credit spreads derivedfrom current credit default swap prices (see Note 19).
The fair value of the swap at December 31, 2019 was a liability of $9,600 thousand, which iscategorized as a level 2 measurement in the fair value hierarchy as it is based on valuationtechniques for which the inputs are directly or indirectly observable. The fair value is calculated asthe present value of the estimated future cash flows and is subject to a credit risk adjustment thatreflect the credit risk of the Company; this is calculated based on credit spreads derived fromcurrent credit default swap prices.
In March, 2020, the Company closed out the cross currency swap resulting in the receipt ofcash proceeds of $3,608 thousand
Interest rate swaps
Interest rate swaps are valued using a discounted cash flow technique. Future cash flows areestimated based on forward interest rates (from observable yield curves at the end of the reportingperiod) and contract interest rates, discounted at a rate that reflects the credit risk of variouscounterparties.
Biological assets
Biological assets comprise timber farms in South Africa, which are a source of raw materialsused for the production of silicon metal. The timber farms plantations are measured at fair valueless the incremental costs to be incurred until the related products are at the point of sale. Thechanges in the fair value of this asset are recognized in the income statement in the line ‘‘net gain(loss) due to changes in the value of assets’’ (see Note 25.5).
During the year ended December 31, 2019, the Company divested of certain timber farmplantations and associated property, plant and equipment, which resulted in proceeds of$8,668 thousand.
The fair value of the remaining timber farm plantations at December 31, 2019 is based onindicative offers received. In the prior year, the fair value of the biological assets was based on avaluation model for which the key assumptions were as follows:
• the arm’s length price (market price) used by the market for wood of varying ages;
• the wood pulp industry Mean Annual Increment (MAI) index of 15 for gum and 10.5 for pineis used to determine the annual growth rate of the plantations; and
• the density index used to convert cubic meters of wood to metric tons is 0.94 for pine and1 for wood pulp.
186

Ferroglobe PLC and Subsidiaries
Notes to the Consolidated Financial Statements (Continued)
December 31, 2019, 2018 and 2017
(U.S. Dollars in thousands, except share and per share data)
28. Fair value measurement (Continued)
The changes in fair value of biological assets classified at level 3 in the hierarchy were asfollows:
Level 3$’000
January 1, 2018 27,279Loss recognised in profit or loss (Note 25.5) . . . . . . . . . . . . . . . . . . . . . . . . . . . . . . . . . (7,615)Disposal of biological assets . . . . . . . . . . . . . . . . . . . . . . . . . . . . . . . . . . . . . . . . . . . . . (12,168)Translation differences . . . . . . . . . . . . . . . . . . . . . . . . . . . . . . . . . . . . . . . . . . . . . . . . . 294
December 31, 2018 . . . . . . . . . . . . . . . . . . . . . . . . . . . . . . . . . . . . . . . . . . . . . . . . . . . 7,790Loss recognised in profit or loss (Note 25.5) . . . . . . . . . . . . . . . . . . . . . . . . . . . . . . . . . (530)Disposal of biological assets . . . . . . . . . . . . . . . . . . . . . . . . . . . . . . . . . . . . . . . . . . . . . (7,365)Translation differences . . . . . . . . . . . . . . . . . . . . . . . . . . . . . . . . . . . . . . . . . . . . . . . . . 105
December 31, 2019 . . . . . . . . . . . . . . . . . . . . . . . . . . . . . . . . . . . . . . . . . . . . . . . . . . . —
29. Non-current assets held for sale and discontinued operations
Discontinued operations
On June 2, 2019 the Company entered into an agreement with Kehlen IndustriesManagement, S.L., a wholly-owned subsidiary of TSSP Adjacent Opportunities Partners, L.P., for thesale of the entire share capital of FerroAtlantica, S.A.U (‘‘FAU’’), the owner and operator of theGroup’s hydro-electric assets in Galicia (the ‘‘Spanish Hydroelectric Business’’) and its smeltingfacility at Cee-Dumbria. The Spanish Hydroelectric Business was classified as disposal group heldfor sale in the second quarter of 2019 and has been accounted for as a discontinued operation.Prior to completion of the sale, all other assets of FAU unrelated to the Spanish HydroelectricBusiness and the Cee-Dumbria smelting facility were transferred to other Group entities.
Following the satisfaction of conditions precedent, the sale of FAU completed on August 30,2019, resulting in gross cash proceeds of $177,627 thousand and a profit on disposal of$85,102 thousand. Under the terms of the transaction, the Group will become exclusive off-taker offinished products produced at the smelting plant at Cee-Dumbria and supplier of key raw materialsto that facility pursuant to a tolling agreement expiring in 2060.
Analysis of the result for the period from the discontinued operations
The results of the discontinued operations included in the (loss) profit after taxes fromdiscontinued operations are set out below. The comparative results of the Spanish HydroelectricBusiness at December 31, 2019, 2018 and 2017 have been represented them as profit (loss) fromdiscontinued operations.
187

Ferroglobe PLC and Subsidiaries
Notes to the Consolidated Financial Statements (Continued)
December 31, 2019, 2018 and 2017
(U.S. Dollars in thousands, except share and per share data)
29. Non-current assets held for sale and discontinued operations (Continued)
The profit and loss statement from discontinued operations is as follows:
2019 2018 2017$’000 $’000 $’000
Sales . . . . . . . . . . . . . . . . . . . . . . . . . . . . . . . . . . . . . . . . . . . . . . . . 13,164 32,035 9,417Cost of sales . . . . . . . . . . . . . . . . . . . . . . . . . . . . . . . . . . . . . . . . . . . (271) (677) (120)Other operating income . . . . . . . . . . . . . . . . . . . . . . . . . . . . . . . . . . . 365 193 99Staff costs . . . . . . . . . . . . . . . . . . . . . . . . . . . . . . . . . . . . . . . . . . . . . (1,450) (2,201) (1,928)Other operating expense . . . . . . . . . . . . . . . . . . . . . . . . . . . . . . . . . . (1,995) (6,370) (5,527)Depreciation and amortization charges, operating allowances and write-
downs . . . . . . . . . . . . . . . . . . . . . . . . . . . . . . . . . . . . . . . . . . . . . . (2,830) (5,300) (4,128)Impairment losses . . . . . . . . . . . . . . . . . . . . . . . . . . . . . . . . . . . . . . . — — 684Gain on sale of discontinued operation . . . . . . . . . . . . . . . . . . . . . . . . 85,102 — —
Operating Profit (loss) . . . . . . . . . . . . . . . . . . . . . . . . . . . . . . . . . . . 92,085 17,680 (1,503)Net finance expense . . . . . . . . . . . . . . . . . . . . . . . . . . . . . . . . . . . . . . (6,433) (4,440) (4,143)
(Loss) Profit before taxes from discontinued operations . . . . . . . . . . 85,652 13,240 (5,646)Income tax expense . . . . . . . . . . . . . . . . . . . . . . . . . . . . . . . . . . . . . . (1,015) (3,776) 596
(Loss) Profit after taxes from discontinued operations . . . . . . . . . . . 84,637 9,464 (5,050)
188
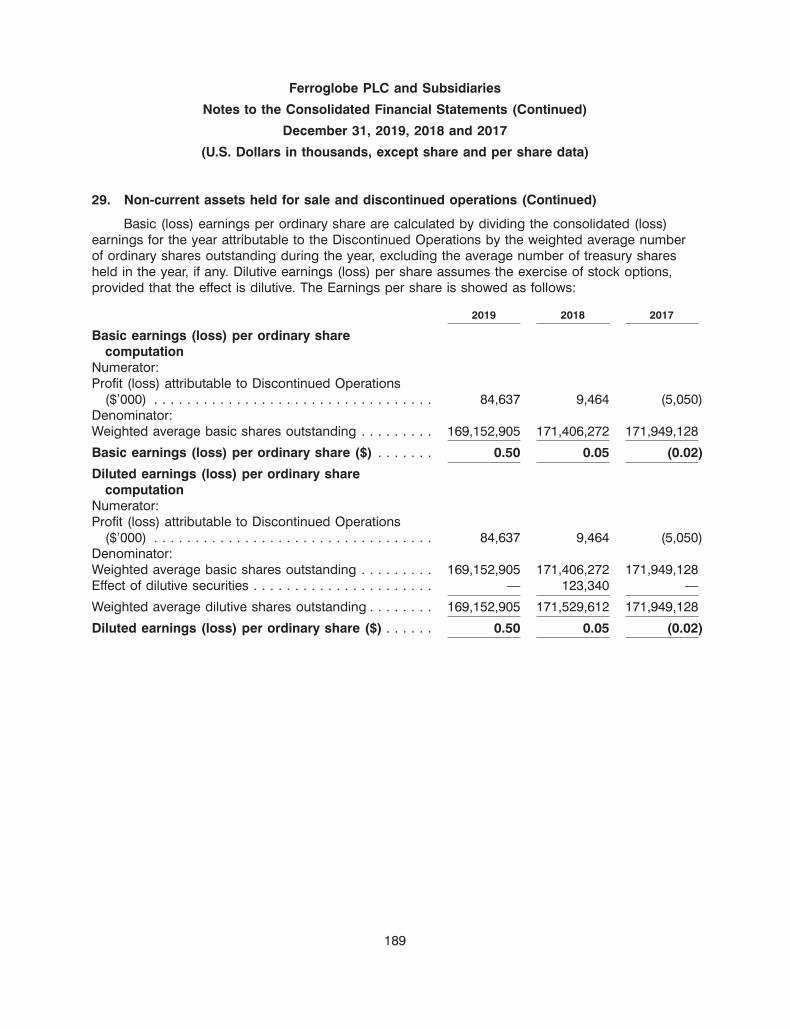
Ferroglobe PLC and Subsidiaries
Notes to the Consolidated Financial Statements (Continued)
December 31, 2019, 2018 and 2017
(U.S. Dollars in thousands, except share and per share data)
29. Non-current assets held for sale and discontinued operations (Continued)
Basic (loss) earnings per ordinary share are calculated by dividing the consolidated (loss)earnings for the year attributable to the Discontinued Operations by the weighted average numberof ordinary shares outstanding during the year, excluding the average number of treasury sharesheld in the year, if any. Dilutive earnings (loss) per share assumes the exercise of stock options,provided that the effect is dilutive. The Earnings per share is showed as follows:
2019 2018 2017
Basic earnings (loss) per ordinary sharecomputation
Numerator:Profit (loss) attributable to Discontinued Operations
($’000) . . . . . . . . . . . . . . . . . . . . . . . . . . . . . . . . . . 84,637 9,464 (5,050)Denominator:Weighted average basic shares outstanding . . . . . . . . . 169,152,905 171,406,272 171,949,128
Basic earnings (loss) per ordinary share ($) . . . . . . . 0.50 0.05 (0.02)
Diluted earnings (loss) per ordinary sharecomputation
Numerator:Profit (loss) attributable to Discontinued Operations
($’000) . . . . . . . . . . . . . . . . . . . . . . . . . . . . . . . . . . 84,637 9,464 (5,050)Denominator:Weighted average basic shares outstanding . . . . . . . . . 169,152,905 171,406,272 171,949,128Effect of dilutive securities . . . . . . . . . . . . . . . . . . . . . . — 123,340 —
Weighted average dilutive shares outstanding . . . . . . . . 169,152,905 171,529,612 171,949,128
Diluted earnings (loss) per ordinary share ($) . . . . . . 0.50 0.05 (0.02)
189
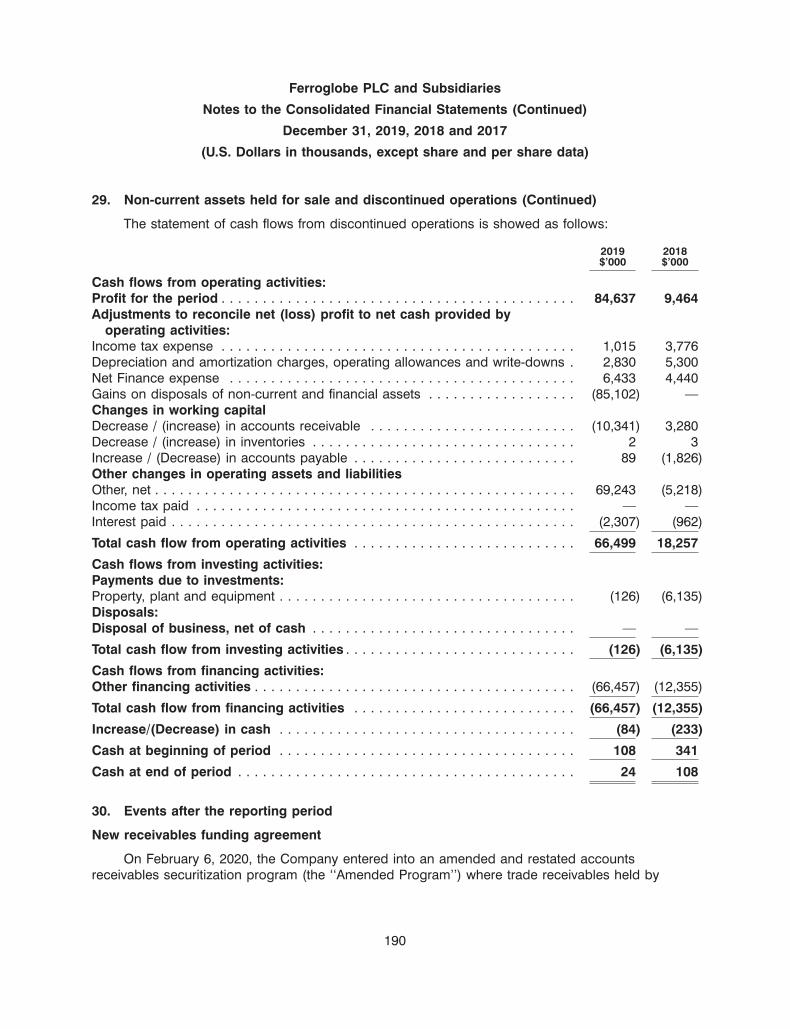
Ferroglobe PLC and Subsidiaries
Notes to the Consolidated Financial Statements (Continued)
December 31, 2019, 2018 and 2017
(U.S. Dollars in thousands, except share and per share data)
29. Non-current assets held for sale and discontinued operations (Continued)
The statement of cash flows from discontinued operations is showed as follows:
2019 2018$’000 $’000
Cash flows from operating activities:Profit for the period . . . . . . . . . . . . . . . . . . . . . . . . . . . . . . . . . . . . . . . . . . . 84,637 9,464Adjustments to reconcile net (loss) profit to net cash provided by
operating activities:Income tax expense . . . . . . . . . . . . . . . . . . . . . . . . . . . . . . . . . . . . . . . . . . . 1,015 3,776Depreciation and amortization charges, operating allowances and write-downs . 2,830 5,300Net Finance expense . . . . . . . . . . . . . . . . . . . . . . . . . . . . . . . . . . . . . . . . . . 6,433 4,440Gains on disposals of non-current and financial assets . . . . . . . . . . . . . . . . . . (85,102) —Changes in working capitalDecrease / (increase) in accounts receivable . . . . . . . . . . . . . . . . . . . . . . . . . (10,341) 3,280Decrease / (increase) in inventories . . . . . . . . . . . . . . . . . . . . . . . . . . . . . . . . 2 3Increase / (Decrease) in accounts payable . . . . . . . . . . . . . . . . . . . . . . . . . . . 89 (1,826)Other changes in operating assets and liabilitiesOther, net . . . . . . . . . . . . . . . . . . . . . . . . . . . . . . . . . . . . . . . . . . . . . . . . . . . 69,243 (5,218)Income tax paid . . . . . . . . . . . . . . . . . . . . . . . . . . . . . . . . . . . . . . . . . . . . . . — —Interest paid . . . . . . . . . . . . . . . . . . . . . . . . . . . . . . . . . . . . . . . . . . . . . . . . . (2,307) (962)
Total cash flow from operating activities . . . . . . . . . . . . . . . . . . . . . . . . . . . 66,499 18,257
Cash flows from investing activities:Payments due to investments:Property, plant and equipment . . . . . . . . . . . . . . . . . . . . . . . . . . . . . . . . . . . . (126) (6,135)Disposals:Disposal of business, net of cash . . . . . . . . . . . . . . . . . . . . . . . . . . . . . . . . — —
Total cash flow from investing activities . . . . . . . . . . . . . . . . . . . . . . . . . . . . (126) (6,135)
Cash flows from financing activities:Other financing activities . . . . . . . . . . . . . . . . . . . . . . . . . . . . . . . . . . . . . . . (66,457) (12,355)
Total cash flow from financing activities . . . . . . . . . . . . . . . . . . . . . . . . . . . (66,457) (12,355)
Increase/(Decrease) in cash . . . . . . . . . . . . . . . . . . . . . . . . . . . . . . . . . . . . (84) (233)
Cash at beginning of period . . . . . . . . . . . . . . . . . . . . . . . . . . . . . . . . . . . . 108 341
Cash at end of period . . . . . . . . . . . . . . . . . . . . . . . . . . . . . . . . . . . . . . . . . 24 108
30. Events after the reporting period
New receivables funding agreement
On February 6, 2020, the Company entered into an amended and restated accountsreceivables securitization program (the ‘‘Amended Program’’) where trade receivables held by
190
Ferroglobe PLC and Subsidiaries
Notes to the Consolidated Financial Statements (Continued)
December 31, 2019, 2018 and 2017
(U.S. Dollars in thousands, except share and per share data)
30. Events after the reporting period (Continued)
certain of the Company’s subsidiaries in Spain and France (the ‘‘Originators’’) are financed, eitherdirectly or indirectly (through a French fonds commun de titrisation named ‘‘FCT Ferro’’ (the‘‘FCT’’)), by a special purpose ‘‘designated activity company’’ domiciled and incorporated in Ireland(the ‘‘SPE’’). The constitution of the FCT into the Amended Program allowed for the sale of certainEUR denominated receivables that were not eligible under the previous structure and increased theavailable funding from the SPE to the Originators.
Subsequent to entering into the Amended Program, the Company has repaid$34,500 thousand of senior loans in order to optimise the level of borrowings of the SPE with thelevel of receivables in the securitization. There has been no change to the senior lender’s maximumcommitment of $150,000 thousand and the Company can request additional senior loans up to themaximum commitment when needed.
Impact of COVID-19 pandemic in Company’s business
In early 2020, the outbreak of coronavirus disease (‘‘COVID-19’’) in China spread to otherjurisdictions, including locations where the Company conducts business. As of the date of theissuance of the consolidated financial statements, the COVID-19 outbreak has not yet had amaterial effect on the Company’s liquidity or financial position. Management continue to monitor theimpact that the COVID-19 pandemic is having on the Company, the specialty chemical industry andthe economies in which the Company operates. Given the speed and frequency of continuouslyevolving developments with respect to this pandemic and the uncertainties this may bring for theCompany and the demand for its products it is difficult to forecast the level of trading activities andhence cash flow in the next twelve months. Management have developed an impact assessment tostress test and assess potential responses to a downside scenario. The assessment involvesapplication of key assumptions around market demand and prices, including the extent of thedecrease that might be experienced in summer 2020 and the subsequent timing and level ofrecovery. Additionally, judgment is required around the level and extent of mitigating actions suchas reductions in operating costs and capital expenditure. Developing a reliable estimate of thepotential impact on the results of operations and cash flow at this time is difficult as markets andindustries react to the pandemic and the measures implemented in response to it, but thedownside scenario analysis supports an expectation that the Company will have cash headroom tocontinue to operate throughout the following twelve months. The key assumption underlying thisassessment is a recovery in forecast trading activity in the latter part of 2020.
Cancellation of Cross-currency swap
In March, 2020, the Company closed out the cross currency swap (see Note 28) resulting inthe receipt of cash proceeds of $3,608 thousand.
191

PARENT COMPANY BALANCE SHEET
AS OF DECEMBER 31, 2019 AND 2018
Thousands of U.S. Dollars
2019 2018Notes $’000 $’000
ASSETSNon-current assetsInvestment in subsidiaries . . . . . . . . . . . . . . . . . . . . . . . . . . . . . . . . . . . . . . 3 610,534 1,068,283Property, plant and equipment . . . . . . . . . . . . . . . . . . . . . . . . . . . . . . . . . . . 10 2 —Trade and other receivables . . . . . . . . . . . . . . . . . . . . . . . . . . . . . . . . . . . . . 4 207,576 265,801
Total non-current assets . . . . . . . . . . . . . . . . . . . . . . . . . . . . . . . . . . . . . . 818,112 1,334,084
Current assetsTrade and other receivables . . . . . . . . . . . . . . . . . . . . . . . . . . . . . . . . . . . . . 4 88,396 98,201Other current assets . . . . . . . . . . . . . . . . . . . . . . . . . . . . . . . . . . . . . . . . . . 708 376Cash and cash equivalents . . . . . . . . . . . . . . . . . . . . . . . . . . . . . . . . . . . . . 1,199 2,013
Total current assets . . . . . . . . . . . . . . . . . . . . . . . . . . . . . . . . . . . . . . . . . . 90,303 100,590
Total assets . . . . . . . . . . . . . . . . . . . . . . . . . . . . . . . . . . . . . . . . . . . . . . . 908,415 1,434,674
EQUITY AND LIABILITIESEquityShare capital . . . . . . . . . . . . . . . . . . . . . . . . . . . . . . . . . . . . . . . . . . . . . . . 1,784 1,784Other reserves . . . . . . . . . . . . . . . . . . . . . . . . . . . . . . . . . . . . . . . . . . . . . . (282,025) (286,906)Translation differences . . . . . . . . . . . . . . . . . . . . . . . . . . . . . . . . . . . . . . . . . 39,236 59,023Valuation adjustments . . . . . . . . . . . . . . . . . . . . . . . . . . . . . . . . . . . . . . . . . (3,417) (8,567)Retained earnings . . . . . . . . . . . . . . . . . . . . . . . . . . . . . . . . . . . . . . . . . . . 793,729 1,274,853
Total equity . . . . . . . . . . . . . . . . . . . . . . . . . . . . . . . . . . . . . . . . . . . . . . . 7 549,307 1,040,187Net current (liabilities) assets . . . . . . . . . . . . . . . . . . . . . . . . . . . . . . . . . . . (111,318) 5,733Total assets less current liabilities . . . . . . . . . . . . . . . . . . . . . . . . . . . . . . . . 706,794 1,339,817
Non-current liabilitiesDebt instruments . . . . . . . . . . . . . . . . . . . . . . . . . . . . . . . . . . . . . . . . . . . . 8 147,435 146,425Bank borrowings . . . . . . . . . . . . . . . . . . . . . . . . . . . . . . . . . . . . . . . . . . . . 6 — 132,821Lease liabilities . . . . . . . . . . . . . . . . . . . . . . . . . . . . . . . . . . . . . . . . . . . . . 11 452 —Other financial liabilities . . . . . . . . . . . . . . . . . . . . . . . . . . . . . . . . . . . . . . . . 9 9,600 20,384
Total non-current liabilities . . . . . . . . . . . . . . . . . . . . . . . . . . . . . . . . . . . . . 157,487 299,630
Current liabilitiesDebt instruments . . . . . . . . . . . . . . . . . . . . . . . . . . . . . . . . . . . . . . . . . . . . 8 4,687 4,687Bank borrowings . . . . . . . . . . . . . . . . . . . . . . . . . . . . . . . . . . . . . . . . . . . . 6 — 493Lease liabilities . . . . . . . . . . . . . . . . . . . . . . . . . . . . . . . . . . . . . . . . . . . . . 11 800 —Trade and other payables . . . . . . . . . . . . . . . . . . . . . . . . . . . . . . . . . . . . . . 5 190,856 88,924Other current liabilities . . . . . . . . . . . . . . . . . . . . . . . . . . . . . . . . . . . . . . . . 5,278 753
Total current liabilities . . . . . . . . . . . . . . . . . . . . . . . . . . . . . . . . . . . . . . . . 201,621 94,857
Total equity and liabilities . . . . . . . . . . . . . . . . . . . . . . . . . . . . . . . . . . . . . 908,415 1,434,674
Notes 1 to 12 are an integral part of these financial statements.
The Company reported a loss for the financial year ended December 31, 2019 of$481,124 thousand (2018: loss of $21,611 thousand).
The financial statements of Ferroglobe PLC with registration number 9425113 were approvedby the Board and authorized for issue on June 5, 2020.
Signed on behalf of the Board.
Dr. Marco LeviDirector
192

PARENT COMPANY STATEMENT OF CHANGES IN EQUITY FOR 2019 AND 2018
Thousands of U.S. Dollars
Equity attributable to equity holders of the CompanyShare Other Translation Valuation Retainedcapital reserves differences adjustments earnings Total$’000 $’000 $’000 $’000 $’000 $’000
Balance at December 31, 2017 . . . 1,796 (277,332) 109,630 (10,596) 1,325,262 1,148,760Comprehensive (loss) income for
the year . . . . . . . . . . . . . . . . . . . — — (50,607) 2,029 (21,611) (70,189)Issue of share capital . . . . . . . . . . . — 240 — — — 240Cash settlement of equity awards . . — (680) — — — (680)Share-based compensation . . . . . . — 2,798 — — — 2,798Dividends paid . . . . . . . . . . . . . . . — — — — (20,642) (20,642)Own shares acquired . . . . . . . . . . . (12) (11,932) — — (8,156) (20,100)
Balance at December 31, 2018 . . . 1,784 (286,906) 59,023 (8,567) 1,274,853 1,040,187Comprehensive (loss) income for
the year . . . . . . . . . . . . . . . . . . . — — (19,787) 5,150 (481,124) (495,761)Share-based compensation . . . . . . — 4,881 — — — 4,881
Balance at December 31, 2019 . . . 1,784 (282,025) 39,236 (3,417) 793,729 549,307
193
1. Significant accounting policies
The separate financial statements of the Company are presented as required by theCompanies Act 2006. The Company meets the definition of a qualifying entity under FRS 100(Financial Reporting Standard 100) issued by the Financial Reporting Council (the ‘‘FRC’’). In theyear ended December 31, 2019 the Company has continued to adopt FRS 101 as issued by theFRC. Accordingly, the financial statements have therefore been prepared in accordance withFRS 101 (Financial Reporting Standard 101) Reduced Disclosure Framework as issued by the FRCincorporating the Amendments to FRS 101 issued by the FRC in July 2015 and July 2016.
As permitted by FRS 101, the Company has taken advantage of the disclosure exemptionsavailable under that standard in relation to share-based payment, financial instruments, capitalmanagement, presentation of comparative information in respect of certain assets, presentation of acash flow statement, certain related party transactions and the requirements of paragraphs 30 and31 of IAS 8 ‘Accounting Policies, Changes in Accounting Estimates and Errors’ in relation tostandards not yet effective. Where required, equivalent disclosures are given in the consolidatedfinancial statements
The financial statements have been prepared on the historical cost basis except for theremeasurement of certain financial instruments to fair value. The principal accounting policiesadopted are the same as those set out in Notes 3 and 4 to the consolidated financial statementsexcept as noted below.
Investment in subsidiaries and impairment
Investments in subsidiaries are stated at cost less, where appropriate, provisions forimpairment. At each balance sheet date, the Company reviews the carrying amount of itsinvestments to determine whether there is any indication that those assets have suffered animpairment loss if any such indication exists, the recoverable amount of the asset is estimated todetermine the extent of the impairment loss (if any).
Recoverable amount is the higher of the fair value less costs to sell and the value in use. Inassessing value in use, the estimated future cash flows are discounted to the present value using apre-tax discount rate that reflects current market assessments of the time value of money and therisks specific to the asset for which the estimates of future cash flows have not been adjusted. If therecoverable amount of an asset is estimated to be less than its carrying amount, the carryingamount of the asset is reduced to its recoverable amount. An impairment loss is recognizedimmediately in profit or loss.
Where an impairment loss subsequently reverses, the carrying amount of the asset isincreased to the revised estimate of its recoverable amount, but so that the increased carryingamount does not exceed the carrying amount that would have been determined had no impairmentloss been recognized for the asset in prior years a reversal of an impairment loss is recognizedimmediately in profit or loss.
Impact of new International Financial Reporting Standards
The Company adopted IFRS 16 ‘Leases’ with effect from January 1, 2019. There are no othernew or amended standards or interpretations adopted during the year that have a significant impacton the financial statements.
194
1. Significant accounting policies (Continued)
IFRS 16 ‘Leases’
IFRS 16 Leases replaces the existing standard on accounting for leases, IAS 17, and therelated interpretations. The Company applied the standard from its mandatory adoption date ofJanuary 1, 2019 and transitioned to the standard in accordance with the modified retrospectiveapproach; the prior year figures were not adjusted. The Company elected the practical expedient inparagraph IFRS 16:C3 that permits an entity not to reassess whether a contract is, or contains, alease at the date of initial application. See Note 10, Property, plant and equipment and Note 11,Leases for the impact of the adoption of IFRS 16 Leases on the components of the financialstatements.
1.1 Critical accounting judgements and key sources of estimation uncertainty
In the application of the Company’s accounting policies, the directors are required to makejudgements, estimates and assumptions about the carrying amounts of assets and liabilities that arenot readily apparent from other sources. The estimates and associated assumptions are based onhistorical experience and other factors that are considered to be relevant. Actual results may differfrom these estimates.
The estimates and underlying assumptions are reviewed on an ongoing basis. Revisions toaccounting estimates are recognized in the period in which the estimate is revised if the revisionaffects only that period, or in the period of the revision and future periods if the revision affects bothcurrent and future periods.
Critical judgements in applying the Company’s accounting policies
The following are the critical judgements, apart from those involving estimations (which aredealt with separately below), that the directors have made in the process of applying theCompany’s accounting policies and that have the most significant effect on the amounts recognizedin financial statements.
Impairment of assets
The Company reviews the carrying value of assets on a periodic basis, and whenever eventsor changes in circumstances indicate that the related carrying amounts may not be recoverable.
Such circumstances or events could include: a pattern of losses involving the asset; a declinein the market value for the asset; and an adverse change in the business or market in which theasset is involved. Determining whether an impairment has occurred typically requires variousestimates and assumptions, including determining which cash flows are directly related to thepotentially impaired asset, the useful life over which cash flows will occur, their amount and theasset’s residual value, if any. Estimates of future cash flows and the selection of appropriatediscount rates relating to particular assets or groups of assets involve the exercise of a significantamount of judgement.
Cash flow projections are based on the Company’s five year internal forecasts, the results ofwhich are reviewed by the Board. Estimates of selling prices and direct costs are based on pastexperience, expectations of future changes in the market and historic trends.
195

1. Significant accounting policies (Continued)
Key sources of estimation of uncertainty
The key assumptions concerning the future, and other key sources of estimating uncertainty atthe reporting period that may have a significant risk of causing a material adjustment to the carryingamount of assets and liabilities within the next financial year, are discussed below.
Allowances against the carrying value of investment in subsidiaries
Investments in subsidiaries and associates are stated at cost less, where appropriate,provisions for impairment. The recoverable amounts of individual investments in subsidiaries aredetermined from value in use calculations with a discounted cash flow model being used tocalculate this amount. The key assumptions for the value in use calculation are those regarding thediscount rate, growth rate, and cash flows.
Cash flow projections are based on the Company’s five year internal forecasts, the results ofwhich are reviewed by the Board. Estimates of selling prices and direct costs are based on pastexperience, expectations of future changes in the market and historic trends. Sensitivities aredisclosed in Note 7 of the Consolidated Financial Statements.
2. Profit (loss) for the year
As permitted by s408 of the Companies Act 2006 the Company has elected not to present itsown profit and loss account or statement of other comprehensive income for the year. The profit(loss) attributable to the Company is disclosed directly beneath the Company’s balance sheet.
The auditor’s remuneration for audit and other services is disclosed in note 25.7 to theconsolidated financial statements.
3. Investment in subsidiaries
The Company’s investments at the balance sheet date in the share capital of its subsidiariesinclude the following:
Company Country Ownership Currency Purpose
Grupo FerroAtlantica, S.A.U. . . Spain 100% EUR ElectrometallurgyGlobe Specialty Metals, Inc. . . United States of America 100% USD Electrometallurgy
Investments in subsidiaries are stated at cost less provision for impairments and the Directorsbelieve that the carrying value of the investments is supported by their underlying net assets orexpected cash generation.
196
3. Investment in subsidiaries (Continued)
The change in carrying value of investments is as follows:
2019 2018$’000 $’000
Cost:At January 1 . . . . . . . . . . . . . . . . . . . . . . . . . . . . . . . . 1,068,283 1,118,945Translation differences . . . . . . . . . . . . . . . . . . . . . . . . . (20,153) (50,662)
At December 31 . . . . . . . . . . . . . . . . . . . . . . . . . . . . . 1,048,130 1,068,283
Provision for impairment:At January 1 . . . . . . . . . . . . . . . . . . . . . . . . . . . . . . . . — —Impairment . . . . . . . . . . . . . . . . . . . . . . . . . . . . . . . . . . 437,596 —
At December 31 . . . . . . . . . . . . . . . . . . . . . . . . . . . . . 437,596 —
Net book value:
At December 31 . . . . . . . . . . . . . . . . . . . . . . . . . . . . . 610,534 1,068,283
During the year ended December 31, 2019, the Company recognized an impairment charge of$437,596 thousand related to the partial impairment of its investment in Globe SpecialtyMetals, Inc., resulting from a decline in future estimated sales prices and a decrease in theestimated long-term growth rate which caused the Company to revise its expected future cash flowsfrom its North American business operations.
The following are the principal subsidiaries of the Company:
Name Country of incorporation Nature of the business
Grupo FerroAtlantica, S.A.U. . . . . . . . . . . Spain(1) ElectrometallurgyFerroPem, S.A.S. . . . . . . . . . . . . . . . . . . France(2) ElectrometallurgySilicon Smelters (Pty.), Ltd. . . . . . . . . . . . South Africa(3) ElectrometallurgyGlobe Specialty Metals, Inc . . . . . . . . . . . United States of America(4) ElectrometallurgyGlobe Metallurgical, Inc. . . . . . . . . . . . . . United States of America(4) ElectrometallurgyWVA Manufacturing, LLC . . . . . . . . . . . . . United States of America(5) ElectrometallurgyQuebec Silicon LP . . . . . . . . . . . . . . . . . Canada(6) ElectrometallurgyGlobe Metales, S.A. . . . . . . . . . . . . . . . . Argentina(7) ElectrometallurgyFerroglobe Mangan Norge AS . . . . . . . . . Norway(8) ElectrometallurgyFerroglobe Manganese France SAS . . . . . France(9) ElectrometallurgyFerroAtlantica del Cinca, S.L. . . . . . . . . . Spain(1) ElectrometallurgyFerroAtlantica de Boo, S.L.U. . . . . . . . . . Spain(1) ElectrometallurgyFerroAtlantica de Sabon, S.L.U. . . . . . . . . Spain(1) ElectrometallurgyFerrous Receivables DAC . . . . . . . . . . . . Ireland(10) Receivables Securitization
Registered Offices:
1 Pº Castellana, Nº 259-D Planta 49ª, 28046, Madrid, Spain
2 517, Av. de la Boisse., Chambery, France
3 Beyersnek Road Po Box 657, Polokwane, 0700 ZA, South Africa
4 1595 Sparling Road, Waterford OH 45786, United States
5 Route 60 East, Alloy WV 25002, United States
197
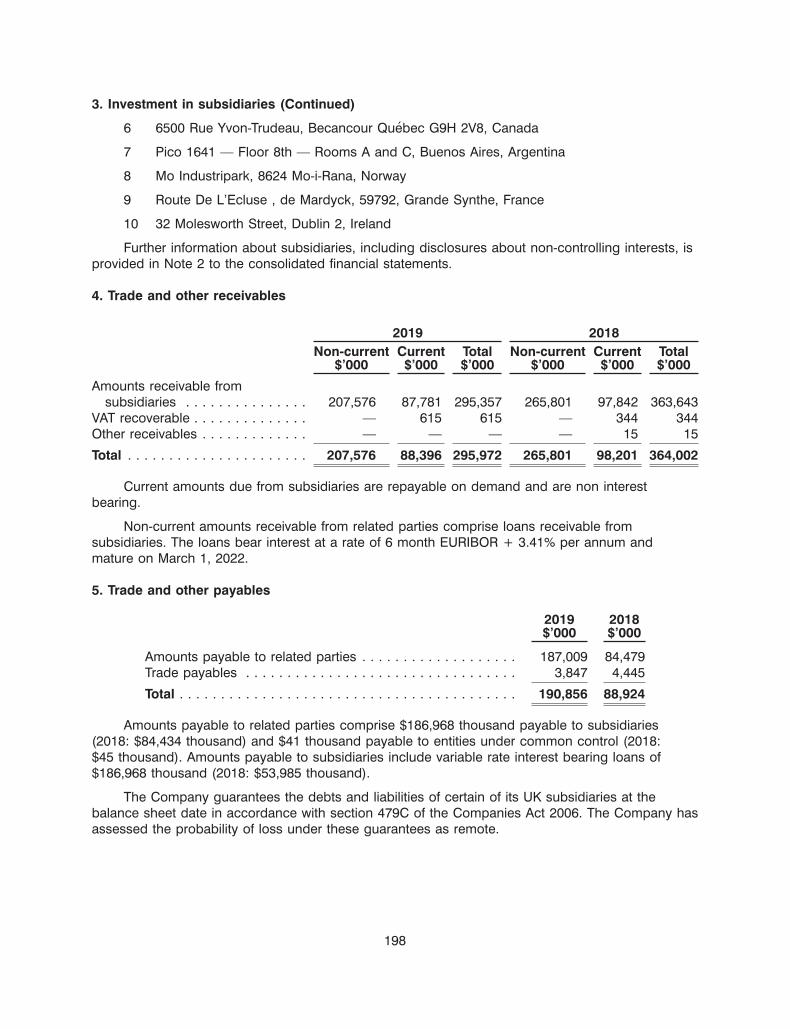
3. Investment in subsidiaries (Continued)
6 6500 Rue Yvon-Trudeau, Becancour Quebec G9H 2V8, Canada
7 Pico 1641 — Floor 8th — Rooms A and C, Buenos Aires, Argentina
8 Mo Industripark, 8624 Mo-i-Rana, Norway
9 Route De L’Ecluse , de Mardyck, 59792, Grande Synthe, France
10 32 Molesworth Street, Dublin 2, Ireland
Further information about subsidiaries, including disclosures about non-controlling interests, isprovided in Note 2 to the consolidated financial statements.
4. Trade and other receivables
2019 2018Non-current Current Total Non-current Current Total
$’000 $’000 $’000 $’000 $’000 $’000
Amounts receivable fromsubsidiaries . . . . . . . . . . . . . . . 207,576 87,781 295,357 265,801 97,842 363,643
VAT recoverable . . . . . . . . . . . . . . — 615 615 — 344 344Other receivables . . . . . . . . . . . . . — — — — 15 15
Total . . . . . . . . . . . . . . . . . . . . . . 207,576 88,396 295,972 265,801 98,201 364,002
Current amounts due from subsidiaries are repayable on demand and are non interestbearing.
Non-current amounts receivable from related parties comprise loans receivable fromsubsidiaries. The loans bear interest at a rate of 6 month EURIBOR + 3.41% per annum andmature on March 1, 2022.
5. Trade and other payables
2019 2018$’000 $’000
Amounts payable to related parties . . . . . . . . . . . . . . . . . . . 187,009 84,479Trade payables . . . . . . . . . . . . . . . . . . . . . . . . . . . . . . . . . 3,847 4,445
Total . . . . . . . . . . . . . . . . . . . . . . . . . . . . . . . . . . . . . . . . . 190,856 88,924
Amounts payable to related parties comprise $186,968 thousand payable to subsidiaries(2018: $84,434 thousand) and $41 thousand payable to entities under common control (2018:$45 thousand). Amounts payable to subsidiaries include variable rate interest bearing loans of$186,968 thousand (2018: $53,985 thousand).
The Company guarantees the debts and liabilities of certain of its UK subsidiaries at thebalance sheet date in accordance with section 479C of the Companies Act 2006. The Company hasassessed the probability of loss under these guarantees as remote.
198

6. Bank borrowings
Credit facilities comprise the following at December 31:
2019 2018$’000 $’000
Secured loans carried at amortised costPrincipal amount . . . . . . . . . . . . . . . . . . . . . . . . . . . . . . . . . . — 135,919Unamortised issuance costs . . . . . . . . . . . . . . . . . . . . . . . . . . — (3,098)Accrued interest . . . . . . . . . . . . . . . . . . . . . . . . . . . . . . . . . . — 493
Total . . . . . . . . . . . . . . . . . . . . . . . . . . . . . . . . . . . . . . . . . . . — 133,314
Amount due for settlement within 12 months . . . . . . . . . . . . . . — 493Amount due for settlement after 12 months . . . . . . . . . . . . . . . — 132,821
Total . . . . . . . . . . . . . . . . . . . . . . . . . . . . . . . . . . . . . . . . . . . — 133,314
On February 27, 2018, Ferroglobe entered into a revolving credit facility that provided forborrowings up to an aggregate principal amount of $250,000 thousand (the ‘‘Revolving CreditFacility’’). The Revolving Credit Facility was amended on February 22, 2019, which included areduction in the size of the facility from $250,000 thousand to $200,000 thousand. The RevolvingCredit Facility was amended further on September 30, 2019, which included a reduction in the sizeof the facility from $200,000 thousand to $150,000 thousand. In addition to loans in US dollars,multicurrency borrowings under the Revolving Credit Facility were available in Euros, Pound Sterlingand any other currency approved by the administrative agent and lenders. Subject to certainexceptions, loans under the Revolving Credit Facility could be borrowed, repaid and reborrowed atany time until the facility’s expiration date in February 27, 2021.
On October 11, 2019, Ferroglobe closed a new $100,000 North-American asset-basedrevolving credit facility (the ‘‘ABL Revolver’’), with Globe Specialty Metals, Inc., and QSIPCanada ULC, each a subsidiary of the Company, as borrowers and PNC Bank, as lender.Ferroglobe PLC was not required to provide a guarantee of this facility. The Revolving Credit Facilitywas repaid using the proceeds from the ABL Revolver and existing cash and cash equivalents ofthe Group.
7. Shareholders’ funds
The change in other reserves is as follows:
Other reservesMerger Share Share-basedreserve premium payment Own shares Total$’000 $’000 $’000 $’000 $’000
Balance at December 31, 2017 . . . . . . . (280,023) 180 2,511 — (277,332)Issue of share capital . . . . . . . . . . . . . . — 240 — — 240Cash settlement of equity awards . . . . . . — — (680) — (680)Share-based compensation . . . . . . . . . . — — 2,798 — 2,798Own shares acquired . . . . . . . . . . . . . . . — — — (11,932) (11,932)
Balance at December 31, 2018 . . . . . . . (280,023) 420 4,629 (11,932) (286,906)Share-based compensation . . . . . . . . . . — — 4,881 — 4,881
Balance at December 31, 2019 . . . . . . . (280,023) 420 9,510 (11,932) (282,025)
199

8. Debt instruments
Debt instruments comprise the following at December 31:
2019 2018$’000 $’000
Unsecured notes carried at amortised costPrincipal amount . . . . . . . . . . . . . . . . . . . . . . . . . . . . . . . . 150,000 150,000Unamortised issuance costs . . . . . . . . . . . . . . . . . . . . . . . . (2,565) (3,575)Accrued coupon interest . . . . . . . . . . . . . . . . . . . . . . . . . . . 4,687 4,687
Total . . . . . . . . . . . . . . . . . . . . . . . . . . . . . . . . . . . . . . . . . 152,122 151,112
Amount due for settlement within 12 months . . . . . . . . . . . . 4,687 4,687Amount due for settlement after 12 months . . . . . . . . . . . . . 147,435 146,425
Total . . . . . . . . . . . . . . . . . . . . . . . . . . . . . . . . . . . . . . . . . 152,122 151,112
On February 15, 2017, Ferroglobe issued $150,000 thousand aggregate principal amount of9.375% Senior Notes due March 1, 2022 (the ‘‘Notes’’). Issuance costs of $5,193 thousand wereincurred. Interest on the Notes is payable semi-annually on March 1 and September 1 of each year,commencing on September 1, 2017.
At any time prior to March 1, 2019, the Company may redeem all or a portion of the Notes ata redemption price based on a ‘‘make-whole’’ premium. At any time on or after March 1, 2019, theCompany may redeem all or a portion of the Notes at redemption prices varying based on theperiod during which the redemption occurs.
The Notes are senior unsecured obligations of the Issuers and are guaranteed on a seniorbasis by certain subsidiaries of Ferroglobe. The Notes are listed on the Irish Global ExchangeMarket. The associated indenture of the Notes contains certain negative covenants. Additionally, ifthe Issuers experience a change of control the indenture requires the Issuers to offer to redeem theNotes at 101% of their principal amount. At December 31, 2019, Grupo VM owned 53.9% of theCompany’s issued and outstanding shares and has pledged them to secure its obligations tocertain banks (2018: 53.9%). The Company would experience a change in control and would berequired to offer redemption of bonds in accordance with the indenture if Grupo VM defaults on theunderlying loan.
The fair value of the Notes, determined by reference to the closing market price on the lasttrading day of the year was $93,908 thousand as at December 31, 2019 (2018: $123,438).
9. Other financial liabilities
Other financial liabilities comprise a derivative financial liability in respect of the Company’scross currency swap, for further details, refer to Notes 19, 27 and 28 in the consolidated financialstatements.
200

10. Property, plant and equipment
The detail of property, plant and equipment, net of the related accumulated depreciation andimpairment in 2019 and 2018 is as follows:
Leased LeasedLand and Plant and AccumulatedBuildings Machinery Depreciation Impairment Total
$’000 $’000 $’000 $’000 $’000
Balance at December 31, 2018 . . . . . . — — — — —Adoption of IFRS 16 . . . . . . . . . . . . . . . 2,046 4 — — 2,050Depreciation charge for the year . . . . . . — — (759) — (759)Impairment . . . . . . . . . . . . . . . . . . . . . . — — — (1,223) (1,223)Exchange differences . . . . . . . . . . . . . . (39) — (32) 5 (66)
Balance at December 31, 2019 . . . . . . 2,007 4 (791) (1,218) 2
On January 1, 2019 the Company adopted IFRS 16 ‘Leases’ resulting in an increase inproperty, plant and equipment of $2,050 thousand and an increase to lease obligations of$2,050 thousand (see Note 11).
During 2019 the Company recognised an impairment of $1,223 thousand in relation to thelease for the London office, which is expected to close.
11. Leases
Lease obligations comprise the following at December 31:
2019 2018$’000 $’000
Operating lease obligations at December 31, 2018 . . . . . . . . . . . . . . . . . . . . . . . . 2,184Minimum lease payments on finance lease liabilities at December 31, 2018 . . . . . . —Gross lease liabilities at January 1, 2019 . . . . . . . . . . . . . . . . . . . . . . . . . . . . . . . 2,184Discounting . . . . . . . . . . . . . . . . . . . . . . . . . . . . . . . . . . . . . . . . . . . . . . . . . . . . 134Lease liabilities at January 1, 2019 . . . . . . . . . . . . . . . . . . . . . . . . . . . . . . . . . . . . 2,050Present value of finance lease liabilities at December 31, 2018 . . . . . . . . . . . . . . . . —
Additional lease liabilities as a result of the initial application of IFRS 16 as atJanuary 1, 2019 . . . . . . . . . . . . . . . . . . . . . . . . . . . . . . . . . . . . . . . . . . . . . . . . 2,050
Balance as at January, 1 . . . . . . . . . . . . . . . . . . . . . . . . . . . . . . . . . . . . . . . . . . — —Adoption of IFRS 16 . . . . . . . . . . . . . . . . . . . . . . . . . . . . . . . . . . . . . . . . . . . . . . 2,050 —Interest . . . . . . . . . . . . . . . . . . . . . . . . . . . . . . . . . . . . . . . . . . . . . . . . . . . . . . . . 80 —Lease payments . . . . . . . . . . . . . . . . . . . . . . . . . . . . . . . . . . . . . . . . . . . . . . . . . (815) —Exchange differences . . . . . . . . . . . . . . . . . . . . . . . . . . . . . . . . . . . . . . . . . . . . . (63) —
Balance as at December, 31 . . . . . . . . . . . . . . . . . . . . . . . . . . . . . . . . . . . . . . . 1,252 —
Analysed as:Current . . . . . . . . . . . . . . . . . . . . . . . . . . . . . . . . . . . . . . . . . . . . . . . . . . . . . . . . 800 —Non-current . . . . . . . . . . . . . . . . . . . . . . . . . . . . . . . . . . . . . . . . . . . . . . . . . . . . 452 —
201

Appendix 1 — Non-IFRS financial metrics (unaudited)
Adjusted EBITDA, Adjusted EBITDA margin, Adjusted Net Profit, Working Capital, Free Cash Flow,Net Debt, Net Debt to total assets and Net Debt to Capital are non-IFRS financial metrics thatFerroglobe utilizes to measure its success. The Company has included these financial metrics toprovide supplemental measures of its performance. We believe these metrics are important becausethey eliminate items that have less bearing on the Company’s current and future operatingperformance and highlight trends in its core business that may not otherwise be apparent whenrelying solely on IFRS financial measures.
Adjusted EBITDA
2019 2018$’000 $’000
(Loss) profit attributable to the parent . . . . . . . . . . . . . . (280,601) 43,661Loss from discontinued operations . . . . . . . . . . . . . . . . . . (84,637) (9,464)Loss attributable to non-controlling interest . . . . . . . . . . . . (5,039) (19,088)Income tax (benefit) expense . . . . . . . . . . . . . . . . . . . . . . (41,541) 20,459Net finance expense . . . . . . . . . . . . . . . . . . . . . . . . . . . . 61,845 52,208Financial derivatives gain . . . . . . . . . . . . . . . . . . . . . . . . . (2,729) (2,838)Exchange differences . . . . . . . . . . . . . . . . . . . . . . . . . . . . (2,884) 14,136Depreciation and amortization charges, operating
allowances and write-downs . . . . . . . . . . . . . . . . . . . . . 120,194 113,837
EBITDA . . . . . . . . . . . . . . . . . . . . . . . . . . . . . . . . . . . . . (235,392) 212,911Impairment loss . . . . . . . . . . . . . . . . . . . . . . . . . . . . . . . . 174,464 65,300Revaluation of biological assets . . . . . . . . . . . . . . . . . . . . 530 7,615Contract termination costs . . . . . . . . . . . . . . . . . . . . . . . . 9,260 —Restructuring and termination costs . . . . . . . . . . . . . . . . . 5,894 —Energy: France . . . . . . . . . . . . . . . . . . . . . . . . . . . . . . . . 9,682 —Energy: South Africa . . . . . . . . . . . . . . . . . . . . . . . . . . . . 3,645 —Staff costs: South Africa . . . . . . . . . . . . . . . . . . . . . . . . . . 327 —Other idling costs . . . . . . . . . . . . . . . . . . . . . . . . . . . . . . 1,532 —Gain on sale of hydro plant assets . . . . . . . . . . . . . . . . . . 822 (11,747)Bargain purchase gain . . . . . . . . . . . . . . . . . . . . . . . . . . . — (40,142)Share-based compensation . . . . . . . . . . . . . . . . . . . . . . . — (3,886)
Adjusted EBITDA . . . . . . . . . . . . . . . . . . . . . . . . . . . . . . (29,236) 230,051
Adjusted EBITDA Margin
2019 2018$’000 $’000
Adjusted EBITDA . . . . . . . . . . . . . . . . . . . . . . . . . . . . (29,236) 230,051Sales . . . . . . . . . . . . . . . . . . . . . . . . . . . . . . . . . . . . . 1,615,222 2,242,002
Adjusted EBITDA Margin . . . . . . . . . . . . . . . . . . . . . . (1.8)% 10.3%
202

Appendix 1 — Non-IFRS financial metrics (unaudited) (Continued)
Adjusted Net Profit
2019 2018$’000 $’000
(Loss) profit attributable to the parent . . . . . . . . . . . . . . (280,601) 43,661Tax rate adjustment . . . . . . . . . . . . . . . . . . . . . . . . . . . . . 90,241(1) 9,077Impairment loss . . . . . . . . . . . . . . . . . . . . . . . . . . . . . . . . 118,636(2) 44,404Revaluation of biological assets . . . . . . . . . . . . . . . . . . . . 360 5,178Contract termination costs . . . . . . . . . . . . . . . . . . . . . . . . 6,297 —Restructuring and termination costs . . . . . . . . . . . . . . . . . 4,008 —Energy: France . . . . . . . . . . . . . . . . . . . . . . . . . . . . . . . . 6,584 —Energy: South Africa . . . . . . . . . . . . . . . . . . . . . . . . . . . . 2,479 —Staff costs: South Africa . . . . . . . . . . . . . . . . . . . . . . . . . . 222 —Other idling costs . . . . . . . . . . . . . . . . . . . . . . . . . . . . . . 1,042 —Bargain purchase gain . . . . . . . . . . . . . . . . . . . . . . . . . . . — (27,297)Share-based compensation . . . . . . . . . . . . . . . . . . . . . . . — (2,642)Gain on sale of hydro plant assets . . . . . . . . . . . . . . . . . . (55,079)(3) (7,988)
Adjusted (loss)/profit attributable to the parent . . . . . . . (105,811) 64,393
Working Capital
2019 2018$’000 $’000
Inventories . . . . . . . . . . . . . . . . . . . . . . . . . . . . . . . . . . . . 354,121 456,970Trade and other receivables . . . . . . . . . . . . . . . . . . . . . . . 309,064 155,996Trade and other payables . . . . . . . . . . . . . . . . . . . . . . . . . (189,229) (256,823)
Working Capital . . . . . . . . . . . . . . . . . . . . . . . . . . . . . . . . 473,956 356,143
Free Cash Flow
2019 2018$’000 $’000
Net cash provided by operating activities . . . . . . . . . . . . . . (31,194) 73,777Payments for property, plant and equipment . . . . . . . . . . . . (32,445) (106,136)
Free Cash Flow . . . . . . . . . . . . . . . . . . . . . . . . . . . . . . . . . (63,639) (32,359)
(1) Loss before tax ($411,818 thousand) multiplied by the group effective tax rate (adjusted for discontinuedoperations) of 32%, minus income tax benefit ($41,541 thousand).
(2) Impairment of goodwill ($174,008, note 25.5) plus allowance for doubtful debts on financial assets($457 thousand), less tax of 32%.
(3) Gain on disposal of FerroAtlantica, S.A.U ($81,820), less loss on disposal of Ultracore Polska ZOO($821 thousand, note 25.6), less tax of 32%.
203

Appendix 1 — Non-IFRS financial metrics (unaudited) (Continued)
Net Debt
2019 2018$’000 $’000
Bank borrowings . . . . . . . . . . . . . . . . . . . . . . . . . . . . . . . 158,999 141,012Debt instruments . . . . . . . . . . . . . . . . . . . . . . . . . . . . . . . 354,951 352,594Lease obligations . . . . . . . . . . . . . . . . . . . . . . . . . . . . . . . 25,872 66,471Other financial liabilities . . . . . . . . . . . . . . . . . . . . . . . . . . . 66,539 85,312Cash and cash equivalents . . . . . . . . . . . . . . . . . . . . . . . . (94,852) (216,647)Non-current restricted cash and cash equivalents . . . . . . . . (28,323) —
Net Debt . . . . . . . . . . . . . . . . . . . . . . . . . . . . . . . . . . . . . 483,186 428,742
Capital
2019 2018$’000 $’000
Net Debt . . . . . . . . . . . . . . . . . . . . . . . . . . . . . . . . . . . 483,186 428,742Equity . . . . . . . . . . . . . . . . . . . . . . . . . . . . . . . . . . . . . 602,297 884,372
Capital . . . . . . . . . . . . . . . . . . . . . . . . . . . . . . . . . . . . . 1,085,483 1,313,114
204