Embed Size (px)
Citation preview
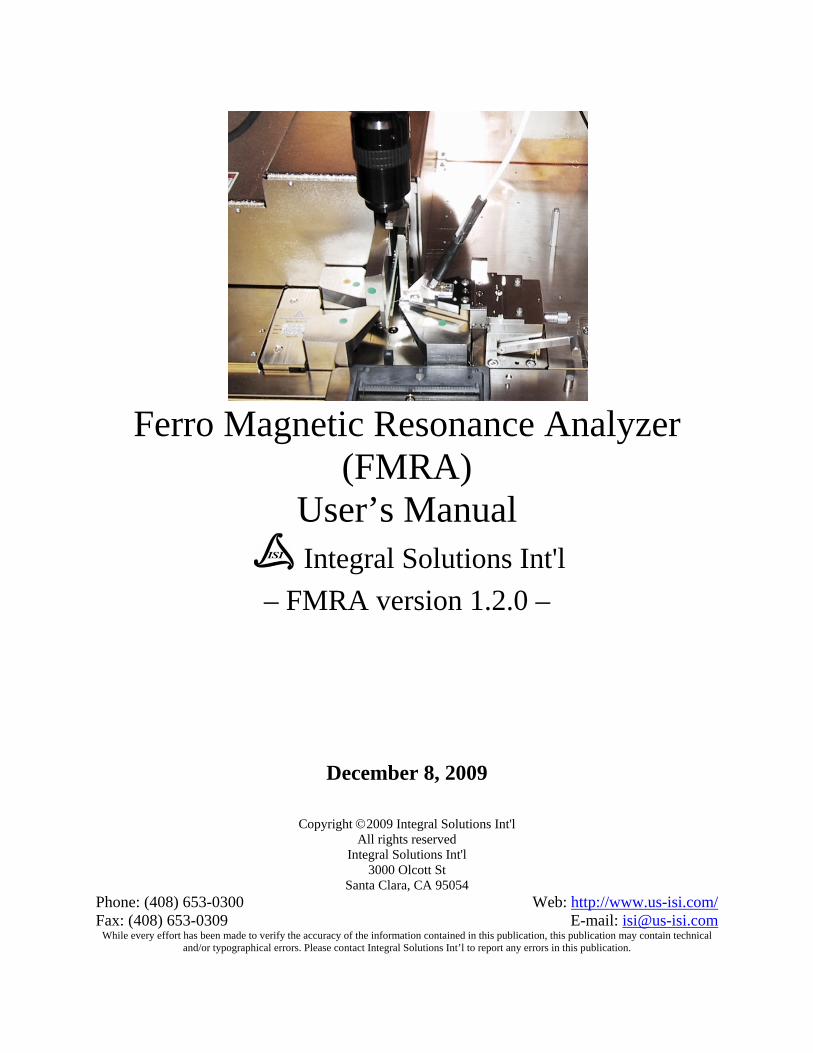
Ferro Magnetic Resonance Analyzer (FMRA)
User’s Manual Integral Solutions Int'l
– FMRA version 1.2.0 –
December 8, 2009
Copyright ©2009 Integral Solutions Int'l All rights reserved
Integral Solutions Int'l 3000 Olcott St
Santa Clara, CA 95054 Phone: (408) 653-0300 Web: http://www.us-isi.com/ Fax: (408) 653-0309 E-mail: [email protected]
While every effort has been made to verify the accuracy of the information contained in this publication, this publication may contain technical and/or typographical errors. Please contact Integral Solutions Int’l to report any errors in this publication.
FMRA User’s Manual Integral Solutions Int’l December 8, 2009
Page 2
Contents 1 INTRODUCTION ....................................................................................................................................... 5
1.1 RELATED DOCUMENTATION ................................................................................................................... 6
2 INSTALLATION ......................................................................................................................................... 7
2.1 REQUIREMENTS ...................................................................................................................................... 7 2.2 ARRIVAL CHECKLIST .............................................................................................................................. 9 2.3 CONNECTIONS ........................................................................................................................................ 9 2.4 RUNNING FOR THE 1ST TIME .................................................................................................................. 13
3 TESTER BASICS ...................................................................................................................................... 14
3.1 STARTING SOFTWARE ........................................................................................................................... 16 3.2 LOADING BARS AND SELECTING SLIDERS ............................................................................................ 17 3.3 RUNNING TESTS ................................................................................................................................... 19 3.4 FMRA TESTS ....................................................................................................................................... 20 3.5 FMR RESULT DEFINITION .................................................................................................................... 22 3.6 FMR RUNTIME LICENSE ....................................................................................................................... 23 3.7 HF PROBE CARD .................................................................................................................................. 24
4 FMRS – FERRO-MAGNETIC RESONANCE SPECTRUM ............................................................... 26
4.1 SETUP PARAMETERS ............................................................................................................................. 27 4.2 RESULTS ............................................................................................................................................... 27 4.3 EXAMPLE PRINTOUT ............................................................................................................................. 28
5 SFT – STIFFNESS FIELD TEST ............................................................................................................ 29
5.1 SETUP PARAMETERS ............................................................................................................................. 30 5.2 RESULTS ............................................................................................................................................... 31 5.3 EXAMPLE PRINTOUT ............................................................................................................................. 32
6 RPLT – REFERENCE-PINNING LAYER TEST.................................................................................. 33
6.1 SETUP PARAMETERS ............................................................................................................................. 33 6.2 RESULTS ............................................................................................................................................... 34 6.3 EXAMPLE PRINTOUT ............................................................................................................................. 35
7 RPLT2 – REFERENCE-PINNING LAYER TEST 2 ............................................................................. 36
7.1 SETUP PARAMETERS ............................................................................................................................. 36 7.2 RESULTS ............................................................................................................................................... 37 7.3 EXAMPLE PRINTOUT ............................................................................................................................. 37
8 CDM – CRITICAL DIMENSION MEASUREMENT ........................................................................... 39
8.1 SETUP PARAMETERS ............................................................................................................................. 39 8.2 RESULTS ............................................................................................................................................... 40 8.3 EXAMPLE PRINTOUT ............................................................................................................................. 41
9 FMR SWEEP TEST .................................................................................................................................. 42
9.1 SETUP PARAMETERS ............................................................................................................................. 43 9.2 RESULTS ............................................................................................................................................... 44 9.3 EXAMPLE PRINTOUT ............................................................................................................................. 45
10 RPLT STABILITY .................................................................................................................................... 47
10.1 SETUP PARAMETERS ............................................................................................................................. 47 10.2 RESULTS ............................................................................................................................................... 48 10.3 EXAMPLE PRINTOUT ............................................................................................................................. 49
FMRA User’s Manual Integral Solutions Int’l December 8, 2009
Page 3
11 FMR TRANSFER ...................................................................................................................................... 51
11.1 SETUP PARAMETERS ............................................................................................................................. 51 11.2 RESULTS ............................................................................................................................................... 52 11.3 EXAMPLE PRINTOUT ............................................................................................................................. 53
12 CALIBRATION ......................................................................................................................................... 55
12.1 FMR CALIBRATION FILES .................................................................................................................... 55 12.2 PREAMP FREQUENCY RESPONSE .......................................................................................................... 57 12.3 SCOPE POINT FREQUENCY RESPONSE ................................................................................................... 58 12.4 MAGNET ............................................................................................................................................... 58
13 TOOLS ....................................................................................................................................................... 59
13.1 USING EXTERNAL SPECTRUM ANALYZER ............................................................................................ 59 13.2 ISI2010 DIAGNOSTICS .......................................................................................................................... 59 13.3 HALL EFFECT PROBE CARD .................................................................................................................. 61 13.4 QUAD-POLE MAGNET CALIBRATION ADAPTOR ................................................................................... 62
14 TESTER RECONFIGURATION ............................................................................................................ 64
16 TROUBLESHOOTING ............................................................................................................................ 65
16.1 FAQ ..................................................................................................................................................... 65
17 LIMITED WARRANTY ........................................................................................................................... 66
FMRA User’s Manual Integral Solutions Int’l December 8, 2009
Page 4
Figures FIGURE 1-1 – COMPLETE SYSTEM ............................................................................................................................................... 5 FIGURE 3-1 – FMRA CONFIGURATION ..................................................................................................................................... 14 FIGURE 3-2 – FMRA PERIPHERALS .......................................................................................................................................... 15 FIGURE 3-3 – FMRA EMI ENCLOSURE .................................................................................................................................... 15 FIGURE 3-4 – SYSTEM MENU SELECTION .................................................................................................................................. 16 FIGURE 3-5 – ADD-INS SELECTED MODULES ....................................................................................................................... 16 FIGURE 3-6 – OPERATOR LOGIN ............................................................................................................................................... 17 FIGURE 3-7 – BARCONT OPERATOR MENU ............................................................................................................................... 17 FIGURE 3-8 – INSTALLING AN HGA .......................................................................................................................................... 17 FIGURE 3-9 – RUNNING MULTIPLE BARS .................................................................................................................................. 18 FIGURE 3-10 – RUNNING THE TESTS ......................................................................................................................................... 19 FIGURE 3-11 – ADD-INS ........................................................................................................................................................... 20 FIGURE 3-12 – FMRA TEST SETTINGS ..................................................................................................................................... 20 FIGURE 3-13 – FMRA CUSTOM STRESS ................................................................................................................................... 21 FIGURE 3-14 – FMR RESULT DEFINITION ................................................................................................................................. 22 FIGURE 3-15 – FMRAPPS RUNTIME LICENSE ........................................................................................................................... 23 FIGURE 3-16 – FMRA SERIAL NUMBER ................................................................................................................................... 23 FIGURE 3-17 – FMRA EVALUATION......................................................................................................................................... 23 FIGURE 3-18 – HIGH FREQUENCY PROBE CARD BASE ................................................................................................................ 24 FIGURE 3-19 – HIGH FREQUENCY PROBE CARD ........................................................................................................................ 24 FIGURE 4-1 – FMRS SETUP ...................................................................................................................................................... 26 FIGURE 4-2 – FMRS TEST EXAMPLE 1 ..................................................................................................................................... 28 FIGURE 4-3 – FMRS TEST EXAMPLE 2 (MULTIPLE RUNS) ........................................................................................................ 28 FIGURE 5-1 – SFT TEST ........................................................................................................................................................... 29 FIGURE 5-2 – SFT TEST EXAMPLE 1 ......................................................................................................................................... 32 FIGURE 5-3 – SFT TEST PEAK FREQUENCY EXAMPLE 2 ............................................................................................................ 32 FIGURE 6-1 – RPLT TEST ......................................................................................................................................................... 33 FIGURE 6-2 – RPLT EXAMPLE 1 ............................................................................................................................................... 35 FIGURE 6-3 – RPLT EXAMPLE 2 (SEVERAL RUNS) ..................................................................................................................... 35 FIGURE 7-1 – RPLT TEST ......................................................................................................................................................... 36 FIGURE 7-2 – RPLT2 EXAMPLE ............................................................................................................................................... 37 FIGURE 7-3 – RPLT 2 EXAMPLE 2 ............................................................................................................................................ 38 FIGURE 7-4 – RPLT 2 EXAMPLE (FREQUENCY VS FIELD) .......................................................................................................... 38 FIGURE 8-1 – CDM TEST ......................................................................................................................................................... 39 FIGURE 8-2 – CDM EXAMPLE PRINTOUT .................................................................................................................................. 41 FIGURE 9-1 – FMR SWEEP TEST ............................................................................................................................................... 42 FIGURE 9-2 – FMR SWEEP EXAMPLE PRINTOUT ....................................................................................................................... 45 FIGURE 9-3 – FMR SWEEP NOISE SPECTRUM BROWSING .......................................................................................................... 45 FIGURE 9-4 – FMR SWEEP PLOT FREQUENCY OPTION .............................................................................................................. 46 FIGURE 9-5 – FMR SWEEP MULTIPLE NOISE SPECTRUM SHOWN .............................................................................................. 46 FIGURE 10-1 – RPLT STABILITY TEST ...................................................................................................................................... 47 FIGURE 10-2 – RPLT STABILITY EXAMPLE PRINTOUT .............................................................................................................. 49 FIGURE 10-3 – RPLT STABILITY PLOT AMPLITUDE OPTION ..................................................................................................... 49 FIGURE 10-4 – RPLT STABILITY BROWSING NOISE SPECTRUM ................................................................................................. 50 FIGURE 11-1 – FMR TRANSFER TEST ....................................................................................................................................... 51 FIGURE 11-2 – FMR TRANSFER EXAMPLE PRINTOUT ............................................................................................................... 53 FIGURE 11-3 – FMR TRANSFER ................................................................................................................................................ 53 FIGURE 11-4 – FMR TRANSFER NOISE SPECTRUM BROWSING .................................................................................................. 54 FIGURE 12-1 – FMRCALIBRATION47XXX.CSV FILE ............................................................................................................... 55 FIGURE 12-2 – PREAMPLIFIER FREQUENCY RESPONSE FILE....................................................................................................... 57 FIGURE 12-3 – FREQ RESPONSE CALIBRATION .......................................................................................................................... 57 FIGURE 12-4 – EXTERNAL SPECTRUM ANALYZER MODE .......................................................................................................... 58 FIGURE 13-1 – EXTERNAL SPECTRUM ANALYZER MODE .......................................................................................................... 59 FIGURE 13-1 – ISI2010 DIAGNOSTICS MENU ............................................................................................................................ 60 FIGURE 13-2 – HALL-EFFECT PROBE CARD .............................................................................................................................. 61 FIGURE 13-3 – BAR QUAD-POLE MAGNET CALIBRATION ADAPTOR .......................................................................................... 62 FIGURE 13-4 – GAUSSMETER PROBE ......................................................................................................................................... 63
FMRA User’s Manual Integral Solutions Int’l December 8, 2009
Page 5
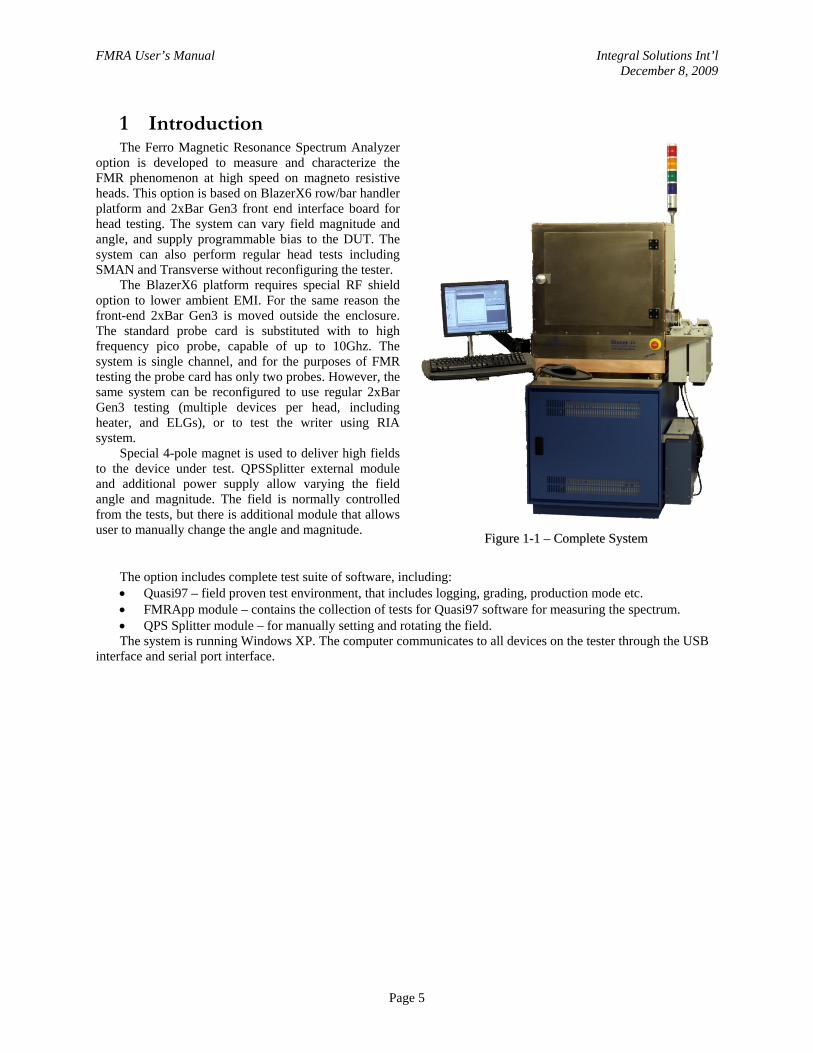
1 Introduction The Ferro Magnetic Resonance Spectrum Analyzer
option is developed to measure and characterize the FMR phenomenon at high speed on magneto resistive heads. This option is based on BlazerX6 row/bar handler platform and 2xBar Gen3 front end interface board for head testing. The system can vary field magnitude and angle, and supply programmable bias to the DUT. The system can also perform regular head tests including SMAN and Transverse without reconfiguring the tester.
The BlazerX6 platform requires special RF shield option to lower ambient EMI. For the same reason the front-end 2xBar Gen3 is moved outside the enclosure. The standard probe card is substituted with to high frequency pico probe, capable of up to 10Ghz. The system is single channel, and for the purposes of FMR testing the probe card has only two probes. However, the same system can be reconfigured to use regular 2xBar Gen3 testing (multiple devices per head, including heater, and ELGs), or to test the writer using RIA system.
Special 4-pole magnet is used to deliver high fields to the device under test. QPSSplitter external module and additional power supply allow varying the field angle and magnitude. The field is normally controlled from the tests, but there is additional module that allows user to manually change the angle and magnitude.
FFiigguurree 11--11 –– CCoommpplleettee SSyysstteemm
The option includes complete test suite of software, including: • Quasi97 – field proven test environment, that includes logging, grading, production mode etc. • FMRApp module – contains the collection of tests for Quasi97 software for measuring the spectrum. • QPS Splitter module – for manually setting and rotating the field. The system is running Windows XP. The computer communicates to all devices on the tester through the USB
interface and serial port interface.
FMRA User’s Manual Integral Solutions Int’l December 8, 2009
Page 6
1.1 Related Documentation This manual concentrates on the FMRA option, and the tests it introduces. It can be used as a reference to look
up the test algorithms, meaning of test parameters and test results. In addition to this, the following literature is recommended:
Quasi97 Software User’s Manual
Contains detailed description of all menus in Quasi97 software, along with procedures on how to set up test parameters, log data, and run the QST in production and engineering modes.
QST External Modules User’s Manual
Description of additional tests provided with the QST and Quasi97 software.
BlazerX5 Users Manual Complete reference of the row/bar handler part of the system. Configuring BlazerX6 Options
BlazerX6 User’s Manual Supplement on how to reconfigure the tester for using different options.
FMRA User’s Manual Integral Solutions Int’l December 8, 2009
Page 7
2 Installation
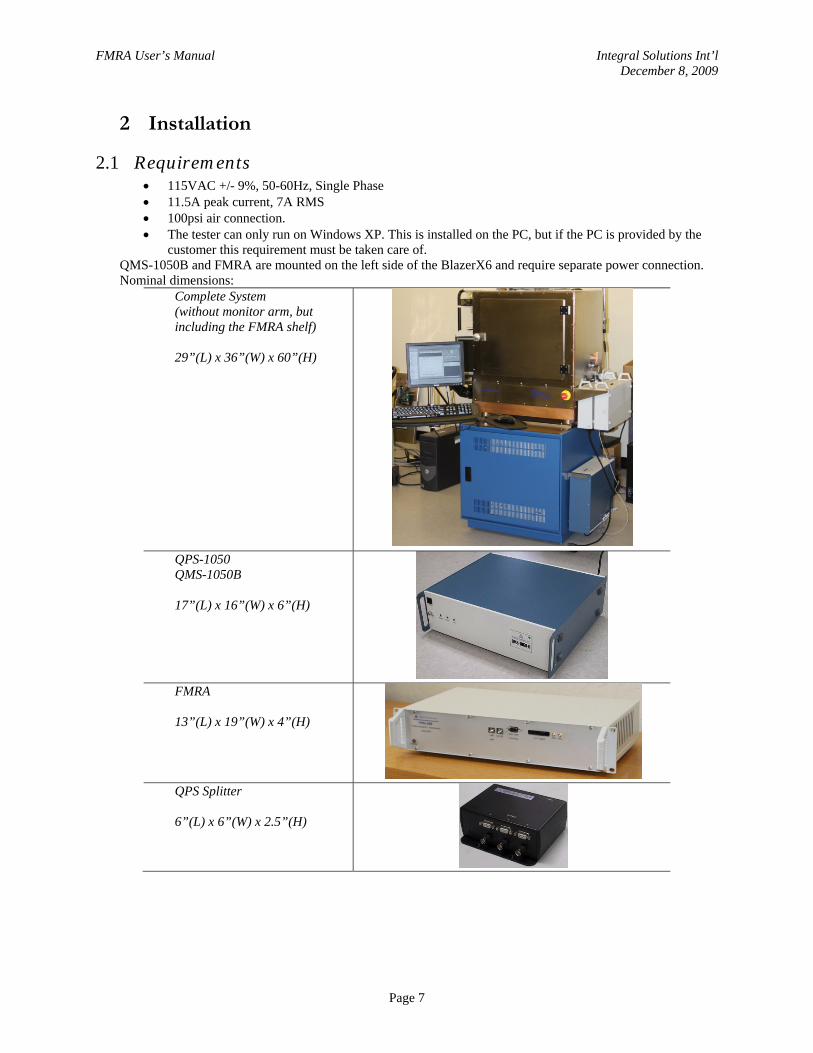
2.1 Requirements • 115VAC +/- 9%, 50-60Hz, Single Phase • 11.5A peak current, 7A RMS • 100psi air connection. • The tester can only run on Windows XP. This is installed on the PC, but if the PC is provided by the
customer this requirement must be taken care of. QMS-1050B and FMRA are mounted on the left side of the BlazerX6 and require separate power connection. Nominal dimensions:
Complete System (without monitor arm, but including the FMRA shelf) 29”(L) x 36”(W) x 60”(H)
QPS-1050 QMS-1050B 17”(L) x 16”(W) x 6”(H)
FMRA 13”(L) x 19”(W) x 4”(H)
QPS Splitter 6”(L) x 6”(W) x 2.5”(H)
FMRA User’s Manual Integral Solutions Int’l December 8, 2009
Page 8
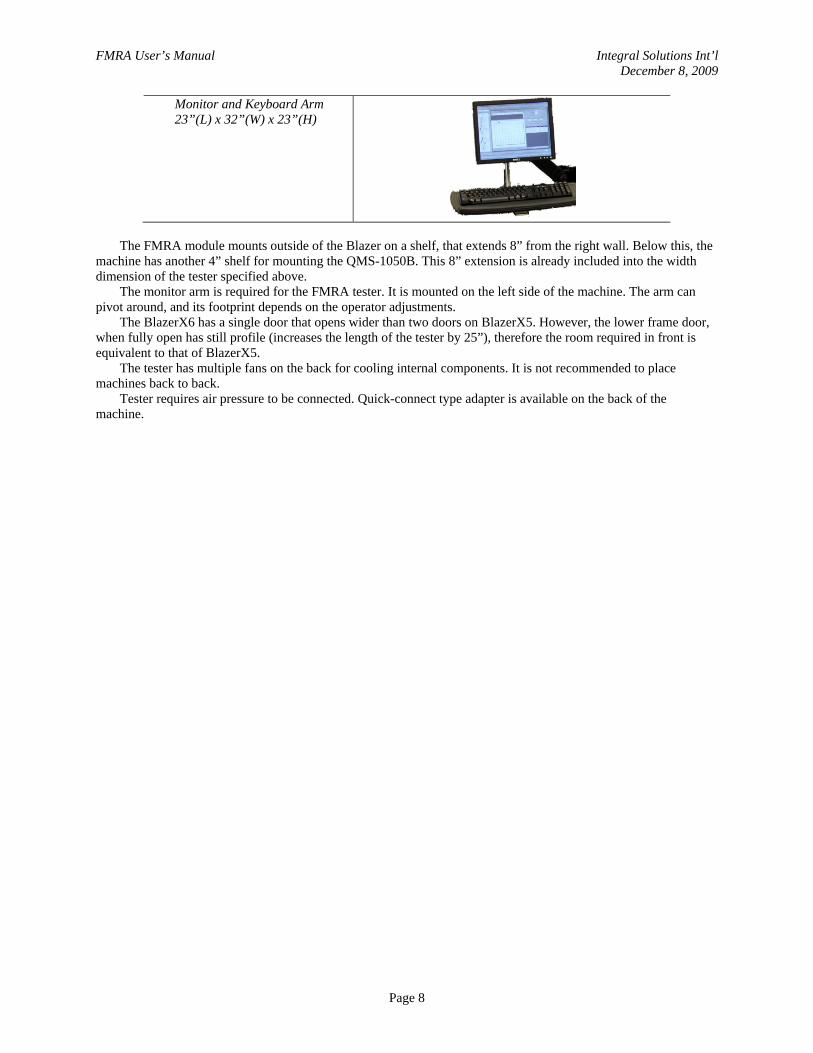
Monitor and Keyboard Arm 23”(L) x 32”(W) x 23”(H)
The FMRA module mounts outside of the Blazer on a shelf, that extends 8” from the right wall. Below this, the
machine has another 4” shelf for mounting the QMS-1050B. This 8” extension is already included into the width dimension of the tester specified above.
The monitor arm is required for the FMRA tester. It is mounted on the left side of the machine. The arm can pivot around, and its footprint depends on the operator adjustments.
The BlazerX6 has a single door that opens wider than two doors on BlazerX5. However, the lower frame door, when fully open has still profile (increases the length of the tester by 25”), therefore the room required in front is equivalent to that of BlazerX5.
The tester has multiple fans on the back for cooling internal components. It is not recommended to place machines back to back.
Tester requires air pressure to be connected. Quick-connect type adapter is available on the back of the machine.
FMRA User’s Manual Integral Solutions Int’l December 8, 2009
Page 9
2.2 Arrival Checklist The following list includes items required for FMRA that may be shipped separately or not mounted to the
tester: 1) FMR Analyzer Module
a. FMR Amplifier b. USB Cord c. AC Power Cord d. RDX and RDY AC cables (FMR 2xBar G3 Interface) e. ISI PN 31622 (FMR 2xBar G3 Interface) f. ISI #31626 FMR Amp (on the box) Blazer side panel g. ISI #31623 FMR Amp Control (on the box) Blazer side panel h. ISI #31624 flat ribbon cable from FMR connector board 114790 FMR Amp i. ISI #31625 coax cable from FMR connector board 114790 FMR Amp j. ISI #31627 FMR Amp Picoprobe
2) BlazerX6 main power cord 3) BlazerX6 air pressure quick-connect adapter 4) QMS-1050B power cord
2.3 Connections Only ISI-supplied cables should be used with FMR system. These are high-quality with corresponding
ISI part numbers for spare reorders, if necessary. Performance is not guaranteed with non-ISI-supplied cables.
The following connections are for the tester part only. Refer to BlazerX5/X6 users manual for row/bar handler connections.
QST-2002
USB To computer (digital IO) 14-pin round To QPS-1050 (DC power for QST-2002) BNC (Field 1) To QPS Splitter Input BNC (field output control) DB9 To QPS Splitter Input DB9 (QPS communication) SMB To RD OUT on universal interface board SMB To WD IN on universal interface board
QPS-1050
3pin AC Power To 115VAC outlet 14-pin round To QST-2002 (DC power for QST-2002) 9-pin round To quad-pole magnet 2-pin Female connector for Transverse coils BNC To QPS Splitter Output BNC X (field output control) DB9 To QPS Splitter Output DB9 X (QPS communication)
FMRA User’s Manual Integral Solutions Int’l December 8, 2009
Page 10
QMS-1050B
3pin AC Power To 115VAC outlet 9-pin round To quad-pole magnet 2-pin Male connector for Longitudinal coils BNC To QPS Splitter Output BNC Y (field output control) DB9 To QPS Splitter Output DB9 Y (QPS communication)
QPS Splitter
USB To computer (digital IO) DC Power Inlet No Connect Input BNC To QST-2002 Field 1 output Input DB9 To QST-2002 DB9 Output BNC X To QPS-1050 BNC Output DB9 X To QPS-1050 DB9 Output BNC Y To QMS-1050B BNC Output DB9 Y To QMS-1050B DB9 Output BNC Z No Connect Output DB9 Z No Connect
Quad-pole Magnet
2-pin Female To QPS-1050 9-pin round connector 2-pin Male To QMS-1050B 9-pin round connector
2xBar Gen3 Interface Board / Universal Interface
60pin ribbon To QST-2002E 2x SMB To QST-2002E (RD OUT and WD IN connection) 2x SMB From universal board to 2xBar G3 board 50pin ribbon From universal board to 2xBar G3 board
FMRA User’s Manual Integral Solutions Int’l December 8, 2009
Page 11
40pin ribbon ISI PN 31622
RDX and RDY - From 2xBar G3 to FMRA module
2x Black SMB RDX and RDY - From 2xBar G3 to FMRA module FMR Analyzer Module
3Pin AC Power To AC outlet USB To Computer (digital IO) 40pin Ribbon To 2xBar Gen3 FMR Coax ISI #31626
To the SMA type connector outside the BlazerX6 (right side of the blazer)
DB-9 ISI #31623
To the DB-9 connector outside of BlazerX6 (right side of the machine)
BlazerX6 Enclosure (external)
DB-9 ISI #31623
To the DB-9 connector on FMRA module
FMR Coax ISI #31626
To the input labeled “FMR” on the FMRA module.
BlazerX6 Enclosure (internal)
10pin ribbon ISI #31624
To the rear of FMR preamplifier
Coax ISI #31625
To the rear of FMR preamplifier
FMR Preamplifier Module
10pin Ribbon ISI #31624
To the adapter board mounted inside the BlazerX6 (right side panel of the machine)
Back SMA ISI #31625
To the right side panel of the BlazerX6 (internal)
Front SMA ISI #31627
To pico probe.

FMRA User’s Manual Integral Solutions Int’l December 8, 2009
Page 12
Probe Card
Coax ISI #31627
To FMR preamplifier
FMRA User’s Manual Integral Solutions Int’l December 8, 2009
Page 13
2.4 Running for the 1st Time 1) Turn ON the PC, monitor. 2) Check that the operating system boots up with no problems. 3) Turn ON the QPS-1050, ensure that the Power LED is ON. 4) Turn ON the QMS-1050B, ensure that the Power LED is ON. 5) Turn ON the QST-2002, ensure that the LED on the front panel is ON. 6) Turn ON the FMRA module. Ensure that the LED on the front panel is ON. 7) Check the LED in the back of the QPS Splitter box (next to USB port) is on. 8) Start Quasi97, select a setup file. 9) In the system menu select 2xBar Gen3. 10) In the Add-Ins Available Modules, add item “FMRApp.Application”. * 11) In the Add-Ins Selected Modules, add a new item and selection “FMRApp.Application”. Close the
dialog box. At this point the software should detect FMRA module and the QPS Splitter option. 12) In the System menu, change the maximum field to 3500 Oe.
The FMRA system operates is single channel mode. In Barcont Tester Options, ensure that CH1 is enabled and CH0 is disabled.
13) Do the probe card alignment procedure, as the probe card may have been moved for shipping. 14) Load a bar, click “Start” in Quasi97 and move to one of the sliders. 15) Run Transfer Curve Test. Check the Active LED on the QPS-1050 – it should turn on for a short time
and then go off before the test is over. Check amplitude and resistance reading. 16) Add an instance of FMRS test and run it. This will check the that the hardware is operating properly.
The outcome of the test will depend on the head connected, so at this step it only matters if there are any errors.
17) Set the angle in FMRS test to 90 degrees and field to 500 Oe, run the test again and ensure that the active LED on the QMS-1050 turns on for a short time and turns off.
18) Run SMAN test; check that the average noise amplitude is higher than 30uV. The actual noise level will be higher and will depend on the head. If the noise is lower, then some connection is missing.
Once this checklist is complete the tester is operational and is ready for use. If there are any problem, review the
connections or contact ISI support. * Note that when FMRApp.Application is enabled, the software switches to 2pt measurement mode, and
bypasses slider UP/Down detection. This has the following visible side effects, which may look like a problem with hardware, but in fact are expected:
1) if normal probe card is installed (instead of high frequency pico probe) then enabled FMRApp.Application will force resistance and amplitude measurement in all tests on the reader to be in 2pt mode. All resistance measurements will be slightly off (higher than in 4pt mode).
2) Reader contact resistance becomes 0ohm. 3) If normal probe card is installed and FMRApp.Application is turned on, writer resistance test will
not work, because without knowing UP/DOWN selection the software would not know which preamp to turn on.
4) If hall-effect probe card will not work, because by design it is a 4pt device.
FMRA User’s Manual Integral Solutions Int’l December 8, 2009
Page 14
3 Tester Basics In order to turn on the FMR system, all of its components must be powered on, including FMR Analyzer, QMS-
1050B, QPS-1050, QST-2002. All of those and the QPS Splitter modules have an LED indicating of whether the power is on.
The tester consists of three functional components. The first, QST-2002, is test electronics module, that is responsible for supplying reader bias current, measuring reader resistance, amplitude, noise characteristics and so on. The QST-2002 needs QPS-1050 to work and the transverse field magnet. The magnet can be connected directly to the QPS-1050 or through the QPS Splitter box. The system also uses 2xBar Gen3 for standard reader measurement, so System Tester Configuration must be set to 2xBAR G3.
The second component is the FMR analyzer, which is responsible for measuring noise in the 0.2-10Ghz spectrum. The FMR component substitutes intermediate reader board assembly, that is normally present on 2xBar Gen3 type systems. So 2xBar Gen3 connects to the FMR analyzer, and the FMR analyzer connects to the preamplifier, which in turn connects to the pico probe and the head. There is a separate software module that controls FMRA, available as “FMR - <serial number>” in Add-Ins Peripherals. This menu option is added when FMRApp.Application is enabled in Add-Ins Selected Modules.
The third component is the quad-pole magnet, which includes the second power supply and the QPS Splitter module. The QPS Splitter is responsible for setting the field angle, but it can also set fixed (static) fields. The QPS Splitter module is controlled by QPSSplitter.exe application. This application is automatically loaded with FMRApp test suite.
The main software module to run the tester is Quasi97.EXE. In order to enable FMR capability, user must add “FMRApp.Application” to the Add-Ins Selected Modules. This adds a suite of spectrum related to the setup file, as well as the field angle. Adding “FMRApp.Application” is required for every new setup file. Adding FMRApp to selected modules is always required for configuration where 2xBar Gen3 is connected to the probe card through the FMRA module.
FFiigguurree 33--11 –– FFMMRRAA CCoonnffiigguurraattiioonn
The BlazerX6 system is a row/bar handler. To run parts, user needs to select Bar Level configuration in the Quasi97 Setup selection dialog box which will load Barcont application and connect it Quasi97. Barcont application is completely responsible for loading and unloading the parts, moving to different heads and reading serial numbers. Since the FMR system is single channel, user needs to disable CH0 in Barcont. To access Barcont, click File Device Setup from Quasi97.
Add-Ins Peripherals gives you access to FMR controller and QPS Splitter application menus. These menus are primarily for diagnostics, but can be used to manually set field vector, switch output on FMRA to external spectrum analyzer and so on. There is also another item, called FMRA Settings – this is where user can change the options that apply to all FMR tests, such as filtering selection for peak detect.
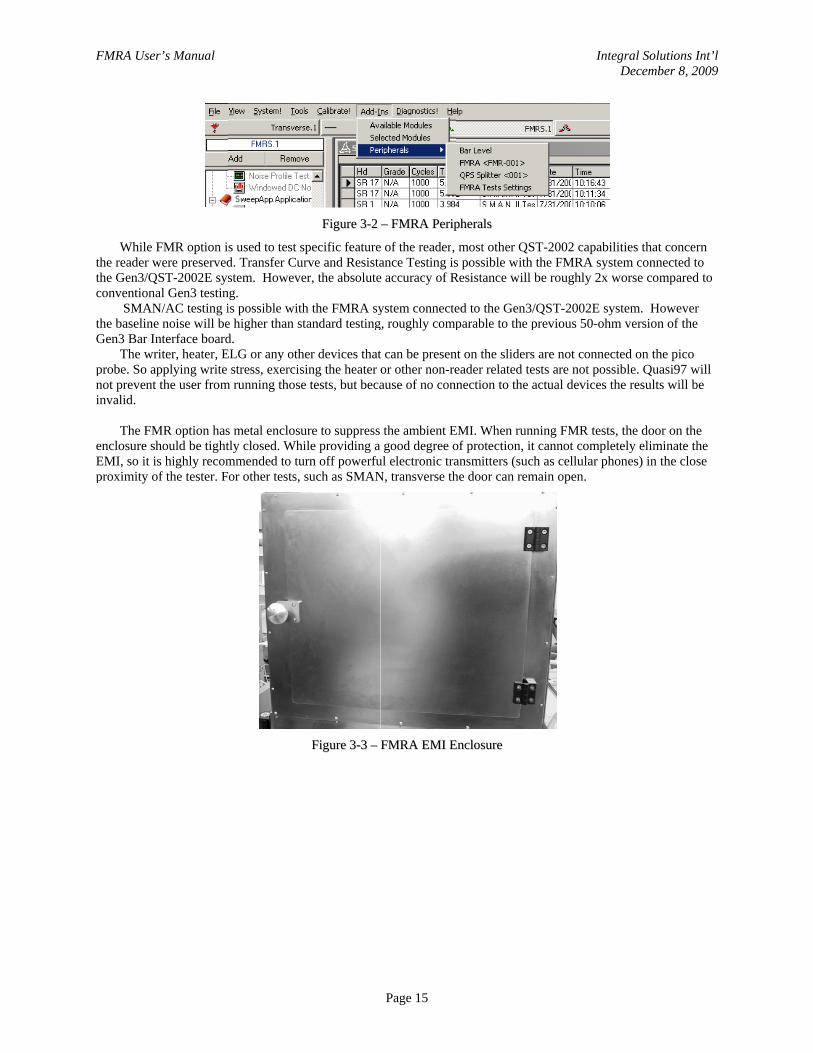
FMRA Use
Whilethe reader the Gen3/Qconvention
SMANthe baselinGen3 Bar I
The wprobe. So anot preveninvalid.
The FM
enclosure sEMI, so it proximity o
er’s Manual
FMR option iwere preserved
QST-2002E sysnal Gen3 testinN/AC testing i
ne noise will beInterface board
writer, heater, Eapplying write
nt the user from
MR option hasshould be tightis highly recomof the tester. F
s used to test sd. Transfer Curstem. Howeve
ng. is possible withe higher than std.
ELG or any othstress, exercis
m running those
s metal enclosutly closed. Whimmended to tuor other tests,
FFiigguurree 33--22
specific featurerve and Resistaer, the absolute
h the FMRA sytandard testing
her devices thating the heater
e tests, but beca
ure to suppress ile providing a
urn off powerfusuch as SMAN
FFiigguurree 33--33 ––
Page 15
–– FFMMRRAA PPeerriipp
e of the reader, ance Testing ise accuracy of R
ystem connecteg, roughly comp
t can be presenor other non-reause of no conn
the ambient E good degree o
ul electronic traN, transverse th
FFMMRRAA EEMMII EE
pphheerraallss
most other QSs possible with
Resistance will
ed to the Gen3/parable to the p
nt on the sliderseader related tenection to the a
EMI. When runof protection, itansmitters (suche door can rem
EEnncclloossuurree
Int
ST-2002 capab the FMRA sybe roughly 2x
/QST-2002E sprevious 50-oh
s are not conneests are not posactual devices
nning FMR testt cannot complch as cellular phmain open.
tegral SolutionDecember 8
ilities that constem connectedworse compar
ystem. Howevhm version of t
ected on the picssible. Quasi97the results wil
ts, the door on letely eliminatehones) in the c
ns Int’l 8, 2009
cern d to red to
ver the
co 7 will l be
the e the close
FMRA User’s Manual Integral Solutions Int’l December 8, 2009
Page 16
3.1 Starting Software Full (Typical) installation of Quasi97 is required for the tester to work. In addition to Quasi97, the FMRApp
module should be installed. The FMRApp software requires runtime license, refer to runtime license section for more details.
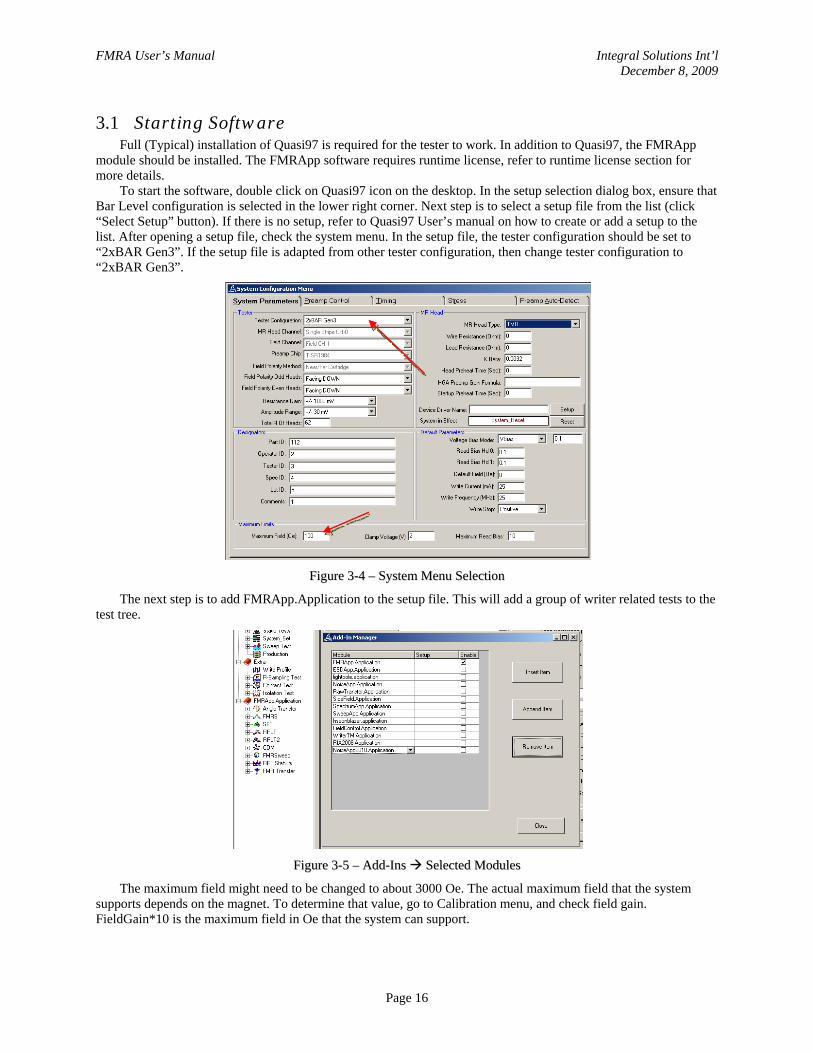
To start the software, double click on Quasi97 icon on the desktop. In the setup selection dialog box, ensure that Bar Level configuration is selected in the lower right corner. Next step is to select a setup file from the list (click “Select Setup” button). If there is no setup, refer to Quasi97 User’s manual on how to create or add a setup to the list. After opening a setup file, check the system menu. In the setup file, the tester configuration should be set to “2xBAR Gen3”. If the setup file is adapted from other tester configuration, then change tester configuration to “2xBAR Gen3”.
FFiigguurree 33--44 –– SSyysstteemm MMeennuu SSeelleeccttiioonn
The next step is to add FMRApp.Application to the setup file. This will add a group of writer related tests to the test tree.
FFiigguurree 33--55 –– AAdddd--IInnss SSeelleecctteedd MMoodduulleess
The maximum field might need to be changed to about 3000 Oe. The actual maximum field that the system supports depends on the magnet. To determine that value, go to Calibration menu, and check field gain. FieldGain*10 is the maximum field in Oe that the system can support.
FMRA User’s Manual Integral Solutions Int’l December 8, 2009
Page 17
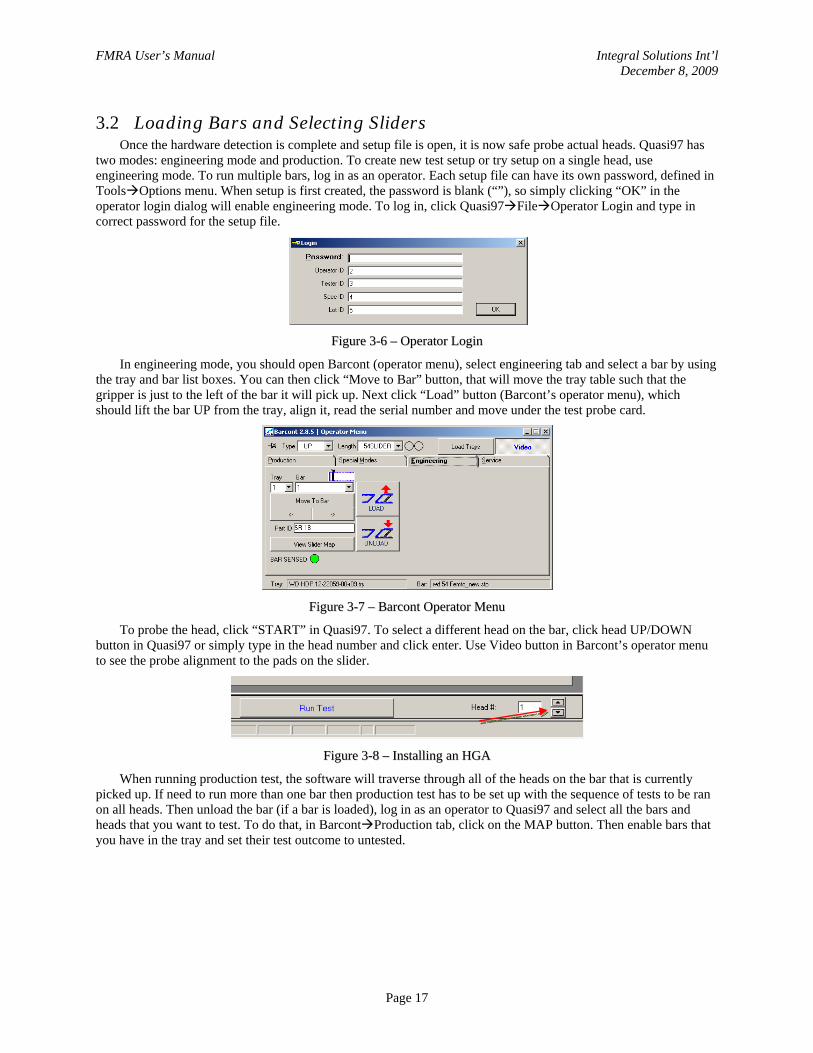
3.2 Loading Bars and Selecting Sliders Once the hardware detection is complete and setup file is open, it is now safe probe actual heads. Quasi97 has
two modes: engineering mode and production. To create new test setup or try setup on a single head, use engineering mode. To run multiple bars, log in as an operator. Each setup file can have its own password, defined in Tools Options menu. When setup is first created, the password is blank (“”), so simply clicking “OK” in the operator login dialog will enable engineering mode. To log in, click Quasi97 File Operator Login and type in correct password for the setup file.
FFiigguurree 33--66 –– OOppeerraattoorr LLooggiinn
In engineering mode, you should open Barcont (operator menu), select engineering tab and select a bar by using the tray and bar list boxes. You can then click “Move to Bar” button, that will move the tray table such that the gripper is just to the left of the bar it will pick up. Next click “Load” button (Barcont’s operator menu), which should lift the bar UP from the tray, align it, read the serial number and move under the test probe card.
FFiigguurree 33--77 –– BBaarrccoonntt OOppeerraattoorr MMeennuu
To probe the head, click “START” in Quasi97. To select a different head on the bar, click head UP/DOWN button in Quasi97 or simply type in the head number and click enter. Use Video button in Barcont’s operator menu to see the probe alignment to the pads on the slider.
FFiigguurree 33--88 –– IInnssttaalllliinngg aann HHGGAA
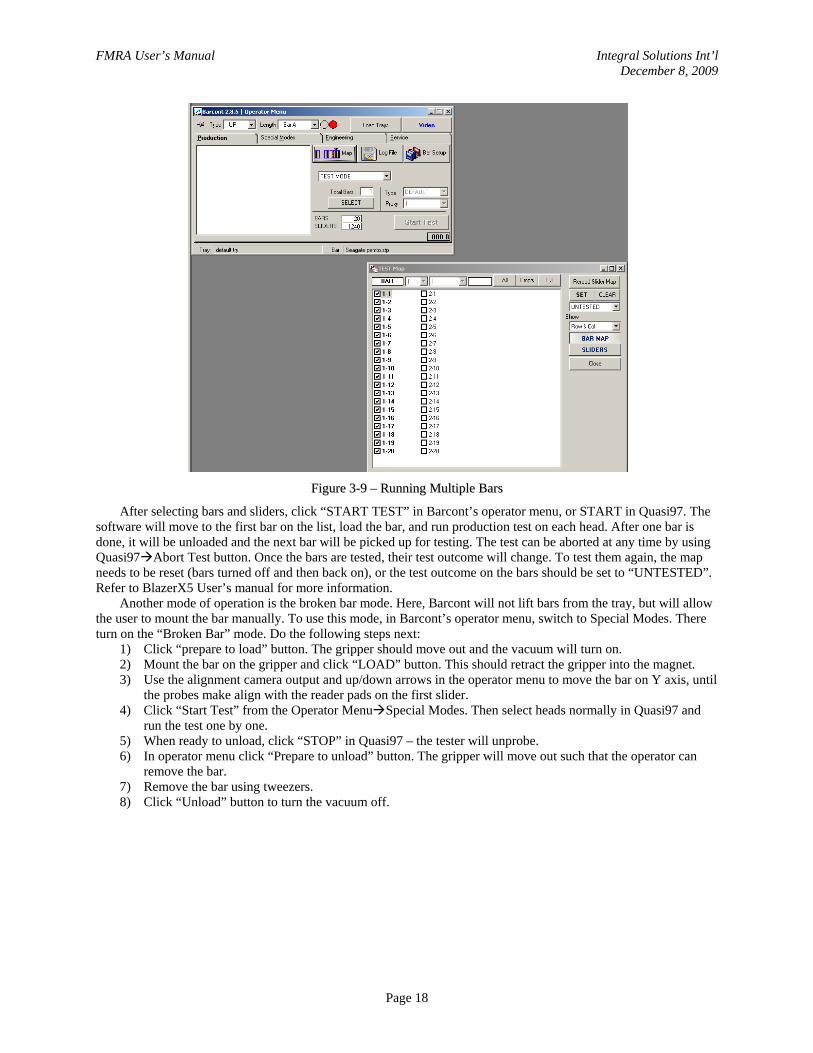
When running production test, the software will traverse through all of the heads on the bar that is currently picked up. If need to run more than one bar then production test has to be set up with the sequence of tests to be ran on all heads. Then unload the bar (if a bar is loaded), log in as an operator to Quasi97 and select all the bars and heads that you want to test. To do that, in Barcont Production tab, click on the MAP button. Then enable bars that you have in the tray and set their test outcome to untested.
FMRA User’s Manual Integral Solutions Int’l December 8, 2009
Page 18
FFiigguurree 33--99 –– RRuunnnniinngg MMuullttiippllee BBaarrss
After selecting bars and sliders, click “START TEST” in Barcont’s operator menu, or START in Quasi97. The software will move to the first bar on the list, load the bar, and run production test on each head. After one bar is done, it will be unloaded and the next bar will be picked up for testing. The test can be aborted at any time by using Quasi97 Abort Test button. Once the bars are tested, their test outcome will change. To test them again, the map needs to be reset (bars turned off and then back on), or the test outcome on the bars should be set to “UNTESTED”. Refer to BlazerX5 User’s manual for more information.
Another mode of operation is the broken bar mode. Here, Barcont will not lift bars from the tray, but will allow the user to mount the bar manually. To use this mode, in Barcont’s operator menu, switch to Special Modes. There turn on the “Broken Bar” mode. Do the following steps next:
1) Click “prepare to load” button. The gripper should move out and the vacuum will turn on. 2) Mount the bar on the gripper and click “LOAD” button. This should retract the gripper into the magnet. 3) Use the alignment camera output and up/down arrows in the operator menu to move the bar on Y axis, until
the probes make align with the reader pads on the first slider. 4) Click “Start Test” from the Operator Menu Special Modes. Then select heads normally in Quasi97 and
run the test one by one. 5) When ready to unload, click “STOP” in Quasi97 – the tester will unprobe. 6) In operator menu click “Prepare to unload” button. The gripper will move out such that the operator can
remove the bar. 7) Remove the bar using tweezers. 8) Click “Unload” button to turn the vacuum off.
FMRA User’s Manual Integral Solutions Int’l December 8, 2009
Page 19
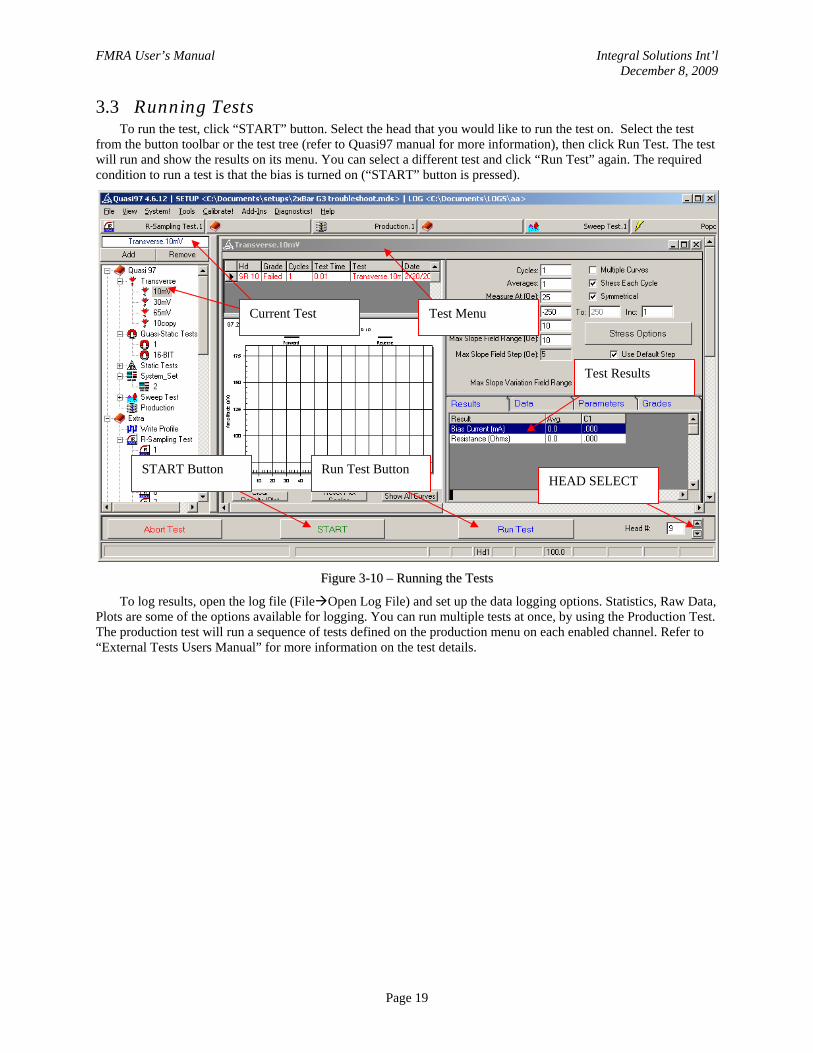
3.3 Running Tests To run the test, click “START” button. Select the head that you would like to run the test on. Select the test
from the button toolbar or the test tree (refer to Quasi97 manual for more information), then click Run Test. The test will run and show the results on its menu. You can select a different test and click “Run Test” again. The required condition to run a test is that the bias is turned on (“START” button is pressed).
FFiigguurree 33--1100 –– RRuunnnniinngg tthhee TTeessttss
To log results, open the log file (File Open Log File) and set up the data logging options. Statistics, Raw Data, Plots are some of the options available for logging. You can run multiple tests at once, by using the Production Test. The production test will run a sequence of tests defined on the production menu on each enabled channel. Refer to “External Tests Users Manual” for more information on the test details.
START Button Run Test Button HEAD SELECT
Current Test Test Menu
Test Results
FMRA User’s Manual Integral Solutions Int’l December 8, 2009
Page 20
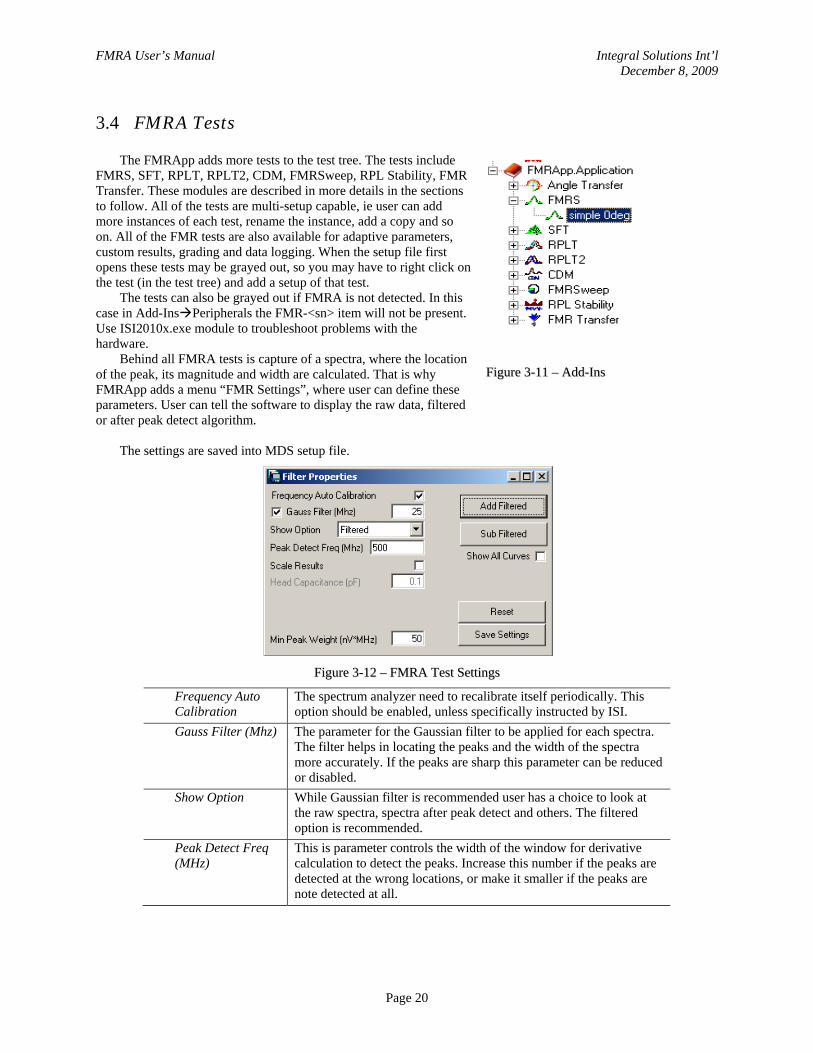
3.4 FMRA Tests The FMRApp adds more tests to the test tree. The tests include
FMRS, SFT, RPLT, RPLT2, CDM, FMRSweep, RPL Stability, FMR Transfer. These modules are described in more details in the sections to follow. All of the tests are multi-setup capable, ie user can add more instances of each test, rename the instance, add a copy and so on. All of the FMR tests are also available for adaptive parameters, custom results, grading and data logging. When the setup file first opens these tests may be grayed out, so you may have to right click on the test (in the test tree) and add a setup of that test.
The tests can also be grayed out if FMRA is not detected. In this case in Add-Ins Peripherals the FMR-<sn> item will not be present. Use ISI2010x.exe module to troubleshoot problems with the hardware.
Behind all FMRA tests is capture of a spectra, where the location of the peak, its magnitude and width are calculated. That is why FMRApp adds a menu “FMR Settings”, where user can define these parameters. User can tell the software to display the raw data, filtered or after peak detect algorithm.
FFiigguurree 33--1111 –– AAdddd--IInnss
The settings are saved into MDS setup file.
FFiigguurree 33--1122 –– FFMMRRAA TTeesstt SSeettttiinnggss
Frequency Auto Calibration
The spectrum analyzer need to recalibrate itself periodically. This option should be enabled, unless specifically instructed by ISI.
Gauss Filter (Mhz) The parameter for the Gaussian filter to be applied for each spectra. The filter helps in locating the peaks and the width of the spectra more accurately. If the peaks are sharp this parameter can be reduced or disabled.
Show Option While Gaussian filter is recommended user has a choice to look at the raw spectra, spectra after peak detect and others. The filtered option is recommended.
Peak Detect Freq (MHz)
This is parameter controls the width of the window for derivative calculation to detect the peaks. Increase this number if the peaks are detected at the wrong locations, or make it smaller if the peaks are note detected at all.
FMRA User’s Manual Integral Solutions Int’l December 8, 2009
Page 21
Scale Results This will rescale the FMR amplitude shown in all of the tests using the gain formula by Klaassen, and the theoretical head capacitance value entered in this menu. If this option is enabled, the tests will also have “Capacitance (pF)” result.
Head Capacitance The value to use for calculating the gain in order to rescale the amplitude results.
Reset Reset to factory default settings Save Settings This will save the current settings to FMRApp.ini file on the hard
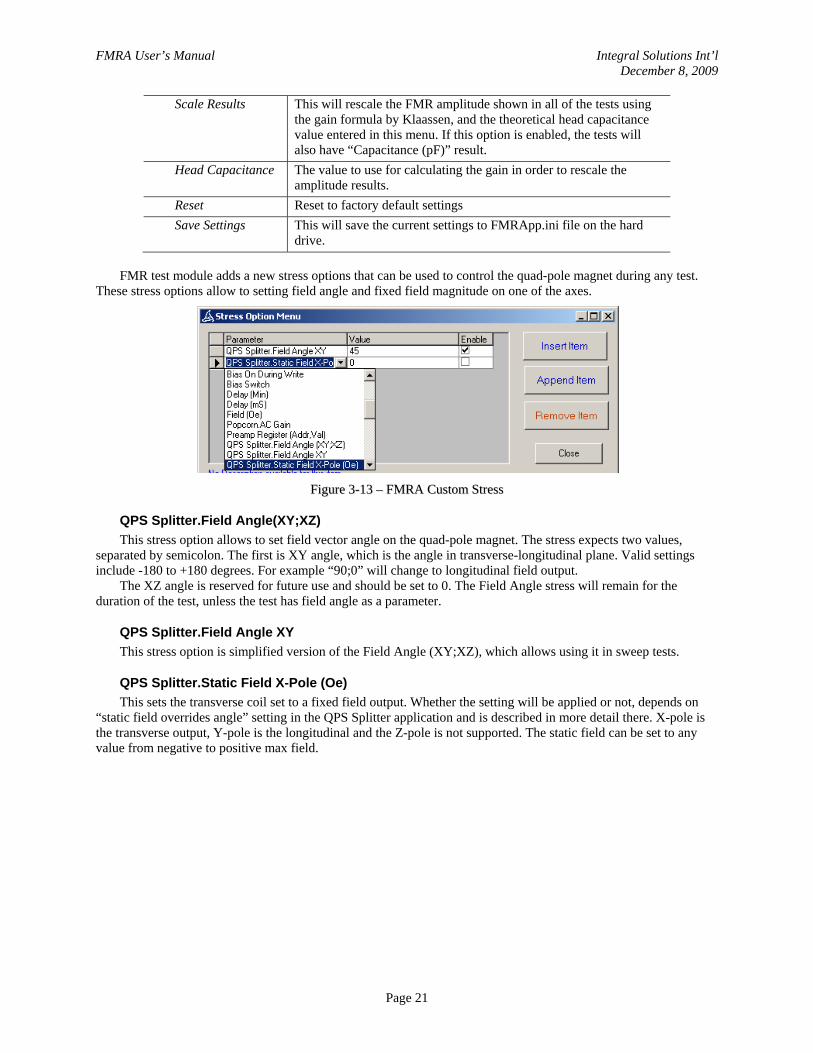
drive. FMR test module adds a new stress options that can be used to control the quad-pole magnet during any test.
These stress options allow to setting field angle and fixed field magnitude on one of the axes.
FFiigguurree 33--1133 –– FFMMRRAA CCuussttoomm SSttrreessss
QPS Splitter.Field Angle(XY;XZ) This stress option allows to set field vector angle on the quad-pole magnet. The stress expects two values,
separated by semicolon. The first is XY angle, which is the angle in transverse-longitudinal plane. Valid settings include -180 to +180 degrees. For example “90;0” will change to longitudinal field output.
The XZ angle is reserved for future use and should be set to 0. The Field Angle stress will remain for the duration of the test, unless the test has field angle as a parameter.
QPS Splitter.Field Angle XY This stress option is simplified version of the Field Angle (XY;XZ), which allows using it in sweep tests.
QPS Splitter.Static Field X-Pole (Oe) This sets the transverse coil set to a fixed field output. Whether the setting will be applied or not, depends on
“static field overrides angle” setting in the QPS Splitter application and is described in more detail there. X-pole is the transverse output, Y-pole is the longitudinal and the Z-pole is not supported. The static field can be set to any value from negative to positive max field.
FMRA User’s Manual Integral Solutions Int’l December 8, 2009
Page 22
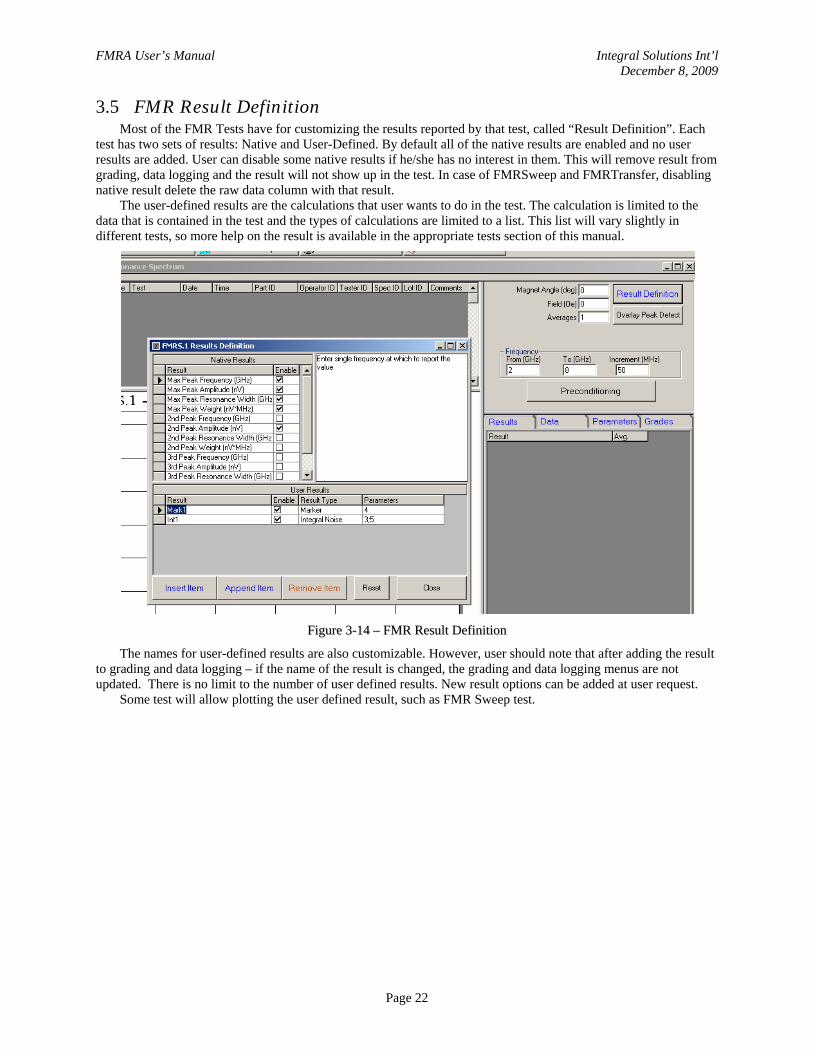
3.5 FMR Result Definition Most of the FMR Tests have for customizing the results reported by that test, called “Result Definition”. Each
test has two sets of results: Native and User-Defined. By default all of the native results are enabled and no user results are added. User can disable some native results if he/she has no interest in them. This will remove result from grading, data logging and the result will not show up in the test. In case of FMRSweep and FMRTransfer, disabling native result delete the raw data column with that result.
The user-defined results are the calculations that user wants to do in the test. The calculation is limited to the data that is contained in the test and the types of calculations are limited to a list. This list will vary slightly in different tests, so more help on the result is available in the appropriate tests section of this manual.
FFiigguurree 33--1144 –– FFMMRR RReessuulltt DDeeffiinniittiioonn
The names for user-defined results are also customizable. However, user should note that after adding the result to grading and data logging – if the name of the result is changed, the grading and data logging menus are not updated. There is no limit to the number of user defined results. New result options can be added at user request.
Some test will allow plotting the user defined result, such as FMR Sweep test.
FMRA User’s Manual Integral Solutions Int’l December 8, 2009
Page 23
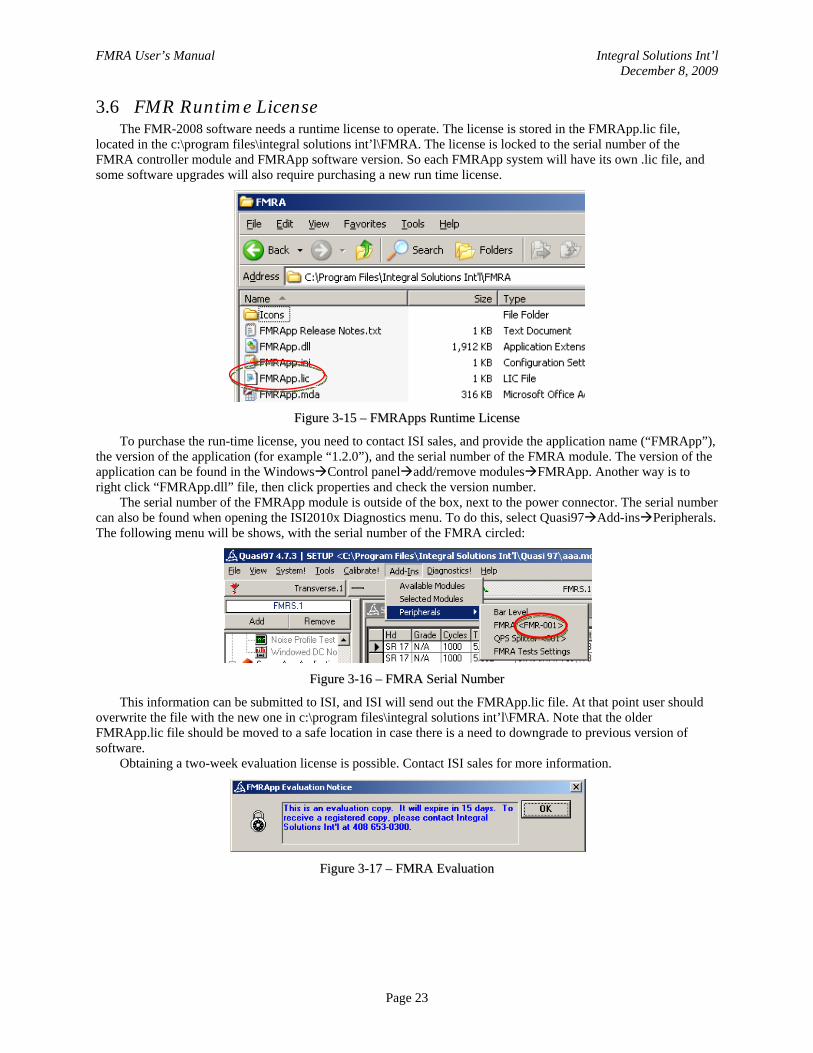
3.6 FMR Runtime License The FMR-2008 software needs a runtime license to operate. The license is stored in the FMRApp.lic file,
located in the c:\program files\integral solutions int’l\FMRA. The license is locked to the serial number of the FMRA controller module and FMRApp software version. So each FMRApp system will have its own .lic file, and some software upgrades will also require purchasing a new run time license.
FFiigguurree 33--1155 –– FFMMRRAAppppss RRuunnttiimmee LLiicceennssee
To purchase the run-time license, you need to contact ISI sales, and provide the application name (“FMRApp”), the version of the application (for example “1.2.0”), and the serial number of the FMRA module. The version of the application can be found in the Windows Control panel add/remove modules FMRApp. Another way is to right click “FMRApp.dll” file, then click properties and check the version number.
The serial number of the FMRApp module is outside of the box, next to the power connector. The serial number can also be found when opening the ISI2010x Diagnostics menu. To do this, select Quasi97 Add-ins Peripherals. The following menu will be shows, with the serial number of the FMRA circled:
FFiigguurree 33--1166 –– FFMMRRAA SSeerriiaall NNuummbbeerr
This information can be submitted to ISI, and ISI will send out the FMRApp.lic file. At that point user should overwrite the file with the new one in c:\program files\integral solutions int’l\FMRA. Note that the older FMRApp.lic file should be moved to a safe location in case there is a need to downgrade to previous version of software.
Obtaining a two-week evaluation license is possible. Contact ISI sales for more information.
FFiigguurree 33--1177 –– FFMMRRAA EEvvaalluuaattiioonn
FMRA User’s Manual Integral Solutions Int’l December 8, 2009
Page 24
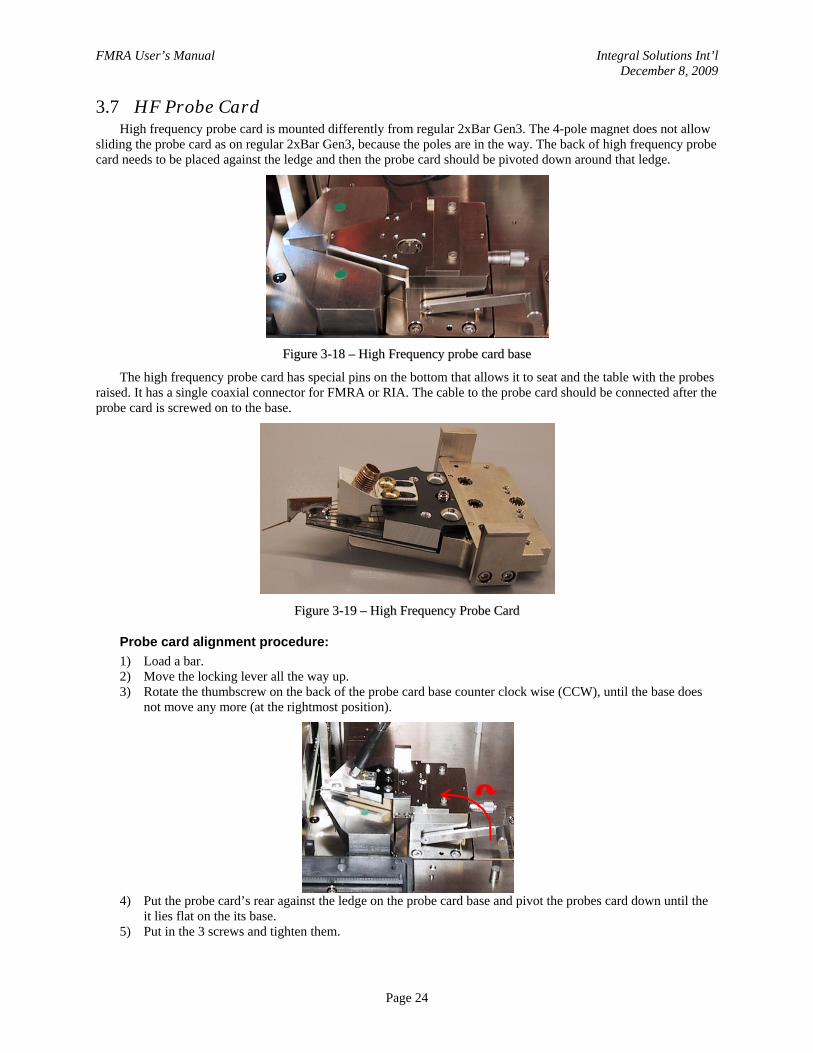
3.7 HF Probe Card High frequency probe card is mounted differently from regular 2xBar Gen3. The 4-pole magnet does not allow
sliding the probe card as on regular 2xBar Gen3, because the poles are in the way. The back of high frequency probe card needs to be placed against the ledge and then the probe card should be pivoted down around that ledge.
FFiigguurree 33--1188 –– HHiigghh FFrreeqquueennccyy pprroobbee ccaarrdd bbaassee
The high frequency probe card has special pins on the bottom that allows it to seat and the table with the probes raised. It has a single coaxial connector for FMRA or RIA. The cable to the probe card should be connected after the probe card is screwed on to the base.
FFiigguurree 33--1199 –– HHiigghh FFrreeqquueennccyy PPrroobbee CCaarrdd
Probe card alignment procedure: 1) Load a bar. 2) Move the locking lever all the way up. 3) Rotate the thumbscrew on the back of the probe card base counter clock wise (CCW), until the base does
not move any more (at the rightmost position).
4) Put the probe card’s rear against the ledge on the probe card base and pivot the probes card down until the
it lies flat on the its base. 5) Put in the 3 screws and tighten them.
FMRA User’s Manual Integral Solutions Int’l December 8, 2009
Page 25
6) Connect the coax cable and tighten it on the probe card. 7) In Barcont, click “Video” button and select the alignment channel. Zoom out so that you can see the probes
and the bar. 8) In Barcont’s operator window, under service tab, click “Align probe card”. 9) Rotate the thumbscrew on the back of the probe card until the probes get close to the bar (on the video). 10) Zoom in the alignment camera so that you can see the probes and the pads. 11) Use the thumbscrew to position the probes at the level of the pads on X axis. You may have to move the
bar on Y axis using the arrow keys in the Barcont’s operator menu. 12) Once aligned, lower the locking lever on the probe card base. 13) Click “Detect” button. You may have to click it several times before the bar is raised to the right height.
Monitor the video: if you see the contact there, stop and verify your connection. Use “Back Down” button to move the bar lower.
14) You may have to release the locking lever and readjust the probe card position on X axis, or bar position on Y axis as the bar gets closer to the probes. Always remember to lock the lever before resuming probe height detection (clicking “detect” button).
15) Once the probe card height is detected, CH1 shape should become green in the operator menu. Click Accept button to set the Z and Y probe card position. Note that for FMR, the second channel does not exist on the probe card.
FMRA User’s Manual Integral Solutions Int’l December 8, 2009
Page 26
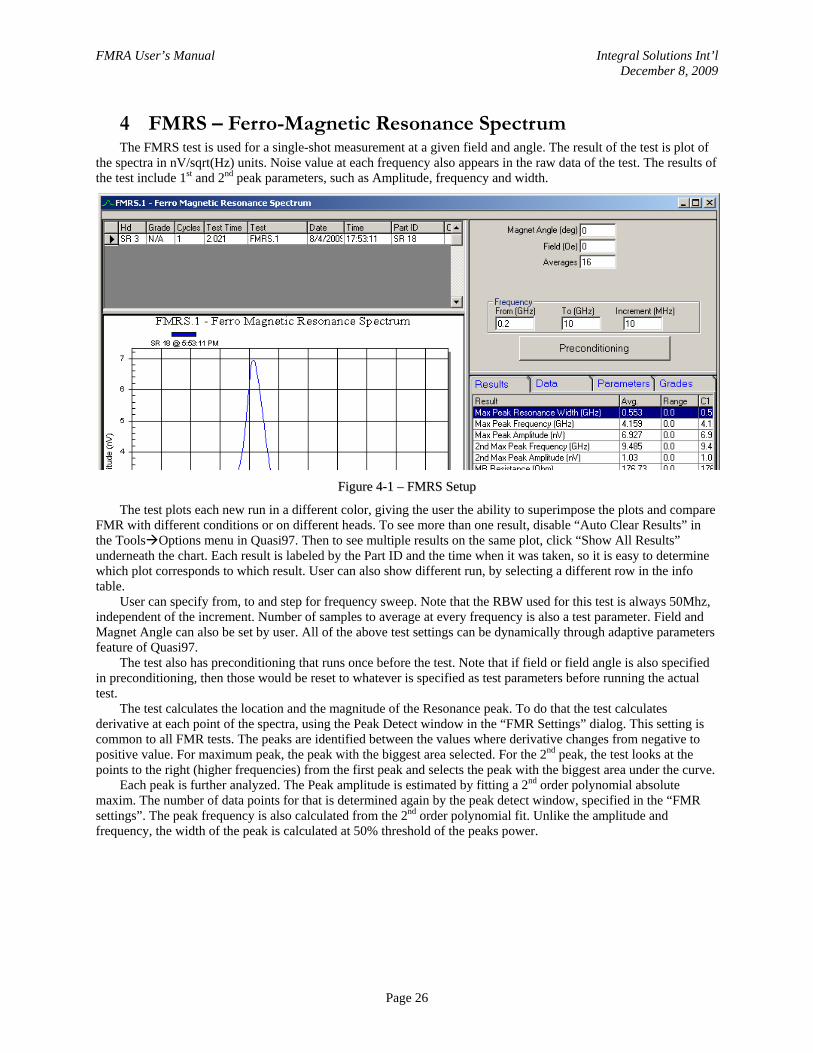
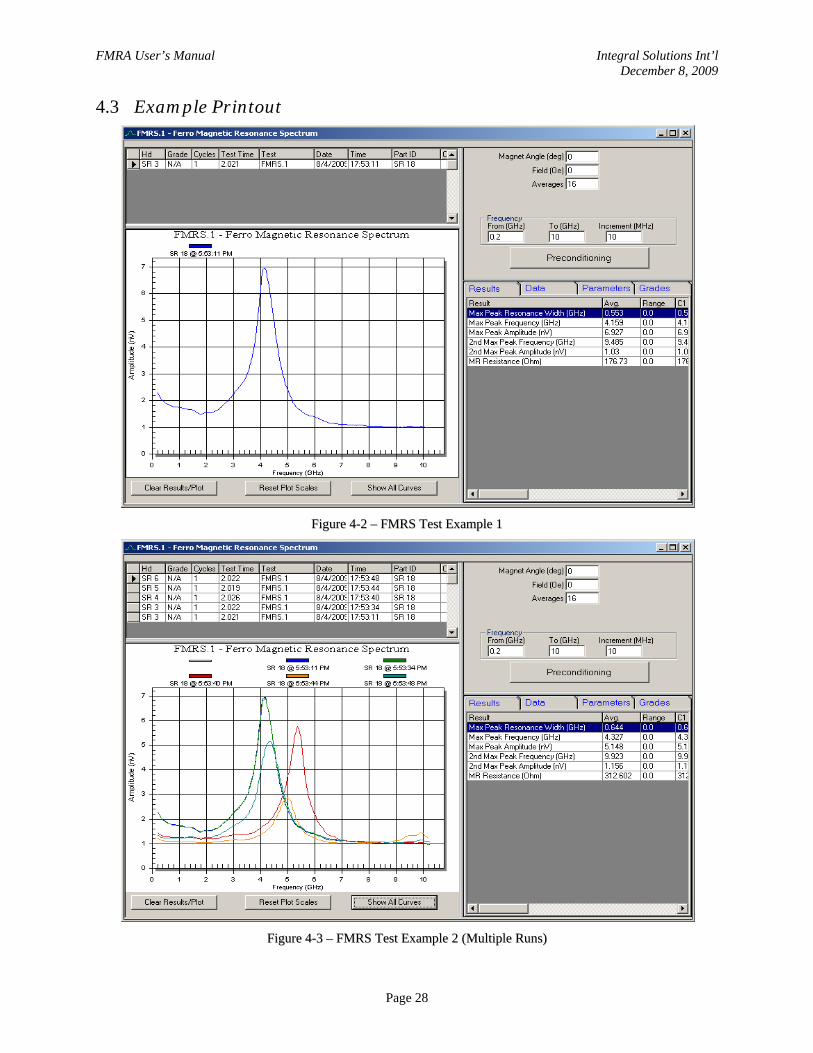
4 FMRS – Ferro-Magnetic Resonance Spectrum The FMRS test is used for a single-shot measurement at a given field and angle. The result of the test is plot of
the spectra in nV/sqrt(Hz) units. Noise value at each frequency also appears in the raw data of the test. The results of the test include 1st and 2nd peak parameters, such as Amplitude, frequency and width.
FFiigguurree 44--11 –– FFMMRRSS SSeettuupp
The test plots each new run in a different color, giving the user the ability to superimpose the plots and compare FMR with different conditions or on different heads. To see more than one result, disable “Auto Clear Results” in the Tools Options menu in Quasi97. Then to see multiple results on the same plot, click “Show All Results” underneath the chart. Each result is labeled by the Part ID and the time when it was taken, so it is easy to determine which plot corresponds to which result. User can also show different run, by selecting a different row in the info table.
User can specify from, to and step for frequency sweep. Note that the RBW used for this test is always 50Mhz, independent of the increment. Number of samples to average at every frequency is also a test parameter. Field and Magnet Angle can also be set by user. All of the above test settings can be dynamically through adaptive parameters feature of Quasi97.
The test also has preconditioning that runs once before the test. Note that if field or field angle is also specified in preconditioning, then those would be reset to whatever is specified as test parameters before running the actual test.
The test calculates the location and the magnitude of the Resonance peak. To do that the test calculates derivative at each point of the spectra, using the Peak Detect window in the “FMR Settings” dialog. This setting is common to all FMR tests. The peaks are identified between the values where derivative changes from negative to positive value. For maximum peak, the peak with the biggest area selected. For the 2nd peak, the test looks at the points to the right (higher frequencies) from the first peak and selects the peak with the biggest area under the curve.
Each peak is further analyzed. The Peak amplitude is estimated by fitting a 2nd order polynomial absolute maxim. The number of data points for that is determined again by the peak detect window, specified in the “FMR settings”. The peak frequency is also calculated from the 2nd order polynomial fit. Unlike the amplitude and frequency, the width of the peak is calculated at 50% threshold of the peaks power.
FMRA User’s Manual Integral Solutions Int’l December 8, 2009
Page 27
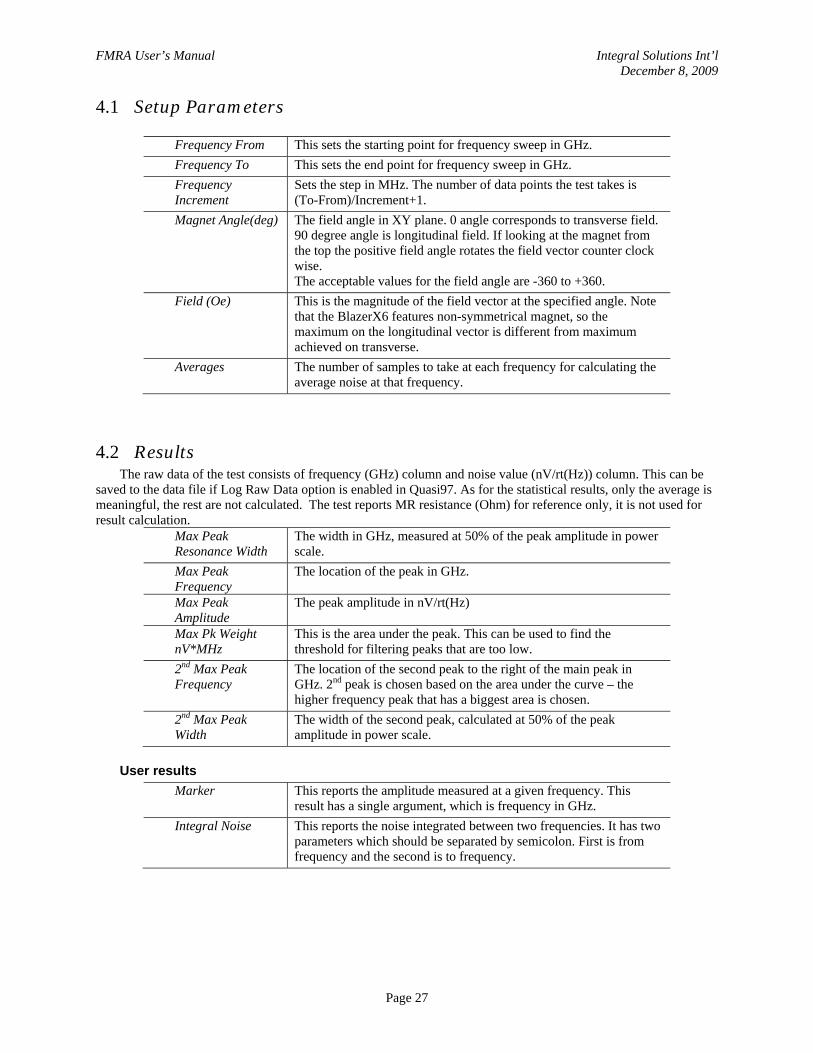
4.1 Setup Parameters
Frequency From This sets the starting point for frequency sweep in GHz. Frequency To This sets the end point for frequency sweep in GHz. Frequency Increment
Sets the step in MHz. The number of data points the test takes is (To-From)/Increment+1.
Magnet Angle(deg) The field angle in XY plane. 0 angle corresponds to transverse field. 90 degree angle is longitudinal field. If looking at the magnet from the top the positive field angle rotates the field vector counter clock wise. The acceptable values for the field angle are -360 to +360.
Field (Oe) This is the magnitude of the field vector at the specified angle. Note that the BlazerX6 features non-symmetrical magnet, so the maximum on the longitudinal vector is different from maximum achieved on transverse.
Averages The number of samples to take at each frequency for calculating the average noise at that frequency.
4.2 Results The raw data of the test consists of frequency (GHz) column and noise value (nV/rt(Hz)) column. This can be
saved to the data file if Log Raw Data option is enabled in Quasi97. As for the statistical results, only the average is meaningful, the rest are not calculated. The test reports MR resistance (Ohm) for reference only, it is not used for result calculation.
Max Peak Resonance Width
The width in GHz, measured at 50% of the peak amplitude in power scale.
Max Peak Frequency
The location of the peak in GHz.
Max Peak Amplitude
The peak amplitude in nV/rt(Hz)
Max Pk Weight nV*MHz
This is the area under the peak. This can be used to find the threshold for filtering peaks that are too low.
2nd Max Peak Frequency
The location of the second peak to the right of the main peak in GHz. 2nd peak is chosen based on the area under the curve – the higher frequency peak that has a biggest area is chosen.
2nd Max Peak Width
The width of the second peak, calculated at 50% of the peak amplitude in power scale.
User results Marker This reports the amplitude measured at a given frequency. This
result has a single argument, which is frequency in GHz. Integral Noise This reports the noise integrated between two frequencies. It has two
parameters which should be separated by semicolon. First is from frequency and the second is to frequency.
FMRA User’s Manual Integral Solutions Int’l December 8, 2009
Page 28
4.3 Example Printout
FFiigguurree 44--22 –– FFMMRRSS TTeesstt EExxaammppllee 11
FFiigguurree 44--33 –– FFMMRRSS TTeesstt EExxaammppllee 22 ((MMuullttiippllee RRuunnss))
FMRA User’s Manual Integral Solutions Int’l December 8, 2009
Page 29
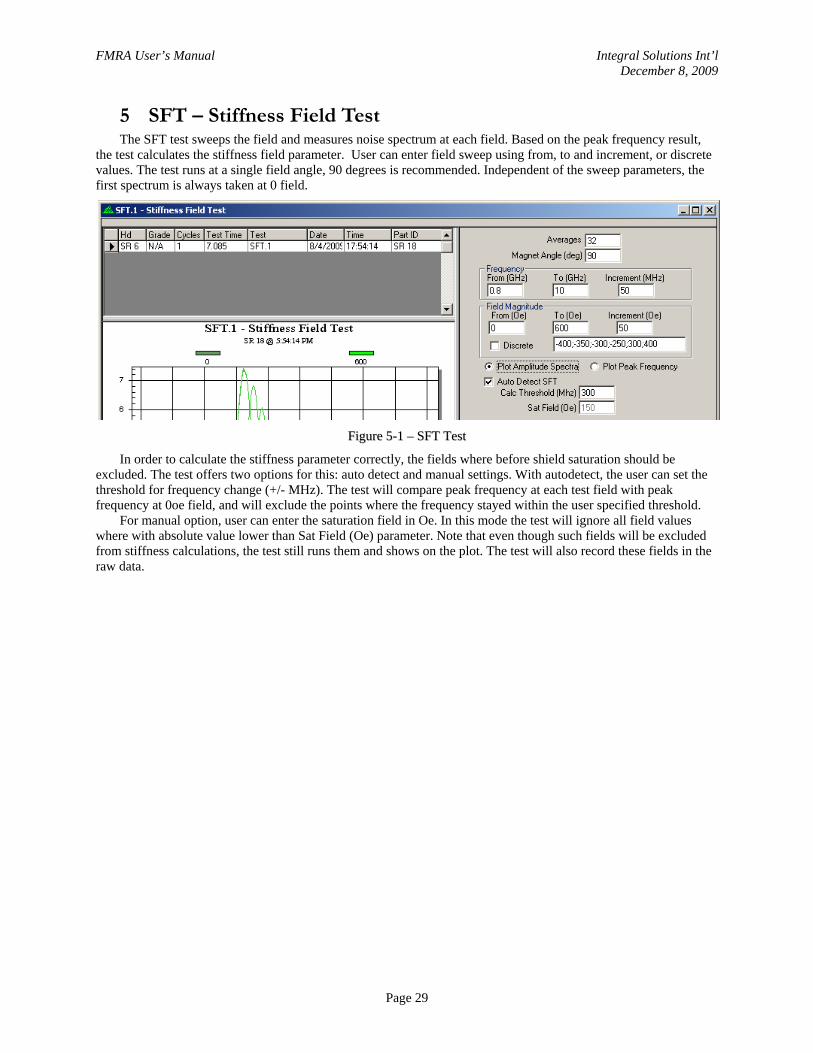
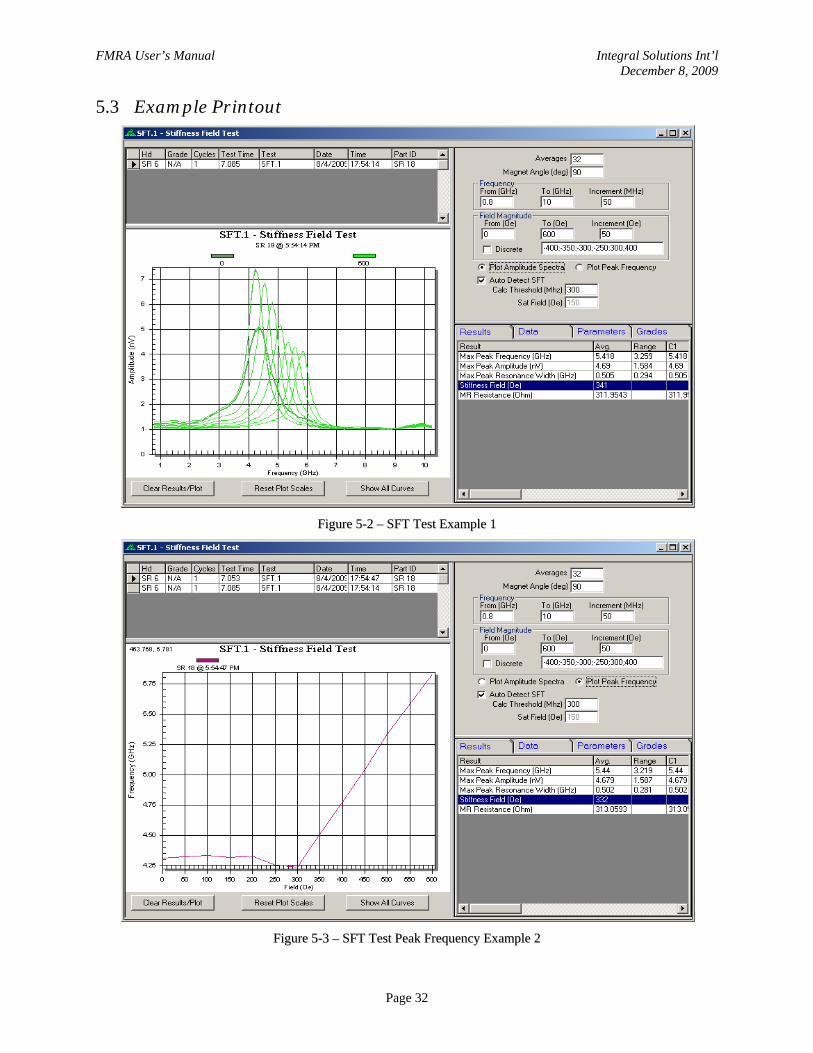
5 SFT – Stiffness Field Test The SFT test sweeps the field and measures noise spectrum at each field. Based on the peak frequency result,
the test calculates the stiffness field parameter. User can enter field sweep using from, to and increment, or discrete values. The test runs at a single field angle, 90 degrees is recommended. Independent of the sweep parameters, the first spectrum is always taken at 0 field.
FFiigguurree 55--11 –– SSFFTT TTeesstt
In order to calculate the stiffness parameter correctly, the fields where before shield saturation should be excluded. The test offers two options for this: auto detect and manual settings. With autodetect, the user can set the threshold for frequency change (+/- MHz). The test will compare peak frequency at each test field with peak frequency at 0oe field, and will exclude the points where the frequency stayed within the user specified threshold.
For manual option, user can enter the saturation field in Oe. In this mode the test will ignore all field values where with absolute value lower than Sat Field (Oe) parameter. Note that even though such fields will be excluded from stiffness calculations, the test still runs them and shows on the plot. The test will also record these fields in the raw data.
FMRA User’s Manual Integral Solutions Int’l December 8, 2009
Page 30
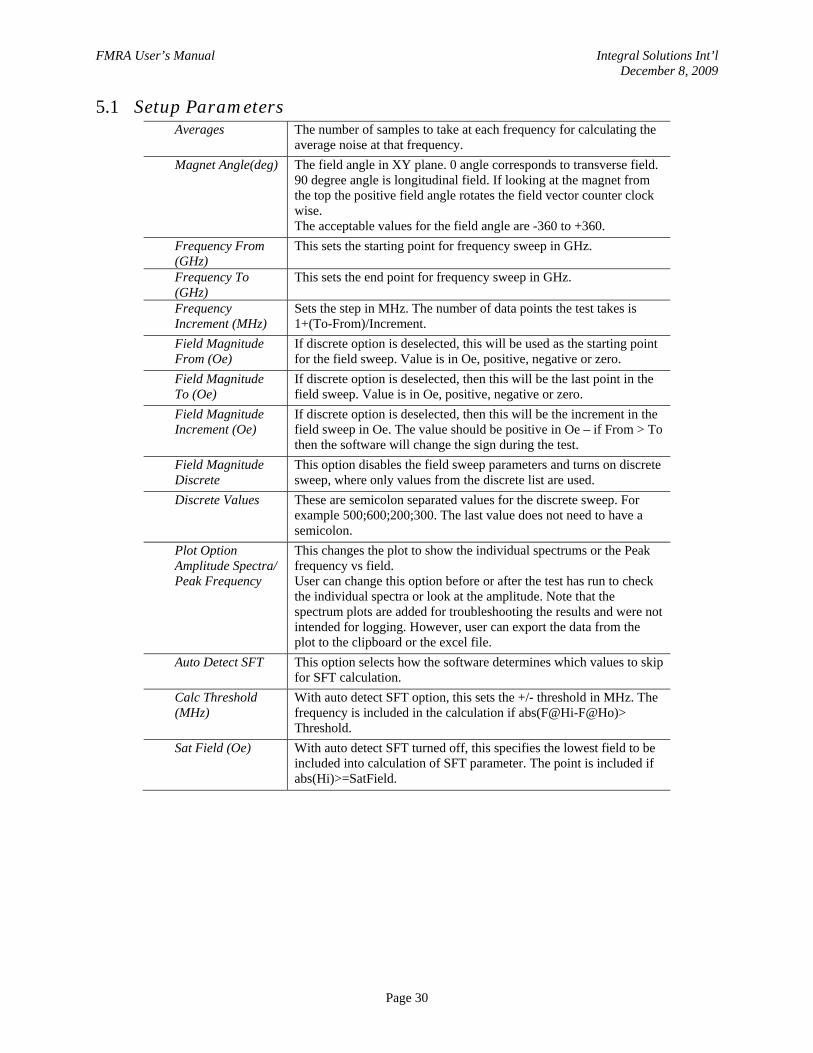
5.1 Setup Parameters Averages The number of samples to take at each frequency for calculating the
average noise at that frequency. Magnet Angle(deg) The field angle in XY plane. 0 angle corresponds to transverse field.
90 degree angle is longitudinal field. If looking at the magnet from the top the positive field angle rotates the field vector counter clock wise. The acceptable values for the field angle are -360 to +360.
Frequency From (GHz)
This sets the starting point for frequency sweep in GHz.
Frequency To (GHz)
This sets the end point for frequency sweep in GHz.
Frequency Increment (MHz)
Sets the step in MHz. The number of data points the test takes is 1+(To-From)/Increment.
Field Magnitude From (Oe)
If discrete option is deselected, this will be used as the starting point for the field sweep. Value is in Oe, positive, negative or zero.
Field Magnitude To (Oe)
If discrete option is deselected, then this will be the last point in the field sweep. Value is in Oe, positive, negative or zero.
Field Magnitude Increment (Oe)
If discrete option is deselected, then this will be the increment in the field sweep in Oe. The value should be positive in Oe – if From > To then the software will change the sign during the test.
Field Magnitude Discrete
This option disables the field sweep parameters and turns on discrete sweep, where only values from the discrete list are used.
Discrete Values These are semicolon separated values for the discrete sweep. For example 500;600;200;300. The last value does not need to have a semicolon.
Plot Option Amplitude Spectra/ Peak Frequency
This changes the plot to show the individual spectrums or the Peak frequency vs field. User can change this option before or after the test has run to check the individual spectra or look at the amplitude. Note that the spectrum plots are added for troubleshooting the results and were not intended for logging. However, user can export the data from the plot to the clipboard or the excel file.
Auto Detect SFT This option selects how the software determines which values to skip for SFT calculation.
Calc Threshold (MHz)
With auto detect SFT option, this sets the +/- threshold in MHz. The frequency is included in the calculation if abs(F@Hi-F@Ho)> Threshold.
Sat Field (Oe) With auto detect SFT turned off, this specifies the lowest field to be included into calculation of SFT parameter. The point is included if abs(Hi)>=SatField.
FMRA User’s Manual Integral Solutions Int’l December 8, 2009
Page 31
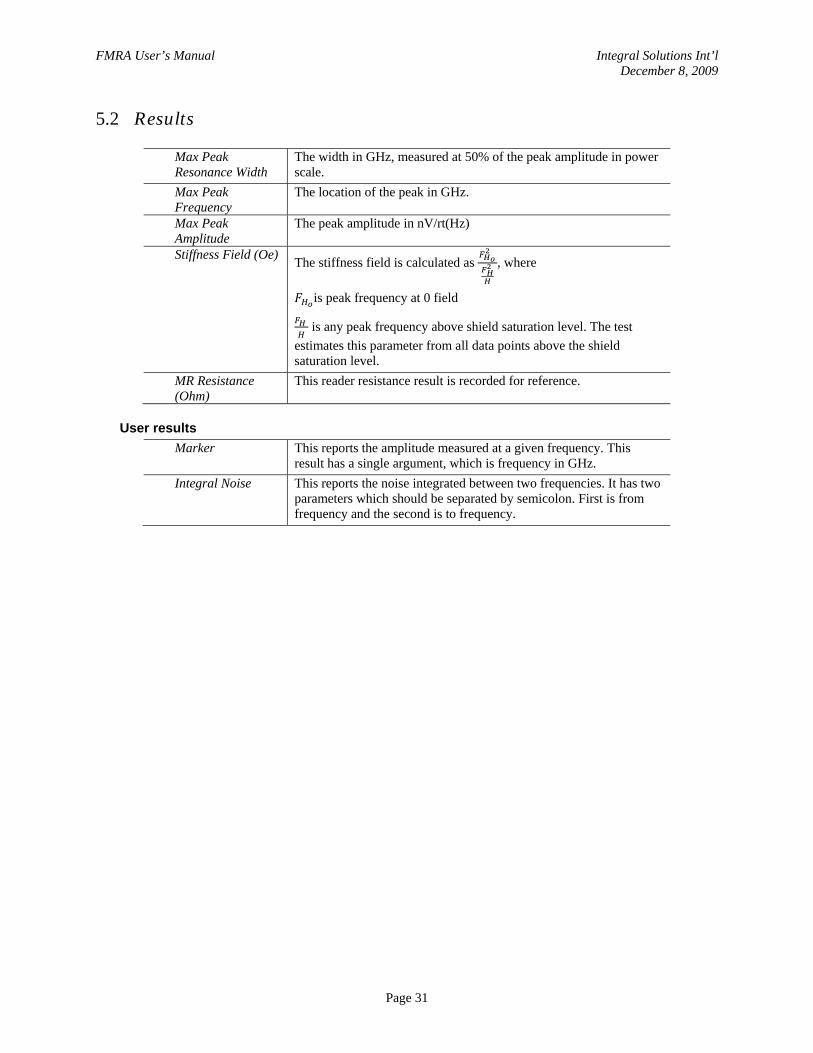
5.2 Results
Max Peak Resonance Width
The width in GHz, measured at 50% of the peak amplitude in power scale.
Max Peak Frequency
The location of the peak in GHz.
Max Peak Amplitude
The peak amplitude in nV/rt(Hz)
Stiffness Field (Oe) The stiffness field is calculated as , where
is peak frequency at 0 field
is any peak frequency above shield saturation level. The test estimates this parameter from all data points above the shield saturation level.
MR Resistance (Ohm)
This reader resistance result is recorded for reference.
User results Marker This reports the amplitude measured at a given frequency. This
result has a single argument, which is frequency in GHz. Integral Noise This reports the noise integrated between two frequencies. It has two
parameters which should be separated by semicolon. First is from frequency and the second is to frequency.
FMRA User’s Manual Integral Solutions Int’l December 8, 2009
Page 32
5.3 Example Printout
FFiigguurree 55--22 –– SSFFTT TTeesstt EExxaammppllee 11
FFiigguurree 55--33 –– SSFFTT TTeesstt PPeeaakk FFrreeqquueennccyy EExxaammppllee 22
FMRA User’s Manual Integral Solutions Int’l December 8, 2009
Page 33
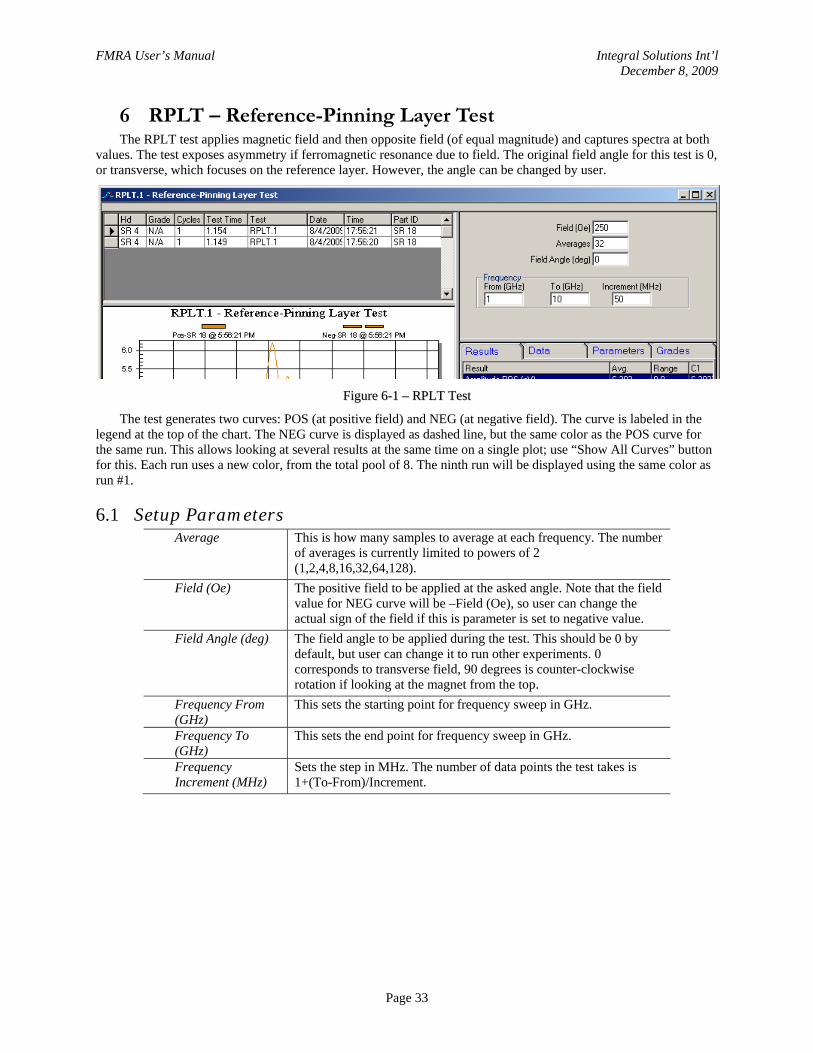
6 RPLT – Reference-Pinning Layer Test The RPLT test applies magnetic field and then opposite field (of equal magnitude) and captures spectra at both
values. The test exposes asymmetry if ferromagnetic resonance due to field. The original field angle for this test is 0, or transverse, which focuses on the reference layer. However, the angle can be changed by user.
FFiigguurree 66--11 –– RRPPLLTT TTeesstt
The test generates two curves: POS (at positive field) and NEG (at negative field). The curve is labeled in the legend at the top of the chart. The NEG curve is displayed as dashed line, but the same color as the POS curve for the same run. This allows looking at several results at the same time on a single plot; use “Show All Curves” button for this. Each run uses a new color, from the total pool of 8. The ninth run will be displayed using the same color as run #1.
6.1 Setup Parameters Average This is how many samples to average at each frequency. The number
of averages is currently limited to powers of 2 (1,2,4,8,16,32,64,128).
Field (Oe) The positive field to be applied at the asked angle. Note that the field value for NEG curve will be –Field (Oe), so user can change the actual sign of the field if this is parameter is set to negative value.
Field Angle (deg) The field angle to be applied during the test. This should be 0 by default, but user can change it to run other experiments. 0 corresponds to transverse field, 90 degrees is counter-clockwise rotation if looking at the magnet from the top.
Frequency From (GHz)
This sets the starting point for frequency sweep in GHz.
Frequency To (GHz)
This sets the end point for frequency sweep in GHz.
Frequency Increment (MHz)
Sets the step in MHz. The number of data points the test takes is 1+(To-From)/Increment.
FMRA User’s Manual Integral Solutions Int’l December 8, 2009
Page 34
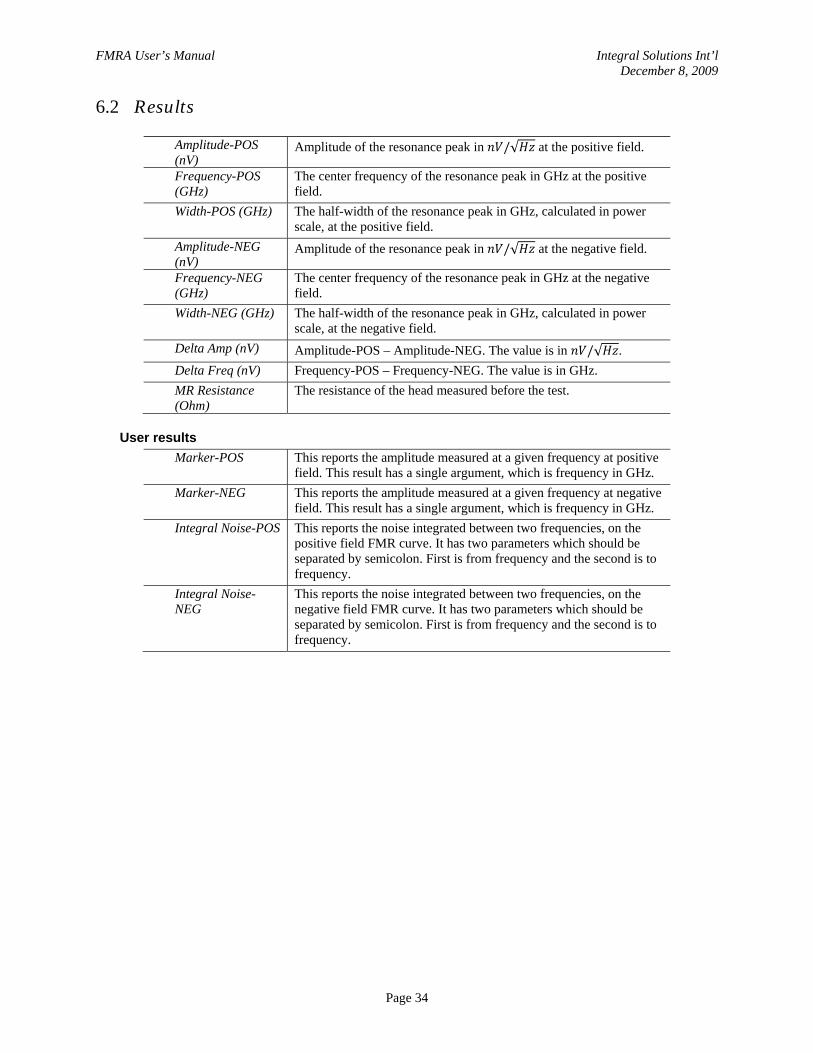
6.2 Results
Amplitude-POS (nV)
Amplitude of the resonance peak in /√ at the positive field.
Frequency-POS (GHz)
The center frequency of the resonance peak in GHz at the positive field.
Width-POS (GHz) The half-width of the resonance peak in GHz, calculated in power scale, at the positive field.
Amplitude-NEG (nV)
Amplitude of the resonance peak in /√ at the negative field.
Frequency-NEG (GHz)
The center frequency of the resonance peak in GHz at the negative field.
Width-NEG (GHz) The half-width of the resonance peak in GHz, calculated in power scale, at the negative field.
Delta Amp (nV) Amplitude-POS – Amplitude-NEG. The value is in /√ . Delta Freq (nV) Frequency-POS – Frequency-NEG. The value is in GHz. MR Resistance (Ohm)
The resistance of the head measured before the test.
User results Marker-POS This reports the amplitude measured at a given frequency at positive
field. This result has a single argument, which is frequency in GHz. Marker-NEG This reports the amplitude measured at a given frequency at negative
field. This result has a single argument, which is frequency in GHz. Integral Noise-POS This reports the noise integrated between two frequencies, on the
positive field FMR curve. It has two parameters which should be separated by semicolon. First is from frequency and the second is to frequency.
Integral Noise-NEG
This reports the noise integrated between two frequencies, on the negative field FMR curve. It has two parameters which should be separated by semicolon. First is from frequency and the second is to frequency.
FMRA User’s Manual Integral Solutions Int’l December 8, 2009
Page 35
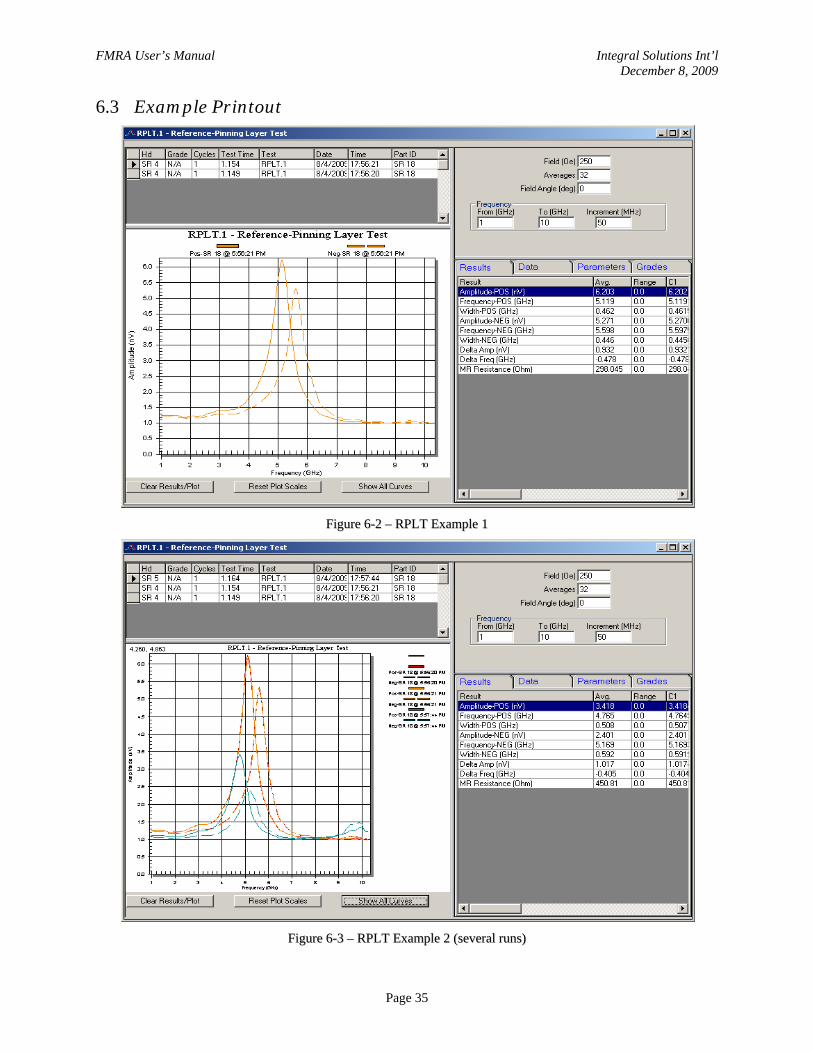
6.3 Example Printout
FFiigguurree 66--22 –– RRPPLLTT EExxaammppllee 11
FFiigguurree 66--33 –– RRPPLLTT EExxaammppllee 22 ((sseevveerraall rruunnss))
FMRA User’s Manual Integral Solutions Int’l December 8, 2009
Page 36
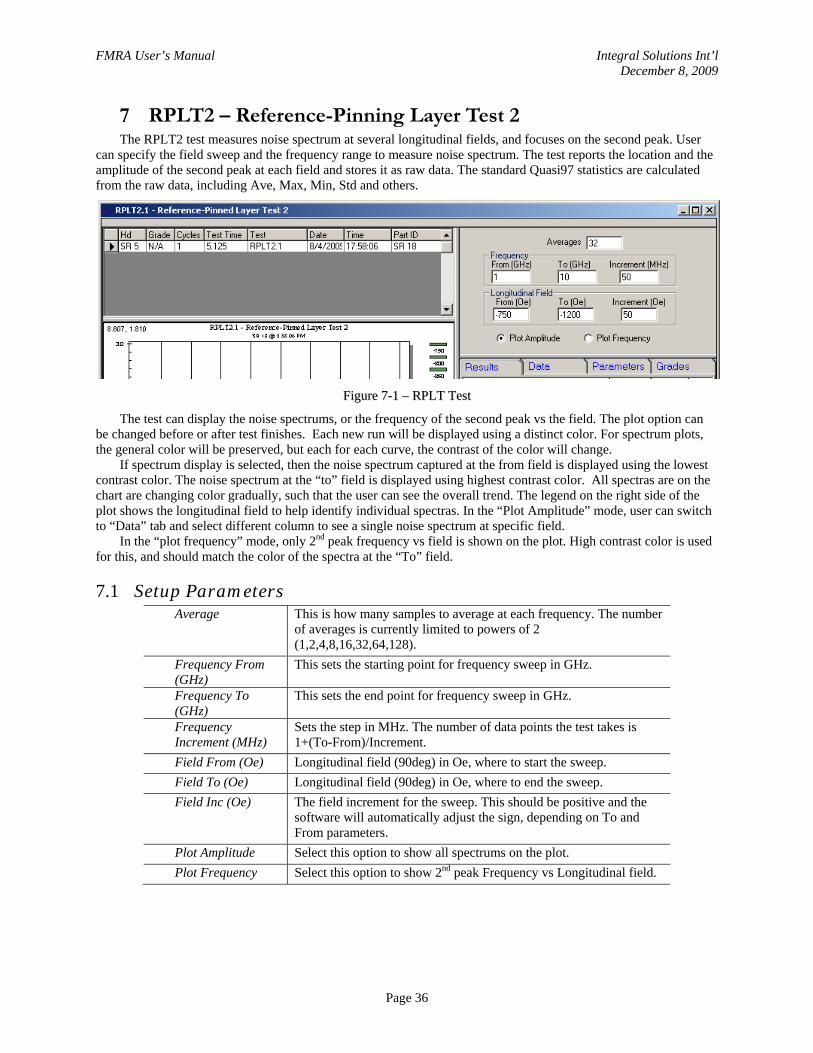
7 RPLT2 – Reference-Pinning Layer Test 2 The RPLT2 test measures noise spectrum at several longitudinal fields, and focuses on the second peak. User
can specify the field sweep and the frequency range to measure noise spectrum. The test reports the location and the amplitude of the second peak at each field and stores it as raw data. The standard Quasi97 statistics are calculated from the raw data, including Ave, Max, Min, Std and others.
FFiigguurree 77--11 –– RRPPLLTT TTeesstt
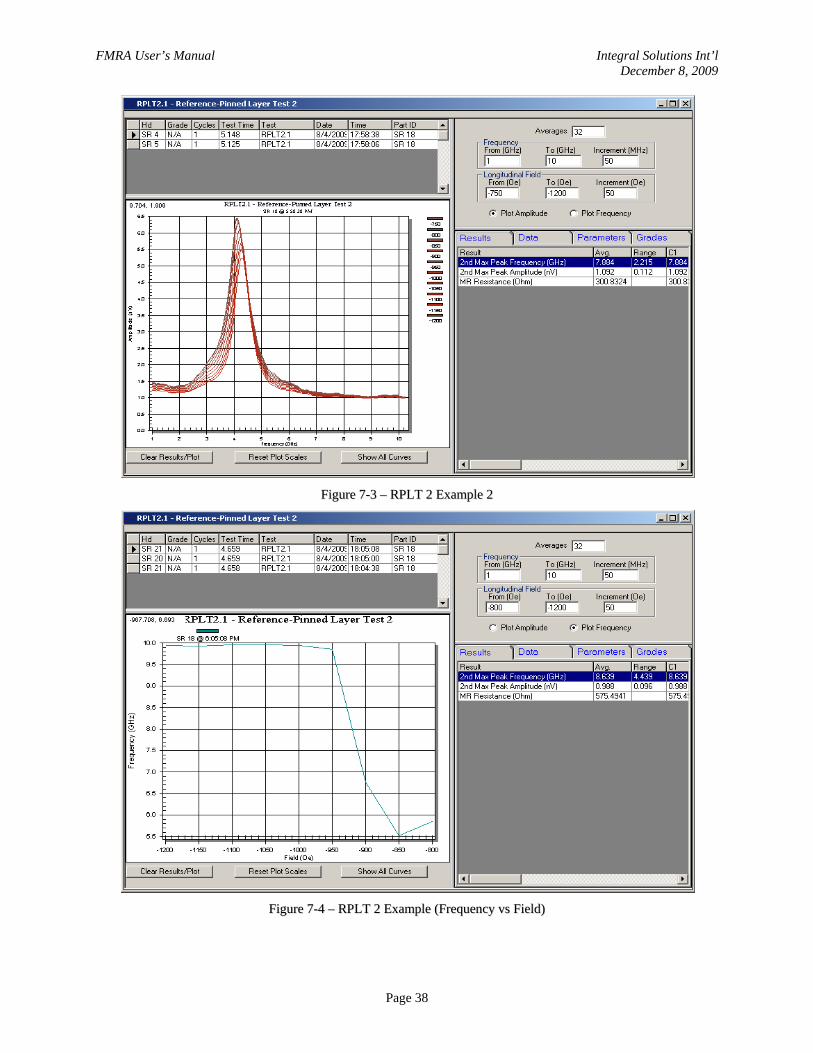
The test can display the noise spectrums, or the frequency of the second peak vs the field. The plot option can be changed before or after test finishes. Each new run will be displayed using a distinct color. For spectrum plots, the general color will be preserved, but each for each curve, the contrast of the color will change.
If spectrum display is selected, then the noise spectrum captured at the from field is displayed using the lowest contrast color. The noise spectrum at the “to” field is displayed using highest contrast color. All spectras are on the chart are changing color gradually, such that the user can see the overall trend. The legend on the right side of the plot shows the longitudinal field to help identify individual spectras. In the “Plot Amplitude” mode, user can switch to “Data” tab and select different column to see a single noise spectrum at specific field.
In the “plot frequency” mode, only 2nd peak frequency vs field is shown on the plot. High contrast color is used for this, and should match the color of the spectra at the “To” field.
7.1 Setup Parameters Average This is how many samples to average at each frequency. The number
of averages is currently limited to powers of 2 (1,2,4,8,16,32,64,128).
Frequency From (GHz)
This sets the starting point for frequency sweep in GHz.
Frequency To (GHz)
This sets the end point for frequency sweep in GHz.
Frequency Increment (MHz)
Sets the step in MHz. The number of data points the test takes is 1+(To-From)/Increment.
Field From (Oe) Longitudinal field (90deg) in Oe, where to start the sweep. Field To (Oe) Longitudinal field (90deg) in Oe, where to end the sweep. Field Inc (Oe) The field increment for the sweep. This should be positive and the
software will automatically adjust the sign, depending on To and From parameters.
Plot Amplitude Select this option to show all spectrums on the plot. Plot Frequency Select this option to show 2nd peak Frequency vs Longitudinal field.
FMRA User’s Manual Integral Solutions Int’l December 8, 2009
Page 37
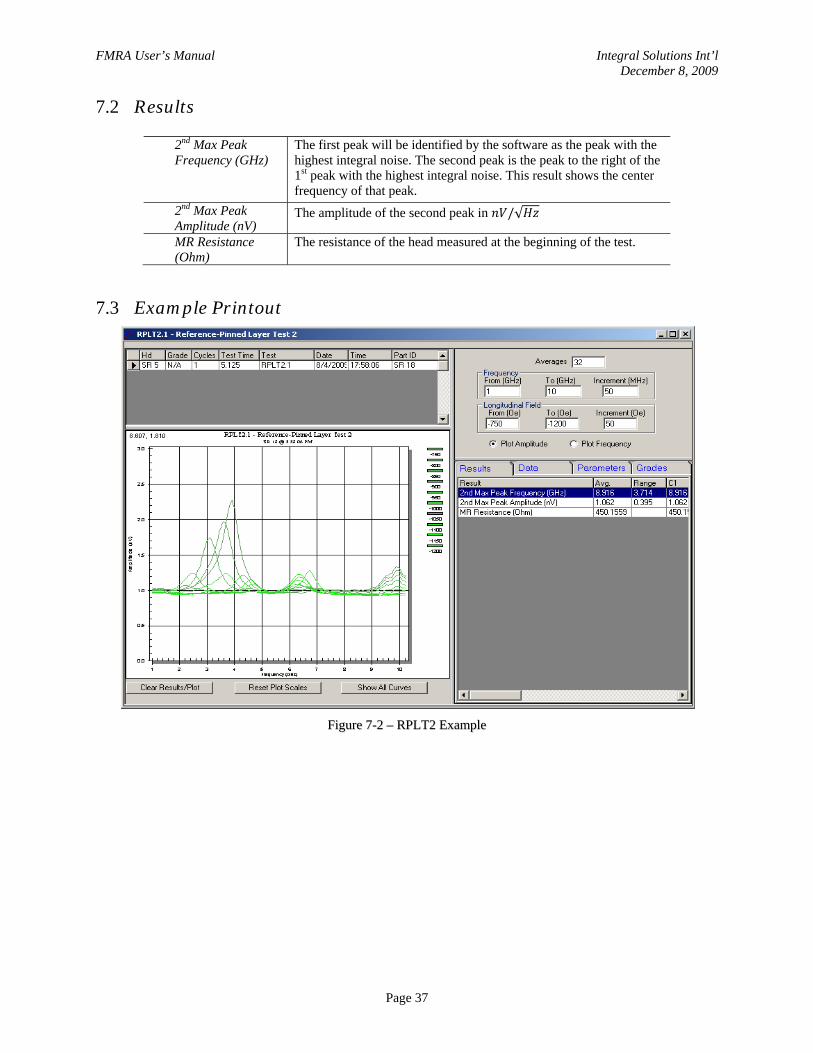
7.2 Results
2nd Max Peak Frequency (GHz)
The first peak will be identified by the software as the peak with the highest integral noise. The second peak is the peak to the right of the 1st peak with the highest integral noise. This result shows the center frequency of that peak.
2nd Max Peak Amplitude (nV)
The amplitude of the second peak in /√
MR Resistance (Ohm)
The resistance of the head measured at the beginning of the test.
7.3 Example Printout
FFiigguurree 77--22 –– RRPPLLTT22 EExxaammppllee
FMRA User’s Manual Integral Solutions Int’l December 8, 2009
Page 38
FFiigguurree 77--33 –– RRPPLLTT 22 EExxaammppllee 22
FFiigguurree 77--44 –– RRPPLLTT 22 EExxaammppllee ((FFrreeqquueennccyy vvss FFiieelldd))
FMRA User’s Manual Integral Solutions Int’l December 8, 2009
Page 39
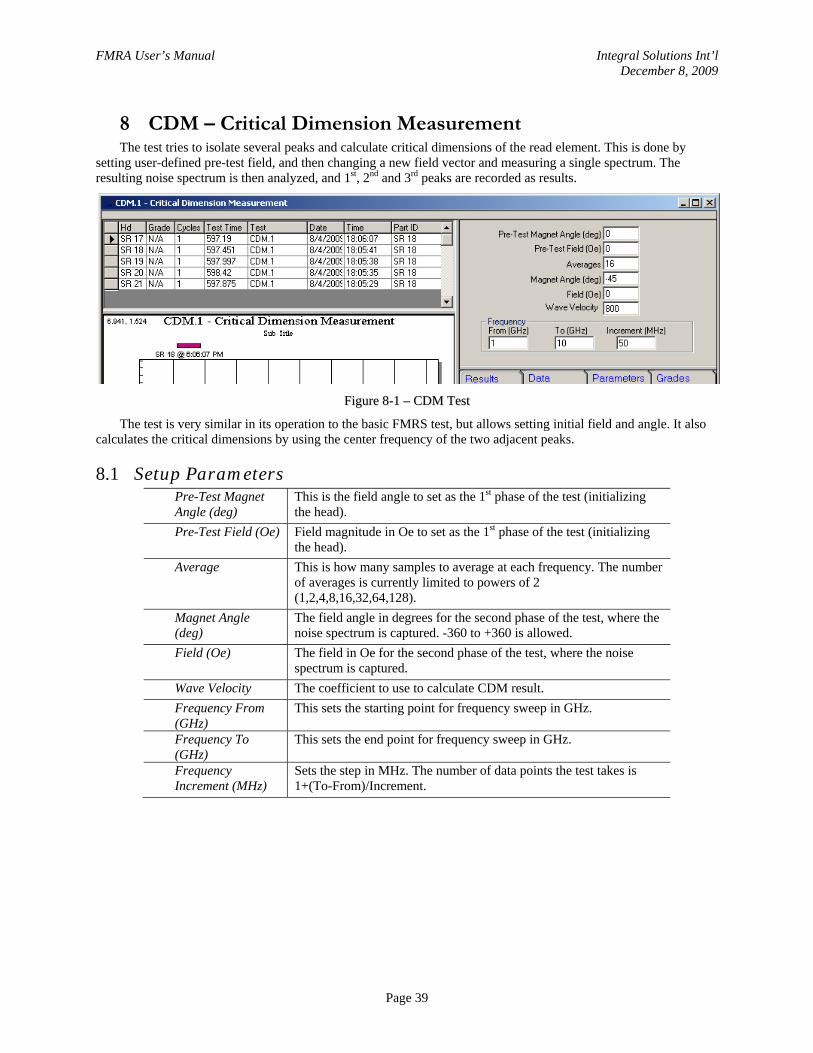
8 CDM – Critical Dimension Measurement The test tries to isolate several peaks and calculate critical dimensions of the read element. This is done by
setting user-defined pre-test field, and then changing a new field vector and measuring a single spectrum. The resulting noise spectrum is then analyzed, and 1st, 2nd and 3rd peaks are recorded as results.
FFiigguurree 88--11 –– CCDDMM TTeesstt
The test is very similar in its operation to the basic FMRS test, but allows setting initial field and angle. It also calculates the critical dimensions by using the center frequency of the two adjacent peaks.
8.1 Setup Parameters Pre-Test Magnet Angle (deg)
This is the field angle to set as the 1st phase of the test (initializing the head).
Pre-Test Field (Oe) Field magnitude in Oe to set as the 1st phase of the test (initializing the head).
Average This is how many samples to average at each frequency. The number of averages is currently limited to powers of 2 (1,2,4,8,16,32,64,128).
Magnet Angle (deg)
The field angle in degrees for the second phase of the test, where the noise spectrum is captured. -360 to +360 is allowed.
Field (Oe) The field in Oe for the second phase of the test, where the noise spectrum is captured.
Wave Velocity The coefficient to use to calculate CDM result. Frequency From (GHz)
This sets the starting point for frequency sweep in GHz.
Frequency To (GHz)
This sets the end point for frequency sweep in GHz.
Frequency Increment (MHz)
Sets the step in MHz. The number of data points the test takes is 1+(To-From)/Increment.
FMRA User’s Manual Integral Solutions Int’l December 8, 2009
Page 40
8.2 Results
MR Resistance (Ohm)
Resistance measured after applying the pre-test field (for reference)
Max Peak Resonance Width (GHz)
The half-width of the peak with maximum integral noise, calculated in power scale. The value is in GHz.
Max Peak Frequency (GHz)
The center frequency of the 1st resonance peak (with maximum integral noise). The value is in GHz.
Max Peak Amplitude (nV)
The amplitude of the resonance peak in /√ , of the 1st peak (with maximum integral noise).
2nd Max Peak Frequency (GHz)
The center frequency of the 2nd resonance peak (to the right of the 1st peak). The value is in GHz.
2nd Max Peak Amplitude (nV)
The amplitude of the resonance peak in /√ , of the 2nd peak (to the right of the 1st peak).
3rd Max Peak Frequency (GHz)
The center frequency of the 3rd resonance peak (to the right of the 2nd peak). The value is in GHz.
3rd Max Peak Amplitude (nV)
The amplitude of the resonance peak in /√ , of the 2nd peak (to the right of the 2nd peak).
Critical Dimension (2)
The calculated result based on 1st and 2nd peak frequencies and wave velocity parameters.
Critical Dimension (3)
The calculated result based on 2nd and 3rd peak frequencies and wave velocity parameters.
User results The user-defined result will be added as raw data column and can be plotted.
Marker This reports the amplitude measured at a given frequency. This result has a single argument, which is frequency in GHz.
Integral Noise This reports the noise integrated between two frequencies. It has two parameters which should be separated by semicolon. First is from frequency and the second is to frequency.
FMRA User’s Manual Integral Solutions Int’l December 8, 2009
Page 41
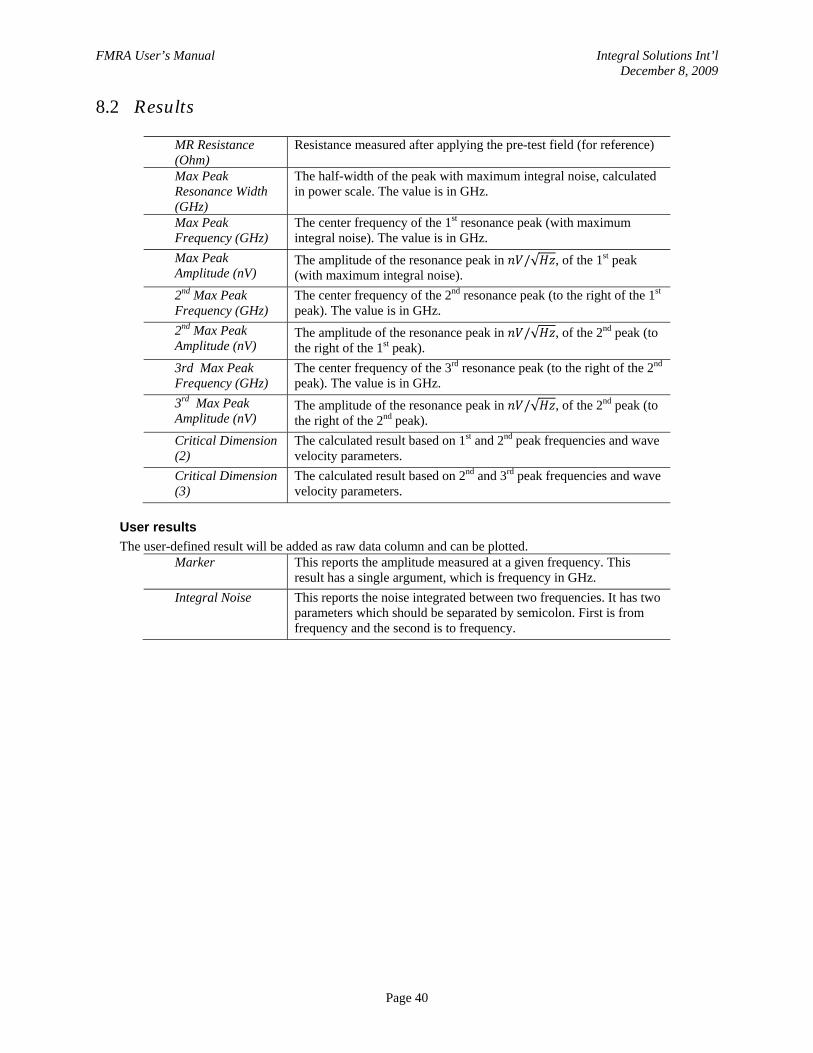
8.3 Example Printout
FFiigguurree 88--22 –– CCDDMM EExxaammppllee PPrriinnttoouutt
FMRA User’s Manual Integral Solutions Int’l December 8, 2009
Page 42
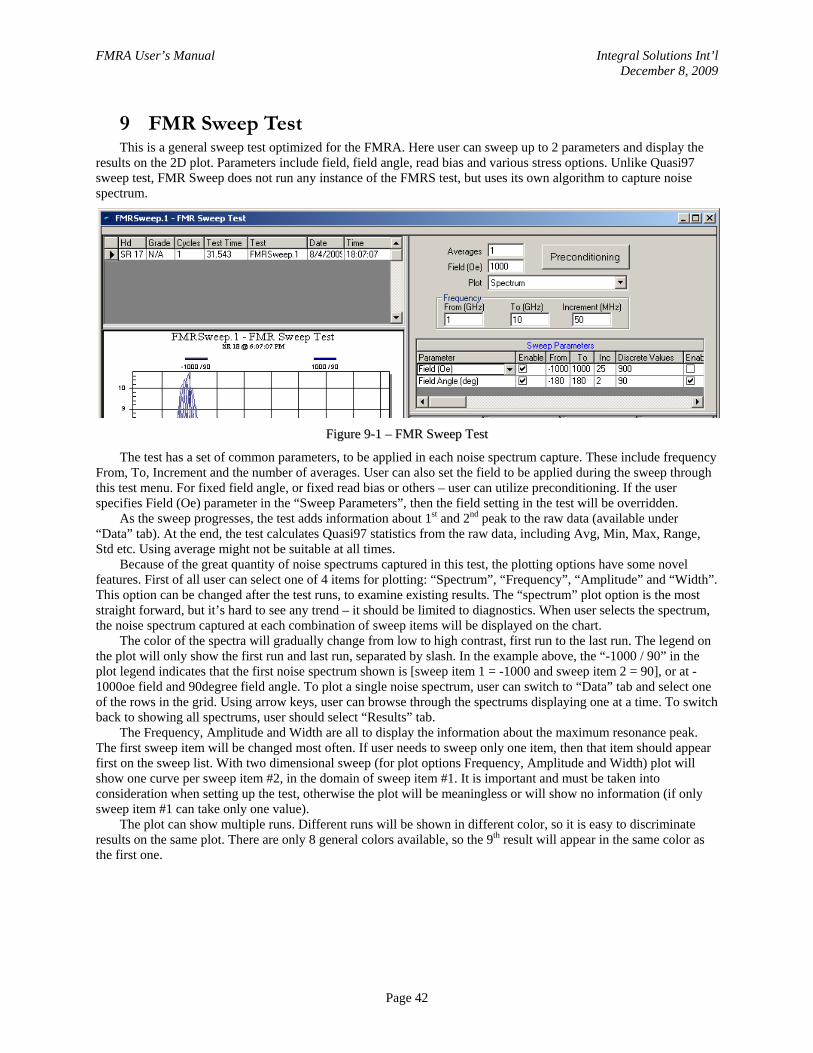
9 FMR Sweep Test This is a general sweep test optimized for the FMRA. Here user can sweep up to 2 parameters and display the
results on the 2D plot. Parameters include field, field angle, read bias and various stress options. Unlike Quasi97 sweep test, FMR Sweep does not run any instance of the FMRS test, but uses its own algorithm to capture noise spectrum.
FFiigguurree 99--11 –– FFMMRR SSwweeeepp TTeesstt
The test has a set of common parameters, to be applied in each noise spectrum capture. These include frequency From, To, Increment and the number of averages. User can also set the field to be applied during the sweep through this test menu. For fixed field angle, or fixed read bias or others – user can utilize preconditioning. If the user specifies Field (Oe) parameter in the “Sweep Parameters”, then the field setting in the test will be overridden.
As the sweep progresses, the test adds information about 1st and 2nd peak to the raw data (available under “Data” tab). At the end, the test calculates Quasi97 statistics from the raw data, including Avg, Min, Max, Range, Std etc. Using average might not be suitable at all times.
Because of the great quantity of noise spectrums captured in this test, the plotting options have some novel features. First of all user can select one of 4 items for plotting: “Spectrum”, “Frequency”, “Amplitude” and “Width”. This option can be changed after the test runs, to examine existing results. The “spectrum” plot option is the most straight forward, but it’s hard to see any trend – it should be limited to diagnostics. When user selects the spectrum, the noise spectrum captured at each combination of sweep items will be displayed on the chart.
The color of the spectra will gradually change from low to high contrast, first run to the last run. The legend on the plot will only show the first run and last run, separated by slash. In the example above, the “-1000 / 90” in the plot legend indicates that the first noise spectrum shown is [sweep item 1 = -1000 and sweep item 2 = 90], or at -1000oe field and 90degree field angle. To plot a single noise spectrum, user can switch to “Data” tab and select one of the rows in the grid. Using arrow keys, user can browse through the spectrums displaying one at a time. To switch back to showing all spectrums, user should select “Results” tab.
The Frequency, Amplitude and Width are all to display the information about the maximum resonance peak. The first sweep item will be changed most often. If user needs to sweep only one item, then that item should appear first on the sweep list. With two dimensional sweep (for plot options Frequency, Amplitude and Width) plot will show one curve per sweep item #2, in the domain of sweep item #1. It is important and must be taken into consideration when setting up the test, otherwise the plot will be meaningless or will show no information (if only sweep item #1 can take only one value).
The plot can show multiple runs. Different runs will be shown in different color, so it is easy to discriminate results on the same plot. There are only 8 general colors available, so the 9th result will appear in the same color as the first one.
FMRA User’s Manual Integral Solutions Int’l December 8, 2009
Page 43
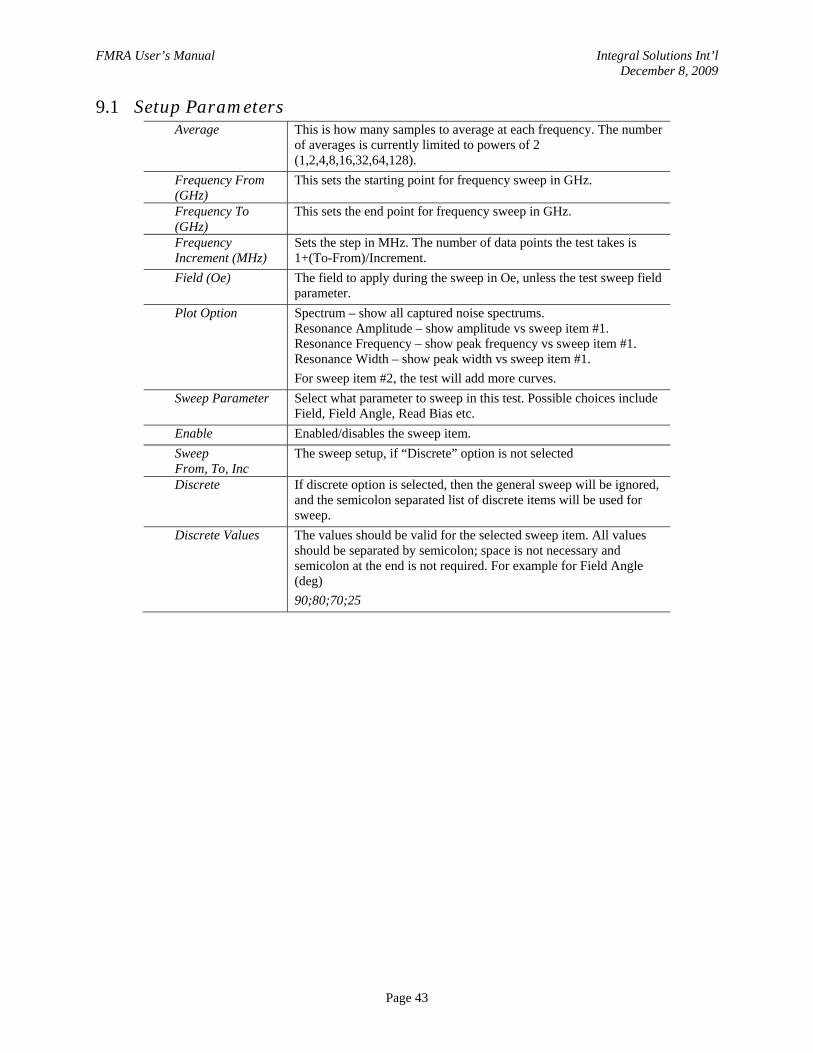
9.1 Setup Parameters Average This is how many samples to average at each frequency. The number
of averages is currently limited to powers of 2 (1,2,4,8,16,32,64,128).
Frequency From (GHz)
This sets the starting point for frequency sweep in GHz.
Frequency To (GHz)
This sets the end point for frequency sweep in GHz.
Frequency Increment (MHz)
Sets the step in MHz. The number of data points the test takes is 1+(To-From)/Increment.
Field (Oe) The field to apply during the sweep in Oe, unless the test sweep field parameter.
Plot Option Spectrum – show all captured noise spectrums. Resonance Amplitude – show amplitude vs sweep item #1. Resonance Frequency – show peak frequency vs sweep item #1. Resonance Width – show peak width vs sweep item #1. For sweep item #2, the test will add more curves.
Sweep Parameter Select what parameter to sweep in this test. Possible choices include Field, Field Angle, Read Bias etc.
Enable Enabled/disables the sweep item. Sweep From, To, Inc
The sweep setup, if “Discrete” option is not selected
Discrete If discrete option is selected, then the general sweep will be ignored, and the semicolon separated list of discrete items will be used for sweep.
Discrete Values The values should be valid for the selected sweep item. All values should be separated by semicolon; space is not necessary and semicolon at the end is not required. For example for Field Angle (deg) 90;80;70;25
FMRA User’s Manual Integral Solutions Int’l December 8, 2009
Page 44
9.2 Results
Max Peak Amplitude
The peak amplitude in /√
Max Peak Frequency
The location of the peak in GHz.
Max Peak Resonance Width
The width in GHz, measured at 50% of the peak amplitude in power scale.
2nd Peak Amplitude The location of the peak in GHz. 2nd Peak Frequency
The location of the second peak to the right of the main peak in GHz. 2nd peak is chosen based on the area under the curve – the higher frequency peak that has a biggest area is chosen.
2nd Peak Width The width of the second peak, calculated at 50% of the peak amplitude in power scale.
MR Resistance (Ohm)
The head resistance before the test (for reference)
Min Frequency sw1
At the end of the test the raw data is scanned and the sweep parameters where minimum peak frequency is observed is calculated. This reports the value of the sweep item #1, where the peak frequency was at minimum.
Min Frequency sw2
At the end of the test the raw data is scanned and the sweep parameters where minimum peak frequency is observed is calculated. This reports the value of the sweep item #2, where the peak frequency was at minimum.
User results Marker This reports the amplitude measured at a given frequency. This
result has a single argument, which is frequency in GHz. Integral Noise This reports the noise integrated between two frequencies. It has two
parameters which should be separated by semicolon. First is from frequency and the second is to frequency.
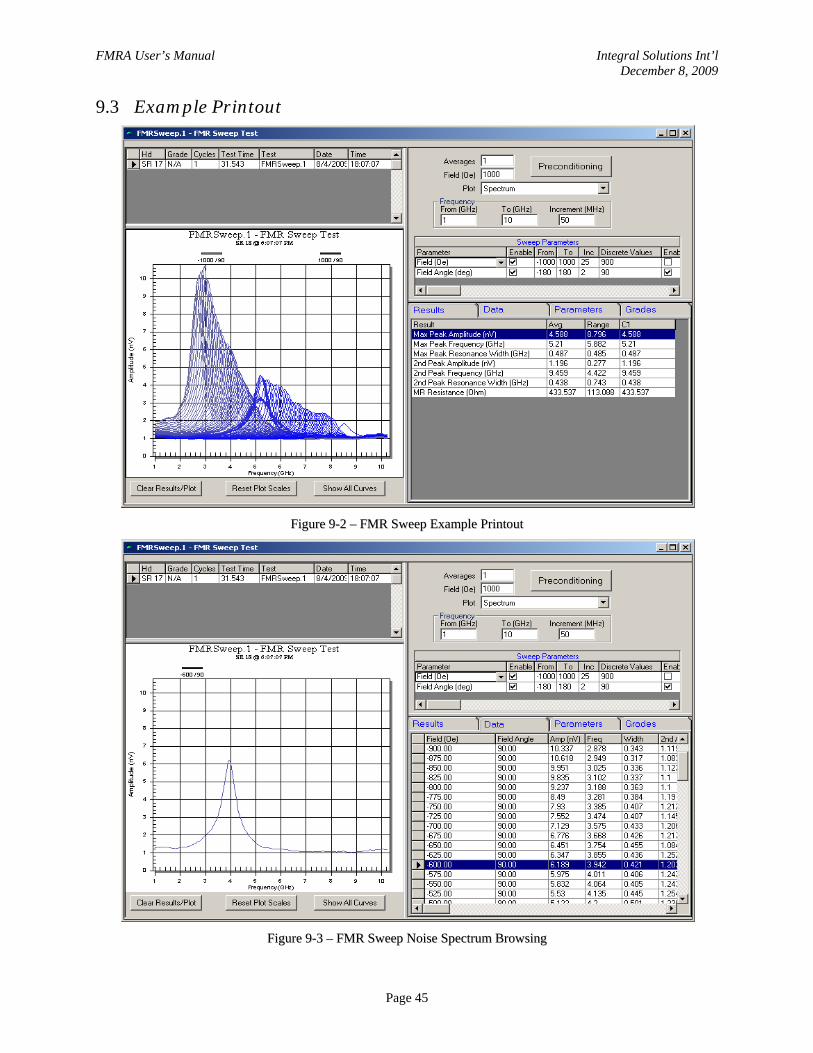
FMRA User’s Manual Integral Solutions Int’l December 8, 2009
Page 45
9.3 Example Printout
FFiigguurree 99--22 –– FFMMRR SSwweeeepp EExxaammppllee PPrriinnttoouutt
FFiigguurree 99--33 –– FFMMRR SSwweeeepp NNooiissee SSppeeccttrruumm BBrroowwssiinngg
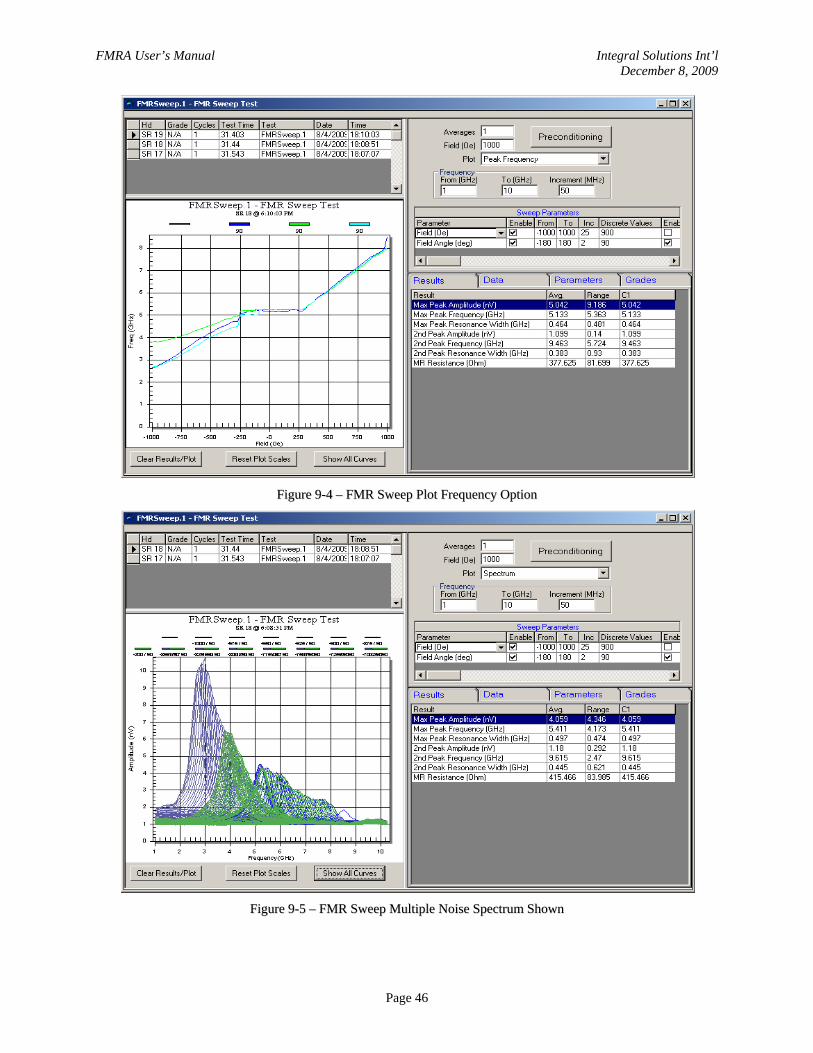
FMRA User’s Manual Integral Solutions Int’l December 8, 2009
Page 46
FFiigguurree 99--44 –– FFMMRR SSwweeeepp PPlloott FFrreeqquueennccyy OOppttiioonn
FFiigguurree 99--55 –– FFMMRR SSwweeeepp MMuullttiippllee NNooiissee SSppeeccttrruumm SShhoowwnn
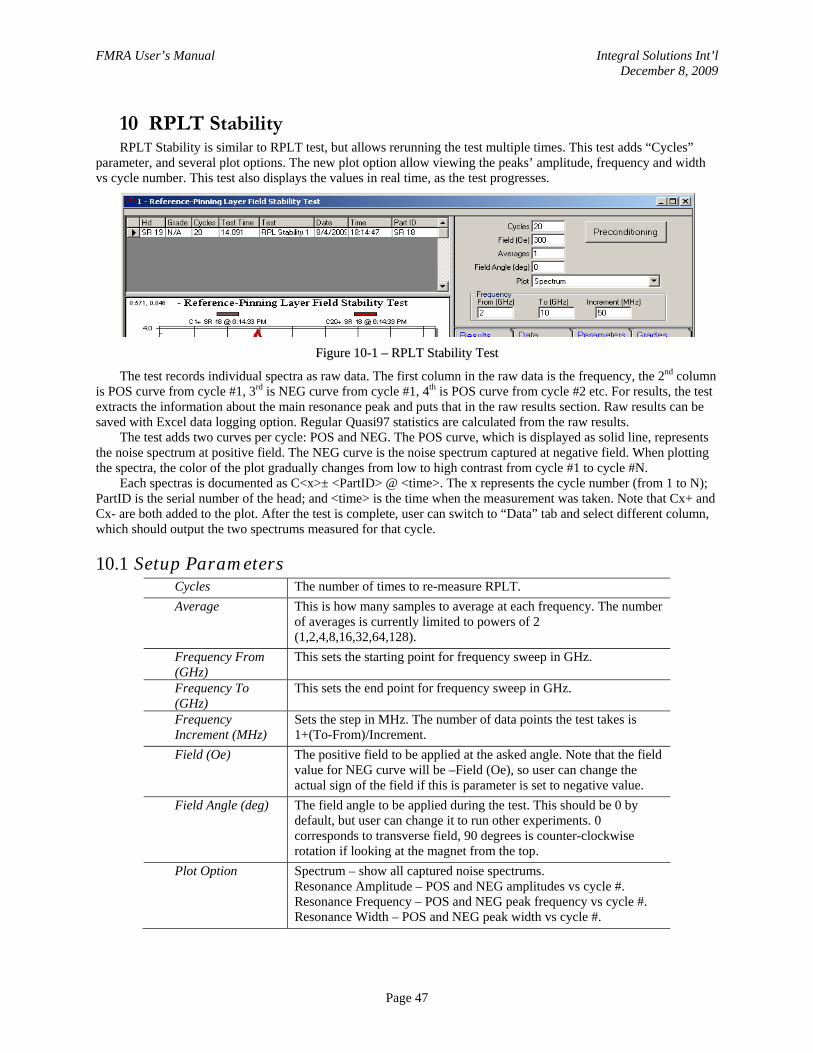
FMRA User’s Manual Integral Solutions Int’l December 8, 2009
Page 47
10 RPLT Stability RPLT Stability is similar to RPLT test, but allows rerunning the test multiple times. This test adds “Cycles”
parameter, and several plot options. The new plot option allow viewing the peaks’ amplitude, frequency and width vs cycle number. This test also displays the values in real time, as the test progresses.
FFiigguurree 1100--11 –– RRPPLLTT SSttaabbiilliittyy TTeesstt
The test records individual spectra as raw data. The first column in the raw data is the frequency, the 2nd column is POS curve from cycle #1, 3rd is NEG curve from cycle #1, 4th is POS curve from cycle #2 etc. For results, the test extracts the information about the main resonance peak and puts that in the raw results section. Raw results can be saved with Excel data logging option. Regular Quasi97 statistics are calculated from the raw results.
The test adds two curves per cycle: POS and NEG. The POS curve, which is displayed as solid line, represents the noise spectrum at positive field. The NEG curve is the noise spectrum captured at negative field. When plotting the spectra, the color of the plot gradually changes from low to high contrast from cycle #1 to cycle #N.
Each spectras is documented as C<x>± <PartID> @ <time>. The x represents the cycle number (from 1 to N); PartID is the serial number of the head; and <time> is the time when the measurement was taken. Note that Cx+ and Cx- are both added to the plot. After the test is complete, user can switch to “Data” tab and select different column, which should output the two spectrums measured for that cycle.
10.1 Setup Parameters Cycles The number of times to re-measure RPLT. Average This is how many samples to average at each frequency. The number
of averages is currently limited to powers of 2 (1,2,4,8,16,32,64,128).
Frequency From (GHz)
This sets the starting point for frequency sweep in GHz.
Frequency To (GHz)
This sets the end point for frequency sweep in GHz.
Frequency Increment (MHz)
Sets the step in MHz. The number of data points the test takes is 1+(To-From)/Increment.
Field (Oe) The positive field to be applied at the asked angle. Note that the field value for NEG curve will be –Field (Oe), so user can change the actual sign of the field if this is parameter is set to negative value.
Field Angle (deg) The field angle to be applied during the test. This should be 0 by default, but user can change it to run other experiments. 0 corresponds to transverse field, 90 degrees is counter-clockwise rotation if looking at the magnet from the top.
Plot Option Spectrum – show all captured noise spectrums. Resonance Amplitude – POS and NEG amplitudes vs cycle #. Resonance Frequency – POS and NEG peak frequency vs cycle #. Resonance Width – POS and NEG peak width vs cycle #.
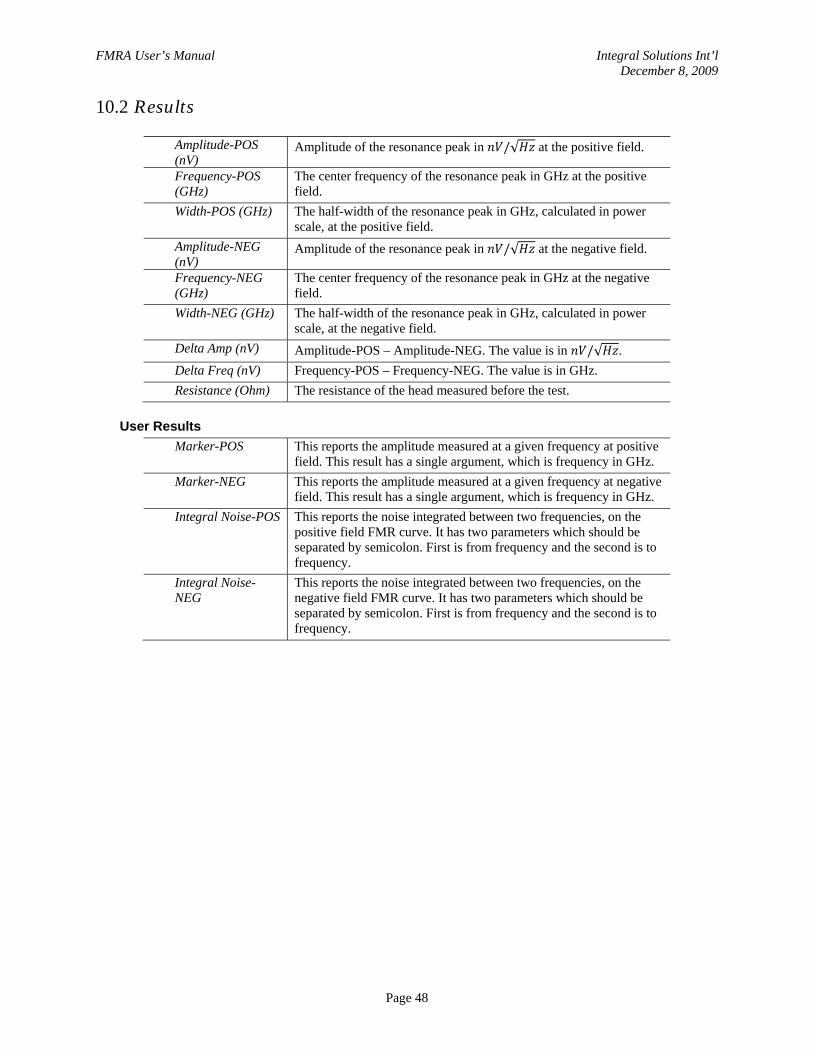
FMRA User’s Manual Integral Solutions Int’l December 8, 2009
Page 48
10.2 Results
Amplitude-POS (nV)
Amplitude of the resonance peak in /√ at the positive field.
Frequency-POS (GHz)
The center frequency of the resonance peak in GHz at the positive field.
Width-POS (GHz) The half-width of the resonance peak in GHz, calculated in power scale, at the positive field.
Amplitude-NEG (nV)
Amplitude of the resonance peak in /√ at the negative field.
Frequency-NEG (GHz)
The center frequency of the resonance peak in GHz at the negative field.
Width-NEG (GHz) The half-width of the resonance peak in GHz, calculated in power scale, at the negative field.
Delta Amp (nV) Amplitude-POS – Amplitude-NEG. The value is in /√ . Delta Freq (nV) Frequency-POS – Frequency-NEG. The value is in GHz. Resistance (Ohm) The resistance of the head measured before the test.
User Results Marker-POS This reports the amplitude measured at a given frequency at positive
field. This result has a single argument, which is frequency in GHz. Marker-NEG This reports the amplitude measured at a given frequency at negative
field. This result has a single argument, which is frequency in GHz. Integral Noise-POS This reports the noise integrated between two frequencies, on the
positive field FMR curve. It has two parameters which should be separated by semicolon. First is from frequency and the second is to frequency.
Integral Noise-NEG
This reports the noise integrated between two frequencies, on the negative field FMR curve. It has two parameters which should be separated by semicolon. First is from frequency and the second is to frequency.
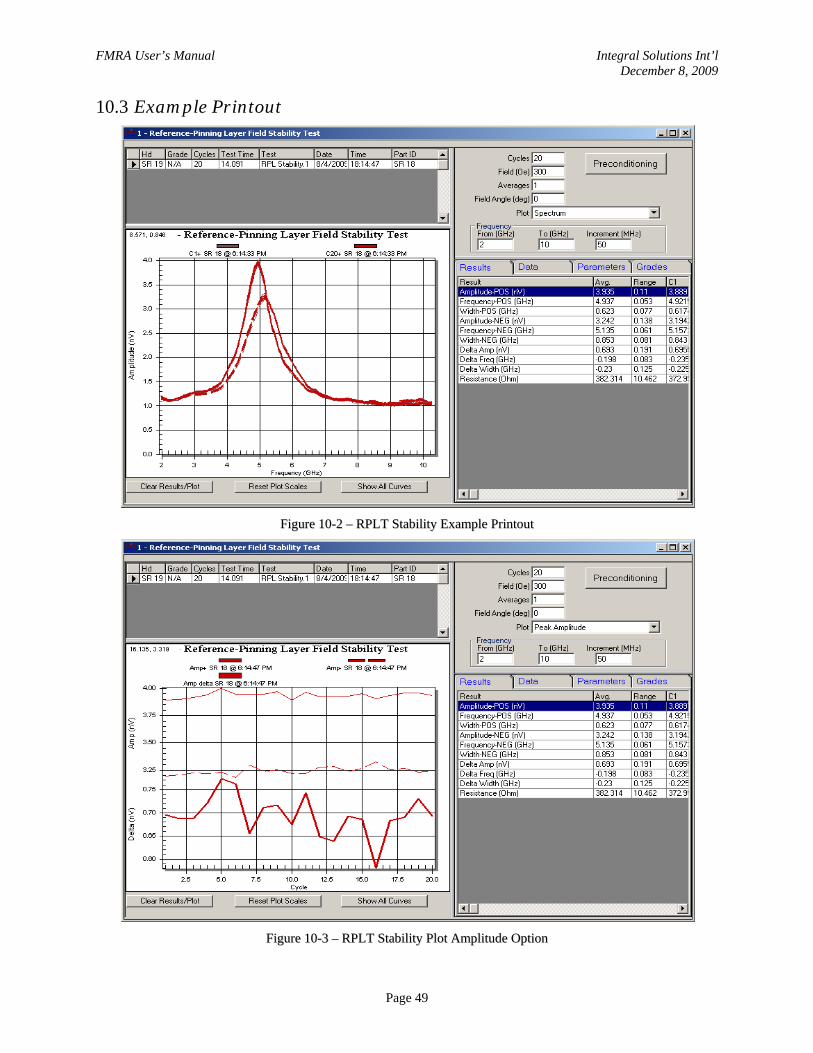
FMRA User’s Manual Integral Solutions Int’l December 8, 2009
Page 49
10.3 Example Printout
FFiigguurree 1100--22 –– RRPPLLTT SSttaabbiilliittyy EExxaammppllee PPrriinnttoouutt
FFiigguurree 1100--33 –– RRPPLLTT SSttaabbiilliittyy PPlloott AAmmpplliittuuddee OOppttiioonn
FMRA User’s Manual Integral Solutions Int’l December 8, 2009
Page 50
FFiigguurree 1100--44 –– RRPPLLTT SSttaabbiilliittyy BBrroowwssiinngg NNooiissee SSppeeccttrruumm
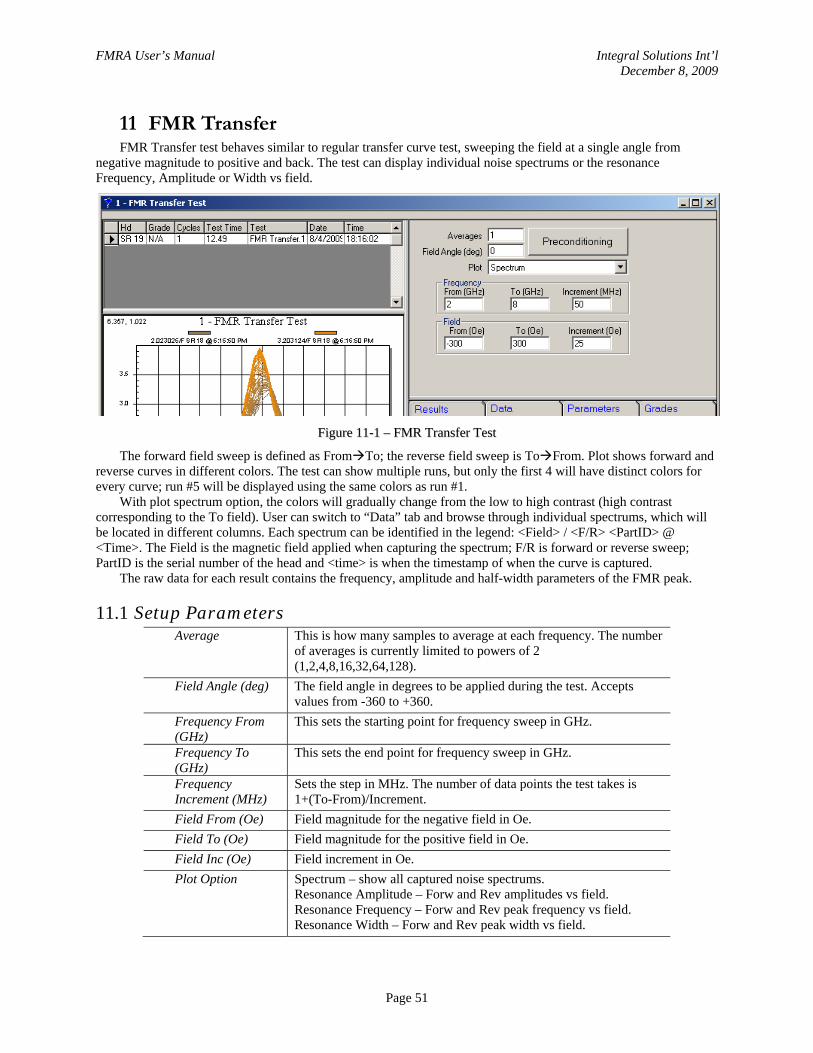
FMRA User’s Manual Integral Solutions Int’l December 8, 2009
Page 51
11 FMR Transfer FMR Transfer test behaves similar to regular transfer curve test, sweeping the field at a single angle from
negative magnitude to positive and back. The test can display individual noise spectrums or the resonance Frequency, Amplitude or Width vs field.
FFiigguurree 1111--11 –– FFMMRR TTrraannssffeerr TTeesstt
The forward field sweep is defined as From To; the reverse field sweep is To From. Plot shows forward and reverse curves in different colors. The test can show multiple runs, but only the first 4 will have distinct colors for every curve; run #5 will be displayed using the same colors as run #1.
With plot spectrum option, the colors will gradually change from the low to high contrast (high contrast corresponding to the To field). User can switch to “Data” tab and browse through individual spectrums, which will be located in different columns. Each spectrum can be identified in the legend: <Field> / <F/R> <PartID> @ <Time>. The Field is the magnetic field applied when capturing the spectrum; F/R is forward or reverse sweep; PartID is the serial number of the head and <time> is when the timestamp of when the curve is captured.
The raw data for each result contains the frequency, amplitude and half-width parameters of the FMR peak.
11.1 Setup Parameters Average This is how many samples to average at each frequency. The number
of averages is currently limited to powers of 2 (1,2,4,8,16,32,64,128).
Field Angle (deg) The field angle in degrees to be applied during the test. Accepts values from -360 to +360.
Frequency From (GHz)
This sets the starting point for frequency sweep in GHz.
Frequency To (GHz)
This sets the end point for frequency sweep in GHz.
Frequency Increment (MHz)
Sets the step in MHz. The number of data points the test takes is 1+(To-From)/Increment.
Field From (Oe) Field magnitude for the negative field in Oe. Field To (Oe) Field magnitude for the positive field in Oe. Field Inc (Oe) Field increment in Oe. Plot Option Spectrum – show all captured noise spectrums.
Resonance Amplitude – Forw and Rev amplitudes vs field. Resonance Frequency – Forw and Rev peak frequency vs field. Resonance Width – Forw and Rev peak width vs field.
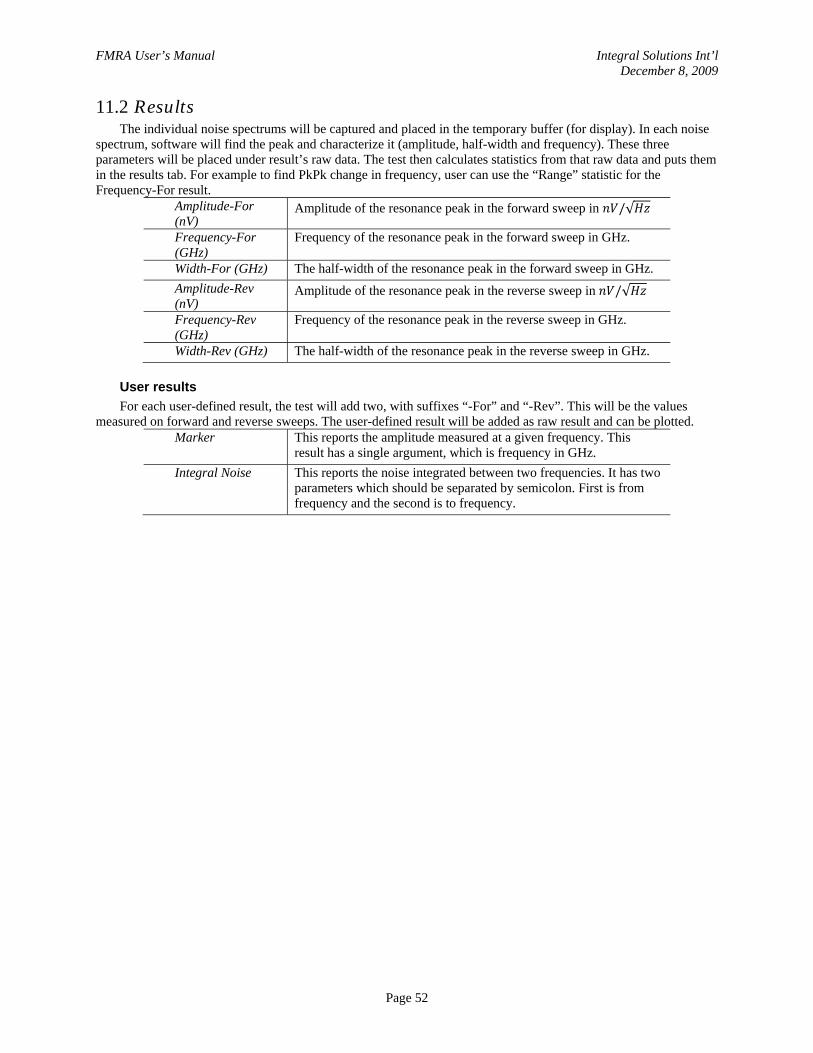
FMRA User’s Manual Integral Solutions Int’l December 8, 2009
Page 52
11.2 Results The individual noise spectrums will be captured and placed in the temporary buffer (for display). In each noise
spectrum, software will find the peak and characterize it (amplitude, half-width and frequency). These three parameters will be placed under result’s raw data. The test then calculates statistics from that raw data and puts them in the results tab. For example to find PkPk change in frequency, user can use the “Range” statistic for the Frequency-For result.
Amplitude-For (nV)
Amplitude of the resonance peak in the forward sweep in /√
Frequency-For (GHz)
Frequency of the resonance peak in the forward sweep in GHz.
Width-For (GHz) The half-width of the resonance peak in the forward sweep in GHz. Amplitude-Rev (nV)
Amplitude of the resonance peak in the reverse sweep in /√
Frequency-Rev (GHz)
Frequency of the resonance peak in the reverse sweep in GHz.
Width-Rev (GHz) The half-width of the resonance peak in the reverse sweep in GHz.
User results For each user-defined result, the test will add two, with suffixes “-For” and “-Rev”. This will be the values
measured on forward and reverse sweeps. The user-defined result will be added as raw result and can be plotted. Marker This reports the amplitude measured at a given frequency. This
result has a single argument, which is frequency in GHz. Integral Noise This reports the noise integrated between two frequencies. It has two
parameters which should be separated by semicolon. First is from frequency and the second is to frequency.
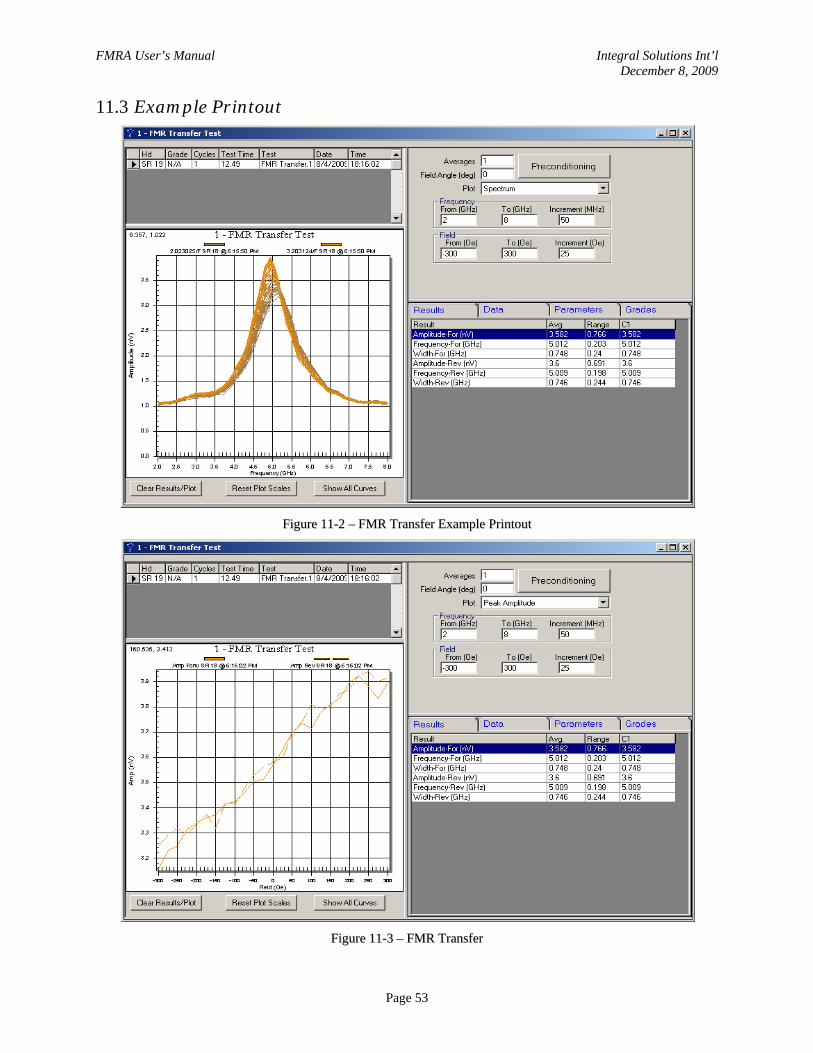
FMRA User’s Manual Integral Solutions Int’l December 8, 2009
Page 53
11.3 Example Printout
FFiigguurree 1111--22 –– FFMMRR TTrraannssffeerr EExxaammppllee PPrriinnttoouutt
FFiigguurree 1111--33 –– FFMMRR TTrraannssffeerr
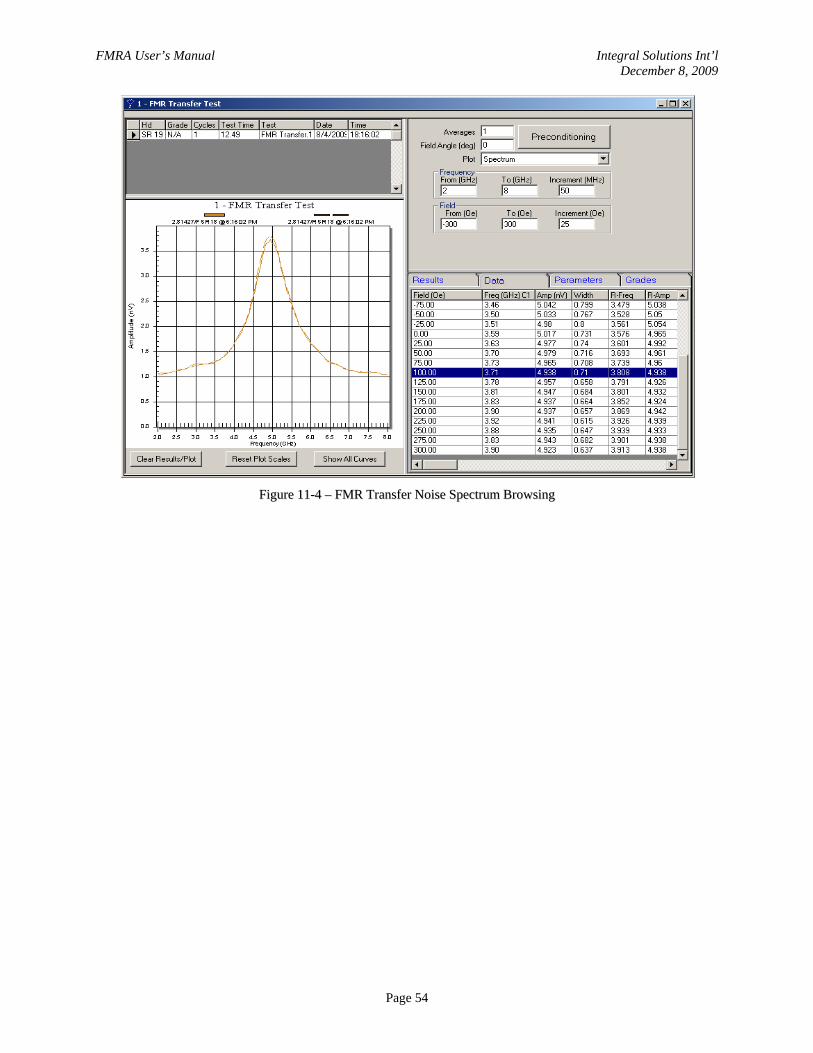
FMRA User’s Manual Integral Solutions Int’l December 8, 2009
Page 54
FFiigguurree 1111--44 –– FFMMRR TTrraannssffeerr NNooiissee SSppeeccttrruumm BBrroowwssiinngg
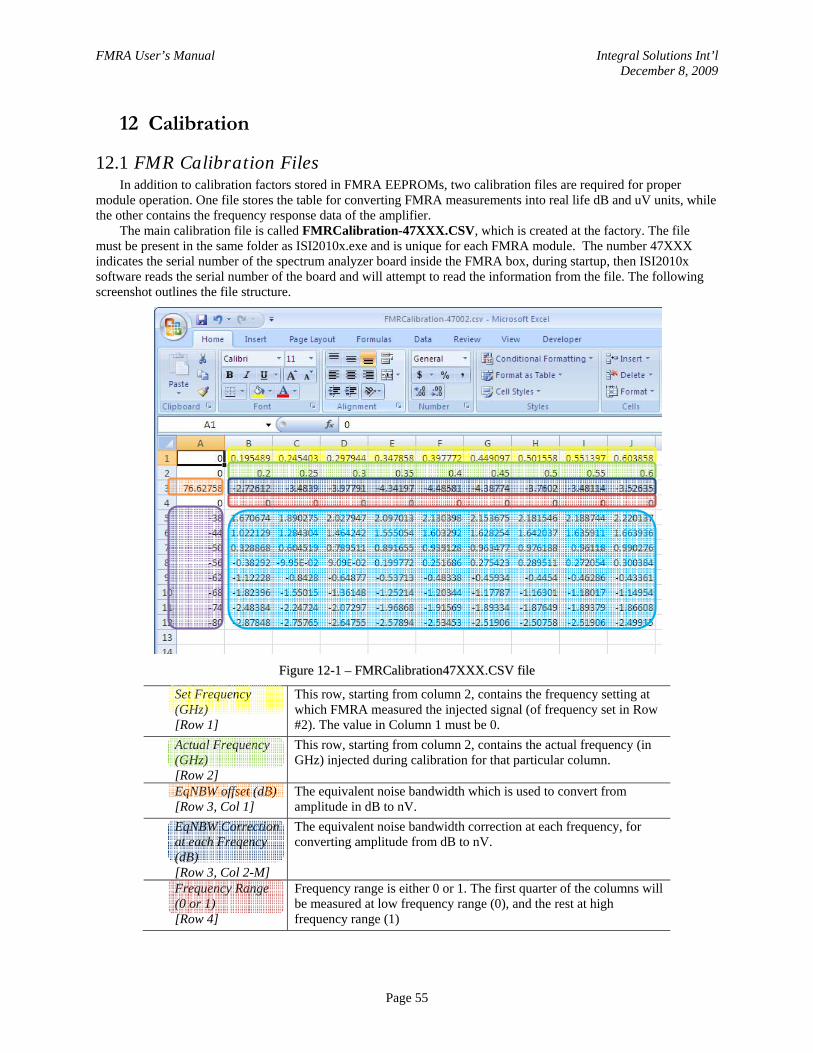
FMRA User’s Manual Integral Solutions Int’l December 8, 2009
Page 55
12 Calibration
12.1 FMR Calibration Files In addition to calibration factors stored in FMRA EEPROMs, two calibration files are required for proper
module operation. One file stores the table for converting FMRA measurements into real life dB and uV units, while the other contains the frequency response data of the amplifier.
The main calibration file is called FMRCalibration-47XXX.CSV, which is created at the factory. The file must be present in the same folder as ISI2010x.exe and is unique for each FMRA module. The number 47XXX indicates the serial number of the spectrum analyzer board inside the FMRA box, during startup, then ISI2010x software reads the serial number of the board and will attempt to read the information from the file. The following screenshot outlines the file structure.
FFiigguurree 1122--11 –– FFMMRRCCaalliibbrraattiioonn4477XXXXXX..CCSSVV ffiillee
Set Frequency (GHz) [Row 1]
This row, starting from column 2, contains the frequency setting at which FMRA measured the injected signal (of frequency set in Row #2). The value in Column 1 must be 0.
Actual Frequency (GHz) [Row 2]
This row, starting from column 2, contains the actual frequency (in GHz) injected during calibration for that particular column.
EqNBW offset (dB) [Row 3, Col 1]
The equivalent noise bandwidth which is used to convert from amplitude in dB to nV.
EqNBW Correction at each Freqency (dB) [Row 3, Col 2-M]
The equivalent noise bandwidth correction at each frequency, for converting amplitude from dB to nV.
Frequency Range (0 or 1) [Row 4]
Frequency range is either 0 or 1. The first quarter of the columns will be measured at low frequency range (0), and the rest at high frequency range (1)

FMRA User’s Manual Integral Solutions Int’l December 8, 2009
Page 56
Amplitude of Injected Signal (dB) [Col 1, Row 5-N]
This is the amplitude (level) in dB of the injected signal during calibration.
Signal magnitude (V), measured by spectrum analyzer [Col 2, Row 5-N]
The data in these cells represents the peak amplitude measured at each frequency and corresponding signal level.
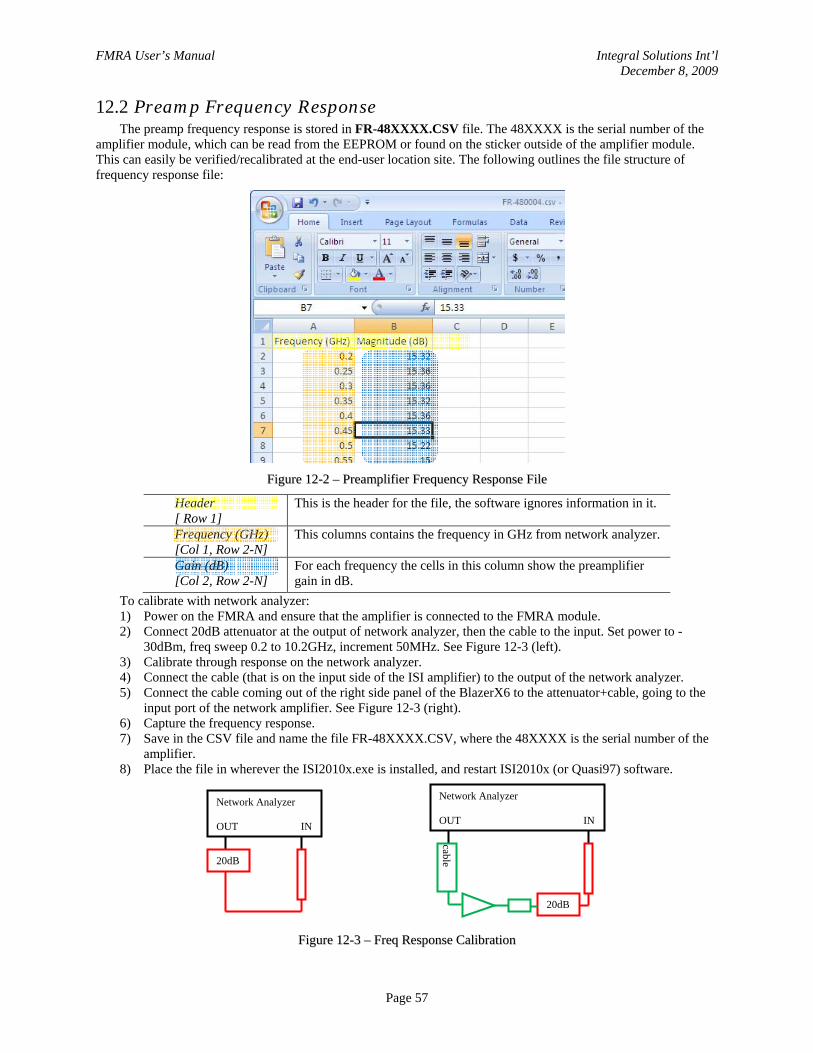
FMRA User’s Manual Integral Solutions Int’l December 8, 2009
Page 57
12.2 Preamp Frequency Response The preamp frequency response is stored in FR-48XXXX.CSV file. The 48XXXX is the serial number of the
amplifier module, which can be read from the EEPROM or found on the sticker outside of the amplifier module. This can easily be verified/recalibrated at the end-user location site. The following outlines the file structure of frequency response file:
FFiigguurree 1122--22 –– PPrreeaammpplliiffiieerr FFrreeqquueennccyy RReessppoonnssee FFiillee
Header [ Row 1]
This is the header for the file, the software ignores information in it.
Frequency (GHz) [Col 1, Row 2-N]
This columns contains the frequency in GHz from network analyzer.
Gain (dB) [Col 2, Row 2-N]
For each frequency the cells in this column show the preamplifier gain in dB.
To calibrate with network analyzer: 1) Power on the FMRA and ensure that the amplifier is connected to the FMRA module. 2) Connect 20dB attenuator at the output of network analyzer, then the cable to the input. Set power to -
30dBm, freq sweep 0.2 to 10.2GHz, increment 50MHz. See Figure 12-3 (left). 3) Calibrate through response on the network analyzer. 4) Connect the cable (that is on the input side of the ISI amplifier) to the output of the network analyzer. 5) Connect the cable coming out of the right side panel of the BlazerX6 to the attenuator+cable, going to the
input port of the network amplifier. See Figure 12-3 (right). 6) Capture the frequency response. 7) Save in the CSV file and name the file FR-48XXXX.CSV, where the 48XXXX is the serial number of the
amplifier. 8) Place the file in wherever the ISI2010x.exe is installed, and restart ISI2010x (or Quasi97) software.
Network Analyzer OUT IN
20dB
cable
Network Analyzer OUT IN
20dB
FFiigguurree 1122--33 –– FFrreeqq RReessppoonnssee CCaalliibbrraattiioonn
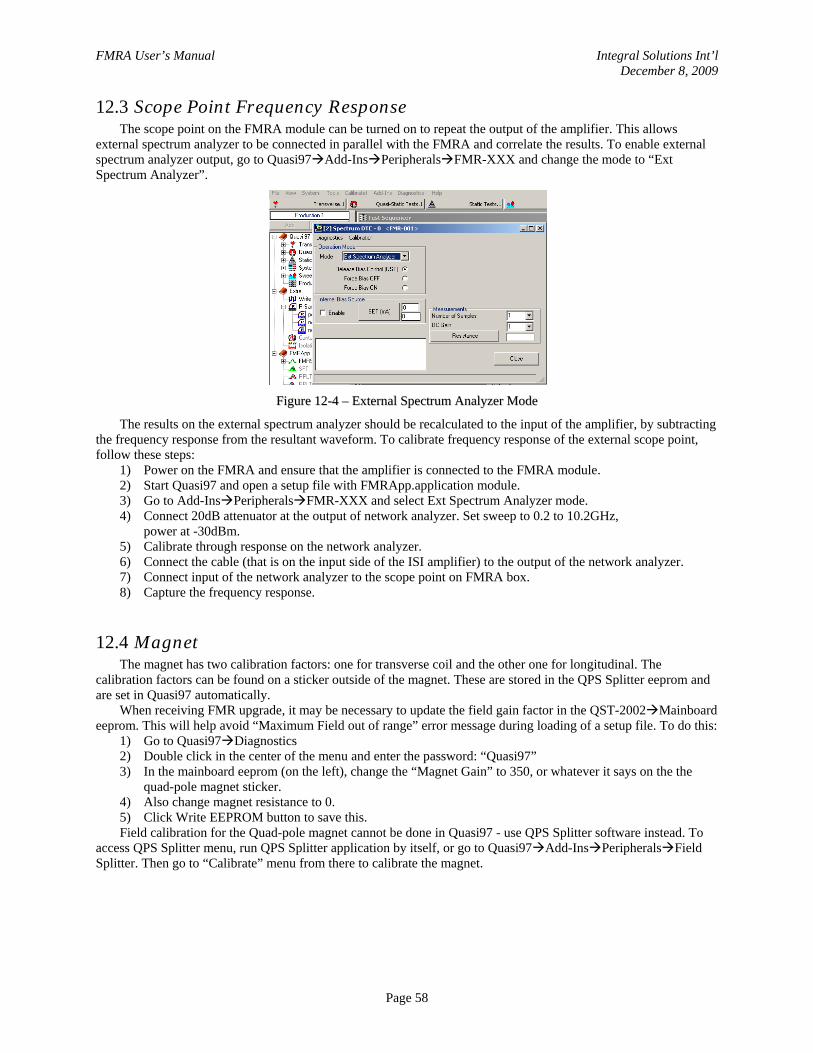
FMRA User’s Manual Integral Solutions Int’l December 8, 2009
Page 58
12.3 Scope Point Frequency Response The scope point on the FMRA module can be turned on to repeat the output of the amplifier. This allows
external spectrum analyzer to be connected in parallel with the FMRA and correlate the results. To enable external spectrum analyzer output, go to Quasi97 Add-Ins Peripherals FMR-XXX and change the mode to “Ext Spectrum Analyzer”.
FFiigguurree 1122--44 –– EExxtteerrnnaall SSppeeccttrruumm AAnnaallyyzzeerr MMooddee
The results on the external spectrum analyzer should be recalculated to the input of the amplifier, by subtracting the frequency response from the resultant waveform. To calibrate frequency response of the external scope point, follow these steps:
1) Power on the FMRA and ensure that the amplifier is connected to the FMRA module. 2) Start Quasi97 and open a setup file with FMRApp.application module. 3) Go to Add-Ins Peripherals FMR-XXX and select Ext Spectrum Analyzer mode. 4) Connect 20dB attenuator at the output of network analyzer. Set sweep to 0.2 to 10.2GHz,
power at -30dBm. 5) Calibrate through response on the network analyzer. 6) Connect the cable (that is on the input side of the ISI amplifier) to the output of the network analyzer. 7) Connect input of the network analyzer to the scope point on FMRA box. 8) Capture the frequency response.
12.4 Magnet The magnet has two calibration factors: one for transverse coil and the other one for longitudinal. The
calibration factors can be found on a sticker outside of the magnet. These are stored in the QPS Splitter eeprom and are set in Quasi97 automatically.
When receiving FMR upgrade, it may be necessary to update the field gain factor in the QST-2002 Mainboard eeprom. This will help avoid “Maximum Field out of range” error message during loading of a setup file. To do this:
1) Go to Quasi97 Diagnostics 2) Double click in the center of the menu and enter the password: “Quasi97” 3) In the mainboard eeprom (on the left), change the “Magnet Gain” to 350, or whatever it says on the the
quad-pole magnet sticker. 4) Also change magnet resistance to 0. 5) Click Write EEPROM button to save this. Field calibration for the Quad-pole magnet cannot be done in Quasi97 - use QPS Splitter software instead. To
access QPS Splitter menu, run QPS Splitter application by itself, or go to Quasi97 Add-Ins Peripherals Field Splitter. Then go to “Calibrate” menu from there to calibrate the magnet.
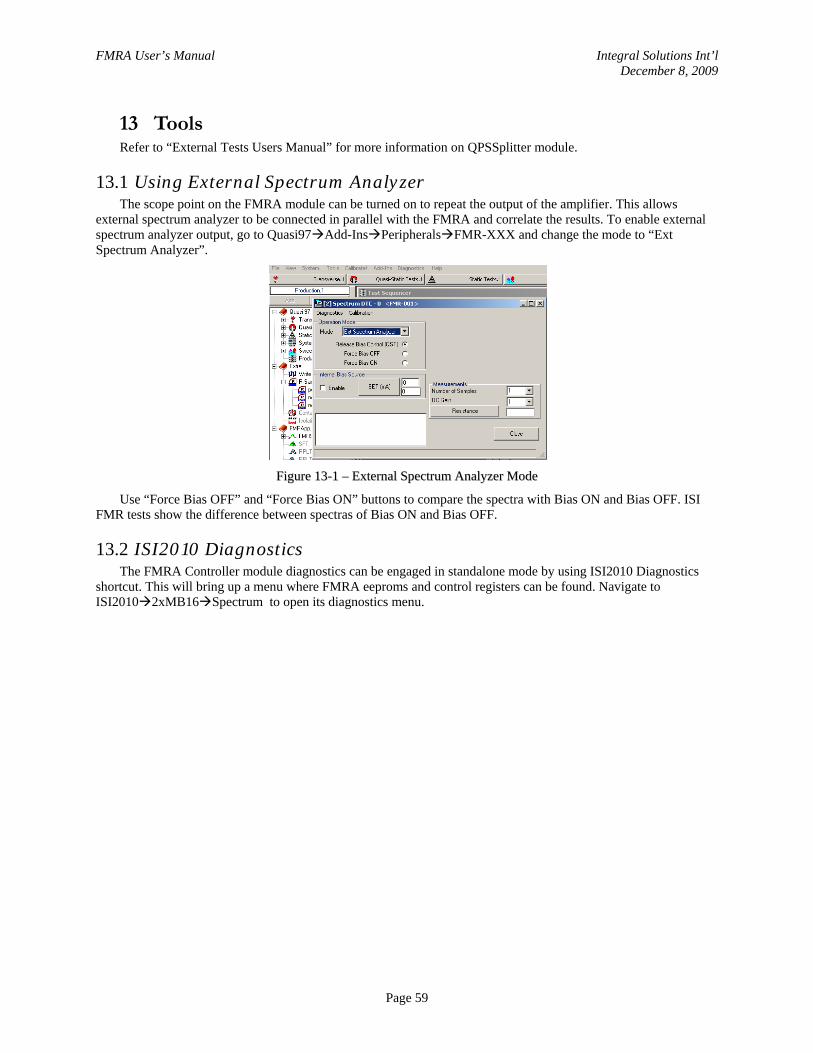
FMRA User’s Manual Integral Solutions Int’l December 8, 2009
Page 59
13 Tools Refer to “External Tests Users Manual” for more information on QPSSplitter module.
13.1 Using External Spectrum Analyzer The scope point on the FMRA module can be turned on to repeat the output of the amplifier. This allows
external spectrum analyzer to be connected in parallel with the FMRA and correlate the results. To enable external spectrum analyzer output, go to Quasi97 Add-Ins Peripherals FMR-XXX and change the mode to “Ext Spectrum Analyzer”.
FFiigguurree 1133--11 –– EExxtteerrnnaall SSppeeccttrruumm AAnnaallyyzzeerr MMooddee
Use “Force Bias OFF” and “Force Bias ON” buttons to compare the spectra with Bias ON and Bias OFF. ISI FMR tests show the difference between spectras of Bias ON and Bias OFF.
13.2 ISI2010 Diagnostics The FMRA Controller module diagnostics can be engaged in standalone mode by using ISI2010 Diagnostics
shortcut. This will bring up a menu where FMRA eeproms and control registers can be found. Navigate to ISI2010 2xMB16 Spectrum to open its diagnostics menu.
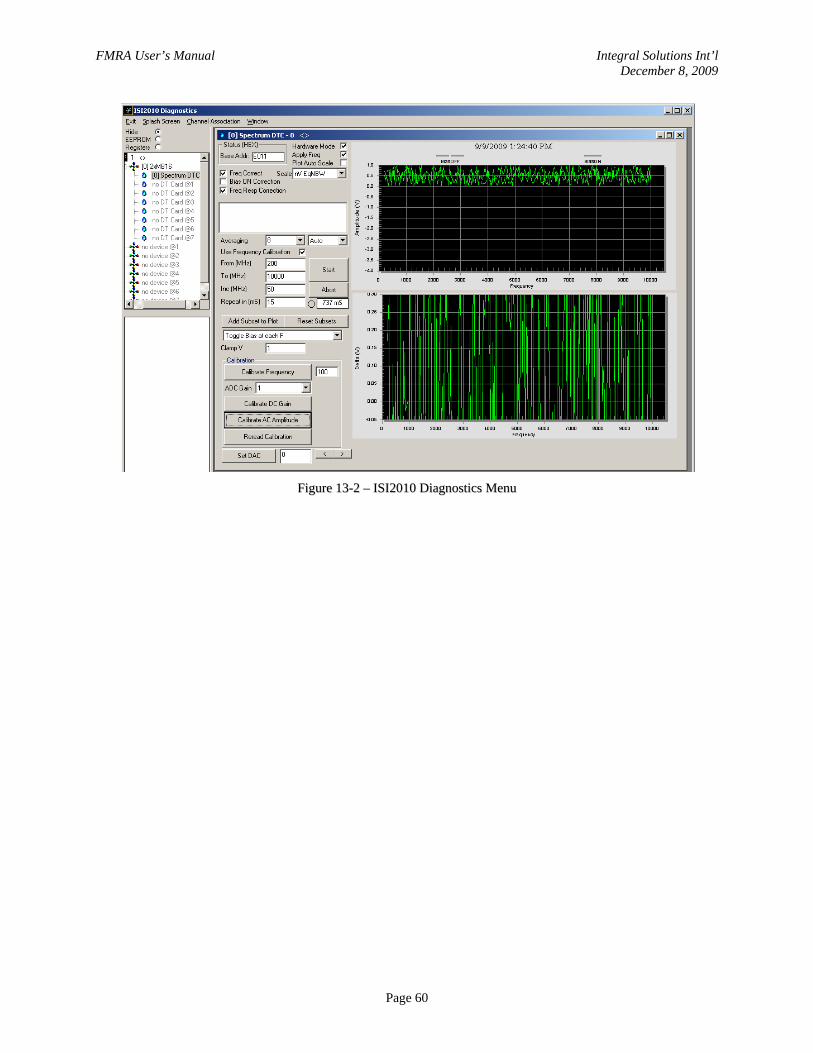
FMRA User’s Manual Integral Solutions Int’l December 8, 2009
Page 60
FFiigguurree 1133--22 –– IISSII22001100 DDiiaaggnnoossttiiccss MMeennuu
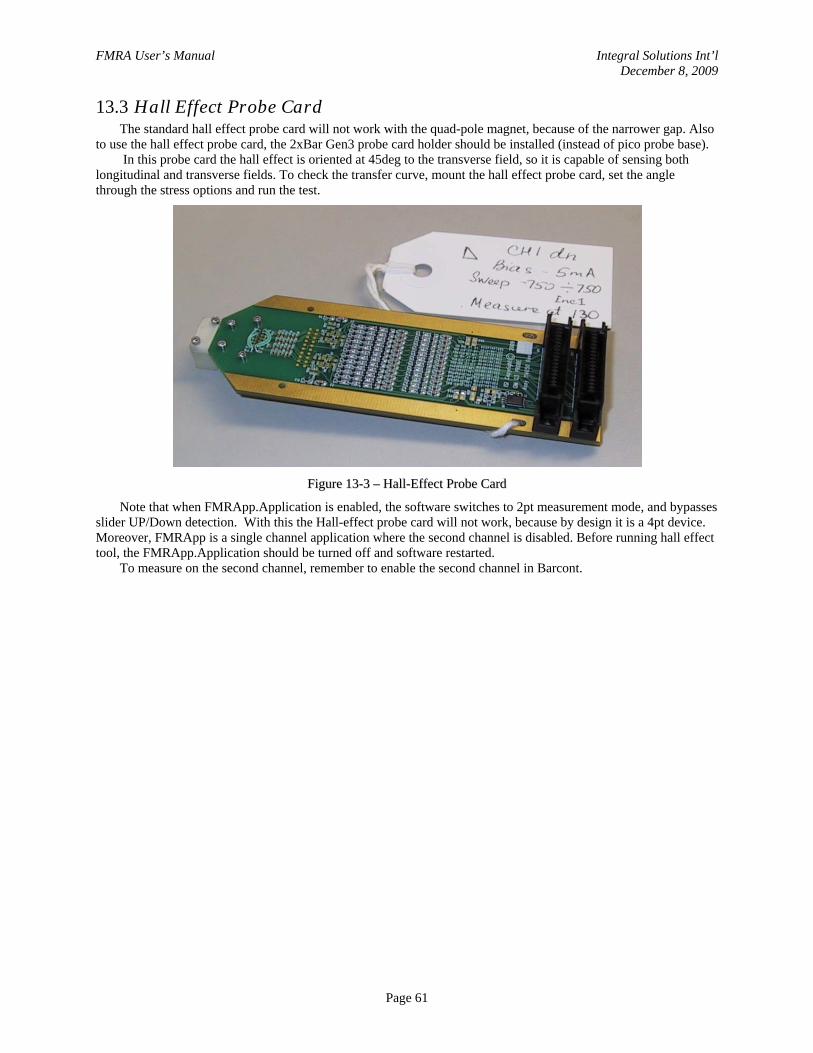
FMRA User’s Manual Integral Solutions Int’l December 8, 2009
Page 61
13.3 Hall Effect Probe Card The standard hall effect probe card will not work with the quad-pole magnet, because of the narrower gap. Also
to use the hall effect probe card, the 2xBar Gen3 probe card holder should be installed (instead of pico probe base). In this probe card the hall effect is oriented at 45deg to the transverse field, so it is capable of sensing both
longitudinal and transverse fields. To check the transfer curve, mount the hall effect probe card, set the angle through the stress options and run the test.
FFiigguurree 1133--33 –– HHaallll--EEffffeecctt PPrroobbee CCaarrdd
Note that when FMRApp.Application is enabled, the software switches to 2pt measurement mode, and bypasses slider UP/Down detection. With this the Hall-effect probe card will not work, because by design it is a 4pt device. Moreover, FMRApp is a single channel application where the second channel is disabled. Before running hall effect tool, the FMRApp.Application should be turned off and software restarted.
To measure on the second channel, remember to enable the second channel in Barcont.
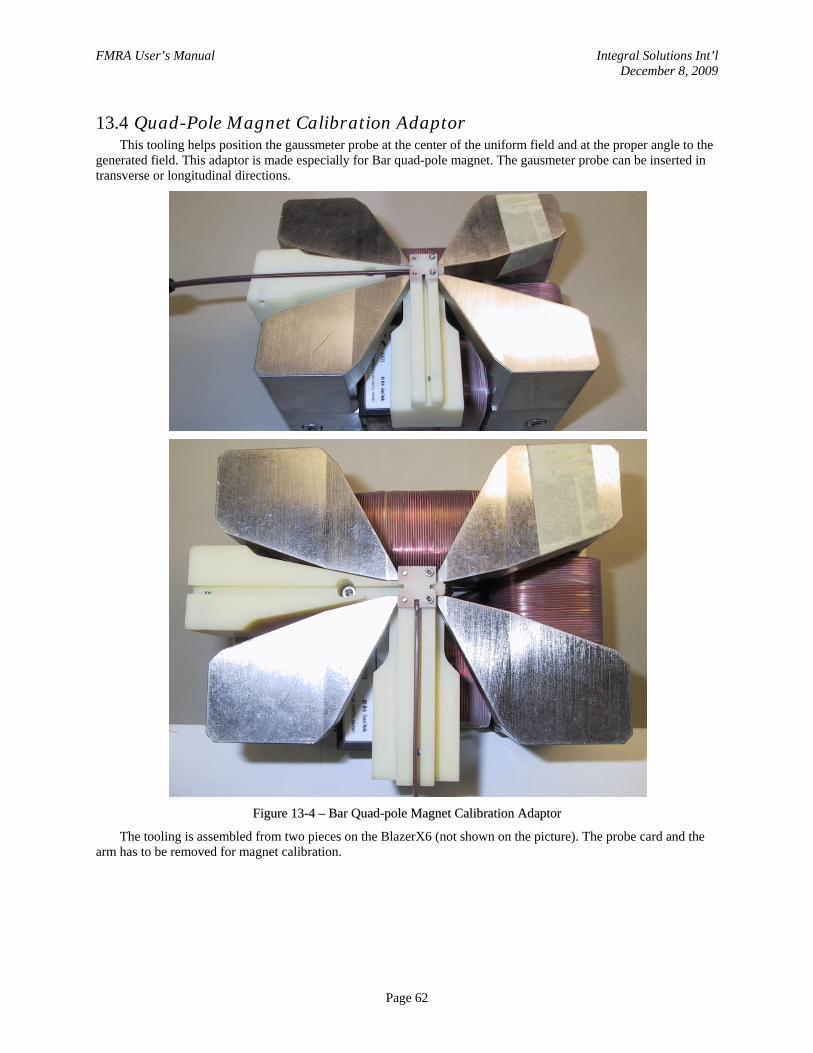
FMRA User’s Manual Integral Solutions Int’l December 8, 2009
Page 62
13.4 Quad-Pole Magnet Calibration Adaptor This tooling helps position the gaussmeter probe at the center of the uniform field and at the proper angle to the
generated field. This adaptor is made especially for Bar quad-pole magnet. The gausmeter probe can be inserted in transverse or longitudinal directions.
FFiigguurree 1133--44 –– BBaarr QQuuaadd--ppoollee MMaaggnneett CCaalliibbrraattiioonn AAddaappttoorr
The tooling is assembled from two pieces on the BlazerX6 (not shown on the picture). The probe card and the arm has to be removed for magnet calibration.
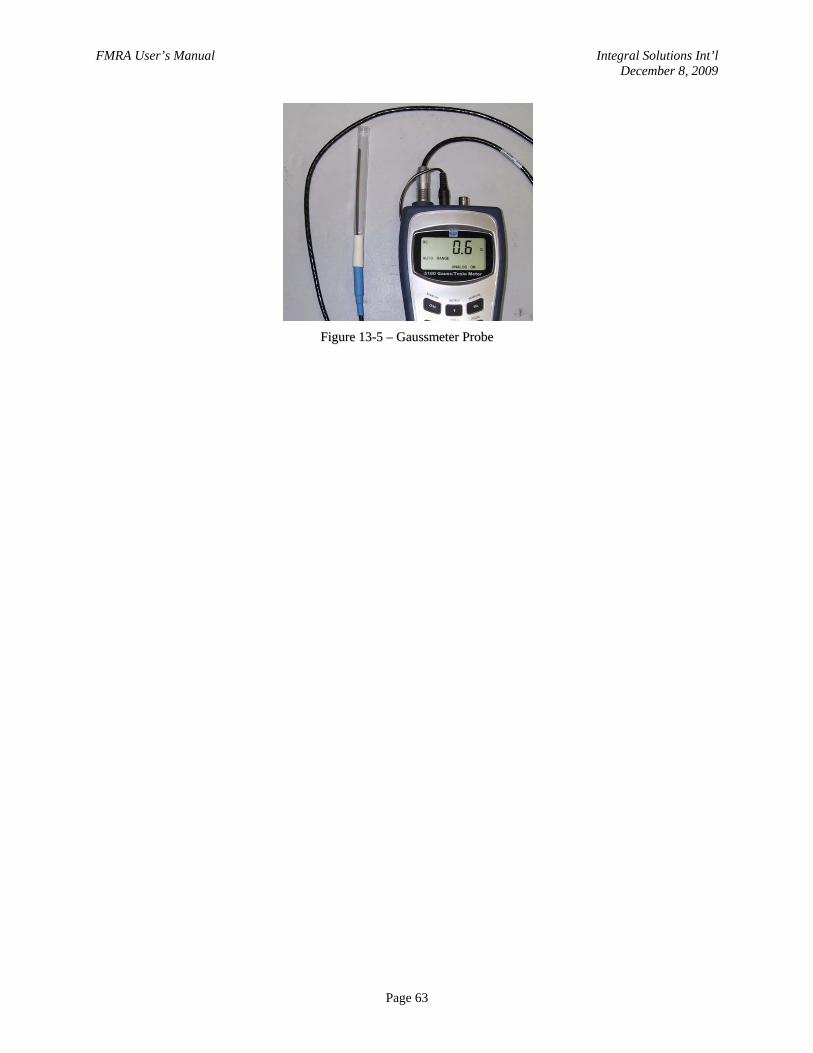
FMRA User’s Manual Integral Solutions Int’l December 8, 2009
Page 63
FFiigguurree 1133--55 –– GGaauussssmmeetteerr PPrroobbee

FMRA User’s Manual Integral Solutions Int’l December 8, 2009
Page 64
14 Tester reconfiguration See “Configuring BlazerX6 Options” – BlazerX6 User’s Manual Supplement.
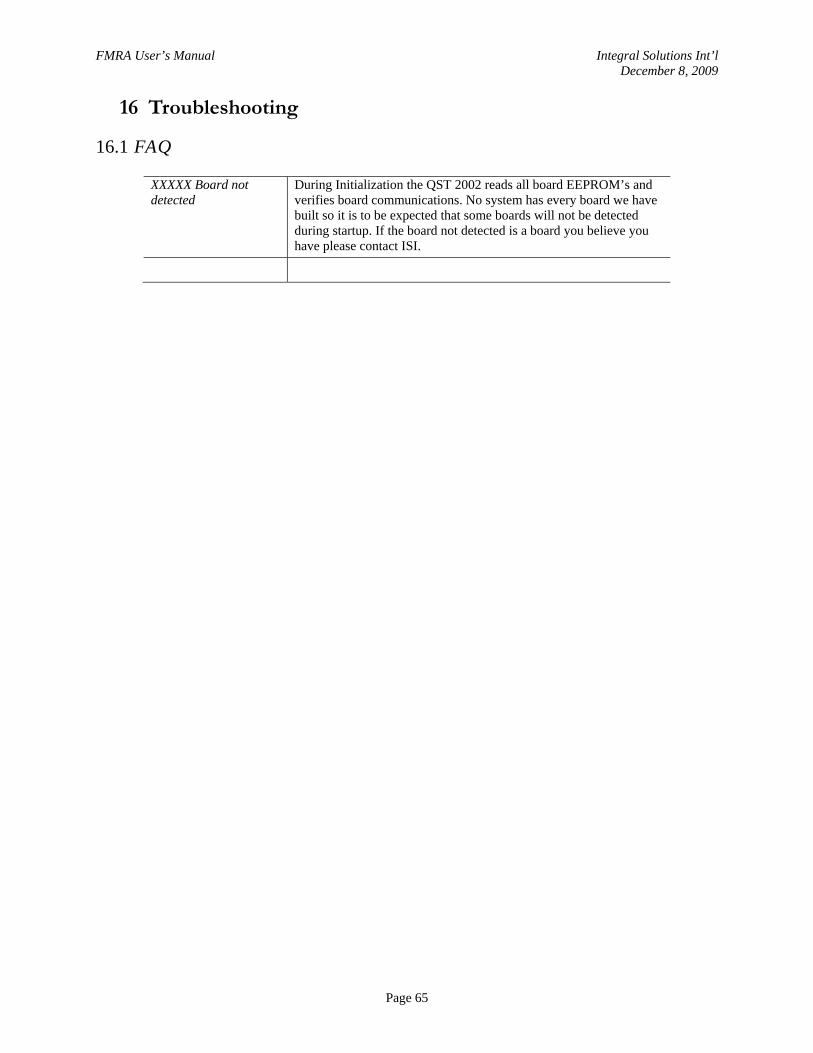
FMRA User’s Manual Integral Solutions Int’l December 8, 2009
Page 65
16 Troubleshooting
16.1 FAQ
XXXXX Board not detected
During Initialization the QST 2002 reads all board EEPROM’s and verifies board communications. No system has every board we have built so it is to be expected that some boards will not be detected during startup. If the board not detected is a board you believe you have please contact ISI.

FMRA User’s Manual Integral Solutions Int’l December 8, 2009
Page 66
17 LIMITED WARRANTY Integral Solutions Int'l, a California Corporation, having its principal place of business at 3000 Olcott St, Santa
Clara, CA 95054 ("Manufacturer") warrants its Quasistatic Tester products (the "Products") as follows:
Limited Warranty Manufacturer warrants that the Products sold hereunder will be free from defects in material and workmanship
for a period of six (6) months from the date of purchase. If the Products do not conform to this Limited Warranty during the warranty period (as herein above specified), Buyer shall notify Manufacturer in writing of the claimed defects and demonstrate to Manufacturer satisfaction that said defects are covered by this Limited Warranty. If the defects are properly reported to Manufacturer within the warranty period, and the defects are of such type and nature as to be covered by this warranty, Manufacturer shall, at its own expense, furnish, replacement Products or, at Manufacturer's option, replacement parts for the defective Products. Shipping and installation of the replacement Products or replacement parts shall be at Buyer's expense.
Other Limits THE FOREGOING IS IN LIEU OF ALL OTHER WARRANTIES, EXPRESS OR IMPLIED, INCLUDING
BUT NOT LIMITED TO THE IMPLIED WARRANTIES OF MERCHANTABILITY AND FITNESS FOR A PARTICULAR PURPOSE. Manufacturer does not warrant against damages or defects arising out of improper or abnormal use of handling of the Products; against defects or damages arising from improper installation (where installation is by persons other than Manufacturer), against defects in products or components not manufactured by Manufacturer, or against damages resulting from such non-Manufacturer made products or components. Manufacturer passes on to Buyer the warranty it received (if any) from the maker thereof of such non-Manufacturer made products or components. This warranty also does not apply to Products upon which repairs have been effected or attempted by persons other than pursuant to written authorization by Manufacturer.
Exclusive Obligation THIS WARRANTY IS EXCLUSIVE. The sole and exclusive obligation of Manufacturer shall be to repair or
replace the defective Products in the manner and for the period provided above. Manufacturer shall not have any other obligation with respect to the Products or any part thereof, whether based on contract, tort, strict liability or otherwise. Under no circumstances, whether based on this Limited Warranty or otherwise, shall Manufacturer be liable for incidental, special, or consequential damages.
Other Statements Manufacturer's employees or representatives' ORAL OR OTHER WRITTEN STATEMENTS DO NOT
CONSTITUTE WARRANTIES, shall not be relied upon by Buyer, and are not a part of the contract for sale or this limited warranty.
Entire Obligation This Limited Warranty states the entire obligation of Manufacturer with respect to the Products. If any part of
this Limited Warranty is determined to be void or illegal, the remainder shall remain in full force and effect.