Embed Size (px)
Citation preview
FERONIA INC.
CONSOLIDATED FINANCIAL STATEMENTS
December 31, 2015 and 2014
(Expressed in United States Dollars – except where otherwise noted)
FERONIA INC.
CONSOLIDATED FINANCIAL STATEMENTS
December 31, 2015 and 2014
(Expressed in United States Dollars – except where otherwise noted)
Table of Contents Auditor’s Report .................................................................................................................................................. 2 Consolidated statements of financial position .................................................................................................... 3 Consolidated statements of loss ........................................................................................................................ 4 Consolidated statements of comprehensive loss ............................................................................................... 5 Consolidated statements of changes in equity................................................................................................... 6 Consolidated statements of cash flows .............................................................................................................. 7 Notes to the consolidated financial statements ........................................................................................... 8 - 34
PricewaterhouseCoopers LLP Pwc Tower, 18 York Street, Suite 2600, Toronto, Ontario, Canada M5J 0B2 T: +1 416 863 1133, F: +1 416 365 8215 “PwC” refers to PricewaterhouseCoopers LLP, an Ontario limited liability partnership.
April 29, 2016
Independent Auditor’s Report To the Shareholders of Feronia Inc. We have audited the accompanying consolidated financial statements of Feronia Inc. and its subsidiaries, which comprise the consolidated statements of financial position as at December 31, 2015 and December 31, 2014 and the consolidated statements of loss, comprehensive loss, changes in equity and cash flows for the years then ended, and the related notes, which comprise a summary of significant accounting policies and other explanatory information. Management’s responsibility for the consolidated financial statements Management is responsible for the preparation and fair presentation of these consolidated financial statements in accordance with International Financial Reporting Standards, and for such internal control as management determines is necessary to enable the preparation of consolidated financial statements that are free from material misstatement, whether due to fraud or error. Auditor’s responsibility Our responsibility is to express an opinion on these consolidated financial statements based on our audits. We conducted our audits in accordance with Canadian generally accepted auditing standards. Those standards require that we comply with ethical requirements and plan and perform the audit to obtain reasonable assurance about whether the consolidated financial statements are free from material misstatement. An audit involves performing procedures to obtain audit evidence about the amounts and disclosures in the consolidated financial statements. The procedures selected depend on the auditor’s judgment, including the assessment of the risks of material misstatement of the consolidated financial statements, whether due to fraud or error. In making those risk assessments, the auditor considers internal control relevant to the entity’s preparation and fair presentation of the consolidated financial statements in order to design audit procedures that are appropriate in the circumstances, but not for the purpose of expressing an opinion on the effectiveness of the entity’s internal control. An audit also includes evaluating the appropriateness of accounting policies used and the reasonableness of accounting estimates made by management, as well as evaluating the overall presentation of the consolidated financial statements. We believe that the audit evidence we have obtained in our audits is sufficient and appropriate to provide a basis for our audit opinion.
Opinion In our opinion, the consolidated financial statements present fairly, in all material respects, the financial position of Feronia Inc. and its subsidiaries as at December 31, 2015 and December 31, 2014 and their financial performance and their cash flows for the years then ended in accordance with International Financial Reporting Standards. Emphasis of matter
Without qualifying our opinion, we draw attention to Note 2 in the consolidated financial statements which describes matters and conditions that indicate the existence of a material uncertainty that may cast significant doubt about the corporation's ability to continue as a going concern.
(Signed) “PricewaterhouseCoopers LLP”
Chartered Professional Accountants, Licensed Public Accountants
3
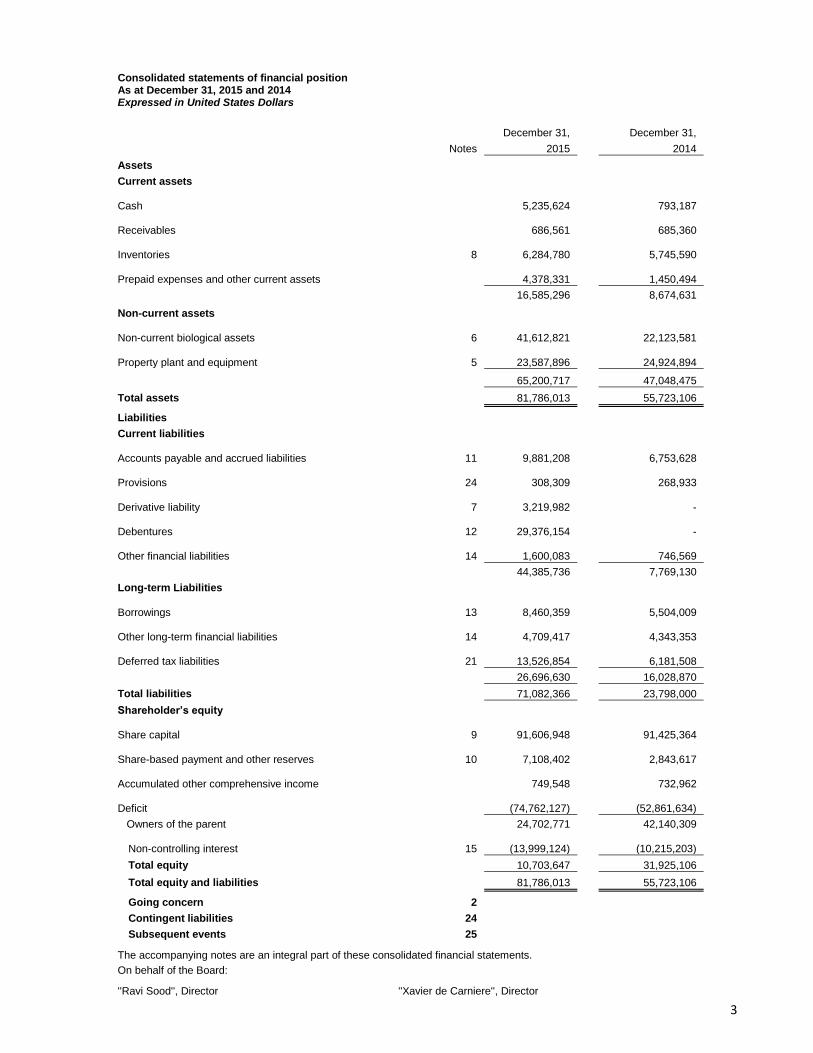
Consolidated statements of financial position As at December 31, 2015 and 2014 Expressed in United States Dollars
December 31,
December 31,
Notes 2015
2014
Assets Current assets
Cash
5,235,624
793,187
Receivables
686,561
685,360
Inventories 8
6,284,780
5,745,590
Prepaid expenses and other current assets
4,378,331
1,450,494
16,585,296
8,674,631
Non-current assets
Non-current biological assets 6
41,612,821
22,123,581
Property plant and equipment 5
23,587,896
24,924,894
65,200,717
47,048,475
Total assets
81,786,013
55,723,106
Liabilities Current liabilities
Accounts payable and accrued liabilities 11
9,881,208
6,753,628
Provisions 24
308,309
268,933
Derivative liability 7
3,219,982
-
Debentures 12
29,376,154
-
Other financial liabilities 14
1,600,083
746,569
44,385,736
7,769,130
Long-term Liabilities
Borrowings 13
8,460,359
5,504,009
Other long-term financial liabilities 14
4,709,417
4,343,353
Deferred tax liabilities 21
13,526,854
6,181,508
26,696,630
16,028,870
Total liabilities
71,082,366
23,798,000
Shareholder’s equity
Share capital 9
91,606,948
91,425,364
Share-based payment and other reserves 10
7,108,402
2,843,617
Accumulated other comprehensive income
749,548
732,962
Deficit
(74,762,127)
(52,861,634)
Owners of the parent
24,702,771
42,140,309
Non-controlling interest 15
(13,999,124)
(10,215,203)
Total equity
10,703,647
31,925,106
Total equity and liabilities
81,786,013
55,723,106
Going concern 2 Contingent liabilities 24 Subsequent events 25
The accompanying notes are an integral part of these consolidated financial statements. On behalf of the Board:
''Ravi Sood'', Director ''Xavier de Carniere'', Director
4
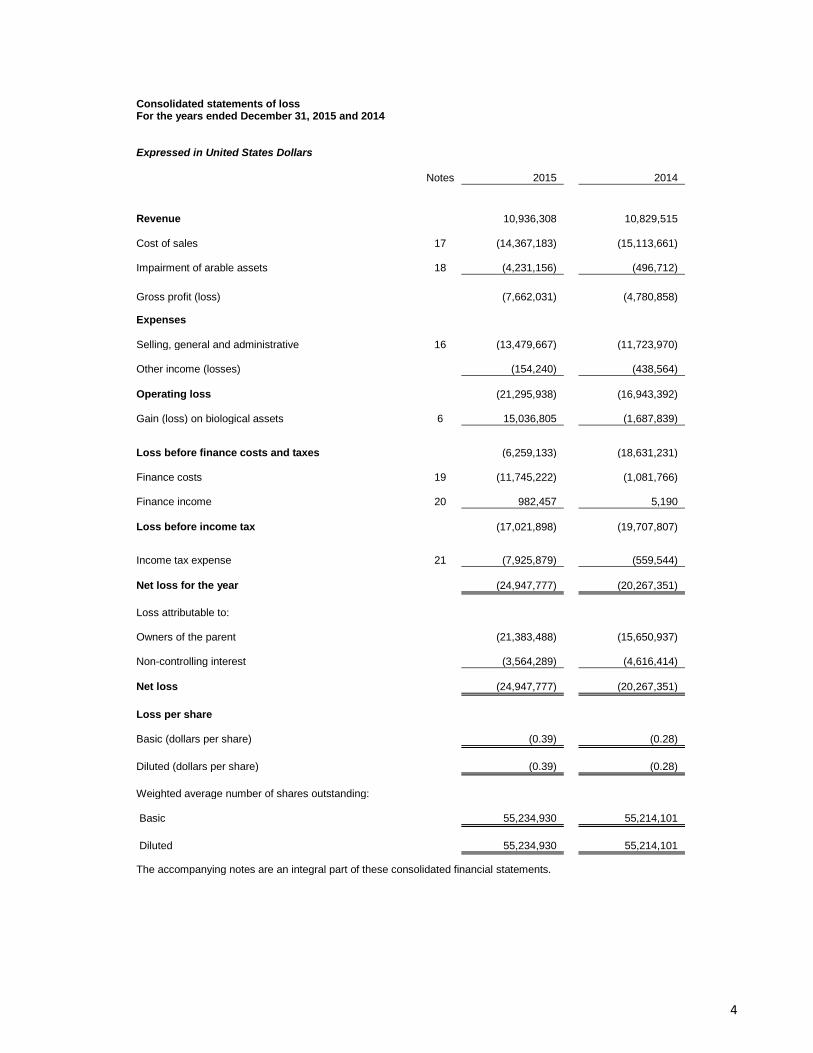
Consolidated statements of loss For the years ended December 31, 2015 and 2014
Expressed in United States Dollars
Notes 2015
2014
Revenue
10,936,308
10,829,515
Cost of sales 17
(14,367,183)
(15,113,661)
Impairment of arable assets 18
(4,231,156)
(496,712)
Gross profit (loss)
(7,662,031)
(4,780,858)
Expenses
Selling, general and administrative 16
(13,479,667)
(11,723,970)
Other income (losses)
(154,240)
(438,564)
Operating loss
(21,295,938)
(16,943,392)
Gain (loss) on biological assets 6
15,036,805
(1,687,839)
Loss before finance costs and taxes
(6,259,133)
(18,631,231)
Finance costs 19
(11,745,222)
(1,081,766)
Finance income 20
982,457
5,190
Loss before income tax
(17,021,898)
(19,707,807)
Income tax expense 21
(7,925,879)
(559,544)
Net loss for the year
(24,947,777)
(20,267,351)
Loss attributable to:
Owners of the parent
(21,383,488)
(15,650,937)
Non-controlling interest
(3,564,289)
(4,616,414)
Net loss
(24,947,777)
(20,267,351)
Loss per share
Basic (dollars per share)
(0.39)
(0.28)
Diluted (dollars per share)
(0.39)
(0.28)
Weighted average number of shares outstanding:
Basic
55,234,930
55,214,101
Diluted
55,234,930
55,214,101
The accompanying notes are an integral part of these consolidated financial statements.
5
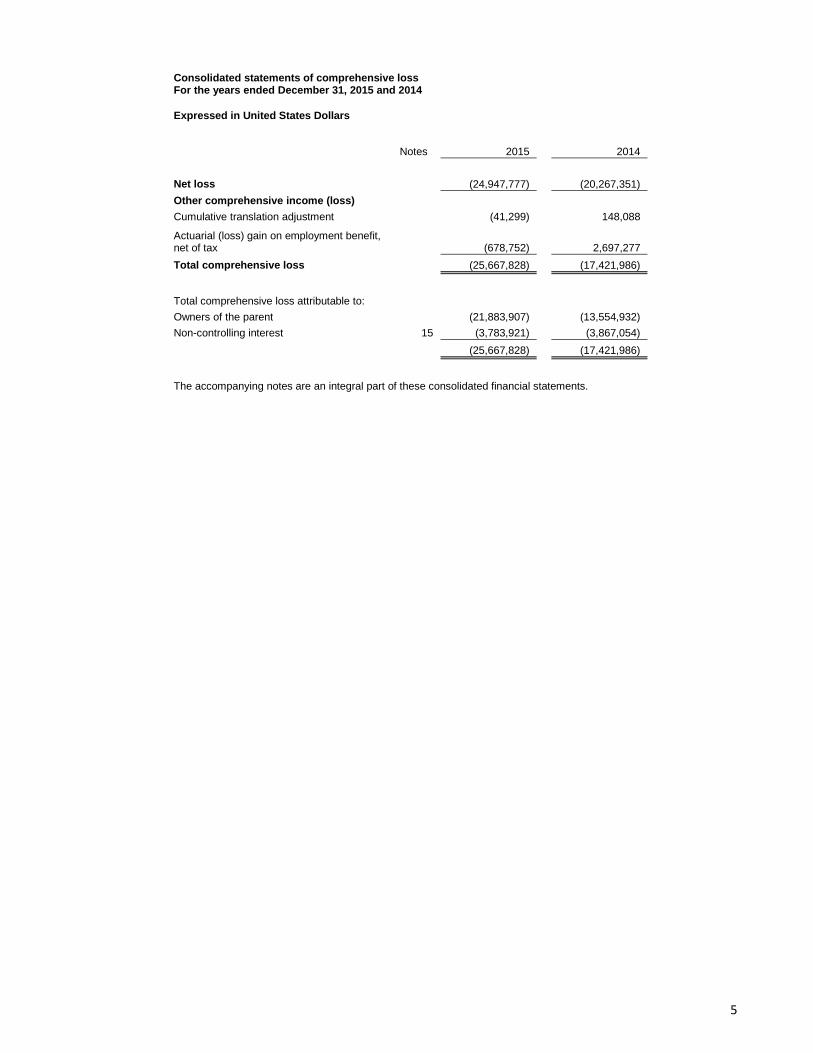
Consolidated statements of comprehensive loss For the years ended December 31, 2015 and 2014
Expressed in United States Dollars
Notes 2015
2014
Net loss
(24,947,777)
(20,267,351)
Other comprehensive income (loss) Cumulative translation adjustment
(41,299)
148,088
Actuarial (loss) gain on employment benefit, net of tax
(678,752)
2,697,277
Total comprehensive loss
(25,667,828)
(17,421,986)
Total comprehensive loss attributable to: Owners of the parent
(21,883,907)
(13,554,932)
Non-controlling interest 15 (3,783,921)
(3,867,054)
(25,667,828)
(17,421,986)
The accompanying notes are an integral part of these consolidated financial statements.
6
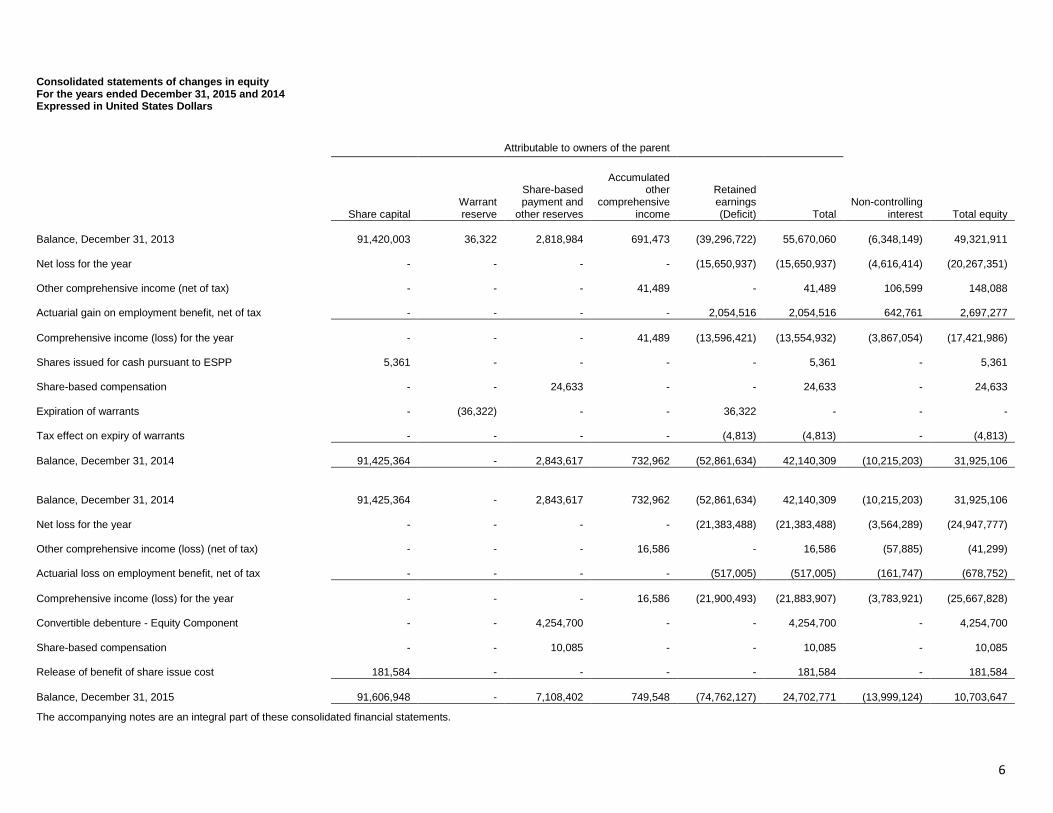
Consolidated statements of changes in equity For the years ended December 31, 2015 and 2014 Expressed in United States Dollars
Attributable to owners of the parent
Non-controlling interest Total equity
Share capital
Warrant reserve
Share-based payment and
other reserves
Accumulated other
comprehensive income
Retained earnings (Deficit) Total
Balance, December 31, 2013
91,420,003
36,322
2,818,984
691,473
(39,296,722) 55,670,060
(6,348,149)
49,321,911
Net loss for the year - - - -
(15,650,937)
(15,650,937)
(4,616,414)
(20,267,351)
Other comprehensive income (net of tax) - - -
41,489 - 41,489
106,599
148,088
Actuarial gain on employment benefit, net of tax - - - -
2,054,516 2,054,516
642,761
2,697,277
Comprehensive income (loss) for the year - - -
41,489
(13,596,421)
(13,554,932)
(3,867,054)
(17,421,986)
Shares issued for cash pursuant to ESPP
5,361 - - - - 5,361 -
5,361
Share-based compensation - -
24,633 - - 24,633 -
24,633
Expiration of warrants -
(36,322) - -
36,322
- -
-
Tax effect on expiry of warrants - - - -
(4,813)
(4,813) -
(4,813)
Balance, December 31, 2014
91,425,364 -
2,843,617
732,962
(52,861,634) 42,140,309
(10,215,203)
31,925,106
Balance, December 31, 2014
91,425,364 -
2,843,617
732,962
(52,861,634) 42,140,309
(10,215,203)
31,925,106
Net loss for the year - - - -
(21,383,488)
(21,383,488)
(3,564,289)
(24,947,777)
Other comprehensive income (loss) (net of tax) - - -
16,586 - 16,586
(57,885)
(41,299)
Actuarial loss on employment benefit, net of tax - - - -
(517,005)
(517,005)
(161,747)
(678,752)
Comprehensive income (loss) for the year - - -
16,586
(21,900,493)
(21,883,907)
(3,783,921)
(25,667,828)
Convertible debenture - Equity Component - -
4,254,700 - - 4,254,700 -
4,254,700
Share-based compensation - -
10,085 - - 10,085 -
10,085
Release of benefit of share issue cost
181,584 - - - - 181,584 -
181,584
Balance, December 31, 2015
91,606,948 -
7,108,402
749,548
(74,762,127) 24,702,771
(13,999,124)
10,703,647
The accompanying notes are an integral part of these consolidated financial statements.
7
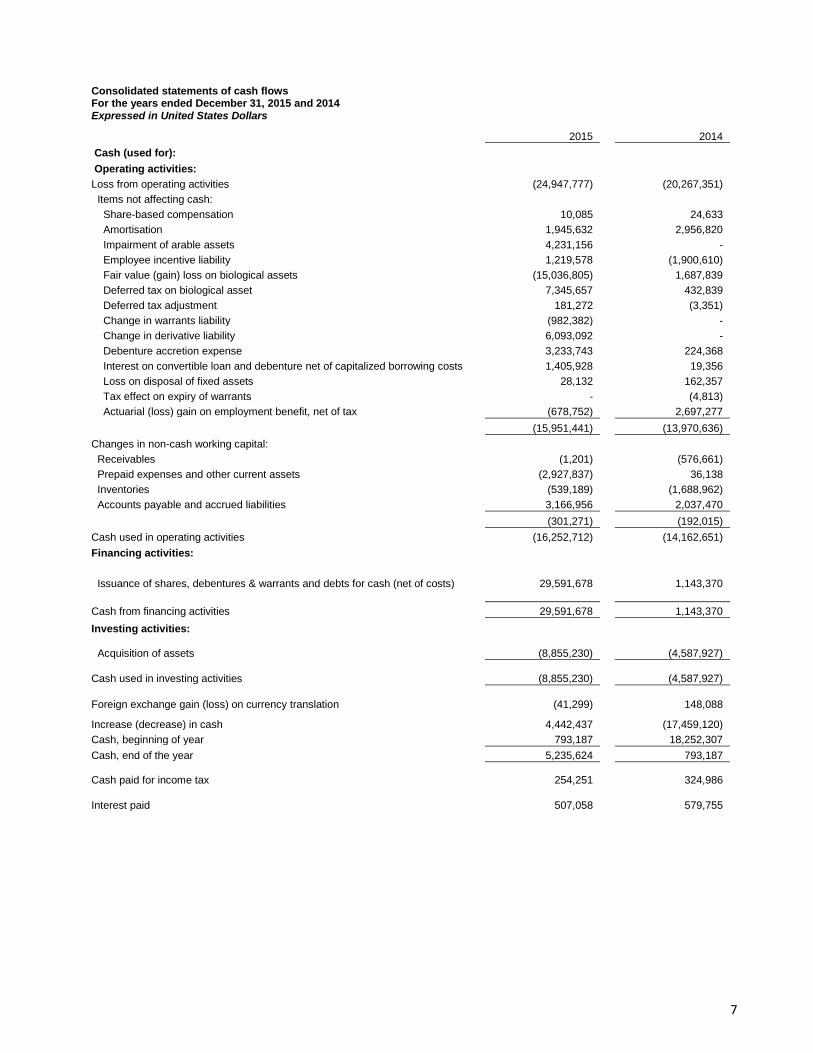
Consolidated statements of cash flows For the years ended December 31, 2015 and 2014 Expressed in United States Dollars
2015
2014
Cash (used for): Operating activities: Loss from operating activities
(24,947,777)
(20,267,351)
Items not affecting cash: Share-based compensation
10,085
24,633
Amortisation
1,945,632
2,956,820
Impairment of arable assets
4,231,156
-
Employee incentive liability
1,219,578
(1,900,610)
Fair value (gain) loss on biological assets
(15,036,805)
1,687,839
Deferred tax on biological asset
7,345,657
432,839
Deferred tax adjustment
181,272
(3,351)
Change in warrants liability
(982,382)
-
Change in derivative liability
6,093,092
-
Debenture accretion expense
3,233,743
224,368
Interest on convertible loan and debenture net of capitalized borrowing costs
1,405,928
19,356
Loss on disposal of fixed assets
28,132
162,357
Tax effect on expiry of warrants
-
(4,813)
Actuarial (loss) gain on employment benefit, net of tax
(678,752)
2,697,277
(15,951,441)
(13,970,636)
Changes in non-cash working capital: Receivables
(1,201)
(576,661)
Prepaid expenses and other current assets
(2,927,837)
36,138
Inventories
(539,189)
(1,688,962)
Accounts payable and accrued liabilities
3,166,956
2,037,470
(301,271)
(192,015)
Cash used in operating activities
(16,252,712)
(14,162,651)
Financing activities:
Issuance of shares, debentures & warrants and debts for cash (net of costs)
29,591,678
1,143,370
Cash from financing activities
29,591,678
1,143,370
Investing activities:
Acquisition of assets
(8,855,230)
(4,587,927)
Cash used in investing activities
(8,855,230)
(4,587,927)
Foreign exchange gain (loss) on currency translation
(41,299)
148,088
Increase (decrease) in cash
4,442,437
(17,459,120)
Cash, beginning of year
793,187
18,252,307
Cash, end of the year
5,235,624
793,187
Cash paid for income tax
254,251
324,986
Interest paid
507,058
579,755
Feronia Inc. Notes to the consolidated financial statements For the years ended December 31, 2015 and 2014 Expressed in United States Dollars, except where otherwise noted
8
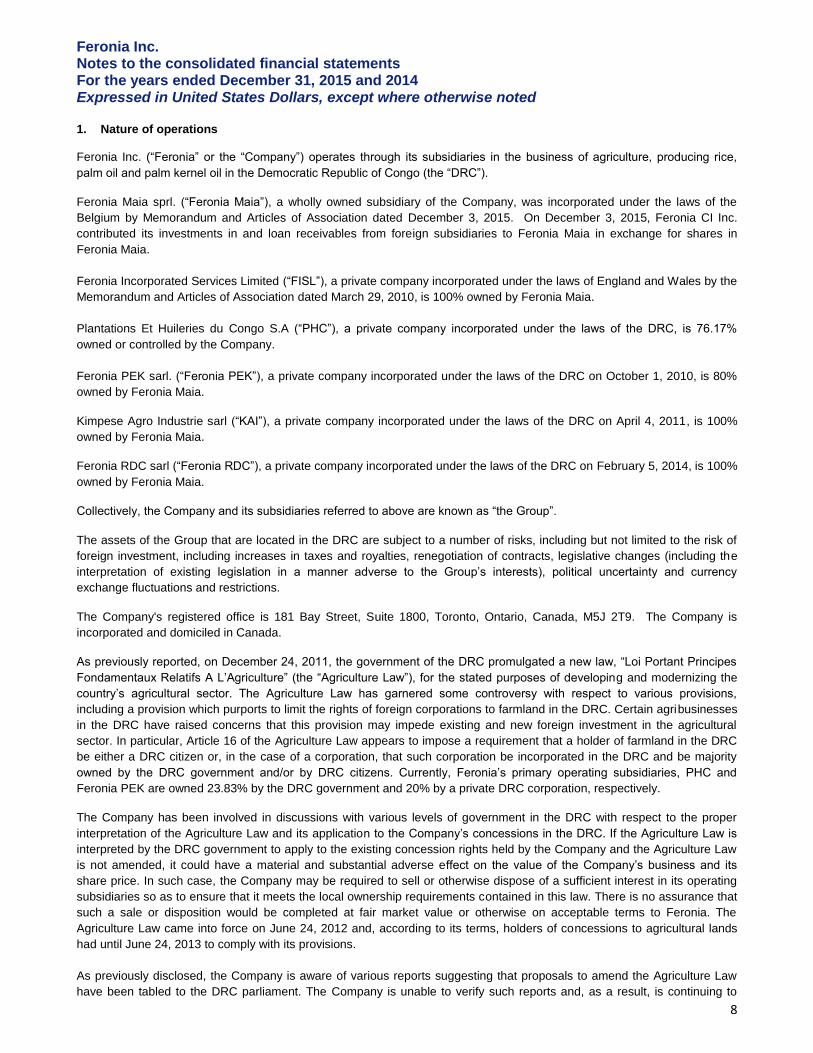
1. Nature of operations
Feronia Inc. (“Feronia” or the “Company”) operates through its subsidiaries in the business of agriculture, producing rice,
palm oil and palm kernel oil in the Democratic Republic of Congo (the “DRC”).
Feronia Maia sprl. (“Feronia Maia”), a wholly owned subsidiary of the Company, was incorporated under the laws of the
Belgium by Memorandum and Articles of Association dated December 3, 2015. On December 3, 2015, Feronia CI Inc.
contributed its investments in and loan receivables from foreign subsidiaries to Feronia Maia in exchange for shares in
Feronia Maia.
Feronia Incorporated Services Limited (“FISL”), a private company incorporated under the laws of England and Wales by the
Memorandum and Articles of Association dated March 29, 2010, is 100% owned by Feronia Maia.
Plantations Et Huileries du Congo S.A (“PHC”), a private company incorporated under the laws of the DRC, is 76.17%
owned or controlled by the Company.
Feronia PEK sarl. (“Feronia PEK”), a private company incorporated under the laws of the DRC on October 1, 2010, is 80%
owned by Feronia Maia.
Kimpese Agro Industrie sarl (“KAI”), a private company incorporated under the laws of the DRC on April 4, 2011, is 100%
owned by Feronia Maia.
Feronia RDC sarl (“Feronia RDC”), a private company incorporated under the laws of the DRC on February 5, 2014, is 100%
owned by Feronia Maia.
Collectively, the Company and its subsidiaries referred to above are known as “the Group”.
The assets of the Group that are located in the DRC are subject to a number of risks, including but not limited to the risk of
foreign investment, including increases in taxes and royalties, renegotiation of contracts, legislative changes (including the
interpretation of existing legislation in a manner adverse to the Group’s interests), political uncertainty and currency
exchange fluctuations and restrictions.
The Company's registered office is 181 Bay Street, Suite 1800, Toronto, Ontario, Canada, M5J 2T9. The Company is
incorporated and domiciled in Canada.
As previously reported, on December 24, 2011, the government of the DRC promulgated a new law, “Loi Portant Principes
Fondamentaux Relatifs A L’Agriculture” (the “Agriculture Law”), for the stated purposes of developing and modernizing the
country’s agricultural sector. The Agriculture Law has garnered some controversy with respect to various provisions,
including a provision which purports to limit the rights of foreign corporations to farmland in the DRC. Certain agribusinesses
in the DRC have raised concerns that this provision may impede existing and new foreign investment in the agricultural
sector. In particular, Article 16 of the Agriculture Law appears to impose a requirement that a holder of farmland in the DRC
be either a DRC citizen or, in the case of a corporation, that such corporation be incorporated in the DRC and be majority
owned by the DRC government and/or by DRC citizens. Currently, Feronia’s primary operating subsidiaries, PHC and
Feronia PEK are owned 23.83% by the DRC government and 20% by a private DRC corporation, respectively.
The Company has been involved in discussions with various levels of government in the DRC with respect to the proper
interpretation of the Agriculture Law and its application to the Company’s concessions in the DRC. If the Agriculture Law is
interpreted by the DRC government to apply to the existing concession rights held by the Company and the Agriculture Law
is not amended, it could have a material and substantial adverse effect on the value of the Company’s business and its
share price. In such case, the Company may be required to sell or otherwise dispose of a sufficient interest in its operating
subsidiaries so as to ensure that it meets the local ownership requirements contained in this law. There is no assurance that
such a sale or disposition would be completed at fair market value or otherwise on acceptable terms to Feronia. The
Agriculture Law came into force on June 24, 2012 and, according to its terms, holders of concessions to agricultural lands
had until June 24, 2013 to comply with its provisions.
As previously disclosed, the Company is aware of various reports suggesting that proposals to amend the Agriculture Law
have been tabled to the DRC parliament. The Company is unable to verify such reports and, as a result, is continuing to
Feronia Inc. Notes to the consolidated financial statements For the years ended December 31, 2015 and 2014 Expressed in United States Dollars, except where otherwise noted
9
monitor the situation and is reviewing various alternatives for a number of possible outcomes. At this time, management has
determined that it is in the best interest of the Company to take no action in respect of the Agriculture Law.
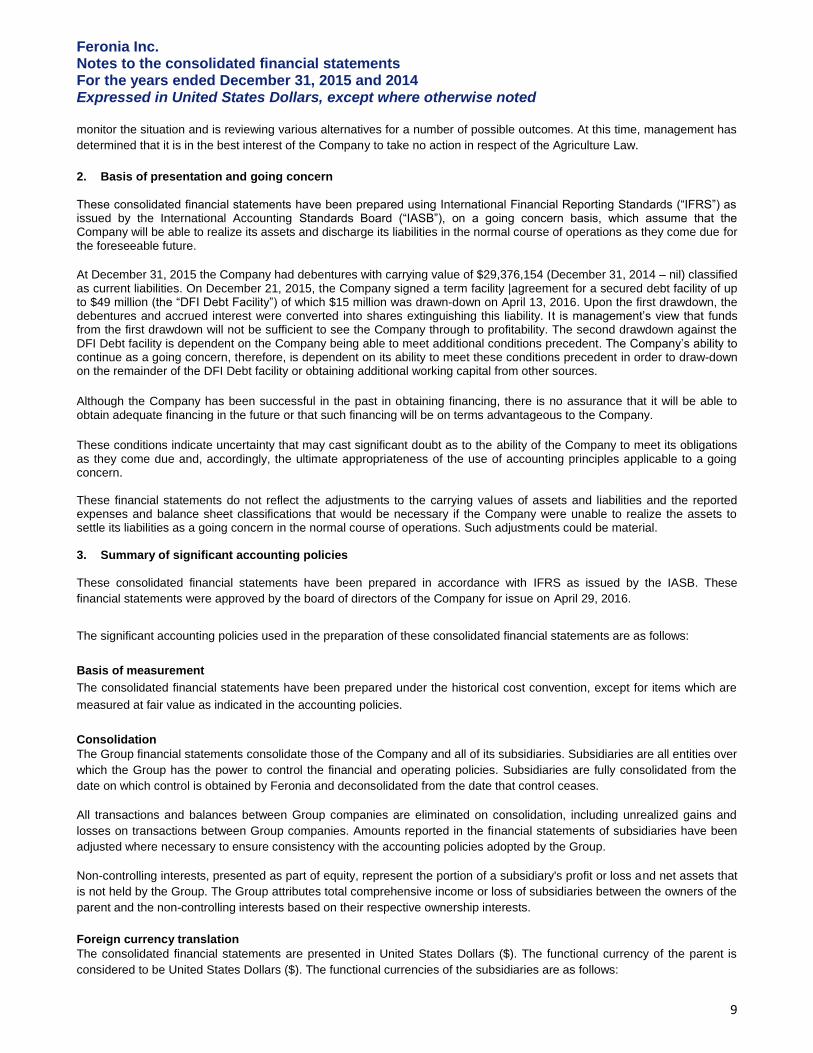
2. Basis of presentation and going concern
These consolidated financial statements have been prepared using International Financial Reporting Standards (“IFRS”) as issued by the International Accounting Standards Board (“IASB”), on a going concern basis, which assume that the Company will be able to realize its assets and discharge its liabilities in the normal course of operations as they come due for the foreseeable future.
At December 31, 2015 the Company had debentures with carrying value of $29,376,154 (December 31, 2014 – nil) classified as current liabilities. On December 21, 2015, the Company signed a term facility |agreement for a secured debt facility of up to $49 million (the “DFI Debt Facility”) of which $15 million was drawn-down on April 13, 2016. Upon the first drawdown, the debentures and accrued interest were converted into shares extinguishing this liability. It is management’s view that funds from the first drawdown will not be sufficient to see the Company through to profitability. The second drawdown against the DFI Debt facility is dependent on the Company being able to meet additional conditions precedent. The Company’s ability to continue as a going concern, therefore, is dependent on its ability to meet these conditions precedent in order to draw-down on the remainder of the DFI Debt facility or obtaining additional working capital from other sources.
Although the Company has been successful in the past in obtaining financing, there is no assurance that it will be able to obtain adequate financing in the future or that such financing will be on terms advantageous to the Company.
These conditions indicate uncertainty that may cast significant doubt as to the ability of the Company to meet its obligations as they come due and, accordingly, the ultimate appropriateness of the use of accounting principles applicable to a going concern. These financial statements do not reflect the adjustments to the carrying values of assets and liabilities and the reported expenses and balance sheet classifications that would be necessary if the Company were unable to realize the assets to settle its liabilities as a going concern in the normal course of operations. Such adjustments could be material. 3. Summary of significant accounting policies
These consolidated financial statements have been prepared in accordance with IFRS as issued by the IASB. These
financial statements were approved by the board of directors of the Company for issue on April 29, 2016.
The significant accounting policies used in the preparation of these consolidated financial statements are as follows:
Basis of measurement
The consolidated financial statements have been prepared under the historical cost convention, except for items which are
measured at fair value as indicated in the accounting policies.
Consolidation
The Group financial statements consolidate those of the Company and all of its subsidiaries. Subsidiaries are all entities over
which the Group has the power to control the financial and operating policies. Subsidiaries are fully consolidated from the
date on which control is obtained by Feronia and deconsolidated from the date that control ceases.
All transactions and balances between Group companies are eliminated on consolidation, including unrealized gains and
losses on transactions between Group companies. Amounts reported in the financial statements of subsidiaries have been
adjusted where necessary to ensure consistency with the accounting policies adopted by the Group.
Non-controlling interests, presented as part of equity, represent the portion of a subsidiary's profit or loss and net assets that
is not held by the Group. The Group attributes total comprehensive income or loss of subsidiaries between the owners of the
parent and the non-controlling interests based on their respective ownership interests.
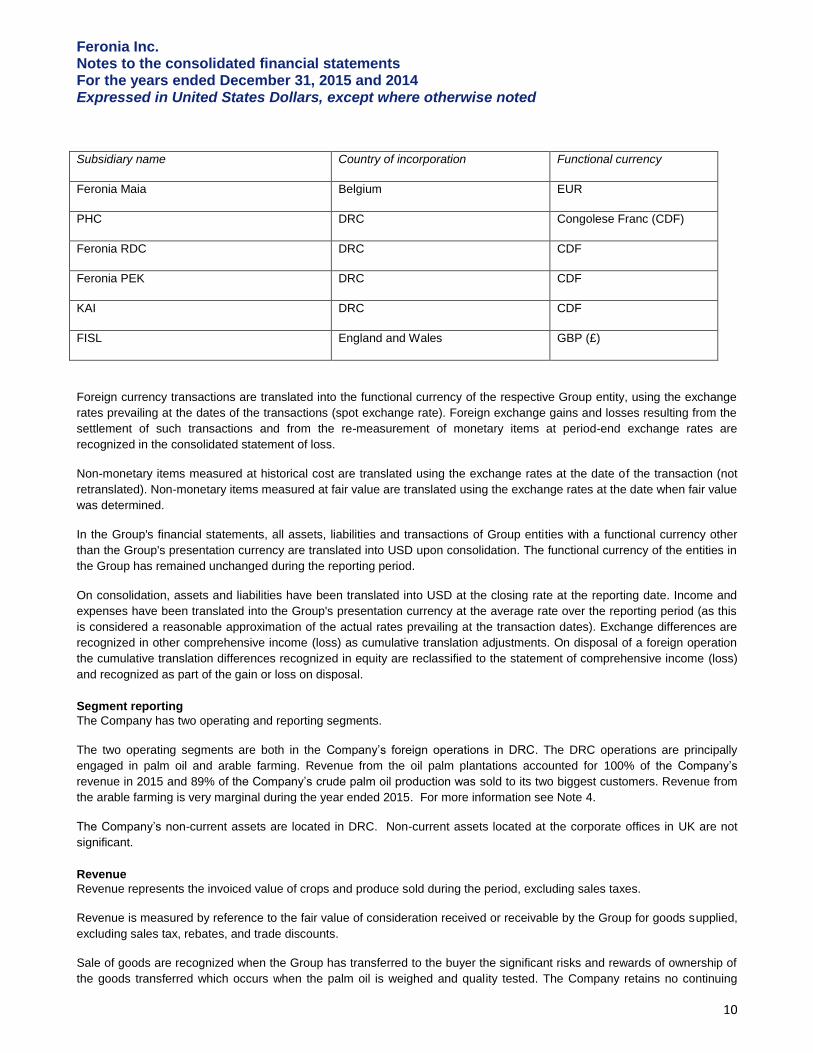
Foreign currency translation
The consolidated financial statements are presented in United States Dollars ($). The functional currency of the parent is
considered to be United States Dollars ($). The functional currencies of the subsidiaries are as follows:
Feronia Inc. Notes to the consolidated financial statements For the years ended December 31, 2015 and 2014 Expressed in United States Dollars, except where otherwise noted
10
Subsidiary name Country of incorporation Functional currency
Feronia Maia Belgium EUR
PHC DRC Congolese Franc (CDF)
Feronia RDC DRC CDF
Feronia PEK DRC CDF
KAI DRC CDF
FISL England and Wales GBP (£)
Foreign currency transactions are translated into the functional currency of the respective Group entity, using the exchange
rates prevailing at the dates of the transactions (spot exchange rate). Foreign exchange gains and losses resulting from the
settlement of such transactions and from the re-measurement of monetary items at period-end exchange rates are
recognized in the consolidated statement of loss.
Non-monetary items measured at historical cost are translated using the exchange rates at the date of the transaction (not
retranslated). Non-monetary items measured at fair value are translated using the exchange rates at the date when fair value
was determined.
In the Group's financial statements, all assets, liabilities and transactions of Group entities with a functional currency other
than the Group's presentation currency are translated into USD upon consolidation. The functional currency of the entities in
the Group has remained unchanged during the reporting period.
On consolidation, assets and liabilities have been translated into USD at the closing rate at the reporting date. Income and
expenses have been translated into the Group's presentation currency at the average rate over the reporting period (as this
is considered a reasonable approximation of the actual rates prevailing at the transaction dates). Exchange differences are
recognized in other comprehensive income (loss) as cumulative translation adjustments. On disposal of a foreign operation
the cumulative translation differences recognized in equity are reclassified to the statement of comprehensive income (loss)
and recognized as part of the gain or loss on disposal.
Segment reporting
The Company has two operating and reporting segments.
The two operating segments are both in the Company’s foreign operations in DRC. The DRC operations are principally
engaged in palm oil and arable farming. Revenue from the oil palm plantations accounted for 100% of the Company’s
revenue in 2015 and 89% of the Company’s crude palm oil production was sold to its two biggest customers. Revenue from
the arable farming is very marginal during the year ended 2015. For more information see Note 4.
The Company’s non-current assets are located in DRC. Non-current assets located at the corporate offices in UK are not
significant.
Revenue
Revenue represents the invoiced value of crops and produce sold during the period, excluding sales taxes.
Revenue is measured by reference to the fair value of consideration received or receivable by the Group for goods supplied,
excluding sales tax, rebates, and trade discounts.
Sale of goods are recognized when the Group has transferred to the buyer the significant risks and rewards of ownership of
the goods transferred which occurs when the palm oil is weighed and quality tested. The Company retains no continuing
Feronia Inc. Notes to the consolidated financial statements For the years ended December 31, 2015 and 2014 Expressed in United States Dollars, except where otherwise noted
11
managerial involvement associated with the ownership or effective control over the goods, the amount can be measured
reliably, it is probable that the economic benefits with the transaction will flow to the Company and the costs incurred in
respect of the transaction can be measured reliably. Significant risks and rewards are generally considered to be transferred
to the buyer when the customer has taken delivery of the goods.
Palm oil is shipped by barge from the plantation to the customer’s factory. The lead time that is required for the delivery of
goods to customers is between two to three weeks from the point of the barge leaving the Company’s plantation to delivery
at the customer’s factory. As at December 31, 2015, the amount of oil in transit amounted to $1,783,165. Paddy rice is
transferred from the farm to the Company’s main rice mill. It is processed into an edible form and sold directly from the mil l to
customers.
After arriving at the factory the customer weighs the goods, takes ownership, assumes the risk of loss and is invoiced by the
Company. At this point, revenue is recognized by the Company.
Loss per share
Basic loss per common share is calculated based on the weighted average number of common shares issued and
outstanding during the year. Basic and diluted losses per share are the same, as the effect of potential issuances of shares
from exercises of stock options, convertible debentures and warrants would be anti-dilutive.
Borrowing costs
Borrowing costs directly attributable to the acquisition, construction or production of a qualifying asset are capitalized during
the period of time that is necessary to complete and prepare the asset for its intended use or sale. Other borrowing costs are
expensed in the period in which they are incurred and reported in 'finance costs'.
Property, plant and equipment
Buildings, furniture and other equipment (comprising fittings and furniture) are carried at acquisition cost or manufacturing
cost less subsequent depreciation and impairment losses.
Leased buildings and equipment are included in property, plant and equipment if the entity is expected to consume
substantially all of the risks and rewards of ownership of the asset. Finance leases are capitalized at the lease’s
commencement at the lower of the fair value of the leased asset and the present value of the minimum lease payments.
Such assets are depreciated over their expected useful lives (determined by reference to comparable owned assets) or over
the term of the lease, if shorter.
All other leases are treated as operating leases. Payments on operating lease agreements are recognized as an expense on
a straight-line basis over the lease term. Associated costs, such as maintenance and insurance, are expensed as incurred.
Depreciation is recognized on a straight-line basis on cost less the estimated residual value of plant and equipment as
follows:
Buildings: straight line basis over 33 years
Materials, furniture and equipment: straight line basis over 3 to 10 years
Motor vehicles: straight line basis over 4 years
The Company allocates the amount initially recognized in respect of an item of property, plant and equipment to its
significant parts and depreciates separately each such part. The carrying amount of the replaced part is derecognized when
replaced.
Residual value, methods of depreciation and estimates of useful life are reviewed at least annually and adjusted if
appropriate.
Gains or losses arising on the disposal of property, plant and equipment are determined as the difference between the
disposal proceeds and the carrying amount of the assets and are recognized in profit or loss within 'other income' or 'other
expenses'.
Feronia Inc. Notes to the consolidated financial statements For the years ended December 31, 2015 and 2014 Expressed in United States Dollars, except where otherwise noted
12
Assets under construction represent property and equipment under construction and are measured at cost. Cost comprises
directly attributable costs of acquisition or construction, net of any revenue received towards the construction in progress.
Assets under construction are not depreciated. Completed items are transferred from assets under construction to
appropriate categories of property and equipment when they are ready for their intended use.
Biological assets
Biological gain or loss is measured in accordance with IAS 41 for bearer assets (oil-palm). The fair value of oil palms
excludes the land upon which the trees are planted or the fixed assets utilized in the upkeep of planted areas. The biological
process starts with preparation of land for planting immature trees and ends with the harvesting of crops in the form of fresh
fruit bunches (‘FFB’). Thereafter, crude palm oil and palm kernel oil is extracted from FFB. Consistent with this process, the
fair value of oil palms is determined using a discounted cash flow model, by reference to the estimated FFB crop harvest
over the full remaining productive life of the trees of up to 25 years, applying an estimated produce value for transfer to the
manufacturing process and allowing for upkeep, harvesting costs and an appropriate allocation of overheads. The estimated
produce value is taken to be the 3-year average based on historic selling prices to determine the present value of expected
future cash flows over the next 25 years. The estimated FFB crop harvest used to derive the fair value is derived by
applying expected palm oil yield to plantation size.
Changes in fair value of palm oil plantations are recognized in the statement of loss.
Bearer assets, the Group’s plantations, are non-current assets.
Plantation
The Group has valued its biological assets on the basis of the discounted net present value of cash flows arising in
producing FFB from oil palms using an expected economic life of 25 years. Areas are included in the valuation once they
reach maturity. Immature trees are accounted for at replacement cost until maturity.
The valuation assumes that the concessions granted to exploit the land on which the biological assets are planted will be
renewed when they expire. No account is taken in the valuation of future replanting. The Group estimates the future sales
value of its crop production using the conditions precedent at the period end, namely, a three year rolling average.
Impairment testing of property, plant and equipment
For the purposes of assessing impairment, assets are grouped at the lowest levels for which there are largely independent
cash inflows (cash-generating units).
Individual assets or cash-generating units are tested for impairment whenever events or changes in circumstances indicate
that the carrying amount may not be recoverable.
An impairment loss is recognized for the amount by which the asset's or cash-generating unit's carrying amount exceeds its
recoverable amount, which is the higher of fair value less costs to sell and value-in-use.
Impairment losses are charged on a pro rata basis to the long-lived assets (excluding biological assets) in the cash-
generating unit. All assets are subsequently reassessed for indications that an impairment loss previously recognized may
no longer exist. An impairment charge is reversed if the cash-generating unit’s recoverable amount exceeds its carrying
amount.
Financial instruments
Financial assets and financial liabilities are recognized when the Group becomes a party to the contractual provisions of the
financial instrument. Financial assets are derecognized when the contractual rights to the cash flows from the financial asset
expire, or when the financial asset and all substantial risks and rewards are transferred.
A financial liability is derecognized when it is extinguished, discharged, cancelled or expires.
Financial assets and financial liabilities are measured initially at fair value plus transactions costs, except for financial assets
and financial liabilities carried at fair value through profit or loss, which are measured initially at fair value.
Feronia Inc. Notes to the consolidated financial statements For the years ended December 31, 2015 and 2014 Expressed in United States Dollars, except where otherwise noted
13
Financial assets and financial liabilities are measured subsequently as described below.
Financial assets
Loans and receivables are non-derivative financial assets with fixed or determinable payments that are not quoted in an
active market. After initial recognition these are measured at amortized cost using the effective interest method, less
provision for impairment. Discounting is omitted where the effect of discounting is immaterial. The Group's cash and cash
equivalents, trade and most other receivables fall into this category of financial instruments.
Loans and receivables are reviewed for impairment at least each reporting date and are impaired when there is any objective
evidence that a financial asset or a group of financial assets is impaired.
Individually significant receivables are considered for impairment when they are past due or when other objective evidence is
received that a specific counterparty will default. Receivables that are not considered to be individually impaired are
reviewed for impairment in groups, which are determined by reference to the industry and region of a counterparty and other
shared credit risk characteristics. The impairment loss estimate is then based on recent historical counterparty default rates
for each identified group.
All income and expenses relating to financial assets that are recognized in profit or loss are presented within 'finance costs',
'finance income' or 'other financial items', except for impairment of trade receivables which is presented within 'other income
and losses'.
Financial liabilities
All financial liabilities are initially recorded at fair value and designated upon inception as fair value through profit or loss (“FVTPL”) or other financial liabilities.
Financial liabilities classified as other financial liabilities are initially recognized at the amount to be paid, less a discount (when material) to reduce financial liabilities to fair value. Other financial liabilities are measured subsequently at amortized cost using the effective interest method. The Group’s other financial liabilities include accounts payable, accrued liabilities, borrowings and debentures.
Financial liabilities classified as FVTPL are measured initially and subsequently at fair. Transaction costs on financial liabilities classified as FVTPL are expensed as incurred. Fair value changes on financial liabilities classified as FVTPL are recognized through the statement of loss.
Derivatives are also classified as FVTPL unless they are designated as effective hedging instruments. Derivatives are valued with the main inputs to the valuation being the underlying stock price and conversion price, credit spread of the Company, volatility of the underlying stock price, and discount factor curve. The Group’s financial liabilities at FVTPL include derivative liability.
All interest-related charges and, if applicable, changes in an instrument's fair value that are reported in the statement of loss
are included within finance costs or finance income.
Lease costs
The Company has concession on the plantations pursuant to revolving 25 year leases which provide the Company with the
right to occupy and develop the land. Accordingly, the Company includes the annual cost of the lease in cost of sales.
Inventories
Inventories are stated at the lower of cost and net realizable value. Cost includes the fair value of harvested FFB, all
expenses directly attributable to the manufacturing process as well as suitable portions of related production overheads,
based on normal operating capacity. Costs of ordinarily interchangeable items are assigned using the first in, first out cost
formula. Net realizable value is the estimated selling price in the ordinary course of business less any applicable selling
expenses.
Feronia Inc. Notes to the consolidated financial statements For the years ended December 31, 2015 and 2014 Expressed in United States Dollars, except where otherwise noted
14
Income taxes
Tax expense recognized in profit or loss comprises the sum of deferred tax and current tax not recognized in other
comprehensive income or directly in equity.
Current income tax assets and/or liabilities comprise those obligations to, or claims from, fiscal authorities relating to the
current or prior reporting periods, that are unpaid at the reporting date. Current tax is payable on taxable profit, which differs
from profit or loss in the financial statements. Calculation of current tax is based on tax rates and tax laws that have been
enacted or substantively enacted by the end of the reporting period.
Deferred income taxes
Deferred income taxes are calculated using the liability method on temporary differences between the carrying amounts of
assets and liabilities and their tax bases. However, deferred tax is not provided on the initial recognition of an asset or liability
unless the related transaction is a business combination or affects tax or accounting profit. Deferred tax on temporary
differences associated with investments in subsidiaries and joint ventures is not provided if reversal of these temporary
differences can be controlled by the Group and it is probable that reversal will not occur in the foreseeable future.
Deferred tax assets and liabilities are calculated, without discounting, at tax rates that are expected to apply to their
respective period of realization, provided they are enacted or substantively enacted by the end of the reporting period.
Deferred tax liabilities are always provided for in full.
Deferred tax assets are recognized to the extent that it is probable that they will be able to be utilized against future taxable
income. For management's assessment of the probability of future taxable income to utilize against deferred tax assets, see
the judgments and estimates policy below.
Deferred tax assets and liabilities are offset only when the Group has a right and intention to set off current tax assets and
liabilities from the same taxation authority.
Changes in deferred tax assets or liabilities are recognized as a component of tax income or expense in profit or loss, except
where they relate to items that are recognized in other comprehensive income or directly in equity, in which case the related
deferred tax is also recognized in other comprehensive income or equity, respectively.
Cash
Cash includes cash on hand and demand deposits held with banks.
Equity and reserves
Incremental costs directly attributable to the issuance of shares are recognized as a deduction from share capital.
Deficit includes all current and prior period retained losses.
All transactions with owners of the Company are recorded separately within equity.
The share-based payment reserve represents equity-settled share-based employee remuneration until such stock options
are exercised, forfeited, lapse or expire and warrant reserve includes broker warrants issued in connection with share
offerings.
Share-based employee remuneration
The Group operates equity-settled share-based remuneration plans for its employees. None of the Group's plans feature any
options for cash settlement.
All services received in exchange for the grant of any share-based payment are measured at their grant date fair values.
Where employees are rewarded using share-based payments, the fair values of employees' services are determined
indirectly by reference to the fair value of the equity instruments granted. This fair value is measured at the grant date and
Feronia Inc. Notes to the consolidated financial statements For the years ended December 31, 2015 and 2014 Expressed in United States Dollars, except where otherwise noted
15
excludes the impact of non-market vesting conditions (for example profitability and sales growth targets and performance
conditions).
All share-based remuneration is ultimately recognized as an expense in profit or loss with a corresponding credit to share
based payment reserves.
If vesting periods or other vesting conditions apply, the expense is allocated over the vesting period, based on the best
available estimate of the number of stock options expected to vest. Non-market vesting conditions are included in
assumptions about the number of options that are expected to become exercisable. Estimates are subsequently revised, if
there is any indication that the number of stock options expected to vest differs from previous estimates. Any cumulative
adjustment prior to vesting is recognized in the current period. No adjustment is made to any expense recognized in prior
periods if stock options ultimately exercised are different to that estimated on vesting.
The share purchase plan (‘’SPP’’) introduced in 2011 is an equity settled share option plan accounted for under IFRS 2. The
SPP share options are Zero Exercise Price Options and the fair value is the share price at the date of the share issue. The
charge is accrued evenly over the life of the SPP share options.
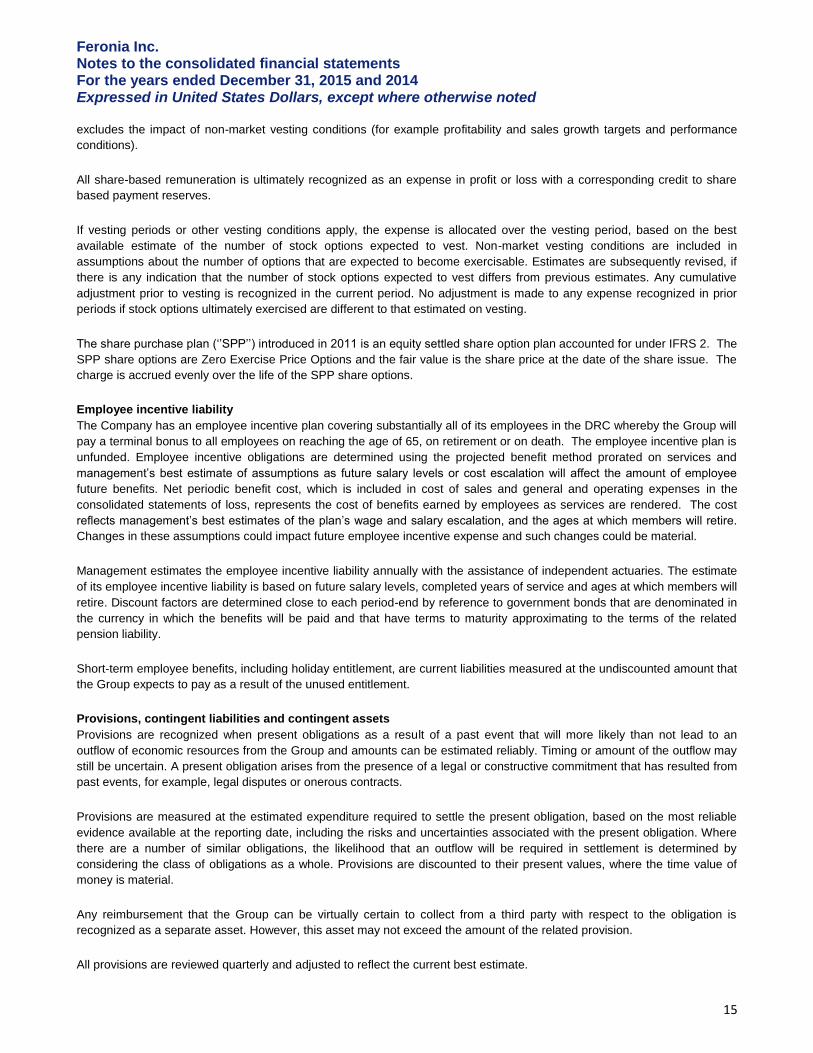
Employee incentive liability
The Company has an employee incentive plan covering substantially all of its employees in the DRC whereby the Group will
pay a terminal bonus to all employees on reaching the age of 65, on retirement or on death. The employee incentive plan is
unfunded. Employee incentive obligations are determined using the projected benefit method prorated on services and
management’s best estimate of assumptions as future salary levels or cost escalation will affect the amount of employee
future benefits. Net periodic benefit cost, which is included in cost of sales and general and operating expenses in the
consolidated statements of loss, represents the cost of benefits earned by employees as services are rendered. The cost
reflects management’s best estimates of the plan’s wage and salary escalation, and the ages at which members will retire.
Changes in these assumptions could impact future employee incentive expense and such changes could be material.
Management estimates the employee incentive liability annually with the assistance of independent actuaries. The estimate
of its employee incentive liability is based on future salary levels, completed years of service and ages at which members will
retire. Discount factors are determined close to each period-end by reference to government bonds that are denominated in
the currency in which the benefits will be paid and that have terms to maturity approximating to the terms of the related
pension liability.
Short-term employee benefits, including holiday entitlement, are current liabilities measured at the undiscounted amount that
the Group expects to pay as a result of the unused entitlement.
Provisions, contingent liabilities and contingent assets
Provisions are recognized when present obligations as a result of a past event that will more likely than not lead to an
outflow of economic resources from the Group and amounts can be estimated reliably. Timing or amount of the outflow may
still be uncertain. A present obligation arises from the presence of a legal or constructive commitment that has resulted from
past events, for example, legal disputes or onerous contracts.
Provisions are measured at the estimated expenditure required to settle the present obligation, based on the most reliable
evidence available at the reporting date, including the risks and uncertainties associated with the present obligation. Where
there are a number of similar obligations, the likelihood that an outflow will be required in settlement is determined by
considering the class of obligations as a whole. Provisions are discounted to their present values, where the time value of
money is material.
Any reimbursement that the Group can be virtually certain to collect from a third party with respect to the obligation is
recognized as a separate asset. However, this asset may not exceed the amount of the related provision.
All provisions are reviewed quarterly and adjusted to reflect the current best estimate.
Feronia Inc. Notes to the consolidated financial statements For the years ended December 31, 2015 and 2014 Expressed in United States Dollars, except where otherwise noted
16
In those cases where the possible outflow of economic resources as a result of present obligations is considered improbable
or remote, no liability is recognized, unless it was assumed in the course of a business combination. In a business
combination, contingent liabilities are recognized on the acquisition date when there is a present obligation that arises from
past events and the fair value can be measured reliably, even if the outflow of economic resources is not probable. They are
subsequently measured at the higher amount of a comparable provision as described above and the amount initially
recognized, less any amortization.
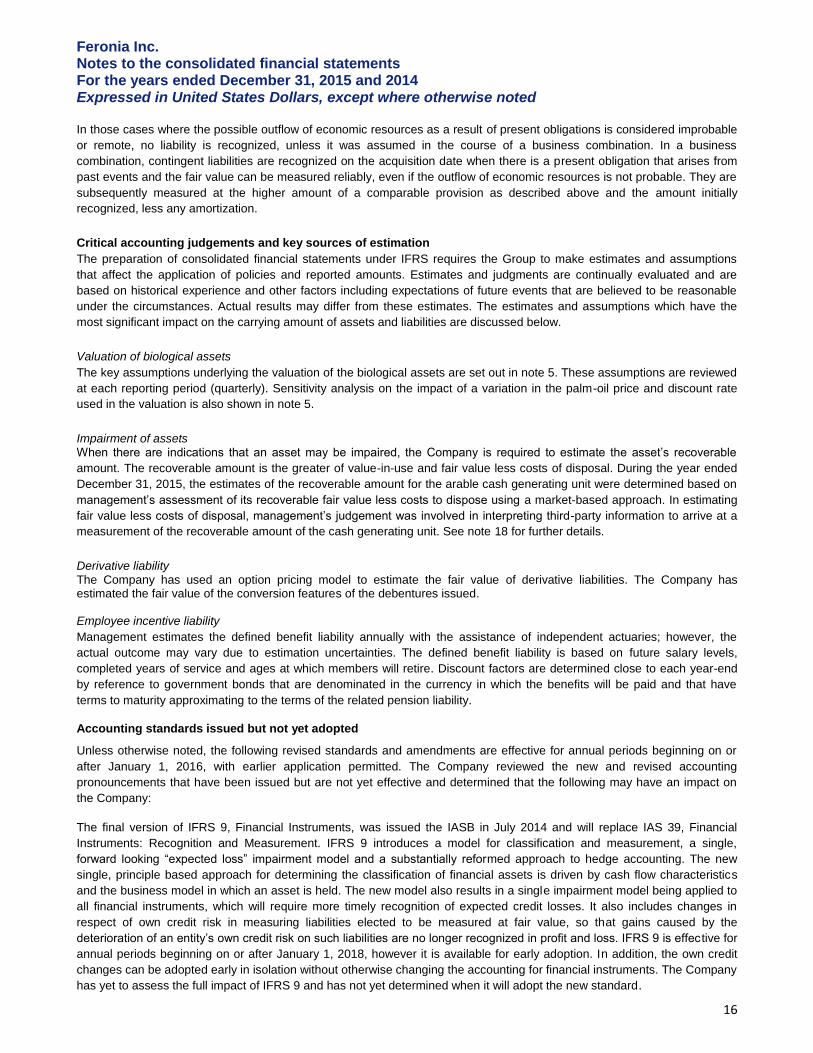
Critical accounting judgements and key sources of estimation
The preparation of consolidated financial statements under IFRS requires the Group to make estimates and assumptions
that affect the application of policies and reported amounts. Estimates and judgments are continually evaluated and are
based on historical experience and other factors including expectations of future events that are believed to be reasonable
under the circumstances. Actual results may differ from these estimates. The estimates and assumptions which have the
most significant impact on the carrying amount of assets and liabilities are discussed below.
Valuation of biological assets
The key assumptions underlying the valuation of the biological assets are set out in note 5. These assumptions are reviewed
at each reporting period (quarterly). Sensitivity analysis on the impact of a variation in the palm-oil price and discount rate
used in the valuation is also shown in note 5.
Impairment of assets When there are indications that an asset may be impaired, the Company is required to estimate the asset’s recoverable
amount. The recoverable amount is the greater of value-in-use and fair value less costs of disposal. During the year ended
December 31, 2015, the estimates of the recoverable amount for the arable cash generating unit were determined based on
management’s assessment of its recoverable fair value less costs to dispose using a market-based approach. In estimating
fair value less costs of disposal, management’s judgement was involved in interpreting third-party information to arrive at a
measurement of the recoverable amount of the cash generating unit. See note 18 for further details.
Derivative liability The Company has used an option pricing model to estimate the fair value of derivative liabilities. The Company has estimated the fair value of the conversion features of the debentures issued. Employee incentive liability
Management estimates the defined benefit liability annually with the assistance of independent actuaries; however, the
actual outcome may vary due to estimation uncertainties. The defined benefit liability is based on future salary levels,
completed years of service and ages at which members will retire. Discount factors are determined close to each year-end
by reference to government bonds that are denominated in the currency in which the benefits will be paid and that have
terms to maturity approximating to the terms of the related pension liability.
Accounting standards issued but not yet adopted
Unless otherwise noted, the following revised standards and amendments are effective for annual periods beginning on or
after January 1, 2016, with earlier application permitted. The Company reviewed the new and revised accounting
pronouncements that have been issued but are not yet effective and determined that the following may have an impact on
the Company:
The final version of IFRS 9, Financial Instruments, was issued the IASB in July 2014 and will replace IAS 39, Financial
Instruments: Recognition and Measurement. IFRS 9 introduces a model for classification and measurement, a single,
forward looking “expected loss” impairment model and a substantially reformed approach to hedge accounting. The new
single, principle based approach for determining the classification of financial assets is driven by cash flow characteristics
and the business model in which an asset is held. The new model also results in a single impairment model being applied to
all financial instruments, which will require more timely recognition of expected credit losses. It also includes changes in
respect of own credit risk in measuring liabilities elected to be measured at fair value, so that gains caused by the
deterioration of an entity’s own credit risk on such liabilities are no longer recognized in profit and loss. IFRS 9 is effec tive for
annual periods beginning on or after January 1, 2018, however it is available for early adoption. In addition, the own credit
changes can be adopted early in isolation without otherwise changing the accounting for financial instruments. The Company
has yet to assess the full impact of IFRS 9 and has not yet determined when it will adopt the new standard.
Feronia Inc. Notes to the consolidated financial statements For the years ended December 31, 2015 and 2014 Expressed in United States Dollars, except where otherwise noted
17
In May 2014, the IASB issued IFRS 15, Revenue from Contracts with Customers, supersedes IAS 18, Revenue, IAS 11
Construction Contracts and other interpretive guidance associated with revenue recognition. IFRS 15 provides a single
model to determine how and when an entity should recognize revenue, as well as requiring entities to provide more
informative, relevant disclosures in respect of its revenue recognition criteria. IFRS 15 is to be applied prospectively and is
effective for annual periods beginning on or after January 1, 2017, with earlier application permitted. The Corporation is in
the process of evaluating the impact that IFRS 15, may have on the Corporation’s consolidated financial statements.
In June 2014, the IASB issued amendments to IAS 16 and IAS 41which require biological assets that meet the definition of a bearer plant to be accounted for as property, plant and equipment in accordance with IAS 16. The amendments are to be applied prospectively and are effective for annual periods beginning on or after January 1, 2016, with earlier application permitted. The Corporation is in the process of evaluating the impact of adopting this amendment to its consolidated financial statements.
In January 2016, the IASB issued IFRS 16 – Leases which established the principles that an entity should use to determine
the recognition, measurement, presentation and disclosure of leases for both parties to a contract, i.e. the customer (‘lessee’) and the supplier (‘lessor’). IFRS 16 replaces that previous leases Standard, IAS 17, Leases, and related interpretations. IFRS 16 is effective from January 1, 2019 though a company can choose to apply IFRS 16 before that date but only in conjuction with IFRS 15, Revenue from Contracts with Customers. The Company is currently assessing the impact of this standard.
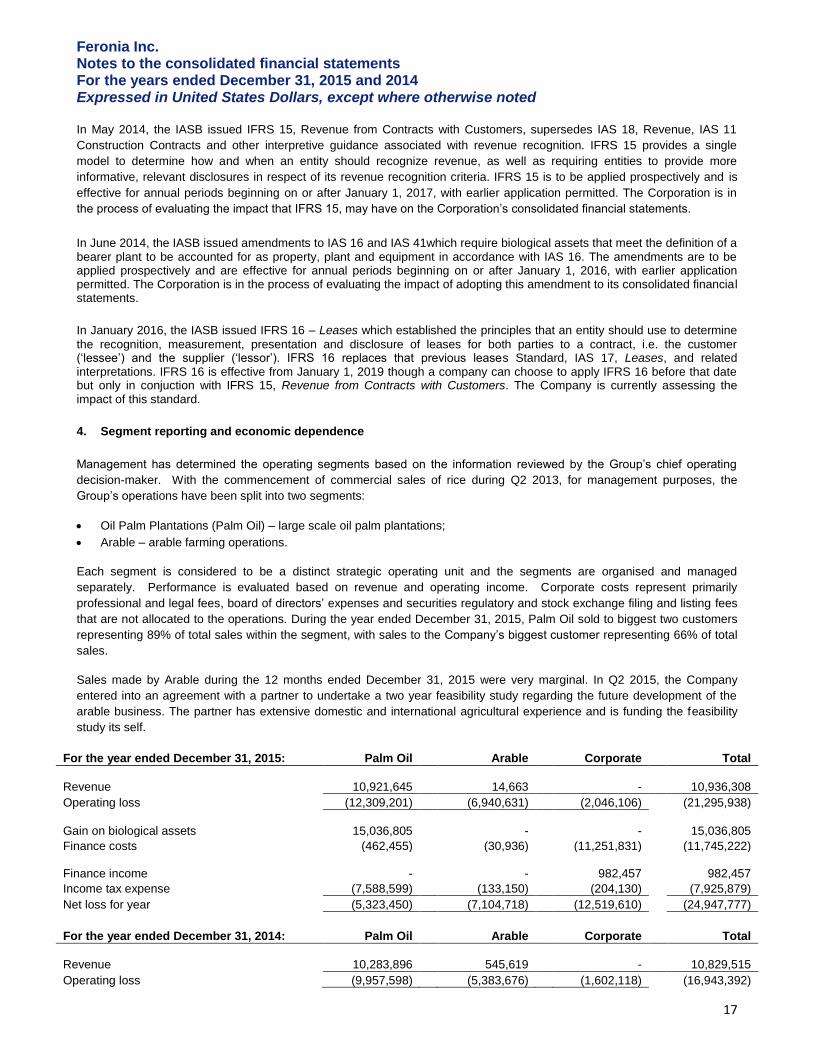
4. Segment reporting and economic dependence
Management has determined the operating segments based on the information reviewed by the Group’s chief operating
decision-maker. With the commencement of commercial sales of rice during Q2 2013, for management purposes, the
Group’s operations have been split into two segments:
Oil Palm Plantations (Palm Oil) – large scale oil palm plantations;
Arable – arable farming operations.
Each segment is considered to be a distinct strategic operating unit and the segments are organised and managed
separately. Performance is evaluated based on revenue and operating income. Corporate costs represent primarily
professional and legal fees, board of directors’ expenses and securities regulatory and stock exchange filing and listing fees
that are not allocated to the operations. During the year ended December 31, 2015, Palm Oil sold to biggest two customers
representing 89% of total sales within the segment, with sales to the Company’s biggest customer representing 66% of total
sales.
Sales made by Arable during the 12 months ended December 31, 2015 were very marginal. In Q2 2015, the Company
entered into an agreement with a partner to undertake a two year feasibility study regarding the future development of the
arable business. The partner has extensive domestic and international agricultural experience and is funding the feasibility
study its self.
For the year ended December 31, 2015: Palm Oil Arable Corporate Total
Revenue 10,921,645 14,663
- 10,936,308
Operating loss (12,309,201) (6,940,631) (2,046,106)
(21,295,938)
Gain on biological assets 15,036,805
-
-
15,036,805
Finance costs (462,455)
(30,936)
(11,251,831)
(11,745,222)
Finance income
-
-
982,457
982,457
Income tax expense (7,588,599)
(133,150)
(204,130)
(7,925,879)
Net loss for year (5,323,450) (7,104,718) (12,519,610)
(24,947,777)
For the year ended December 31, 2014: Palm Oil Arable Corporate Total
Revenue 10,283,896 545,619
- 10,829,515
Operating loss (9,957,598) (5,383,676) (1,602,118)
(16,943,392)
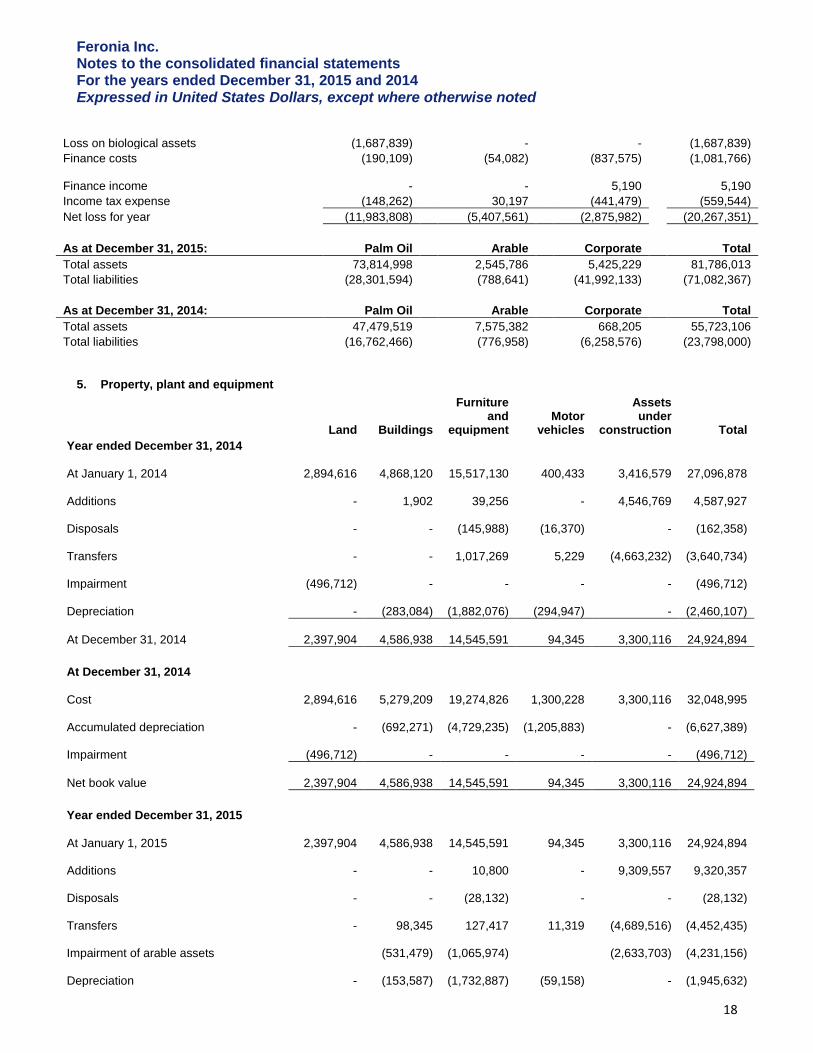
Feronia Inc. Notes to the consolidated financial statements For the years ended December 31, 2015 and 2014 Expressed in United States Dollars, except where otherwise noted
18
Loss on biological assets (1,687,839)
-
-
(1,687,839)
Finance costs (190,109)
(54,082)
(837,575)
(1,081,766)
Finance income
-
-
5,190
5,190
Income tax expense (148,262)
30,197
(441,479)
(559,544)
Net loss for year (11,983,808) (5,407,561) (2,875,982)
(20,267,351)
As at December 31, 2015: Palm Oil Arable Corporate Total
Total assets 73,814,998
2,545,786
5,425,229
81,786,013
Total liabilities (28,301,594)
(788,641)
(41,992,133)
(71,082,367)
As at December 31, 2014: Palm Oil Arable Corporate Total
Total assets 47,479,519
7,575,382
668,205
55,723,106
Total liabilities (16,762,466)
(776,958)
(6,258,576)
(23,798,000)
5. Property, plant and equipment
Land Buildings
Furniture and
equipment Motor
vehicles
Assets under
construction Total
Year ended December 31, 2014
At January 1, 2014
2,894,616
4,868,120
15,517,130
400,433 3,416,579
27,096,878
Additions
-
1,902
39,256
- 4,546,769
4,587,927
Disposals
-
-
(145,988)
(16,370) -
(162,358)
Transfers
-
-
1,017,269
5,229
(4,663,232)
(3,640,734)
Impairment
(496,712)
-
-
- -
(496,712)
Depreciation
-
(283,084)
(1,882,076)
(294,947) -
(2,460,107)
At December 31, 2014
2,397,904
4,586,938
14,545,591
94,345 3,300,116
24,924,894
At December 31, 2014
Cost
2,894,616
5,279,209
19,274,826
1,300,228 3,300,116
32,048,995
Accumulated depreciation
-
(692,271)
(4,729,235)
(1,205,883) -
(6,627,389)
Impairment
(496,712)
-
-
- -
(496,712)
Net book value
2,397,904
4,586,938
14,545,591
94,345 3,300,116
24,924,894
Year ended December 31, 2015
At January 1, 2015
2,397,904
4,586,938
14,545,591
94,345 3,300,116
24,924,894
Additions
-
-
10,800
- 9,309,557
9,320,357
Disposals
-
-
(28,132)
- -
(28,132)
Transfers
-
98,345
127,417
11,319
(4,689,516)
(4,452,435)
Impairment of arable assets
(531,479)
(1,065,974)
(2,633,703)
(4,231,156)
Depreciation
-
(153,587)
(1,732,887)
(59,158) -
(1,945,632)
Feronia Inc. Notes to the consolidated financial statements For the years ended December 31, 2015 and 2014 Expressed in United States Dollars, except where otherwise noted
19
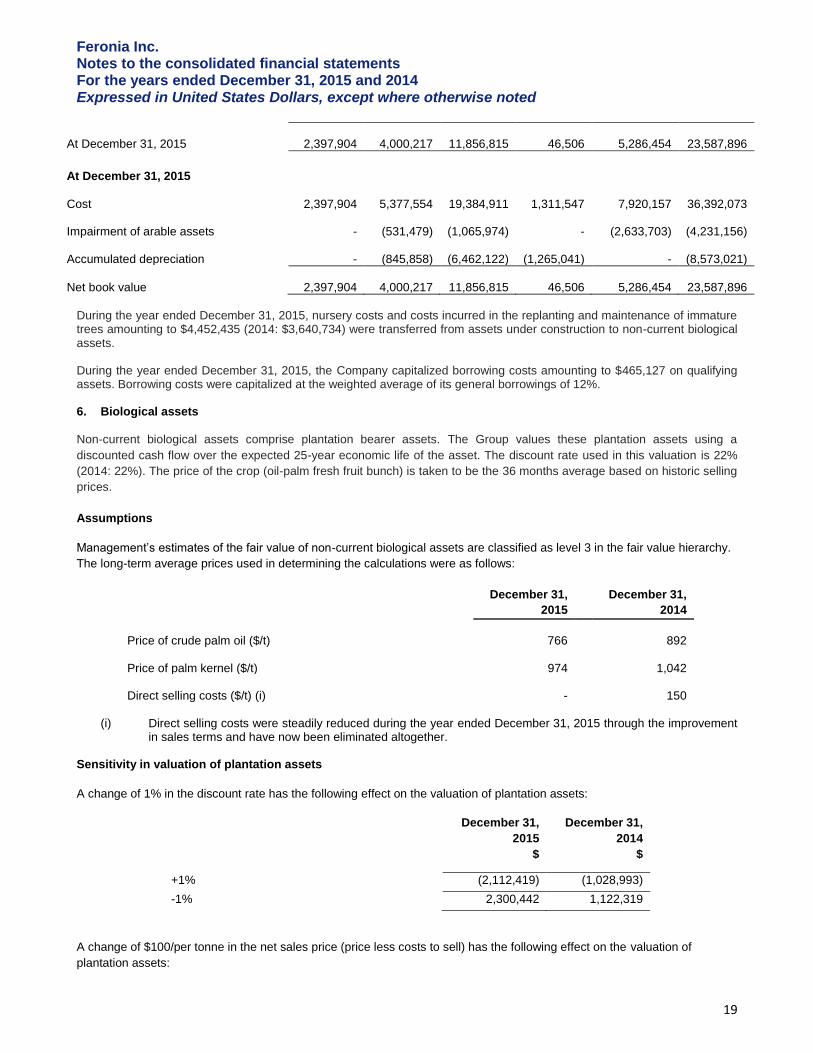
At December 31, 2015
2,397,904
4,000,217
11,856,815
46,506 5,286,454
23,587,896
At December 31, 2015
Cost
2,397,904
5,377,554
19,384,911
1,311,547 7,920,157
36,392,073
Impairment of arable assets
-
(531,479)
(1,065,974)
-
(2,633,703)
(4,231,156)
Accumulated depreciation
-
(845,858)
(6,462,122)
(1,265,041) -
(8,573,021)
Net book value
2,397,904
4,000,217
11,856,815
46,506 5,286,454
23,587,896
During the year ended December 31, 2015, nursery costs and costs incurred in the replanting and maintenance of immature trees amounting to $4,452,435 (2014: $3,640,734) were transferred from assets under construction to non-current biological assets. During the year ended December 31, 2015, the Company capitalized borrowing costs amounting to $465,127 on qualifying assets. Borrowing costs were capitalized at the weighted average of its general borrowings of 12%. 6. Biological assets
Non-current biological assets comprise plantation bearer assets. The Group values these plantation assets using a
discounted cash flow over the expected 25-year economic life of the asset. The discount rate used in this valuation is 22%
(2014: 22%). The price of the crop (oil-palm fresh fruit bunch) is taken to be the 36 months average based on historic selling
prices.
Assumptions
Management’s estimates of the fair value of non-current biological assets are classified as level 3 in the fair value hierarchy.
The long-term average prices used in determining the calculations were as follows:
December 31,
December 31,
2015 2014
Price of crude palm oil ($/t)
766
892
Price of palm kernel ($/t)
974
1,042
Direct selling costs ($/t) (i)
-
150
(i) Direct selling costs were steadily reduced during the year ended December 31, 2015 through the improvement
in sales terms and have now been eliminated altogether. Sensitivity in valuation of plantation assets
A change of 1% in the discount rate has the following effect on the valuation of plantation assets:
December 31,
2015
$
December 31,
2014
$
+1% (2,112,419) (1,028,993)
-1% 2,300,442 1,122,319
A change of $100/per tonne in the net sales price (price less costs to sell) has the following effect on the valuation of
plantation assets:
Feronia Inc. Notes to the consolidated financial statements For the years ended December 31, 2015 and 2014 Expressed in United States Dollars, except where otherwise noted
20
December 31,
2015
$
December 31,
2014
$
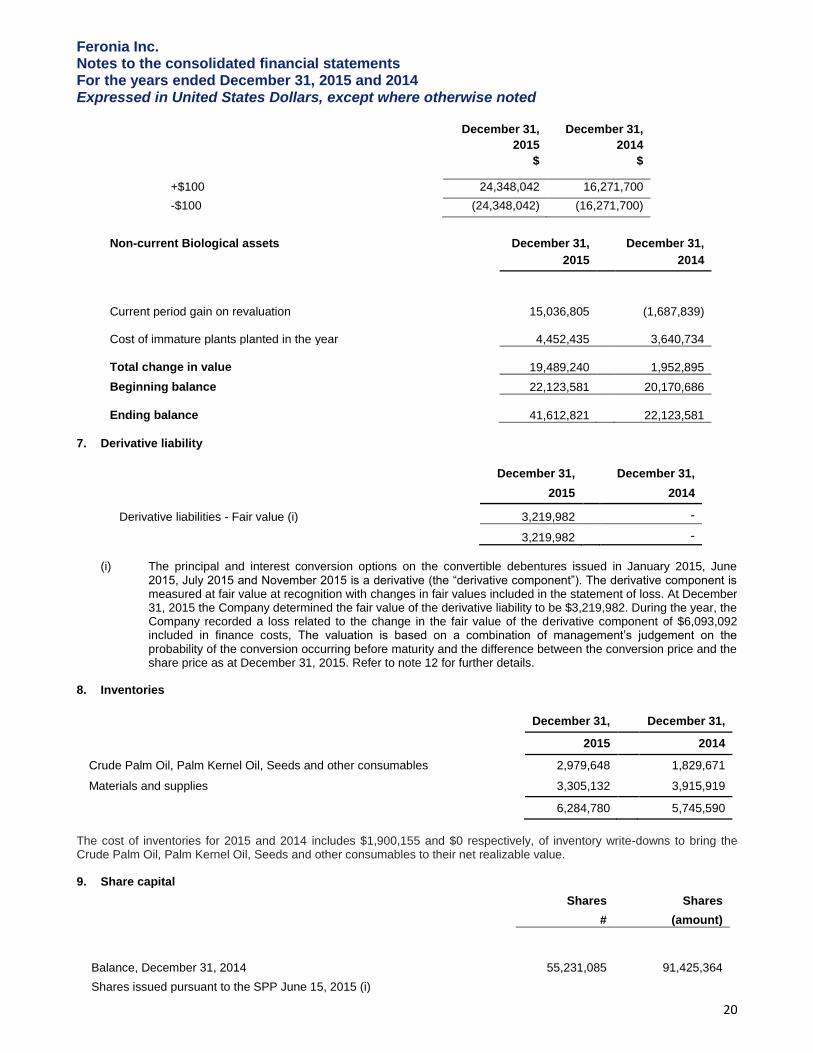
+$100 24,348,042 16,271,700
-$100 (24,348,042) (16,271,700)
Non-current Biological assets
December 31,
December 31,
2015 2014
Current period gain on revaluation
15,036,805
(1,687,839)
Cost of immature plants planted in the year
4,452,435
3,640,734
Total change in value
19,489,240
1,952,895
Beginning balance
22,123,581
20,170,686
Ending balance
41,612,821
22,123,581
7. Derivative liability
December 31,
December 31,
2015 2014
Derivative liabilities - Fair value (i)
3,219,982
-
3,219,982 -
(i) The principal and interest conversion options on the convertible debentures issued in January 2015, June 2015, July 2015 and November 2015 is a derivative (the “derivative component”). The derivative component is measured at fair value at recognition with changes in fair values included in the statement of loss. At December 31, 2015 the Company determined the fair value of the derivative liability to be $3,219,982. During the year, the Company recorded a loss related to the change in the fair value of the derivative component of $6,093,092 included in finance costs, The valuation is based on a combination of management’s judgement on the probability of the conversion occurring before maturity and the difference between the conversion price and the share price as at December 31, 2015. Refer to note 12 for further details.
8. Inventories
December 31, December 31,
2015 2014
Crude Palm Oil, Palm Kernel Oil, Seeds and other consumables 2,979,648
1,829,671
Materials and supplies 3,305,132
3,915,919
6,284,780 5,745,590
The cost of inventories for 2015 and 2014 includes $1,900,155 and $0 respectively, of inventory write-downs to bring the Crude Palm Oil, Palm Kernel Oil, Seeds and other consumables to their net realizable value.
9. Share capital
Shares
Shares
# (amount)
Balance, December 31, 2014
55,231,085
91,425,364
Shares issued pursuant to the SPP June 15, 2015 (i)
Feronia Inc. Notes to the consolidated financial statements For the years ended December 31, 2015 and 2014 Expressed in United States Dollars, except where otherwise noted
21
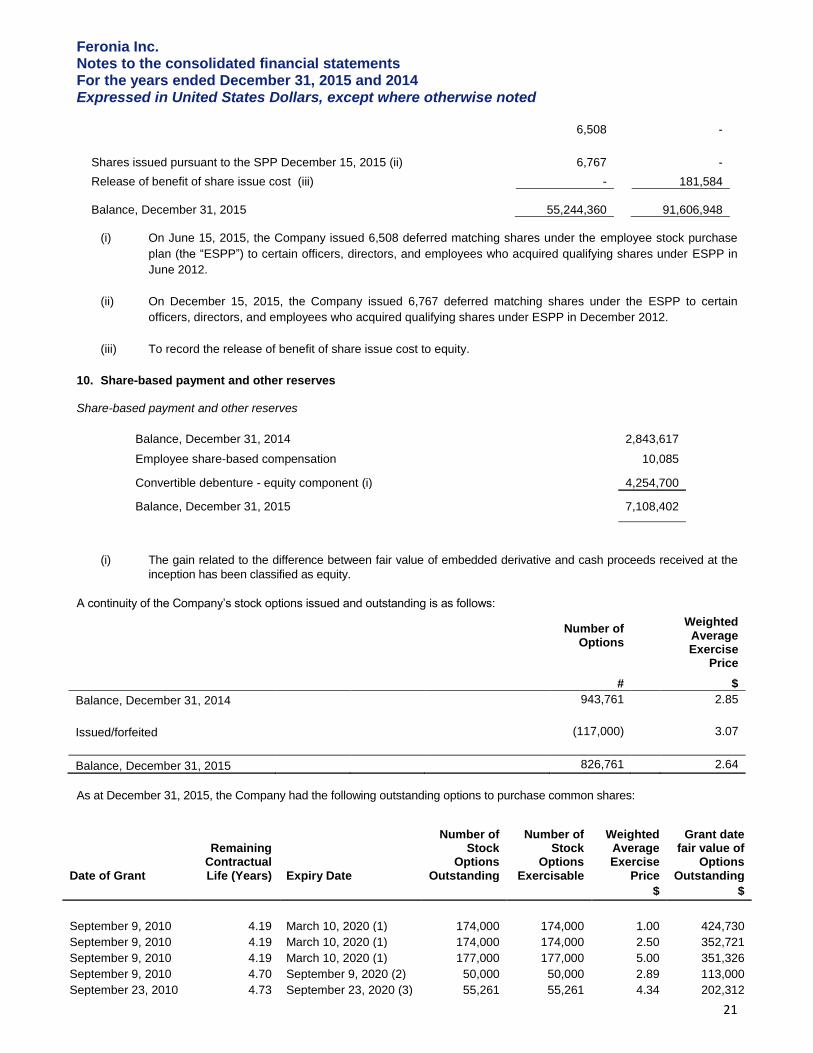
6,508 -
Shares issued pursuant to the SPP December 15, 2015 (ii)
6,767 -
Release of benefit of share issue cost (iii)
-
181,584
Balance, December 31, 2015
55,244,360
91,606,948
(i) On June 15, 2015, the Company issued 6,508 deferred matching shares under the employee stock purchase
plan (the “ESPP”) to certain officers, directors, and employees who acquired qualifying shares under ESPP in
June 2012.
(ii) On December 15, 2015, the Company issued 6,767 deferred matching shares under the ESPP to certain
officers, directors, and employees who acquired qualifying shares under ESPP in December 2012.
(iii) To record the release of benefit of share issue cost to equity.
10. Share-based payment and other reserves Share-based payment and other reserves
Balance, December 31, 2014
2,843,617
Employee share-based compensation
10,085
Convertible debenture - equity component (i) 4,254,700
Balance, December 31, 2015
7,108,402
(i) The gain related to the difference between fair value of embedded derivative and cash proceeds received at the
inception has been classified as equity.
A continuity of the Company’s stock options issued and outstanding is as follows:
Number of Options
Weighted Average Exercise
Price
#
$
Balance, December 31, 2014
943,761
2.85
Issued/forfeited
(117,000)
3.07
Balance, December 31, 2015 826,761 2.64
As at December 31, 2015, the Company had the following outstanding options to purchase common shares:
Date of Grant
Remaining Contractual Life (Years) Expiry Date
Number of Stock
Options Outstanding
Number of Stock
Options Exercisable
Weighted Average Exercise
Price
Grant date fair value of
Options Outstanding
$ $
September 9, 2010 4.19 March 10, 2020 (1) 174,000 174,000 1.00 424,730
September 9, 2010 4.19 March 10, 2020 (1) 174,000 174,000 2.50 352,721
September 9, 2010 4.19 March 10, 2020 (1) 177,000 177,000 5.00 351,326
September 9, 2010 4.70 September 9, 2020 (2) 50,000 50,000 2.89 113,000
September 23, 2010 4.73 September 23, 2020 (3) 55,261 55,261 4.34 202,312
Feronia Inc. Notes to the consolidated financial statements For the years ended December 31, 2015 and 2014 Expressed in United States Dollars, except where otherwise noted
22
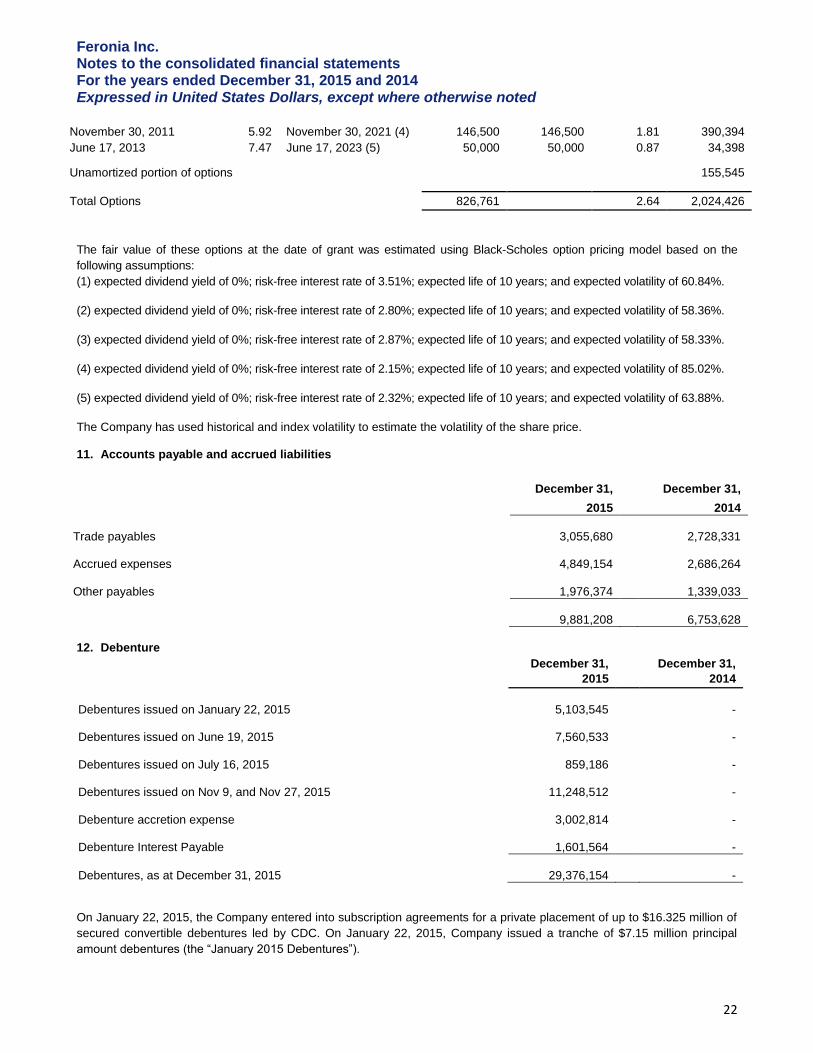
November 30, 2011 5.92 November 30, 2021 (4) 146,500 146,500 1.81 390,394
June 17, 2013 7.47 June 17, 2023 (5) 50,000 50,000 0.87 34,398
Unamortized portion of options
155,545
Total Options
826,761 2.64 2,024,426
The fair value of these options at the date of grant was estimated using Black-Scholes option pricing model based on the
following assumptions:
(1) expected dividend yield of 0%; risk-free interest rate of 3.51%; expected life of 10 years; and expected volatility of 60.84%.
(2) expected dividend yield of 0%; risk-free interest rate of 2.80%; expected life of 10 years; and expected volatility of 58.36%.
(3) expected dividend yield of 0%; risk-free interest rate of 2.87%; expected life of 10 years; and expected volatility of 58.33%.
(4) expected dividend yield of 0%; risk-free interest rate of 2.15%; expected life of 10 years; and expected volatility of 85.02%.
(5) expected dividend yield of 0%; risk-free interest rate of 2.32%; expected life of 10 years; and expected volatility of 63.88%.
The Company has used historical and index volatility to estimate the volatility of the share price. 11. Accounts payable and accrued liabilities
December 31,
December 31,
2015 2014
Trade payables
3,055,680
2,728,331
Accrued expenses
4,849,154
2,686,264
Other payables
1,976,374
1,339,033
9,881,208
6,753,628
12. Debenture
December 31,
December 31,
2015 2014
Debentures issued on January 22, 2015
5,103,545
-
Debentures issued on June 19, 2015
7,560,533
-
Debentures issued on July 16, 2015
859,186
-
Debentures issued on Nov 9, and Nov 27, 2015
11,248,512
-
Debenture accretion expense
3,002,814
-
Debenture Interest Payable
1,601,564
-
Debentures, as at December 31, 2015
29,376,154
-
On January 22, 2015, the Company entered into subscription agreements for a private placement of up to $16.325 million of
secured convertible debentures led by CDC. On January 22, 2015, Company issued a tranche of $7.15 million principal
amount debentures (the “January 2015 Debentures”).
Feronia Inc. Notes to the consolidated financial statements For the years ended December 31, 2015 and 2014 Expressed in United States Dollars, except where otherwise noted
23
On June 19, 2015, the Company entered into subscription agreements with CDC and the African Agriculture Fund (“AAF”),
through its subsidiary Golden Oil Holdings Limited (“GOHL”), for the private placement of $9.18 million secured convertible
debentures completing the previously announced private placement of secured convertible debentures. The first tranche of
$8,196,500 principal amount of debentures was issued on June 19, 2015 and on July 16, 2015, the issuance of the second
tranche of $983,500 secured convertible debentures was completed with AAF through its subsidiary Golden Oil Holdings
Limited (collectively, the “June/July 2015 Debentures”).
On November 9, 2015, the Company completed the first tranche of the private placement of secured convertible debentures
with CDC in the principal amount of $10 million and on November 27, 2015, the second tranche of the private placement of
secured convertible debentures with AAF through its subsidiary GOHL in the principal amount of $1.8 million (collectively,
the “November 2015 Debentures”). The terms of the convertible debentures are the same as the June/July 2015
Debentures.
Concurrently with the issuance of the June/July 2015 Debentures, the Company amended the terms of the January 2015
Debentures (the “Amended January 2015 Debentures”). The amendments included: (i) amending the conversion terms, so
that the Amended January 2015 Debentures are convertible into common shares rather than units comprised of common
shares and warrants (the “Units”); (ii) reducing the conversion price from CDN$0.80 per Unit or CDN$0.45 per Unit if the
Company does not complete a Qualified Debt Financing (as defined in the January 2015 Debentures) to CDN$0.25 per
common share or CDN$0.14 per common share if the Company does not complete an Amended Debt Financing (as defined
in the Amended January 2015 Debentures); and (ii) deleting the concept of a “Qualified Debt Financing” and replacing it with
an “Amended Debt Financing”.
Upon conversion, the principal and interest on the debentures shall first be converted into Canadian dollars at a fixed
exchange rate of CDN$1.20 per US$1.00. The Canadian dollar equivalent of the principal amount of the Amended January
2015 Debentures, June/July 2015 Debentures and November 2015 Debentures (collectively, the “2015 Debentures”) is
convertible into common shares of the Company at a rate of CDN$0.14 per common share as the Company did not
complete a drawdown on the Amended Debt Financing (as defined in the 2015 Debentures) prior to December 31, 2015.
Interest on the 2015 Debentures is 12% per annum, compounded semi-annually, and shall accrue and be payable upon
maturity, unless converted earlier. The 2015 Debentures contain a guaranteed interest provision. Notwithstanding the
foregoing, the guaranteed interest provisions shall not apply as the Amended Debt Financing was not completed by
December 31, 2015. Upon conversion, the Canadian dollar equivalent of the accrued interest on the 2015 Debentures shall,
subject to the approval of the TSX Venture Exchange (“TSXV”), be convertible into common shares at a per share price
equal to the greater of CDN$0.14 and the Discounted Market Price (as defined in the policies of the TSXV) at the time of
conversion as the Amended Debt Financing was not completed by December 31, 2015. The 2015 Debentures will mature
and, if not converted, will become due on January 22, 2016, being one year from the issuance date of the January 2015
Debentures. At any time prior to or after maturity, the 2015 Debentures may be converted at the option of the holder. The
Debentures shall automatically convert in the event that the Company draws down on an Amended Debt Financing. The
maturity of the debentures extended till April 13, 2016 and all the 2015 Debentures and interests were converted in to shares
on April 13, 2016.
Each of the subscribers of the Debentures received a 2% placement fee on the amount of the Debentures purchased.
Proceeds from the Debentures were used for working capital purposes and, in particular, to provide expansion capital for the
Company's subsidiaries in the DRC.
The secured convertible debentures, warrants liability and derivative liability have been valued using the Cox-Ross-
Rubenstein (CRR) binomial tree method to model the underlying stock price. The main inputs for valuations were obtained
from Bloomberg are:
(a) Underlying stock;
(b) Underlying stock volatility – The stock volatility calculated at the valuation date is 53.18%;
(c) CAD discount curve;
(d) USD/CAD FX rate; and
Feronia Inc. Notes to the consolidated financial statements For the years ended December 31, 2015 and 2014 Expressed in United States Dollars, except where otherwise noted
24
(e) Credit spread – The credit spread obtained at the valuation date is 30.8%.
On the date of issuance, the fair value of the January 2015 Debentures without conversion option is estimated at $5,421,850
and the fair value after deducting the issuing cost ($175,305) and placement fees ($143,000), is $5,103,545.
On the date of issuance the fair value of the June 2015 debentures issued on June 19, 2015 without conversion option is
estimated at $7,790,900 and the fair value after deducting the issuing cost ($66,393) and placement fees ($163,930), is
$7,560,533.
On the date of issuance the fair value of the July 2015 debentures issued on July 16, 2015 without conversion option is
estimated at $952,020 and the fair value after deducting the issuing cost ($73,164) and placement fees ($19,670), is
$859,186.
Also on the date of issuance the fair value of the November 2015 debentures issued on November 9, 2015 without
conversion option is estimated at $9,800,620 and the debenture issued on November 27, 2015 without the conversion option
is estimated at $1,708,638. The fair value November 2015 Debenture after deducting the issuing cost ($96,746) and
placement fees ($236,000), is $11,248,512.
Using the effecting interest method the interest accretion as of December 31, 2015 is $3,002,814. As of December 31, 2015,
the carrying value of the 2015 Debentures (including accretion and interest) was $29,376,154.
The value of the 2015 Debentures is classified as a current liability, and will be accreted to the face value through a periodic
charge to accretion expense, with a corresponding credit to the liability component over the one-year term. This accretion is
based on the effective interest method.
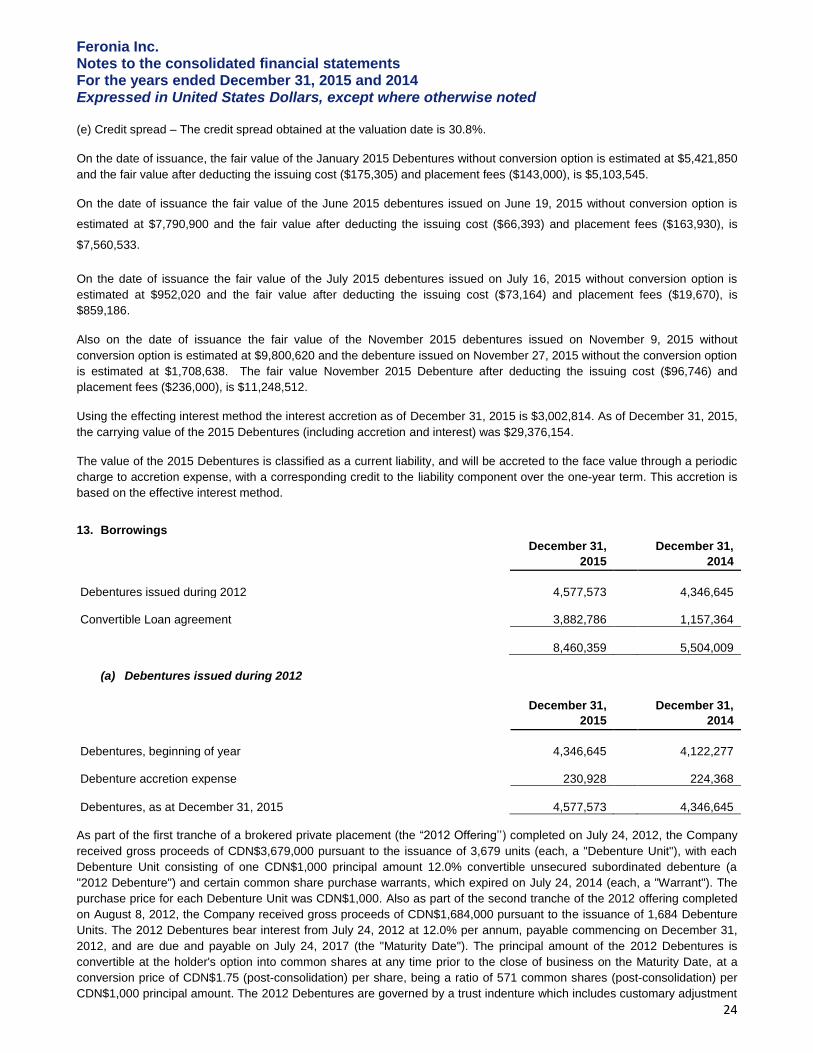
13. Borrowings
December 31,
December 31,
2015 2014
Debentures issued during 2012
4,577,573
4,346,645
Convertible Loan agreement
3,882,786
1,157,364
8,460,359
5,504,009
(a) Debentures issued during 2012
December 31,
December 31,
2015 2014
Debentures, beginning of year 4,346,645
4,122,277
Debenture accretion expense
230,928
224,368
Debentures, as at December 31, 2015
4,577,573
4,346,645
As part of the first tranche of a brokered private placement (the “2012 Offering’’) completed on July 24, 2012, the Company
received gross proceeds of CDN$3,679,000 pursuant to the issuance of 3,679 units (each, a "Debenture Unit"), with each
Debenture Unit consisting of one CDN$1,000 principal amount 12.0% convertible unsecured subordinated debenture (a
"2012 Debenture") and certain common share purchase warrants, which expired on July 24, 2014 (each, a "Warrant"). The
purchase price for each Debenture Unit was CDN$1,000. Also as part of the second tranche of the 2012 offering completed
on August 8, 2012, the Company received gross proceeds of CDN$1,684,000 pursuant to the issuance of 1,684 Debenture
Units. The 2012 Debentures bear interest from July 24, 2012 at 12.0% per annum, payable commencing on December 31,
2012, and are due and payable on July 24, 2017 (the "Maturity Date"). The principal amount of the 2012 Debentures is
convertible at the holder's option into common shares at any time prior to the close of business on the Maturity Date, at a
conversion price of CDN$1.75 (post-consolidation) per share, being a ratio of 571 common shares (post-consolidation) per
CDN$1,000 principal amount. The 2012 Debentures are governed by a trust indenture which includes customary adjustment
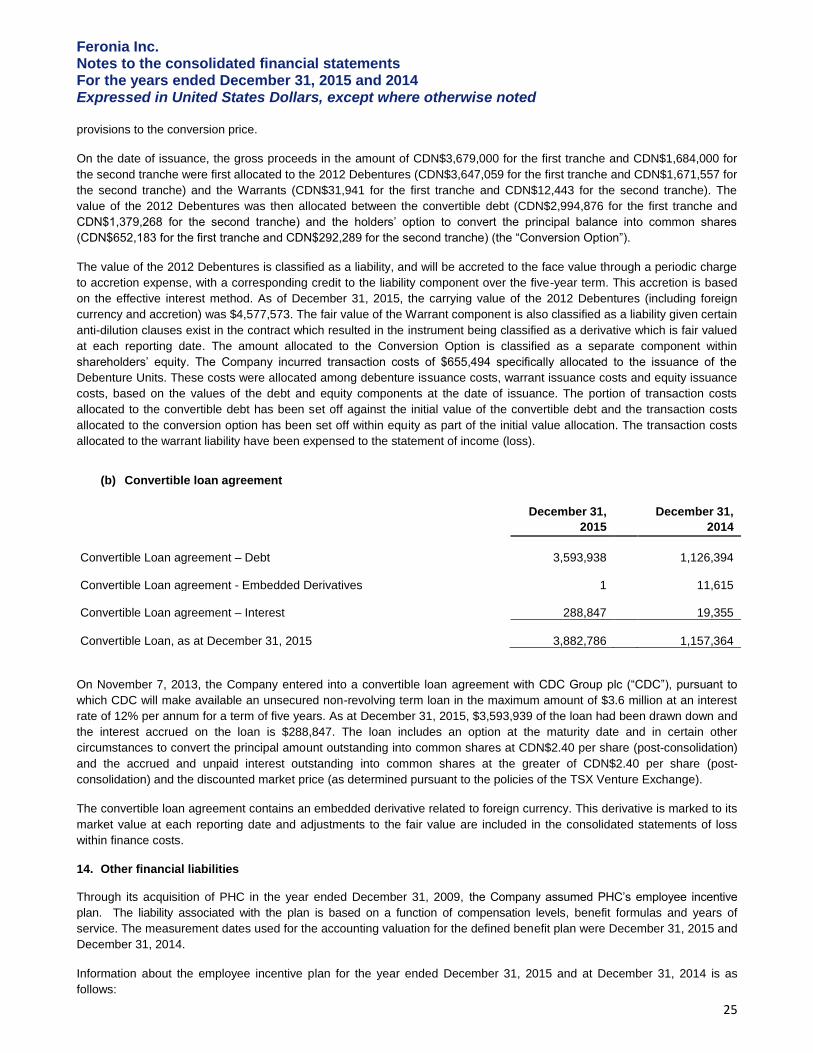
Feronia Inc. Notes to the consolidated financial statements For the years ended December 31, 2015 and 2014 Expressed in United States Dollars, except where otherwise noted
25
provisions to the conversion price.
On the date of issuance, the gross proceeds in the amount of CDN$3,679,000 for the first tranche and CDN$1,684,000 for
the second tranche were first allocated to the 2012 Debentures (CDN$3,647,059 for the first tranche and CDN$1,671,557 for
the second tranche) and the Warrants (CDN$31,941 for the first tranche and CDN$12,443 for the second tranche). The
value of the 2012 Debentures was then allocated between the convertible debt (CDN$2,994,876 for the first tranche and
CDN$1,379,268 for the second tranche) and the holders’ option to convert the principal balance into common shares
(CDN$652,183 for the first tranche and CDN$292,289 for the second tranche) (the “Conversion Option”).
The value of the 2012 Debentures is classified as a liability, and will be accreted to the face value through a periodic charge
to accretion expense, with a corresponding credit to the liability component over the five-year term. This accretion is based
on the effective interest method. As of December 31, 2015, the carrying value of the 2012 Debentures (including foreign
currency and accretion) was $4,577,573. The fair value of the Warrant component is also classified as a liability given certain
anti-dilution clauses exist in the contract which resulted in the instrument being classified as a derivative which is fair valued
at each reporting date. The amount allocated to the Conversion Option is classified as a separate component within
shareholders’ equity. The Company incurred transaction costs of $655,494 specifically allocated to the issuance of the
Debenture Units. These costs were allocated among debenture issuance costs, warrant issuance costs and equity issuance
costs, based on the values of the debt and equity components at the date of issuance. The portion of transaction costs
allocated to the convertible debt has been set off against the initial value of the convertible debt and the transaction costs
allocated to the conversion option has been set off within equity as part of the initial value allocation. The transaction costs
allocated to the warrant liability have been expensed to the statement of income (loss).
(b) Convertible loan agreement
December 31,
December 31,
2015 2014
Convertible Loan agreement – Debt
3,593,938
1,126,394
Convertible Loan agreement - Embedded Derivatives
1
11,615
Convertible Loan agreement – Interest
288,847
19,355
Convertible Loan, as at December 31, 2015
3,882,786
1,157,364
On November 7, 2013, the Company entered into a convertible loan agreement with CDC Group plc (“CDC”), pursuant to
which CDC will make available an unsecured non-revolving term loan in the maximum amount of $3.6 million at an interest
rate of 12% per annum for a term of five years. As at December 31, 2015, $3,593,939 of the loan had been drawn down and
the interest accrued on the loan is $288,847. The loan includes an option at the maturity date and in certain other
circumstances to convert the principal amount outstanding into common shares at CDN$2.40 per share (post-consolidation)
and the accrued and unpaid interest outstanding into common shares at the greater of CDN$2.40 per share (post-
consolidation) and the discounted market price (as determined pursuant to the policies of the TSX Venture Exchange).
The convertible loan agreement contains an embedded derivative related to foreign currency. This derivative is marked to its
market value at each reporting date and adjustments to the fair value are included in the consolidated statements of loss
within finance costs.
14. Other financial liabilities
Through its acquisition of PHC in the year ended December 31, 2009, the Company assumed PHC’s employee incentive
plan. The liability associated with the plan is based on a function of compensation levels, benefit formulas and years of
service. The measurement dates used for the accounting valuation for the defined benefit plan were December 31, 2015 and
December 31, 2014.
Information about the employee incentive plan for the year ended December 31, 2015 and at December 31, 2014 is as
follows:
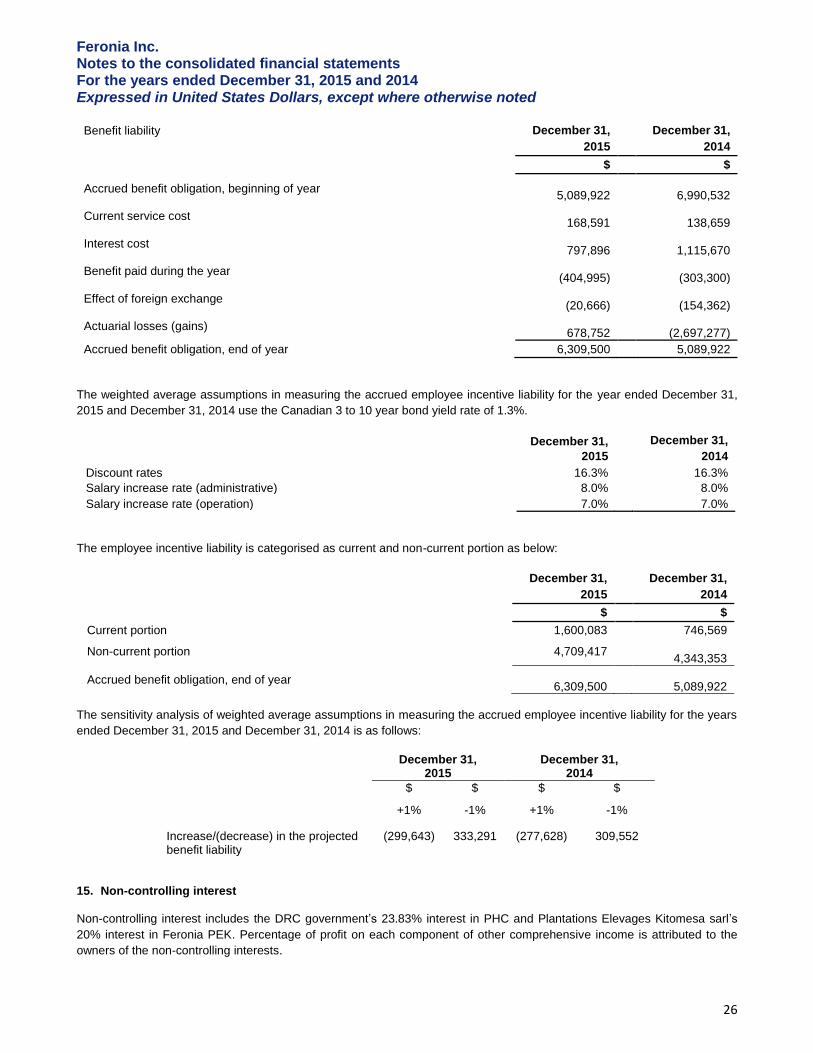
Feronia Inc. Notes to the consolidated financial statements For the years ended December 31, 2015 and 2014 Expressed in United States Dollars, except where otherwise noted
26
Benefit liability December 31,
December 31,
2015 2014
$ $
Accrued benefit obligation, beginning of year
5,089,922
6,990,532
Current service cost
168,591
138,659
Interest cost
797,896
1,115,670
Benefit paid during the year
(404,995)
(303,300)
Effect of foreign exchange
(20,666)
(154,362)
Actuarial losses (gains)
678,752
(2,697,277)
Accrued benefit obligation, end of year 6,309,500 5,089,922
The weighted average assumptions in measuring the accrued employee incentive liability for the year ended December 31,
2015 and December 31, 2014 use the Canadian 3 to 10 year bond yield rate of 1.3%.
December 31,
December 31,
2015
2014
Discount rates 16.3%
16.3%
Salary increase rate (administrative) 8.0%
8.0%
Salary increase rate (operation) 7.0% 7.0%
The employee incentive liability is categorised as current and non-current portion as below:
December 31,
December 31,
2015 2014
$ $
Current portion 1,600,083
746,569
Non-current portion 4,709,417
4,343,353
Accrued benefit obligation, end of year
6,309,500
5,089,922
The sensitivity analysis of weighted average assumptions in measuring the accrued employee incentive liability for the years
ended December 31, 2015 and December 31, 2014 is as follows:
December 31, 2015
December 31, 2014
$ $ $ $
+1% -1% +1% -1%
Increase/(decrease) in the projected benefit liability
(299,643) 333,291 (277,628) 309,552
15. Non-controlling interest
Non-controlling interest includes the DRC government’s 23.83% interest in PHC and Plantations Elevages Kitomesa sarl’s
20% interest in Feronia PEK. Percentage of profit on each component of other comprehensive income is attributed to the
owners of the non-controlling interests.
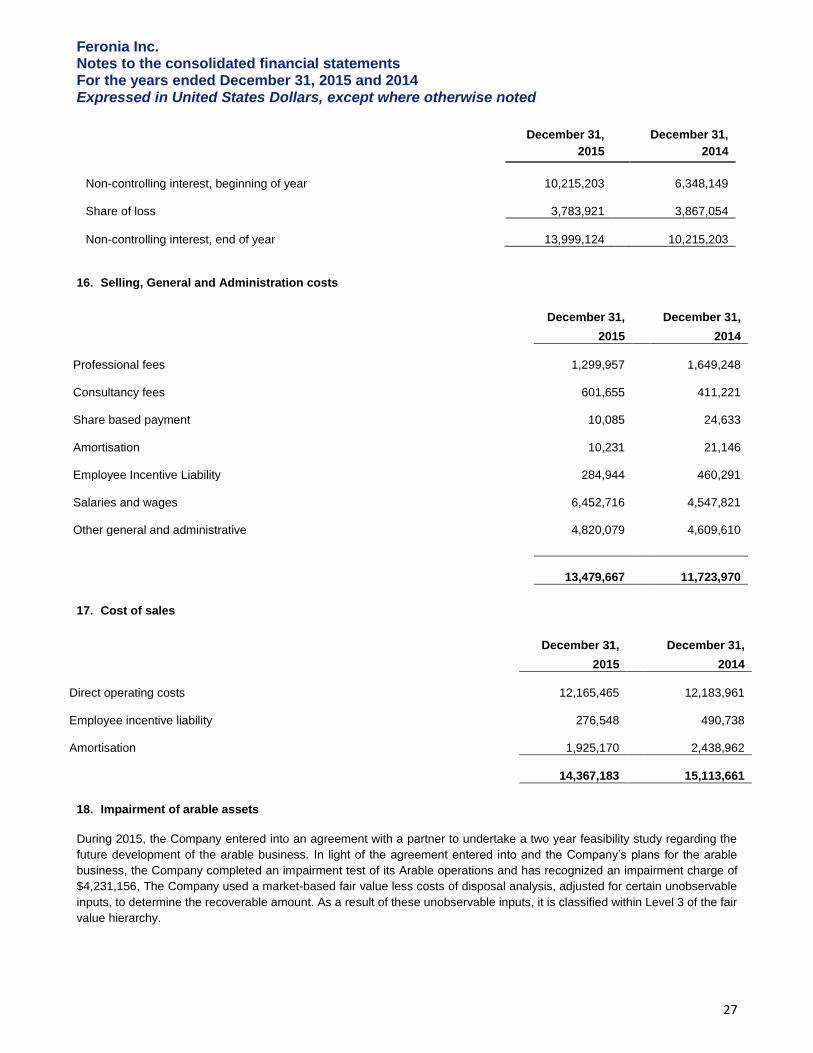
Feronia Inc. Notes to the consolidated financial statements For the years ended December 31, 2015 and 2014 Expressed in United States Dollars, except where otherwise noted
27
December 31,
December 31,
2015 2014
Non-controlling interest, beginning of year
10,215,203
6,348,149
Share of loss
3,783,921
3,867,054
Non-controlling interest, end of year
13,999,124
10,215,203
16. Selling, General and Administration costs
December 31,
December 31,
2015 2014
Professional fees
1,299,957
1,649,248
Consultancy fees
601,655
411,221
Share based payment
10,085
24,633
Amortisation
10,231
21,146
Employee Incentive Liability
284,944
460,291
Salaries and wages
6,452,716
4,547,821
Other general and administrative
4,820,079
4,609,610
13,479,667
11,723,970
17. Cost of sales
December 31,
December 31,
2015 2014
Direct operating costs
12,165,465
12,183,961
Employee incentive liability
276,548
490,738
Amortisation
1,925,170
2,438,962
14,367,183
15,113,661
18. Impairment of arable assets
During 2015, the Company entered into an agreement with a partner to undertake a two year feasibility study regarding the
future development of the arable business. In light of the agreement entered into and the Company’s plans for the arable
business, the Company completed an impairment test of its Arable operations and has recognized an impairment charge of
$4,231,156, The Company used a market-based fair value less costs of disposal analysis, adjusted for certain unobservable
inputs, to determine the recoverable amount. As a result of these unobservable inputs, it is classified within Level 3 of the fair
value hierarchy.
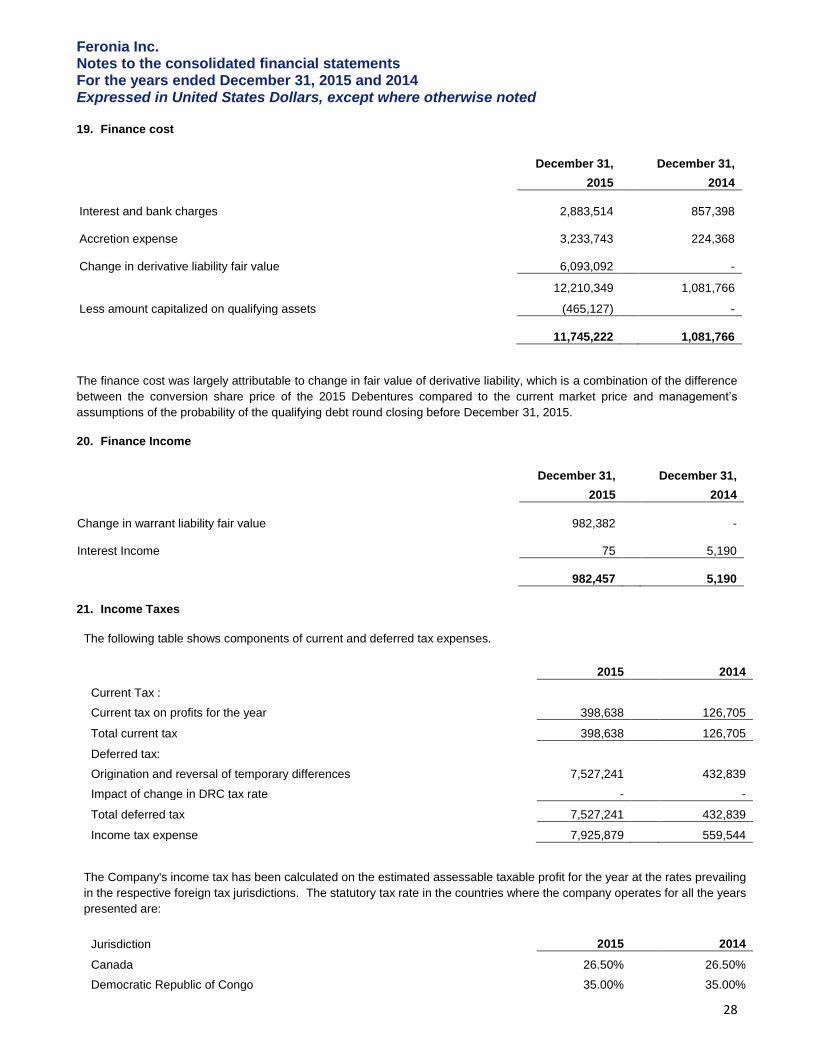
Feronia Inc. Notes to the consolidated financial statements For the years ended December 31, 2015 and 2014 Expressed in United States Dollars, except where otherwise noted
28
19. Finance cost
December 31,
December 31,
2015 2014
Interest and bank charges
2,883,514
857,398
Accretion expense
3,233,743
224,368
Change in derivative liability fair value
6,093,092
-
12,210,349 1,081,766
Less amount capitalized on qualifying assets (465,127) -
11,745,222
1,081,766
The finance cost was largely attributable to change in fair value of derivative liability, which is a combination of the difference
between the conversion share price of the 2015 Debentures compared to the current market price and management’s
assumptions of the probability of the qualifying debt round closing before December 31, 2015.
20. Finance Income
December 31,
December 31,
2015 2014
Change in warrant liability fair value
982,382
-
Interest Income
75
5,190
982,457
5,190
21. Income Taxes
The following table shows components of current and deferred tax expenses.
2015
2014
Current Tax :
Current tax on profits for the year
398,638
126,705
Total current tax
398,638 126,705
Deferred tax:
Origination and reversal of temporary differences
7,527,241
432,839
Impact of change in DRC tax rate
-
-
Total deferred tax
7,527,241 432,839
Income tax expense
7,925,879 559,544
The Company's income tax has been calculated on the estimated assessable taxable profit for the year at the rates prevailing
in the respective foreign tax jurisdictions. The statutory tax rate in the countries where the company operates for all the years
presented are:
Jurisdiction
2015 2014
Canada
26.50%
26.50%
Democratic Republic of Congo
35.00%
35.00%
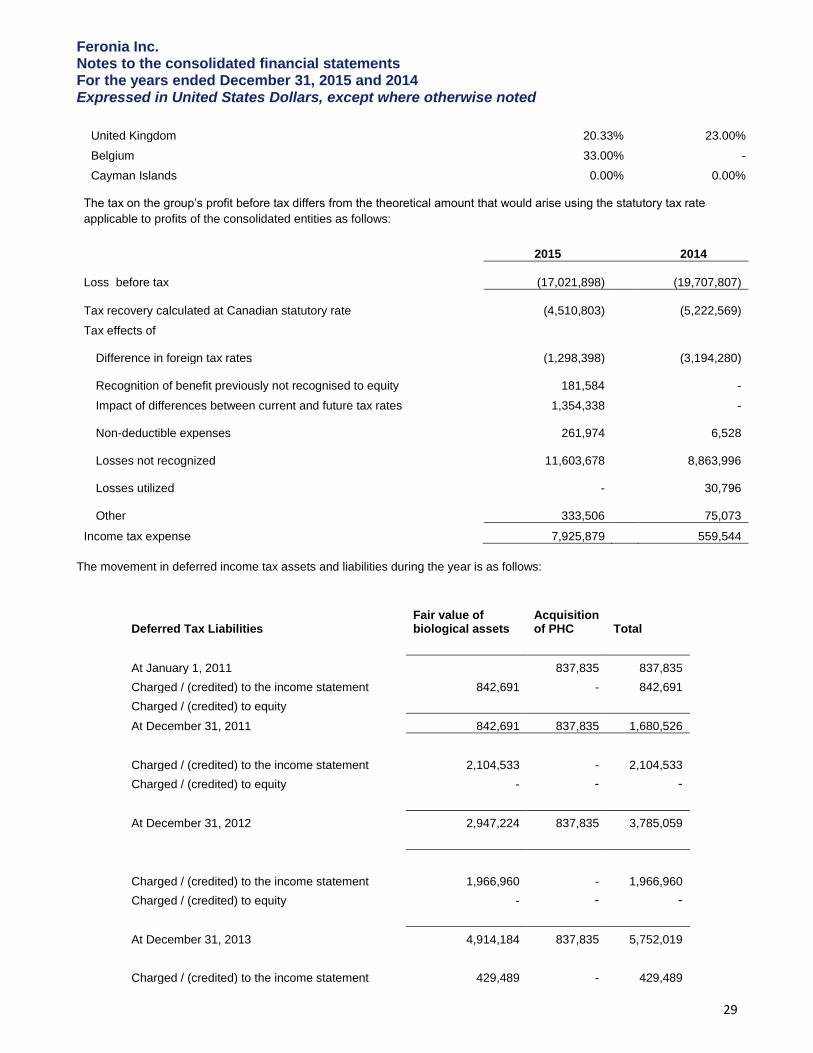
Feronia Inc. Notes to the consolidated financial statements For the years ended December 31, 2015 and 2014 Expressed in United States Dollars, except where otherwise noted
29
United Kingdom
20.33%
23.00%
Belgium 33.00% -
Cayman Islands
0.00%
0.00% The tax on the group’s profit before tax differs from the theoretical amount that would arise using the statutory tax rate
applicable to profits of the consolidated entities as follows:
2015 2014
Loss before tax
(17,021,898)
(19,707,807)
Tax recovery calculated at Canadian statutory rate
(4,510,803)
(5,222,569)
Tax effects of
Difference in foreign tax rates
(1,298,398)
(3,194,280)
Recognition of benefit previously not recognised to equity
181,584
-
Impact of differences between current and future tax rates 1,354,338 -
Non-deductible expenses
261,974
6,528
Losses not recognized 11,603,678
8,863,996
Losses utilized -
30,796
Other
333,506
75,073
Income tax expense 7,925,879 559,544
The movement in deferred income tax assets and liabilities during the year is as follows:
Deferred Tax Liabilities Fair value of biological assets
Acquisition of PHC Total
At January 1, 2011 837,835 837,835
Charged / (credited) to the income statement 842,691 - 842,691
Charged / (credited) to equity At December 31, 2011 842,691 837,835 1,680,526
Charged / (credited) to the income statement 2,104,533 - 2,104,533
Charged / (credited) to equity - - -
At December 31, 2012 2,947,224 837,835 3,785,059
Charged / (credited) to the income statement 1,966,960 - 1,966,960
Charged / (credited) to equity - - -
At December 31, 2013 4,914,184 837,835 5,752,019
Charged / (credited) to the income statement 429,489 - 429,489
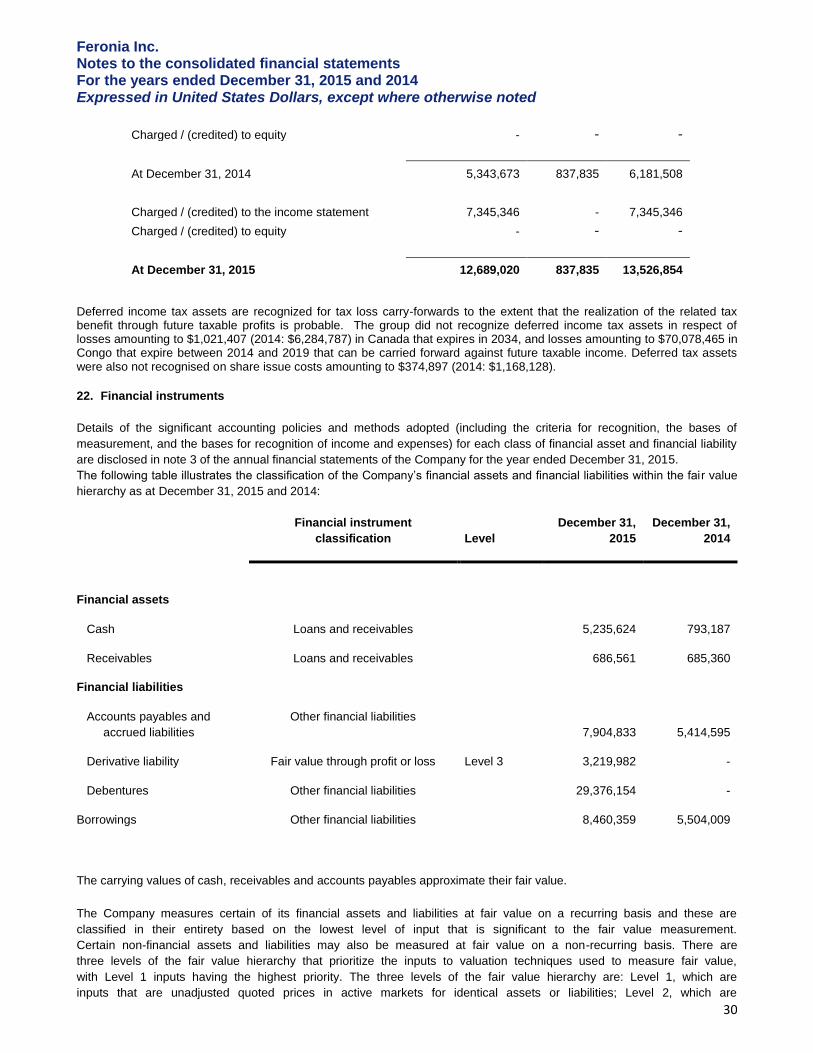
Feronia Inc. Notes to the consolidated financial statements For the years ended December 31, 2015 and 2014 Expressed in United States Dollars, except where otherwise noted
30
Charged / (credited) to equity - - -
At December 31, 2014 5,343,673 837,835 6,181,508
Charged / (credited) to the income statement 7,345,346 - 7,345,346
Charged / (credited) to equity - - -
At December 31, 2015 12,689,020 837,835 13,526,854
Deferred income tax assets are recognized for tax loss carry-forwards to the extent that the realization of the related tax benefit through future taxable profits is probable. The group did not recognize deferred income tax assets in respect of losses amounting to $1,021,407 (2014: $6,284,787) in Canada that expires in 2034, and losses amounting to $70,078,465 in Congo that expire between 2014 and 2019 that can be carried forward against future taxable income. Deferred tax assets were also not recognised on share issue costs amounting to $374,897 (2014: $1,168,128).
22. Financial instruments
Details of the significant accounting policies and methods adopted (including the criteria for recognition, the bases of
measurement, and the bases for recognition of income and expenses) for each class of financial asset and financial liability
are disclosed in note 3 of the annual financial statements of the Company for the year ended December 31, 2015.
The following table illustrates the classification of the Company’s financial assets and financial liabilities within the fair value
hierarchy as at December 31, 2015 and 2014:
Financial instrument
classification Level
December 31,
2015
December 31,
2014
Financial assets
Cash Loans and receivables 5,235,624 793,187
Receivables Loans and receivables 686,561 685,360
Financial liabilities
Accounts payables and
accrued liabilities
Other financial liabilities
7,904,833 5,414,595
Derivative liability Fair value through profit or loss Level 3 3,219,982 -
Debentures Other financial liabilities 29,376,154 -
Borrowings Other financial liabilities 8,460,359 5,504,009
The carrying values of cash, receivables and accounts payables approximate their fair value.
The Company measures certain of its financial assets and liabilities at fair value on a recurring basis and these are
classified in their entirety based on the lowest level of input that is significant to the fair value measurement.
Certain non-financial assets and liabilities may also be measured at fair value on a non-recurring basis. There are
three levels of the fair value hierarchy that prioritize the inputs to valuation techniques used to measure fair value,
with Level 1 inputs having the highest priority. The three levels of the fair value hierarchy are: Level 1, which are
inputs that are unadjusted quoted prices in active markets for identical assets or liabilities; Level 2, which are
Feronia Inc. Notes to the consolidated financial statements For the years ended December 31, 2015 and 2014 Expressed in United States Dollars, except where otherwise noted
31
inputs other than Level 1 quoted prices that are observable for the asset or liability, either directly or indirectly;
and Level 3, which are inputs for the asset or liability that are not based on observable market data.
Fair value hierarchy:
The financial assets and liabilities that are recognized on the consolidated statements of financial position at fair value in a
hierarchy that is based on significance of the inputs used in making the measurements. The levels in the hierarchy are:
Level 1 - Quoted prices (unadjusted) in active markets for identical assets or liabilities
Level 2 - Inputs other than quoted prices included within level 1 that are observable for the asset or liability, either
directly (that is, as prices) or indirectly (that is, derived from prices)
Level 3 - Inputs for the asset or liability that are not based on observable market data (that is, unobservable inputs).
Financial risk factors:
The Company’s activities expose it to a variety of financial risks: market risk (including foreign exchange risk and interest
rate risk), credit risk and liquidity risk. The Company’s overall risk management program seeks to minimize potential adverse
effects on the Company’s financial performance.
(a) Market risk
(i) Foreign exchange risk
The Company's presentation currency is the U.S. dollar and major purchases are transacted in United States dollars. The
Company funds certain operations using the Congolese Franc currency from its bank accounts held in the DRC.
Management closely monitors the foreign exchange risk derived from currency conversions but does not hedge its foreign
exchange risk. Foreign exchange risk arises on recognized assets and liabilities, principally trade payables, cash and
investments in foreign operations.
Foreign exchange risk arises when future recognized assets or liabilities are denominated in a currency that is not the
subsidiary’s functional currency.
(ii) Interest rate risk
The Group’s interest rate risk arises from the debentures. Changes in interest rates related to fixed debentures would not
have impacted net earnings or comprehensive income in the current period. Cash has limited interest rate risk due to its
short-term nature.
(b) Credit risk
The Company's credit risk is primarily attributable to receivables. Two customers purchase 89% of the Company’s crude
palm oil production, with a refining factory owned by Marsavco currently purchasing the majority of such production. The
Company does not have a written agreement with either customer and relies upon the terms of verbal arrangements. Although the Company has a good business relationship with both of the customers, there is no guarantee that the Company
will be able to continue these relationships or enter into written agreements on terms acceptable to the Company or at all.
Financial instruments included in receivables consist of receivables from unrelated companies.
Management believes that the credit risk concentration with respect to financial instruments included in accounts receivable
is low as the majority of the Company’s sales are to a large long-standing customer.
(c) Liquidity risk
Cash flow forecasting is performed in the operating entities of the Company and aggregated in head office which monitors
rolling forecasts of the Company’s liquidity requirements to ensure it has sufficient cash to meet operational needs at all
times.
Feronia Inc. Notes to the consolidated financial statements For the years ended December 31, 2015 and 2014 Expressed in United States Dollars, except where otherwise noted
32
The Company’s approach to managing liquidity risk is to provide reasonable assurance that it can provide sufficient capital to
meet liabilities when due (see Note 2). The group maintains sufficient cash and cash equivalents in order to meet short term
business requirements. The group’s ability to settle other long term liabilities when due is dependent upon future liquidity
from capital sources or positive cash flows form business operations.
As at December 31, 2015, the Company had net working capital deficit of $(27,800,440) including a cash balance of
$5,235,624. The majority of the Company’s financial liabilities have contractual maturities of less than 30 days and are
subject to normal trade terms. An exception to this is the employee incentive liability that falls due over the anticipated
qualifying leaving date, which will frequently be the retirement date. As a guide to liquidity requirements, management
considers that less than 10% of the liability will fall due within five years.
The table below analyses the Group’s non-derivative financial liabilities into relevant maturity groupings based on the
remaining period from the date of the consolidated statements of financial position to the contractual maturity date.
December 31, 2015
Less than 3 3 months to
Over 5
Months 1 year 1-5 years years
Trade payables
3,055,680
-
-
-
Accrued expenses
4,849,154
-
-
-
Other payables
1,976,374
-
-
-
Debt
29,535,732
478,735 8,097,998
-
December 31, 2014
Less than 3 3 months to
Over 5
Months 1 year 1-5 years years
Trade payables
2,728,331
-
-
-
Accrued expenses
2,686,264
-
-
-
Other payables
1,339,034
-
-
-
Debt
159,578
478,735
4,857,023
-
Capital management
The Company considers its capital structure to consist of shares, stock options, warrants and convertible debt. The
Company manages its capital structure and makes adjustments to it, based on the funds available to the Company, in order
to support its ongoing operations.
The Company’s objectives when managing capital are to maintain financial flexibility in order to preserve its ability to meet
financial obligations, including potential obligations arising from additional acquisitions, maintain a capital structure that
allows the Company to favor the financing of its growth strategy using internally generated cash flows and optimize the use
of capital to provide an appropriate investment return to its shareholders. In order to maintain or adjust its capital structure,
the Company may raise new debt or issue new shares.
There were no changes to the Group’s capital management approach during the year ended December 31, 2015. The
Group entered into debt arrangements during 2012 and 2015 as detailed in note 12 and note 13.
Feronia Inc. Notes to the consolidated financial statements For the years ended December 31, 2015 and 2014 Expressed in United States Dollars, except where otherwise noted
33
23. Related party disclosures
Purchase of services from key management personnel
December 31,
December 31,
Purchase of services:
2015 2014
Board fees (1)
245,000
230,912
Purchase of consultancy services, and property rental payments (2)
-
100,000
245,000
330,912
(1) Board fees paid to non-executive directors
(2) In relation to rental payment for use of a building owned by Mr. Bin Karubi for office space and accommodation
Key management compensation
Key management includes the Chief Executive Officer, the Chief Financial Officer, the Chief Operating Officer and the directors of the Company. The compensation paid or payable to key management for employee services is as follows:
December
31,
December 31,
2015 2014
Salaries and short-term employee benefits
999,788
746,952
Change in fair value of share-based payments
December
31,
December 31,
2015 2014
Change in fair value of share-based payments
9,396
21,376
Payables to related parties
December 31,
December 31,
2015 2014
Board of Directors fees
56,875
125,136
Other Consultancy fees
-
-
Key management compensation
86,875
91,458
143,750
216,594
The payables to related parties relate to normal course expenses incurred on behalf of the Company.
24. Contingent liabilities
The Company is, from time to time, involved in various claims, legal proceedings and complaints arising in the ordinary
course of business. The Company cannot reasonably predict the likelihood or outcome of these actions. The board of
directors of the Company does not believe that adverse decisions in any other pending or threatened proceedings related to
any matter, or any amount which may be required to be paid by reason thereof, will have a material effect on the financial
Feronia Inc. Notes to the consolidated financial statements For the years ended December 31, 2015 and 2014 Expressed in United States Dollars, except where otherwise noted
34
condition or future results of operations. As at December 31, 2015, provisions related to such matters totalled $308,309
(December 31, 2014: $268,933).
25. Subsequent Event
On January 15, 2016, pursuant to the previously disclosed subscription agreement between the Company and African
Agricultural Fund, through its subsidiary Golden Oil Holdings Limited (“GOHL”), the Company issued US$3,200,000 principal
amount of secured convertible debentures (the “January 2016 Debenture”). Including this issuance, the Company issued a
total of $15,000,000 of Debentures pursuant to previously disclosed subscription agreement on November 5, 2015.
The Debentures and the January 2016 Debenture were subsequently amended in Q1 2016 to extend the maturity date until
April 30, 2016.
On April 13, 2016, all the conditions precedent were satisfied to facilitate the first drawdown of the DFI Debt Facility. Upon
the first drawdown, the Debentures and the January 2016 Debenture and accrued interest were converted into shares on the
Company.