Embed Size (px)
Citation preview
PHYSICAL REVIEW B 94, 195141 (2016)
Fermi surface evolution of Na-doped PbTe studied through density functional theory calculationsand Shubnikov–de Haas measurements
P. Giraldo-Gallo,1,2,3 B. Sangiorgio,4 P. Walmsley,1,5 H. J. Silverstein,1,5 M. Fechner,4 S. C. Riggs,3 T. H. Geballe,1,5
N. A. Spaldin,4 and I. R. Fisher1,5
1Geballe Laboratory for Advanced Materials, Stanford University, Stanford, California 94305, USA2Department of Physics, Stanford University, Stanford, California 94305, USA3National High Magnetic Field Laboratory, Tallahassee, Florida 32310, USA
4Materials Theory, ETH Zurich, Wolfgang-Pauli-Strasse 27, CH-8093 Zurich, Switzerland5Department of Applied Physics, Stanford University, Stanford, California 94305, USA
(Received 5 September 2016; published 23 November 2016)
We present a combined experimental and theoretical study of the evolution of the low-temperature Fermisurface of lead telluride (PbTe) when holes are introduced through sodium substitution on the lead site. OurShubnikov-de Haas measurements for samples with carrier concentrations up to 9.4 × 1019 cm−3 (0.62 Na at. %)show the qualitative features of the Fermi surface evolution (topology and effective mass) predicted by ourdensity functional (DFT) calculations within the generalized gradient approximation (GGA): we obtain perfectellipsoidal L pockets at low and intermediate carrier concentrations, evolution away from ideal ellipsoidicity forthe highest doping studied, and cyclotron effective masses increasing monotonically with doping level, implyingdeviations from perfect parabolicity throughout the whole band. Our measurements show, however, that standardDFT calculations underestimate the energy difference between the L point and �-line valence band maxima,since our data are consistent with a single-band Fermi surface over the entire doping range studied, whereasthe calculations predict an occupation of the � pockets at higher doping. Our results for low and intermediatecompositions are consistent with a nonparabolic Kane-model dispersion, in which the L pockets are ellipsoidsof fixed anisotropy throughout the band, but the effective masses depend strongly on Fermi energy.
DOI: 10.1103/PhysRevB.94.195141
I. INTRODUCTION
Lead telluride (PbTe) is a widely known thermoelectricmaterial and a narrow-gap semiconductor, which can bedegenerately doped by either Pb (hole-doping) or Te (electron-doping) vacancies, or by introduction of acceptor or donorimpurities [1–3]. Such impurity dopants have been shownto enhance the thermoelectric figure of merit zT from 0.8to 1.4 for the case of sodium doping [4–6], and to 1.5for doping with thallium [4,7]. Tl is also the only dopantknown to date that leads to a superconducting ground statein PbTe; remarkably its maximum critical temperature ofTc = 1.5 K is almost an order of magnitude higher thanother superconducting semiconductors with similar carrierdensity [8–12]. Understanding the physical origin of theseenhanced properties and their dependence on the choiceof dopant chemistry requires a detailed knowledge of theelectronic structure, in particular its evolution with changesin dopant and carrier concentrations.
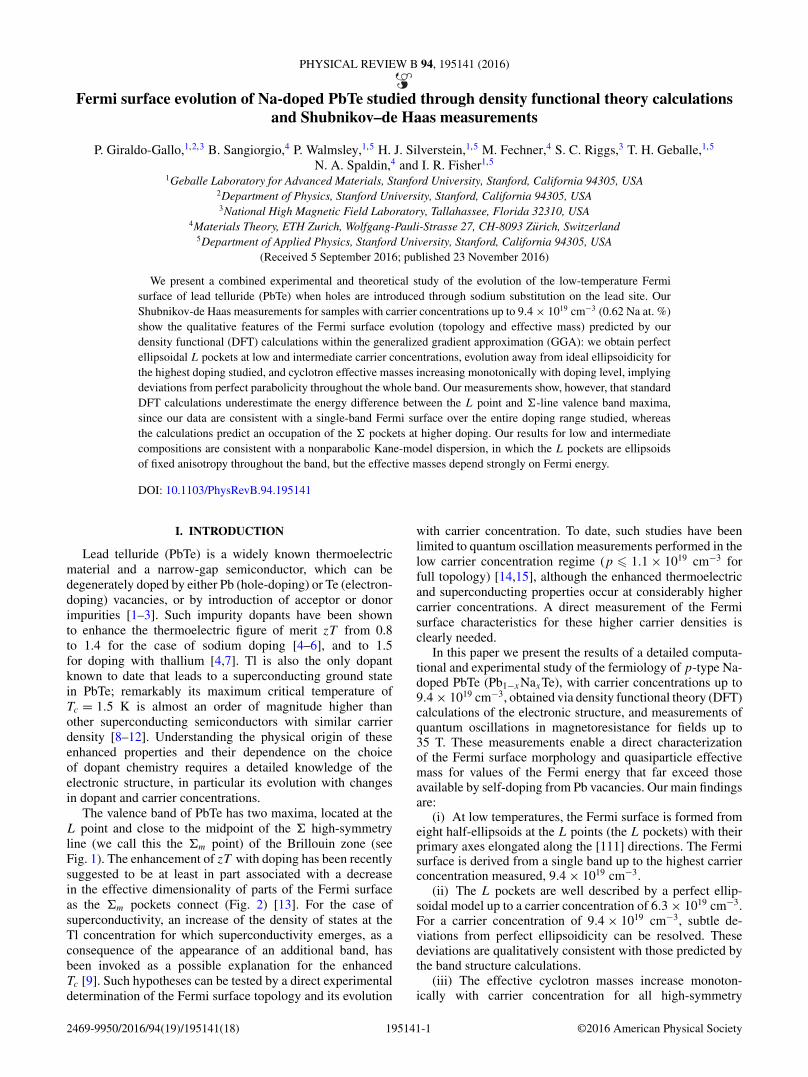
The valence band of PbTe has two maxima, located at theL point and close to the midpoint of the � high-symmetryline (we call this the �m point) of the Brillouin zone (seeFig. 1). The enhancement of zT with doping has been recentlysuggested to be at least in part associated with a decreasein the effective dimensionality of parts of the Fermi surfaceas the �m pockets connect (Fig. 2) [13]. For the case ofsuperconductivity, an increase of the density of states at theTl concentration for which superconductivity emerges, as aconsequence of the appearance of an additional band, hasbeen invoked as a possible explanation for the enhancedTc [9]. Such hypotheses can be tested by a direct experimentaldetermination of the Fermi surface topology and its evolution
with carrier concentration. To date, such studies have beenlimited to quantum oscillation measurements performed in thelow carrier concentration regime (p � 1.1 × 1019 cm−3 forfull topology) [14,15], although the enhanced thermoelectricand superconducting properties occur at considerably highercarrier concentrations. A direct measurement of the Fermisurface characteristics for these higher carrier densities isclearly needed.
In this paper we present the results of a detailed computa-tional and experimental study of the fermiology of p-type Na-doped PbTe (Pb1−xNaxTe), with carrier concentrations up to9.4 × 1019 cm−3, obtained via density functional theory (DFT)calculations of the electronic structure, and measurements ofquantum oscillations in magnetoresistance for fields up to35 T. These measurements enable a direct characterizationof the Fermi surface morphology and quasiparticle effectivemass for values of the Fermi energy that far exceed thoseavailable by self-doping from Pb vacancies. Our main findingsare:
(i) At low temperatures, the Fermi surface is formed fromeight half-ellipsoids at the L points (the L pockets) with theirprimary axes elongated along the [111] directions. The Fermisurface is derived from a single band up to the highest carrierconcentration measured, 9.4 × 1019 cm−3.
(ii) The L pockets are well described by a perfect ellip-soidal model up to a carrier concentration of 6.3 × 1019 cm−3.For a carrier concentration of 9.4 × 1019 cm−3, subtle de-viations from perfect ellipsoidicity can be resolved. Thesedeviations are qualitatively consistent with those predicted bythe band structure calculations.
(iii) The effective cyclotron masses increase monoton-ically with carrier concentration for all high-symmetry
2469-9950/2016/94(19)/195141(18) 195141-1 ©2016 American Physical Society
P. GIRALDO-GALLO et al. PHYSICAL REVIEW B 94, 195141 (2016)
FIG. 1. Energy dispersion for stoichiometric PbTe along the highsymmetry directions of the fcc Brillouin zone, calculated in this workusing density functional theory (DFT) (for details see text). A directgap, underestimated compared with experiment as is usual in DFTcalculations, is observed at the L point, and a second valence bandmaximum occurs along the � high-symmetry line. A representativeFermi surface, which emerges as the Fermi energy is shifted into thevalence band by Pb vacancies or hole-dopant impurities, is shown inthe inset. For the choice of Fermi level shown (green-dashed line), theFermi surface contains eight half-ellipsoids (shaded in red) centeredat the L point and oriented along the [111] directions (L pockets),and 12 � pockets (shaded in blue) centered close to the midpoint ofthe [110] � line and oriented along the [100] directions.
directions, implying that the L band is not well described by aperfect parabolic model for any carrier density. This evolutionis also consistent with the predictions from our band structurecalculations.
(iv) Although the qualitative evolution of the Fermi surfacetopology with carrier concentration is correctly predicted byband structure calculations, these calculations underestimatethe band offset (between the top of the L band and the top ofthe �m band).
Before detailing our experiments, we emphasize that ourmeasurements are made in the low-temperature regime andcaution should be exercised before extrapolating the results todifferent temperature regimes. Quantum oscillations charac-terize the low-temperature properties of a material, and dueto the exponential damping factor, they cannot be observedabove approximately 60 K in Na-doped PbTe. Hence, we donot claim that our first three findings outlined above necessarilyremain valid at higher temperatures. In particular, earlierexperimental studies, based on magnetoresistance and Hallcoefficient measurements [16], have indicated an appreciabletemperature dependence of both the band gap and the bandoffset (between L and � band maxima) in PbTe. Additionally,recent angle-resolved photoemission spectroscopy (ARPES)experiments have provided evidence for the convergence ofthe top of these two bands at high temperatures, becomingdegenerate at ∼ 800 K [17–19]. The current measurements
provide a definitive determination of the morphology of thebulk Fermi surface at low temperatures, and hence provide animportant point of comparison for band structure calculations,but additional measurements based on a technique that is lesssensitive to the quasiparticle relaxation rate, such as ARPES,are required in order to determine whether the � pocketremains unoccupied at higher temperatures for the carrierconcentrations studied here.
II. FIRST-PRINCIPLES CALCULATIONS
To provide a baseline with which to compare our exper-imental data, we first show density functional theory (DFT)calculations of the electronic structure of PbTe with andwithout doping. An accurate description of this compoundwithin DFT is very challenging; in particular, the computedband structure is highly sensitive to the choice of volume, theexchange-correlation functional, and whether or not spin-orbitcoupling is included. A change in lattice constant of 1%,for example, can both change the band offset by 60% andgenerate a ferroelectric instability. Moreover, when spin-orbitcoupling is included, an unusually fine k-point mesh is neededto converge the phonon frequencies, forces, and Fermi energy.This unusual sensitivity to the input parameters in the calcula-tion is of course related to the many interesting properties ofPbTe, which is on the boundary between various competingstructural (incipient ferroelectricity [20,21]) and electronic(superconductivity [10–12] and topological insulator [22,23])instabilities. Interestingly, we show in Appendix C that thevolume does not significantly affect the computed evolutionwith doping of the cyclotron masses and the frequencies ofquantum oscillations. Therefore, experimental variations involume, as occur for example with temperature, do not affectour conclusions.
A. Computational details
Our calculations were performed using the PAW imple-mentation [24,25] of density functional theory within theVASP package [26]. After carefully comparing structuraland electronic properties calculated using the local densityapproximation (LDA) [27], PBE [28], and PBEsol [29] withavailable experimental data, we chose the PBEsol exchange-correlation functional as providing the best overall agreement.We used a 20 × 20 × 20 �-centered k-point mesh and toensure a convergence below 0.1 μeV for the total energyused a plane-wave energy cutoff of 600 eV and an energythreshold for the self-consistent calculations of 0.1 μeV. Weused valence electron configurations 5d106s26p2 for lead,5s25p4 for tellurium, and 2p63s1 for sodium. Spin-orbitcoupling was included. The unit cell volume was obtainedusing a full structural relaxation giving a lattice constant of6.44 A (to be compared with the experimental 6.43 A [20]at 15 K). Kohn-Sham band energies were computed on a fine(140 × 140 × 140) three-dimensional grid covering the entireBrillouin zone and used as an input for the SKEAF code [30]which allows for extraction of extremal cross-sectional areasof the Fermi surface in different spatial orientations.
195141-2
FERMI SURFACE EVOLUTION OF Na-DOPED PbTe . . . PHYSICAL REVIEW B 94, 195141 (2016)
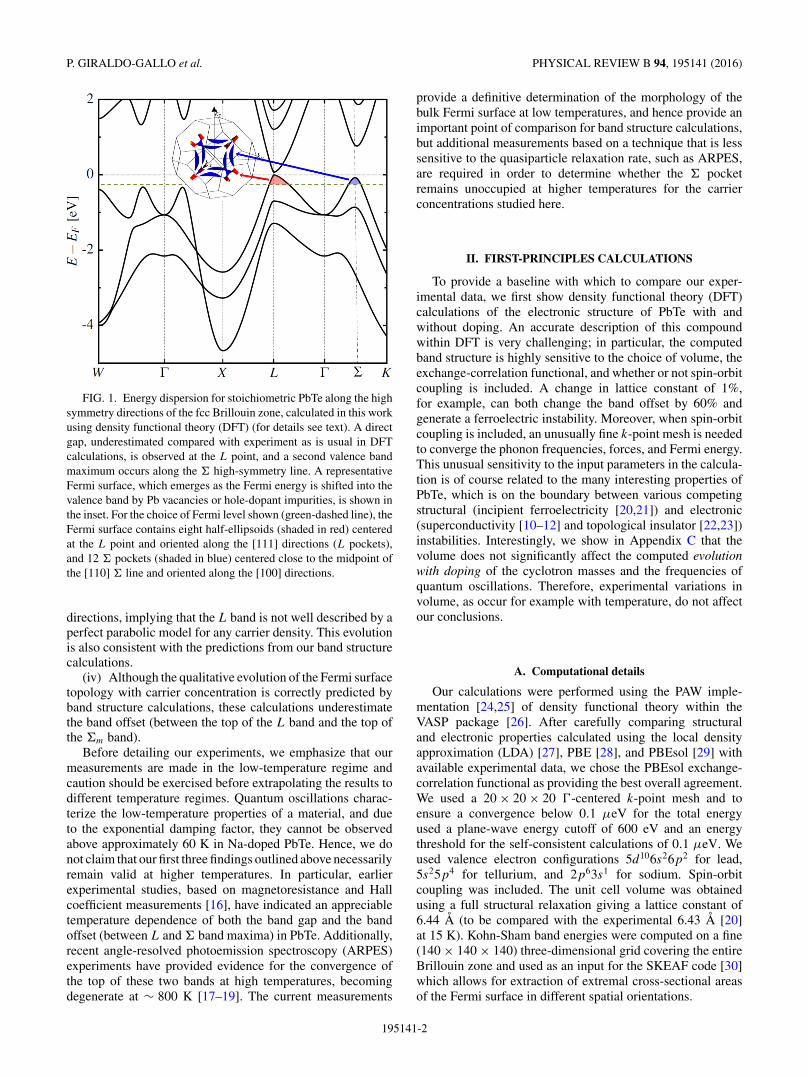
FIG. 2. Upper panel: Fermi surface of hole-doped PbTe calculated in this work using the rigid band approximation. Lower panel plots:The corresponding (110)-plane angle evolution of the cross-sectional areas (in frequency units) of the calculated Fermi surface pockets. Thefour columns correspond to monovalent impurity concentrations of (a) x = 0.02% (pL = 0.27 × 1019 cm−3 and p� = 0); (b) x = 0.81%(pL = 3.5 × 1019 cm−3 and p� = 8.6 × 1019 cm−3); (c) x = 1.56% (pL = 6.1 × 1019 cm−3 and p� = 17.4 × 1019 cm−3); and (d) x = 2.61%(ptotal = 36.2 × 1019 cm−3). The frequencies of the L pockets are shown in red, and compared with those expected in a perfect ellipsoidalmodel shown as black lines. The evolution of the � pockets is shown in blue. These pockets appear at a dopant concentration of x = 0.11%(pL ≈ 1019 cm−3). In column (d), the � and L pockets have merged, forming a cube-shape Fermi surface; cross sections that cannot beidentified separately with � or L are shown in purple. We plot frequencies up to 600 T, noting, however, that frequencies up to 8 kT occur,corresponding to the large-square Fermi surface orbits. As described in the main text, our quantum oscillation studies reveal that for carrierdensities up to at least 9.4 × 10⁻¹⁹ cm−3 value, the maximum studied in this report, the Fermi surface is found to only comprise L pockets(shown in red), implying a larger band offset between the L and � pockets than predicted by these and other DFT calculations.
B. Rigid-band approximation
First, we computed the Fermi-surface evolution as afunction of doping (shown in Fig. 2) by rigidly shifting theFermi energy in the pure PbTe structure and assuming onehole per dopant. This rigid-band approximation allows veryfine samplings of the Brillouin zone, which are necessaryto characterize the tiny Fermi surface of hole-doped PbTeat low doping. We discuss its validity here, by comparingwith calculations in which a Pb ion is substituted explicitlywith a Na ion. Many first-principles studies [31–36] havealready been carried out to determine the effect of differentdopant atoms on the electronic properties of PbTe, withsome of them explicitly assessing the validity of the rigidband approximation in Na-doped PbTe: Takagiwa et al. [35]confirmed from KKR-CPA calculations that the density ofstates (DOS) behaves as in a rigid band model, whereas Hoanget al. [37] and Lee and Mahanti [36] showed that a liftingof degeneracy occurs at the top of the valence band withexplicit Na doping (at a concentration of 3.125%), with theconsequence that the rigid band approximation overestimatesthe thermopower [36]. Here we study how sodium impuritiesaffect the band structure of PbTe close to the Fermi energyfor the lower concentrations that we use in our experiments(x � 1%).
We show here results for a 4 × 4 × 4 supercell of theprimitive cell containing 128 atoms (x ≈ 1.6%), with onelead ion substituted by sodium. The unit cell volume waskept the same as in pristine PbTe (it would be changed byless than 0.1% by a full structural relaxation). We checkedalso that our conclusions are qualitatively unchanged for alarger 216 atom supercell (3 × 3 × 3 of the conventional cubiccell) in which one or two lead ions are substituted by sodium(x ≈ 0.9% or x ≈ 1.6%). The k-point mesh was accordingly
scaled down and spin-orbit coupling was not included becauseof computational cost; the other computational settings wereleft unchanged.
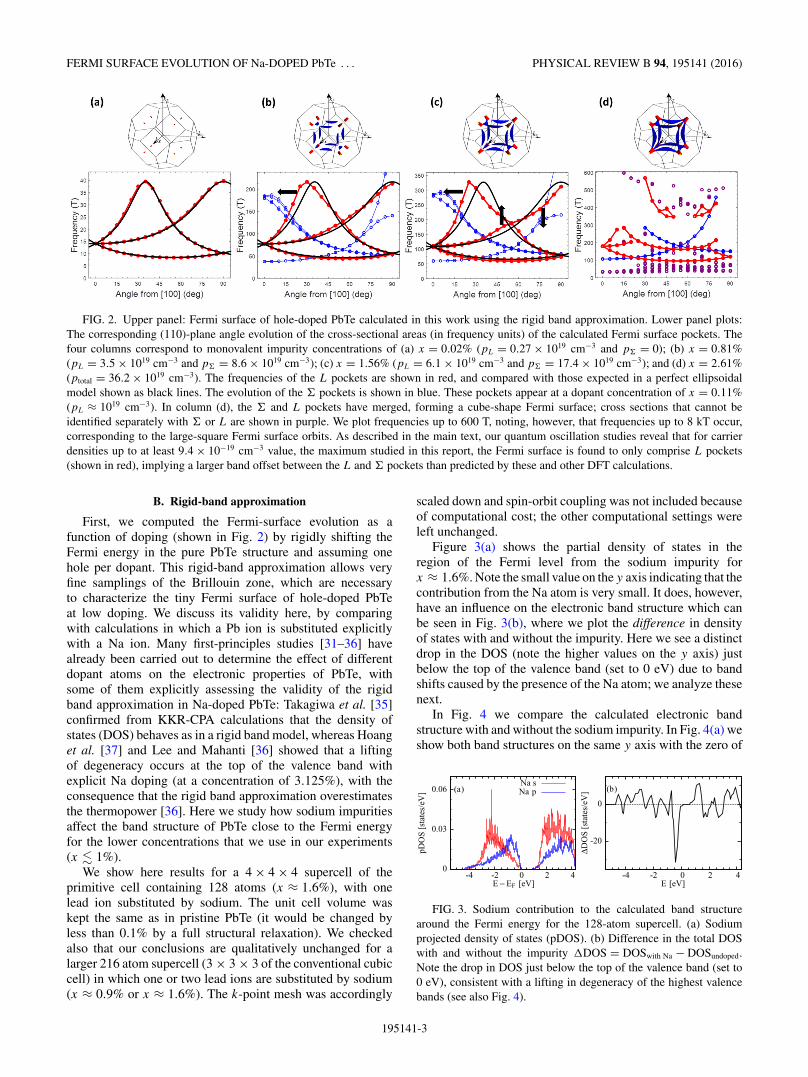
Figure 3(a) shows the partial density of states in theregion of the Fermi level from the sodium impurity forx ≈ 1.6%. Note the small value on the y axis indicating that thecontribution from the Na atom is very small. It does, however,have an influence on the electronic band structure which canbe seen in Fig. 3(b), where we plot the difference in densityof states with and without the impurity. Here we see a distinctdrop in the DOS (note the higher values on the y axis) justbelow the top of the valence band (set to 0 eV) due to bandshifts caused by the presence of the Na atom; we analyze thesenext.
In Fig. 4 we compare the calculated electronic bandstructure with and without the sodium impurity. In Fig. 4(a) weshow both band structures on the same y axis with the zero of
0
0.03
0.06
-4 -2 0 2 4
pDO
S[s
tate
s/eV
]
E − EF [eV]
(a)Na sNa p
-20
0
-4 -2 0 2 4
ΔDO
S[s
tate
s/eV
]
E [eV]
(b)
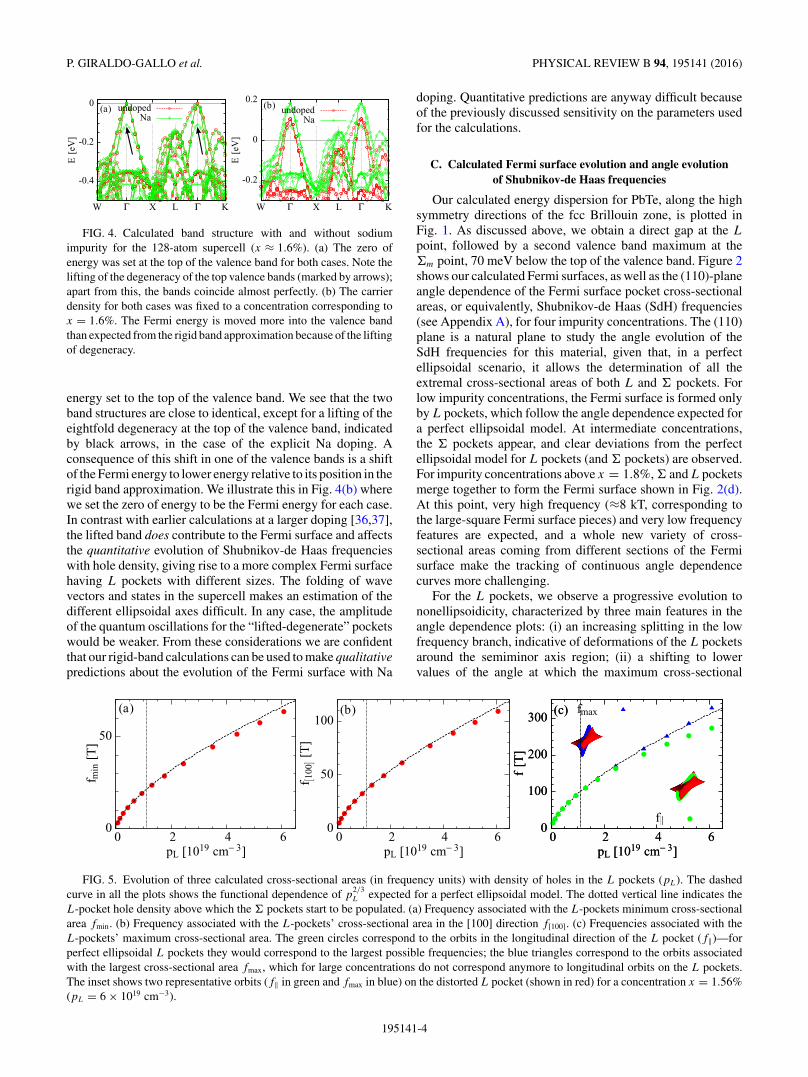
FIG. 3. Sodium contribution to the calculated band structurearound the Fermi energy for the 128-atom supercell. (a) Sodiumprojected density of states (pDOS). (b) Difference in the total DOSwith and without the impurity �DOS = DOSwith Na − DOSundoped.Note the drop in DOS just below the top of the valence band (set to0 eV), consistent with a lifting in degeneracy of the highest valencebands (see also Fig. 4).
195141-3
P. GIRALDO-GALLO et al. PHYSICAL REVIEW B 94, 195141 (2016)
-0.2
0
0.2
W Γ X L Γ K
E[e
V]
(b) undopedNa
-0.4
-0.2
0
W Γ X L Γ K
E[e
V]
(a) undopedNa
FIG. 4. Calculated band structure with and without sodiumimpurity for the 128-atom supercell (x ≈ 1.6%). (a) The zero ofenergy was set at the top of the valence band for both cases. Note thelifting of the degeneracy of the top valence bands (marked by arrows);apart from this, the bands coincide almost perfectly. (b) The carrierdensity for both cases was fixed to a concentration corresponding tox = 1.6%. The Fermi energy is moved more into the valence bandthan expected from the rigid band approximation because of the liftingof degeneracy.
energy set to the top of the valence band. We see that the twoband structures are close to identical, except for a lifting of theeightfold degeneracy at the top of the valence band, indicatedby black arrows, in the case of the explicit Na doping. Aconsequence of this shift in one of the valence bands is a shiftof the Fermi energy to lower energy relative to its position in therigid band approximation. We illustrate this in Fig. 4(b) wherewe set the zero of energy to be the Fermi energy for each case.In contrast with earlier calculations at a larger doping [36,37],the lifted band does contribute to the Fermi surface and affectsthe quantitative evolution of Shubnikov-de Haas frequencieswith hole density, giving rise to a more complex Fermi surfacehaving L pockets with different sizes. The folding of wavevectors and states in the supercell makes an estimation of thedifferent ellipsoidal axes difficult. In any case, the amplitudeof the quantum oscillations for the “lifted-degenerate” pocketswould be weaker. From these considerations we are confidentthat our rigid-band calculations can be used to make qualitativepredictions about the evolution of the Fermi surface with Na
doping. Quantitative predictions are anyway difficult becauseof the previously discussed sensitivity on the parameters usedfor the calculations.
C. Calculated Fermi surface evolution and angle evolutionof Shubnikov-de Haas frequencies
Our calculated energy dispersion for PbTe, along the highsymmetry directions of the fcc Brillouin zone, is plotted inFig. 1. As discussed above, we obtain a direct gap at the L
point, followed by a second valence band maximum at the�m point, 70 meV below the top of the valence band. Figure 2shows our calculated Fermi surfaces, as well as the (110)-planeangle dependence of the Fermi surface pocket cross-sectionalareas, or equivalently, Shubnikov-de Haas (SdH) frequencies(see Appendix A), for four impurity concentrations. The (110)plane is a natural plane to study the angle evolution of theSdH frequencies for this material, given that, in a perfectellipsoidal scenario, it allows the determination of all theextremal cross-sectional areas of both L and � pockets. Forlow impurity concentrations, the Fermi surface is formed onlyby L pockets, which follow the angle dependence expected fora perfect ellipsoidal model. At intermediate concentrations,the � pockets appear, and clear deviations from the perfectellipsoidal model for L pockets (and � pockets) are observed.For impurity concentrations above x = 1.8%, � and L pocketsmerge together to form the Fermi surface shown in Fig. 2(d).At this point, very high frequency (≈8 kT, corresponding tothe large-square Fermi surface pieces) and very low frequencyfeatures are expected, and a whole new variety of cross-sectional areas coming from different sections of the Fermisurface make the tracking of continuous angle dependencecurves more challenging.
For the L pockets, we observe a progressive evolution tononellipsoidicity, characterized by three main features in theangle dependence plots: (i) an increasing splitting in the lowfrequency branch, indicative of deformations of the L pocketsaround the semiminor axis region; (ii) a shifting to lowervalues of the angle at which the maximum cross-sectional
0
50
0 2 4 6
f min
[T]
pL [1019 cm− 3]
(a)
0
50
100
0 2 4 6
f [100
][T
]
pL [1019 cm− 3]
(b)
0
100
200
300
0 2 4 6
f[T
]
pL [1019 cm− 3]
(c)
0
100
200
300
0 2 4 6
f[T
]
pL [1019 cm− 3]
(c) fmax
f
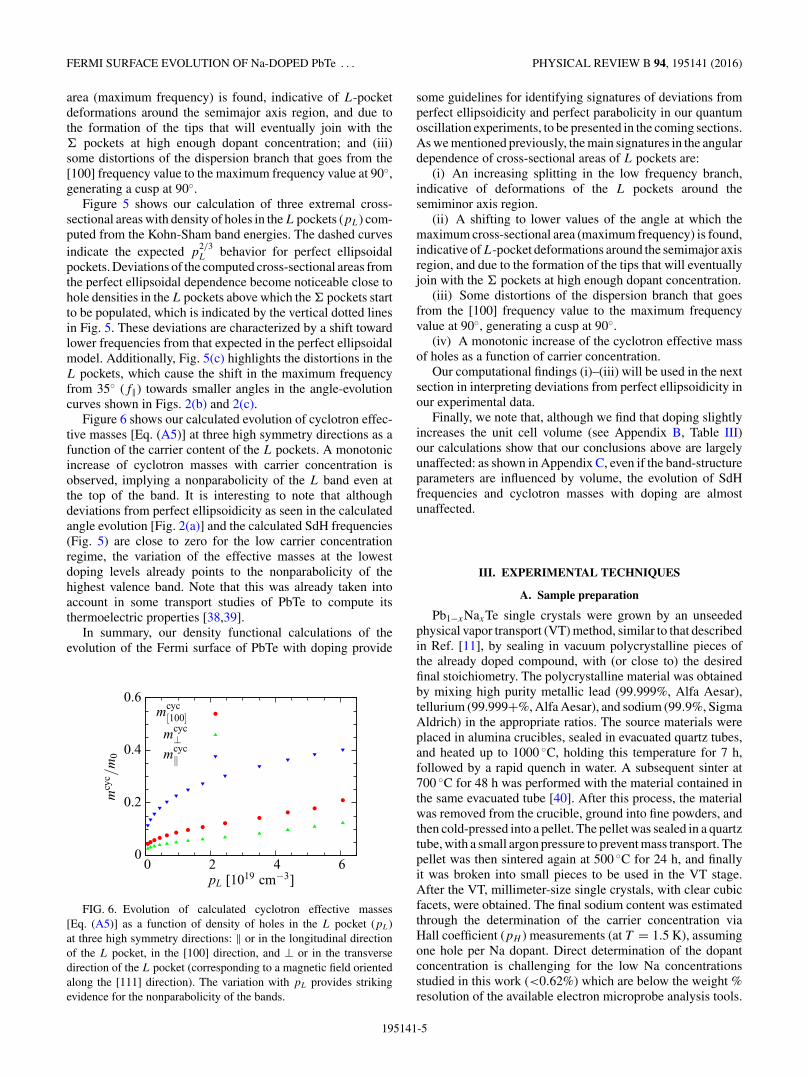
FIG. 5. Evolution of three calculated cross-sectional areas (in frequency units) with density of holes in the L pockets (pL). The dashedcurve in all the plots shows the functional dependence of p
2/3L expected for a perfect ellipsoidal model. The dotted vertical line indicates the
L-pocket hole density above which the � pockets start to be populated. (a) Frequency associated with the L-pockets minimum cross-sectionalarea fmin. (b) Frequency associated with the L-pockets’ cross-sectional area in the [100] direction f[100]. (c) Frequencies associated with theL-pockets’ maximum cross-sectional area. The green circles correspond to the orbits in the longitudinal direction of the L pocket (f‖)—forperfect ellipsoidal L pockets they would correspond to the largest possible frequencies; the blue triangles correspond to the orbits associatedwith the largest cross-sectional area fmax, which for large concentrations do not correspond anymore to longitudinal orbits on the L pockets.The inset shows two representative orbits (f‖ in green and fmax in blue) on the distorted L pocket (shown in red) for a concentration x = 1.56%(pL = 6 × 1019 cm−3).
195141-4
FERMI SURFACE EVOLUTION OF Na-DOPED PbTe . . . PHYSICAL REVIEW B 94, 195141 (2016)
area (maximum frequency) is found, indicative of L-pocketdeformations around the semimajor axis region, and due tothe formation of the tips that will eventually join with the� pockets at high enough dopant concentration; and (iii)some distortions of the dispersion branch that goes from the[100] frequency value to the maximum frequency value at 90◦,generating a cusp at 90◦.
Figure 5 shows our calculation of three extremal cross-sectional areas with density of holes in the L pockets (pL) com-puted from the Kohn-Sham band energies. The dashed curvesindicate the expected p
2/3L behavior for perfect ellipsoidal
pockets. Deviations of the computed cross-sectional areas fromthe perfect ellipsoidal dependence become noticeable close tohole densities in the L pockets above which the � pockets startto be populated, which is indicated by the vertical dotted linesin Fig. 5. These deviations are characterized by a shift towardlower frequencies from that expected in the perfect ellipsoidalmodel. Additionally, Fig. 5(c) highlights the distortions in theL pockets, which cause the shift in the maximum frequencyfrom 35◦ (f‖) towards smaller angles in the angle-evolutioncurves shown in Figs. 2(b) and 2(c).
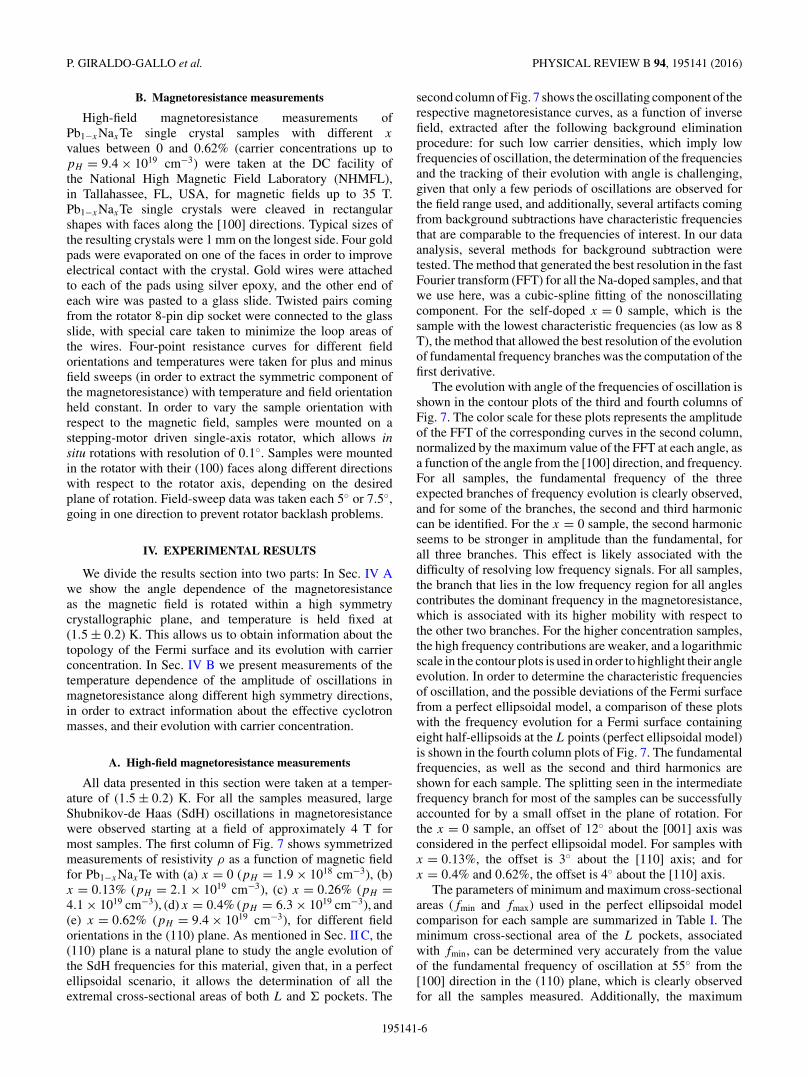
Figure 6 shows our calculated evolution of cyclotron effec-tive masses [Eq. (A5)] at three high symmetry directions as afunction of the carrier content of the L pockets. A monotonicincrease of cyclotron masses with carrier concentration isobserved, implying a nonparabolicity of the L band even atthe top of the band. It is interesting to note that althoughdeviations from perfect ellipsoidicity as seen in the calculatedangle evolution [Fig. 2(a)] and the calculated SdH frequencies(Fig. 5) are close to zero for the low carrier concentrationregime, the variation of the effective masses at the lowestdoping levels already points to the nonparabolicity of thehighest valence band. Note that this was already taken intoaccount in some transport studies of PbTe to compute itsthermoelectric properties [38,39].
In summary, our density functional calculations of theevolution of the Fermi surface of PbTe with doping provide
0
0.2
0.4
0.6
0 2 4 6
mcy
c /m
0
pL [1019 cm−3]
mcyc[100]
mcyc⊥
mcyc
FIG. 6. Evolution of calculated cyclotron effective masses[Eq. (A5)] as a function of density of holes in the L pocket (pL)at three high symmetry directions: ‖ or in the longitudinal directionof the L pocket, in the [100] direction, and ⊥ or in the transversedirection of the L pocket (corresponding to a magnetic field orientedalong the [111] direction). The variation with pL provides strikingevidence for the nonparabolicity of the bands.
some guidelines for identifying signatures of deviations fromperfect ellipsoidicity and perfect parabolicity in our quantumoscillation experiments, to be presented in the coming sections.As we mentioned previously, the main signatures in the angulardependence of cross-sectional areas of L pockets are:
(i) An increasing splitting in the low frequency branch,indicative of deformations of the L pockets around thesemiminor axis region.
(ii) A shifting to lower values of the angle at which themaximum cross-sectional area (maximum frequency) is found,indicative of L-pocket deformations around the semimajor axisregion, and due to the formation of the tips that will eventuallyjoin with the � pockets at high enough dopant concentration.
(iii) Some distortions of the dispersion branch that goesfrom the [100] frequency value to the maximum frequencyvalue at 90◦, generating a cusp at 90◦.
(iv) A monotonic increase of the cyclotron effective massof holes as a function of carrier concentration.
Our computational findings (i)–(iii) will be used in the nextsection in interpreting deviations from perfect ellipsoidicity inour experimental data.
Finally, we note that, although we find that doping slightlyincreases the unit cell volume (see Appendix B, Table III)our calculations show that our conclusions above are largelyunaffected: as shown in Appendix C, even if the band-structureparameters are influenced by volume, the evolution of SdHfrequencies and cyclotron masses with doping are almostunaffected.
III. EXPERIMENTAL TECHNIQUES
A. Sample preparation
Pb1−xNaxTe single crystals were grown by an unseededphysical vapor transport (VT) method, similar to that describedin Ref. [11], by sealing in vacuum polycrystalline pieces ofthe already doped compound, with (or close to) the desiredfinal stoichiometry. The polycrystalline material was obtainedby mixing high purity metallic lead (99.999%, Alfa Aesar),tellurium (99.999+%, Alfa Aesar), and sodium (99.9%, SigmaAldrich) in the appropriate ratios. The source materials wereplaced in alumina crucibles, sealed in evacuated quartz tubes,and heated up to 1000 ◦C, holding this temperature for 7 h,followed by a rapid quench in water. A subsequent sinter at700 ◦C for 48 h was performed with the material contained inthe same evacuated tube [40]. After this process, the materialwas removed from the crucible, ground into fine powders, andthen cold-pressed into a pellet. The pellet was sealed in a quartztube, with a small argon pressure to prevent mass transport. Thepellet was then sintered again at 500 ◦C for 24 h, and finallyit was broken into small pieces to be used in the VT stage.After the VT, millimeter-size single crystals, with clear cubicfacets, were obtained. The final sodium content was estimatedthrough the determination of the carrier concentration viaHall coefficient (pH ) measurements (at T = 1.5 K), assumingone hole per Na dopant. Direct determination of the dopantconcentration is challenging for the low Na concentrationsstudied in this work (<0.62%) which are below the weight %resolution of the available electron microprobe analysis tools.
195141-5
P. GIRALDO-GALLO et al. PHYSICAL REVIEW B 94, 195141 (2016)
B. Magnetoresistance measurements
High-field magnetoresistance measurements ofPb1−xNaxTe single crystal samples with different x
values between 0 and 0.62% (carrier concentrations up topH = 9.4 × 1019 cm−3) were taken at the DC facility ofthe National High Magnetic Field Laboratory (NHMFL),in Tallahassee, FL, USA, for magnetic fields up to 35 T.Pb1−xNaxTe single crystals were cleaved in rectangularshapes with faces along the [100] directions. Typical sizes ofthe resulting crystals were 1 mm on the longest side. Four goldpads were evaporated on one of the faces in order to improveelectrical contact with the crystal. Gold wires were attachedto each of the pads using silver epoxy, and the other end ofeach wire was pasted to a glass slide. Twisted pairs comingfrom the rotator 8-pin dip socket were connected to the glassslide, with special care taken to minimize the loop areas ofthe wires. Four-point resistance curves for different fieldorientations and temperatures were taken for plus and minusfield sweeps (in order to extract the symmetric component ofthe magnetoresistance) with temperature and field orientationheld constant. In order to vary the sample orientation withrespect to the magnetic field, samples were mounted on astepping-motor driven single-axis rotator, which allows insitu rotations with resolution of 0.1◦. Samples were mountedin the rotator with their (100) faces along different directionswith respect to the rotator axis, depending on the desiredplane of rotation. Field-sweep data was taken each 5◦ or 7.5◦,going in one direction to prevent rotator backlash problems.
IV. EXPERIMENTAL RESULTS
We divide the results section into two parts: In Sec. IV Awe show the angle dependence of the magnetoresistanceas the magnetic field is rotated within a high symmetrycrystallographic plane, and temperature is held fixed at(1.5 ± 0.2) K. This allows us to obtain information about thetopology of the Fermi surface and its evolution with carrierconcentration. In Sec. IV B we present measurements of thetemperature dependence of the amplitude of oscillations inmagnetoresistance along different high symmetry directions,in order to extract information about the effective cyclotronmasses, and their evolution with carrier concentration.
A. High-field magnetoresistance measurements
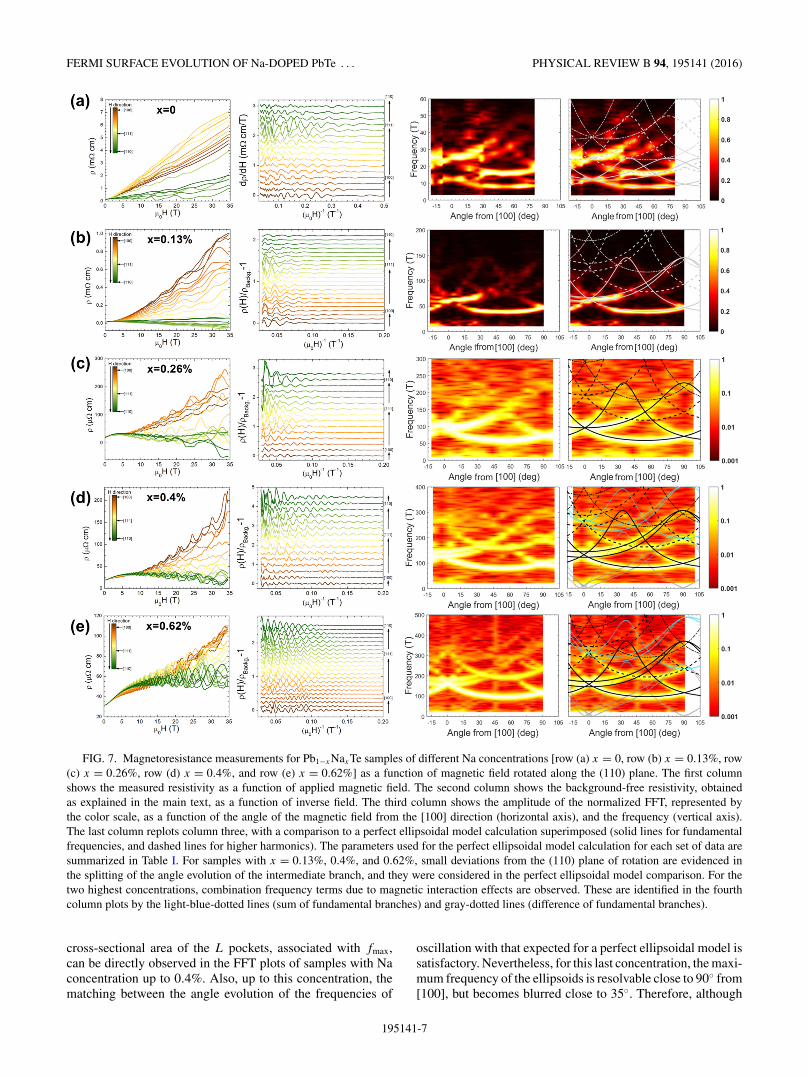
All data presented in this section were taken at a temper-ature of (1.5 ± 0.2) K. For all the samples measured, largeShubnikov-de Haas (SdH) oscillations in magnetoresistancewere observed starting at a field of approximately 4 T formost samples. The first column of Fig. 7 shows symmetrizedmeasurements of resistivity ρ as a function of magnetic fieldfor Pb1−xNaxTe with (a) x = 0 (pH = 1.9 × 1018 cm−3), (b)x = 0.13% (pH = 2.1 × 1019 cm−3), (c) x = 0.26% (pH =4.1 × 1019 cm−3), (d) x = 0.4% (pH = 6.3 × 1019 cm−3), and(e) x = 0.62% (pH = 9.4 × 1019 cm−3), for different fieldorientations in the (110) plane. As mentioned in Sec. II C, the(110) plane is a natural plane to study the angle evolution ofthe SdH frequencies for this material, given that, in a perfectellipsoidal scenario, it allows the determination of all theextremal cross-sectional areas of both L and � pockets. The
second column of Fig. 7 shows the oscillating component of therespective magnetoresistance curves, as a function of inversefield, extracted after the following background eliminationprocedure: for such low carrier densities, which imply lowfrequencies of oscillation, the determination of the frequenciesand the tracking of their evolution with angle is challenging,given that only a few periods of oscillations are observed forthe field range used, and additionally, several artifacts comingfrom background subtractions have characteristic frequenciesthat are comparable to the frequencies of interest. In our dataanalysis, several methods for background subtraction weretested. The method that generated the best resolution in the fastFourier transform (FFT) for all the Na-doped samples, and thatwe use here, was a cubic-spline fitting of the nonoscillatingcomponent. For the self-doped x = 0 sample, which is thesample with the lowest characteristic frequencies (as low as 8T), the method that allowed the best resolution of the evolutionof fundamental frequency branches was the computation of thefirst derivative.
The evolution with angle of the frequencies of oscillation isshown in the contour plots of the third and fourth columns ofFig. 7. The color scale for these plots represents the amplitudeof the FFT of the corresponding curves in the second column,normalized by the maximum value of the FFT at each angle, asa function of the angle from the [100] direction, and frequency.For all samples, the fundamental frequency of the threeexpected branches of frequency evolution is clearly observed,and for some of the branches, the second and third harmoniccan be identified. For the x = 0 sample, the second harmonicseems to be stronger in amplitude than the fundamental, forall three branches. This effect is likely associated with thedifficulty of resolving low frequency signals. For all samples,the branch that lies in the low frequency region for all anglescontributes the dominant frequency in the magnetoresistance,which is associated with its higher mobility with respect tothe other two branches. For the higher concentration samples,the high frequency contributions are weaker, and a logarithmicscale in the contour plots is used in order to highlight their angleevolution. In order to determine the characteristic frequenciesof oscillation, and the possible deviations of the Fermi surfacefrom a perfect ellipsoidal model, a comparison of these plotswith the frequency evolution for a Fermi surface containingeight half-ellipsoids at the L points (perfect ellipsoidal model)is shown in the fourth column plots of Fig. 7. The fundamentalfrequencies, as well as the second and third harmonics areshown for each sample. The splitting seen in the intermediatefrequency branch for most of the samples can be successfullyaccounted for by a small offset in the plane of rotation. Forthe x = 0 sample, an offset of 12◦ about the [001] axis wasconsidered in the perfect ellipsoidal model. For samples withx = 0.13%, the offset is 3◦ about the [110] axis; and forx = 0.4% and 0.62%, the offset is 4◦ about the [110] axis.
The parameters of minimum and maximum cross-sectionalareas (fmin and fmax) used in the perfect ellipsoidal modelcomparison for each sample are summarized in Table I. Theminimum cross-sectional area of the L pockets, associatedwith fmin, can be determined very accurately from the valueof the fundamental frequency of oscillation at 55◦ from the[100] direction in the (110) plane, which is clearly observedfor all the samples measured. Additionally, the maximum
195141-6
FERMI SURFACE EVOLUTION OF Na-DOPED PbTe . . . PHYSICAL REVIEW B 94, 195141 (2016)
FIG. 7. Magnetoresistance measurements for Pb1−xNaxTe samples of different Na concentrations [row (a) x = 0, row (b) x = 0.13%, row(c) x = 0.26%, row (d) x = 0.4%, and row (e) x = 0.62%] as a function of magnetic field rotated along the (110) plane. The first columnshows the measured resistivity as a function of applied magnetic field. The second column shows the background-free resistivity, obtainedas explained in the main text, as a function of inverse field. The third column shows the amplitude of the normalized FFT, represented bythe color scale, as a function of the angle of the magnetic field from the [100] direction (horizontal axis), and the frequency (vertical axis).The last column replots column three, with a comparison to a perfect ellipsoidal model calculation superimposed (solid lines for fundamentalfrequencies, and dashed lines for higher harmonics). The parameters used for the perfect ellipsoidal model calculation for each set of data aresummarized in Table I. For samples with x = 0.13%, 0.4%, and 0.62%, small deviations from the (110) plane of rotation are evidenced inthe splitting of the angle evolution of the intermediate branch, and they were considered in the perfect ellipsoidal model comparison. For thetwo highest concentrations, combination frequency terms due to magnetic interaction effects are observed. These are identified in the fourthcolumn plots by the light-blue-dotted lines (sum of fundamental branches) and gray-dotted lines (difference of fundamental branches).
cross-sectional area of the L pockets, associated with fmax,can be directly observed in the FFT plots of samples with Naconcentration up to 0.4%. Also, up to this concentration, thematching between the angle evolution of the frequencies of
oscillation with that expected for a perfect ellipsoidal model issatisfactory. Nevertheless, for this last concentration, the maxi-mum frequency of the ellipsoids is resolvable close to 90◦ from[100], but becomes blurred close to 35◦. Therefore, although
195141-7
P. GIRALDO-GALLO et al. PHYSICAL REVIEW B 94, 195141 (2016)
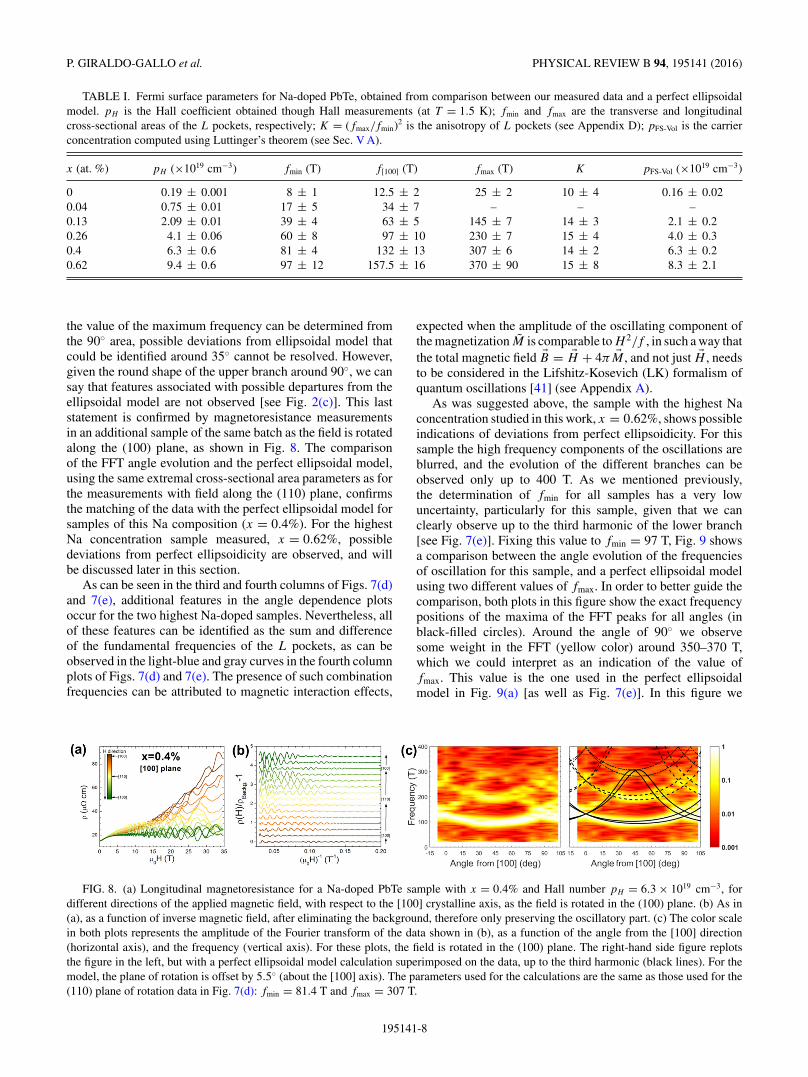
TABLE I. Fermi surface parameters for Na-doped PbTe, obtained from comparison between our measured data and a perfect ellipsoidalmodel. pH is the Hall coefficient obtained though Hall measurements (at T = 1.5 K); fmin and fmax are the transverse and longitudinalcross-sectional areas of the L pockets, respectively; K = (fmax/fmin)2 is the anisotropy of L pockets (see Appendix D); pFS-Vol is the carrierconcentration computed using Luttinger’s theorem (see Sec. V A).
x (at. %) pH (×1019 cm−3) fmin (T) f[100] (T) fmax (T) K pFS-Vol (×1019 cm−3)
0 0.19 ± 0.001 8 ± 1 12.5 ± 2 25 ± 2 10 ± 4 0.16 ± 0.020.04 0.75 ± 0.01 17 ± 5 34 ± 7 – – –0.13 2.09 ± 0.01 39 ± 4 63 ± 5 145 ± 7 14 ± 3 2.1 ± 0.20.26 4.1 ± 0.06 60 ± 8 97 ± 10 230 ± 7 15 ± 4 4.0 ± 0.30.4 6.3 ± 0.6 81 ± 4 132 ± 13 307 ± 6 14 ± 2 6.3 ± 0.20.62 9.4 ± 0.6 97 ± 12 157.5 ± 16 370 ± 90 15 ± 8 8.3 ± 2.1
the value of the maximum frequency can be determined fromthe 90◦ area, possible deviations from ellipsoidal model thatcould be identified around 35◦ cannot be resolved. However,given the round shape of the upper branch around 90◦, we cansay that features associated with possible departures from theellipsoidal model are not observed [see Fig. 2(c)]. This laststatement is confirmed by magnetoresistance measurementsin an additional sample of the same batch as the field is rotatedalong the (100) plane, as shown in Fig. 8. The comparisonof the FFT angle evolution and the perfect ellipsoidal model,using the same extremal cross-sectional area parameters as forthe measurements with field along the (110) plane, confirmsthe matching of the data with the perfect ellipsoidal model forsamples of this Na composition (x = 0.4%). For the highestNa concentration sample measured, x = 0.62%, possibledeviations from perfect ellipsoidicity are observed, and willbe discussed later in this section.
As can be seen in the third and fourth columns of Figs. 7(d)and 7(e), additional features in the angle dependence plotsoccur for the two highest Na-doped samples. Nevertheless, allof these features can be identified as the sum and differenceof the fundamental frequencies of the L pockets, as can beobserved in the light-blue and gray curves in the fourth columnplots of Figs. 7(d) and 7(e). The presence of such combinationfrequencies can be attributed to magnetic interaction effects,
expected when the amplitude of the oscillating component ofthe magnetization M is comparable to H 2/f , in such a way thatthe total magnetic field �B = �H + 4π �M , and not just �H , needsto be considered in the Lifshitz-Kosevich (LK) formalism ofquantum oscillations [41] (see Appendix A).
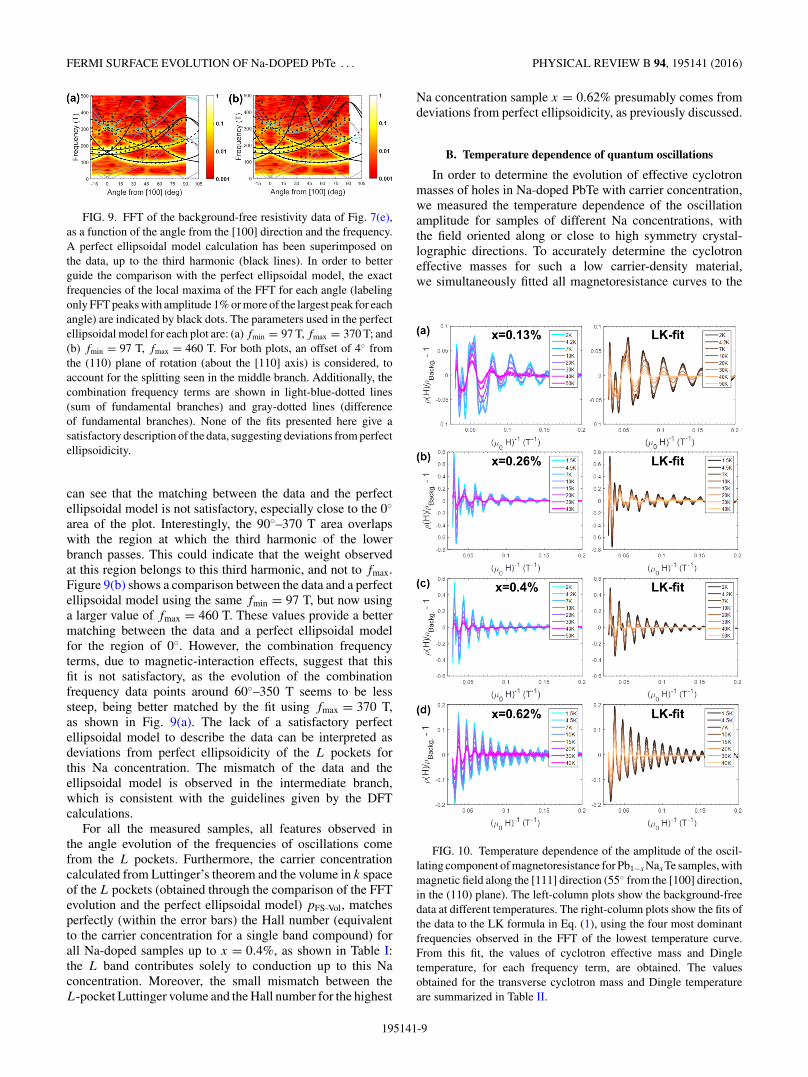
As was suggested above, the sample with the highest Naconcentration studied in this work, x = 0.62%, shows possibleindications of deviations from perfect ellipsoidicity. For thissample the high frequency components of the oscillations areblurred, and the evolution of the different branches can beobserved only up to 400 T. As we mentioned previously,the determination of fmin for all samples has a very lowuncertainty, particularly for this sample, given that we canclearly observe up to the third harmonic of the lower branch[see Fig. 7(e)]. Fixing this value to fmin = 97 T, Fig. 9 showsa comparison between the angle evolution of the frequenciesof oscillation for this sample, and a perfect ellipsoidal modelusing two different values of fmax. In order to better guide thecomparison, both plots in this figure show the exact frequencypositions of the maxima of the FFT peaks for all angles (inblack-filled circles). Around the angle of 90◦ we observesome weight in the FFT (yellow color) around 350–370 T,which we could interpret as an indication of the value offmax. This value is the one used in the perfect ellipsoidalmodel in Fig. 9(a) [as well as Fig. 7(e)]. In this figure we
FIG. 8. (a) Longitudinal magnetoresistance for a Na-doped PbTe sample with x = 0.4% and Hall number pH = 6.3 × 1019 cm−3, fordifferent directions of the applied magnetic field, with respect to the [100] crystalline axis, as the field is rotated in the (100) plane. (b) As in(a), as a function of inverse magnetic field, after eliminating the background, therefore only preserving the oscillatory part. (c) The color scalein both plots represents the amplitude of the Fourier transform of the data shown in (b), as a function of the angle from the [100] direction(horizontal axis), and the frequency (vertical axis). For these plots, the field is rotated in the (100) plane. The right-hand side figure replotsthe figure in the left, but with a perfect ellipsoidal model calculation superimposed on the data, up to the third harmonic (black lines). For themodel, the plane of rotation is offset by 5.5◦ (about the [100] axis). The parameters used for the calculations are the same as those used for the(110) plane of rotation data in Fig. 7(d): fmin = 81.4 T and fmax = 307 T.
195141-8
FERMI SURFACE EVOLUTION OF Na-DOPED PbTe . . . PHYSICAL REVIEW B 94, 195141 (2016)
FIG. 9. FFT of the background-free resistivity data of Fig. 7(e),as a function of the angle from the [100] direction and the frequency.A perfect ellipsoidal model calculation has been superimposed onthe data, up to the third harmonic (black lines). In order to betterguide the comparison with the perfect ellipsoidal model, the exactfrequencies of the local maxima of the FFT for each angle (labelingonly FFT peaks with amplitude 1% or more of the largest peak for eachangle) are indicated by black dots. The parameters used in the perfectellipsoidal model for each plot are: (a) fmin = 97 T, fmax = 370 T; and(b) fmin = 97 T, fmax = 460 T. For both plots, an offset of 4◦ fromthe (110) plane of rotation (about the [110] axis) is considered, toaccount for the splitting seen in the middle branch. Additionally, thecombination frequency terms are shown in light-blue-dotted lines(sum of fundamental branches) and gray-dotted lines (differenceof fundamental branches). None of the fits presented here give asatisfactory description of the data, suggesting deviations from perfectellipsoidicity.
can see that the matching between the data and the perfectellipsoidal model is not satisfactory, especially close to the 0◦area of the plot. Interestingly, the 90◦–370 T area overlapswith the region at which the third harmonic of the lowerbranch passes. This could indicate that the weight observedat this region belongs to this third harmonic, and not to fmax.Figure 9(b) shows a comparison between the data and a perfectellipsoidal model using the same fmin = 97 T, but now usinga larger value of fmax = 460 T. These values provide a bettermatching between the data and a perfect ellipsoidal modelfor the region of 0◦. However, the combination frequencyterms, due to magnetic-interaction effects, suggest that thisfit is not satisfactory, as the evolution of the combinationfrequency data points around 60◦–350 T seems to be lesssteep, being better matched by the fit using fmax = 370 T,as shown in Fig. 9(a). The lack of a satisfactory perfectellipsoidal model to describe the data can be interpreted asdeviations from perfect ellipsoidicity of the L pockets forthis Na concentration. The mismatch of the data and theellipsoidal model is observed in the intermediate branch,which is consistent with the guidelines given by the DFTcalculations.
For all the measured samples, all features observed inthe angle evolution of the frequencies of oscillations comefrom the L pockets. Furthermore, the carrier concentrationcalculated from Luttinger’s theorem and the volume in k spaceof the L pockets (obtained through the comparison of the FFTevolution and the perfect ellipsoidal model) pFS-Vol, matchesperfectly (within the error bars) the Hall number (equivalentto the carrier concentration for a single band compound) forall Na-doped samples up to x = 0.4%, as shown in Table I:the L band contributes solely to conduction up to this Naconcentration. Moreover, the small mismatch between theL-pocket Luttinger volume and the Hall number for the highest
Na concentration sample x = 0.62% presumably comes fromdeviations from perfect ellipsoidicity, as previously discussed.
B. Temperature dependence of quantum oscillations
In order to determine the evolution of effective cyclotronmasses of holes in Na-doped PbTe with carrier concentration,we measured the temperature dependence of the oscillationamplitude for samples of different Na concentrations, withthe field oriented along or close to high symmetry crystal-lographic directions. To accurately determine the cyclotroneffective masses for such a low carrier-density material,we simultaneously fitted all magnetoresistance curves to the
FIG. 10. Temperature dependence of the amplitude of the oscil-lating component of magnetoresistance for Pb1−xNaxTe samples, withmagnetic field along the [111] direction (55◦ from the [100] direction,in the (110) plane). The left-column plots show the background-freedata at different temperatures. The right-column plots show the fits ofthe data to the LK formula in Eq. (1), using the four most dominantfrequencies observed in the FFT of the lowest temperature curve.From this fit, the values of cyclotron effective mass and Dingletemperature, for each frequency term, are obtained. The valuesobtained for the transverse cyclotron mass and Dingle temperatureare summarized in Table II.
195141-9
P. GIRALDO-GALLO et al. PHYSICAL REVIEW B 94, 195141 (2016)
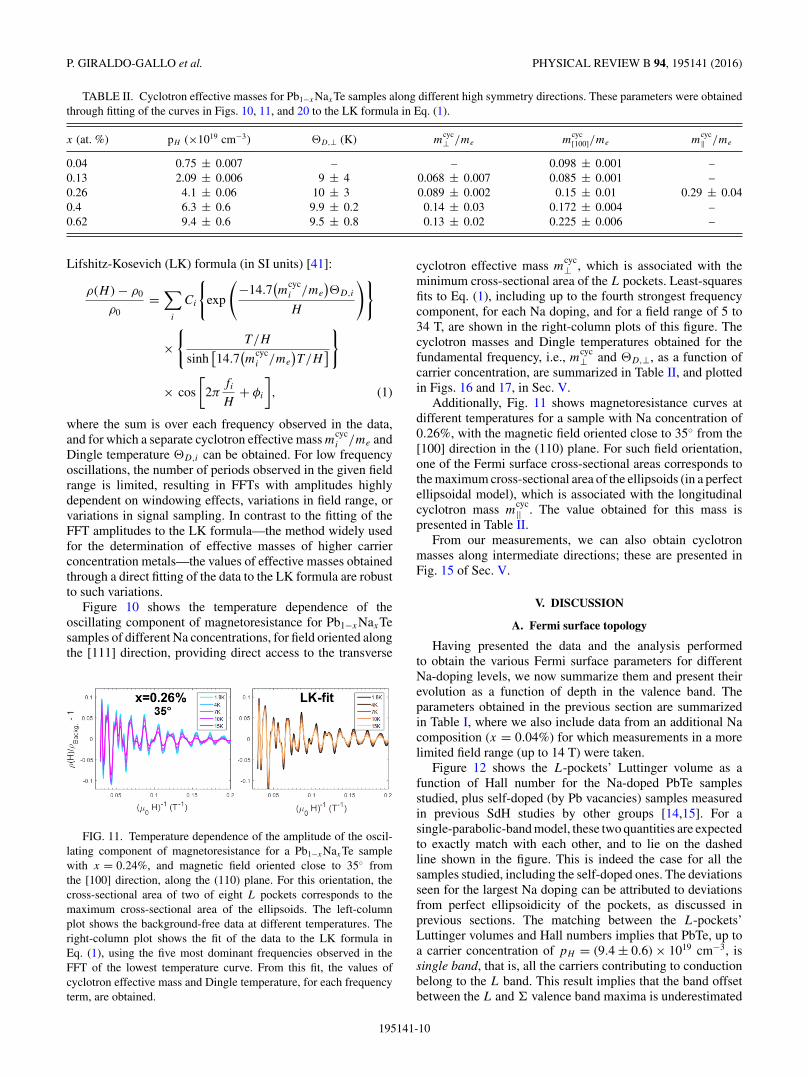
TABLE II. Cyclotron effective masses for Pb1−xNaxTe samples along different high symmetry directions. These parameters were obtainedthrough fitting of the curves in Figs. 10, 11, and 20 to the LK formula in Eq. (1).
x (at. %) pH (×1019 cm−3) �D,⊥ (K) mcyc⊥ /me m
cyc[100]/me m
cyc‖ /me
0.04 0.75 ± 0.007 – – 0.098 ± 0.001 –0.13 2.09 ± 0.006 9 ± 4 0.068 ± 0.007 0.085 ± 0.001 –0.26 4.1 ± 0.06 10 ± 3 0.089 ± 0.002 0.15 ± 0.01 0.29 ± 0.040.4 6.3 ± 0.6 9.9 ± 0.2 0.14 ± 0.03 0.172 ± 0.004 –0.62 9.4 ± 0.6 9.5 ± 0.8 0.13 ± 0.02 0.225 ± 0.006 –
Lifshitz-Kosevich (LK) formula (in SI units) [41]:
ρ(H ) − ρ0
ρ0=
∑i
Ci
{exp
(−14.7
(m
cyci /me
)�D,i
H
)}
×{
T/H
sinh[14.7
(m
cyci /me
)T/H
]}
× cos
[2π
fi
H+ φi
], (1)
where the sum is over each frequency observed in the data,and for which a separate cyclotron effective mass m
cyci /me and
Dingle temperature �D,i can be obtained. For low frequencyoscillations, the number of periods observed in the given fieldrange is limited, resulting in FFTs with amplitudes highlydependent on windowing effects, variations in field range, orvariations in signal sampling. In contrast to the fitting of theFFT amplitudes to the LK formula—the method widely usedfor the determination of effective masses of higher carrierconcentration metals—the values of effective masses obtainedthrough a direct fitting of the data to the LK formula are robustto such variations.
Figure 10 shows the temperature dependence of theoscillating component of magnetoresistance for Pb1−xNaxTesamples of different Na concentrations, for field oriented alongthe [111] direction, providing direct access to the transverse
FIG. 11. Temperature dependence of the amplitude of the oscil-lating component of magnetoresistance for a Pb1−xNaxTe samplewith x = 0.24%, and magnetic field oriented close to 35◦ fromthe [100] direction, along the (110) plane. For this orientation, thecross-sectional area of two of eight L pockets corresponds to themaximum cross-sectional area of the ellipsoids. The left-columnplot shows the background-free data at different temperatures. Theright-column plot shows the fit of the data to the LK formula inEq. (1), using the five most dominant frequencies observed in theFFT of the lowest temperature curve. From this fit, the values ofcyclotron effective mass and Dingle temperature, for each frequencyterm, are obtained.
cyclotron effective mass mcyc⊥ , which is associated with the
minimum cross-sectional area of the L pockets. Least-squaresfits to Eq. (1), including up to the fourth strongest frequencycomponent, for each Na doping, and for a field range of 5 to34 T, are shown in the right-column plots of this figure. Thecyclotron masses and Dingle temperatures obtained for thefundamental frequency, i.e., m
cyc⊥ and �D,⊥, as a function of
carrier concentration, are summarized in Table II, and plottedin Figs. 16 and 17, in Sec. V.
Additionally, Fig. 11 shows magnetoresistance curves atdifferent temperatures for a sample with Na concentration of0.26%, with the magnetic field oriented close to 35◦ from the[100] direction in the (110) plane. For such field orientation,one of the Fermi surface cross-sectional areas corresponds tothe maximum cross-sectional area of the ellipsoids (in a perfectellipsoidal model), which is associated with the longitudinalcyclotron mass m
cyc|| . The value obtained for this mass is
presented in Table II.From our measurements, we can also obtain cyclotron
masses along intermediate directions; these are presented inFig. 15 of Sec. V.
V. DISCUSSION
A. Fermi surface topology
Having presented the data and the analysis performedto obtain the various Fermi surface parameters for differentNa-doping levels, we now summarize them and present theirevolution as a function of depth in the valence band. Theparameters obtained in the previous section are summarizedin Table I, where we also include data from an additional Nacomposition (x = 0.04%) for which measurements in a morelimited field range (up to 14 T) were taken.
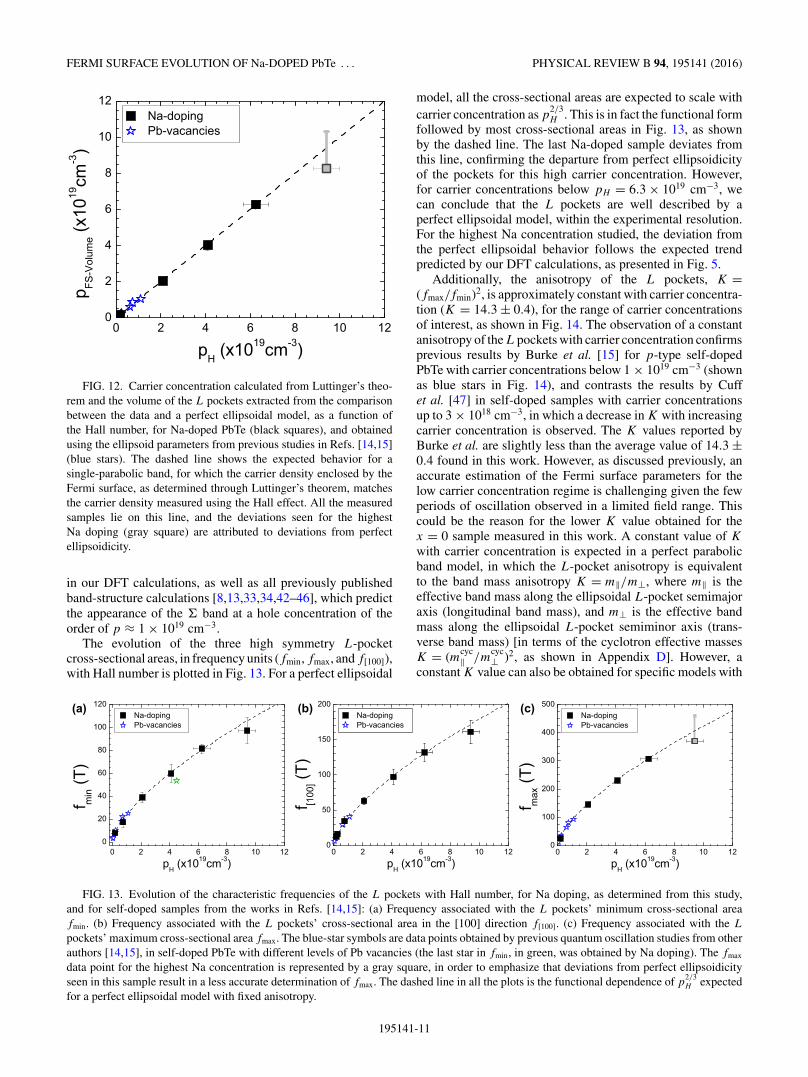
Figure 12 shows the L-pockets’ Luttinger volume as afunction of Hall number for the Na-doped PbTe samplesstudied, plus self-doped (by Pb vacancies) samples measuredin previous SdH studies by other groups [14,15]. For asingle-parabolic-band model, these two quantities are expectedto exactly match with each other, and to lie on the dashedline shown in the figure. This is indeed the case for all thesamples studied, including the self-doped ones. The deviationsseen for the largest Na doping can be attributed to deviationsfrom perfect ellipsoidicity of the pockets, as discussed inprevious sections. The matching between the L-pockets’Luttinger volumes and Hall numbers implies that PbTe, up toa carrier concentration of pH = (9.4 ± 0.6) × 1019 cm−3, issingle band, that is, all the carriers contributing to conductionbelong to the L band. This result implies that the band offsetbetween the L and � valence band maxima is underestimated
195141-10
FERMI SURFACE EVOLUTION OF Na-DOPED PbTe . . . PHYSICAL REVIEW B 94, 195141 (2016)
0 2 4 6 8 10 120
2
4
6
8
10
12Na-dopingPb-vacancies
p FS-V
olum
e(x
1019
cm-3)
pH (x1019cm-3)
FIG. 12. Carrier concentration calculated from Luttinger’s theo-rem and the volume of the L pockets extracted from the comparisonbetween the data and a perfect ellipsoidal model, as a function ofthe Hall number, for Na-doped PbTe (black squares), and obtainedusing the ellipsoid parameters from previous studies in Refs. [14,15](blue stars). The dashed line shows the expected behavior for asingle-parabolic band, for which the carrier density enclosed by theFermi surface, as determined through Luttinger’s theorem, matchesthe carrier density measured using the Hall effect. All the measuredsamples lie on this line, and the deviations seen for the highestNa doping (gray square) are attributed to deviations from perfectellipsoidicity.
in our DFT calculations, as well as all previously publishedband-structure calculations [8,13,33,34,42–46], which predictthe appearance of the � band at a hole concentration of theorder of p ≈ 1 × 1019 cm−3.
The evolution of the three high symmetry L-pocketcross-sectional areas, in frequency units (fmin, fmax, and f[100]),with Hall number is plotted in Fig. 13. For a perfect ellipsoidal
model, all the cross-sectional areas are expected to scale withcarrier concentration as p
2/3H . This is in fact the functional form
followed by most cross-sectional areas in Fig. 13, as shownby the dashed line. The last Na-doped sample deviates fromthis line, confirming the departure from perfect ellipsoidicityof the pockets for this high carrier concentration. However,for carrier concentrations below pH = 6.3 × 1019 cm−3, wecan conclude that the L pockets are well described by aperfect ellipsoidal model, within the experimental resolution.For the highest Na concentration studied, the deviation fromthe perfect ellipsoidal behavior follows the expected trendpredicted by our DFT calculations, as presented in Fig. 5.
Additionally, the anisotropy of the L pockets, K =(fmax/fmin)2, is approximately constant with carrier concentra-tion (K = 14.3 ± 0.4), for the range of carrier concentrationsof interest, as shown in Fig. 14. The observation of a constantanisotropy of the L pockets with carrier concentration confirmsprevious results by Burke et al. [15] for p-type self-dopedPbTe with carrier concentrations below 1 × 1019 cm−3 (shownas blue stars in Fig. 14), and contrasts the results by Cuffet al. [47] in self-doped samples with carrier concentrationsup to 3 × 1018 cm−3, in which a decrease in K with increasingcarrier concentration is observed. The K values reported byBurke et al. are slightly less than the average value of 14.3 ±0.4 found in this work. However, as discussed previously, anaccurate estimation of the Fermi surface parameters for thelow carrier concentration regime is challenging given the fewperiods of oscillation observed in a limited field range. Thiscould be the reason for the lower K value obtained for thex = 0 sample measured in this work. A constant value of K
with carrier concentration is expected in a perfect parabolicband model, in which the L-pocket anisotropy is equivalentto the band mass anisotropy K = m‖/m⊥, where m‖ is theeffective band mass along the ellipsoidal L-pocket semimajoraxis (longitudinal band mass), and m⊥ is the effective bandmass along the ellipsoidal L-pocket semiminor axis (trans-verse band mass) [in terms of the cyclotron effective massesK = (mcyc
‖ /mcyc⊥ )2, as shown in Appendix D]. However, a
constant K value can also be obtained for specific models with
0 2 4 6 8 10 120
50
100
150
200(b)
f [100
] (T)
pH (x1019cm-3)
Na-doping Pb-vacancies
0 2 4 6 8 10 120
20
40
60
80
100
120 Na-doping Pb-vacancies
(a)
f min (T
)
pH (x1019cm-3)0 2 4 6 8 10 12
0
100
200
300
400
500(c) Na-doping Pb-vacancies
f max
(T)
pH (x1019cm-3)
FIG. 13. Evolution of the characteristic frequencies of the L pockets with Hall number, for Na doping, as determined from this study,and for self-doped samples from the works in Refs. [14,15]: (a) Frequency associated with the L pockets’ minimum cross-sectional areafmin. (b) Frequency associated with the L pockets’ cross-sectional area in the [100] direction f[100]. (c) Frequency associated with the L
pockets’ maximum cross-sectional area fmax. The blue-star symbols are data points obtained by previous quantum oscillation studies from otherauthors [14,15], in self-doped PbTe with different levels of Pb vacancies (the last star in fmin, in green, was obtained by Na doping). The fmax
data point for the highest Na concentration is represented by a gray square, in order to emphasize that deviations from perfect ellipsoidicityseen in this sample result in a less accurate determination of fmax. The dashed line in all the plots is the functional dependence of p
2/3H expected
for a perfect ellipsoidal model with fixed anisotropy.
195141-11
P. GIRALDO-GALLO et al. PHYSICAL REVIEW B 94, 195141 (2016)
0 2 4 6 8 10 120
5
10
15
20
25
30 Na-doping Pb-vacancies
K
pH (x1019cm-3)
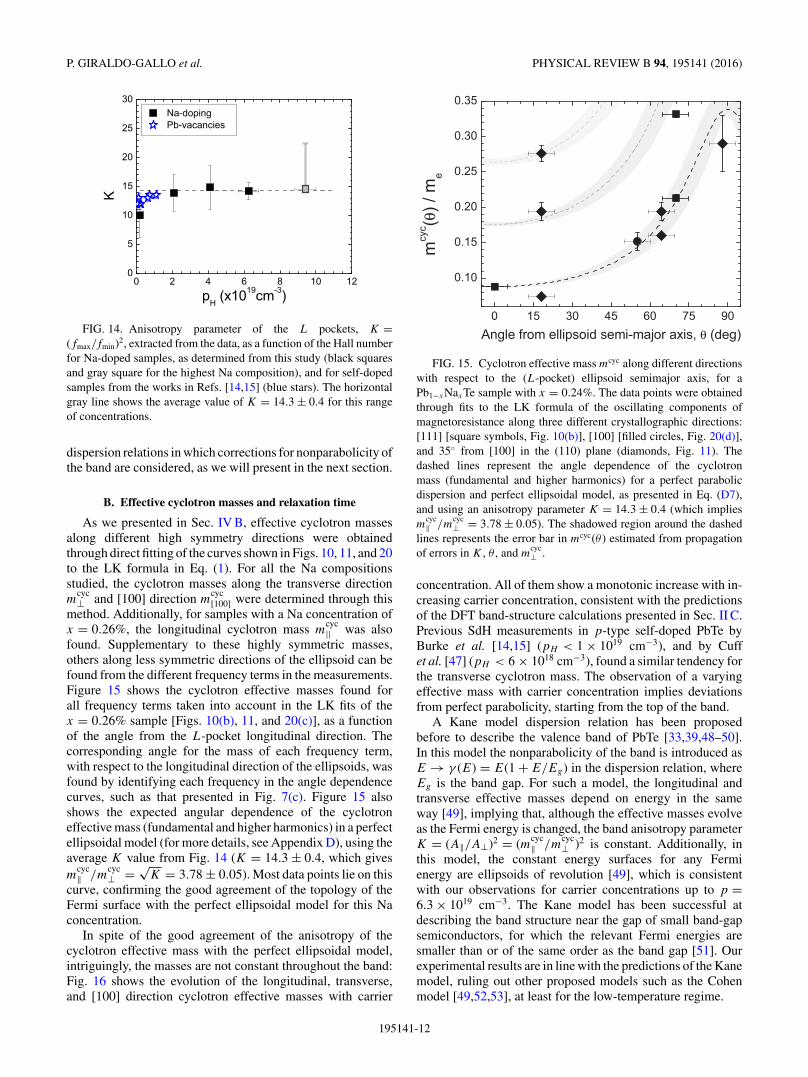
FIG. 14. Anisotropy parameter of the L pockets, K =(fmax/fmin)2, extracted from the data, as a function of the Hall numberfor Na-doped samples, as determined from this study (black squaresand gray square for the highest Na composition), and for self-dopedsamples from the works in Refs. [14,15] (blue stars). The horizontalgray line shows the average value of K = 14.3 ± 0.4 for this rangeof concentrations.
dispersion relations in which corrections for nonparabolicity ofthe band are considered, as we will present in the next section.
B. Effective cyclotron masses and relaxation time
As we presented in Sec. IV B, effective cyclotron massesalong different high symmetry directions were obtainedthrough direct fitting of the curves shown in Figs. 10, 11, and 20to the LK formula in Eq. (1). For all the Na compositionsstudied, the cyclotron masses along the transverse directionm
cyc⊥ and [100] direction m
cyc[100] were determined through this
method. Additionally, for samples with a Na concentration ofx = 0.26%, the longitudinal cyclotron mass m
cyc|| was also
found. Supplementary to these highly symmetric masses,others along less symmetric directions of the ellipsoid can befound from the different frequency terms in the measurements.Figure 15 shows the cyclotron effective masses found forall frequency terms taken into account in the LK fits of thex = 0.26% sample [Figs. 10(b), 11, and 20(c)], as a functionof the angle from the L-pocket longitudinal direction. Thecorresponding angle for the mass of each frequency term,with respect to the longitudinal direction of the ellipsoids, wasfound by identifying each frequency in the angle dependencecurves, such as that presented in Fig. 7(c). Figure 15 alsoshows the expected angular dependence of the cyclotroneffective mass (fundamental and higher harmonics) in a perfectellipsoidal model (for more details, see Appendix D), using theaverage K value from Fig. 14 (K = 14.3 ± 0.4, which givesm
cyc‖ /m
cyc⊥ = √
K = 3.78 ± 0.05). Most data points lie on thiscurve, confirming the good agreement of the topology of theFermi surface with the perfect ellipsoidal model for this Naconcentration.
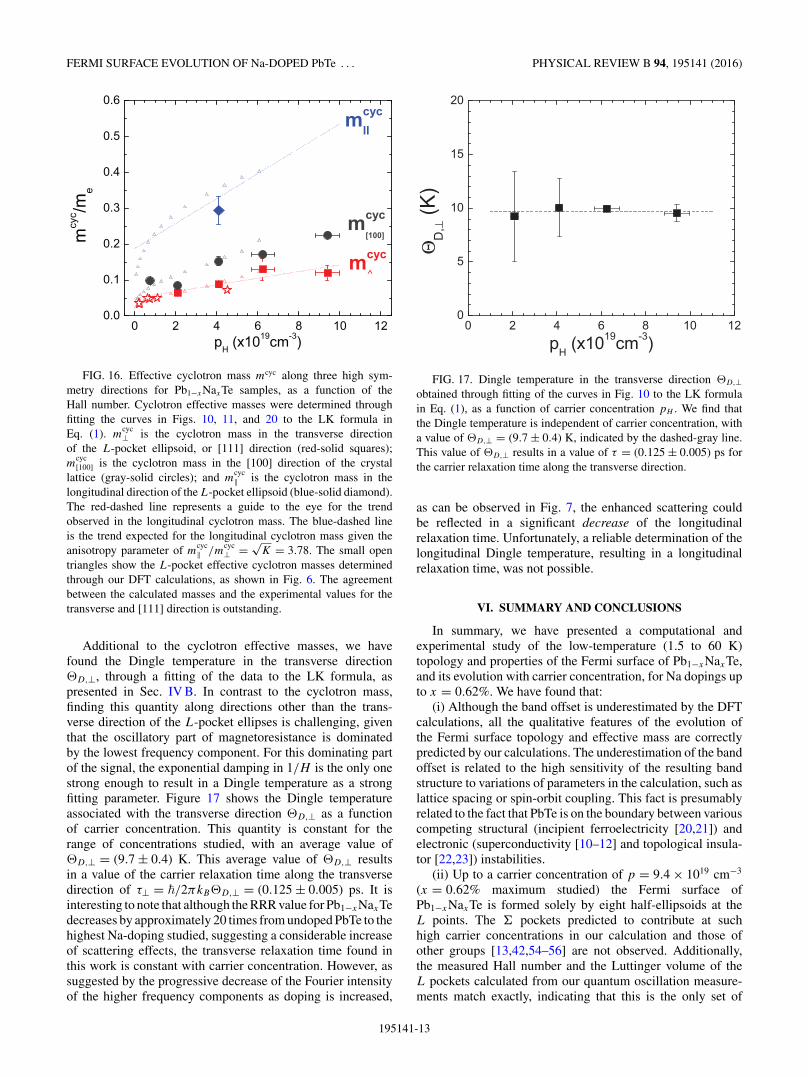
In spite of the good agreement of the anisotropy of thecyclotron effective mass with the perfect ellipsoidal model,intriguingly, the masses are not constant throughout the band:Fig. 16 shows the evolution of the longitudinal, transverse,and [100] direction cyclotron effective masses with carrier
0 15 30 45 60 75 90
0.10
0.15
0.20
0.25
0.30
0.35
mcy
c (θ)/
me
Angle from ellipsoid semi-major axis, θ (deg)
FIG. 15. Cyclotron effective mass mcyc along different directionswith respect to the (L-pocket) ellipsoid semimajor axis, for aPb1−xNaxTe sample with x = 0.24%. The data points were obtainedthrough fits to the LK formula of the oscillating components ofmagnetoresistance along three different crystallographic directions:[111] [square symbols, Fig. 10(b)], [100] [filled circles, Fig. 20(d)],and 35◦ from [100] in the (110) plane (diamonds, Fig. 11). Thedashed lines represent the angle dependence of the cyclotronmass (fundamental and higher harmonics) for a perfect parabolicdispersion and perfect ellipsoidal model, as presented in Eq. (D7),and using an anisotropy parameter K = 14.3 ± 0.4 (which impliesm
cyc‖ /m
cyc⊥ = 3.78 ± 0.05). The shadowed region around the dashed
lines represents the error bar in mcyc(θ ) estimated from propagationof errors in K , θ , and m
cyc⊥ .
concentration. All of them show a monotonic increase with in-creasing carrier concentration, consistent with the predictionsof the DFT band-structure calculations presented in Sec. II C.Previous SdH measurements in p-type self-doped PbTe byBurke et al. [14,15] (pH < 1 × 1019 cm−3), and by Cuffet al. [47] (pH < 6 × 1018 cm−3), found a similar tendency forthe transverse cyclotron mass. The observation of a varyingeffective mass with carrier concentration implies deviationsfrom perfect parabolicity, starting from the top of the band.
A Kane model dispersion relation has been proposedbefore to describe the valence band of PbTe [33,39,48–50].In this model the nonparabolicity of the band is introduced asE → γ (E) = E(1 + E/Eg) in the dispersion relation, whereEg is the band gap. For such a model, the longitudinal andtransverse effective masses depend on energy in the sameway [49], implying that, although the effective masses evolveas the Fermi energy is changed, the band anisotropy parameterK = (A‖/A⊥)2 = (mcyc
‖ /mcyc⊥ )2 is constant. Additionally, in
this model, the constant energy surfaces for any Fermienergy are ellipsoids of revolution [49], which is consistentwith our observations for carrier concentrations up to p =6.3 × 1019 cm−3. The Kane model has been successful atdescribing the band structure near the gap of small band-gapsemiconductors, for which the relevant Fermi energies aresmaller than or of the same order as the band gap [51]. Ourexperimental results are in line with the predictions of the Kanemodel, ruling out other proposed models such as the Cohenmodel [49,52,53], at least for the low-temperature regime.
195141-12
FERMI SURFACE EVOLUTION OF Na-DOPED PbTe . . . PHYSICAL REVIEW B 94, 195141 (2016)
0 2 4 6 8 10 120.0
0.1
0.2
0.3
0.4
0.5
0.6
mcycll
mcyc[100]m
cyc /m
e
pH (x1019cm-3)
mcyc^
FIG. 16. Effective cyclotron mass mcyc along three high sym-metry directions for Pb1−xNaxTe samples, as a function of theHall number. Cyclotron effective masses were determined throughfitting the curves in Figs. 10, 11, and 20 to the LK formula inEq. (1). m
cyc⊥ is the cyclotron mass in the transverse direction
of the L-pocket ellipsoid, or [111] direction (red-solid squares);m
cyc[100] is the cyclotron mass in the [100] direction of the crystal
lattice (gray-solid circles); and mcyc‖ is the cyclotron mass in the
longitudinal direction of the L-pocket ellipsoid (blue-solid diamond).The red-dashed line represents a guide to the eye for the trendobserved in the longitudinal cyclotron mass. The blue-dashed lineis the trend expected for the longitudinal cyclotron mass given theanisotropy parameter of m
cyc‖ /m
cyc⊥ = √
K = 3.78. The small opentriangles show the L-pocket effective cyclotron masses determinedthrough our DFT calculations, as shown in Fig. 6. The agreementbetween the calculated masses and the experimental values for thetransverse and [111] direction is outstanding.
Additional to the cyclotron effective masses, we havefound the Dingle temperature in the transverse direction�D,⊥, through a fitting of the data to the LK formula, aspresented in Sec. IV B. In contrast to the cyclotron mass,finding this quantity along directions other than the trans-verse direction of the L-pocket ellipses is challenging, giventhat the oscillatory part of magnetoresistance is dominatedby the lowest frequency component. For this dominating partof the signal, the exponential damping in 1/H is the only onestrong enough to result in a Dingle temperature as a strongfitting parameter. Figure 17 shows the Dingle temperatureassociated with the transverse direction �D,⊥ as a functionof carrier concentration. This quantity is constant for therange of concentrations studied, with an average value of�D,⊥ = (9.7 ± 0.4) K. This average value of �D,⊥ resultsin a value of the carrier relaxation time along the transversedirection of τ⊥ = �/2πkB�D,⊥ = (0.125 ± 0.005) ps. It isinteresting to note that although the RRR value for Pb1−xNaxTedecreases by approximately 20 times from undoped PbTe to thehighest Na-doping studied, suggesting a considerable increaseof scattering effects, the transverse relaxation time found inthis work is constant with carrier concentration. However, assuggested by the progressive decrease of the Fourier intensityof the higher frequency components as doping is increased,
0 2 4 6 8 10 120
5
10
15
20
ΘD
,⊥ (K
)
pH (x1019cm-3)
FIG. 17. Dingle temperature in the transverse direction �D,⊥obtained through fitting of the curves in Fig. 10 to the LK formulain Eq. (1), as a function of carrier concentration pH . We find thatthe Dingle temperature is independent of carrier concentration, witha value of �D,⊥ = (9.7 ± 0.4) K, indicated by the dashed-gray line.This value of �D,⊥ results in a value of τ = (0.125 ± 0.005) ps forthe carrier relaxation time along the transverse direction.
as can be observed in Fig. 7, the enhanced scattering couldbe reflected in a significant decrease of the longitudinalrelaxation time. Unfortunately, a reliable determination of thelongitudinal Dingle temperature, resulting in a longitudinalrelaxation time, was not possible.
VI. SUMMARY AND CONCLUSIONS
In summary, we have presented a computational andexperimental study of the low-temperature (1.5 to 60 K)topology and properties of the Fermi surface of Pb1−xNaxTe,and its evolution with carrier concentration, for Na dopings upto x = 0.62%. We have found that:
(i) Although the band offset is underestimated by the DFTcalculations, all the qualitative features of the evolution ofthe Fermi surface topology and effective mass are correctlypredicted by our calculations. The underestimation of the bandoffset is related to the high sensitivity of the resulting bandstructure to variations of parameters in the calculation, such aslattice spacing or spin-orbit coupling. This fact is presumablyrelated to the fact that PbTe is on the boundary between variouscompeting structural (incipient ferroelectricity [20,21]) andelectronic (superconductivity [10–12] and topological insula-tor [22,23]) instabilities.
(ii) Up to a carrier concentration of p = 9.4 × 1019 cm−3
(x = 0.62% maximum studied) the Fermi surface ofPb1−xNaxTe is formed solely by eight half-ellipsoids at theL points. The � pockets predicted to contribute at suchhigh carrier concentrations in our calculation and those ofother groups [13,42,54–56] are not observed. Additionally,the measured Hall number and the Luttinger volume of theL pockets calculated from our quantum oscillation measure-ments match exactly, indicating that this is the only set of
195141-13
P. GIRALDO-GALLO et al. PHYSICAL REVIEW B 94, 195141 (2016)
pockets that contribute to conduction in this compound at lowtemperatures.
(iii) The topology of the Fermi surface, formed by eighthalf-pockets at the L points, is well described by a perfectellipsoidal model for carrier concentrations up to p = 6.3 ×1019 cm−3 (x = 0.4%). Deviations from perfect ellipsoidicitywere resolved for the highest carrier concentration studied,p = 9.4 × 1019 cm−3 (x = 0.62%).
(iv) The anisotropy of the L pockets is constant for therange of concentrations studied, and has an average value ofK = 14.3 ± 0.4.
(v) The anisotropy of the cyclotron effective mass of the L
pockets follows the angular dependence expected in a perfectellipsoidal model.
(vi) The effective cyclotron masses along all high symmetrydirections increase monotonically with increasing carrierconcentration, implying deviations from perfect parabolicityof the band. The observation of constant geometric andmass anisotropy with carrier concentration, but an increasingeffective mass, is consistent with a Kane model of nonparabolicdispersion relation for the valence band of PbTe.
Our experimental determination of the low-temperatureFermi surface and band structure parameters of PbTe is animportant piece of information which needs to be consideredin models that aim at explaining the evolution of a variety ofelectronic properties at high doping levels in PbTe, includingsuperconductivity and thermoelectric properties.
ACKNOWLEDGMENTS
The high-field magnetoresistance measurements were per-formed at the National High Magnetic Field Laboratory(NHMFL), which is supported by NSF DMR-1157490 andthe State of Florida. P.G.G., P.W., H.J.S., and I.R.F. weresupported by AFOSR Grant No. FA9550-09-1-0583. B.S.,M.F., and N.A.S. acknowledge support from ETH Zurich,ERC Advanced Grant program (No. 291151), and the SwissNational Supercomputing Centre (CSCS) under project IDs307.
APPENDIX A: QUANTUM OSCILLATIONS FORMALISM
In this Appendix we briefly outline the concepts needed tounderstand quantum oscillation experiments in metals. For adetailed treatment see the excellent book by Shoenberg [41].It is well known that in a magnetic field H the allowedelectronic states lie on quantized tubes in k space (Landautubes). The tube quantization is described by the Onsagerequation
a(En,kH,kH ) =
(n + 1
2
)2πeH/�c, (A1)
where a is the cross-sectional area of the Landau tube in a planeperpendicular to H , and n is an integer. As a consequence,an oscillatory behavior with the inverse magnetic field 1/H
can be observed in, for example, the magnetization—the deHaas-van Alphen effect—or the resistance—the Shubnikov-deHaas effect. The period of such oscillations �1/H is given by
�1/H = 2πe/(�cA), (A2)
A being an extremal cross-sectional area of the Fermi surfacein a plane perpendicular to H . One can also define a frequencyfor these oscillations as
f = 1/�1/H = (c�/2πe)A. (A3)
By determining the oscillations in, e.g., the resistivity forvarying orientations of the magnetic field, one can eventuallyreconstruct the Fermi surface.
In the semiclassical picture the electrons move along (openand closed) orbits on the Fermi surface in a plane perpendicularto H . The time taken to traverse a closed (cyclotron) orbit isgiven by
tc = 2π
ωc
= �2c
eH
∂a
∂E, (A4)
where one can rewrite the cyclotron frequency ωc in terms ofa cyclotron mass
mcyc = �2
2π
∂a
∂E. (A5)
For a free-electron gas the cyclotron mass is equal tothe electron mass. Experimentally the cyclotron masses areextracted using the Lifshitz-Kosevich (LK) formula (in SIunits)
ρ(H ) − ρ0
ρ0=
∑i
Ci
{exp
(−14.7
(m
cyci /m0
)�D,i
H
)}
×{
T/H
sinh[14.7
(m
cyci /m0
)T/H
]}
× cos
[2π
fi
H+ φi
], (A6)
as presented in Eq. (1).
0 50 100 150 200 250 300
6.43
6.44
6.45
6.46
6.47
6.48Undoped (Bozin et al.)x=0.26% (pH=4.1x1019cm-3)
x=0.62% (pH=9.4x1019cm-3)
a
T (K)
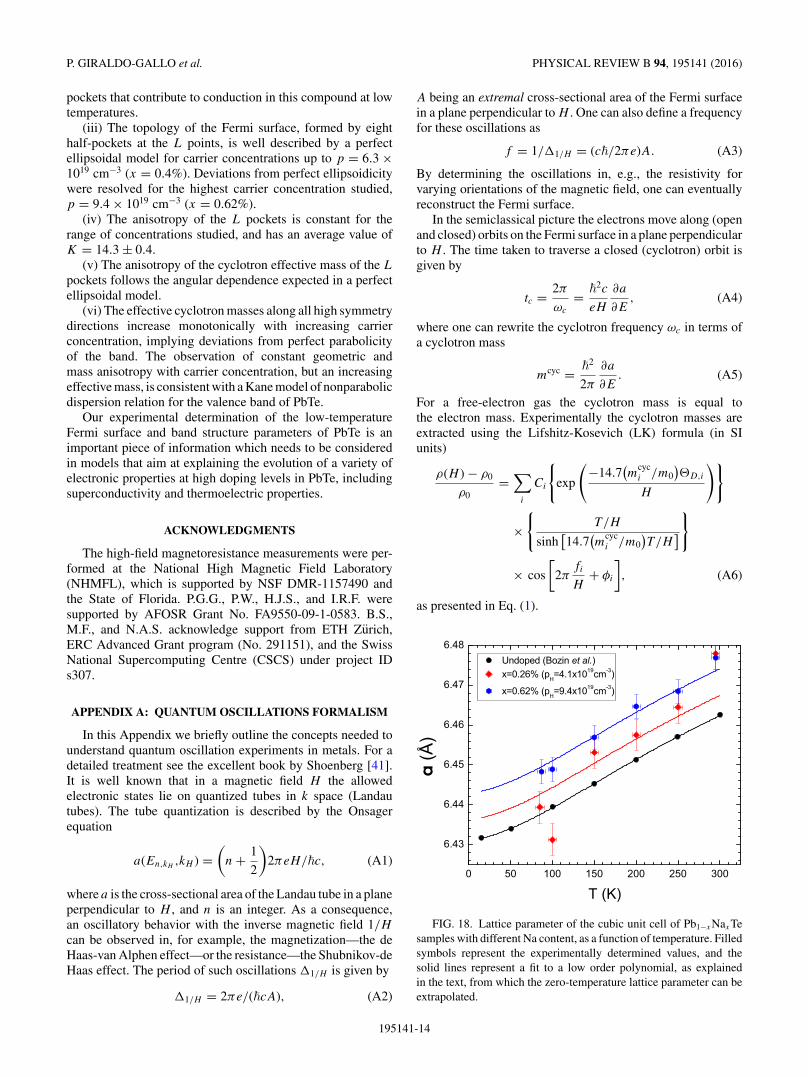
FIG. 18. Lattice parameter of the cubic unit cell of Pb1−xNaxTesamples with different Na content, as a function of temperature. Filledsymbols represent the experimentally determined values, and thesolid lines represent a fit to a low order polynomial, as explainedin the text, from which the zero-temperature lattice parameter can beextrapolated.
195141-14
FERMI SURFACE EVOLUTION OF Na-DOPED PbTe . . . PHYSICAL REVIEW B 94, 195141 (2016)
TABLE III. Zero-temperature extrapolated lattice parameter(aT =0 K) of Pb1−xNaxTe samples with different Na content. Thisextrapolation was done through a low-order polynomial fit of thetemperature dependence of the lattice parameters, as explained in thetext.
x (Na at. %) pH (×1019 cm−3) aT =0 K (A)
0 – 6.4311(1)0.26 4.1 ± 0.06 6.436(3)0.62 9.4 ± 0.6 6.4429(7)
APPENDIX B: TEMPERATURE AND NA-COMPOSITIONDEPENDENCE OF THE LATTICE CONSTANT
In this Appendix we present an experimental determinationof the cubic lattice parameter of Pb1−xNaxTe samples withdifferent Na content, and its temperature dependence. Thisdetermination will be necessary to study the sensitivity of theDFT band-structure calculations to realistic variations in latticeconstant, which we present in the next section.
The peak positions of several diffraction peaks with high 2θ
values were determined for different temperatures (from 300down to 80 K), using the 2D detector of a commercial Bruker-D8-Venture single crystal x-ray diffractometer. In order tominimize systematic errors, the lattice parameters at eachtemperature were determined through a linear fit of the cal-culated lattice spacing for each peak (a = dhkl
√h2 + k2 + l2)
vs 2θ , and the extrapolation of this fit to 2θ = 180◦. Thesemeasurements were done for two Na-doped PbTe samples withNa concentrations of x = 0.26% and 0.62%. The temperaturedependence of the lattice parameter of the measured samples,as well as data by Bozin et al. [20] for undoped PbTe, areshown in Fig. 18. Below 150 K, the data for x = 0.26% exhibita greater scatter than those for x = 0.62%, reflecting poorerexperimental conditions for that measurement. However, theoverall trend of the temperature dependence for both composi-tions is similar. In order to obtain a sensible extrapolation of ourdata down to zero temperature, Bozin’s data for undoped PbTe
TABLE IV. Volume dependence of band-structure parameters inDFT. The volume range is chosen to cover the experimental range of(un)doped samples at T = 0 K. a is the lattice constant and m∗ arethe effective masses (curvature) at the top of the valence band.
a (A) Band offset (meV) |m∗⊥| (me) |m∗
‖| (me)
6.43 71 0.016 0.3686.44 74 0.014 0.3056.45 84 0.011 0.224
samples, which goes down to much lower temperatures thanours, was fitted with a low order polynomial (solid-black linein Fig. 18). For the Na-doped samples, the data was fitted bykeeping all the polynomial coefficient found for the undopedsample, except the zero-power term (vertical offset), whichrepresents the zero-temperature lattice parameter for these Na-doped samples. The values obtained for the zero-temperaturelattice parameter of these three compositions are summarizedin Table III. The temperature variation of the lattice parameter,from zero temperature to room temperature, of the samplesstudied here, is of the order of 0.5%, whereas the compositionalvariation, from undoped PbTe to 0.62% Na-doped PbTe, is ofthe order of 0.2%.
APPENDIX C: VOLUME DEPENDENCE OF DFT RESULTS
In this Appendix we comment on the volume dependenceof the band structure and quantum-oscillation parameters inour DFT calculations. Table IV shows the volume dependenceof the band offset and effective masses for the range ofexperimental volumes of (un)doped samples at T = 0 K (seeFig. 18 and Table III).
An increase in volume is accompanied by an increasein band offset (in contrast to the behavior expected fromexperiments, where thermal expansion leads to a decrease ofthe band offset [17–19]), and a decrease in effective masses.The latter indicates that the L pocket becomes narrower, butis not able alone to predict an appreciable change in the
0
100
200
300
0 2 4 6
f[T
]
pL [1019 cm−3]
Σl
Σ
(a)f[100]
f⊥
f
f l[100]
f l⊥f l
,
,
,
0
0.2
0.4
0.6
0 2 4 6
mcy
c[m
e]
pL [1019 cm−3]
Σl
Σ
(b)mc[100]
mc⊥
mc
mc l[100]
mc l⊥
mc l
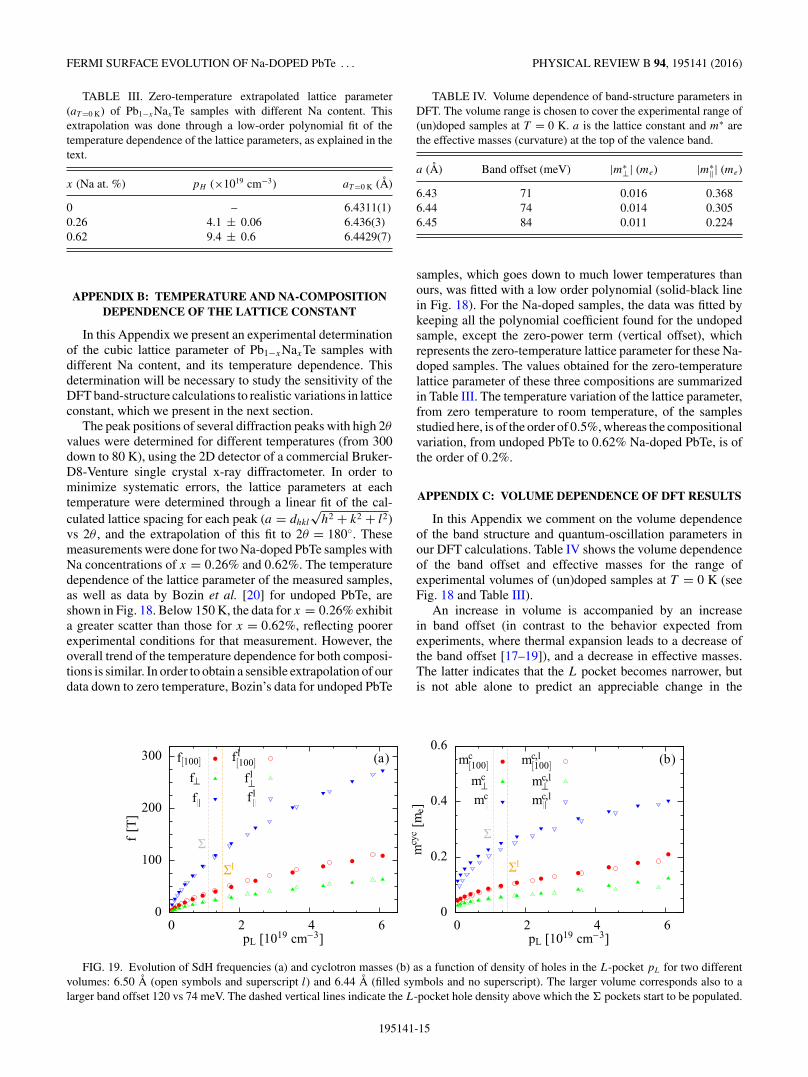
FIG. 19. Evolution of SdH frequencies (a) and cyclotron masses (b) as a function of density of holes in the L-pocket pL for two differentvolumes: 6.50 A (open symbols and superscript l) and 6.44 A (filled symbols and no superscript). The larger volume corresponds also to alarger band offset 120 vs 74 meV. The dashed vertical lines indicate the L-pocket hole density above which the � pockets start to be populated.
195141-15
P. GIRALDO-GALLO et al. PHYSICAL REVIEW B 94, 195141 (2016)
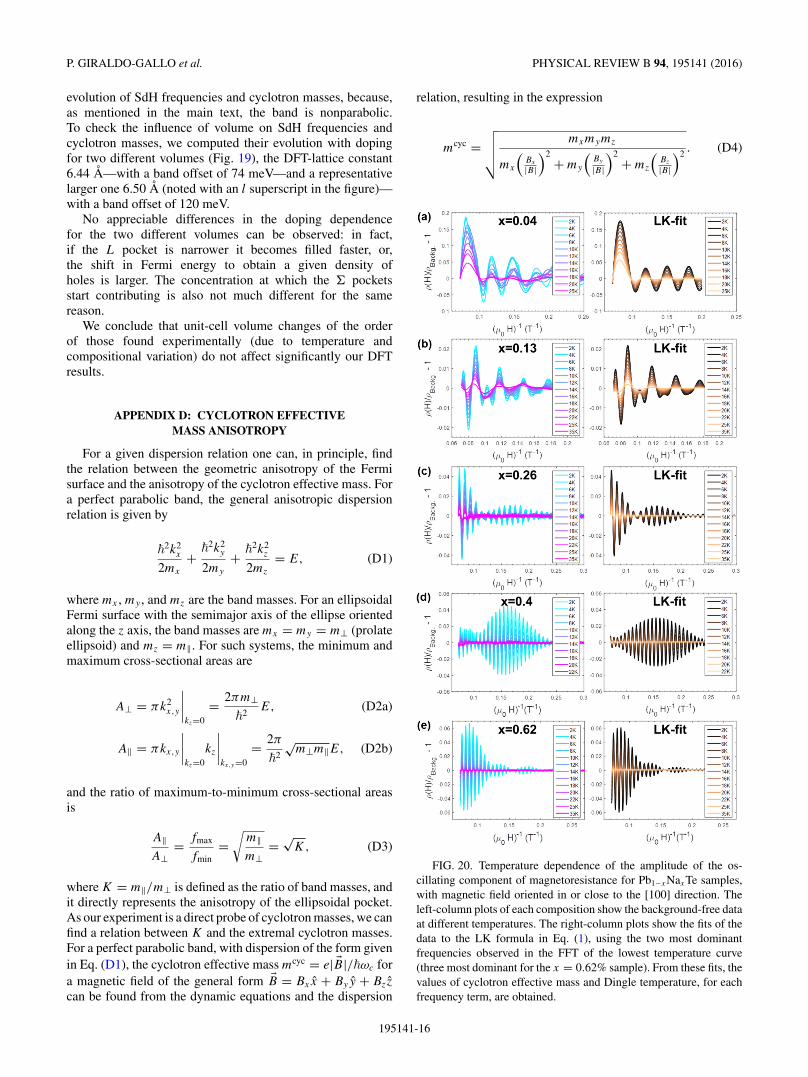
evolution of SdH frequencies and cyclotron masses, because,as mentioned in the main text, the band is nonparabolic.To check the influence of volume on SdH frequencies andcyclotron masses, we computed their evolution with dopingfor two different volumes (Fig. 19), the DFT-lattice constant6.44 A—with a band offset of 74 meV—and a representativelarger one 6.50 A (noted with an l superscript in the figure)—with a band offset of 120 meV.
No appreciable differences in the doping dependencefor the two different volumes can be observed: in fact,if the L pocket is narrower it becomes filled faster, or,the shift in Fermi energy to obtain a given density ofholes is larger. The concentration at which the � pocketsstart contributing is also not much different for the samereason.
We conclude that unit-cell volume changes of the orderof those found experimentally (due to temperature andcompositional variation) do not affect significantly our DFTresults.
APPENDIX D: CYCLOTRON EFFECTIVEMASS ANISOTROPY
For a given dispersion relation one can, in principle, findthe relation between the geometric anisotropy of the Fermisurface and the anisotropy of the cyclotron effective mass. Fora perfect parabolic band, the general anisotropic dispersionrelation is given by
�2k2
x
2mx
+ �2k2
y
2my
+ �2k2
z
2mz
= E, (D1)
where mx , my , and mz are the band masses. For an ellipsoidalFermi surface with the semimajor axis of the ellipse orientedalong the z axis, the band masses are mx = my = m⊥ (prolateellipsoid) and mz = m‖. For such systems, the minimum andmaximum cross-sectional areas are
A⊥ = πk2x,y
∣∣∣∣kz=0
= 2πm⊥�2
E, (D2a)
A‖ = πkx,y
∣∣∣∣kz=0
kz
∣∣∣∣kx,y=0
= 2π
�2
√m⊥m‖E, (D2b)
and the ratio of maximum-to-minimum cross-sectional areasis
A‖A⊥
= fmax
fmin=
√m‖m⊥
=√
K, (D3)
where K = m‖/m⊥ is defined as the ratio of band masses, andit directly represents the anisotropy of the ellipsoidal pocket.As our experiment is a direct probe of cyclotron masses, we canfind a relation between K and the extremal cyclotron masses.For a perfect parabolic band, with dispersion of the form givenin Eq. (D1), the cyclotron effective mass mcyc = e| �B|/�ωc fora magnetic field of the general form �B = Bxx + Byy + Bzz
can be found from the dynamic equations and the dispersion
relation, resulting in the expression
mcyc =√√√√ mxmymz
mx
(Bx
|B|)2
+ my
(By
|B|)2
+ mz
(Bz
|B|)2 . (D4)
FIG. 20. Temperature dependence of the amplitude of the os-cillating component of magnetoresistance for Pb1−xNaxTe samples,with magnetic field oriented in or close to the [100] direction. Theleft-column plots of each composition show the background-free dataat different temperatures. The right-column plots show the fits of thedata to the LK formula in Eq. (1), using the two most dominantfrequencies observed in the FFT of the lowest temperature curve(three most dominant for the x = 0.62% sample). From these fits, thevalues of cyclotron effective mass and Dingle temperature, for eachfrequency term, are obtained.
195141-16
FERMI SURFACE EVOLUTION OF Na-DOPED PbTe . . . PHYSICAL REVIEW B 94, 195141 (2016)
For an ellipsoid of revolution, therefore, the transverse andlongitudinal cyclotron effective masses, in terms of the bandmasses, are
mcyc⊥ = m⊥, (D5a)
mcyc‖ = √
m⊥m‖. (D5b)
And with this,
mcyc‖
mcyc⊥
=√
m‖m⊥
=√
K. (D6)
For the case of Pb1−xNaxTe, in which K = 14.3 ± 0.4for a wide range of dopings, m
cyc‖ /m
cyc⊥ = 3.78 ± 0.05. Ad-
ditionally, from Eq. (D4), we can find a general expressionfor the angle dependence of cyclotron mass of an ellipsoidof revolution, with respect to the main axis of the ellipsoid,and as a function of the transverse cyclotron mass, bywriting the components of the magnetic field in spherical
coordinates as Bx = | �B| sin θ cos ϕ, By = | �B| sin θ sin ϕ, andBz = | �B| cos θ :
mcyc(θ )
mcyc⊥
=√
K
(K − 1) cos2 θ + 1. (D7)
APPENDIX E: EFFECTIVE CYCLOTRON MASS ALONGTHE [100] ORIENTATION
Figure 20 shows the temperature dependence of theoscillating component of magnetoresistance for Pb1−xNaxTesamples of different Na concentrations, for field orientedalong the [100] direction, which provides direct access to them
cyc[100] cyclotron effective mass. Least-squares fits to Eq. (1),
including up to the second strongest frequency component,for each Na doping, and for a field range of 3–5 to 14 T, areshown in the right-column plots of this figure. The obtained[100] cyclotron masses are summarized in Table II, andplotted as a function of carrier concentration in Fig. 16, inSec. V.
[1] Y. I. Ravich, B. A. Efimova, and I. A. Smirnov, SemiconductingLead Chalcogenides (Plenum, New York, 1970).
[2] R. Dornhaus, G. Nimtz, and B. Schlicht, Narrow-Gap Semicon-ductors, Springer Tracts Mod. Phys., Vol. 98 (Springer, NewYork, 1983).
[3] D. Khokhlov, Lead Chalcogenides: Physics and Applications(Taylor and Francis, New York, 2003).
[4] Y. Pei, A. LaLonde, S. Iwanaga, and G. J. Snyder, EnergyEnviron. Sci. 4, 2085 (2011).
[5] Y. Pei, X. Shi, A. LaLonde, H. Wang, L. Chen, and G. J. Snyder,Nature (London) 473, 66 (2011).
[6] M. G. Kanatzidis, Chem. Mater. 22, 648 (2010).[7] J. P. Heremans, V. Jovovic, E. S. Toberer, A. Saramat, K.
Kurosaki, A. Charoenphakdee, S. Yamanaka, and G. J. Snyder,Science 321, 554 (2008).
[8] V. I. Kaidanov and Y. I. Ravich, Sov. Phys. Usp. 28, 31 (1985).[9] J. E. Lewis, Phys. Status Solidi B 42, K97 (1970).
[10] Y. Matsushita, H. Bluhm, T. H. Geballe, and I. R. Fisher, Phys.Rev. Lett. 94, 157002 (2005).
[11] Y. Matsushita, P. A. Wianecki, A. T. Sommer, T. H. Geballe,and I. R. Fisher, Phys. Rev. B 74, 134512 (2006).
[12] M. Dzero and J. Schmalian, Phys. Rev. Lett. 94, 157003(2005).
[13] D. Parker, X. Chen, and D. J. Singh, Phys. Rev. Lett. 110, 146601(2013).
[14] J. R. Burke, B. Houston, and H. T. Savage, Phys. Rev. B 2, 1977(1970).
[15] J. D. Jensen, B. Houston, and J. R. Burke, Phys. Rev. B 18, 5567(1978).
[16] H. Sitter, K. Lischka, and H. Heinrich, Phys. Rev. B 16, 680(1977).
[17] C. M. Jaworski, M. D. Nielsen, H. Wang, S. N. Girard, W. Cai,W. D. Porter, M. G. Kanatzidis, and J. P. Heremans, Phys. Rev.B 87, 045203 (2013).
[18] Z. M. Gibbs, H. Kim, H. Wang, R. L. White, F. Drymiotis, M.Kaviany, and G. Jeffrey Snyder, Appl. Phys. Lett. 103, 262109(2013).
[19] J. Zhao, C. D. Malliakas, D. Bugaris, N. Appathurai, V.Karlapati, D. Y. Chung, M. G. Kanatzidis, and U. Chatterjee,arXiv:1404.1807.
[20] E. S. Bozin, C. D. Malliakas, P. Souvatzis, T. Proffen, N. a.Spaldin, M. G. Kanatzidis, and S. J. L. Billinge, Science 330,1660 (2010).
[21] A. S. Erickson, J. H. Chu, M. F. Toney, T. H. Geballe, and I. R.Fisher, Phys. Rev. B 79, 024520 (2009).
[22] P. Barone, T. Rauch, D. Di Sante, J. Henk, I. Mertig, and S.Picozzi, Phys. Rev. B 88, 045207 (2013).
[23] P. Barone, D. Di Sante, and S. Picozzi, Phys. Status Solidi 7,1102 (2013).
[24] P. E. Blochl, Phys. Rev. B 50, 17953 (1994).[25] G. Kresse and D. Joubert, Phys. Rev. B 59, 1758 (1999).[26] G. Kresse and J. Furthmuller, Phys. Rev. B 54, 11169 (1996).[27] J. P. Perdew and A. Zunger, Phys. Rev. B 23, 5048 (1981).[28] J. P. Perdew, K. Burke, and M. Ernzerhof, Phys. Rev. Lett. 77,
3865 (1996).[29] J. P. Perdew, A. Ruzsinszky, G. I. Csonka, O. A. Vydrov, G. E.
Scuseria, L. A. Constantin, X. Zhou, and K. Burke, Phys. Rev.Lett. 100, 136406 (2008).
[30] P. M. C. Rourke and S. R. Julian, Comput. Phys. Commun. 183,324 (2012).
[31] S. Ahmad, K. Hoang, and S. D. Mahanti, Phys. Rev. Lett. 96,056403 (2006).
[32] I. Hase and T. Yanagisawa, Phys. C Supercond. 445-448, 61(2006).
[33] S. Ahmad, S. D. Mahanti, K. Hoang, and M. G. Kanatzidis,Phys. Rev. B 74, 155205 (2006).
[34] K. Xiong, G. Lee, R. P. Gupta, W. Wang, B. E. Gnade, and K.Cho, J. Phys. D: Appl. Phys. 43, 405403 (2010).
[35] Y. Takagiwa, Y. Pei, G. Pomrehn, and G. Jeffrey Snyder, APLMater. 1, 011101 (2013).
[36] M.-S. Lee and S. D. Mahanti, Phys. Rev. B 85, 165149(2012).
[37] K. Hoang, S. D. Mahanti, and M. G. Kanatzidis, Phys. Rev. B81, 115106 (2010).
195141-17
P. GIRALDO-GALLO et al. PHYSICAL REVIEW B 94, 195141 (2016)
[38] S. Venkatapathi, B. Dong, and C. Hin, J. Appl. Phys. 116, 013708(2014).
[39] D. Bilc, S. D. Mahanti, and M. G. Kanatzidis, Phys. Rev. B 74,125202 (2006).
[40] S. A. Yamini, T. Ikeda, A. L. Y. Pei, S. Doua, and G. J. Snyder,J. Mater. Chem. A 1, 8725 (2013).
[41] D. Shoenberg, Magnetic Oscillations in Metals (CambridgeUniversity Press, Cambridge, 1984).
[42] G. Martinez, M. Schluter, and M. L. Cohen, Phys. Rev. B 11,651 (1975).
[43] B. Wiendlocha, Phys. Rev. B 88, 205205 (2013).[44] S. A. Nemov and Y. I. Ravich, Sov. Phys. Usp. 41, 735 (1998).[45] Y. I. Ravich, A. Efimova, and V. I. Tamarchenkov, Phys. Status
Solidi B 43, 11 (1971).[46] Y. I. Ravich, A. Efimova, and V. I. Tamarchenkov, Phys. Status
Solidi B 43, 453 (1971).
[47] K. F. Cuff, M. R. Ellett, C. D. Kuglin, and L. R. Williams, inProceedings of the International Conference on the Physics ofSemiconductors in Exeter, 1962 (1962), p. 316.
[48] E. O. Kane, Semiconductors and Semimetals (Academic, NewYork, 1975), Vol. 1, Chap. 3.
[49] Y. I. Ravich, Semiconducting Lead Chalcogenides (Springer,Berlin, 1970).
[50] H. Kong, Ph.D. Thesis, University of Michigan, 2008.[51] E. O. Kane, J. Phys. Chem. Solids 1, 249 (1957).[52] M. H. Cohen, Phys. Rev. 121, 387 (1961).[53] J. R. Dixon and H. R. Riedl, Phys. Rev. 138, A873
(1965).[54] P. J. Lin and L. Kleinman, Phys. Rev. 142, 478 (1966).[55] J. O. Dimmock and G. B. Wright, Phys. Rev. 135, A821
(1964).[56] Y. W. Tung and M. L. Cohen, Phys. Rev. 180, 823 (1969).
195141-18