Embed Size (px)
Citation preview
ORIGINAL PAPER
Fermentative production of shikimic acid: a paradigm shiftof production concept from plant route to microbial route
Priyanka Tripathi • Garima Rawat •
Sweta Yadav • R. K. Saxena
Received: 10 October 2012 / Accepted: 4 March 2013
� Springer-Verlag Berlin Heidelberg 2013
Abstract Different physiological and nutritional param-
eters affect the fermentative production of shikimic acid. In
our study, Citrobacter freundii initially produced 0.62 g/L
of shikimic acid in 72 h. However, when process optimi-
zation was employed, 5.11 g/L of shikimic acid was pro-
duced in the production medium consisting of glucose
(5.0 %), asparagine (4.5 %), CaCO3 (2.0 %), at pH 6.0,
when inoculated with 6 % inoculum and incubated at
30 ± 1 �C, 200 rpm for 60 h. Preliminary fed-batch stud-
ies have resulted in the production of 9.11 g/L of shikimic
acid on feeding the production medium by 20 g/L of glu-
cose at 24 h of the fermentation run. Production of similar
amount of shikimic acid was observed when the optimized
conditions were employed in a 10-L bioreactor as obtained
in shake flask conditions. A total of 9.11 g/L of shikimic
acid was produced in 60 h. This is approximately 14.69-
fold increase in shikimic acid production when compared
to the initial un-optimized production conditions. This has
also resulted in the reduction of the production time. The
present study provides useful information to the industri-
alists seeking environmentally benign technology for the
production of bulk biomolecules through manipulation of
various chemical parameters.
Keywords Shikimic acid � Process optimization �Fermentation � Fed-batch � Bioreactor
Introduction
Shikimic acid is a white crystalline compound of non-
nitrogenous acid. It is a cyclitol, a polyhydroxylated
cycloalkane containing at least three hydroxyl groups in the
ring at different positions. The most important feature of a
cyclitol is that they are chiral isomers and key intermedi-
ates in the biosynthesis of aromatic compounds in living
metabolism [1]. Shikimic acid is a key intermediate in the
biochemical pathway starting from phosphoenolpyruvic
acid to tryptophan, phenylalanine and tyrosine. Due to its
highly functionalized, six-membered carbocyclic ring and
three asymmetric centers shikimic acid can be regarded as
attractive enantiomerically pure building block for the
synthesis of biologically important compounds [2]. Shiki-
mic acid has emerged as a key chiral starting material for
the synthesis of the neuraminidase inhibitor drug (Tamiflu,
the drug against swine flu/avian flu) [3].
Shikimic acid is naturally abundant in the fruits of a
Chinese plant star anise (Illicium vernum). There are cer-
tain limitations for the production of the drug during the
pandemic (Swine flu). Since the production of large-scale
quantities of the drug relies on having enough starting
material and star anise is harvested only from March to
May, the demand to produce the number of doses needed
worldwide cannot be met. With no other agricultural
sources, other than the fruits of the I. vernum tree, the
pharmaceutical industry needs to find an alternative sus-
tainable supply [4].
Shikimic acid, however, is also a natural intermediate in
the formation of microbial amino acids. Researchers could
boost production of shikimic acid in strains of the bacte-
rium Escherichia coli by ramping up enzyme activity and
feeding the microbe a diet of carbohydrates. Recombinant
and mutant strains of few bacteria such as Citrobacter
P. Tripathi � G. Rawat � S. Yadav � R. K. Saxena (&)
Department of Microbiology, University of Delhi South
Campus, Benito Juarez Road, New Delhi 110021, India
e-mail: [email protected]
123
Bioprocess Biosyst Eng
DOI 10.1007/s00449-013-0940-4
freundii, Bacillus amyloliquefaciens, E. coli and Aerobac-
ter aerogenes are commonly known to produce shikimic
acid extracellularly [5, 6]. Several metabolic engineering
approaches have been developed to obtain shikimic acid
from E. coli by biotechnological processes such as an
alternative to its limited and costly extraction procedures
from plants such as I. verum [7–11].
Fermentative production of shikimic acid has many
advantages over the plant sources, owing to its simplicity
and easy availability of shikimic acid at the time of need.
Although the recombinant and mutant strains of different
microbes have been exploited for the production of shiki-
mic acid by fermentation, an economically viable biosyn-
thetic process for shikimic acid production from wild-type
bacteria is yet to be developed.
In this respect, to develop a process for the maximum
production of shikimic acid, standardization of media,
process designing and fermentation conditions are of
utmost importance. Thus, process optimization can be very
helpful for the most efficient production of this desired
biomolecule. Physiological and nutritional factors such as
initial sugar concentration, nitrogen sources, inoculum size,
metal ion concentrations, pH and temperature of the growth
medium are the most critical factors affecting both cell
growth and shikimic acid production. In the present
investigation, process optimization has been carried out for
enhanced production of shikimic acid from the selected
microorganism after the initial screening. Subsequently,
initial fed-batch studies (with sugar) were also carried out
to increase the production of this important biomolecule.
Further, the possible scalability of the process was also
analyzed by translating the process to a 10-L bioreactor.
Materials and methods
Chemicals
Shikimic acid was purchased from Sigma (St. Louis, USA).
HPLC-grade water (Thomas Baker, India) was used to
prepare the mobile phase for HPLC. All other chemicals
used for media preparation were of analytical grade and
were purchased from the local commercial sources.
Organism and growth conditions
According to the reports, E. coli, A. aerogenes, Klebsiella
sp. and C. freundii are the major group of bacteria for
shikimic acid production. Keeping this in mind, different
strains of these bacteria procured from laboratory stock
cultures were analyzed for shikimic acid production. This
resulted in the selection of isolate no. PT16 (identified as C.
freundii YRL11 by Royal Life Sciences Pvt. Ltd.
Hyderabad, affiliated to MIDI Sherlock, USA), as a potent
shikimic acid producer. This strain is a facultative anaer-
obe, Gram-negative and rod-shaped bacteria. This organ-
ism was analyzed for shikimic acid production using the
production medium with the composition (g/L): glucose,
50.0; ammonium sulfate, 25.0; CaCO3, 20.0; KH2PO4, 1.0;
MgSO4, 0.4; L-tyrosine, 0.1; L-tryptophan, 0.1; L-phenyl-
alanine, 0.1; pABA, 0.001; FeSO4�7H2O, 0.0099;
MnSO4�H2O, 0.0072; ZnCl2, 0.0025; CuSO4�5H2O, 0.0005
at pH 7.0 ± 0.2 [9]. The medium was sterilized at 10 psi
(at 110 �C for 20 min) followed by the inoculation with
2 % seed inoculum with the composition (g/L): tryptone,
10.0; yeast extract, 5.0; NaCl, 5.0 at pH 7.5 ± 0.2 (16).
Further, the inoculated medium was incubated at 37 �C for
72 h with intermittent gentle shaking. Samples (2 mL)
were withdrawn at a regular interval of 12 h.
Preparation of sample for shikimic acid and growth
estimation
Samples withdrawn were centrifuged at 12,000 rpm in a
Sigma centrifuge (4K-15) for 15 min. Supernatant thus
obtained, was analyzed for the amount of shikimic acid
produced and cell pellet was used for growth estimation.
Here, the pellet was washed with 2 mL of double distilled
water and again centrifuged at 12,000 rpm for 10 min. The
process was repeated three times to remove all media
components from the cell surface. Now, the pellet was re-
suspended in 1 mL of double distilled water and the
absorbance was read at 660 nm against double distilled
water blank.
Methods for estimation of shikimic acid
Shikimic acid produced was estimated by high-perfor-
mance liquid chromatography (HPLC, Shimadzu Corp.,
Kyoto, Japan) on Aminex HPX-87H (300 mm 9 7.8 mm)
column, refractive index detector at an oven temperature of
55 �C and 5 mM H2SO4 as the mobile phase. Samples
withdrawn were centrifuged at 12,000 rpm in Sigma cen-
trifuge for 15 min. The supernatant thus obtained was fil-
tered by 0.22 l (mdi) and 20 lL of each test sample was
run on HPLC.
Process optimization in batch and fed-batch
fermentation
Shikimic acid production was optimized in the production
medium wherein, the effects of different physiological and
nutritional parameters were studied. The effect of temper-
ature in the range of 25–45 �C on shikimic acid production
was studied in the medium. Similarly, effect of pH was
studied by preparing the medium in different pH range of
Bioprocess Biosyst Eng
123
3.0–9.0. With a view to optimize the nutritional parame-
ters, the first parameter taken into consideration was the
carbon source as these are known to affect cell growth as
well as product formation. Therefore, a set of experiments
was designed, wherein glucose was replaced by different
carbon sources such as sucrose, lactose, mannose, fructose,
xylose and maltose at a concentration of 0.5 % w/v in the
medium. The selected sugar was optimized for its optimal
concentration for maximum production of shikimic acid.
The cell growth was also determined. Subsequently, with
respect to the optimization of nitrogen sources, ammonium
sulfate (2.5 % w/v) was replaced by different inorganic
(ammonium acetate, ammonium chloride, asparagine, di-
ammonium hydrogen orthophosphate (DAHP), ammonium
ferrous sulfate) and organic nitrogen sources [beef extract,
casein hydrolysate, corn steep liquor (CSL), yeast extract,
tryptone, peptone] in the production medium with the same
percent equivalent. Further, the process was optimized to
obtain the most suitable concentration of the selected
nitrogen source. Besides the carbon and nitrogen sources,
to assess the effect of metal ions, the carbonate salts of
different metal ions (Na?, Mg2?, Ca2?, Zn2?, K? and
Mn2?) at a concentration of 2 % were separately added in
the medium. In order to investigate the effect of inoculum
size, the optimized medium was inoculated with different
inoculum size (such as 1, 2, 4, 6, 8 and 10 %). Further, to
examine the time period at which the maximum shikimic
acid production is achieved, the organism was grown for
different time periods (84 h) under optimized conditions.
With the view to further enhance shikimic acid production,
fed-batch studies were carried out using optimized pro-
duction medium. However, in order to determine the exact
time period for fed, three different time periods (12, 24 and
36 h) were evaluated for glucose feed in fed-batch studies.
Selection of the time of fed
The shikimic acid production medium containing 50 g/L of
initial glucose concentration was fed with 20 g/L of glu-
cose at 12, 24 and 36 h of incubation in separate sets.
Optimization of glucose concentration as feed
To optimize glucose concentration to be used as a feed at
24 h, three different concentrations of glucose (10, 20 and
30 g/L) were used.
All the experiments were conducted in triplicate and
results are presented along with the standard deviation.
Scale-up of the production process in a 10-L bioreactor
The scale-up of shikimic acid production was carried out in
a 10-L bioreactor (Bioflow IV, NBS, USA) with a working
volume of 7.5 L under the optimized conditions obtained
through process optimization. The optimized medium was
sterilized in situ at 110 �C for 20 min. The medium was
inoculated with appropriate size of the seed inoculum (OD
0.6) and fermentation was carried out at 30 �C for 72 h.
Foaming was controlled by adding silicon antifoam agent
(0.1 ml of 50 % v/v prepared in distilled water). The
impeller speed was adjusted to 200 rpm. Samples were
withdrawn periodically at an interval of 6 h and analyzed
for shikimic acid production. The fermentation parameters,
such as temperature and pH were continuously monitored
using microprocessor-controlled probes.
Statistical analysis
The statistical software package Design-Expert, Stat-Ease,
Inc., Minneapolis, USA, was used for regression analysis
of experimental data and to plot response surface. ANOVA
was used to estimate the statistical parameters.
Results and discussion
Optimization of shikimic acid production by ‘‘one-
variable-at-a-time-approach’’
Citrobacter freundii, a shikimic acid producing strain ini-
tially produced 0.62 g/L of shikimic acid. Subsequently,
process optimization was carried out for achieving maxi-
mum shikimic acid production. In this respect, the effect of
different temperatures (25, 30, 37 and 45 �C) on the pro-
duction of shikimic acid in the medium clearly indicated
that 0.89 g/L of shikimic acid was produced at 30 �C with
cell density of 1.37 in 72 h. However, at the temperature of
45 �C, the organism fails to grow and did not produce
shikimic acid in the production medium. In addition to this
at a temperature of 37 �C the organism grew well, but
could not produce significant amount of shikimic acid
(Table 1).
Process optimization clearly showed that 30 �C is the
optimal temperature for shikimic acid production from C.
freundii. It may be due to the fact that the present strain
grows very well at 30 �C and thus produces maximum
shikimic acid at this temperature. Similar finding has been
reported by Shirai et al. [9] who observed that 30 �C is the
optimal temperature for the production of shikimic acid
from C. freundii 4AA-12 (FERM BP-6722). However,
while working with the different recombinant strains of
E. coli (LBB427, W3110.shik1; SP1.1/pKD12.112A;
SP1.1/pKD12.138A and LBB427), Bogosian et al. [12],
Johansson and Liden [13], Johansson et al. [14], Knop et al.
[15], Li et al. [16] and Rangachari et al. [17] reported
37 �C to be the best temperature for the production of
Bioprocess Biosyst Eng
123
shikimic acid. Similarly, while working with Bacillus
subtilis 1–118 and E. coli, Iomantas et al. [18] and Ahn
et al. [19], respectively, reported that maximum shikimic
acid was produced at 37 �C. On the contrary, Simonart and
Wiaux [20] reported 25 �C to be the optimal temperature
while working with Penicillium griseofulvum.
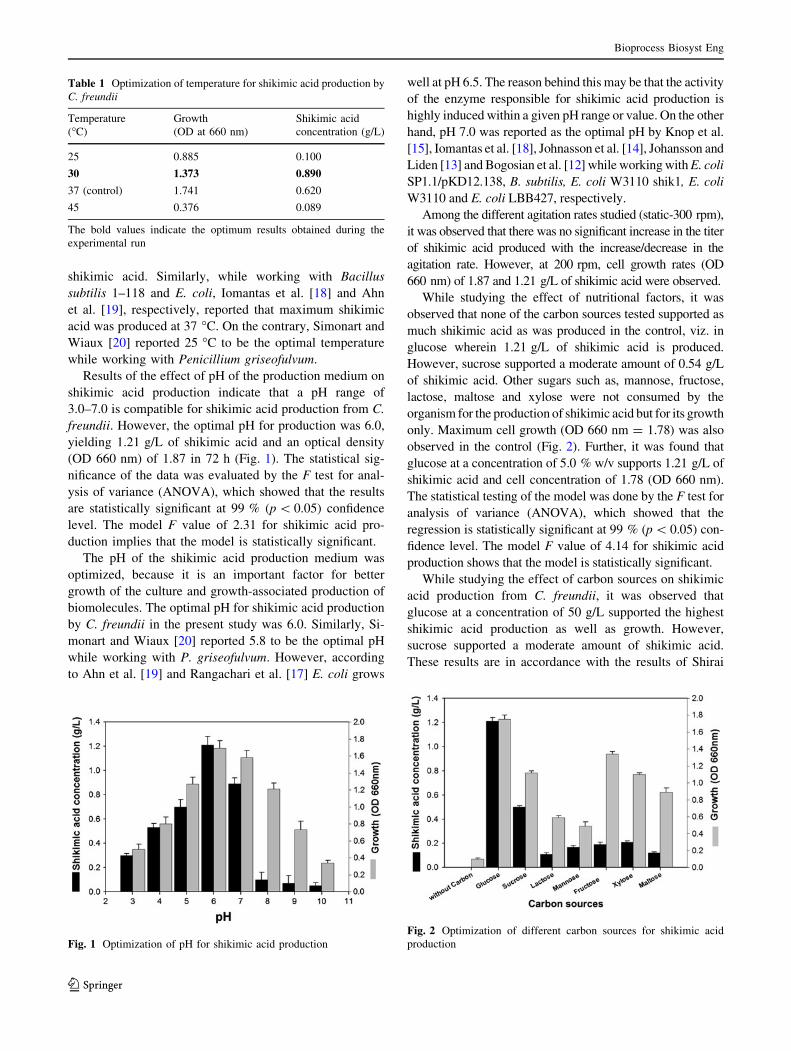
Results of the effect of pH of the production medium on
shikimic acid production indicate that a pH range of
3.0–7.0 is compatible for shikimic acid production from C.
freundii. However, the optimal pH for production was 6.0,
yielding 1.21 g/L of shikimic acid and an optical density
(OD 660 nm) of 1.87 in 72 h (Fig. 1). The statistical sig-
nificance of the data was evaluated by the F test for anal-
ysis of variance (ANOVA), which showed that the results
are statistically significant at 99 % (p \ 0.05) confidence
level. The model F value of 2.31 for shikimic acid pro-
duction implies that the model is statistically significant.
The pH of the shikimic acid production medium was
optimized, because it is an important factor for better
growth of the culture and growth-associated production of
biomolecules. The optimal pH for shikimic acid production
by C. freundii in the present study was 6.0. Similarly, Si-
monart and Wiaux [20] reported 5.8 to be the optimal pH
while working with P. griseofulvum. However, according
to Ahn et al. [19] and Rangachari et al. [17] E. coli grows
well at pH 6.5. The reason behind this may be that the activity
of the enzyme responsible for shikimic acid production is
highly induced within a given pH range or value. On the other
hand, pH 7.0 was reported as the optimal pH by Knop et al.
[15], Iomantas et al. [18], Johnasson et al. [14], Johansson and
Liden [13] and Bogosian et al. [12] while working with E. coli
SP1.1/pKD12.138, B. subtilis, E. coli W3110 shik1, E. coli
W3110 and E. coli LBB427, respectively.
Among the different agitation rates studied (static-300 rpm),
it was observed that there was no significant increase in the titer
of shikimic acid produced with the increase/decrease in the
agitation rate. However, at 200 rpm, cell growth rates (OD
660 nm) of 1.87 and 1.21 g/L of shikimic acid were observed.
While studying the effect of nutritional factors, it was
observed that none of the carbon sources tested supported as
much shikimic acid as was produced in the control, viz. in
glucose wherein 1.21 g/L of shikimic acid is produced.
However, sucrose supported a moderate amount of 0.54 g/L
of shikimic acid. Other sugars such as, mannose, fructose,
lactose, maltose and xylose were not consumed by the
organism for the production of shikimic acid but for its growth
only. Maximum cell growth (OD 660 nm = 1.78) was also
observed in the control (Fig. 2). Further, it was found that
glucose at a concentration of 5.0 % w/v supports 1.21 g/L of
shikimic acid and cell concentration of 1.78 (OD 660 nm).
The statistical testing of the model was done by the F test for
analysis of variance (ANOVA), which showed that the
regression is statistically significant at 99 % (p \ 0.05) con-
fidence level. The model F value of 4.14 for shikimic acid
production shows that the model is statistically significant.
While studying the effect of carbon sources on shikimic
acid production from C. freundii, it was observed that
glucose at a concentration of 50 g/L supported the highest
shikimic acid production as well as growth. However,
sucrose supported a moderate amount of shikimic acid.
These results are in accordance with the results of Shirai
Fig. 1 Optimization of pH for shikimic acid production
Table 1 Optimization of temperature for shikimic acid production by
C. freundii
Temperature
(�C)
Growth
(OD at 660 nm)
Shikimic acid
concentration (g/L)
25 0.885 0.100
30 1.373 0.890
37 (control) 1.741 0.620
45 0.376 0.089
The bold values indicate the optimum results obtained during the
experimental run
Fig. 2 Optimization of different carbon sources for shikimic acid
production
Bioprocess Biosyst Eng
123
et al. [9]. Similar results are reported by Iomantas et al.
[18] and Knop et al. [15], where glucose supported maxi-
mum shikimic acid production. On the other hand, Ahn
et al. [19] reported glycerol to be the best carbon source for
the maximum production of shikimic acid.
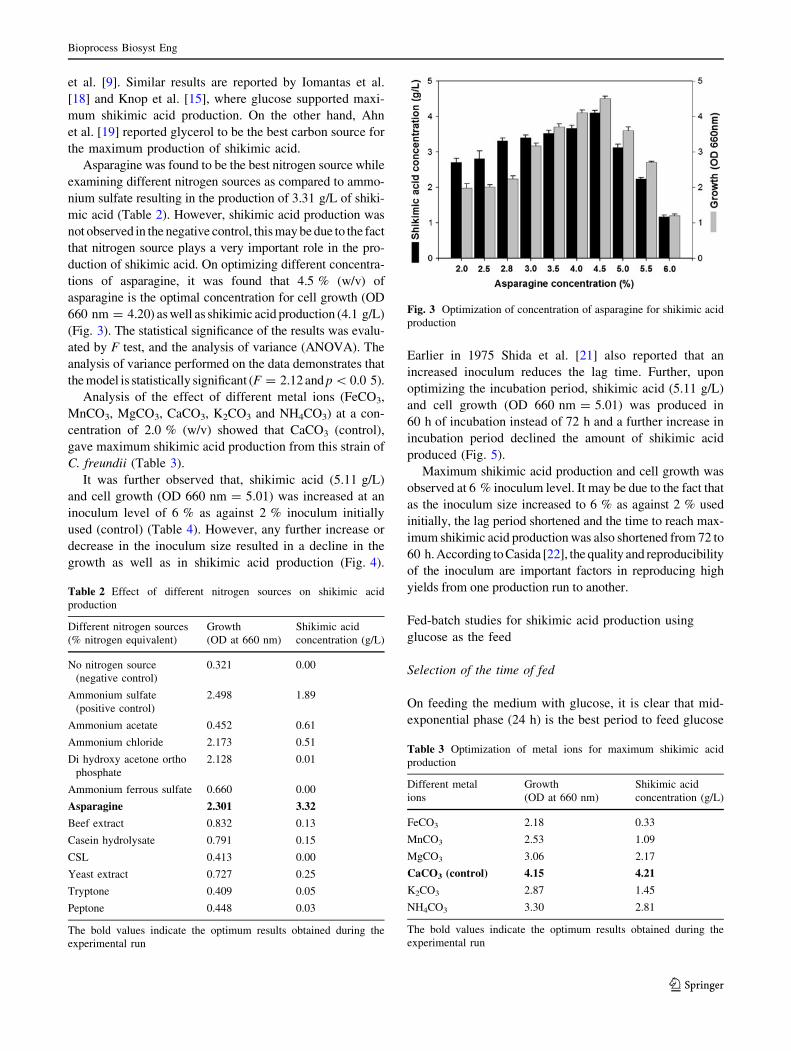
Asparagine was found to be the best nitrogen source while
examining different nitrogen sources as compared to ammo-
nium sulfate resulting in the production of 3.31 g/L of shiki-
mic acid (Table 2). However, shikimic acid production was
not observed in the negative control, this may be due to the fact
that nitrogen source plays a very important role in the pro-
duction of shikimic acid. On optimizing different concentra-
tions of asparagine, it was found that 4.5 % (w/v) of
asparagine is the optimal concentration for cell growth (OD
660 nm = 4.20) as well as shikimic acid production (4.1 g/L)
(Fig. 3). The statistical significance of the results was evalu-
ated by F test, and the analysis of variance (ANOVA). The
analysis of variance performed on the data demonstrates that
the model is statistically significant (F = 2.12 and p \ 0.0 5).
Analysis of the effect of different metal ions (FeCO3,
MnCO3, MgCO3, CaCO3, K2CO3 and NH4CO3) at a con-
centration of 2.0 % (w/v) showed that CaCO3 (control),
gave maximum shikimic acid production from this strain of
C. freundii (Table 3).
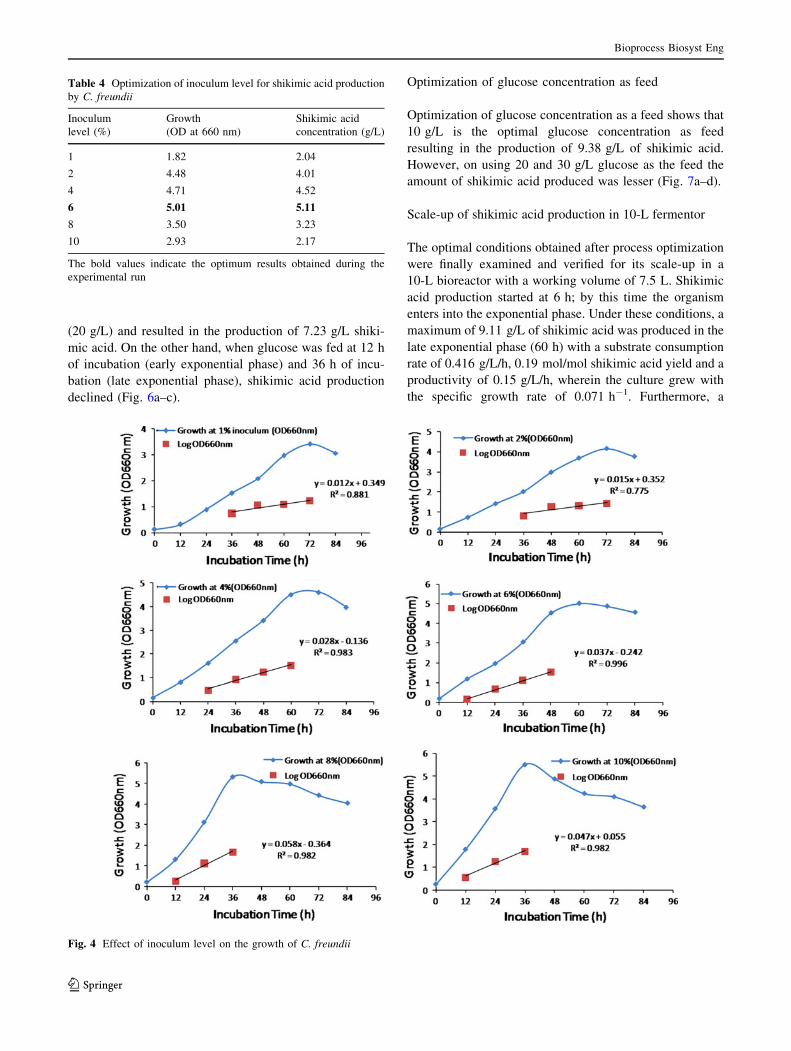
It was further observed that, shikimic acid (5.11 g/L)
and cell growth (OD 660 nm = 5.01) was increased at an
inoculum level of 6 % as against 2 % inoculum initially
used (control) (Table 4). However, any further increase or
decrease in the inoculum size resulted in a decline in the
growth as well as in shikimic acid production (Fig. 4).
Earlier in 1975 Shida et al. [21] also reported that an
increased inoculum reduces the lag time. Further, upon
optimizing the incubation period, shikimic acid (5.11 g/L)
and cell growth (OD 660 nm = 5.01) was produced in
60 h of incubation instead of 72 h and a further increase in
incubation period declined the amount of shikimic acid
produced (Fig. 5).
Maximum shikimic acid production and cell growth was
observed at 6 % inoculum level. It may be due to the fact that
as the inoculum size increased to 6 % as against 2 % used
initially, the lag period shortened and the time to reach max-
imum shikimic acid production was also shortened from 72 to
60 h. According to Casida [22], the quality and reproducibility
of the inoculum are important factors in reproducing high
yields from one production run to another.
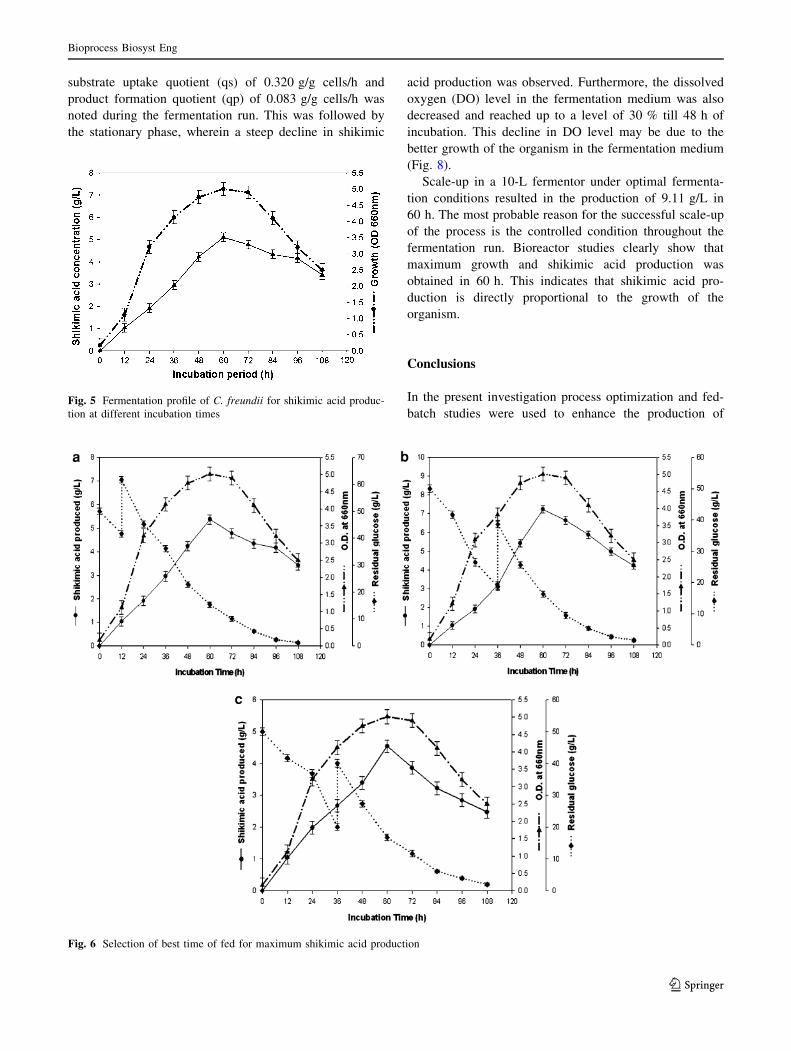
Fed-batch studies for shikimic acid production using
glucose as the feed
Selection of the time of fed
On feeding the medium with glucose, it is clear that mid-
exponential phase (24 h) is the best period to feed glucose
Fig. 3 Optimization of concentration of asparagine for shikimic acid
production
Table 2 Effect of different nitrogen sources on shikimic acid
production
Different nitrogen sources
(% nitrogen equivalent)
Growth
(OD at 660 nm)
Shikimic acid
concentration (g/L)
No nitrogen source
(negative control)
0.321 0.00
Ammonium sulfate
(positive control)
2.498 1.89
Ammonium acetate 0.452 0.61
Ammonium chloride 2.173 0.51
Di hydroxy acetone ortho
phosphate
2.128 0.01
Ammonium ferrous sulfate 0.660 0.00
Asparagine 2.301 3.32
Beef extract 0.832 0.13
Casein hydrolysate 0.791 0.15
CSL 0.413 0.00
Yeast extract 0.727 0.25
Tryptone 0.409 0.05
Peptone 0.448 0.03
The bold values indicate the optimum results obtained during the
experimental run
Table 3 Optimization of metal ions for maximum shikimic acid
production
Different metal
ions
Growth
(OD at 660 nm)
Shikimic acid
concentration (g/L)
FeCO3 2.18 0.33
MnCO3 2.53 1.09
MgCO3 3.06 2.17
CaCO3 (control) 4.15 4.21
K2CO3 2.87 1.45
NH4CO3 3.30 2.81
The bold values indicate the optimum results obtained during the
experimental run
Bioprocess Biosyst Eng
123
(20 g/L) and resulted in the production of 7.23 g/L shiki-
mic acid. On the other hand, when glucose was fed at 12 h
of incubation (early exponential phase) and 36 h of incu-
bation (late exponential phase), shikimic acid production
declined (Fig. 6a–c).
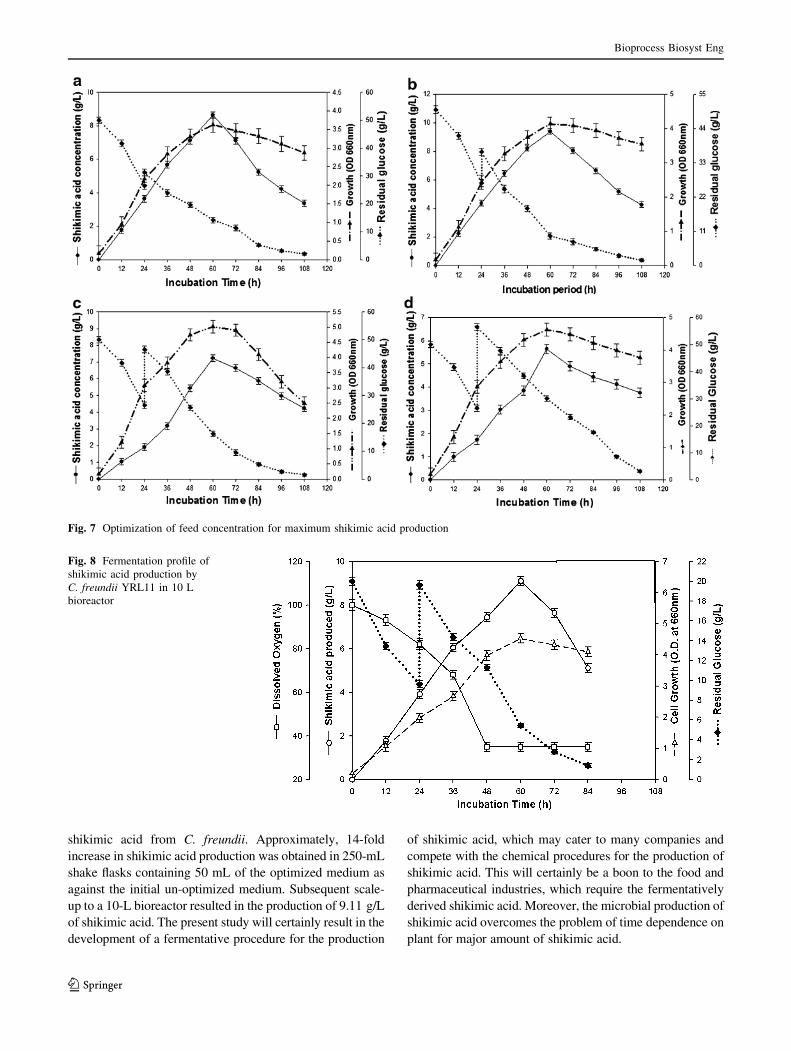
Optimization of glucose concentration as feed
Optimization of glucose concentration as a feed shows that
10 g/L is the optimal glucose concentration as feed
resulting in the production of 9.38 g/L of shikimic acid.
However, on using 20 and 30 g/L glucose as the feed the
amount of shikimic acid produced was lesser (Fig. 7a–d).
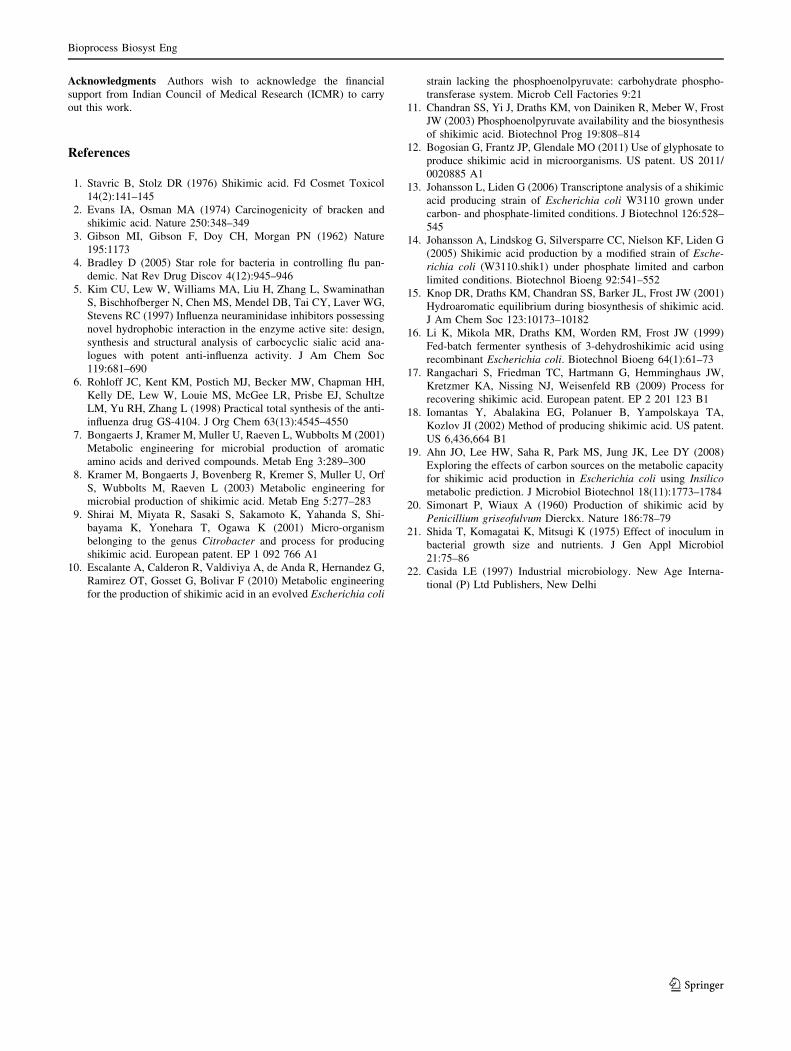
Scale-up of shikimic acid production in 10-L fermentor
The optimal conditions obtained after process optimization
were finally examined and verified for its scale-up in a
10-L bioreactor with a working volume of 7.5 L. Shikimic
acid production started at 6 h; by this time the organism
enters into the exponential phase. Under these conditions, a
maximum of 9.11 g/L of shikimic acid was produced in the
late exponential phase (60 h) with a substrate consumption
rate of 0.416 g/L/h, 0.19 mol/mol shikimic acid yield and a
productivity of 0.15 g/L/h, wherein the culture grew with
the specific growth rate of 0.071 h-1. Furthermore, a
Table 4 Optimization of inoculum level for shikimic acid production
by C. freundii
Inoculum
level (%)
Growth
(OD at 660 nm)
Shikimic acid
concentration (g/L)
1 1.82 2.04
2 4.48 4.01
4 4.71 4.52
6 5.01 5.11
8 3.50 3.23
10 2.93 2.17
The bold values indicate the optimum results obtained during the
experimental run
Fig. 4 Effect of inoculum level on the growth of C. freundii
Bioprocess Biosyst Eng
123
substrate uptake quotient (qs) of 0.320 g/g cells/h and
product formation quotient (qp) of 0.083 g/g cells/h was
noted during the fermentation run. This was followed by
the stationary phase, wherein a steep decline in shikimic
acid production was observed. Furthermore, the dissolved
oxygen (DO) level in the fermentation medium was also
decreased and reached up to a level of 30 % till 48 h of
incubation. This decline in DO level may be due to the
better growth of the organism in the fermentation medium
(Fig. 8).
Scale-up in a 10-L fermentor under optimal fermenta-
tion conditions resulted in the production of 9.11 g/L in
60 h. The most probable reason for the successful scale-up
of the process is the controlled condition throughout the
fermentation run. Bioreactor studies clearly show that
maximum growth and shikimic acid production was
obtained in 60 h. This indicates that shikimic acid pro-
duction is directly proportional to the growth of the
organism.
Conclusions
In the present investigation process optimization and fed-
batch studies were used to enhance the production ofFig. 5 Fermentation profile of C. freundii for shikimic acid produc-
tion at different incubation times
Fig. 6 Selection of best time of fed for maximum shikimic acid production
Bioprocess Biosyst Eng
123
shikimic acid from C. freundii. Approximately, 14-fold
increase in shikimic acid production was obtained in 250-mL
shake flasks containing 50 mL of the optimized medium as
against the initial un-optimized medium. Subsequent scale-
up to a 10-L bioreactor resulted in the production of 9.11 g/L
of shikimic acid. The present study will certainly result in the
development of a fermentative procedure for the production
of shikimic acid, which may cater to many companies and
compete with the chemical procedures for the production of
shikimic acid. This will certainly be a boon to the food and
pharmaceutical industries, which require the fermentatively
derived shikimic acid. Moreover, the microbial production of
shikimic acid overcomes the problem of time dependence on
plant for major amount of shikimic acid.
Fig. 7 Optimization of feed concentration for maximum shikimic acid production
Fig. 8 Fermentation profile of
shikimic acid production by
C. freundii YRL11 in 10 L
bioreactor
Bioprocess Biosyst Eng
123
Acknowledgments Authors wish to acknowledge the financial
support from Indian Council of Medical Research (ICMR) to carry
out this work.
References
1. Stavric B, Stolz DR (1976) Shikimic acid. Fd Cosmet Toxicol
14(2):141–145
2. Evans IA, Osman MA (1974) Carcinogenicity of bracken and
shikimic acid. Nature 250:348–349
3. Gibson MI, Gibson F, Doy CH, Morgan PN (1962) Nature
195:1173
4. Bradley D (2005) Star role for bacteria in controlling flu pan-
demic. Nat Rev Drug Discov 4(12):945–946
5. Kim CU, Lew W, Williams MA, Liu H, Zhang L, Swaminathan
S, Bischhofberger N, Chen MS, Mendel DB, Tai CY, Laver WG,
Stevens RC (1997) Influenza neuraminidase inhibitors possessing
novel hydrophobic interaction in the enzyme active site: design,
synthesis and structural analysis of carbocyclic sialic acid ana-
logues with potent anti-influenza activity. J Am Chem Soc
119:681–690
6. Rohloff JC, Kent KM, Postich MJ, Becker MW, Chapman HH,
Kelly DE, Lew W, Louie MS, McGee LR, Prisbe EJ, Schultze
LM, Yu RH, Zhang L (1998) Practical total synthesis of the anti-
influenza drug GS-4104. J Org Chem 63(13):4545–4550
7. Bongaerts J, Kramer M, Muller U, Raeven L, Wubbolts M (2001)
Metabolic engineering for microbial production of aromatic
amino acids and derived compounds. Metab Eng 3:289–300
8. Kramer M, Bongaerts J, Bovenberg R, Kremer S, Muller U, Orf
S, Wubbolts M, Raeven L (2003) Metabolic engineering for
microbial production of shikimic acid. Metab Eng 5:277–283
9. Shirai M, Miyata R, Sasaki S, Sakamoto K, Yahanda S, Shi-
bayama K, Yonehara T, Ogawa K (2001) Micro-organism
belonging to the genus Citrobacter and process for producing
shikimic acid. European patent. EP 1 092 766 A1
10. Escalante A, Calderon R, Valdiviya A, de Anda R, Hernandez G,
Ramirez OT, Gosset G, Bolivar F (2010) Metabolic engineering
for the production of shikimic acid in an evolved Escherichia coli
strain lacking the phosphoenolpyruvate: carbohydrate phospho-
transferase system. Microb Cell Factories 9:21
11. Chandran SS, Yi J, Draths KM, von Dainiken R, Meber W, Frost
JW (2003) Phosphoenolpyruvate availability and the biosynthesis
of shikimic acid. Biotechnol Prog 19:808–814
12. Bogosian G, Frantz JP, Glendale MO (2011) Use of glyphosate to
produce shikimic acid in microorganisms. US patent. US 2011/
0020885 A1
13. Johansson L, Liden G (2006) Transcriptone analysis of a shikimic
acid producing strain of Escherichia coli W3110 grown under
carbon- and phosphate-limited conditions. J Biotechnol 126:528–
545
14. Johansson A, Lindskog G, Silversparre CC, Nielson KF, Liden G
(2005) Shikimic acid production by a modified strain of Esche-richia coli (W3110.shik1) under phosphate limited and carbon
limited conditions. Biotechnol Bioeng 92:541–552
15. Knop DR, Draths KM, Chandran SS, Barker JL, Frost JW (2001)
Hydroaromatic equilibrium during biosynthesis of shikimic acid.
J Am Chem Soc 123:10173–10182
16. Li K, Mikola MR, Draths KM, Worden RM, Frost JW (1999)
Fed-batch fermenter synthesis of 3-dehydroshikimic acid using
recombinant Escherichia coli. Biotechnol Bioeng 64(1):61–73
17. Rangachari S, Friedman TC, Hartmann G, Hemminghaus JW,
Kretzmer KA, Nissing NJ, Weisenfeld RB (2009) Process for
recovering shikimic acid. European patent. EP 2 201 123 B1
18. Iomantas Y, Abalakina EG, Polanuer B, Yampolskaya TA,
Kozlov JI (2002) Method of producing shikimic acid. US patent.
US 6,436,664 B1
19. Ahn JO, Lee HW, Saha R, Park MS, Jung JK, Lee DY (2008)
Exploring the effects of carbon sources on the metabolic capacity
for shikimic acid production in Escherichia coli using Insilicometabolic prediction. J Microbiol Biotechnol 18(11):1773–1784
20. Simonart P, Wiaux A (1960) Production of shikimic acid by
Penicillium griseofulvum Dierckx. Nature 186:78–79
21. Shida T, Komagatai K, Mitsugi K (1975) Effect of inoculum in
bacterial growth size and nutrients. J Gen Appl Microbiol
21:75–86
22. Casida LE (1997) Industrial microbiology. New Age Interna-
tional (P) Ltd Publishers, New Delhi
Bioprocess Biosyst Eng
123