Embed Size (px)
Citation preview
DI
SC
US
SI
ON
P
AP
ER
S
ER
IE
S
Forschungsinstitut zur Zukunft der ArbeitInstitute for the Study of Labor
Female Self-Employment and Children:The Case of Sweden
IZA DP No. 8486
September 2014
Pernilla Andersson Joona
Female Self-Employment and Children:
The Case of Sweden
Pernilla Andersson Joona SOFI, Stockholm University
and IZA
Discussion Paper No. 8486 September 2014
IZA
P.O. Box 7240 53072 Bonn
Germany
Phone: +49-228-3894-0 Fax: +49-228-3894-180
E-mail: [email protected]
Any opinions expressed here are those of the author(s) and not those of IZA. Research published in this series may include views on policy, but the institute itself takes no institutional policy positions. The IZA research network is committed to the IZA Guiding Principles of Research Integrity. The Institute for the Study of Labor (IZA) in Bonn is a local and virtual international research center and a place of communication between science, politics and business. IZA is an independent nonprofit organization supported by Deutsche Post Foundation. The center is associated with the University of Bonn and offers a stimulating research environment through its international network, workshops and conferences, data service, project support, research visits and doctoral program. IZA engages in (i) original and internationally competitive research in all fields of labor economics, (ii) development of policy concepts, and (iii) dissemination of research results and concepts to the interested public. IZA Discussion Papers often represent preliminary work and are circulated to encourage discussion. Citation of such a paper should account for its provisional character. A revised version may be available directly from the author.
IZA Discussion Paper No. 8486 September 2014
ABSTRACT
Female Self-Employment and Children: The Case of Sweden* Previous studies, mostly from Anglo-Saxon countries, find a positive correlation between the presence of young children in the household and self-employment probabilities among women. This has been seen as an indication of women with young children choosing self-employment as a way of balancing work and family commitments. This paper studies the relationship between children and female self-employment in a country with family friendly policies and a generous welfare system: Sweden. The initial hypothesis is that we will not find evidence of a positive effect of children on self-employment among Swedish women since there are other institutions in place aiming at facilitating the combination of work and family. Using Swedish register data for the period 2004-2008 we do, however, find that the presence of young children increases the probability of choosing self-employment also among Swedish women. The effect is strongest for women with very young children, 0-3 years of age. These results also hold in a panel data model that takes individual unobserved heterogeneity into account. We also analyze time-use data and find, contrary to what has been found in many other countries, that self-employed women spend more, or as much, time on market work than wage-earning women. This raises doubts about whether women in Sweden chose self-employment as a way of balancing work and family commitments. We suggest an alternative interpretation which is that women who chose self-employment while the children are young in fact are women with strong preferences for market work. JEL Classification: J22, L26, J13 Keywords: work, family, self-employment, fertility Corresponding author: Pernilla Andersson Joona Swedish Institute for social research (SOFI) Stockholm University S-106 91 Stockholm Sweden E-mail: [email protected]
* The author gratefully acknowledges financial support from the Swedish Research Council (VR).
2
1. Introduction
It has been argued that women choose self-employment as a way of balancing work and family
commitments, in particular if there are young children living in the household. The presence of
children increases the amount of household work at the same time as the parents’ demand for
flexible scheduling increases. Self-employment is assumed to increase flexibility regarding when
and where the work is performed and self-employment also involves a higher degree of control
and self-determination than what wage-earning employment does. Previous studies, mostly from
Anglo-Saxon countries, find a positive correlation between the presence of young children in the
household and self-employment probabilities among women (Boden 1996; Budig 2006; Hundley
2000; Lombard 2001; Wellington 2006). This has been interpreted as evidence of women
choosing self-employment as a way of balancing work and family commitments. Boden (1999)
using survey data from the US, report that in particular women with young children are more
likely than men to state that they become self-employed to increase flexibility and for family
related reasons. This is also in line with the findings of Carr (1996). Related studies using time-
use data find that self-employed women spend more time on household work than wage earning
women and less time on market work (Gurley-Calvez et al. 2009; Craig et al. 2014).
There are no previous studies investigating this hypothesis for Sweden where the labor market is
structured in a very different way than, for example, in the US. There are reasons to believe that
Swedish women do not choose self-employment in order to achieve more flexibility and to
facilitate the combination of work and family; there are other institutions in place in the Swedish
labor market aimed at facilitating the combination of work and family for parents with young
children: large scale publically subsidized child care, a generous parental leave system with
built-in incentives for fathers to take more parental leave1, and the right for parents with children
up to eight years to work part-time. Looking at the Swedish labor market in an international
comparison we see that female self-employment rates are low while female labor force
participation is high, part-time work is high, and fertility levels are high. Taken together, it seems
plausible that Swedish women manage to combine work and family without choosing self-
employment to a very high extent. Rønsen (2014) has a similar discussion about the relationship
1 Examples of this are two so called “daddy-months” that cannot be transferred to the mother, a higher replacement rate than in the public health insurance, and a bonus paid to couples who share their parental leave equally.
3
between children and self-employment among Norwegian women: the extra working time
associated with being self-employed should outweigh the flexibility and self-autonomy
associated with being self-employed in a welfare-state, such as Norway, with a good supply of
state-sponsored child care. Rønsen (2014) does, however, find indications of a positive
association between the presence of young children (up to eleven years of age) and female self-
employment also in Norway. Using survey data with information on working hours, she also
reports that self-employed women on average spend more time on market work than wage-
earning women do.
In this paper I use Swedish register data for the total Swedish population covering the period
2004−2008 and estimate both pooled cross sectional models and fixed effect models to analyze
the effect of young children in the household on self-employment probabilities. I find that the
presence of young children increases the probability of choosing self-employment also among
Swedish women. The effect is found to be strongest for women with very young children, 0−3
years of age and the effect is decreasing with the age of the children. I also find a positive effect
of having children on self-employment probabilities for men but here the effect is strongest for
the presence of slightly older children (7−10 years).
To interpret these results I relate the findings to what we know about how self-employed and
wage-earners divide their time between market- and household work. If women choose self-
employment as a way of balancing work and family commitments we would expect that they
spend less time on market work and more time on household work compared to wage-earning
women. Hundley (2000) provides us with an explanation for why this should be the case. He
argues that self-employment are not subject to some of the constraints of organizational
employment; he assumes that there is a lower bound defined by the minimum contribution of the
worker in organizational employment and an upper bound defined by the ability of organizations
of rewarding very skilled employees. Due to the lack of primarily the lower bound in self-
employment, it will be easier for the self-employed to adjust their time spent on market and
household work if family responsibilities increase. Having the US labor market in mind, he
further argues that self-employed women will work fewer market hours and more housework
hours compared to their organizational counterparts while the opposite will be true for self-
employed men.
4
In this paper an alternative explanation for the results which has been given far less attention in
self-employment literature is suggested: mothers of young children who choose self-employment
are in fact women who have very strong preferences for market work and are career oriented.
Becoming a mother in Sweden is associated with expectations of that she will leave the labor
market a fairly long time due to the generous parental leave system; it is possible to be a way
from work and to receive parental leave benefits for up to one and a half year. At the same time,
differences in parental leave periods between mothers and fathers are assumed to be one of the
main explanations for the persistent gender wage gap on the Swedish labor market. For women
who are career oriented, self-employment might be an alternative if one wants to work while the
children are very young or do not want to reduce the working time as much as one perhaps
would have needed to do if one would have been employed as a wage-earner. Few employers
may have such flexibility in their organization which makes it possible for mothers (or fathers)
with very young children to decide entirely on their own when to work and how much work to
perform. Previous studies for Sweden and several different data sources which include
information about how workers divide their time between market- and household work, show
that self-employed women in Sweden spend more, or as much, time on market work than wage-
earning women and there are no significant differences in the amount of time spent on household
work. This raises doubts about whether women in Sweden choses self-employment as a way of
balancing work and family commitments. Instead, it seems more plausible that women who
choses self-employment while the children are young in fact are women with strong preferences
for market work.
In addition to analyzing time-use data I also look at differences in number of days of parental
leave taken by self-employed and wage earners. We find that the group of self-employed appears
to be heterogeneous; self-employed mothers are more likely to take no, or very short, parental
leave even when the children are very young but among those who do take some parental leave,
self-employed mothers take on average more days of parental leave than wage-earning mothers.
This paper makes several contributions to the existing literature. First, results presented in
previous research are mainly based on data from Anglo-Saxon countries while this study uses
data for Sweden. The Swedish labor market is organized in a very different way than in Anglo-
Saxon countries and it is of great interest to see if the results for Sweden are consistent with
findings for other countries. One exception to previous research is Rønsen (2014) for Norway
5
but this study is interesting for comparison. Second, in the present study I use register data for
the period 2004-2008 covering the whole Swedish population. Most previous studies are based
on rather small samples, are often restricted to smaller groups e.g. married white women, and
cover earlier time periods. Third, I try to explain the association between self-employment and
the presence of young children in the household by relating our findings to what is known about
how self-employed and wage earners divide their time between market and household work and
to differences in days of parental leave between self-employed and wage-earners.
The remainder of the paper is structured as follows. In section two I go through previous
research in more detail, in section three the structure of the Swedish labor market is discussed in
more detail, in section four I describe the data, variables and the econometric approach, in
section five the results are presented and interpreted, in section six I relate the findings to what is
known about differences in time spent on market work between self-employed and wage-earners
and in section seven I analyze whether there are differences in the use of parental leave between
self-employed and wage-earners, and finally section eight summarizes and concludes the paper.
2. Previous research
2.1. Self-employment and work and family commitments
In this section, results from previous studies concerning self-employment as a way of balancing
work and family commitments are summarized.
Using data from the U.S., Wellington (2006) examines the hypothesis that married women are
increasingly choosing self-employment as a strategy to balance family and career. In the
econometric analysis, the author estimates the effect of children on the probability of being, and
becoming, self-employed. This is estimated both using cross sectional and longitudinal data. It is
found that the presence of young children increases the probability of being self-employed but
the impact of children does not appear to have increased over time. The conclusion that is drawn
is that mother’s increased labor force participation comes at a direct cost of time spent with
children.
Lombard (2001) uses similar data and also finds that the presence of children increases the
likelihood of self-employment. Here it is assumed that women with children have a higher
demand for flexible scheduling and that this is more easily attained when being self-employed.
6
In an article from 1996, Boden hypothesize that fertility, defined as having at least one child
under the age of six, will have a positive impact on self-employment entry. This article uses the
same type of data as the two abovementioned, the Current Population Survey (CPS) for the US.
Boden finds a positive influence of fertility of female self-employment.
Budig (2006) differentiate between non-professional and non-managerial self-employment on
the one hand and professional and managerial self-employment on the other hand when
analyzing the effects of family structure on self-employment. This is tested using survey data
(the NLYS) for the US and it is found that children increases women’s non-professional self-
employment but has no effect on professional self-employment. The interpretation suggested for
these results is that the demand for increased flexibility and more control over work schedules is
lower among women in professional wage employment since many occupations of this type
already offer more flexibility. An alternative explanation is that women in professional wage
employment have less family responsibilities, having fewer children compared to women in non-
professional employment could be a sign of this.
Noseleit (2014) analyzes the relation between fertility and self-employment using data from the
European Social Survey. The focus of this article is on the direction of causality between self-
employment and fertility, something that many previous studies have failed to account for. Most
studies are interested in the effect of fertility, or the presence of children, on self-employment.
But one could also argue that the direction of causality is reversed, i.e. that self-employment will
cause women, and perhaps also men, to have more children. One argument for this is that self-
employed individuals want to maximize the probability that one of their children can take over
the business and therefore have more children than employees (Broussard et al. 2013). To
establish the direction of causality, Noseleit (2014) uses instrument variable techniques and
instrument fertility by parents’ preferences for a mixed sibling-sex composition, as has been
done by Angrist and Evans (1998) and by instrumenting self-employment with the regional share
of employees working in small businesses. The IV-estimates indicate that fertility has a positive
effect on self-employment while he finds no evidence of that the reverse should be true, i.e. that
self-employment leads to higher fertility rates among women. An exception is, however, that he
finds that among women between 31 and 45 years of age, self-employment has a positive effect
on fertility.
7
Hundley (2000) analyzes male/female earnings differentials in self-employment using survey
data from the US. He argues that organizational employment is constrained by both lower
bounds (on acceptable employee contribution) and upper bounds (on employee rewards) which
self-employment is not. If there are changes in the demands for household production associated
with marriage and children, self-employed women could respond to these changes more easily
than organizational employed women since there is no lower bound on employee contribution
for the self-employed. However, this might of course result in lower incomes for the self-
employed woman. In more general terms, he argues that due to the lack of constraints for the
self-employed it is likely that some self-employed will participate more intensively in either
household or market work. As a consequence, self-employed married women will work fewer
market hours and more housework hours and self-employed men will work more market hours
and fewer housework hours compared to organizational employed women and men.
This prediction is consistent with what is found in studies using time-use data: self-employed
women tend to spend less time on market work than wage earning women and more time on
household work and/or child care (see Gurley-Calvez et al. 2009 for the US; Craig et al. 2014 for
Australia). A study for Spain find differences in time spent on market work where self-employed
women spend less time, but do not find any significant difference in the time spent on child care
between self-employed and wage-earning women (Gimenez-Nadal et al. 2012 for Spain). It has
also been found that self-employed women more often work during non-standard work hours, i.e.
during evenings and weekends (Gimenez-Nadal et al. 2012; Lombard 2001).
These results are, however, not entirely consistent with what has been found for Sweden. Mångs
(2012) finds that self-employed women, with and without young children (0−3 years) spend
more hours on market work than wage-earning women. Öun and Johansson Sevä (2014) find that
self-employed women with employees spend more time on market work compared to both self-
employed without employees and regularly employed women. They also find that self-employed
women without employees are more likely than regularly employed to state that they experience
balance between family and work commitments, while self-employed with employees are less
likely of experiencing work-family balance and more likely of experiencing work to family
conflict. As is shown below, a majority of self-employed females in the entire workforce have no
employees and also in the sample used in Öun and Johansson Sevä (2014), the majority has no
employees.
8
Using data from the European Social Survey, Nordenmark et al. (2012) find that self-employed
women experience a significantly higher level of work-life balance than wage-earning women
while self-employed men experience a similar level of work-life balance as employed men.
These are interesting results but since they use data for all 26 countries included in the survey we
do not know whether the correlations are found in all countries or whether the pattern in Sweden
differs from those in other European countries.
3. Female employment in the Swedish labor market
In this section some features of the Swedish labor market that speak against the hypothesis that
women chose self-employment as a way of balancing work and family commitments are
discussed. The implications of the Swedish, or Nordic, welfare state model for female labor force
participation have been studied extensively (e.g. Datta Gupta et al. 2008; Ferrarini et al. 2014).
Female labor force participation rates in Sweden are among the highest in the world. In 2010,
83.1 percent of Swedish women 25−64 years of age participated in the labor force compared to
the OECD average of 66.2 (OECD, 2012). The high female labor force participation means that
dual-earner families are very common in Sweden. Large scale public child care is an important
explanation for the structure of the Swedish labor market. During recent years, parents have also
come to share the parental leave period more equally between them although women still take
the majority of the parental leave period. But in spite of that Swedish parents appear to divide
both market work and household work more equally than parents in many other countries,
previous research find that women in Sweden are not less likely than women in other countries to
experience work-family conflicts. This is believed to be partly explained by the high female
labor force participation (Grönlund and Öun 2010). The female labor force participation is high
but the share of women working part-time is also high. Data from Eurostat for 2009 shows that
slightly over 40 percent work part-time. Working part-time while the children are young would
be one way of facilitating the combination of work and family commitments. Instead of leaving
the labor force altogether while the children are young, many women choose to work part-time.
According to the parental insurance law, employers cannot decline parents the possibility to
work part-time up until the child is eight years old (Föräldraledighetslagen 1995:584). Looking
9
at the time trend in part-time work we see, however, that there has been a decline in the share of
women working part-time in Sweden (Wennemo Lanninger and Sundström 2014).
Partly thanks to the generous welfare system, Swedish women can choose to combine labor force
participation with high fertility rates. In 2009, Eurostat estimates that the total fertility rate of
Swedish women is 1.94 children. This can be compared with the average in EU (EU28) which is
1.6 children per women. Iceland has highest fertility rates (2.23) while Hungary, Portugal and
Germany have lowest fertility rates (1.32, 1.34, and 1.36).
The Swedish parental leave system is both very generous and rather flexible. For each child, the
parents are assigned 480 days. During 390 days, the replacement rate is about 80 percent of their
previous earnings up to a certain ceiling. During the remaining 90 days the parents receive a
fixed smaller amount. The parents can divide the number of days as they please but 60 days are
assigned to each of the parent individually and cannot be transferred to the other parent. Each
week one can be on parental for a maximum of seven days but if one chooses for example five
days the length of the total parental leave period will be longer. It is possible to combine work
with parental leave. One could for example work three days a week and be on parental leave for
two days.
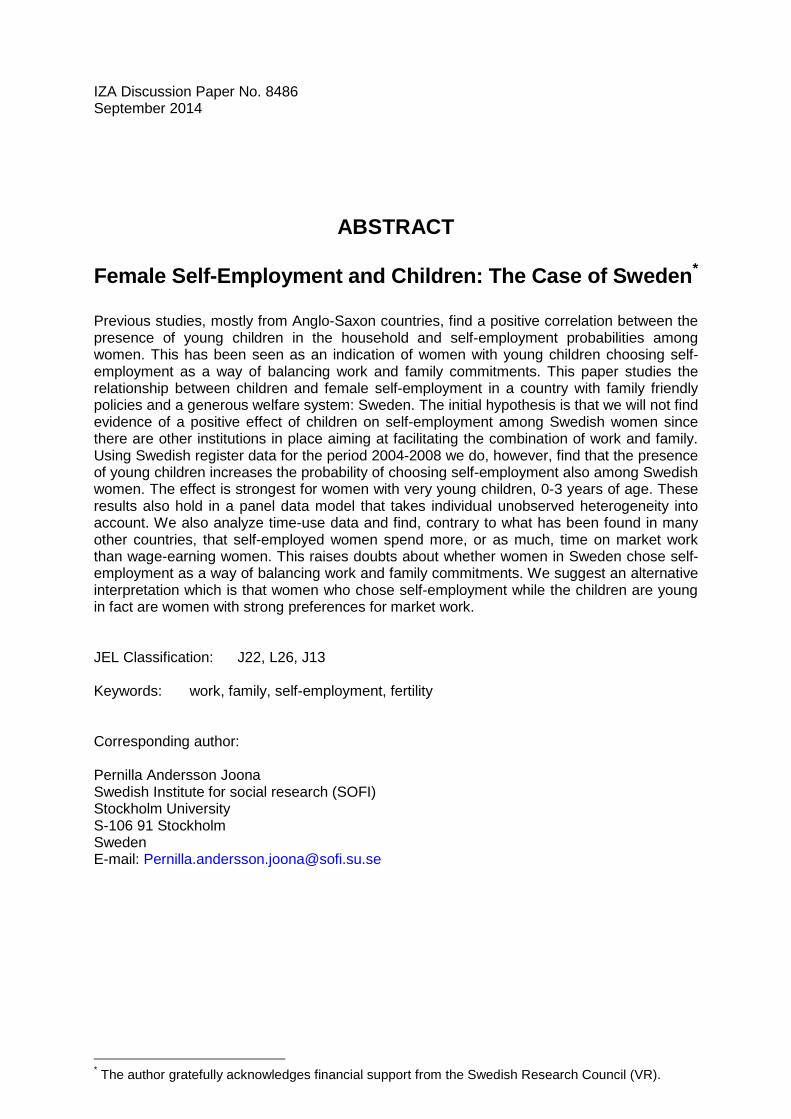
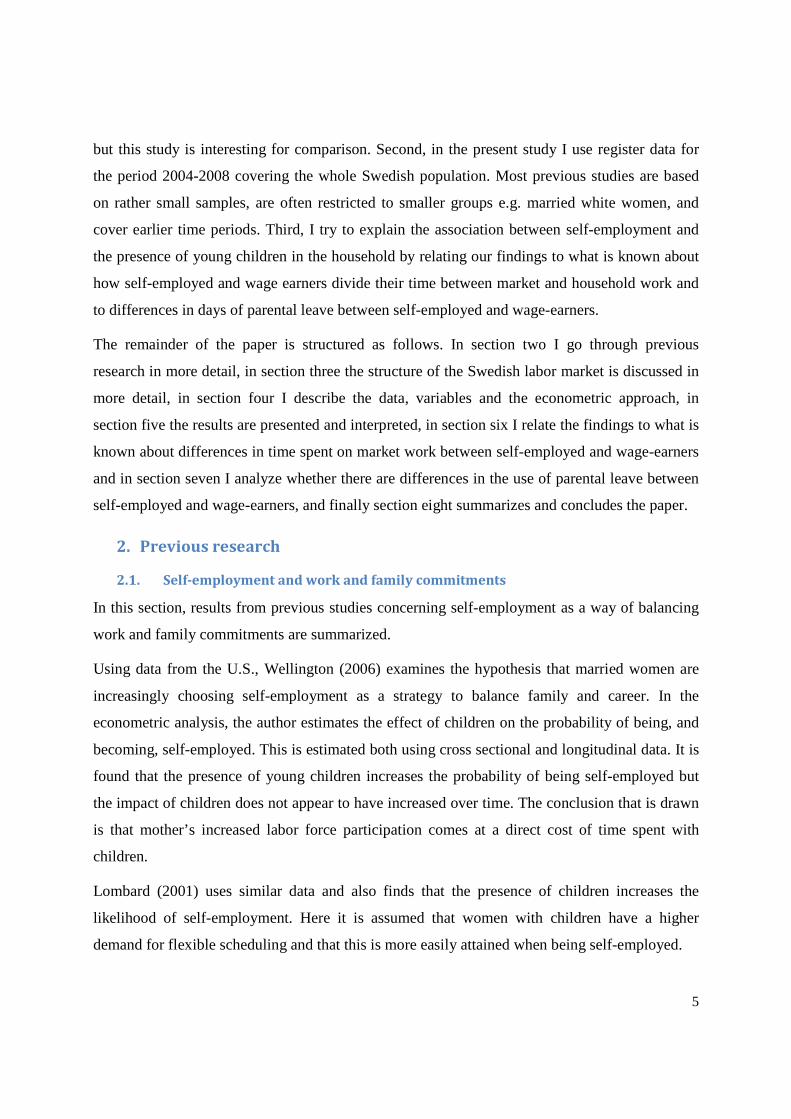
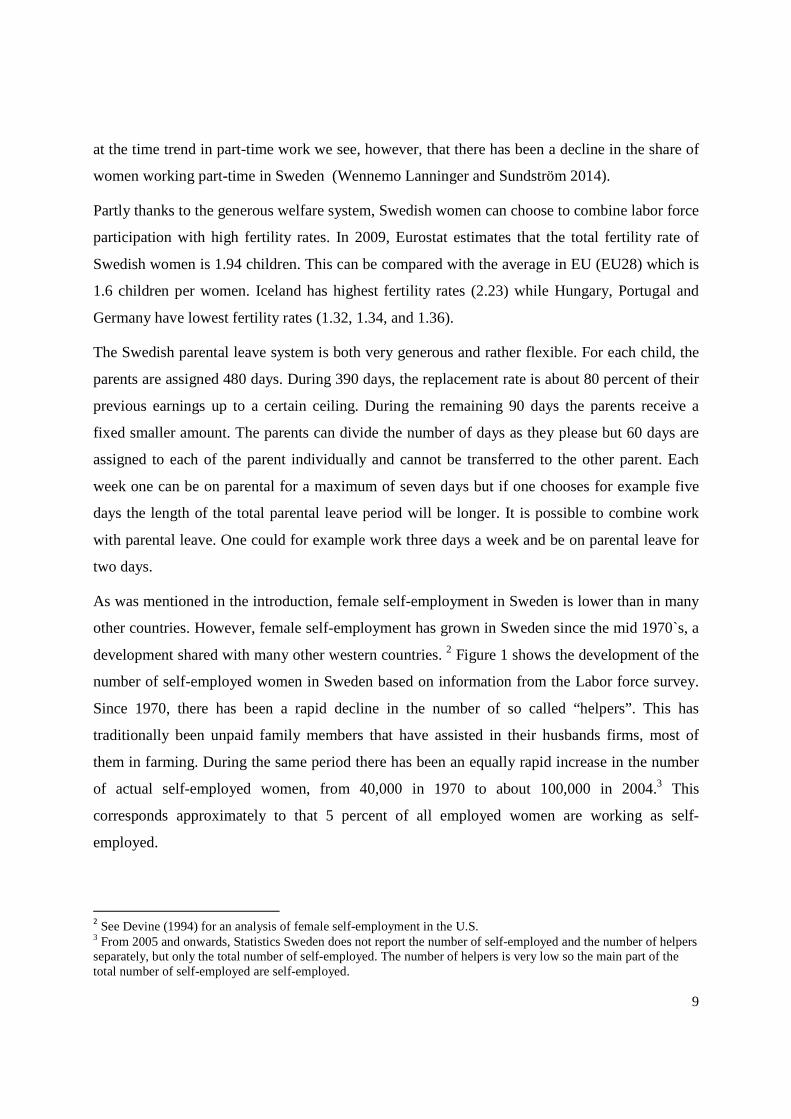
As was mentioned in the introduction, female self-employment in Sweden is lower than in many
other countries. However, female self-employment has grown in Sweden since the mid 1970`s, a
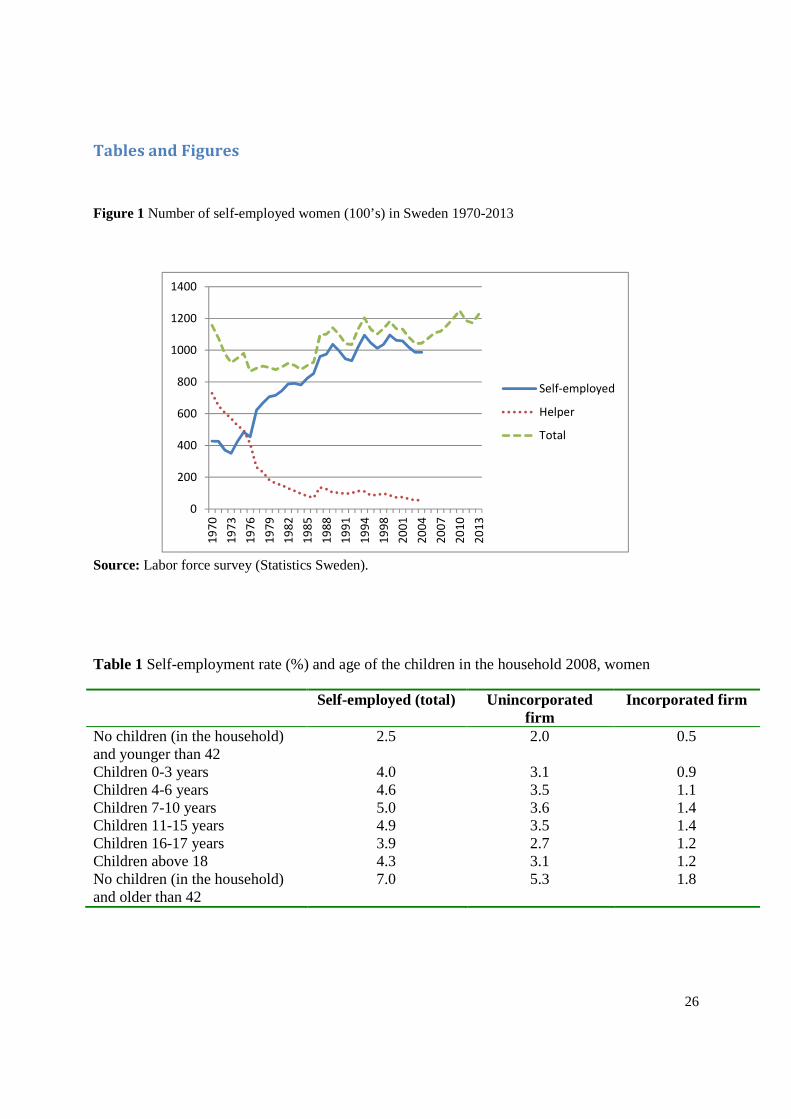
development shared with many other western countries. 2 Figure 1 shows the development of the
number of self-employed women in Sweden based on information from the Labor force survey.
Since 1970, there has been a rapid decline in the number of so called “helpers”. This has
traditionally been unpaid family members that have assisted in their husbands firms, most of
them in farming. During the same period there has been an equally rapid increase in the number
of actual self-employed women, from 40,000 in 1970 to about 100,000 in 2004.3 This
corresponds approximately to that 5 percent of all employed women are working as self-
employed.
2 See Devine (1994) for an analysis of female self-employment in the U.S. 3 From 2005 and onwards, Statistics Sweden does not report the number of self-employed and the number of helpers separately, but only the total number of self-employed. The number of helpers is very low so the main part of the total number of self-employed are self-employed.
10
These four stylized facts: high female labor force participation, high share of women working
part-time, high fertility rates and a low share of self-employed females suggest that women on
the Swedish labor market combine market work and family formation without choosing self-
employment to a very high extent. These facts are based on data for the whole grown-up
population. Below we take a closer look at the relationship between self-employment and
fertility using detailed micro data for the whole Swedish population.
There are certainly other macro level factors which influence the self-employment rate in a
country and may explain country differences. Since also male self-employment rates in Sweden
are lower than in many other countries this suggests that (other) institutions also matters. The
OECD looks for example at the correlations between self-employment (excluding agriculture)
and per capita GDP and finds a negative correlation: the richer the country, the lower the self-
employment share (OECD 2011). The empirical literature has also shown that there is negative
correlation between the size of the public sector and self-employment rates (Torrini 2005). The
role of taxes for self-employment has been studied extensively and the general idea is that higher
taxes encourage self-employment since it is easier to evade taxes if self-employed. Studies for
Sweden do, however, find a negative correlation between taxes and self-employment (Davis and
Henrekson 1999; Fölster 2002). The correlation between unemployment and self-employment
has also been studied but the results vary. Blanchflower (2000) finds, for example, that there is a
negative correlation between the unemployment rate and the self-employment rate in most
countries.
[FIGURE 1 ABOUT HERE]
4. Data and econometric analysis
4.1. Data and variables
The main analysis presented in this paper is based on individual level register data from the
employment register at Statistics Sweden covering the period from 2004 to 2008. This data is
collected mainly for administrative purposes and includes information on for example
employment status (wage-earners, self-employed or not employed) in November each year, age,
marital status, number of children residing in the household, education, country of birth and
place of residence. An individual is defined as self-employed with an unincorporated firm if the
11
largest source of income during November is from self-employment. The self-employment
income is however adjusted with the factor 1.6 since the self-employed in general report lower
incomes. Self-employed with incorporated firms receive a wage income, just as regular
employees, since they are employed in their own firm. The self-employed, as they are defined
here, could both be owners of unincorporated or incorporated firms and of firms both with and
without employees. The incorporated firms included are, however, only firms with ten or fewer
stockholders. The firms can be active in all industries and include everything from farmers or
carpenters to lawyers and physical therapists. In the regression analysis I can control for industry
but not for occupation since the register at Statistics Sweden lacks reliable information on
occupation for the self-employed.
In the analysis I restrict the sample to only include women who participate in the labor force, i.e.
the dependent variable is one if an individual is working as self-employed and zero if the
individual is working as a wage-earner. Individuals who are students, unemployed, on sick-leave,
or outside the labor force are not included in the study. The reason for applying this restriction,
which is also done in Rønsen (2014), is that we are mainly interested in how the presence of
children affects occupational choices, given that one has chosen to participate in the labor force.
The main independent variable of interest in this study is a measure of fertility, or the presence of
children in the household. The register includes information on the number of children in
different age ranges living in the household, i.e. I do not know the exact age of the children.
There are several ways of controlling for the number and the age of the children in the regression
analysis. Different definitions have been tried but the main results are invariant to the definition
used. I choose to present the results from a regression where we control of the number of
children in all different age ranges: 0−3 years, 4−6 years, 7−10 years, 11−15 years, 16−17 years,
and 18 years or above.
To be able to better understand and interpret our results on the relationship between children in
different age ranges and self-employment I also present some descriptive results using aggregate
data from the Harmonized European Time Use Survey (HETUS). This data was collected within
a project supported by Eurostat and it is possible to calculate user defined, comparable statistical
12
tables on the organization and activities of everyday life in fifteen European countries.4 The
Swedish data originates from the time use survey conducted by Statistics Sweden in 2000/01.
To further illustrate the question of how self-employed and wage earners divide their time
between market and household work I also use individual level data from the Swedish Level of
Living Survey for year 2000. This is data from a survey that has been conducted among a
random sample of 1/1000 of the Swedish population. The respondents are asked questions about
their living conditions in several areas. The drawback of this data is that it includes very few self-
employed women.
4.2. Econometric analysis
I use panel data for the period 2004−2008 and estimate both pooled cross sectional models (eq.
1) and models that include individual time fixed effects (eq. 2). Our key independent variables
of interest are the number of children living in the household in different age ranges (0−3 years,
4−6 years, 7−10 years, 11−15 years, 16−17 years, and 18 years or above). The vector X includes
controls for: age, age squared, being married, education, industry, country of birth, county of
residence and year. The regressions are estimated separately for women and men and I focus on
the result for women.
���� = � + �ℎ� �0_3�� + ��ℎ� �4_6�� +⋯+ ��ℎ� �18�� + ���� + ��� (1)
It should be stressed that the β-coefficients in equation 1 are not measures of the causal effect of
the number of children on self-employment. In this model the comparison is made between
individuals who differs in their preferences for the number of children and self-employment, two
factors that are outcomes of decisions that are not exogenous to each other. To try do address this
problem I include individual fixed effects in equation 2. This is assumed to be a time fixed effect
that varies between individuals but is constant over time, which for example could be
preferences for employment form and family formation or family size. Since this model is
estimated using panel data methods the comparison becomes intra-personal rather than inter-
personal, i.e. I compare the same individual with herself over time. Put simply, I estimate the
impact of a change in the number of children in different age ranges on the change on
employment status to and from self-employment. More formally, I estimate the model specified
4 To read more about HETUS see, https://www.h2.scb.se/tus/tus/.
13
in equation 3 where all variables are expressed as the value of the variable for individual i at time
t and its deviation from the mean calculated over all years for this individual.
���� = � + �ℎ� �0_3�� + ��ℎ� �4_6�� +⋯+ ��ℎ� �18�� + ���� + �� + ��� (2)
���� − ��� = � + �(ℎ� �0_3�� − ℎ� �0_3�) + ��(ℎ� �4_6�� − ℎ� �4_6�) +⋯+ ��(ℎ� �18�� −
ℎ� �18�) + �(��� −��) + (��� − ��) (3)
The dependent variable is a dichotomous variable taking the value one if the individual is self-
employed and zero if the individual is a wage-earner. The models are first estimated using a
linear probability model. This has the advantage that the interpretation of the coefficients is
simple: each additional child in a certain age range increases or decreases the probability of
being self-employed by a certain percentage point. Using this model there is, however, a risk
that it will yield predicted probabilities outside the range of zero to one. For this reason I also
estimate both pooled cross sectional and panel regressions using the non-linear logit model. To
account for individual fixed effects in the logit model I estimate so called conditional fixed
effects models (Chamberlain 1980, 1984; Maddala 1987). In this model, I condition on that there
has been a change in the dependent variable between two time periods. Individuals who do not
change state between two time periods are not included in the regressions, since they do not
contribute to the likelihood function (Maddala 1987). As a consequence, this model uses
substantially fewer observations than the other models.
4.3. Descriptive statistics
The main purpose of this study is to estimate the effect of the presence of children in the
household on the probability of being self-employed. As a descriptive exercise self-employment
rates among different groups of employed women are presented in Table 1. The sample is
divided into eight groups depending on whether there live any children in the household, the age
of the women and the age of the children. The first group includes women younger than 42 and
with no children living in their household. This group presumably includes some women who
have not yet had any children and where some of them will have children in the future. The last
14
group also includes women with no children living in their household but who are older than 42.
This group includes women that have older children that do not live with their parents. The
groups in between are not mutually exclusive since women can have children in different age
spans. For example, a woman can have one child in the age range 0 to 3 and one child in the age
range 4 to 6. Previous research has found a positive correlation between age and the probability
of being self-employed. There is also likely a positive correlation between the age of a woman
and the age of her children. This makes it difficult to disentangle the impact of age on the self-
employment probability and the impact of the presence of children in different age ranges. This
will be dealt with more carefully in the regression analysis. However, it can still be interesting to
look at the correlations between self-employment, total and divided into unincorporated firms
and incorporated firms, and the presence of children in the household. Self-employment is lowest
among women younger than 42 years with no children and highest among women with no
children but who are older than 42. For women with children up to 17 years there appears to be
an inverted u-shaped relation between the age of the children and self-employment with a peak
in the self-employment rate among mothers with children between 7 and 10 years.
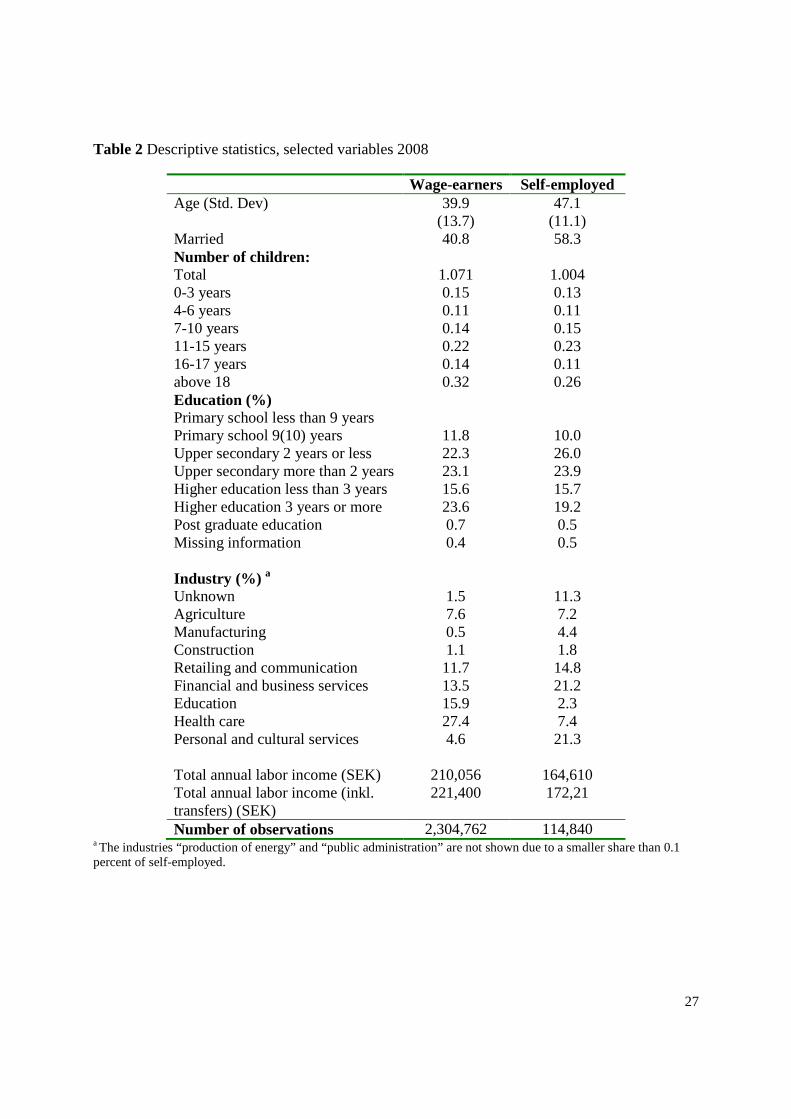
In Table 2 some descriptive statistics for the groups of self-employed and wage-earning women
that are included in the sample in 2008 are presented. Self-employed women are on average
almost eight years older than wage-earning women. This correlation between age and self-
employment has been found in many previous studies (see for example Blanchflower 2000). The
age difference is reflected in differences in marriage rates and fertility rates when studying the
whole group of self-employed women; a substantially higher share of self-employed women are
married and they have fewer children in all age groups living in their household. A higher share
among the self-employed have relatively low education, not more than upper secondary school,
while a lower share have university education. I also present the distribution over sector which
tend to be very different among wage-earners and self-employed. The largest group of wage-
earning women is employed in the health care sector, 27 percent, while only 7 percent of the
self-employed are active in this sector. We also find the same pattern regarding the educational
sector. The self-employed are instead predominately located within “personal and cultural
services” and “financial and business services”. Lastly, annual labor income, both excluding and
including transfers, are presented and we find that the self-employed on average have lower
incomes than wage-earners.
15
[TABLE 1 & 2 ABOUT HERE]
5. Results
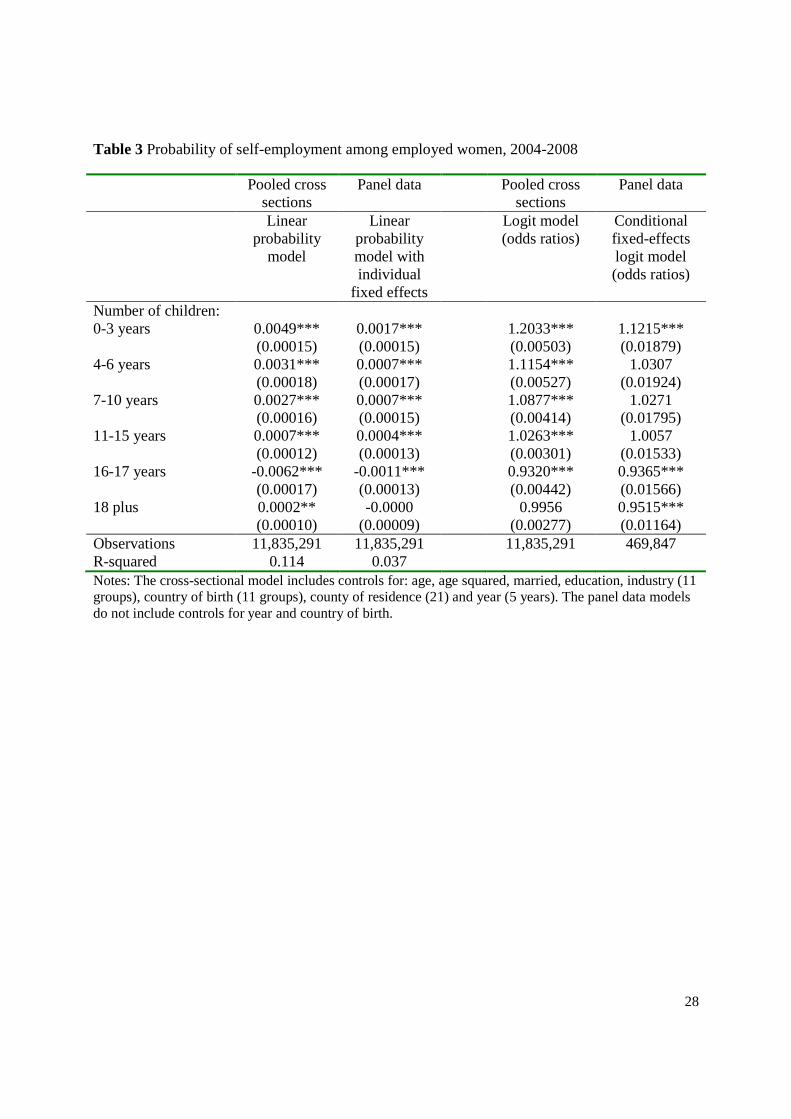
The results from our estimations of the relation between the presence of children in the
household and the probability of being self-employed are presented in Table 3. In general, there
is a positive correlation between the number of children in the household, in all age ranges
except 16−17 years, and self-employment. It can be assumed that family responsibilities and
perhaps foremost, the workload in the household associated with having children, decreases as
the children gets older. An implication of this would be that the demand for self-employment
also decreases with the age of the children. Our results suggest that this is indeed the case.
According to the estimations based on the pooled cross sectional data an additional child in the
age range 0−3 increases the self-employment probability by 0.49 percentage points while an
additional child in the age range 4−6 years increases the self-employment probability by 0.31
percentage points. The logit model show a similar pattern; the odds ratio of being self-employed
is more positively affected by an additional child in the younger age groups than in older age
groups and the odds ratio of being self-employed decreases for children aged from 16 to 17.
The cross sectional models cannot be used to identify the causal effect of young children on self-
employment. The more relevant question is if the arrival of young children in the household and
hence an increased demand for labor market flexibility increases the likelihood of mothers
switching from wage employment to self-employment. To address this question we use of the
panel dimension of the data and estimate fixed effect models. The point estimates of these
models are smaller than in the cross-sectional models but we still find a positive effect of more
young children in the household on self-employment. The conditional fixed-effect logit model
only uses observations for which there is a change in the dependent variable, i.e. individuals who
change from wage employment to self-employment (a positive outcome) and individuals who
change from self-employment to wage employment (a negative outcome). Here, only the
estimate for the youngest age group is positive and significant. In this very restrictive model
there is a positive effect of an additional young child on the probability of becoming self-
employed, i.e. switching from wage employment to self-employment.
16
We have also estimated the same models for men. These results are presented in Table A1 in the
Appendix. We find a positive correlation between the number of young children and the
probability of being self-employed also for men. However, the impact of an additional child is
smaller if the children are very young (0−3 years) and stronger if the children are older. For
women, we find that the impact of an additional child decrease by the age of the children. This
could mean that fathers do not choose self-employment when the need to be caring for the
children is the highest which seems to be the case for mothers.
[TABLE 3 ABOUT HERE]
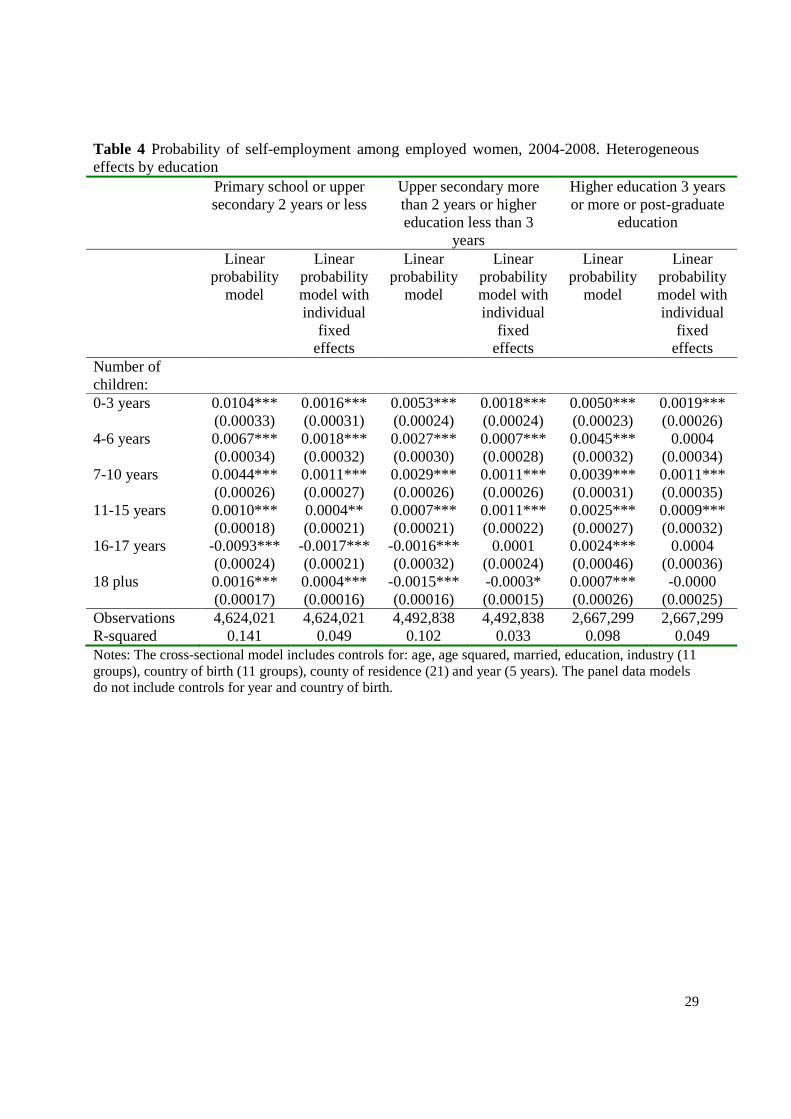
5.2. Heterogeneous effects by educational level
It has been argued in previous studies (see e.g. Hundely 2000) that professionals and workers in
managerial positions would not need to choose self-employment in order to achieve this type of
flexibility but that many wage-earning jobs in the modern labor market also are flexible with
respect to where and when the work is performed. This idea is tested by conducting the analysis
separately by three educational groups; (1) primary school or upper secondary 2 years or less, (2)
Upper secondary more than 2 years or higher education less than 3 years and (3) Higher
education 3 years or more or post-graduate education. We would expect to find most
professionals and workers in managerial positions in the group with the highest educational level
and hence expect the effect of children on self-employment to be non-existent or at least weakest
in this group. The results are presented in Table 4 and from the linear probability model we find
that the association between the number of young children and self-employment probabilities is
strongest among women with the lowest educational level.5 However, even for women with the
highest level of education, each additional child in the youngest age group has a positive and
significant impact on the probability of being self-employed. In the fixed effects regressions the
estimates of children in the youngest age group are about the same for all educational groups.
Hence, it does not appear to be the case that only low educated women choose self-employment
as an alternative employment form while the children are young.
[TABLE 4 ABOUT HERE]
5 These models have also been estimated using a logit model but the results are not presented her but are available from the author upon request. The main results are invariant to the choice of model.
17
5.2. Interpreting the results
The results presented in the previous section suggest that self-employment among women
increases with the number of children and that the effect is decreasing in the age of the children.
This is consistent with the results presented in previous studies and supports the hypothesis that
women with more child care, and hence in many cases more household responsibilities, more
likely chose self-employment than other groups of women. In previous studies similar results
have been interpreted as evidence of that this group of women has a higher demand for flexible
scheduling and chooses self-employment as a way to achieve it. This interpretation is supported
by the findings in studies using time-use data who report that self-employed women spend more
time on household work and less time on market work than wage-earning women do. But is this
the way the results should be interpreted for Sweden? In the remaining sections of the paper I try
to shed some light on two possible explanations for our results. The first hypothesis is that
women in Sweden, in spite of the institutions in place on the labor market with the purpose of
facilitating the combination of work and family commitments, also chooses self-employment as
a way of balancing work and family. The second hypothesis, which has been given far less
attention in self-employment literature, is that mothers of young children who choose self-
employment in fact are women who have very strong preferences for market work. Self-
employment could be a way for these women to avoid reducing time spent on market work to the
same extent as they would have done if they would have been employed as wage-earners when
they have young children. Self-employment is assumed to satisfy the demand for flexibility and
instead of working eight hours straight from morning to afternoon as one often does when being
an employee, self-employed parents could work while the children are in day care or in school,
pick up them in the afternoon and spend time with them and doing household choirs and then
continue to work in the evening when the partner has come home and can take over child care
responsibilities.
For the self-employed there could also be the possibility to work while the child is very young
and has not started day care yet. As was mentioned before, the parental leave system in Sweden
is generous and flexible allowing parents, while they are on parental leave, to work during some
days of the week although not receiving any benefits during this time. But children under the age
of one are not covered by the public child care system so if neither of the parents can care for
these very young children it is up to the family to find private alternatives, like a grandmother or
18
a paid nanny. However, to have employed nannies is still not very common in Sweden. If one
were self-employed prior to having a child, it could be difficult to be away from the business full
time for up to a year and if there are no employees in the firm, it might be difficult for the firm to
survive. There is lots of anecdotal evidence of self-employed women who continue to work just
after the baby is born or take a very short period of parental leave.
A second motivation for why self-employment might be chosen by women with strong
preferences for market work is that even though Sweden in many respects is a gender equal
country there is still a non-negligible gender wage gap which is larger higher up in the wage
distribution (Albrecht et al 2003). One of the main explanations that has been put forward is that
women still take the majority of parental leave days and that the parental leave period in many
cases are very long, up to one and a half year. Young women are often aware of that there is a
risk of being punished in the labor market if they stay away from the labor market for a long
period when they have children. But at the same time there is still a social pressure on women
that they should stay at home and take care of the children. Becoming self-employed could then
be a way of achieving both these goals: to still be active on the labor market when the children
are very young and also be the one taking the main responsibility for caring of the child. There
are a limited number of wage-earning jobs where this is possible.
We will not be able to fully separate between these two possible explanations; choosing self-
employment to better balance work and family commitments or choosing self-employment in
order to still be active on the labor market when the children are young, but to be able to say
something I use two different indicators: time-use data for Sweden and information from
administrative registers about the number of days of parental leave. If women choose self-
employment as a way of balancing work and family commitments we would expect them to
spend less time on market work and more time on household work compared to wage-earning
women. We also would expect them to take more days of parental leave. On the other hand, if it
is women with strong preferences for market work that chose self-employment while the
children are young we would expect the opposite: they spend more time on market work and less
time on household work compared to wage-earning women and they will take fewer days of
parental leave compared to wage-earners.
19
One caveat to this analysis is that I do not have micro data on the time use of the individuals in
the administrative data that I use to estimate self-employment probabilities. We will therefore
rely on some secondary sources with information on the time-use of the self-employed and a
regression analysis of a sample that includes only a small number of self-employed women (the
Swedish Level-of-Living Survey).
6. Time use among self-employed men and women in Sweden
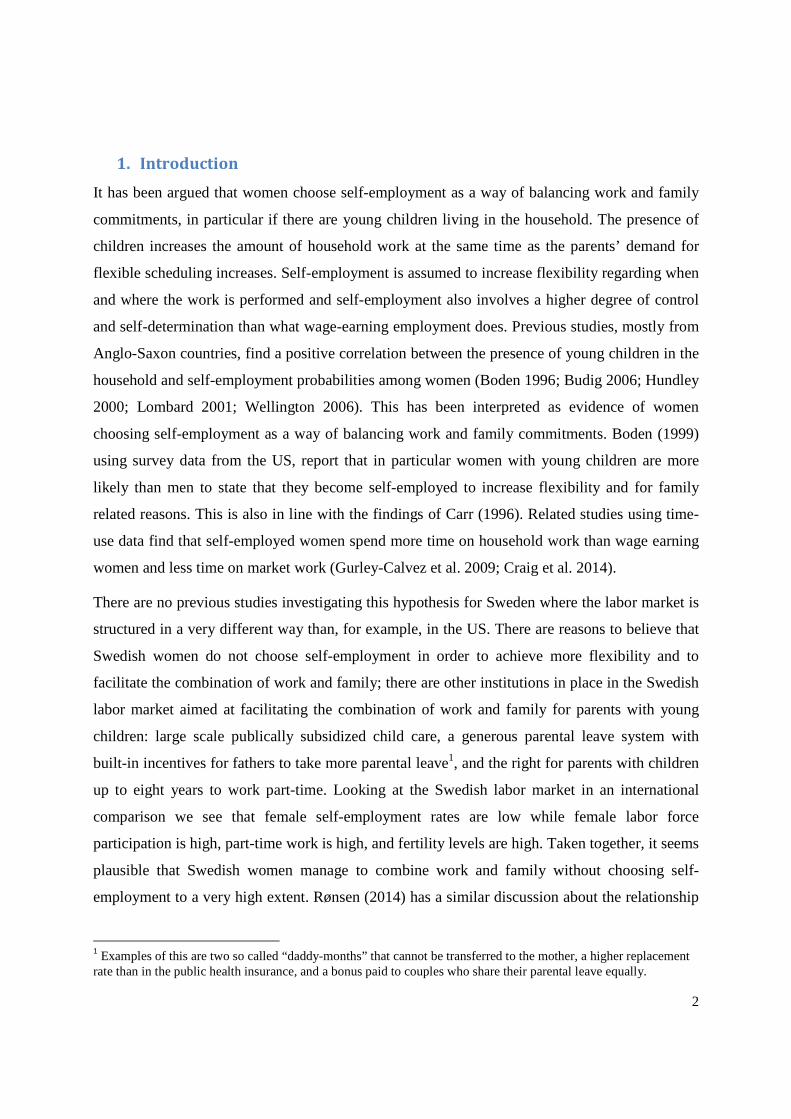
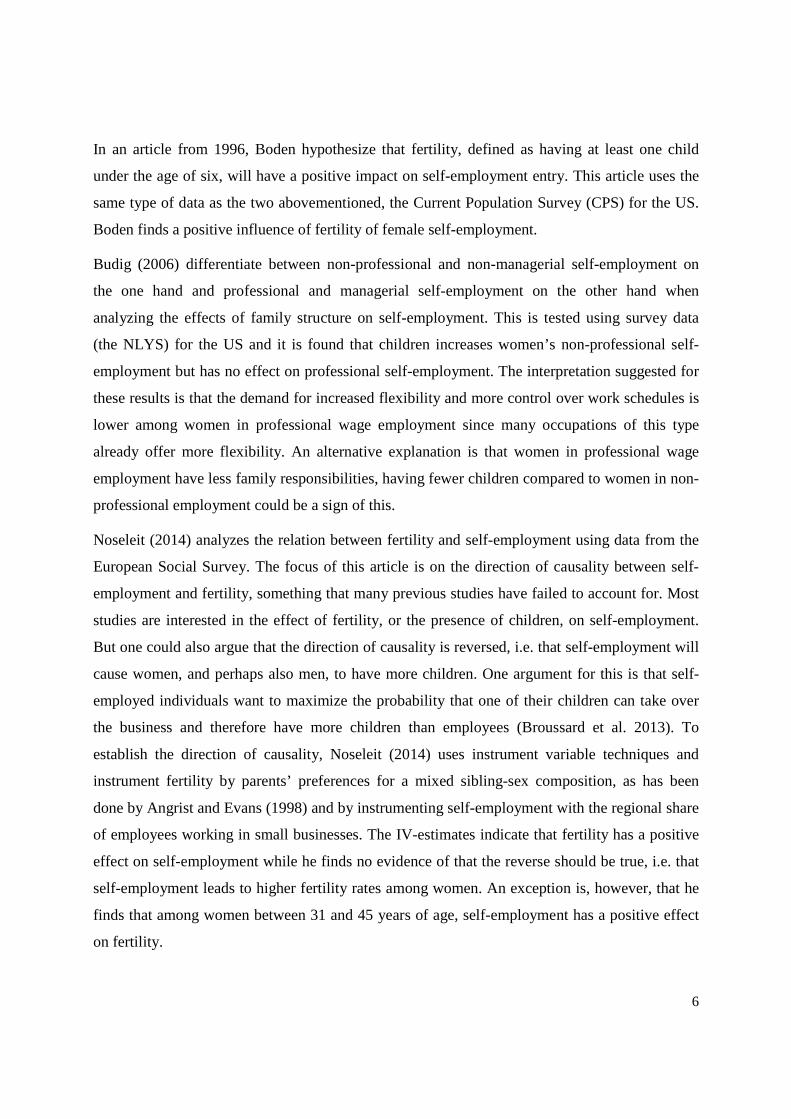
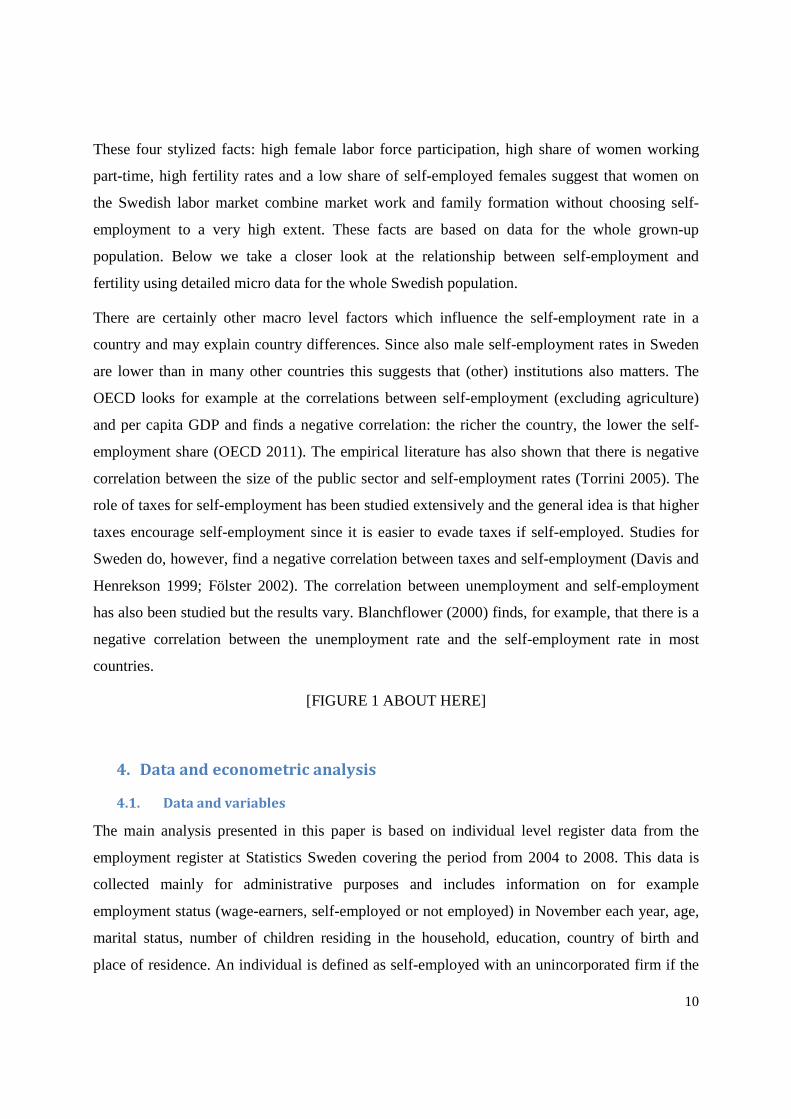
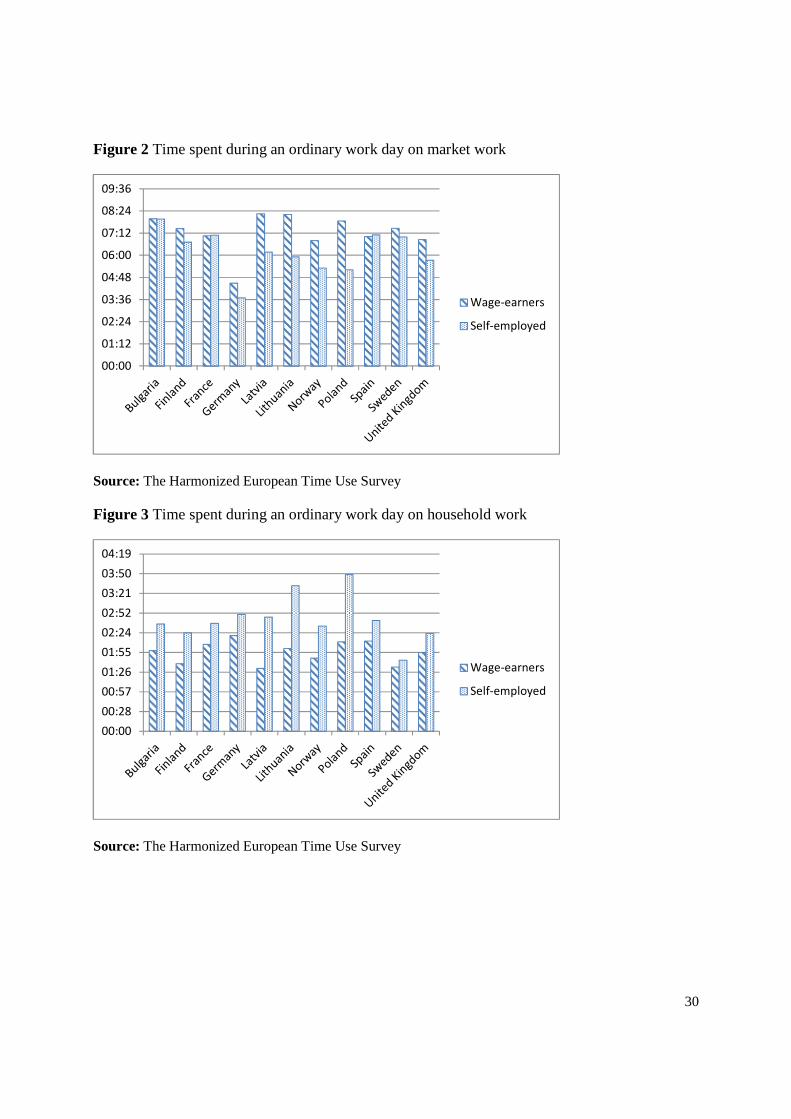
Previous studies for the US, Australia and Spain reveal that self-employed women spend less
time on market work than wage-earning women. Descriptive statistics from the Harmonized
European Time Use Survey also show that in most countries wage earning women spend more
time on market work than self-employed women. See Figure 2. According to this data, this is
also the case in Sweden but the difference is smaller than in most other countries.
[FIGURE 2 ABOUT HERE]
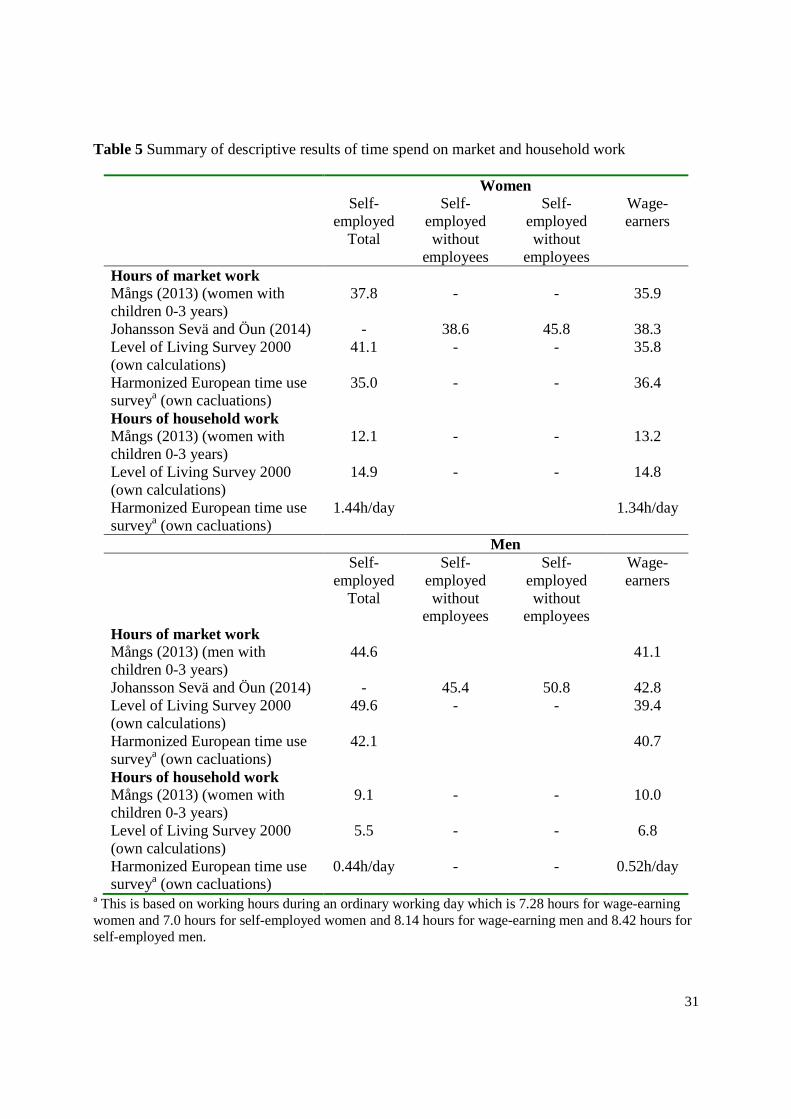
The evidence on time-use of self-employed men and women in Sweden are scarce but at least
two studies report that self-employed women spend more, or as much, time on market work as
wage-earning women. Average weekly hours of market work based on different data sources are
summarized in Table 5. Mångs (2013) report that self-employed women with children 0−3 years
of age spend on average 37.8 hours per week on market work and wage-earning women spend
35.9 hours per week on market work. These results are based on a survey and the sample of self-
employed is strongly selected since those having an annual income below 100,000 SEK are
excluded and so are combiners, i.e. self-employed who also have had an income from wage
employment during the year. Johansson Sevä and Öun (2014) report that self-employed women
with employees spend on average 45.8 hours per week on market work and wage-earning
women spend on average 38.3 hours on market work. Self-employed women without employees
spend about the same time on market work as wage-earning women. From the Swedish Level of
Living survey in 2000 we also see that self-employed women spend more time on market work
than wage-earning women. The sample of self-employed women is however small in this survey
and the average weekly working time is only based on 84 individuals. Data for Sweden from the
Harmonized European time use survey show that self-employed women spend slightly less time
on market work but the difference, 1.4 hours/week, is smaller than in many other countries
20
(https://www.h2.scb.se/tus/tus/). For men, all data sources show that self-employed men spend
more time on market work than wage-earning men.
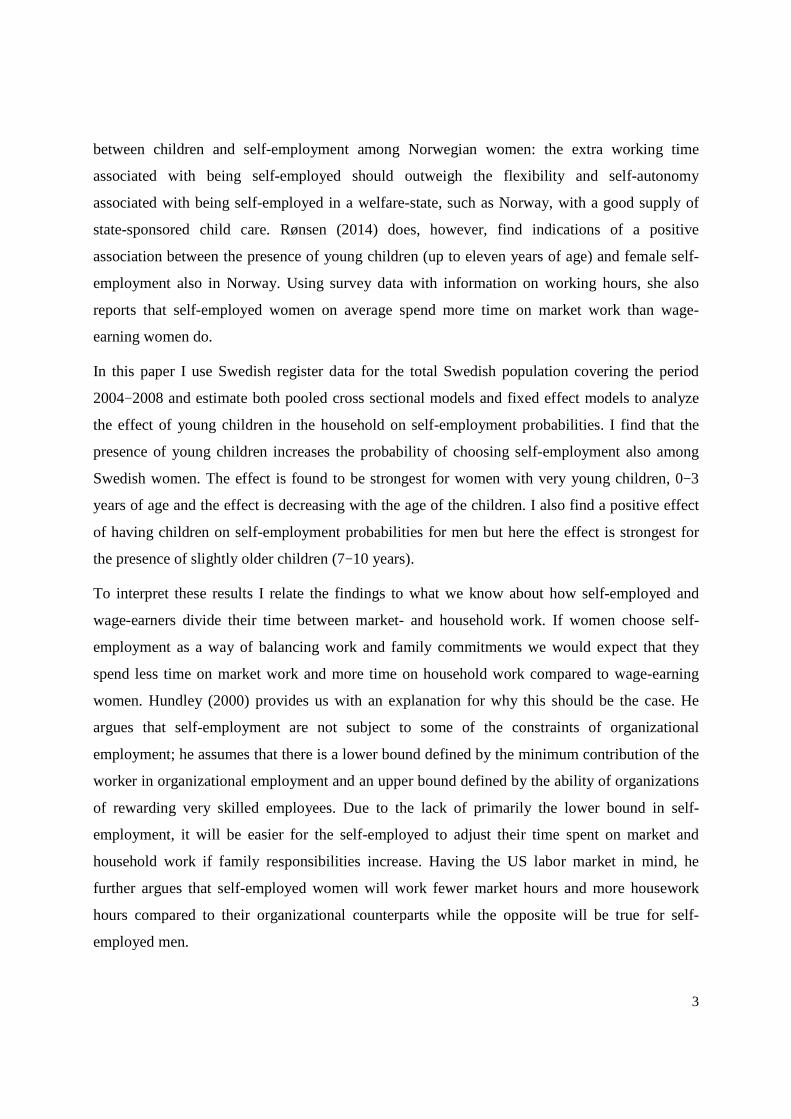
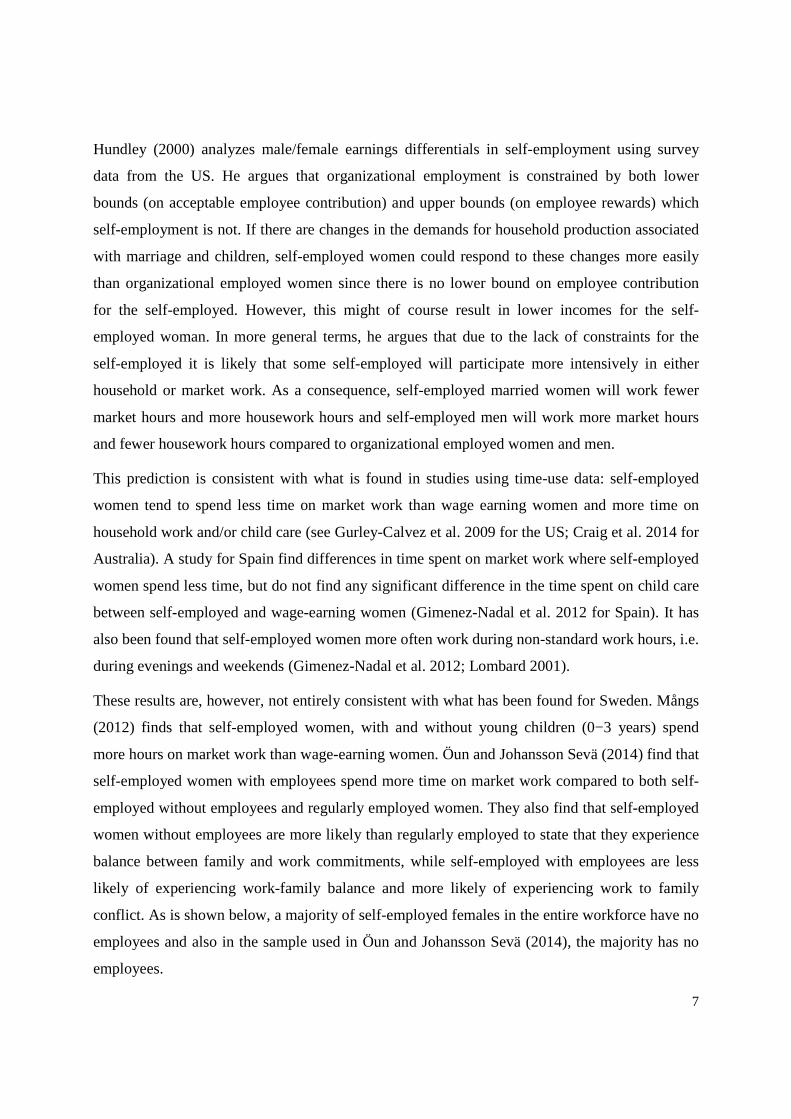
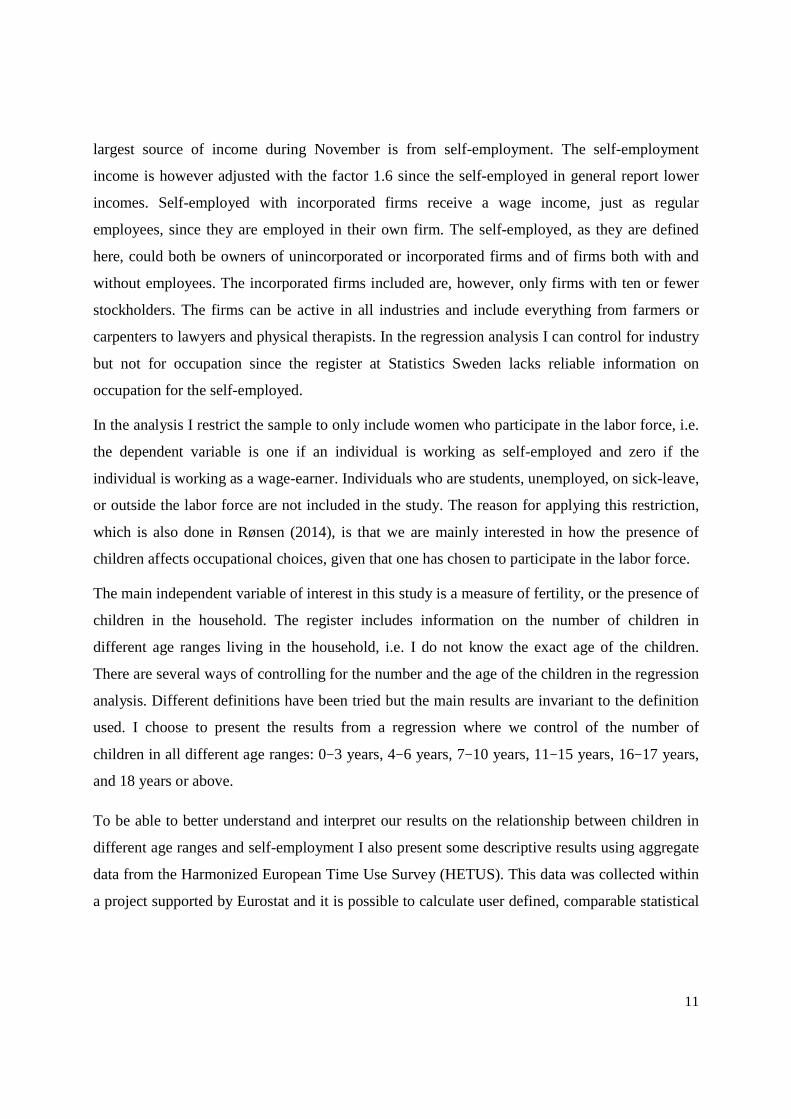
In previous studies it has also been found that self-employed women spend more time on
household work than wage-earning women. The existing evidence for Sweden reveals that there
are small differences in time spent on household work between wage-earning and self-employed
women. Again, the Harmonized European Time Use Survey show that in most countries self-
employed women spend substantially more time on household work than wage earning women
do. But the differences are small in Sweden. See Figure 3. In Table 5 we have also summarized
what is known about time spent on household work based on data for Sweden. Even though the
descriptive statistics on time spend on market work and household work presented here in no
way are conclusive, it could still be argued that it is not apparent that Swedish women choose
self-employment when the children are young to spend less time on market work and more time
on household responsibilities.
[FIGURE 3 & TABLE 5 ABOUT HERE]
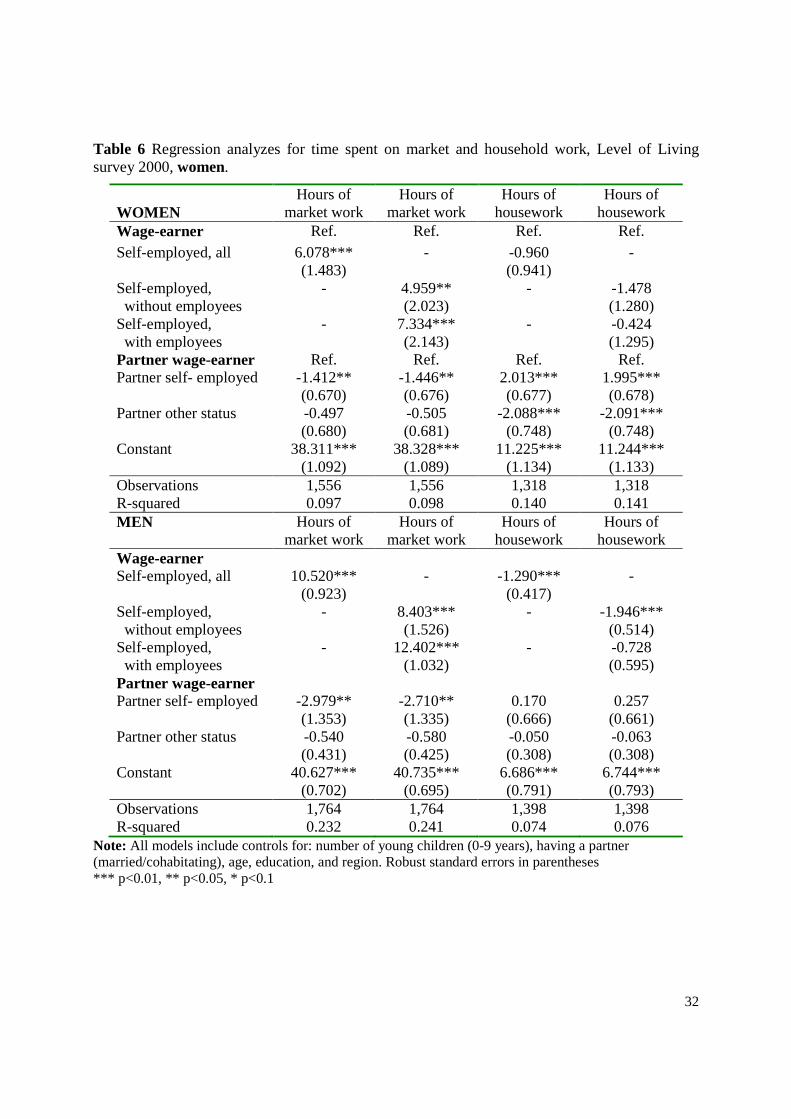
Using individual data from the Level of Living Survey for year 2000 I perform a multivariate
analysis of time spent on market and household work, the results are presented in Table 6. Even
though there are few individuals, in particular women, who are self-employed in this data we still
find significant differences regarding time spent on market work: self-employed women spend
on average about six hours more on market work than wage-earning women. We also find that
self-employed both with and without employees spend more time on market work than wage-
earning women but the differences are larger between wage-earners and self-employed with
employees. We find no significant differences with respect to time spent on housework. The
pattern for men is very similar: the self-employed spend more time on market work than wage-
earners. Here we do, however, also find that self-employed men, in particular those without
employees, spend significantly less time on household work than wage-earning men.
It is also interesting to note that the employment status of the partner has a significant impact on
the time spent on market work. For both women and men, having a self-employed spouse
decreases the time spent on market work by about 1.4 hours for women and by almost 3 hours
per week for men. Having a self-employed spouse increases the time spent on household work
for women, but for men it has no significant effect on time spent on household work.
21
[TABLE 6 ABOUT HERE]
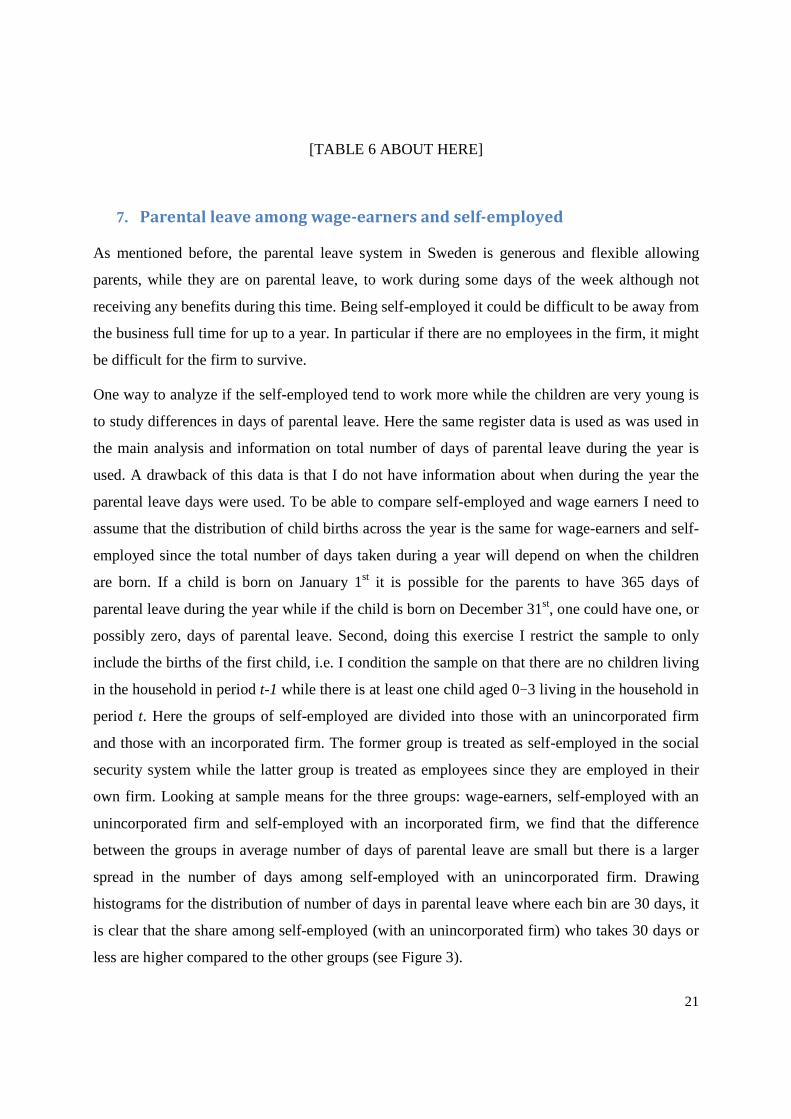
7. Parental leave among wage-earners and self-employed
As mentioned before, the parental leave system in Sweden is generous and flexible allowing
parents, while they are on parental leave, to work during some days of the week although not
receiving any benefits during this time. Being self-employed it could be difficult to be away from
the business full time for up to a year. In particular if there are no employees in the firm, it might
be difficult for the firm to survive.
One way to analyze if the self-employed tend to work more while the children are very young is
to study differences in days of parental leave. Here the same register data is used as was used in
the main analysis and information on total number of days of parental leave during the year is
used. A drawback of this data is that I do not have information about when during the year the
parental leave days were used. To be able to compare self-employed and wage earners I need to
assume that the distribution of child births across the year is the same for wage-earners and self-
employed since the total number of days taken during a year will depend on when the children
are born. If a child is born on January 1st it is possible for the parents to have 365 days of
parental leave during the year while if the child is born on December 31st, one could have one, or
possibly zero, days of parental leave. Second, doing this exercise I restrict the sample to only
include the births of the first child, i.e. I condition the sample on that there are no children living
in the household in period t-1 while there is at least one child aged 0−3 living in the household in
period t. Here the groups of self-employed are divided into those with an unincorporated firm
and those with an incorporated firm. The former group is treated as self-employed in the social
security system while the latter group is treated as employees since they are employed in their
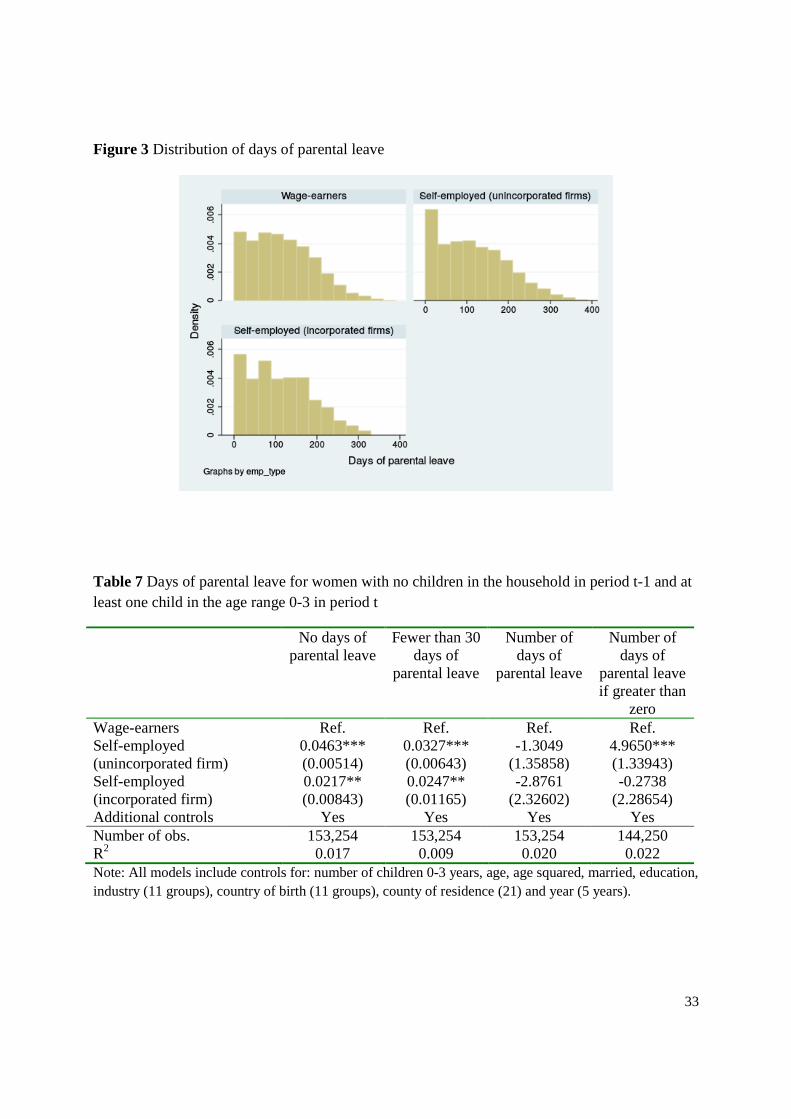
own firm. Looking at sample means for the three groups: wage-earners, self-employed with an
unincorporated firm and self-employed with an incorporated firm, we find that the difference
between the groups in average number of days of parental leave are small but there is a larger
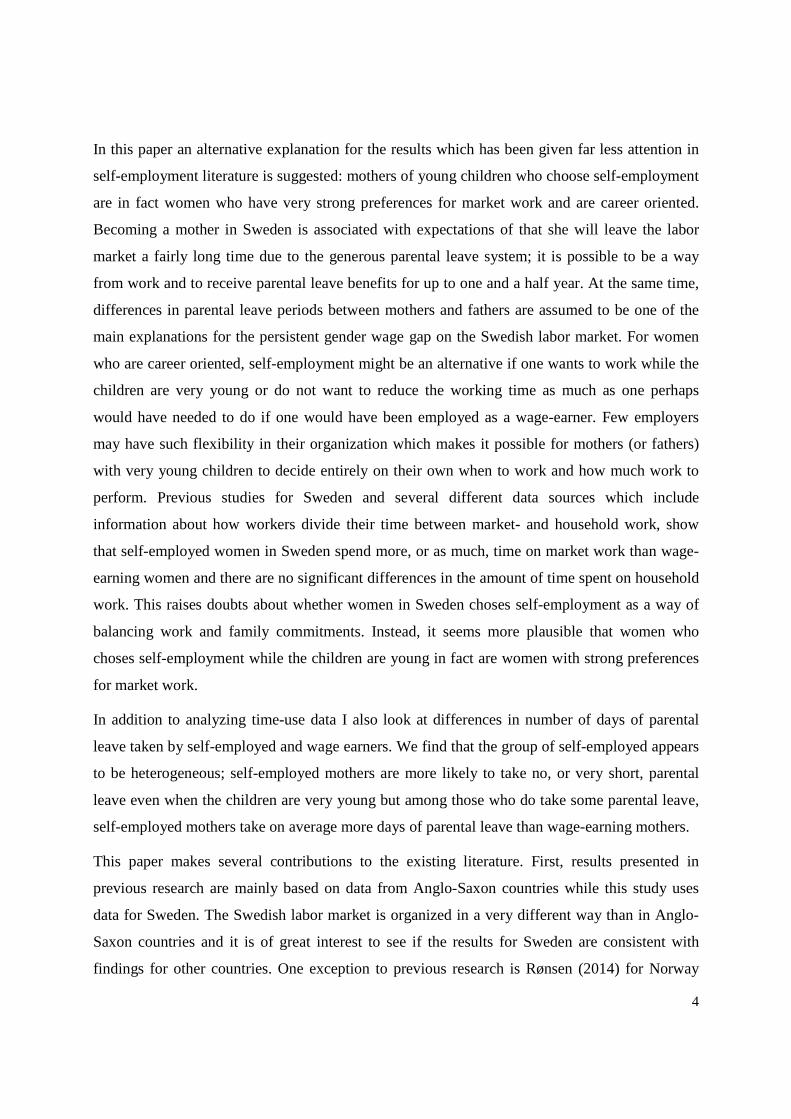
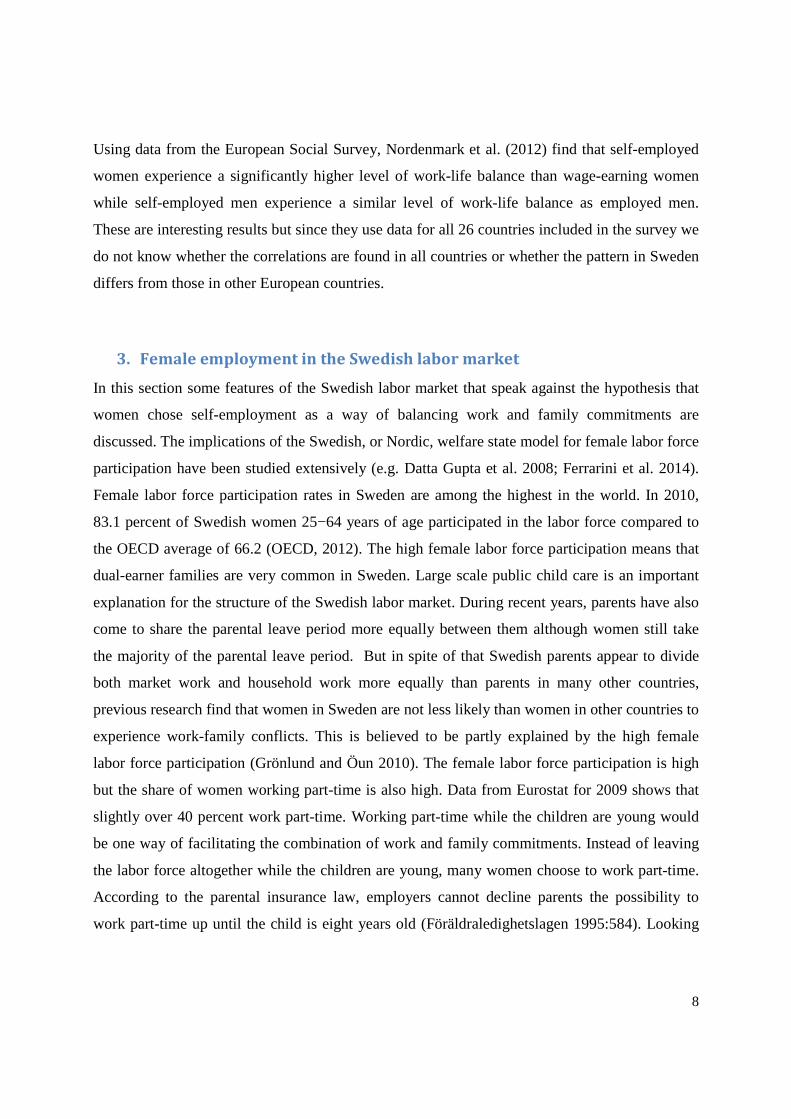
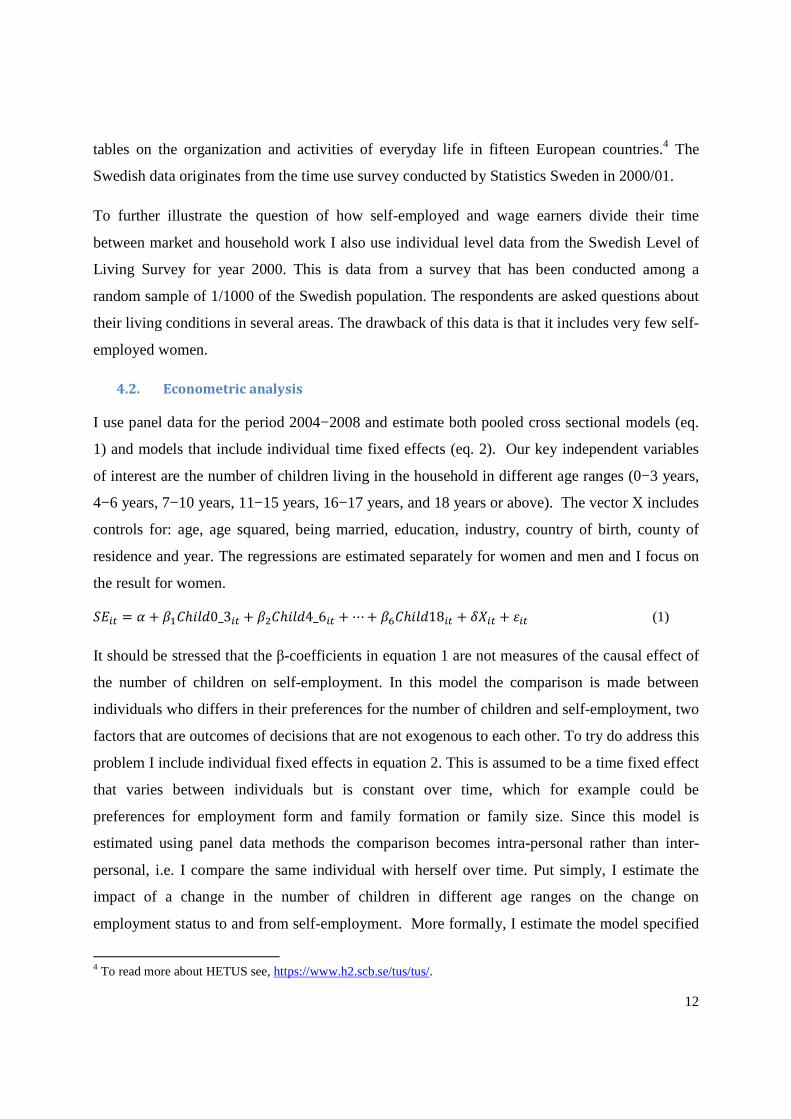
spread in the number of days among self-employed with an unincorporated firm. Drawing
histograms for the distribution of number of days in parental leave where each bin are 30 days, it
is clear that the share among self-employed (with an unincorporated firm) who takes 30 days or
less are higher compared to the other groups (see Figure 3).
22
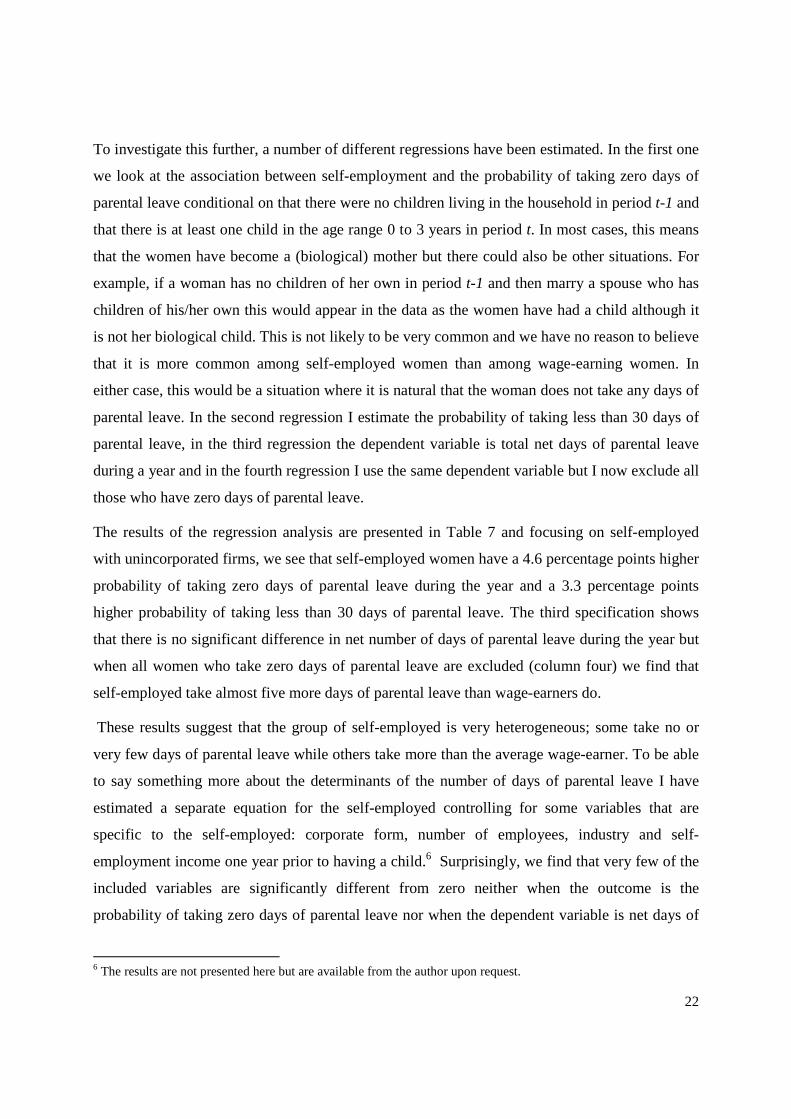
To investigate this further, a number of different regressions have been estimated. In the first one
we look at the association between self-employment and the probability of taking zero days of
parental leave conditional on that there were no children living in the household in period t-1 and
that there is at least one child in the age range 0 to 3 years in period t. In most cases, this means
that the women have become a (biological) mother but there could also be other situations. For
example, if a woman has no children of her own in period t-1 and then marry a spouse who has
children of his/her own this would appear in the data as the women have had a child although it
is not her biological child. This is not likely to be very common and we have no reason to believe
that it is more common among self-employed women than among wage-earning women. In
either case, this would be a situation where it is natural that the woman does not take any days of
parental leave. In the second regression I estimate the probability of taking less than 30 days of
parental leave, in the third regression the dependent variable is total net days of parental leave
during a year and in the fourth regression I use the same dependent variable but I now exclude all
those who have zero days of parental leave.
The results of the regression analysis are presented in Table 7 and focusing on self-employed
with unincorporated firms, we see that self-employed women have a 4.6 percentage points higher
probability of taking zero days of parental leave during the year and a 3.3 percentage points
higher probability of taking less than 30 days of parental leave. The third specification shows
that there is no significant difference in net number of days of parental leave during the year but
when all women who take zero days of parental leave are excluded (column four) we find that
self-employed take almost five more days of parental leave than wage-earners do.
These results suggest that the group of self-employed is very heterogeneous; some take no or
very few days of parental leave while others take more than the average wage-earner. To be able
to say something more about the determinants of the number of days of parental leave I have
estimated a separate equation for the self-employed controlling for some variables that are
specific to the self-employed: corporate form, number of employees, industry and self-
employment income one year prior to having a child.6 Surprisingly, we find that very few of the
included variables are significantly different from zero neither when the outcome is the
probability of taking zero days of parental leave nor when the dependent variable is net days of
6 The results are not presented here but are available from the author upon request.
23
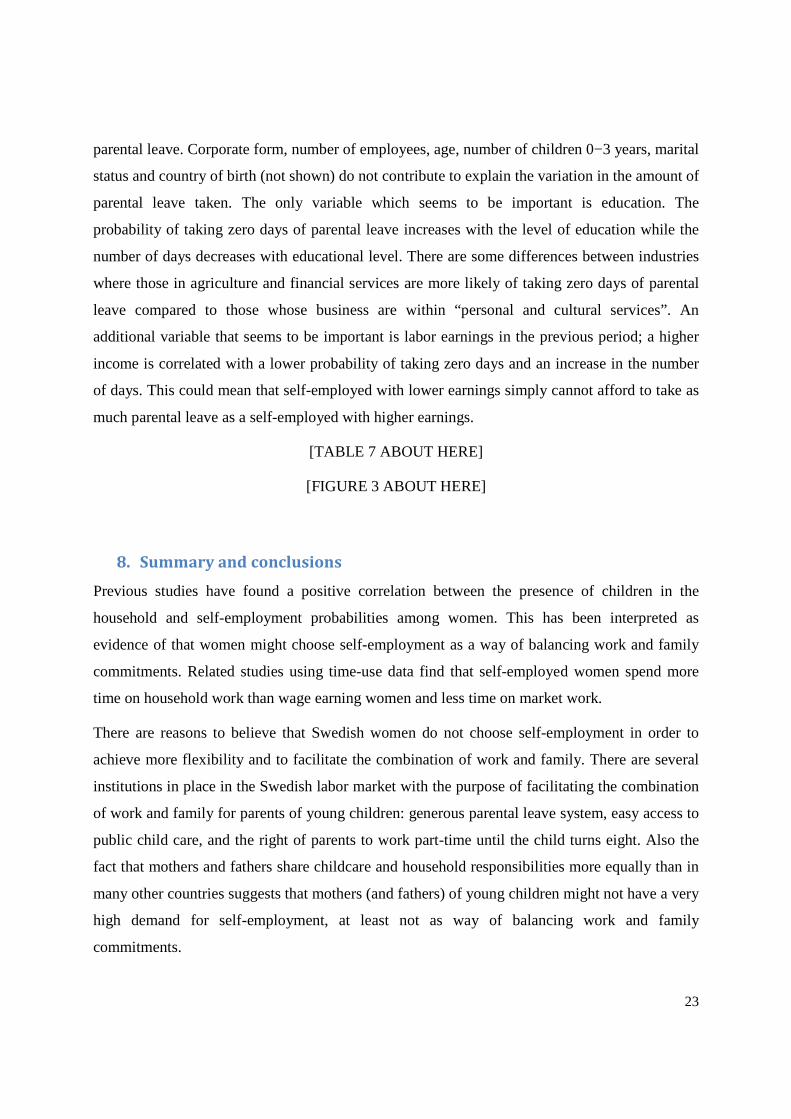
parental leave. Corporate form, number of employees, age, number of children 0−3 years, marital
status and country of birth (not shown) do not contribute to explain the variation in the amount of
parental leave taken. The only variable which seems to be important is education. The
probability of taking zero days of parental leave increases with the level of education while the
number of days decreases with educational level. There are some differences between industries
where those in agriculture and financial services are more likely of taking zero days of parental
leave compared to those whose business are within “personal and cultural services”. An
additional variable that seems to be important is labor earnings in the previous period; a higher
income is correlated with a lower probability of taking zero days and an increase in the number
of days. This could mean that self-employed with lower earnings simply cannot afford to take as
much parental leave as a self-employed with higher earnings.
[TABLE 7 ABOUT HERE]
[FIGURE 3 ABOUT HERE]
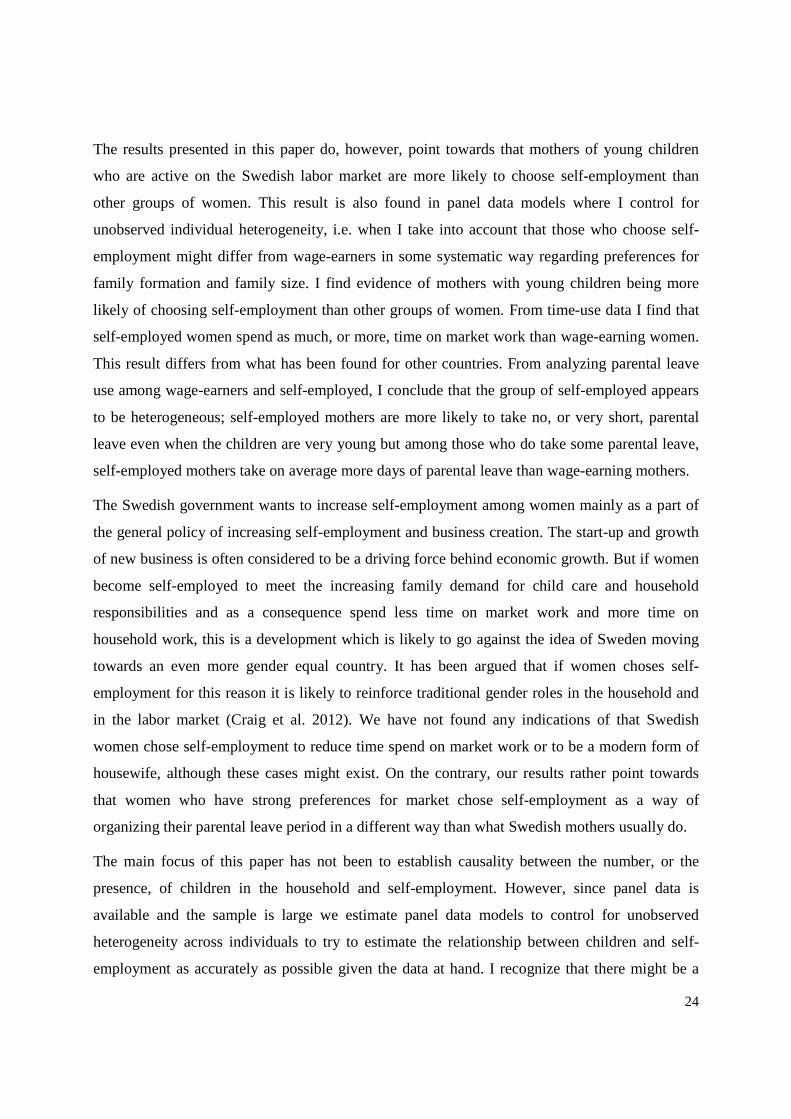
8. Summary and conclusions
Previous studies have found a positive correlation between the presence of children in the
household and self-employment probabilities among women. This has been interpreted as
evidence of that women might choose self-employment as a way of balancing work and family
commitments. Related studies using time-use data find that self-employed women spend more
time on household work than wage earning women and less time on market work.
There are reasons to believe that Swedish women do not choose self-employment in order to
achieve more flexibility and to facilitate the combination of work and family. There are several
institutions in place in the Swedish labor market with the purpose of facilitating the combination
of work and family for parents of young children: generous parental leave system, easy access to
public child care, and the right of parents to work part-time until the child turns eight. Also the
fact that mothers and fathers share childcare and household responsibilities more equally than in
many other countries suggests that mothers (and fathers) of young children might not have a very
high demand for self-employment, at least not as way of balancing work and family
commitments.
24
The results presented in this paper do, however, point towards that mothers of young children
who are active on the Swedish labor market are more likely to choose self-employment than
other groups of women. This result is also found in panel data models where I control for
unobserved individual heterogeneity, i.e. when I take into account that those who choose self-
employment might differ from wage-earners in some systematic way regarding preferences for
family formation and family size. I find evidence of mothers with young children being more
likely of choosing self-employment than other groups of women. From time-use data I find that
self-employed women spend as much, or more, time on market work than wage-earning women.
This result differs from what has been found for other countries. From analyzing parental leave
use among wage-earners and self-employed, I conclude that the group of self-employed appears
to be heterogeneous; self-employed mothers are more likely to take no, or very short, parental
leave even when the children are very young but among those who do take some parental leave,
self-employed mothers take on average more days of parental leave than wage-earning mothers.
The Swedish government wants to increase self-employment among women mainly as a part of
the general policy of increasing self-employment and business creation. The start-up and growth
of new business is often considered to be a driving force behind economic growth. But if women
become self-employed to meet the increasing family demand for child care and household
responsibilities and as a consequence spend less time on market work and more time on
household work, this is a development which is likely to go against the idea of Sweden moving
towards an even more gender equal country. It has been argued that if women choses self-
employment for this reason it is likely to reinforce traditional gender roles in the household and
in the labor market (Craig et al. 2012). We have not found any indications of that Swedish
women chose self-employment to reduce time spend on market work or to be a modern form of
housewife, although these cases might exist. On the contrary, our results rather point towards
that women who have strong preferences for market chose self-employment as a way of
organizing their parental leave period in a different way than what Swedish mothers usually do.
The main focus of this paper has not been to establish causality between the number, or the
presence, of children in the household and self-employment. However, since panel data is
available and the sample is large we estimate panel data models to control for unobserved
heterogeneity across individuals to try to estimate the relationship between children and self-
employment as accurately as possible given the data at hand. I recognize that there might be a

25
problem of reversed causality, i.e. that self-employment affects fertility, and I believe that this is
an important question that is on the agenda over questions for future research. It is, however,
reassuring that Noseleit (2014) who uses an instrumental variable approach only finds evidence
of there being a causal relationship between fertility and self-employment and not the other way
around.
26
Tables and Figures
Figure 1 Number of self-employed women (100’s) in Sweden 1970-2013
Source: Labor force survey (Statistics Sweden).
Table 1 Self-employment rate (%) and age of the children in the household 2008, women
Self-employed (total) Unincorporated firm
Incorporated firm
No children (in the household) and younger than 42
2.5 2.0 0.5
Children 0-3 years 4.0 3.1 0.9 Children 4-6 years 4.6 3.5 1.1 Children 7-10 years 5.0 3.6 1.4 Children 11-15 years 4.9 3.5 1.4 Children 16-17 years 3.9 2.7 1.2 Children above 18 4.3 3.1 1.2 No children (in the household) and older than 42
7.0 5.3 1.8
0
200
400
600
800
1000
1200
1400
19
70
19
73
19
76
19
79
19
82
19
85
19
88
19
91
19
94
19
98
20
01
20
04
20
07
20
10
20
13
Self-employed
Helper
Total
27
Table 2 Descriptive statistics, selected variables 2008
Wage-earners Self-employed Age (Std. Dev) 39.9
(13.7) 47.1
(11.1) Married 40.8 58.3 Number of children: Total 1.071 1.004 0-3 years 0.15 0.13 4-6 years 0.11 0.11 7-10 years 0.14 0.15 11-15 years 0.22 0.23 16-17 years 0.14 0.11 above 18 0.32 0.26 Education (%) Primary school less than 9 years Primary school 9(10) years 11.8 10.0 Upper secondary 2 years or less 22.3 26.0 Upper secondary more than 2 years 23.1 23.9 Higher education less than 3 years 15.6 15.7 Higher education 3 years or more 23.6 19.2 Post graduate education 0.7 0.5 Missing information 0.4 0.5 Industry (%) a Unknown 1.5 11.3 Agriculture 7.6 7.2 Manufacturing 0.5 4.4 Construction 1.1 1.8 Retailing and communication 11.7 14.8 Financial and business services 13.5 21.2 Education 15.9 2.3 Health care 27.4 7.4 Personal and cultural services 4.6 21.3 Total annual labor income (SEK) 210,056 164,610 Total annual labor income (inkl. transfers) (SEK)
221,400 172,21
Number of observations 2,304,762 114,840 a The industries “production of energy” and “public administration” are not shown due to a smaller share than 0.1 percent of self-employed.
28
Table 3 Probability of self-employment among employed women, 2004-2008
Pooled cross sections
Panel data Pooled cross sections
Panel data
Linear probability
model
Linear probability model with individual
fixed effects
Logit model (odds ratios)
Conditional fixed-effects logit model (odds ratios)
Number of children: 0-3 years 0.0049*** 0.0017*** 1.2033*** 1.1215*** (0.00015) (0.00015) (0.00503) (0.01879) 4-6 years 0.0031*** 0.0007*** 1.1154*** 1.0307 (0.00018) (0.00017) (0.00527) (0.01924) 7-10 years 0.0027*** 0.0007*** 1.0877*** 1.0271 (0.00016) (0.00015) (0.00414) (0.01795) 11-15 years 0.0007*** 0.0004*** 1.0263*** 1.0057 (0.00012) (0.00013) (0.00301) (0.01533) 16-17 years -0.0062*** -0.0011*** 0.9320*** 0.9365*** (0.00017) (0.00013) (0.00442) (0.01566) 18 plus 0.0002** -0.0000 0.9956 0.9515*** (0.00010) (0.00009) (0.00277) (0.01164) Observations 11,835,291 11,835,291 11,835,291 469,847 R-squared 0.114 0.037 Notes: The cross-sectional model includes controls for: age, age squared, married, education, industry (11 groups), country of birth (11 groups), county of residence (21) and year (5 years). The panel data models do not include controls for year and country of birth.
29
Table 4 Probability of self-employment among employed women, 2004-2008. Heterogeneous effects by education Primary school or upper
secondary 2 years or less Upper secondary more than 2 years or higher education less than 3
years
Higher education 3 years or more or post-graduate
education
Linear probability
model
Linear probability model with individual
fixed effects
Linear probability
model
Linear probability model with individual
fixed effects
Linear probability
model
Linear probability model with individual
fixed effects
Number of children:
0-3 years 0.0104*** 0.0016*** 0.0053*** 0.0018*** 0.0050*** 0.0019*** (0.00033) (0.00031) (0.00024) (0.00024) (0.00023) (0.00026) 4-6 years 0.0067*** 0.0018*** 0.0027*** 0.0007*** 0.0045*** 0.0004 (0.00034) (0.00032) (0.00030) (0.00028) (0.00032) (0.00034) 7-10 years 0.0044*** 0.0011*** 0.0029*** 0.0011*** 0.0039*** 0.0011*** (0.00026) (0.00027) (0.00026) (0.00026) (0.00031) (0.00035) 11-15 years 0.0010*** 0.0004** 0.0007*** 0.0011*** 0.0025*** 0.0009*** (0.00018) (0.00021) (0.00021) (0.00022) (0.00027) (0.00032) 16-17 years -0.0093*** -0.0017*** -0.0016*** 0.0001 0.0024*** 0.0004 (0.00024) (0.00021) (0.00032) (0.00024) (0.00046) (0.00036) 18 plus 0.0016*** 0.0004*** -0.0015*** -0.0003* 0.0007*** -0.0000 (0.00017) (0.00016) (0.00016) (0.00015) (0.00026) (0.00025) Observations 4,624,021 4,624,021 4,492,838 4,492,838 2,667,299 2,667,299 R-squared 0.141 0.049 0.102 0.033 0.098 0.049 Notes: The cross-sectional model includes controls for: age, age squared, married, education, industry (11 groups), country of birth (11 groups), county of residence (21) and year (5 years). The panel data models do not include controls for year and country of birth.
30
Figure 2 Time spent during an ordinary work day on market work
Source: The Harmonized European Time Use Survey
Figure 3 Time spent during an ordinary work day on household work
Source: The Harmonized European Time Use Survey
00:00
01:12
02:24
03:36
04:48
06:00
07:12
08:24
09:36
Wage-earners
Self-employed
00:00
00:28
00:57
01:26
01:55
02:24
02:52
03:21
03:50
04:19
Wage-earners
Self-employed
31
Table 5 Summary of descriptive results of time spend on market and household work
Women Self-
employed Total
Self-employed without
employees
Self-employed without
employees
Wage-earners
Hours of market work Mångs (2013) (women with children 0-3 years)
37.8 - - 35.9
Johansson Sevä and Öun (2014) - 38.6 45.8 38.3 Level of Living Survey 2000 (own calculations)
41.1 - - 35.8
Harmonized European time use surveya (own cacluations)
35.0 - - 36.4
Hours of household work Mångs (2013) (women with children 0-3 years)
12.1 - - 13.2
Level of Living Survey 2000 (own calculations)
14.9 - - 14.8
Harmonized European time use surveya (own cacluations)
1.44h/day 1.34h/day
Men Self-
employed Total
Self-employed without
employees
Self-employed without
employees
Wage-earners
Hours of market work Mångs (2013) (men with children 0-3 years)
44.6 41.1
Johansson Sevä and Öun (2014) - 45.4 50.8 42.8 Level of Living Survey 2000 (own calculations)
49.6 - - 39.4
Harmonized European time use surveya (own cacluations)
42.1 40.7
Hours of household work Mångs (2013) (women with children 0-3 years)
9.1 - - 10.0
Level of Living Survey 2000 (own calculations)
5.5 - - 6.8
Harmonized European time use surveya (own cacluations)
0.44h/day - - 0.52h/day
a This is based on working hours during an ordinary working day which is 7.28 hours for wage-earning
women and 7.0 hours for self-employed women and 8.14 hours for wage-earning men and 8.42 hours for self-employed men.
32
Table 6 Regression analyzes for time spent on market and household work, Level of Living survey 2000, women.
Hours of Hours of Hours of Hours of WOMEN market work market work housework housework Wage-earner Ref. Ref. Ref. Ref. Self-employed, all 6.078*** - -0.960 - (1.483) (0.941) Self-employed, - 4.959** - -1.478 without employees (2.023) (1.280) Self-employed, - 7.334*** - -0.424 with employees (2.143) (1.295) Partner wage-earner Ref. Ref. Ref. Ref. Partner self- employed -1.412** -1.446** 2.013*** 1.995*** (0.670) (0.676) (0.677) (0.678) Partner other status -0.497 -0.505 -2.088*** -2.091*** (0.680) (0.681) (0.748) (0.748) Constant 38.311*** 38.328*** 11.225*** 11.244*** (1.092) (1.089) (1.134) (1.133) Observations 1,556 1,556 1,318 1,318 R-squared 0.097 0.098 0.140 0.141 MEN Hours of Hours of Hours of Hours of market work market work housework housework Wage-earner Self-employed, all 10.520*** - -1.290*** - (0.923) (0.417) Self-employed, - 8.403*** - -1.946*** without employees (1.526) (0.514) Self-employed, - 12.402*** - -0.728 with employees (1.032) (0.595) Partner wage-earner Partner self- employed -2.979** -2.710** 0.170 0.257 (1.353) (1.335) (0.666) (0.661) Partner other status -0.540 -0.580 -0.050 -0.063 (0.431) (0.425) (0.308) (0.308) Constant 40.627*** 40.735*** 6.686*** 6.744*** (0.702) (0.695) (0.791) (0.793) Observations 1,764 1,764 1,398 1,398 R-squared 0.232 0.241 0.074 0.076
Note: All models include controls for: number of young children (0-9 years), having a partner (married/cohabitating), age, education, and region. Robust standard errors in parentheses *** p<0.01, ** p<0.05, * p<0.1
33
Figure 3 Distribution of days of parental leave
Table 7 Days of parental leave for women with no children in the household in period t-1 and at least one child in the age range 0-3 in period t
No days of parental leave
Fewer than 30 days of
parental leave
Number of days of
parental leave
Number of days of
parental leave if greater than
zero Wage-earners Ref. Ref. Ref. Ref. Self-employed 0.0463*** 0.0327*** -1.3049 4.9650*** (unincorporated firm) (0.00514) (0.00643) (1.35858) (1.33943) Self-employed 0.0217** 0.0247** -2.8761 -0.2738 (incorporated firm) (0.00843) (0.01165) (2.32602) (2.28654) Additional controls Yes Yes Yes Yes
Number of obs. 153,254 153,254 153,254 144,250 R2 0.017 0.009 0.020 0.022 Note: All models include controls for: number of children 0-3 years, age, age squared, married, education, industry (11 groups), country of birth (11 groups), county of residence (21) and year (5 years).
34
References
Albrecht, James, Anders Björklund and Susan Vroman (2003), “Is There a Glass Ceiling in Sweden”, Journal of Labor Economics, Vol. 21(1), pp. 145-177.
Angrist, Joshua D. And William N. Evans (1998), “Children and their Parents’ Labor Supply: Evidence from Exogenous Variations in Family Size”, American Economic Review, Vol. 88(3), pp. 450-477.
Anxo, Dominique, Thomas Ericson and Andreas Mångs (2010), ”Self-employment and the gender division of domestic and market work in Sweden”, Mimeo, CAFO, Linnéuniversitetet.
Blanchflower, David G. (2000), “Self-employment in OECD countries”, Labour Economics, Vol. 7(5), pp. 471-505.
Boden, Richard J. (1996), “Gender and Self-Employment Selection: An Empirical Assessment”, Journal of Socio-Economics, Vol. 25(6), pp. 671-682.
Boden, Richard J. (1999), “Flexible Working Hours, Family Responsibilities, and Female Self-Employment”, American Journal of Economics and Sociology, Vol. 58(1), pp. 71-83.
Broussard, Nzinga H., Ralph Chami, and Gregory D. Hess (2013), “(Why) Do self-employed parents have more children?” Review of economics of the Household, DOI 10.1007/s11150-013-9190-0.
Budig, Michelle J (2006), “Intersections on the Road to Self-Employment: Gender, Family and Occupational Class”, Social Forces, Vol. 84(4), pp. 2223-2239.
Carr, Deborah (1996), “Two Paths to Self-Employment? Women´s and Men´s Self-Employment in the United States, 1980”, Work and Occupations, Vol. 23(1), pp. 26-53.
Chamberlain, Gary (1980), “Analysis of covariance with qualitative data”, Review of Economic Studies Vol. 47(1), pp. 225–238.
Chamberlain, Gary (1984), Panel data. In: Griliches, Z., Intriligator, M. (Eds.), Handbook of Econometrics, vol. 2. North-Holland, Amsterdam
Davis, Steven J. and Magnus Henrekson (1999), “Explaining national differences in the Size and industry distribution of employment”, Small Business Economics, Vol. 12(1), pp. 59-83.
Datta Gupta, Nabantia, Nina Smith and Mette Verner (2008), ”The impact of Nordic countries’ family friendly policies on employment, wages, and children”, Review of Economics of the Household, Vol. 6(1), pp.65-89.
Devine, Theresa (1994), “Characteristics of Self-Employed Women in the United States”, Monthly Labor Review, Vol. 117(3), pp. 20-34.
35
Ferrarini, Tommy, Walter Korpi and Stefan Englund (2013), “Women’s Opportunities under Different Family Policy Constellations: Gender, class, and Inequality Tradeoffs in Western Coutries Re-examined”, Social Politics, Vol. 20(1), pp. 1-40.
Fölster, Stefan (2002), “Do lower taxes stimulate self-employment?”, Small Business Economics, Vol. 19(2), pp. 135-145.
Föräldraledighetslagen, SFS 1995:584
Gimenez-Nadal, Jose Alberto Molina, and Raquel Ortega (2012), “Self-employed mothers and the work-family conflict”, Applied Economics, Vol. 44(17), pp. 2133-2147
Gurley-Calvez, Tami, Amelia Biehl, and Katherine Harper (2009), ”Time-Use Patterns and Women Entrepreneurship”, American Economic Review: Papers and Proceedings, Vol. 99(2), pp. 139-144.
Hundley, Greg (2000), “Male/Female Earnings Differences in Self-Employment: The Effects of Marriage, Children, and the Household Division of Labor”, Industrial and Labor Relations Review, Vol. 54(1), pp. 95-114.
Johansson Sevä, Ingemar and Ida Öun (2014), “Self-employment as a strategy to reduce work-family conflict? The importance of Family/Lifestyle motives”, unpublished work, Umeå University.
Lombard, Karen V (2001), “Female self-employment and demand for flexible, nonstandard work schedules”, Economic Inquiry, Vol. 39(2), pp. 214-237
Maddala, G.S., (1987), “Limited dependent variable models using panel data”, Journal of Human Resources, Vol. 22(3), pp. 307–338.
Mångs, Andreas (2013), Self-Employment in Sweden: A Gender Perspective, Linnaeus University Dissertations No 146/213, Växjö: Linnaeus University Press
Nordenmark, Mikael, Stig Vinberg and Mattias Strandh (2012), “Job control and demands, work-life balance and well-being among self-employed men and women in Europe”, Vulnerable Groups & Inclusion, Vol. 3, http://dx.doi.org/10.3402/vgi.v3i0.18896
Noseleit, Florian (2014),”Female self-employment and children”, Small Business Economics, Vol. 43(3), pp. 549-569.
OECD (2012), www.stats.oecd.org. 2014-05-23
Rønsen, Marit (2014), “Children and family: A barrier or an incentive to female self-employment in Norway”, International Labour Review, Vol. 153(2), pp. 337-349.
Torrini, Roberto (2005), “Cross-country differences in self-employment rates: the role of institutions”, Labour Economics, Vol. 12(5), pp. 661-683.

36
Wellington, Alison J. (2006), ”Self-employment: the new solution for balancing family and career?”, Labour Economics, Vol. 13(3), pp. 357-386.
Wennemo Lanninger, Alma and Marianne Sundström (2014), “Part-Time Work in the Nordic region: Part-time work, gender and economic distribution in the Nordic countries”, TemaNord 2014:503, Nordic Council of Ministers.
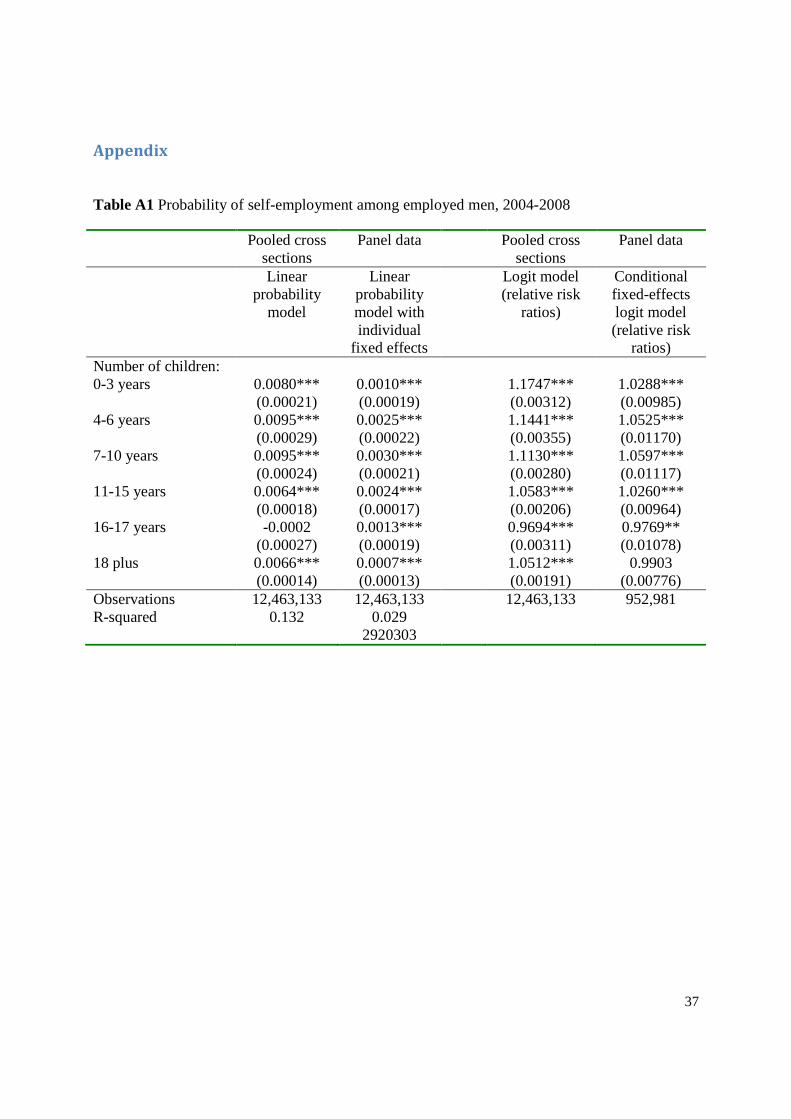
37
Appendix
Table A1 Probability of self-employment among employed men, 2004-2008
Pooled cross sections
Panel data Pooled cross sections
Panel data
Linear probability
model
Linear probability model with individual
fixed effects
Logit model (relative risk
ratios)
Conditional fixed-effects logit model (relative risk
ratios) Number of children: 0-3 years 0.0080*** 0.0010*** 1.1747*** 1.0288*** (0.00021) (0.00019) (0.00312) (0.00985) 4-6 years 0.0095*** 0.0025*** 1.1441*** 1.0525*** (0.00029) (0.00022) (0.00355) (0.01170) 7-10 years 0.0095*** 0.0030*** 1.1130*** 1.0597*** (0.00024) (0.00021) (0.00280) (0.01117) 11-15 years 0.0064*** 0.0024*** 1.0583*** 1.0260*** (0.00018) (0.00017) (0.00206) (0.00964) 16-17 years -0.0002 0.0013*** 0.9694*** 0.9769** (0.00027) (0.00019) (0.00311) (0.01078) 18 plus 0.0066*** 0.0007*** 1.0512*** 0.9903 (0.00014) (0.00013) (0.00191) (0.00776) Observations 12,463,133 12,463,133 12,463,133 952,981 R-squared 0.132 0.029 2920303