Embed Size (px)
Citation preview
ASIAN DEVELOPMENT BANK
AsiAn Development BAnk6 ADB Avenue, Mandaluyong City1550 Metro Manila, Philippineswww.adb.org
Female Labor Force Participation in Asia: Indonesia Country Study
This paper uses over 20 years of data from Indonesia’s labor force survey to study trends in and constraints to female labor force participation. We also survey existing evidence, identify data gaps, and outline a research-policy evaluation of female-centered vocational training and job placement services, which may be effective tools to increase female labor force participation.
About the Asian Development Bank
ADB’s vision is an Asia and Pacific region free of poverty. Its mission is to help its developing member countries reduce poverty and improve the quality of life of their people. Despite the region’s many successes, it remains home to the majority of the world’s poor. ADB is committed to reducing poverty through inclusive economic growth, environmentally sustainable growth, and regional integration.
Based in Manila, ADB is owned by 67 members, including 48 from the region. Its main instruments for helping its developing member countries are policy dialogue, loans, equity investments, guarantees, grants, and technical assistance.
FemALe LABor ForCe PArtICIPAtIon In ASIA: InDoneSIA Country StuDySimone Schaner and Smita Das
adb economicsworking paper series
no. 474
February 2016
ADB Economics Working Paper Series
Female Labor Force Participation in Asia: Indonesia Country Study Simone Schaner and Smita Das
No. 474 | February 2016
Simone Schaner ([email protected]) is Assistant Professor of Economics at Dartmouth College. Smita Das ([email protected]) is Research Fellow at Evidence for Policy Design, Harvard Kennedy School of Government. The study was conducted under the Asian Development Bank's technical assistance on economic analysis for gender and development (RDTA 8620).
ASIAN DEVELOPMENT BANK
Asian Development Bank 6 ADB Avenue, Mandaluyong City 1550 Metro Manila, Philippines www.adb.org
© 2016 by Asian Development Bank February 2016 ISSN 2313-6537 (Print), 2313-6545 (e-ISSN) Publication Stock No. WPS167885-2
The views expressed in this paper are those of the authors and do not necessarily reflect the views and policies of the Asian Development Bank (ADB) or its Board of Governors or the governments they represent.
ADB does not guarantee the accuracy of the data included in this publication and accepts no responsibility for any consequence of their use.
By making any designation of or reference to a particular territory or geographic area, or by using the term “country” in this document, ADB does not intend to make any judgments as to the legal or other status of any territory or area.
Note: In this publication, “$” refers to US dollars.
The ADB Economics Working Paper Series is a forum for stimulating discussion and eliciting feedback on ongoing and recently completed research and policy studies undertaken by the Asian Development Bank (ADB) staff, consultants, or resource persons. The series deals with key economic and development problems, particularly those facing the Asia and Pacific region; as well as conceptual, analytical, or methodological issues relating to project/program economic analysis, and statistical data and measurement. The series aims to enhance the knowledge on Asia’s development and policy challenges; strengthen analytical rigor and quality of ADB’s country partnership strategies, and its subregional and country operations; and improve the quality and availability of statistical data and development indicators for monitoring development effectiveness.
The ADB Economics Working Paper Series is a quick-disseminating, informal publication whose titles could subsequently be revised for publication as articles in professional journals or chapters in books. The series is maintained by the Economic Research and Regional Cooperation Department.
CONTENTS TABLES AND FIGURES iv ABSTRACT v EXECUTIVE SUMMARY vi I. INTRODUCTION 1 II. CONCEPTUAL FRAMEWORK AND COUNTRY CONTEXT 2 A. Conceptual Framework 2 B. Country Context 3 III. LITERATURE REVIEW 5 IV. EMPIRICAL ANALYSIS 7 A. Data 7 B. Diagnostic Assessment 9 V. THE WAY FORWARD: POLICY AND DATA 30 A. The Need for Data Support 30 B. The Need for Research on Specific Interventions 31 C. Policy Focus: Job Matching Services and Vocational Training 31 VI. CONCLUSION 33 APPENDIX 35 REFERENCES 39
TABLES AND FIGURES TABLES 1 Summary Statistics from Selected Years of the SAKERNAS 8 2 Summary Statistics for Women in the 2012 Indonesia DHS 9 3 Relationship between Class of Worker and the Women's Empowerment Index 20 4 Relationship between FLFP, Marriage, and Fertility 22 5 Impact of Controlling for Observable Characteristics on the Log Gender Wage Gap 28 FIGURES 1 Female Labor Supply and Per Capita GDP over Time 1 2 A Conceptual Framework for Female Labor Supply 2 3 The Cross-Country Relationship between Income and Gender Equality 4 4 Trends in Type of Work Performed by Female Workers over Time 10 5 Hours Worked by Employment Category and Geography 11 6 Life Cycle Changes in FLFP by Birth Cohort 12 7 Educational Attainment by Birth Year 14 8 FLFP over Time by Educational Attainment 15 9 FLFP by Household Wealth 16 10 Educational Attainment by Work Status 18 11 Correlation between Women's Empowerment Index and Type of Employment 19 12 Share of Women Who Think that a Husband is Justified in Hitting/Beating His Wife
For Going Out Without His Permission, by Province 24 13 Gender Wage and Employment Ratios over Time 26 14 Decomposition of the Gender Wage Gap over Time—Wage Workers 27 15 Female Share of Employment by Occupation 29 16 FLFP and Latent Labor Supply among Women by Demographic Characteristics 30 17 FLFP for Vocational and Regular Secondary School Graduates 32 A1 Trends in Type of Work Performed by Male Workers over Time 35 A2 Life Cycle Changes in FLFP by Birth Cohort—Women in Rural Areas 36 A3 Life Cycle Changes in FLFP by Birth Cohort—Women in Urban Areas 37
ABSTRACT This paper uses over 20 years of data from Indonesia’s labor force survey to study trends in female labor force participation (FLFP). We find that younger women in urban areas have increased their labor force participation in recent years, largely through wage employment, while younger women in rural areas have reduced their labor force participation, largely by opting out of informal, unpaid employment. We find evidence that wage jobs are more desirable than other types of work and that many women exit wage work due to family and childcare constraints. We outline a research-policy evaluation of female-centered vocational training and job placement services, which may be effective tools to increase FLFP. Keywords: gender, Indonesia, labor force participation JEL codes: J16, J22, O12
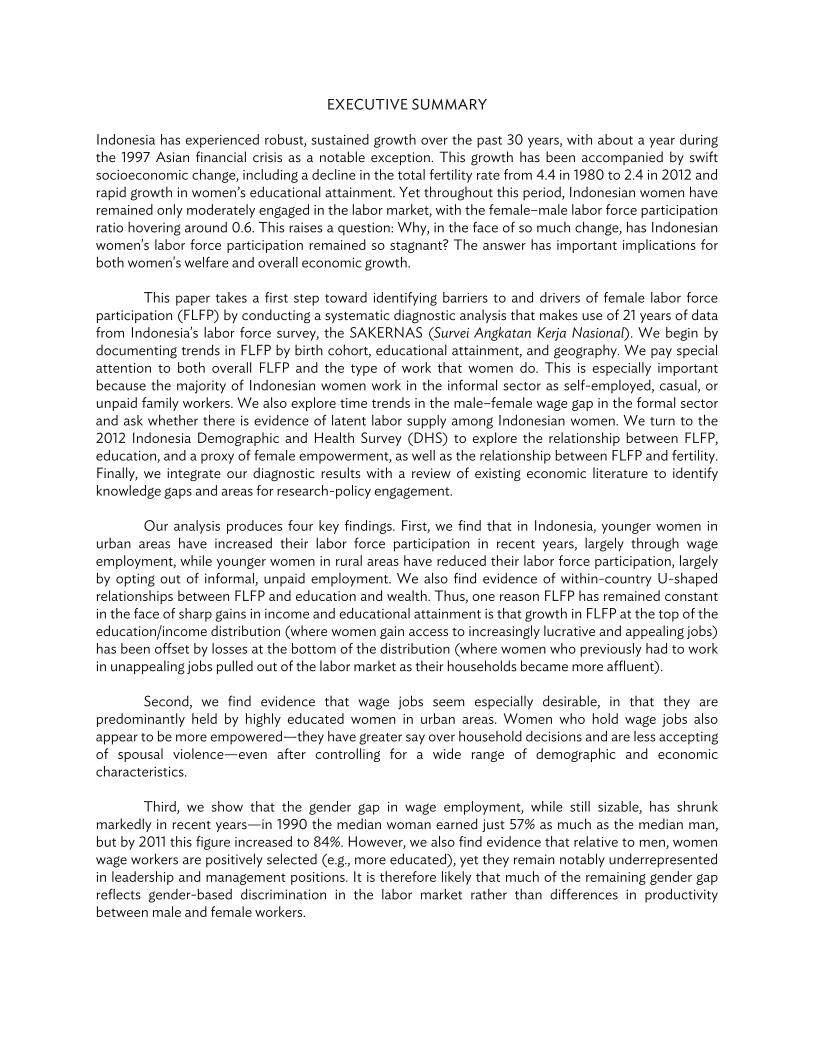
EXECUTIVE SUMMARY Indonesia has experienced robust, sustained growth over the past 30 years, with about a year during the 1997 Asian financial crisis as a notable exception. This growth has been accompanied by swift socioeconomic change, including a decline in the total fertility rate from 4.4 in 1980 to 2.4 in 2012 and rapid growth in women’s educational attainment. Yet throughout this period, Indonesian women have remained only moderately engaged in the labor market, with the female–male labor force participation ratio hovering around 0.6. This raises a question: Why, in the face of so much change, has Indonesian women's labor force participation remained so stagnant? The answer has important implications for both women's welfare and overall economic growth.
This paper takes a first step toward identifying barriers to and drivers of female labor force participation (FLFP) by conducting a systematic diagnostic analysis that makes use of 21 years of data from Indonesia's labor force survey, the SAKERNAS (Survei Angkatan Kerja Nasional). We begin by documenting trends in FLFP by birth cohort, educational attainment, and geography. We pay special attention to both overall FLFP and the type of work that women do. This is especially important because the majority of Indonesian women work in the informal sector as self-employed, casual, or unpaid family workers. We also explore time trends in the male–female wage gap in the formal sector and ask whether there is evidence of latent labor supply among Indonesian women. We turn to the 2012 Indonesia Demographic and Health Survey (DHS) to explore the relationship between FLFP, education, and a proxy of female empowerment, as well as the relationship between FLFP and fertility. Finally, we integrate our diagnostic results with a review of existing economic literature to identify knowledge gaps and areas for research-policy engagement.
Our analysis produces four key findings. First, we find that in Indonesia, younger women in
urban areas have increased their labor force participation in recent years, largely through wage employment, while younger women in rural areas have reduced their labor force participation, largely by opting out of informal, unpaid employment. We also find evidence of within-country U-shaped relationships between FLFP and education and wealth. Thus, one reason FLFP has remained constant in the face of sharp gains in income and educational attainment is that growth in FLFP at the top of the education/income distribution (where women gain access to increasingly lucrative and appealing jobs) has been offset by losses at the bottom of the distribution (where women who previously had to work in unappealing jobs pulled out of the labor market as their households became more affluent).
Second, we find evidence that wage jobs seem especially desirable, in that they are
predominantly held by highly educated women in urban areas. Women who hold wage jobs also appear to be more empowered—they have greater say over household decisions and are less accepting of spousal violence—even after controlling for a wide range of demographic and economic characteristics.
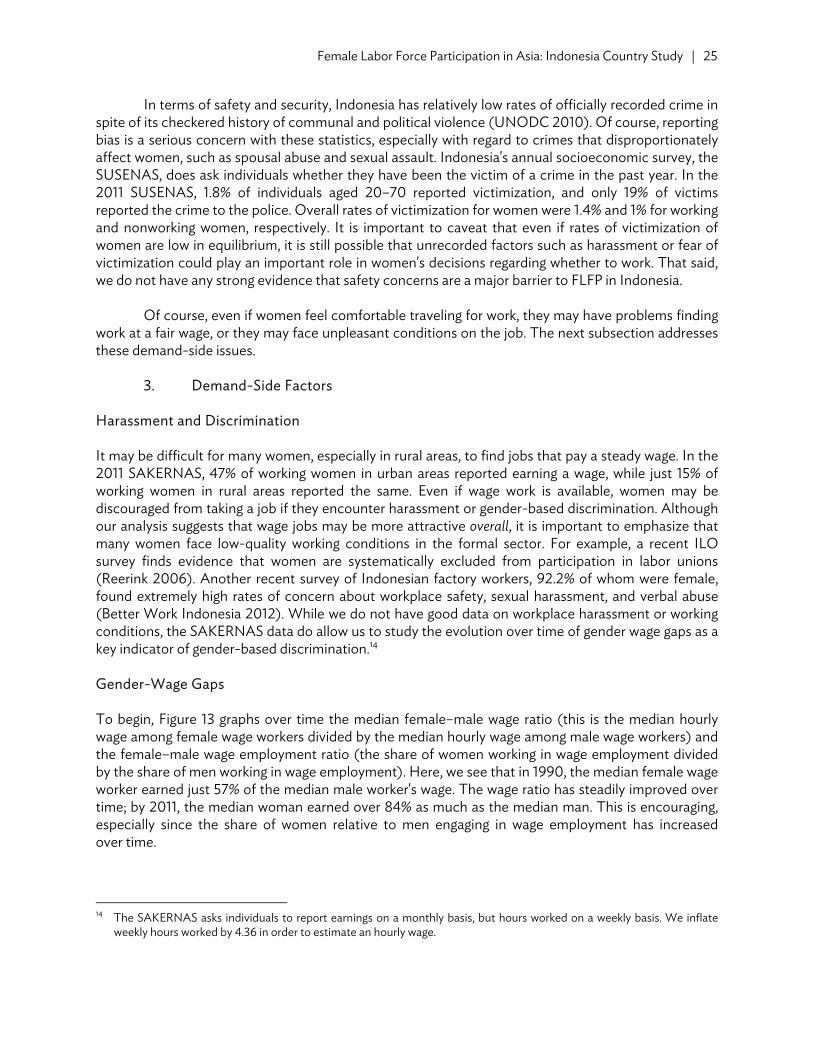
Third, we show that the gender gap in wage employment, while still sizable, has shrunk
markedly in recent years—in 1990 the median woman earned just 57% as much as the median man, but by 2011 this figure increased to 84%. However, we also find evidence that relative to men, women wage workers are positively selected (e.g., more educated), yet they remain notably underrepresented in leadership and management positions. It is therefore likely that much of the remaining gender gap reflects gender-based discrimination in the labor market rather than differences in productivity between male and female workers.
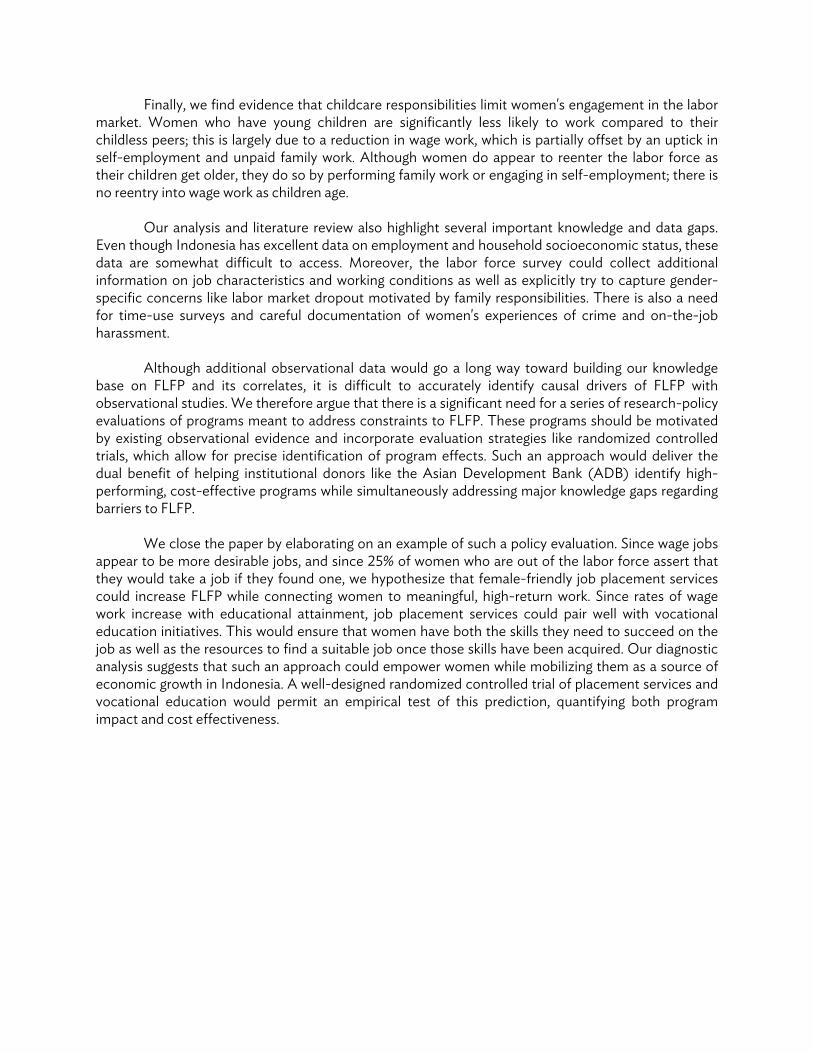
Finally, we find evidence that childcare responsibilities limit women's engagement in the labor market. Women who have young children are significantly less likely to work compared to their childless peers; this is largely due to a reduction in wage work, which is partially offset by an uptick in self-employment and unpaid family work. Although women do appear to reenter the labor force as their children get older, they do so by performing family work or engaging in self-employment; there is no reentry into wage work as children age.
Our analysis and literature review also highlight several important knowledge and data gaps.
Even though Indonesia has excellent data on employment and household socioeconomic status, these data are somewhat difficult to access. Moreover, the labor force survey could collect additional information on job characteristics and working conditions as well as explicitly try to capture gender-specific concerns like labor market dropout motivated by family responsibilities. There is also a need for time-use surveys and careful documentation of women's experiences of crime and on-the-job harassment.
Although additional observational data would go a long way toward building our knowledge
base on FLFP and its correlates, it is difficult to accurately identify causal drivers of FLFP with observational studies. We therefore argue that there is a significant need for a series of research-policy evaluations of programs meant to address constraints to FLFP. These programs should be motivated by existing observational evidence and incorporate evaluation strategies like randomized controlled trials, which allow for precise identification of program effects. Such an approach would deliver the dual benefit of helping institutional donors like the Asian Development Bank (ADB) identify high-performing, cost-effective programs while simultaneously addressing major knowledge gaps regarding barriers to FLFP.
We close the paper by elaborating on an example of such a policy evaluation. Since wage jobs
appear to be more desirable jobs, and since 25% of women who are out of the labor force assert that they would take a job if they found one, we hypothesize that female-friendly job placement services could increase FLFP while connecting women to meaningful, high-return work. Since rates of wage work increase with educational attainment, job placement services could pair well with vocational education initiatives. This would ensure that women have both the skills they need to succeed on the job as well as the resources to find a suitable job once those skills have been acquired. Our diagnostic analysis suggests that such an approach could empower women while mobilizing them as a source of economic growth in Indonesia. A well-designed randomized controlled trial of placement services and vocational education would permit an empirical test of this prediction, quantifying both program impact and cost effectiveness.
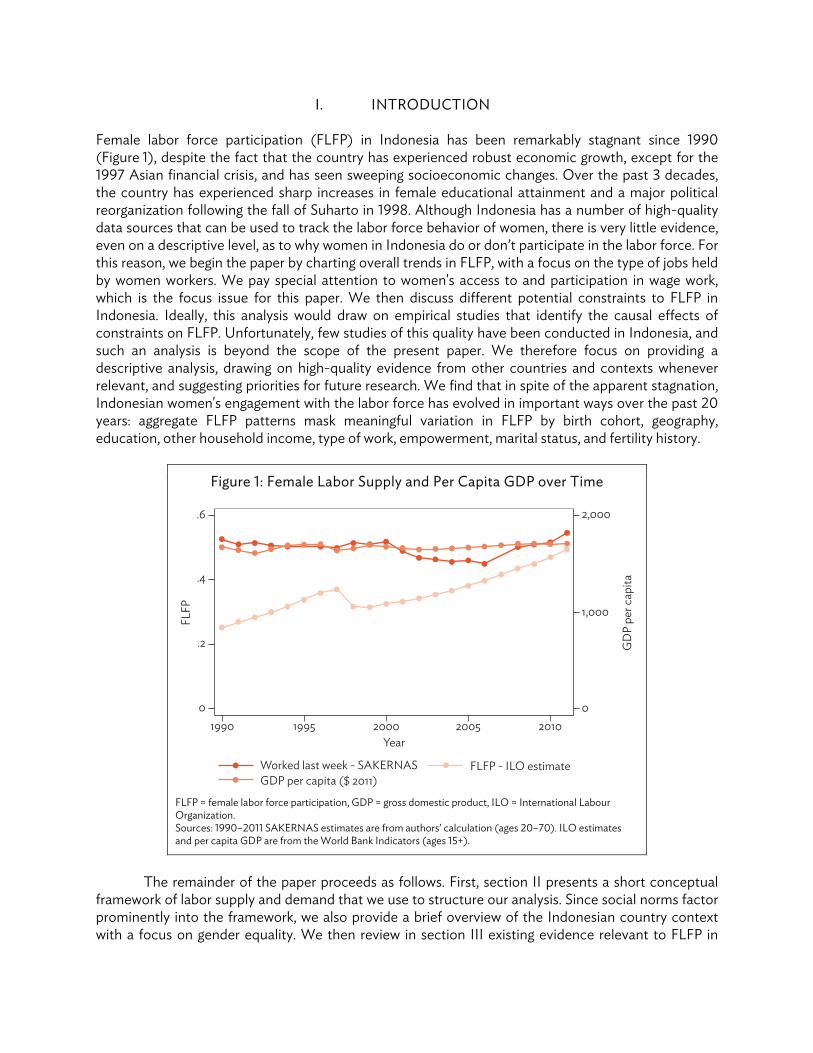
I. INTRODUCTION Female labor force participation (FLFP) in Indonesia has been remarkably stagnant since 1990 (Figure 1), despite the fact that the country has experienced robust economic growth, except for the 1997 Asian financial crisis, and has seen sweeping socioeconomic changes. Over the past 3 decades, the country has experienced sharp increases in female educational attainment and a major political reorganization following the fall of Suharto in 1998. Although Indonesia has a number of high-quality data sources that can be used to track the labor force behavior of women, there is very little evidence, even on a descriptive level, as to why women in Indonesia do or don’t participate in the labor force. For this reason, we begin the paper by charting overall trends in FLFP, with a focus on the type of jobs held by women workers. We pay special attention to women's access to and participation in wage work, which is the focus issue for this paper. We then discuss different potential constraints to FLFP in Indonesia. Ideally, this analysis would draw on empirical studies that identify the causal effects of constraints on FLFP. Unfortunately, few studies of this quality have been conducted in Indonesia, and such an analysis is beyond the scope of the present paper. We therefore focus on providing a descriptive analysis, drawing on high-quality evidence from other countries and contexts whenever relevant, and suggesting priorities for future research. We find that in spite of the apparent stagnation, Indonesian women's engagement with the labor force has evolved in important ways over the past 20 years: aggregate FLFP patterns mask meaningful variation in FLFP by birth cohort, geography, education, other household income, type of work, empowerment, marital status, and fertility history.
Figure 1: Female Labor Supply and Per Capita GDP over Time
FLFP = female labor force participation, GDP = gross domestic product, ILO = International Labour Organization. Sources: 1990–2011 SAKERNAS estimates are from authors’ calculation (ages 20–70). ILO estimates and per capita GDP are from the World Bank Indicators (ages 15+).
The remainder of the paper proceeds as follows. First, section II presents a short conceptual
framework of labor supply and demand that we use to structure our analysis. Since social norms factor prominently into the framework, we also provide a brief overview of the Indonesian country context with a focus on gender equality. We then review in section III existing evidence relevant to FLFP in
FLFP
19900
.2
.4
.6
1995
Worked last week - SAKERNASGDP per capita ($ 2011)
FLFP - ILO estimate
2000Year
2005 20100
1,000
2,000
GD
P pe
r cap
ita
2 | ADB Economics Working Paper Series No. 474
Indonesia. Section IV presents our diagnostic analysis. In section V, we summarize policy implications and highlight areas for future research. Section VI concludes the paper.
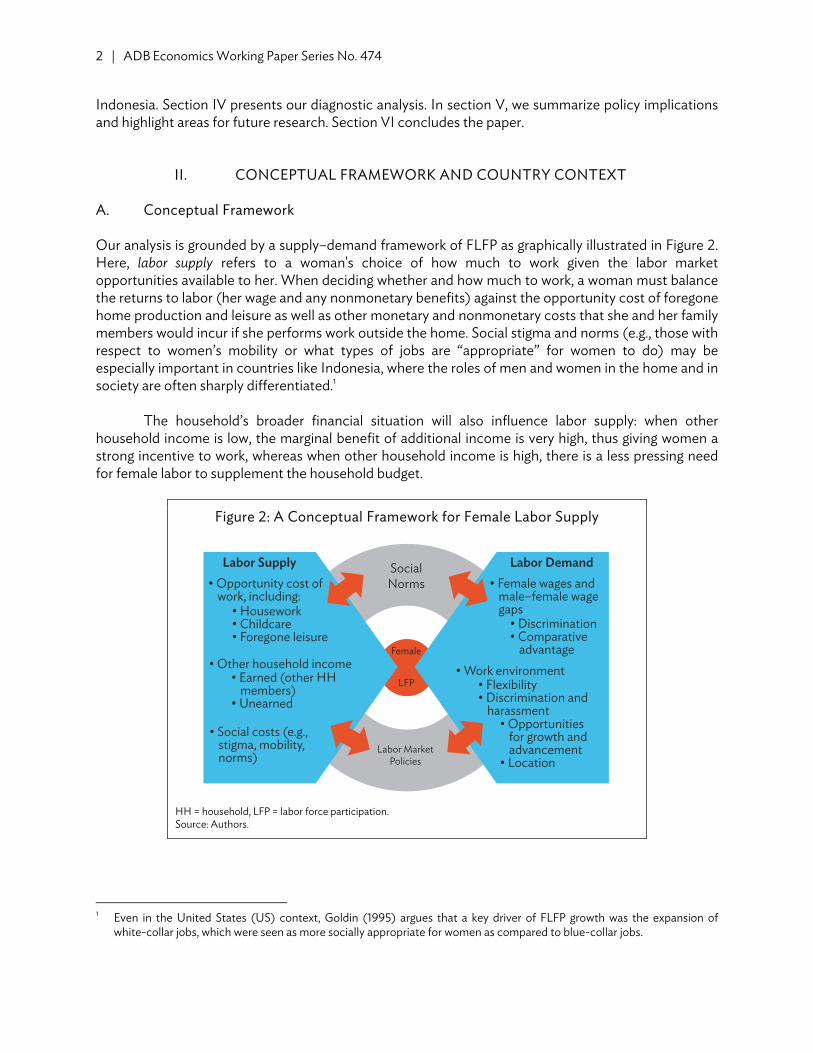
II. CONCEPTUAL FRAMEWORK AND COUNTRY CONTEXT A. Conceptual Framework Our analysis is grounded by a supply–demand framework of FLFP as graphically illustrated in Figure 2. Here, labor supply refers to a woman's choice of how much to work given the labor market opportunities available to her. When deciding whether and how much to work, a woman must balance the returns to labor (her wage and any nonmonetary benefits) against the opportunity cost of foregone home production and leisure as well as other monetary and nonmonetary costs that she and her family members would incur if she performs work outside the home. Social stigma and norms (e.g., those with respect to women’s mobility or what types of jobs are “appropriate” for women to do) may be especially important in countries like Indonesia, where the roles of men and women in the home and in society are often sharply differentiated.1
The household’s broader financial situation will also influence labor supply: when other household income is low, the marginal benefit of additional income is very high, thus giving women a strong incentive to work, whereas when other household income is high, there is a less pressing need for female labor to supplement the household budget.
Figure 2: A Conceptual Framework for Female Labor Supply
HH = household, LFP = labor force participation. Source: Authors.
1 Even in the United States (US) context, Goldin (1995) argues that a key driver of FLFP growth was the expansion of
white-collar jobs, which were seen as more socially appropriate for women as compared to blue-collar jobs.
Female
LFP
Labor DemandSocialNorms
Labor MarketPolicies
Labor Supply• Female wages and
male–female wage gaps
• Opportunity cost of work, including:
• Housework• Childcare• Foregone leisure
• Earned (other HH members)
• Unearned
• Other household income
• Social costs (e.g., stigma, mobility, norms)
• Discrimination• Comparative
advantage• Work environment
• Flexibility• Discrimination and
harassment• Opportunities
for growth and advancement
• Location
Female Labor Force Participation in Asia: Indonesia Country Study | 3
Labor demand broadly refers to the set of labor market opportunities available to a woman with a given set of demographic characteristics. These opportunities may be limited by a number of factors, among them (i) gender-based discrimination in hiring or wages, (ii) the quality of the work environment (e.g., concerns due to harassment or security), (iii) the location of available jobs and commuting costs, and (iv) whether the available jobs allow a woman to balance work with obligations at home.
A woman’s labor market behavior will be determined by the intersection of labor supply with
labor demand. One thing to note from the discussion above is that the impact of the wage on FLFP is ambiguous. As a woman’s wage rises, she may choose to work more as the marginal returns to labor are higher (this is called the substitution effect in the economics literature). Alternatively, she may decide to work less as she is now effectively better off and so has a less pressing need for additional income (this force is called the income effect).
Figure 2 also highlights that there is a continuous feedback loop between supply-side and
demand-side factors, social norms, and labor market policies. The multidirectional nature of these relationships makes it especially difficult to infer causality from observational correlations. For example, if we observe that women with children are less likely to work compared to women without children, it is difficult to know whether this is due to supply-side factors (e.g., a woman's time at home is more productive when there is a child to mind) or to demand-side factors (e.g., employers are unwilling to hire new mothers), or to both. Given this situation, high-quality empirical research that relies on natural experiments or randomized controlled trials is needed to cut through the feedback loops and shed light on causal relationships. There is relatively little evidence of this sort from the Indonesian context, and such rigorous analysis is beyond the scope of this paper. This is why our paper focuses on performing a descriptive diagnostic analysis to flag potential constraints to FLFP.2
B. Country Context Indonesia is well-known for its ethnic and cultural diversity, being home to over 200 distinct ethnic groups scattered across more than 6,000 inhabited islands (Cribb 1999: CIA 2014). It is therefore difficult—and ultimately inaccurate—to make blanket statements about Indonesian culture or the role of women in Indonesia, considering that women in some areas of the country have a great deal of autonomy and independence, while women in other areas are much more restricted. It is possible to find some common threads, however; Blackburn (2004) notes that the Suharto regime placed a very strong emphasis on differences between men and women and celebrated the special role that women have as mothers at the center of the home—this rhetoric still has a powerful influence in many areas of the country today.
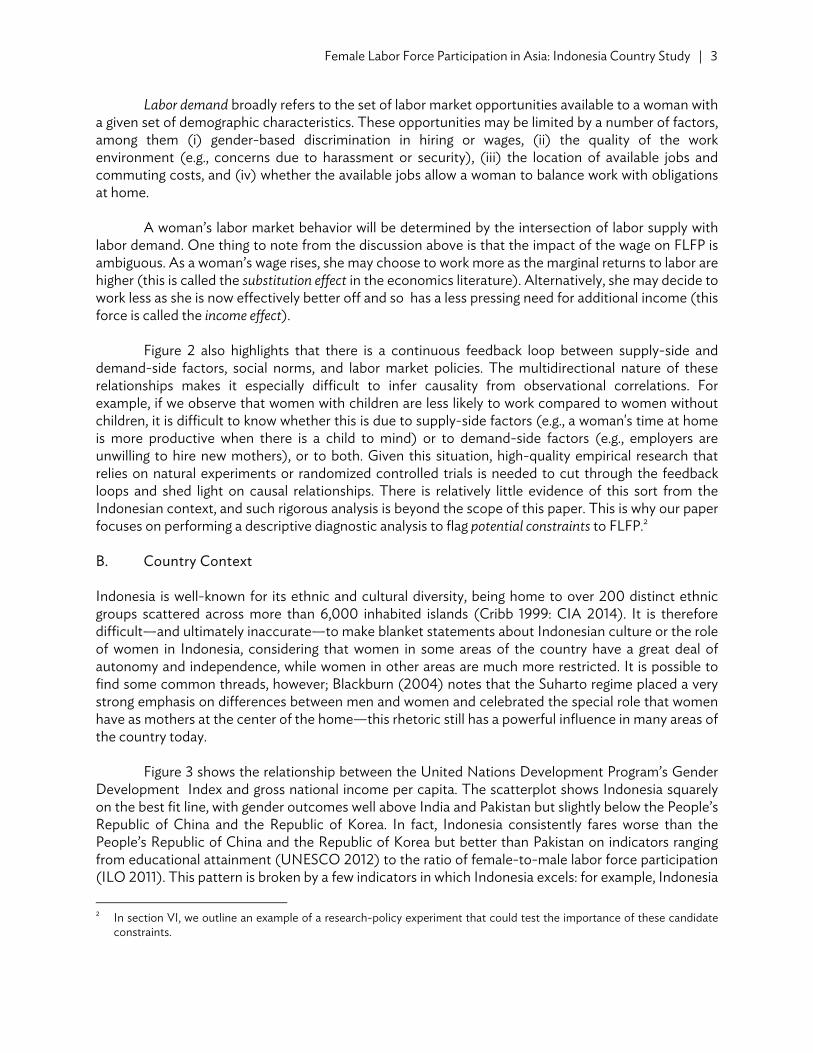
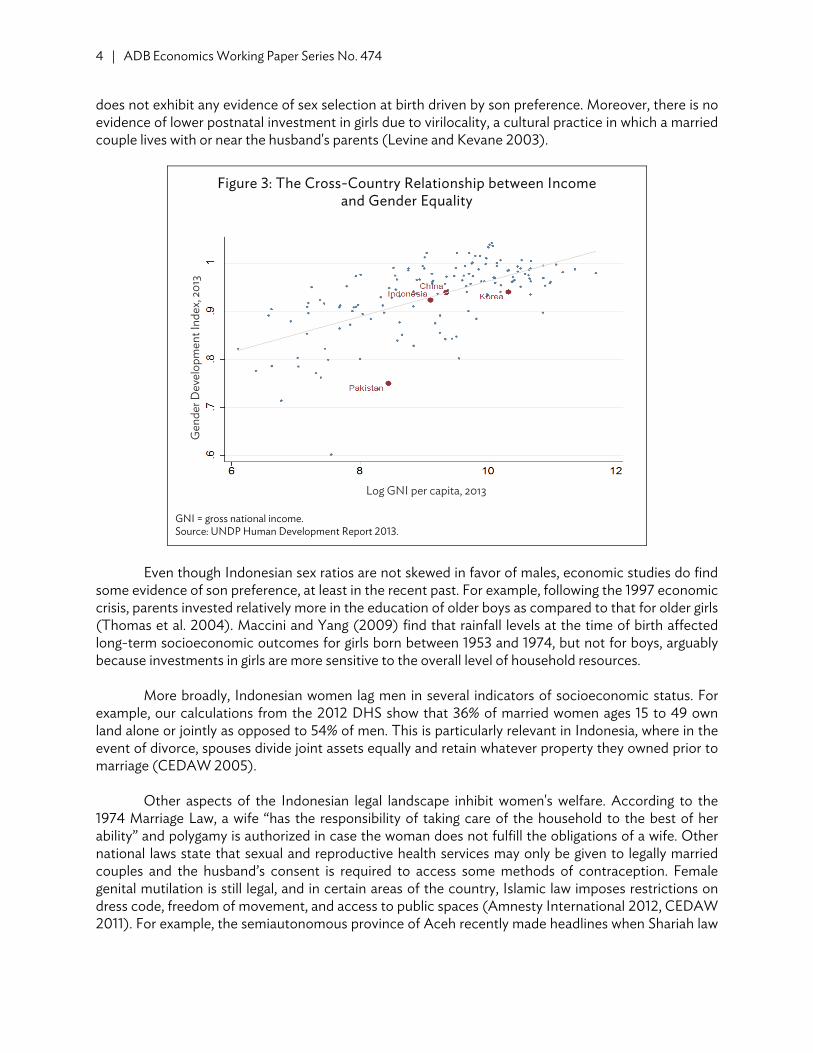
Figure 3 shows the relationship between the United Nations Development Program’s Gender Development Index and gross national income per capita. The scatterplot shows Indonesia squarely on the best fit line, with gender outcomes well above India and Pakistan but slightly below the People’s Republic of China and the Republic of Korea. In fact, Indonesia consistently fares worse than the People’s Republic of China and the Republic of Korea but better than Pakistan on indicators ranging from educational attainment (UNESCO 2012) to the ratio of female-to-male labor force participation (ILO 2011). This pattern is broken by a few indicators in which Indonesia excels: for example, Indonesia 2 In section VI, we outline an example of a research-policy experiment that could test the importance of these candidate
constraints.
4 | ADB Economics Working Paper Series No. 474
does not exhibit any evidence of sex selection at birth driven by son preference. Moreover, there is no evidence of lower postnatal investment in girls due to virilocality, a cultural practice in which a married couple lives with or near the husband's parents (Levine and Kevane 2003).
Figure 3: The Cross-Country Relationship between Income and Gender Equality
GNI = gross national income. Source: UNDP Human Development Report 2013.
Even though Indonesian sex ratios are not skewed in favor of males, economic studies do find
some evidence of son preference, at least in the recent past. For example, following the 1997 economic crisis, parents invested relatively more in the education of older boys as compared to that for older girls (Thomas et al. 2004). Maccini and Yang (2009) find that rainfall levels at the time of birth affected long-term socioeconomic outcomes for girls born between 1953 and 1974, but not for boys, arguably because investments in girls are more sensitive to the overall level of household resources.
More broadly, Indonesian women lag men in several indicators of socioeconomic status. For
example, our calculations from the 2012 DHS show that 36% of married women ages 15 to 49 own land alone or jointly as opposed to 54% of men. This is particularly relevant in Indonesia, where in the event of divorce, spouses divide joint assets equally and retain whatever property they owned prior to marriage (CEDAW 2005).
Other aspects of the Indonesian legal landscape inhibit women's welfare. According to the
1974 Marriage Law, a wife “has the responsibility of taking care of the household to the best of her ability” and polygamy is authorized in case the woman does not fulfill the obligations of a wife. Other national laws state that sexual and reproductive health services may only be given to legally married couples and the husband’s consent is required to access some methods of contraception. Female genital mutilation is still legal, and in certain areas of the country, Islamic law imposes restrictions on dress code, freedom of movement, and access to public spaces (Amnesty International 2012, CEDAW 2011). For example, the semiautonomous province of Aceh recently made headlines when Shariah law
Gen
der D
evel
opm
ent I
ndex
, 201
3
Log GNI per capita, 2013
Female Labor Force Participation in Asia: Indonesia Country Study | 5
was extended to non-Muslims. Here, Islamic courts are considered equal to state courts and they have jurisdiction over both personal law (e.g., inheritance, marriage) and criminal law (Iaccino 2014).
Indonesia also has room to make its workplace policies more gender-sensitive. While formal
employers are required to pay 100% of prior earnings for 6 weeks of maternity leave, the law only applies to less than a third of employed women, and in practice, not all workers who are entitled to this benefit receive it. Additionally, Indonesia is one of the few countries in which maternity benefits are funded by employers rather than social security insurance, and paid time-off is not offered during nursing breaks. This discourages employers from hiring women of childbearing age. There are also limited leave provisions for working fathers, as companies are only required to provide a few days of paternity leave (Addati, Cassier, and Gilchrist 2014).
The Indonesian government has taken steps to promote gender equality in recent years,
although change on the national level has been difficult given the ideologically diverse population. As of 2004, 30% of candidates nominated by each political party for House of Representatives must be female (Quota Project 2014). The Gender Equality and Justice Bill, which would change the marriage law among its provisions, was introduced in 2010, but subsequently stalled in parliament due to objections from conservative political parties (Win 2014).
Grounded in this context, we now review existing evidence on FLFP in Indonesia.
III. LITERATURE REVIEW
There are relatively few well-identified quantitative studies that focus on women's labor supply decisions in Indonesia. However, several studies have attempted to use quasi-experimental methods and simple regression analysis to understand the relationship between FLFP and financial shocks, fertility, and minimum wage laws. We review these bodies of literature in turn. The Asian Financial Crisis The Asian Financial Crisis caused gross domestic product growth rates in Indonesia to fall from 6% in 1996 to –14.4% in 1998 (World Bank 2013 and OECD 2013). Inflation reached 54.4% in 1998 (IMF 2013), with even greater growth in food prices that was particularly detrimental to low-income households (Frankenberg, Smith, and Thomas 2003). Several studies have documented how FLFP responded to this unprecedented economic shock.
First, Smith et al. (2002) find that FLFP slightly increased between 1997 and 1998, while male LFP slightly decreased. In both cases, informal employment increased, while formal employment decreased. Fallon and Lucas (2002) find an even stronger countercyclical effect in rural areas and find similar results using panel data from the Indonesia Family Life Survey. Thus, Indonesia’s crisis-era FLFP presents a case of the income effect dominating the substitution effect; as real wages collapsed in the months following the crisis, women entered the labor force to supplement suddenly lower household incomes.
Fertility and Contraception Priebe (2010) explores the relationship between fertility and FLFP using multiple rounds of the SUSENAS, Indonesia's annual socioeconomic survey. The author uses the sex composition of a
6 | ADB Economics Working Paper Series No. 474
woman's first two children as an instrumental variable for whether or not she has a third child and finds that women who have a third child are more likely to participate in the labor market.3
This effect is concentrated among low-income households, and the author argues that it is the
expense associated with having a third child that drives women into the labor market. In contrast, Radhakrishnan (2010) correlates variation in access to family planning during the
Suharto era with variation in FLFP and argues that women exit formal employment and enter informal employment when they have children. This suggests that childcare constraints do bind for some women, at least at the margin of what type of work to perform, and that informal employment is relatively more attractive to mothers, perhaps due to additional flexibility. The Minimum Wage Indonesia rapidly increased its minimum wage between 1990 and 1996, creating an opportunity for researchers to study the impact of minimum wage raises on both the distribution of workers' wages and labor demand. Alatas and Cameron (2003) apply Card and Krueger’s (1995) methods to the Indonesia context, comparing employment in the clothing industries on either side of the Jakarta–West Java provincial border; during this period, several minimum-wage changes were implemented at the provincial rather than national level. The authors find that the minimum wage hike had a greater impact on female wages, since women are generally paid less than men. They also find little impact of the minimum wage on employment, although they do find some evidence that small, domestic firms reduced their labor demand. Summary Although existing economic research on FLFP in Indonesia is somewhat scattershot, several themes emerge: First, even though aggregate levels of FLFP have been static over time, women do respond to economic stimuli when considering whether and how to participate in the labor market. Second, there is evidence that income effects play an important role in the FLFP decision; that is, many low-income women work because they need to, not because they want to. These results fall in line with Cameron, Dowling, and Worswick (2001)’s finding that Indonesian women with poorly educated husbands (i.e., those with limited earning power) are more likely to participate in the labor market compared to women with better-educated husbands. Cameron, Dowling, and Worswick (2001) also find that women with higher education levels are more likely to participate in the labor market, a finding that suggests that FLFP is also influenced by substitution effects. Finally, many women work in the informal sector, and there is evidence that informal sector work may be more attractive for women with childcare responsibilities. The evidence from the Asian Financial Crisis also suggests that some individuals turn to informal employment when there are no other options in the labor market.
Our diagnostic analysis takes these findings and builds on them to construct a more comprehensive picture of FLFP in Indonesia. We begin our analysis in the next section by describing our data sources. 3 Like Angrist and Evans (1998), Priebe finds that Indonesian parents have a preference for a gender mix in their offspring.
Thus, couples who have either two boys or two girls are more likely to have a third child.
Female Labor Force Participation in Asia: Indonesia Country Study | 7
IV. EMPIRICAL ANALYSIS A. Data We use two primary data sources in this paper. The first is Indonesia’s national labor force survey, the SAKERNAS (Survei Angkatan Kerja Nasional). The SAKERNAS was first conducted in 1976 and has been conducted every year since 1986 (except in 1995), with varying frequency within a given year. The SAKERNAS, managed by Indonesia’s statistics bureau, is nationally representative and is the main source of Indonesia’s annual labor force statistics.
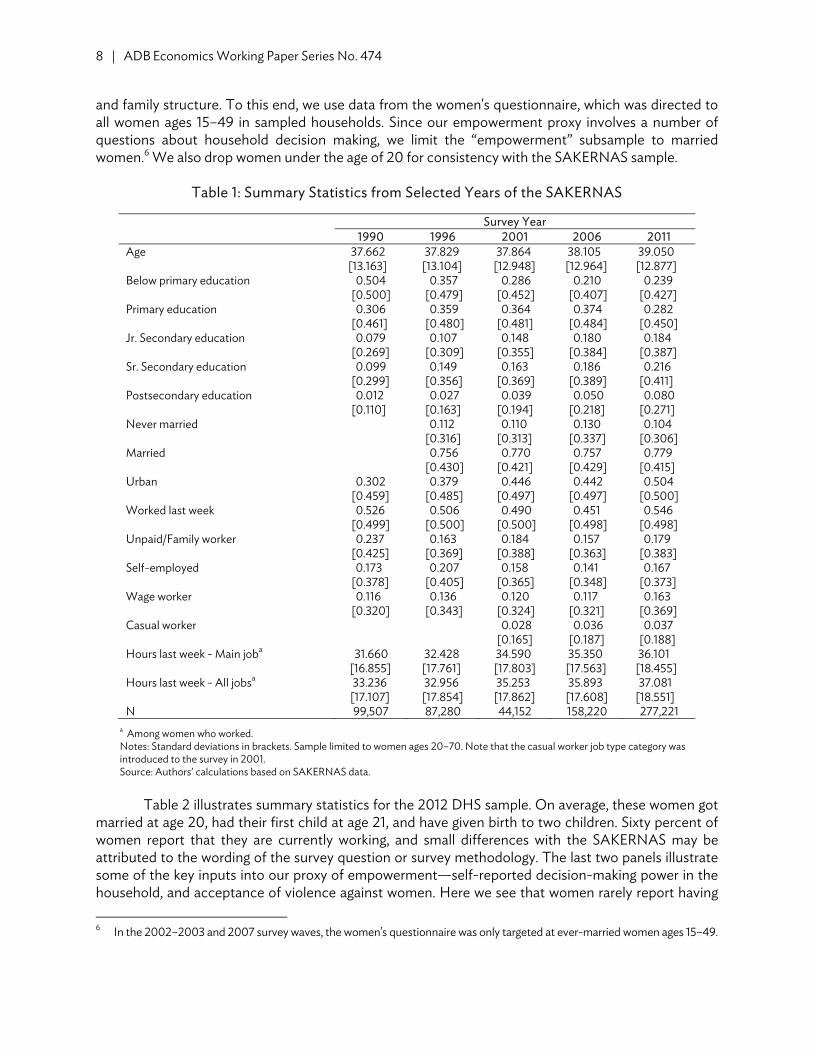
The SAKERNAS records demographic and labor supply information for all individuals age 10 and older living in sampled households. In this paper, we use data on the 22-year period from 1990–2011 and focus on women ages 20 to 70.4 Table 1 provides summary statistics for 5 years in our study period. The table highlights several important shifts over time: first, educational attainment increased sharply. While more than half of women in 1990 had not finished primary school, this figure declined to 24% of women by 2011. Similarly, just 11% of women in 1990 had a senior secondary or postsecondary degree, while nearly 30% of women in 2011 reported the same. Table 2 shows that the share of women living in urban areas also increased sharply, from 30% in 1990 to 50% in 2011.
In spite of these significant sociodemographic changes, female labor supply, as measured by
the share of women who reported working in the past week, is relatively stable—53% of women reported working in the past week in 1990, and just 55% reported the same 21 years later. Figure 1 gives a year-to-year picture of FLFP and cross-checks our estimates with estimates from the International Labour Organization (ILO), which are adjusted to account for country-specific differences in national data collection and other measurement issues.5
Overall, our FLFP estimates closely track the ILO estimates, with the exception of the period
from 2002 to 2006, during which we estimate somewhat lower FLFP. We do not have a good explanation for this apparent discrepancy—it could reflect changes in the SAKERNAS sampling strategy or in the methodology used to calculate sample weights (we present weighted estimates throughout this paper). However, given this pattern, our preference in what follows is to focus on long-run trends and to avoid reading too much into relatively small changes in estimates from year to year.
Although the SAKERNAS is very useful for tracking time trends in the Indonesian labor market,
it does have some important disadvantages. First, it is a cross-sectional survey, so it is not possible to study individuals over their life span; we can, however, follow birth cohorts over time. Second, changes in the survey design limit cross-year comparability of some variables. Finally, the SAKERNAS is a relatively short survey focused on collecting basic demographic information and labor market outcomes. Thus, it is not very useful for studying other aspects of socioeconomic status and well-being. For this purpose, we use the Indonesia DHS, which has been conducted three times, first in 2002–2003, then again in 2007, and in 2012. We focus on the 2012 data to explore correlations between women’s labor market outcomes and proxies of female empowerment, household wealth, 4 We drop women 19 years old and under to avoid picking up declines in labor supply owing to growing secondary school
enrollment. 5 Note that the ILO estimates refer to the share of women ages 15 and above who are working or seeking work. For cross-
year comparability reasons we confine ourselves to study an indicator for whether or not a woman was working in the past week. We do not obtain persistently lower FLFP estimates compared to the ILO series because our focus age group (20–70 years) is more likely to work than all women ages 15 and older.
8 | ADB Economics Working Paper Series No. 474
and family structure. To this end, we use data from the women's questionnaire, which was directed to all women ages 15–49 in sampled households. Since our empowerment proxy involves a number of questions about household decision making, we limit the “empowerment” subsample to married women.6 We also drop women under the age of 20 for consistency with the SAKERNAS sample.
Table 1: Summary Statistics from Selected Years of the SAKERNAS
Survey Year1990 1996 2001 2006 2011
Age 37.662 37.829 37.864 38.105 39.050[13.163] [13.104] [12.948] [12.964] [12.877]
Below primary education 0.504 0.357 0.286 0.210 0.239[0.500] [0.479] [0.452] [0.407] [0.427]
Primary education 0.306 0.359 0.364 0.374 0.282[0.461] [0.480] [0.481] [0.484] [0.450]
Jr. Secondary education 0.079 0.107 0.148 0.180 0.184[0.269] [0.309] [0.355] [0.384] [0.387]
Sr. Secondary education 0.099 0.149 0.163 0.186 0.216[0.299] [0.356] [0.369] [0.389] [0.411]
Postsecondary education 0.012 0.027 0.039 0.050 0.080[0.110] [0.163] [0.194] [0.218] [0.271]
Never married 0.112 0.110 0.130 0.104[0.316] [0.313] [0.337] [0.306]
Married 0.756 0.770 0.757 0.779[0.430] [0.421] [0.429] [0.415]
Urban 0.302 0.379 0.446 0.442 0.504[0.459] [0.485] [0.497] [0.497] [0.500]
Worked last week 0.526 0.506 0.490 0.451 0.546[0.499] [0.500] [0.500] [0.498] [0.498]
Unpaid/Family worker 0.237 0.163 0.184 0.157 0.179[0.425] [0.369] [0.388] [0.363] [0.383]
Self-employed 0.173 0.207 0.158 0.141 0.167 [0.378] [0.405] [0.365] [0.348] [0.373]Wage worker 0.116 0.136 0.120 0.117 0.163 [0.320] [0.343] [0.324] [0.321] [0.369]Casual worker 0.028 0.036 0.037
[0.165] [0.187] [0.188]Hours last week - Main joba 31.660 32.428 34.590 35.350 36.101
[16.855] [17.761] [17.803] [17.563] [18.455]Hours last week - All jobsa 33.236 32.956 35.253 35.893 37.081
[17.107] [17.854] [17.862] [17.608] [18.551]N 99,507 87,280 44,152 158,220 277,221
a Among women who worked. Notes: Standard deviations in brackets. Sample limited to women ages 20–70. Note that the casual worker job type category was introduced to the survey in 2001. Source: Authors’ calculations based on SAKERNAS data.
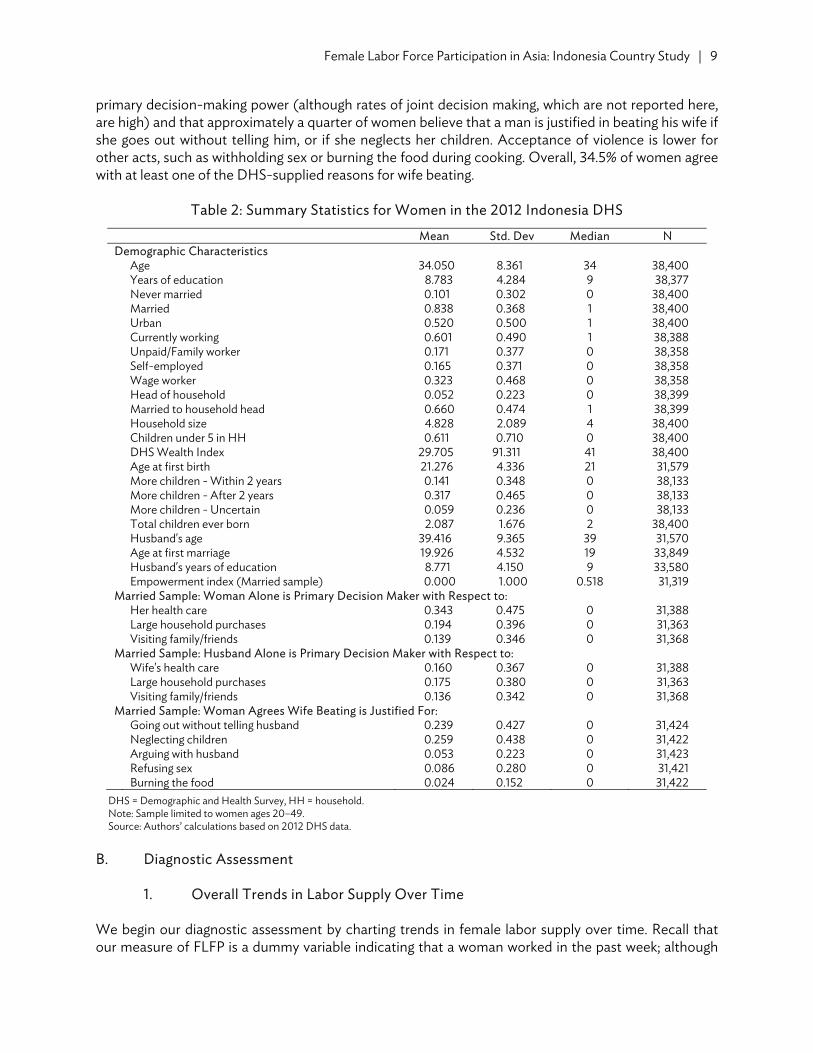
Table 2 illustrates summary statistics for the 2012 DHS sample. On average, these women got
married at age 20, had their first child at age 21, and have given birth to two children. Sixty percent of women report that they are currently working, and small differences with the SAKERNAS may be attributed to the wording of the survey question or survey methodology. The last two panels illustrate some of the key inputs into our proxy of empowerment—self-reported decision-making power in the household, and acceptance of violence against women. Here we see that women rarely report having 6 In the 2002–2003 and 2007 survey waves, the women's questionnaire was only targeted at ever-married women ages 15–49.
Female Labor Force Participation in Asia: Indonesia Country Study | 9
primary decision-making power (although rates of joint decision making, which are not reported here, are high) and that approximately a quarter of women believe that a man is justified in beating his wife if she goes out without telling him, or if she neglects her children. Acceptance of violence is lower for other acts, such as withholding sex or burning the food during cooking. Overall, 34.5% of women agree with at least one of the DHS-supplied reasons for wife beating.
Table 2: Summary Statistics for Women in the 2012 Indonesia DHS
Mean Std. Dev Median NDemographic Characteristics
Age 34.050 8.361 34 38,400Years of education 8.783 4.284 9 38,377Never married 0.101 0.302 0 38,400Married 0.838 0.368 1 38,400Urban 0.520 0.500 1 38,400Currently working 0.601 0.490 1 38,388Unpaid/Family worker 0.171 0.377 0 38,358Self-employed 0.165 0.371 0 38,358Wage worker 0.323 0.468 0 38,358Head of household 0.052 0.223 0 38,399Married to household head 0.660 0.474 1 38,399Household size 4.828 2.089 4 38,400Children under 5 in HH 0.611 0.710 0 38,400DHS Wealth Index 29.705 91.311 41 38,400Age at first birth 21.276 4.336 21 31,579More children - Within 2 years 0.141 0.348 0 38,133More children - After 2 years 0.317 0.465 0 38,133More children - Uncertain 0.059 0.236 0 38,133Total children ever born 2.087 1.676 2 38,400Husband's age 39.416 9.365 39 31,570Age at first marriage 19.926 4.532 19 33,849Husband's years of education 8.771 4.150 9 33,580Empowerment index (Married sample) 0.000 1.000 0.518 31,319
Married Sample: Woman Alone is Primary Decision Maker with Respect to:Her health care 0.343 0.475 0 31,388Large household purchases 0.194 0.396 0 31,363Visiting family/friends 0.139 0.346 0 31,368
Married Sample: Husband Alone is Primary Decision Maker with Respect to:Wife's health care 0.160 0.367 0 31,388Large household purchases 0.175 0.380 0 31,363Visiting family/friends 0.136 0.342 0 31,368
Married Sample: Woman Agrees Wife Beating is Justified For:Going out without telling husband 0.239 0.427 0 31,424Neglecting children 0.259 0.438 0 31,422Arguing with husband 0.053 0.223 0 31,423Refusing sex 0.086 0.280 0 31,421Burning the food 0.024 0.152 0 31,422
DHS = Demographic and Health Survey, HH = household. Note: Sample limited to women ages 20–49. Source: Authors’ calculations based on 2012 DHS data.
B. Diagnostic Assessment
1. Overall Trends in Labor Supply Over Time We begin our diagnostic assessment by charting trends in female labor supply over time. Recall that our measure of FLFP is a dummy variable indicating that a woman worked in the past week; although
10 | ADB Economics Working Paper Series No. 474
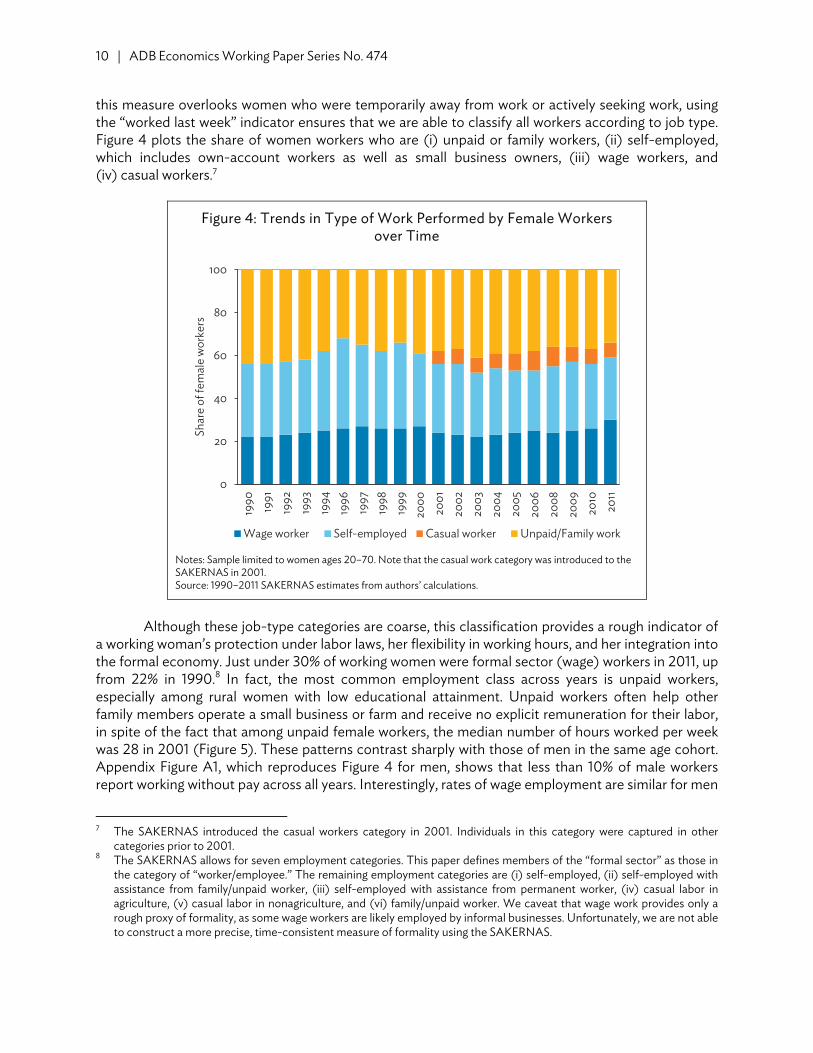
this measure overlooks women who were temporarily away from work or actively seeking work, using the “worked last week” indicator ensures that we are able to classify all workers according to job type. Figure 4 plots the share of women workers who are (i) unpaid or family workers, (ii) self-employed, which includes own-account workers as well as small business owners, (iii) wage workers, and (iv) casual workers.7
Figure 4: Trends in Type of Work Performed by Female Workers over Time
Notes: Sample limited to women ages 20–70. Note that the casual work category was introduced to the SAKERNAS in 2001. Source: 1990–2011 SAKERNAS estimates from authors’ calculations.
Although these job-type categories are coarse, this classification provides a rough indicator of
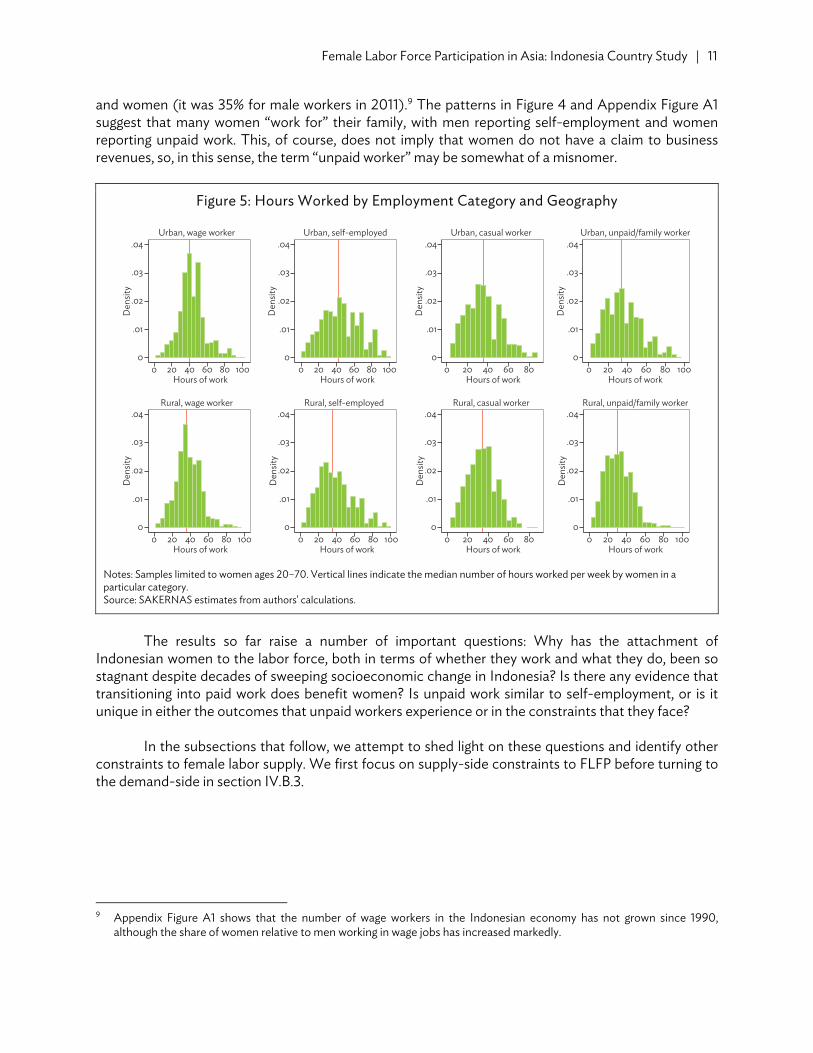
a working woman’s protection under labor laws, her flexibility in working hours, and her integration into the formal economy. Just under 30% of working women were formal sector (wage) workers in 2011, up from 22% in 1990.8 In fact, the most common employment class across years is unpaid workers, especially among rural women with low educational attainment. Unpaid workers often help other family members operate a small business or farm and receive no explicit remuneration for their labor, in spite of the fact that among unpaid female workers, the median number of hours worked per week was 28 in 2001 (Figure 5). These patterns contrast sharply with those of men in the same age cohort. Appendix Figure A1, which reproduces Figure 4 for men, shows that less than 10% of male workers report working without pay across all years. Interestingly, rates of wage employment are similar for men
7 The SAKERNAS introduced the casual workers category in 2001. Individuals in this category were captured in other
categories prior to 2001. 8 The SAKERNAS allows for seven employment categories. This paper defines members of the “formal sector” as those in
the category of “worker/employee.” The remaining employment categories are (i) self-employed, (ii) self-employed with assistance from family/unpaid worker, (iii) self-employed with assistance from permanent worker, (iv) casual labor in agriculture, (v) casual labor in nonagriculture, and (vi) family/unpaid worker. We caveat that wage work provides only a rough proxy of formality, as some wage workers are likely employed by informal businesses. Unfortunately, we are not able to construct a more precise, time-consistent measure of formality using the SAKERNAS.
0
20
40
60
80
100
1990 1991
1992
1993
1994
1996
1997
1998
1999
2000
2001
2002
2003
2004
2005
2006
2008
2009
2010
2011
Shar
e of
fem
ale
wor
kers
Wage worker Self-employed Casual worker Unpaid/Family work
Female Labor Force Participation in Asia: Indonesia Country Study | 11
and women (it was 35% for male workers in 2011).9 The patterns in Figure 4 and Appendix Figure A1 suggest that many women “work for” their family, with men reporting self-employment and women reporting unpaid work. This, of course, does not imply that women do not have a claim to business revenues, so, in this sense, the term “unpaid worker” may be somewhat of a misnomer.
Figure 5: Hours Worked by Employment Category and Geography
Notes: Samples limited to women ages 20–70. Vertical lines indicate the median number of hours worked per week by women in a particular category. Source: SAKERNAS estimates from authors' calculations.
The results so far raise a number of important questions: Why has the attachment of
Indonesian women to the labor force, both in terms of whether they work and what they do, been so stagnant despite decades of sweeping socioeconomic change in Indonesia? Is there any evidence that transitioning into paid work does benefit women? Is unpaid work similar to self-employment, or is it unique in either the outcomes that unpaid workers experience or in the constraints that they face?
In the subsections that follow, we attempt to shed light on these questions and identify other
constraints to female labor supply. We first focus on supply-side constraints to FLFP before turning to the demand-side in section IV.B.3.
9 Appendix Figure A1 shows that the number of wage workers in the Indonesian economy has not grown since 1990,
although the share of women relative to men working in wage jobs has increased markedly.
0
.01
.02
.03
.04
0
.01
.02
.03
.04
Den
sity
0
.01
.02
.03
.04
Den
sity
0
.01
.02
.03
.04
Den
sity
0
.01
.02
.03
.04D
ensit
y
0
.01
.02
.03
.04
Den
sity
Den
sity
0
.01
.02
.03
.04
Den
sity
0
.01
.02
.03
.04
Den
sity
Hours of work0 20 40 60 80 100
Hours of work0 20 40 60 80 100
Hours of work0 20 40 60 80 100
Hours of work0 20 40 60 80 100
Hours of work0 20 40 60 80 100
Hours of work0 20 40 60 80 100
Hours of work0 20 40 60 80
Hours of work0 20 40 60 80
Urban, wage worker
Rural, wage worker Rural, self-employed
Urban, self-employed Urban, casual worker
Rural, casual worker
Urban, unpaid/family worker
Rural, unpaid/family worker
12 | ADB Economics Working Paper Series No. 474
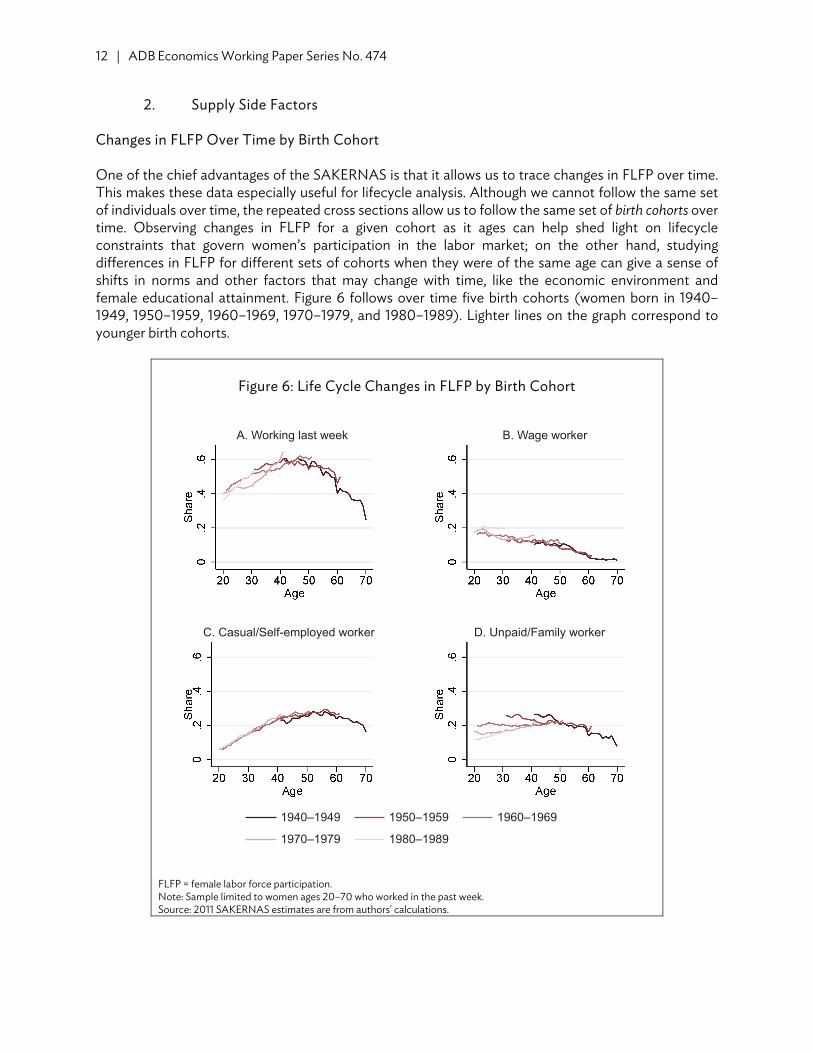
2. Supply Side Factors Changes in FLFP Over Time by Birth Cohort One of the chief advantages of the SAKERNAS is that it allows us to trace changes in FLFP over time. This makes these data especially useful for lifecycle analysis. Although we cannot follow the same set of individuals over time, the repeated cross sections allow us to follow the same set of birth cohorts over time. Observing changes in FLFP for a given cohort as it ages can help shed light on lifecycle constraints that govern women’s participation in the labor market; on the other hand, studying differences in FLFP for different sets of cohorts when they were of the same age can give a sense of shifts in norms and other factors that may change with time, like the economic environment and female educational attainment. Figure 6 follows over time five birth cohorts (women born in 1940–1949, 1950–1959, 1960–1969, 1970–1979, and 1980–1989). Lighter lines on the graph correspond to younger birth cohorts.
Figure 6: Life Cycle Changes in FLFP by Birth Cohort
FLFP = female labor force participation. Note: Sample limited to women ages 20–70 who worked in the past week. Source: 2011 SAKERNAS estimates are from authors' calculations.
1940–1949
1970–1979
1950–1959
1980–1989
1960–1969
A. Working last week
C. Casual/Self-employed worker D. Unpaid/Family worker
B. Wage worker
Female Labor Force Participation in Asia: Indonesia Country Study | 13
Panel A illustrates how overall FLFP varies with age for the five cohorts. Here, we see that FLFP follows a clear inverse U-shape. Approximately 40% of women in their early 20s participate in the labor market, but this share grows steadily as women (and their children) get older. FLFP peaks at around 60% when women are ages 40–50, and then declines as women continue to age. Panels B–D reveal that participation in wage work peaks among women in their 20s and then decreases with age, while participation in casual and self-employed work peaks among women in their late 40s and early 50s.
This pattern suggests that many women first enter the labor market by joining the informal
sector after they marry and their children are older. This contrasts with the M-shaped pattern found in the Republic of Korea and Japan, where young women enter the labor force, drop out when they have children, and rejoin after their children mature (Kawata and Naganuma 2010, Lee et al. 2013). In Panel A, the lines for the different birth cohorts overlap closely, which suggests that overall lifecycle patterns in FLFP have been stable from generation to generation.
However, our analysis by job type in Panels B–D shows evidence of some important
generational change. Panel D shows that more recent birth cohorts have increasingly been less likely to engage in unpaid work at young ages, while Panel B shows that women in the most recent birth cohort (1980–1989) are more likely to work for a wage at young ages. In contrast, women’s engagement in self-employment is very stable from cohort to cohort.
Appendix Figures A2 and A3 reproduce these graphs for women living in rural and urban areas,
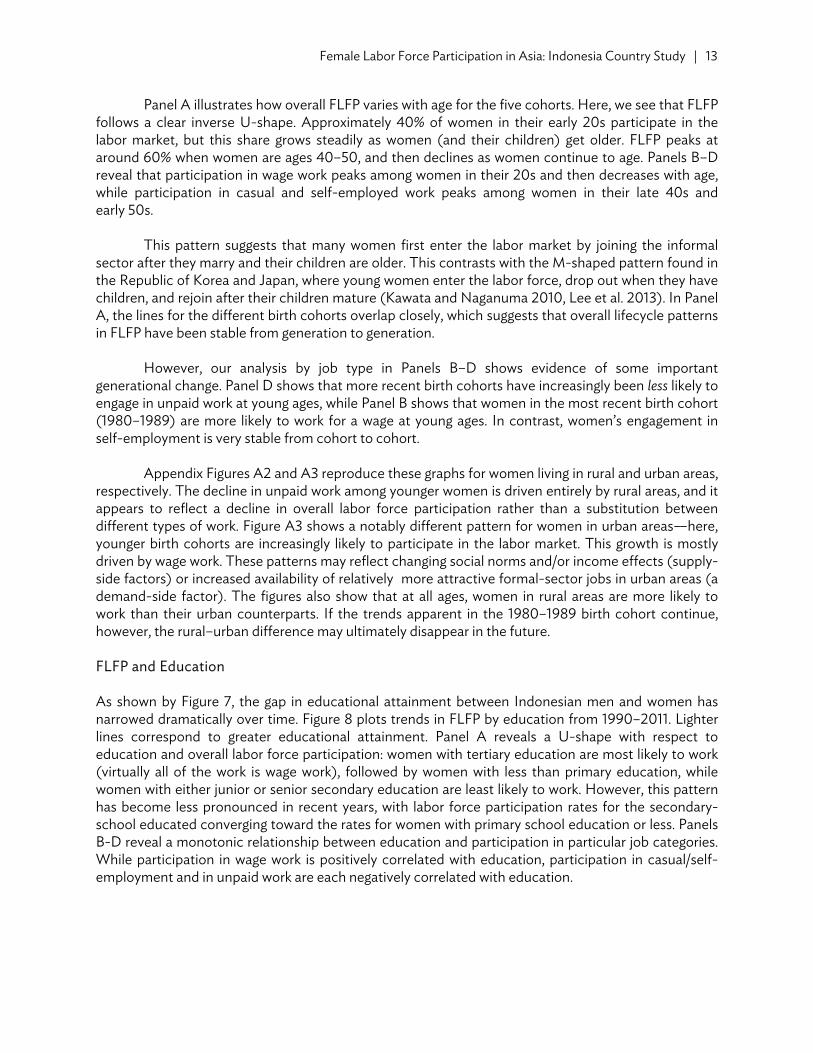
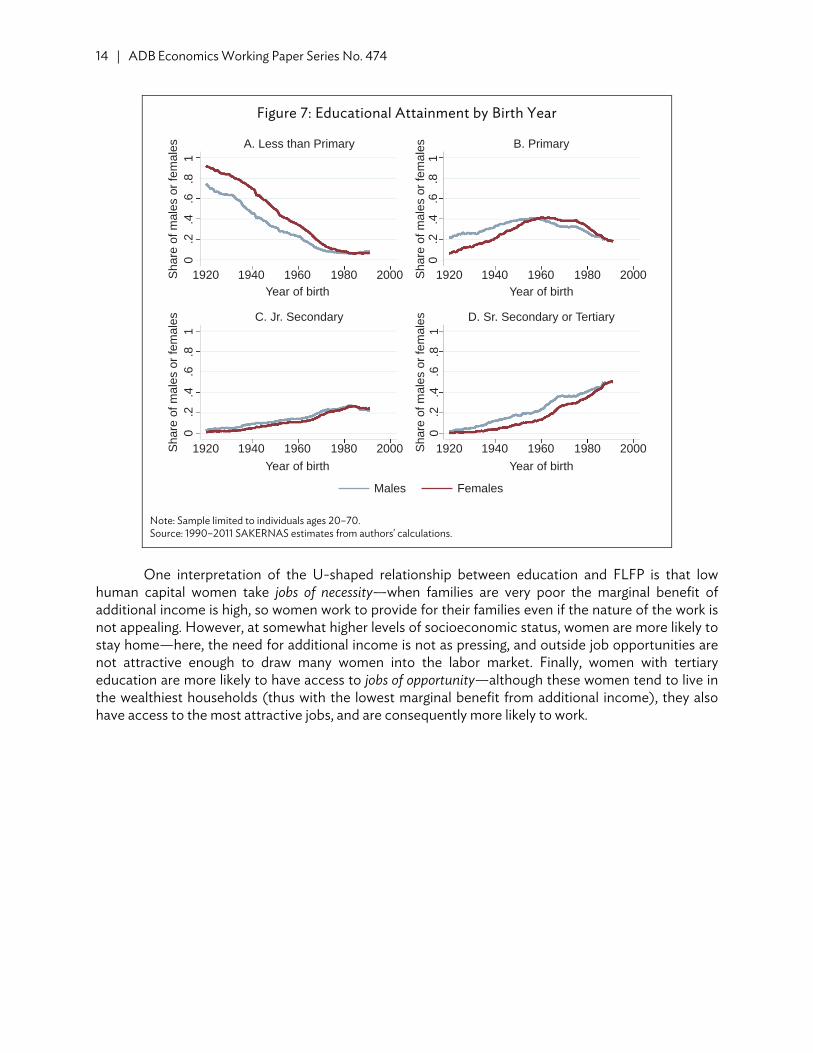
respectively. The decline in unpaid work among younger women is driven entirely by rural areas, and it appears to reflect a decline in overall labor force participation rather than a substitution between different types of work. Figure A3 shows a notably different pattern for women in urban areas—here, younger birth cohorts are increasingly likely to participate in the labor market. This growth is mostly driven by wage work. These patterns may reflect changing social norms and/or income effects (supply-side factors) or increased availability of relatively more attractive formal-sector jobs in urban areas (a demand-side factor). The figures also show that at all ages, women in rural areas are more likely to work than their urban counterparts. If the trends apparent in the 1980–1989 birth cohort continue, however, the rural–urban difference may ultimately disappear in the future. FLFP and Education As shown by Figure 7, the gap in educational attainment between Indonesian men and women has narrowed dramatically over time. Figure 8 plots trends in FLFP by education from 1990–2011. Lighter lines correspond to greater educational attainment. Panel A reveals a U-shape with respect to education and overall labor force participation: women with tertiary education are most likely to work (virtually all of the work is wage work), followed by women with less than primary education, while women with either junior or senior secondary education are least likely to work. However, this pattern has become less pronounced in recent years, with labor force participation rates for the secondary-school educated converging toward the rates for women with primary school education or less. Panels B-D reveal a monotonic relationship between education and participation in particular job categories. While participation in wage work is positively correlated with education, participation in casual/self-employment and in unpaid work are each negatively correlated with education.
14 | ADB Economics Working Paper Series No. 474
Figure 7: Educational Attainment by Birth Year
Note: Sample limited to individuals ages 20–70. Source: 1990–2011 SAKERNAS estimates from authors' calculations.
One interpretation of the U-shaped relationship between education and FLFP is that low
human capital women take jobs of necessity—when families are very poor the marginal benefit of additional income is high, so women work to provide for their families even if the nature of the work is not appealing. However, at somewhat higher levels of socioeconomic status, women are more likely to stay home—here, the need for additional income is not as pressing, and outside job opportunities are not attractive enough to draw many women into the labor market. Finally, women with tertiary education are more likely to have access to jobs of opportunity—although these women tend to live in the wealthiest households (thus with the lowest marginal benefit from additional income), they also have access to the most attractive jobs, and are consequently more likely to work.
A. Less than Primary
C. Jr. Secondary
Year of birth
1920
0.2
.4.6
.81
0.2
.4.6
.81
0.2
.4.6
.81
0.2
.4.6
.81
1940 1960 1980 2000 1920 1940 1960 1980 2000
1920 1940 1960 1980 2000 1920 1940 1960 1980 2000
Year of birth
Year of birth
Males
Year of birth
D. Sr. Secondary or Tertiary
B. Primary
Sh
are
of m
ale
s o
r fe
ma
les
Sh
are
of m
ale
s o
r fe
ma
les
Sh
are
of m
ale
s o
r fe
ma
les
Sh
are
of m
ale
s o
r fe
ma
les
Females
Female Labor Force Participation in Asia: Indonesia Country Study | 15
Figure 8: FLFP over Time by Educational Attainment
FLFP = female labor force participation. Notes: Sample limited to women ages 20–70. Note that the casual work category was introduced to the SAKERNAS in 2001. Source: 1990–2011 SAKERNAS estimates from authors’ calculations.
< Primary Primary Jr. Secondary
Sr. Secondary Tertiary
A. Working last week
C. Casual/Self-employed worker D. Unpaid/Family worker
B. Wage worker
16 | ADB Economics Working Paper Series No. 474
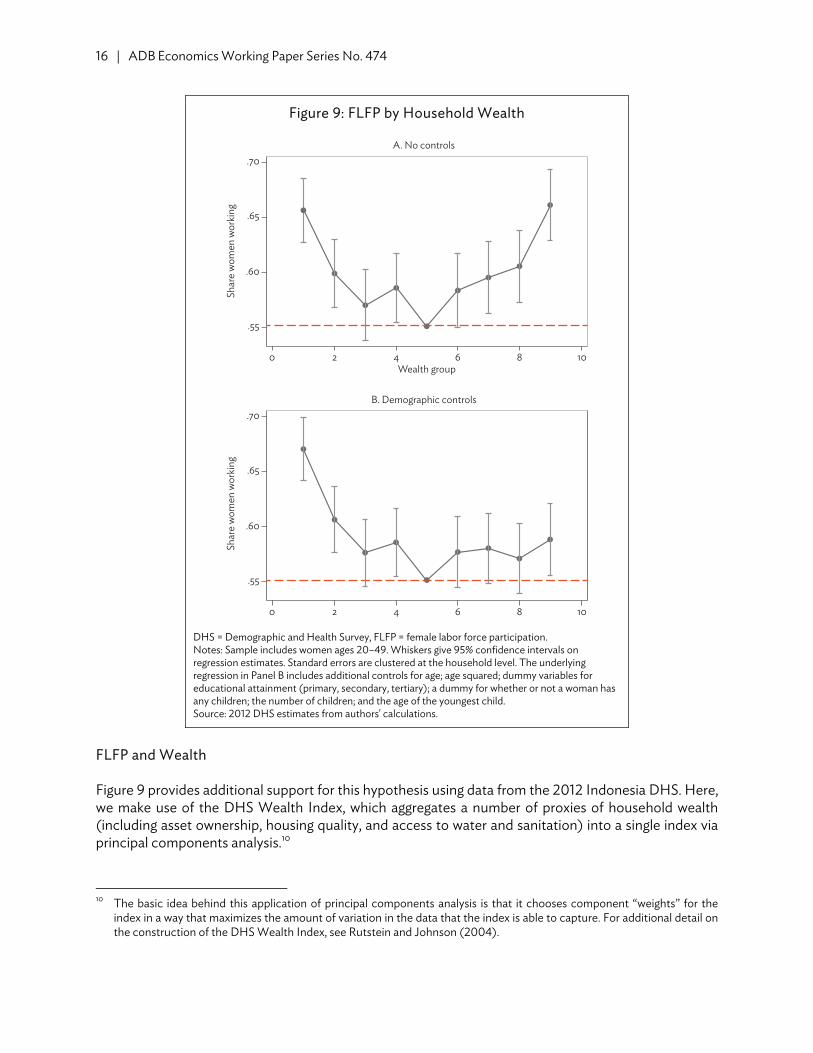
Figure 9: FLFP by Household Wealth
DHS = Demographic and Health Survey, FLFP = female labor force participation. Notes: Sample includes women ages 20–49. Whiskers give 95% confidence intervals on regression estimates. Standard errors are clustered at the household level. The underlying regression in Panel B includes additional controls for age; age squared; dummy variables for educational attainment (primary, secondary, tertiary); a dummy for whether or not a woman has any children; the number of children; and the age of the youngest child. Source: 2012 DHS estimates from authors' calculations.
FLFP and Wealth Figure 9 provides additional support for this hypothesis using data from the 2012 Indonesia DHS. Here, we make use of the DHS Wealth Index, which aggregates a number of proxies of household wealth (including asset ownership, housing quality, and access to water and sanitation) into a single index via principal components analysis.10
10 The basic idea behind this application of principal components analysis is that it chooses component “weights” for the
index in a way that maximizes the amount of variation in the data that the index is able to capture. For additional detail on the construction of the DHS Wealth Index, see Rutstein and Johnson (2004).
A. No controls
B. Demographic controls
.55
0 2 4 6 8 10
0 2 4 6 8 10
Wealth group
.60
Shar
e w
omen
wor
king
Shar
e w
omen
wor
king
.65
.70
.55
.60
.65
.70
Female Labor Force Participation in Asia: Indonesia Country Study | 17
We then group women into nine quantiles of household wealth and run the following regression:
where is equal to 1 if woman i in household h is working and 0 otherwise and is equal to 1 if the woman of interest is in quantile q (out of nine) in terms of the DHS Wealth Index. The vector xih denotes additional demographic controls and standard errors are clustered at the household level. The fifth (middle) quantile is the omitted category—thus, the βq coefficients give the difference in average FLFP for quantile q as compared to the middle quantile. Panel A of Figure 9 plots the regression coefficients and associated 95% confidence intervals when no additional demographic controls are included in the regression. All coefficients are plotted relative to average FLFP in the omitted group (this is given by the dashed line at 0.55); when confidence intervals do not cross the dashed line, we can infer that average FLFP in quantile q is different from FLFP in the middle quantile at the 5% significance level. Panel A shows a striking U-shaped relationship between FLFP and household wealth. Women in the poorest and richest quantiles are over 10 percentage points more likely to be working than women in the middle quantile, and the results are highly statistically significant.
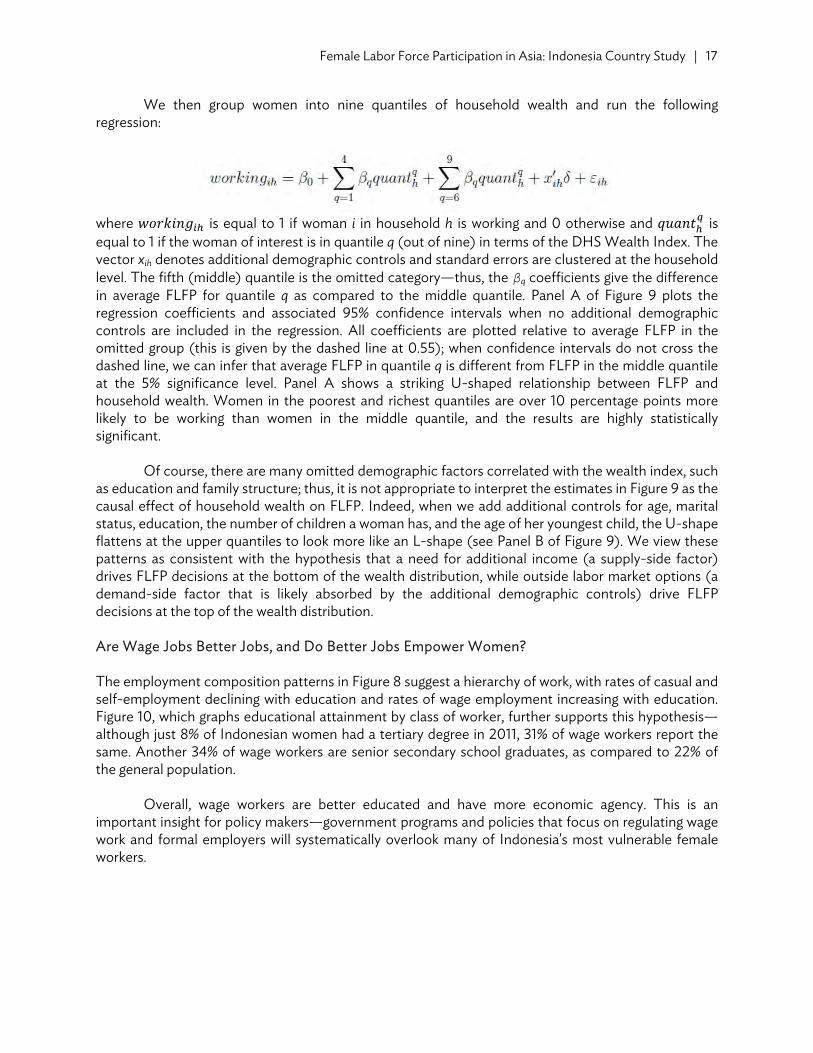
Of course, there are many omitted demographic factors correlated with the wealth index, such as education and family structure; thus, it is not appropriate to interpret the estimates in Figure 9 as the causal effect of household wealth on FLFP. Indeed, when we add additional controls for age, marital status, education, the number of children a woman has, and the age of her youngest child, the U-shape flattens at the upper quantiles to look more like an L-shape (see Panel B of Figure 9). We view these patterns as consistent with the hypothesis that a need for additional income (a supply-side factor) drives FLFP decisions at the bottom of the wealth distribution, while outside labor market options (a demand-side factor that is likely absorbed by the additional demographic controls) drive FLFP decisions at the top of the wealth distribution. Are Wage Jobs Better Jobs, and Do Better Jobs Empower Women? The employment composition patterns in Figure 8 suggest a hierarchy of work, with rates of casual and self-employment declining with education and rates of wage employment increasing with education. Figure 10, which graphs educational attainment by class of worker, further supports this hypothesis—although just 8% of Indonesian women had a tertiary degree in 2011, 31% of wage workers report the same. Another 34% of wage workers are senior secondary school graduates, as compared to 22% of the general population.
Overall, wage workers are better educated and have more economic agency. This is an important insight for policy makers—government programs and policies that focus on regulating wage work and formal employers will systematically overlook many of Indonesia's most vulnerable female workers.
18 | ADB Economics Working Paper Series No. 474
Figure 10: Educational Attainment by Work Status
Note: Sample limited to women ages 20–70. Source: 1990–2011 SAKERNAS estimates from authors' calculations.
This raises the question of whether giving lower-skilled women access to more stable waged
jobs would help improve socioeconomic outcomes. Indeed, well-identified evidence from other countries suggests that easing demand-side constraints can improve labor market outcomes for women. Jensen (2012) finds that giving young Indian women access to call center jobs causes them to delay marriage and reduce fertility. Heath and Mobarak (2014) find similar results when women in Bangladesh gain access to garment factory jobs; they also find that access to garment jobs increases girls' school enrollment. In the Indonesian context, Federman and Levine (2005) find some evidence that growth in manufacturing employment is associated with greater school enrollment and less labor force participation by teenage girls.11
Taking these findings as a starting point, we explore correlations in the DHS data to generate
suggestive evidence as to whether access to formal work can improve women’s welfare beyond the labor market. Here, we ask whether there is any systematic association between the type of work a woman does and a proxy of her empowerment. The United Nations Guidelines on Women’s Empowerment defines women's empowerment as encompassing five areas: “women’s sense of self-worth; their right to have and determine choices; their right to have access to opportunities and resources; their right to have the power to control their own lives, both within and outside the home; and their ability to influence the direction of social change to create a more just social and economic order, nationally and internationally” (UNDP 1997). This definition underscores the fact that empowerment is a rich, multifaceted concept that can be difficult to measure quantitatively and whose meaning can vary by social context.
11 Access to formal sector jobs need not always encourage additional educational investment, however. Atkin (2012) finds
that greater access to factory work in Mexico decreases investment in education, since some of the factory jobs have relatively limited human capital requirements.
0
20
40
60
80
100
Not working Unpaid Self/Casual Wage
Shar
e of
wom
en
Less than primary Primary Jr. Secondary
Sr. Secondary Tertiary
Female Labor Force Participation in Asia: Indonesia Country Study | 19
With this in mind, we do not claim to use an exhaustive measure of empowerment; rather, we use the DHS data to create an index that captures some important, measurable aspects of women’s empowerment. Specifically, we use principal components analysis to aggregate women’s self-reported household decision-making power and women’s attitudes toward spousal violence into a single index.12
The index is standardized to have a mean of 0 and a standard deviation of 1 among all women;
higher values of the index correspond to greater empowerment levels (i.e., women report having more individual or joint decision-making power, and women report that wife beating is not acceptable).
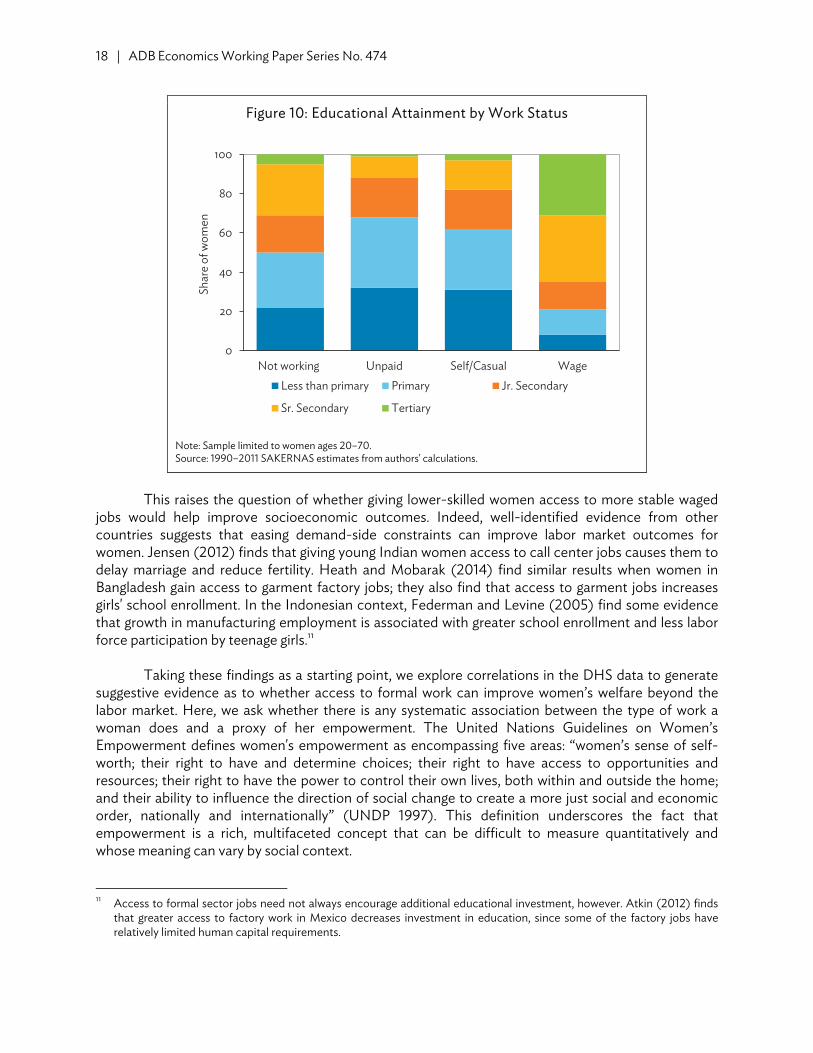
Figure 11 graphs the average value of the empowerment index by both job type and educational
attainment. At each level of education, women who report being family workers (an employment category similar to “unpaid workers” in the SAKERNAS data) are the least empowered. In contrast, women who work for a wage tend to have higher levels of empowerment (especially among the primary and secondary school educated, who account for 86% of all women). Also, note that women with more education are more empowered.
Figure 11: Correlation between Women's Empowerment Index and Type of Employment
DHS = Demographic and Health Survey. Note: Sample limited to women ages 20–49. Source: 2012 Indonesia DHS estimates are from authors' calculations.
12 As a proxy for household decision-making power, we use responses to three household decision-making questions, which
ask women to report who decides about their own health care, large household purchases, and visits to family and friends. We also include responses to five questions that ask women whether a husband is justified in beating his wife if she (a) goes out without telling him, (b) neglects the children, (c) argues with him, (d) refuses sex, and (e) burns the food. See Table 2 for summary statistics on these questions.
–0.4
–0.2
0
0.2
0.4
No education Primary Secondary Postsecondary
Mea
n em
pow
erm
ent i
ndex
Not working Family worker Self-employed Employee
20 | ADB Economics Working Paper Series No. 474
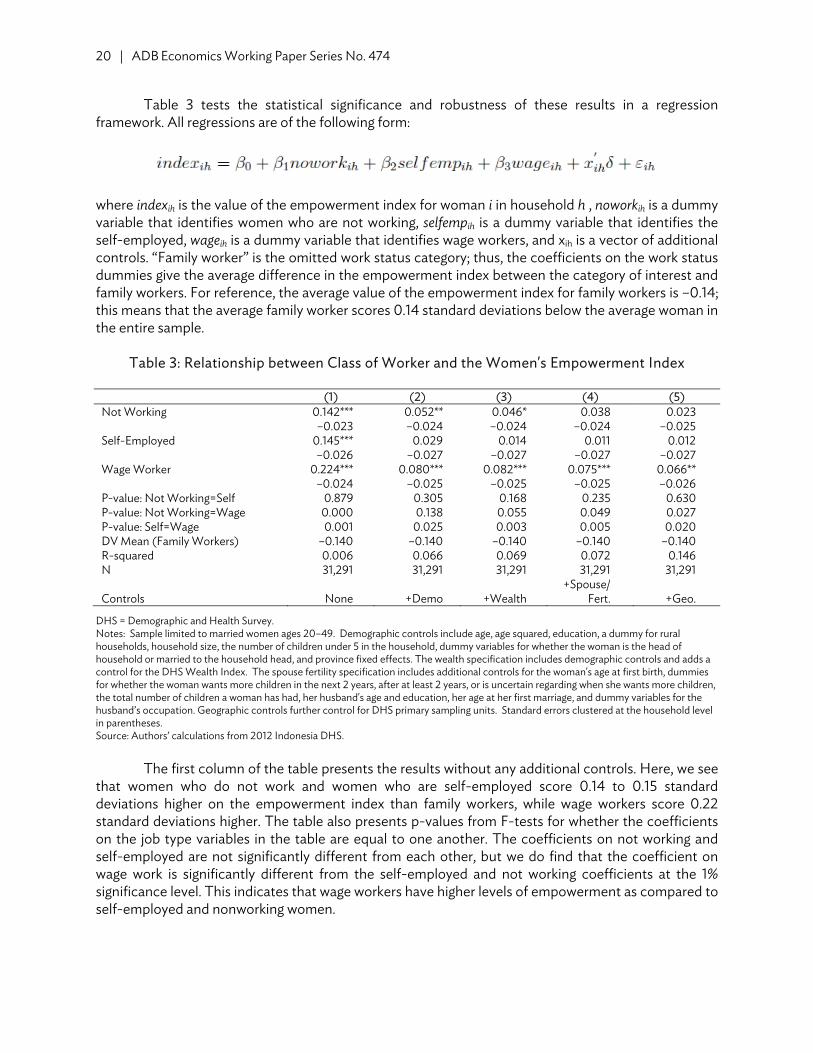
Table 3 tests the statistical significance and robustness of these results in a regression framework. All regressions are of the following form:
where indexih is the value of the empowerment index for woman i in household h , noworkih is a dummy variable that identifies women who are not working, selfempih is a dummy variable that identifies the self-employed, wageih is a dummy variable that identifies wage workers, and xih is a vector of additional controls. “Family worker” is the omitted work status category; thus, the coefficients on the work status dummies give the average difference in the empowerment index between the category of interest and family workers. For reference, the average value of the empowerment index for family workers is –0.14; this means that the average family worker scores 0.14 standard deviations below the average woman in the entire sample.
Table 3: Relationship between Class of Worker and the Women's Empowerment Index
(1) (2) (3) (4) (5)Not Working 0.142*** 0.052** 0.046* 0.038 0.023
–0.023 –0.024 –0.024 –0.024 –0.025Self-Employed 0.145*** 0.029 0.014 0.011 0.012
–0.026 –0.027 –0.027 –0.027 –0.027Wage Worker 0.224*** 0.080*** 0.082*** 0.075*** 0.066**
–0.024 –0.025 –0.025 –0.025 –0.026P-value: Not Working=Self 0.879 0.305 0.168 0.235 0.630P-value: Not Working=Wage 0.000 0.138 0.055 0.049 0.027P-value: Self=Wage 0.001 0.025 0.003 0.005 0.020DV Mean (Family Workers) –0.140 –0.140 –0.140 –0.140 –0.140R-squared 0.006 0.066 0.069 0.072 0.146N 31,291 31,291 31,291 31,291 31,291
+Spouse/ Controls None +Demo +Wealth Fert. +Geo.
DHS = Demographic and Health Survey. Notes: Sample limited to married women ages 20–49. Demographic controls include age, age squared, education, a dummy for rural households, household size, the number of children under 5 in the household, dummy variables for whether the woman is the head of household or married to the household head, and province fixed effects. The wealth specification includes demographic controls and adds a control for the DHS Wealth Index. The spouse fertility specification includes additional controls for the woman's age at first birth, dummies for whether the woman wants more children in the next 2 years, after at least 2 years, or is uncertain regarding when she wants more children, the total number of children a woman has had, her husband's age and education, her age at her first marriage, and dummy variables for the husband’s occupation. Geographic controls further control for DHS primary sampling units. Standard errors clustered at the household level in parentheses. Source: Authors’ calculations from 2012 Indonesia DHS.
The first column of the table presents the results without any additional controls. Here, we see
that women who do not work and women who are self-employed score 0.14 to 0.15 standard deviations higher on the empowerment index than family workers, while wage workers score 0.22 standard deviations higher. The table also presents p-values from F-tests for whether the coefficients on the job type variables in the table are equal to one another. The coefficients on not working and self-employed are not significantly different from each other, but we do find that the coefficient on wage work is significantly different from the self-employed and not working coefficients at the 1% significance level. This indicates that wage workers have higher levels of empowerment as compared to self-employed and nonworking women.
Female Labor Force Participation in Asia: Indonesia Country Study | 21
This result should not come as a surprise given our earlier analyses—among other things, wage workers are more educated and more likely to live in urban areas. These women may be more empowered for reasons unrelated to the nature of their work. The next four columns of Table 3 test the robustness of the results when controls are added for observable characteristics that may be correlated with empowerment and job type. Column 2 begins by adding demographic controls including the woman’s age, education, urban/rural status, dummy variables for her province of residence, and household structure. All the coefficients attenuate, but the coefficient on wage work remains statistically significant at the 1% level, while the coefficient on not working remains significant at the 5% level. Column 3 further controls for the DHS Wealth Index, Column 4 adds controls for husbands' education and women's childbearing histories, and Column 5 swaps province fixed effects for DHS primary sampling unit fixed effects. The primary sampling unit for the Indonesia DHS is the census block; thus, one can roughly interpret the specification in Column 5 as one with village/community fixed effects.
The coefficient on the wage worker dummy is relatively stable across Columns 2–5 and always
statistically significant at the 5% level or better.13 In contrast, we find no significant differences between the empowerment of nonworking women and self-employed women relative to family workers. We cannot attach a causal interpretation to our results, for it may simply be that more empowered women are more likely to select into wage work because they already have greater social and economic independence, but we view our results as suggestive and meriting further investigation.
These results also raise an important question: If wage work is more attractive, why don’t more women hold wage jobs? Recall from Table 1 that just 16% of women, or 30% of women workers, reported holding a wage job in the 2011 SAKERNAS. Low levels of wage work and wage work dropout could be caused by supply-side factors such as social norms surrounding family responsibilities, or demand-side factors like discrimination in hiring, promotion, or compensation. We will discuss these constraints in turn.
Barriers to Better Work: Family Responsibilities Figure 6 shows that rates of wage work decline steadily with age, an outcome that is strongly correlated with marriage and the presence of children in our sample. One explanation for dropout may be that wage work requires longer hours, or that it does not offer women the flexibility they need to balance work and family responsibilities. Figure 5 shows that wage workers, the self-employed, and casual workers work a similar number of hours per week on average. However, the variance in the number of hours worked is smaller for wage workers; thus may indicate less flexibility.
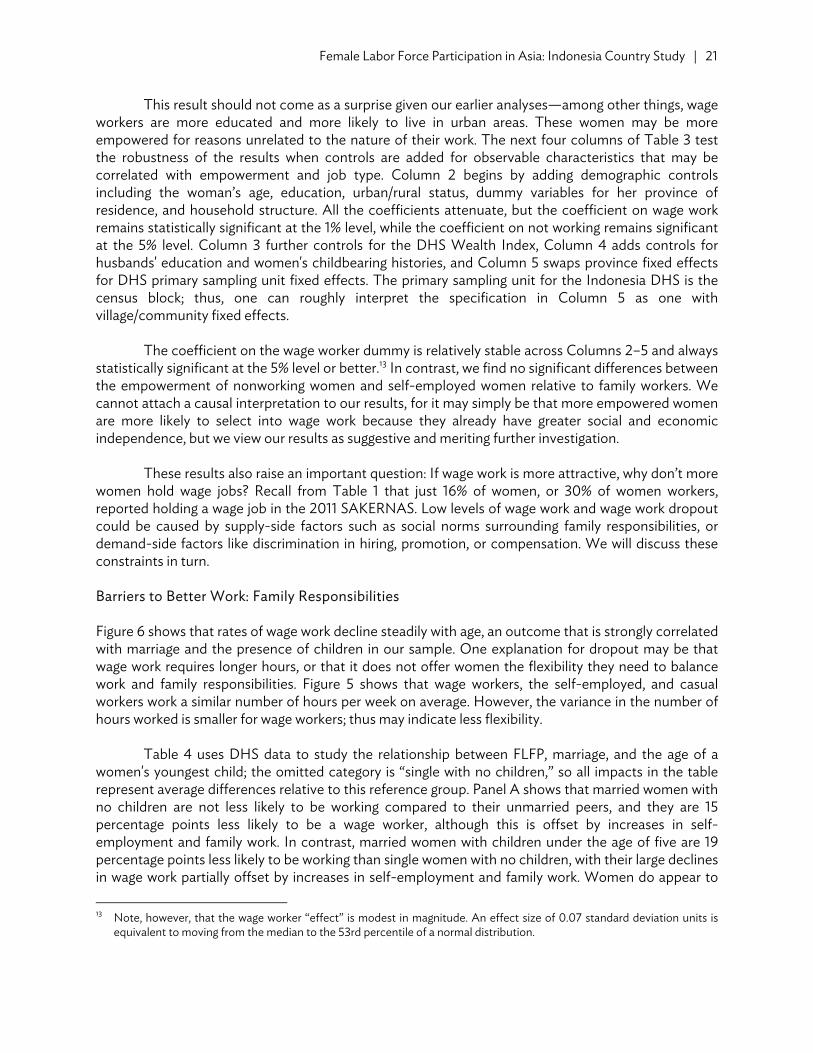
Table 4 uses DHS data to study the relationship between FLFP, marriage, and the age of a women's youngest child; the omitted category is “single with no children,” so all impacts in the table represent average differences relative to this reference group. Panel A shows that married women with no children are not less likely to be working compared to their unmarried peers, and they are 15 percentage points less likely to be a wage worker, although this is offset by increases in self-employment and family work. In contrast, married women with children under the age of five are 19 percentage points less likely to be working than single women with no children, with their large declines in wage work partially offset by increases in self-employment and family work. Women do appear to 13 Note, however, that the wage worker “effect” is modest in magnitude. An effect size of 0.07 standard deviation units is
equivalent to moving from the median to the 53rd percentile of a normal distribution.
22 | ADB Economics Working Paper Series No. 474
reenter the labor force, however; mothers with children aged 11 and older are just as likely to work as their unmarried childless peers, although mothers do less wage work and more informal sector work.
Table 4: Relationship between FLFP, Marriage, and Fertility
(1) (2) (3) (4)
Outcome is: Working Wage
Worker Self-
Employed Family
Worker A. No Controls
Married and no children –0.025 –0.147*** 0.038*** 0.084***–0.017 –0.019 –0.010 –0.013
Married and youngest age 0–5 –0.193*** –0.337*** 0.076*** 0.068***–0.011 –0.012 –0.006 –0.007
Married and youngest age 6–10 –0.037*** –0.288*** 0.144*** 0.107***–0.013 –0.014 –0.009 –0.009
Married and youngest age 11–15 –0.011 –0.274*** 0.139*** 0.124***–0.014 –0.016 –0.011 –0.011
Married and youngest age 15+ –0.003 –0.303*** 0.158*** 0.142***–0.015 –0.017 –0.012 –0.013
DV Mean: Single and no children 0.731 0.352 0.183 0.196R-squared 0.038 0.051 0.025 0.013N 38,346 38,346 38,346 38,346
B. Demographic and Economic Controls Married and no children –0.099 –0.204*** 0.075 0.030
–0.067 –0.063 –0.046 –0.059Married and youngest age 0–5 –0.262*** –0.340*** 0.092** –0.014
–0.066 –0.062 –0.046 –0.058Married and youngest age 6–10 –0.136** –0.267*** 0.116** 0.015
–0.066 –0.061 –0.045 –0.058Married and youngest age 11–15 –0.112* –0.226*** 0.087* 0.027
–0.066 –0.061 –0.045 –0.057Married and youngest age 15+ –0.096 –0.216*** 0.090** 0.031
–0.065 –0.061 –0.045 –0.058DV Mean: No children 0.731 0.352 0.183 0.196R-squared 0.062 0.101 0.044 0.144
N 38,346 38,346 38,346 38,346
DHS = Demographic and Health Survey, FLFP = female labor force participation. Notes: Standard errors clustered at the household level in parentheses. ***, **, and * indicate significance at the 1%, 5%, and 10% significance levels, respectively. Sample limited to women ages 20–49. Demographic and economic controls include age, age squared, marital status, education, a dummy for rural households, total household size, indicators for whether the woman is the head or married to the head of the household, the DHS Wealth Index, dummies for whether the woman wants more children in the next 2 years, wants more children in more than 2 years or is uncertain about timing, or is uncertain whether she wants more children, a woman’s total number of children, her husband’s age, education, and occupation, and primary sampling unit fixed effects. All coefficients are in relative to single women with no children. While dummies for all marital statuses were included in the regression, coefficients are displayed for married women, as single women with no children and married women make up 93.9% of the weighted sample. Source: Authors’ calculations from 2012 Indonesia DHS.
Childbearing decisions are, of course, deeply endogenous to a number of factors that could
influence labor supply. To fully solve this problem, we would need to isolate as-good-as-random variation in fertility patterns. This is not feasible, so instead we present estimates in Panel B that control for a wide range of demographic and economic factors, to illustrate how our estimates change when we attempt to account for observable differences between women with different fertility histories. Even here, we still find evidence of an overall decline in FLFP upon the arrival of young children that fades as children age, and again this decline is driven almost entirely by a decline in wage work. The dropout from wage work upon marriage remains significant and large but does not attenuate
Female Labor Force Participation in Asia: Indonesia Country Study | 23
as children age. This suggests that after having children, women may find it difficult to reenter the formal sector.
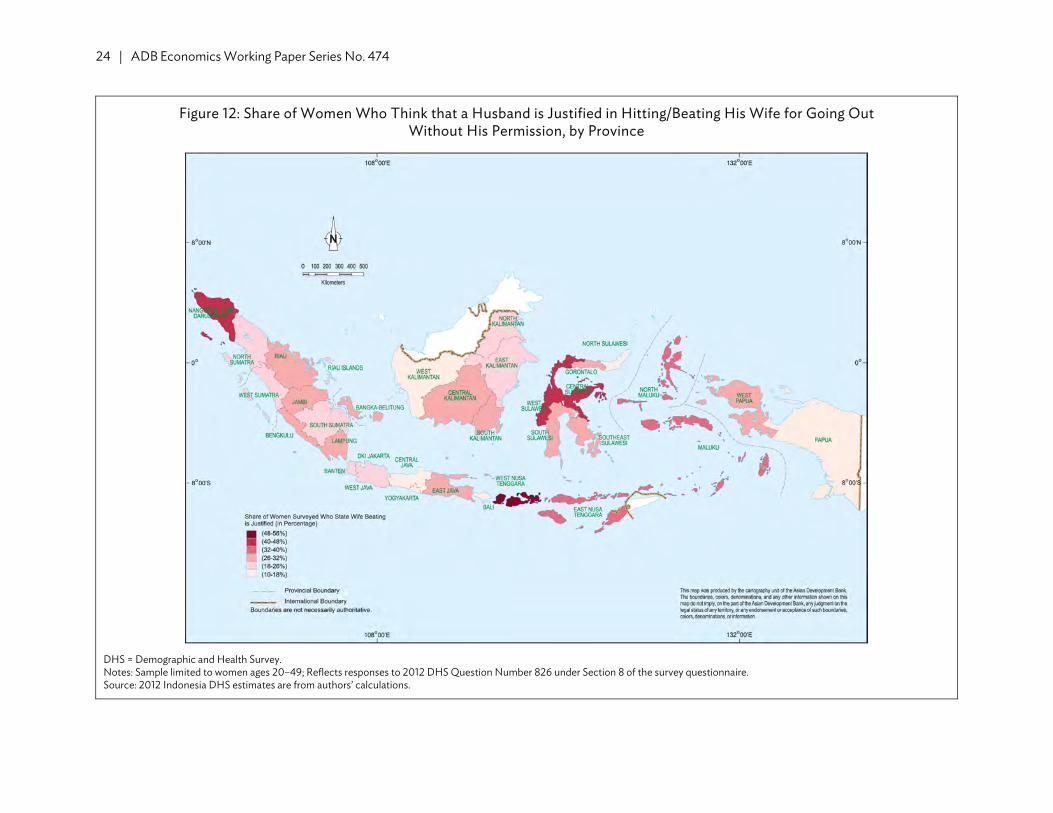
These results are broadly consistent with the earlier findings of Radhakrishnan (2010), but subject to the identification caveat discussed above, they suggest that women do exit the labor force to care for young children. Thus, policies that make it easier for women with young children to work, or policies that help reintroduce mothers of older children to high-return wage employment, could be an especially useful tool for boosting FLFP. Rigorous research in the United States (US), Europe, and Latin America has found varying, though often positive, impacts of childcare facilities on FLFP; see the literature review in Bauernschuster and Schlotter (2015). Bauernschuster and Schlotter (2015) argue that subsidized childcare will likely be effective in contexts where it does not simply crowd out informal caregiving arrangements. In the Indonesian context, this suggests that urban women, who often have family in rural areas, could especially benefit from services. Research that sheds light on women's experiences transitioning back into formal-sector work after their children have grown could help identify additional policy entry points. Mobility and Security It is also possible that women in conservative households are not permitted sufficient freedom of movement to perform wage work, or that they do not feel safe traveling to areas where wage work is readily available. There is a great deal of regional variation in female mobility across Indonesia. This variation is evident in Figure 12, which graphs the share of women in the DHS who state that wife hitting/beating is justifiable if a woman leaves the house without her husband's permission.
Rates of agreement range from 11% in the urban areas of Jakarta and Yogyakarta, to 43% in
Aceh and Central Sulawesi, and to over 50% in West Nusa Tenggara. Moreover, women who live in provinces where going out without permission is seen as a punishable offense are more likely to be employed as family workers and less likely to be employed as wage workers. This suggests that these norms may translate into meaningful restrictions on the nature of female work. Interestingly, overall FLFP is actually higher in provinces where beating is more accepted, which suggests that norms may have more influence on the nature of a woman's work than her choice of joining the labor force.
24 | ADB Economics Working Paper Series No. 474
Figure 12: Share of Women Who Think that a Husband is Justified in Hitting/Beating His Wife for Going Out Without His Permission, by Province
DHS = Demographic and Health Survey. Notes: Sample limited to women ages 20–49; Reflects responses to 2012 DHS Question Number 826 under Section 8 of the survey questionnaire. Source: 2012 Indonesia DHS estimates are from authors’ calculations.
Female Labor Force Participation in Asia: Indonesia Country Study | 25
In terms of safety and security, Indonesia has relatively low rates of officially recorded crime in spite of its checkered history of communal and political violence (UNODC 2010). Of course, reporting bias is a serious concern with these statistics, especially with regard to crimes that disproportionately affect women, such as spousal abuse and sexual assault. Indonesia's annual socioeconomic survey, the SUSENAS, does ask individuals whether they have been the victim of a crime in the past year. In the 2011 SUSENAS, 1.8% of individuals aged 20–70 reported victimization, and only 19% of victims reported the crime to the police. Overall rates of victimization for women were 1.4% and 1% for working and nonworking women, respectively. It is important to caveat that even if rates of victimization of women are low in equilibrium, it is still possible that unrecorded factors such as harassment or fear of victimization could play an important role in women's decisions regarding whether to work. That said, we do not have any strong evidence that safety concerns are a major barrier to FLFP in Indonesia.
Of course, even if women feel comfortable traveling for work, they may have problems finding
work at a fair wage, or they may face unpleasant conditions on the job. The next subsection addresses these demand-side issues.
3. Demand-Side Factors
Harassment and Discrimination It may be difficult for many women, especially in rural areas, to find jobs that pay a steady wage. In the 2011 SAKERNAS, 47% of working women in urban areas reported earning a wage, while just 15% of working women in rural areas reported the same. Even if wage work is available, women may be discouraged from taking a job if they encounter harassment or gender-based discrimination. Although our analysis suggests that wage jobs may be more attractive overall, it is important to emphasize that many women face low-quality working conditions in the formal sector. For example, a recent ILO survey finds evidence that women are systematically excluded from participation in labor unions (Reerink 2006). Another recent survey of Indonesian factory workers, 92.2% of whom were female, found extremely high rates of concern about workplace safety, sexual harassment, and verbal abuse (Better Work Indonesia 2012). While we do not have good data on workplace harassment or working conditions, the SAKERNAS data do allow us to study the evolution over time of gender wage gaps as a key indicator of gender-based discrimination.14 Gender-Wage Gaps To begin, Figure 13 graphs over time the median female–male wage ratio (this is the median hourly wage among female wage workers divided by the median hourly wage among male wage workers) and the female–male wage employment ratio (the share of women working in wage employment divided by the share of men working in wage employment). Here, we see that in 1990, the median female wage worker earned just 57% of the median male worker's wage. The wage ratio has steadily improved over time; by 2011, the median woman earned over 84% as much as the median man. This is encouraging, especially since the share of women relative to men engaging in wage employment has increased over time. 14 The SAKERNAS asks individuals to report earnings on a monthly basis, but hours worked on a weekly basis. We inflate
weekly hours worked by 4.36 in order to estimate an hourly wage.
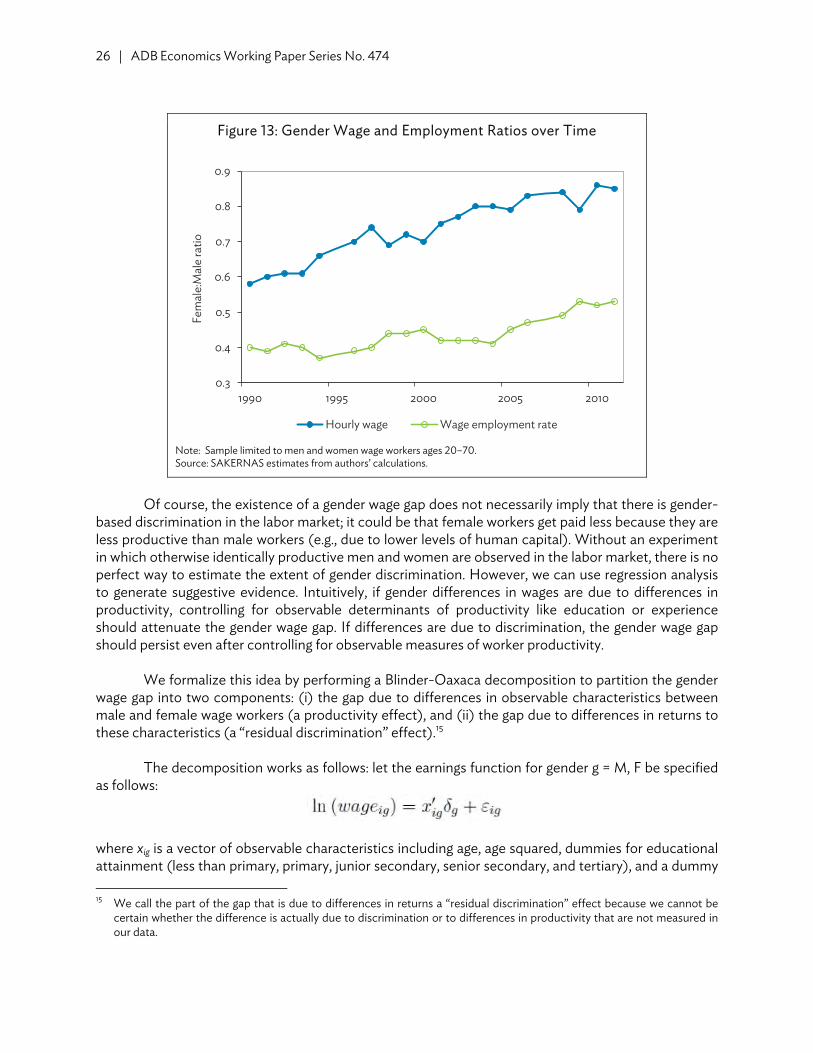
26 | ADB Economics Working Paper Series No. 474
Figure 13: Gender Wage and Employment Ratios over Time
Note: Sample limited to men and women wage workers ages 20–70. Source: SAKERNAS estimates from authors’ calculations.
Of course, the existence of a gender wage gap does not necessarily imply that there is gender-
based discrimination in the labor market; it could be that female workers get paid less because they are less productive than male workers (e.g., due to lower levels of human capital). Without an experiment in which otherwise identically productive men and women are observed in the labor market, there is no perfect way to estimate the extent of gender discrimination. However, we can use regression analysis to generate suggestive evidence. Intuitively, if gender differences in wages are due to differences in productivity, controlling for observable determinants of productivity like education or experience should attenuate the gender wage gap. If differences are due to discrimination, the gender wage gap should persist even after controlling for observable measures of worker productivity.
We formalize this idea by performing a Blinder-Oaxaca decomposition to partition the gender
wage gap into two components: (i) the gap due to differences in observable characteristics between male and female wage workers (a productivity effect), and (ii) the gap due to differences in returns to these characteristics (a “residual discrimination” effect).15
The decomposition works as follows: let the earnings function for gender g = M, F be specified as follows:
where xig is a vector of observable characteristics including age, age squared, dummies for educational attainment (less than primary, primary, junior secondary, senior secondary, and tertiary), and a dummy 15 We call the part of the gap that is due to differences in returns a “residual discrimination” effect because we cannot be
certain whether the difference is actually due to discrimination or to differences in productivity that are not measured in our data.
0.3
0.4
0.5
0.6
0.7
0.8
0.9
1990 1995 2000 2005 2010
Fem
ale:
Mal
e ra
tio
Hourly wage Wage employment rate
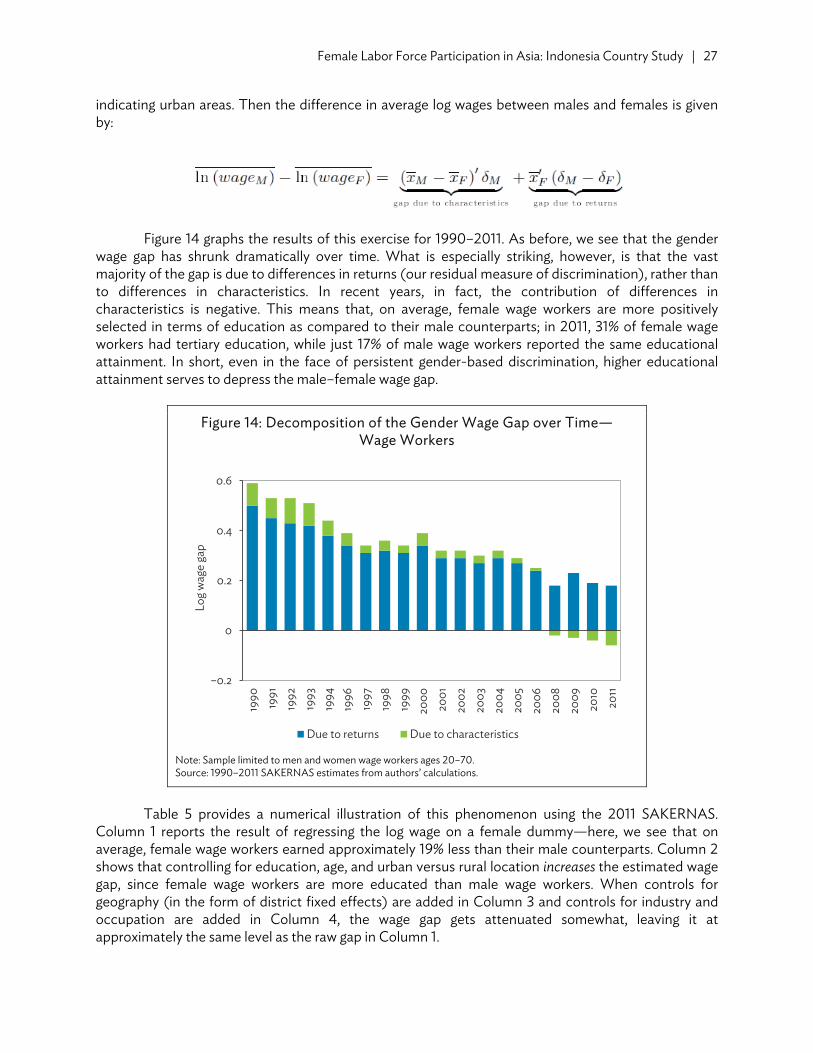
Female Labor Force Participation in Asia: Indonesia Country Study | 27
indicating urban areas. Then the difference in average log wages between males and females is given by:
Figure 14 graphs the results of this exercise for 1990–2011. As before, we see that the gender wage gap has shrunk dramatically over time. What is especially striking, however, is that the vast majority of the gap is due to differences in returns (our residual measure of discrimination), rather than to differences in characteristics. In recent years, in fact, the contribution of differences in characteristics is negative. This means that, on average, female wage workers are more positively selected in terms of education as compared to their male counterparts; in 2011, 31% of female wage workers had tertiary education, while just 17% of male wage workers reported the same educational attainment. In short, even in the face of persistent gender-based discrimination, higher educational attainment serves to depress the male–female wage gap.
Figure 14: Decomposition of the Gender Wage Gap over Time— Wage Workers
Note: Sample limited to men and women wage workers ages 20–70. Source: 1990–2011 SAKERNAS estimates from authors’ calculations.
Table 5 provides a numerical illustration of this phenomenon using the 2011 SAKERNAS.
Column 1 reports the result of regressing the log wage on a female dummy—here, we see that on average, female wage workers earned approximately 19% less than their male counterparts. Column 2 shows that controlling for education, age, and urban versus rural location increases the estimated wage gap, since female wage workers are more educated than male wage workers. When controls for geography (in the form of district fixed effects) are added in Column 3 and controls for industry and occupation are added in Column 4, the wage gap gets attenuated somewhat, leaving it at approximately the same level as the raw gap in Column 1.
–0.2
0
0.2
0.4
0.6
1990 1991
1992
1993
1994
1996
1997
1998
1999
2000
2001
2002
2003
2004
2005
2006
2008
2009
2010
2011
Log w
age
gap
Due to returns Due to characteristics
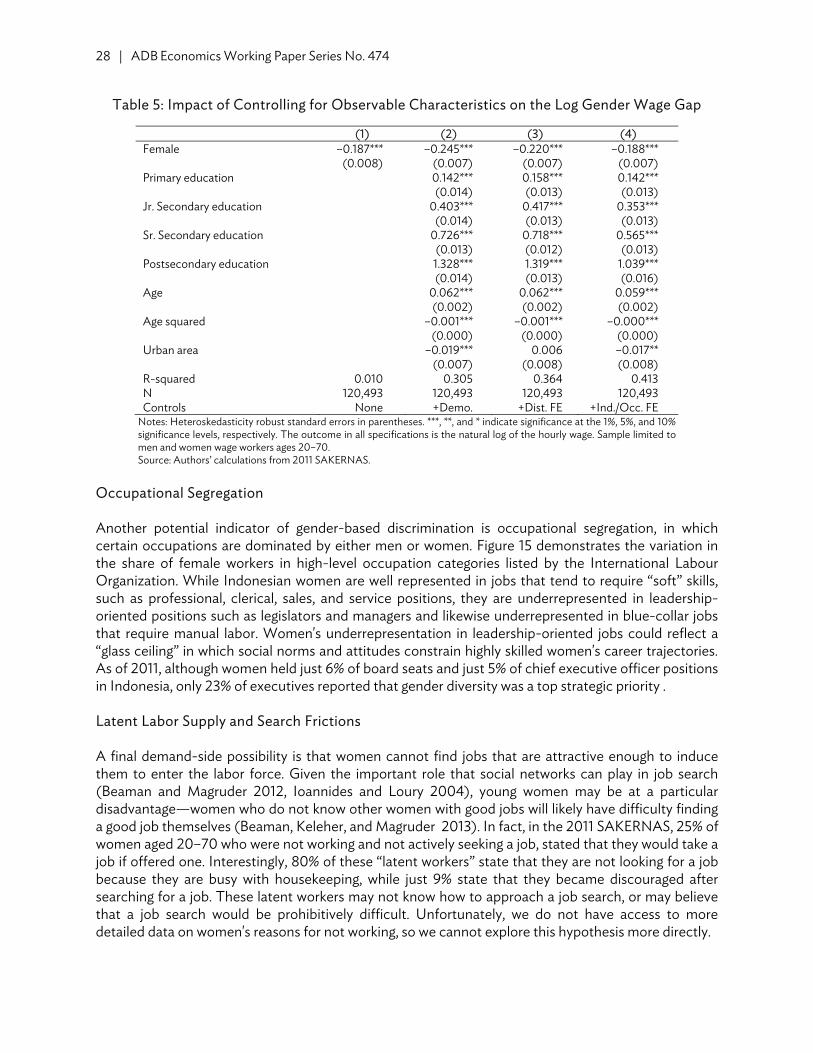
28 | ADB Economics Working Paper Series No. 474
Table 5: Impact of Controlling for Observable Characteristics on the Log Gender Wage Gap
(1) (2) (3) (4) Female –0.187*** –0.245*** –0.220*** –0.188***
(0.008) (0.007) (0.007) (0.007)Primary education 0.142*** 0.158*** 0.142***
(0.014) (0.013) (0.013)Jr. Secondary education 0.403*** 0.417*** 0.353***
(0.014) (0.013) (0.013)Sr. Secondary education 0.726*** 0.718*** 0.565***
(0.013) (0.012) (0.013)Postsecondary education 1.328*** 1.319*** 1.039***
(0.014) (0.013) (0.016)Age 0.062*** 0.062*** 0.059***
(0.002) (0.002) (0.002)Age squared –0.001*** –0.001*** –0.000***
(0.000) (0.000) (0.000)Urban area –0.019*** 0.006 –0.017**
(0.007) (0.008) (0.008)R-squared 0.010 0.305 0.364 0.413N 120,493 120,493 120,493 120,493Controls None +Demo. +Dist. FE +Ind./Occ. FE
Notes: Heteroskedasticity robust standard errors in parentheses. ***, **, and * indicate significance at the 1%, 5%, and 10% significance levels, respectively. The outcome in all specifications is the natural log of the hourly wage. Sample limited to men and women wage workers ages 20–70. Source: Authors’ calculations from 2011 SAKERNAS.
Occupational Segregation Another potential indicator of gender-based discrimination is occupational segregation, in which certain occupations are dominated by either men or women. Figure 15 demonstrates the variation in the share of female workers in high-level occupation categories listed by the International Labour Organization. While Indonesian women are well represented in jobs that tend to require “soft” skills, such as professional, clerical, sales, and service positions, they are underrepresented in leadership-oriented positions such as legislators and managers and likewise underrepresented in blue-collar jobs that require manual labor. Women's underrepresentation in leadership-oriented jobs could reflect a “glass ceiling” in which social norms and attitudes constrain highly skilled women's career trajectories. As of 2011, although women held just 6% of board seats and just 5% of chief executive officer positions in Indonesia, only 23% of executives reported that gender diversity was a top strategic priority . Latent Labor Supply and Search Frictions A final demand-side possibility is that women cannot find jobs that are attractive enough to induce them to enter the labor force. Given the important role that social networks can play in job search (Beaman and Magruder 2012, Ioannides and Loury 2004), young women may be at a particular disadvantage—women who do not know other women with good jobs will likely have difficulty finding a good job themselves (Beaman, Keleher, and Magruder 2013). In fact, in the 2011 SAKERNAS, 25% of women aged 20–70 who were not working and not actively seeking a job, stated that they would take a job if offered one. Interestingly, 80% of these “latent workers” state that they are not looking for a job because they are busy with housekeeping, while just 9% state that they became discouraged after searching for a job. These latent workers may not know how to approach a job search, or may believe that a job search would be prohibitively difficult. Unfortunately, we do not have access to more detailed data on women's reasons for not working, so we cannot explore this hypothesis more directly.
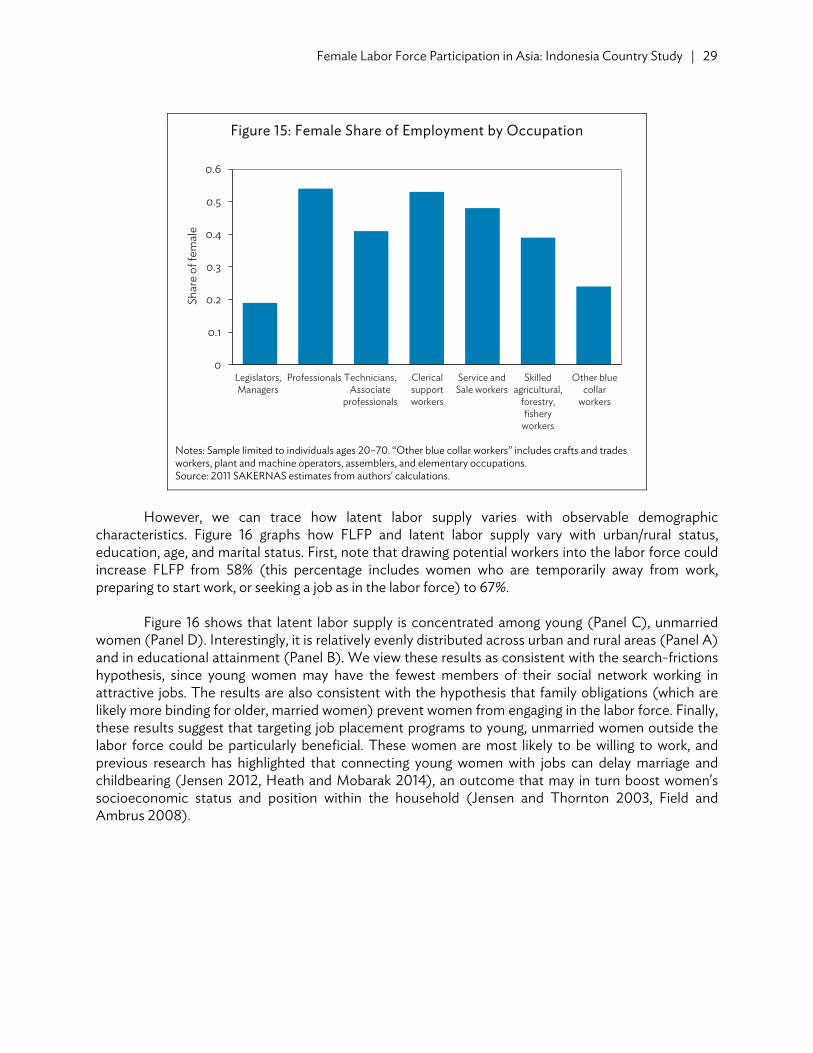
Female Labor Force Participation in Asia: Indonesia Country Study | 29
Figure 15: Female Share of Employment by Occupation
Notes: Sample limited to individuals ages 20–70. “Other blue collar workers” includes crafts and trades workers, plant and machine operators, assemblers, and elementary occupations. Source: 2011 SAKERNAS estimates from authors' calculations.
However, we can trace how latent labor supply varies with observable demographic
characteristics. Figure 16 graphs how FLFP and latent labor supply vary with urban/rural status, education, age, and marital status. First, note that drawing potential workers into the labor force could increase FLFP from 58% (this percentage includes women who are temporarily away from work, preparing to start work, or seeking a job as in the labor force) to 67%.
Figure 16 shows that latent labor supply is concentrated among young (Panel C), unmarried
women (Panel D). Interestingly, it is relatively evenly distributed across urban and rural areas (Panel A) and in educational attainment (Panel B). We view these results as consistent with the search-frictions hypothesis, since young women may have the fewest members of their social network working in attractive jobs. The results are also consistent with the hypothesis that family obligations (which are likely more binding for older, married women) prevent women from engaging in the labor force. Finally, these results suggest that targeting job placement programs to young, unmarried women outside the labor force could be particularly beneficial. These women are most likely to be willing to work, and previous research has highlighted that connecting young women with jobs can delay marriage and childbearing (Jensen 2012, Heath and Mobarak 2014), an outcome that may in turn boost women's socioeconomic status and position within the household (Jensen and Thornton 2003, Field and Ambrus 2008).
0
0.1
0.2
0.3
0.4
0.5
0.6
Legislators,Managers
Professionals Technicians,Associate
professionals
Clericalsupportworkers
Service andSale workers
Skilledagricultural,
forestry,fishery
workers
Other bluecollar
workers
Shar
e of
fem
ale
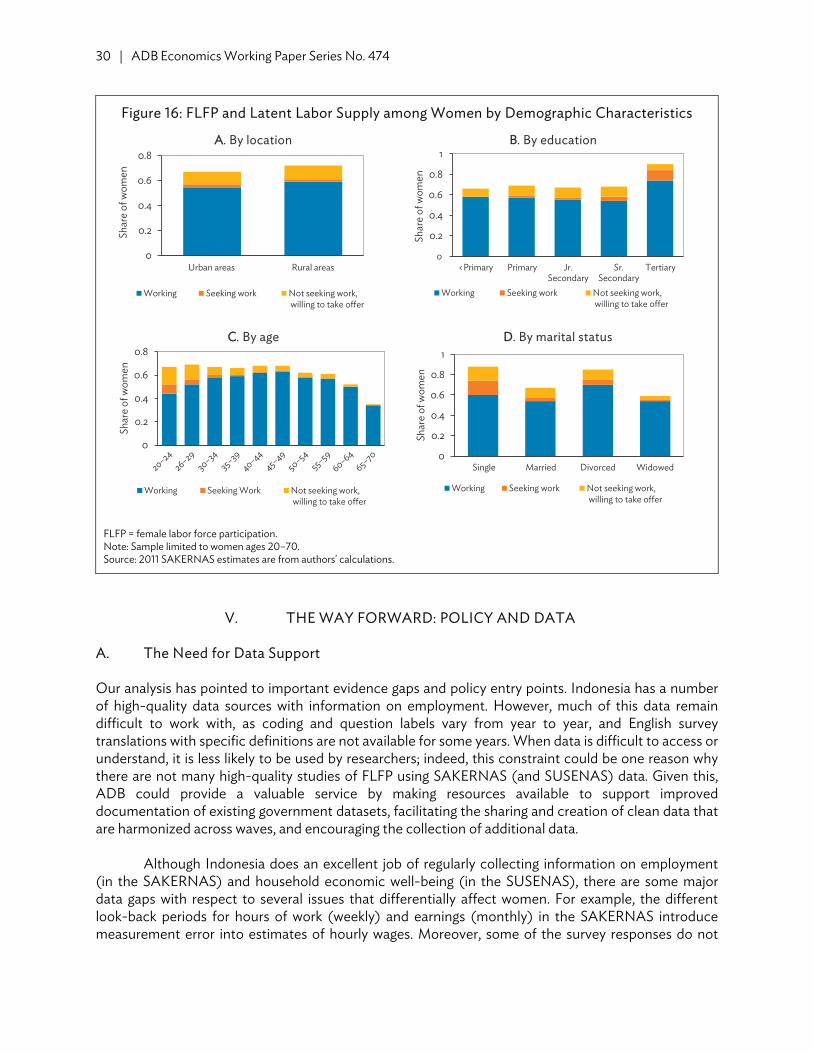
30 | ADB Economics Working Paper Series No. 474
Figure 16: FLFP and Latent Labor Supply among Women by Demographic Characteristics
FLFP = female labor force participation. Note: Sample limited to women ages 20–70. Source: 2011 SAKERNAS estimates are from authors' calculations.
V. THE WAY FORWARD: POLICY AND DATA A. The Need for Data Support Our analysis has pointed to important evidence gaps and policy entry points. Indonesia has a number of high-quality data sources with information on employment. However, much of this data remain difficult to work with, as coding and question labels vary from year to year, and English survey translations with specific definitions are not available for some years. When data is difficult to access or understand, it is less likely to be used by researchers; indeed, this constraint could be one reason why there are not many high-quality studies of FLFP using SAKERNAS (and SUSENAS) data. Given this, ADB could provide a valuable service by making resources available to support improved documentation of existing government datasets, facilitating the sharing and creation of clean data that are harmonized across waves, and encouraging the collection of additional data.
Although Indonesia does an excellent job of regularly collecting information on employment (in the SAKERNAS) and household economic well-being (in the SUSENAS), there are some major data gaps with respect to several issues that differentially affect women. For example, the different look-back periods for hours of work (weekly) and earnings (monthly) in the SAKERNAS introduce measurement error into estimates of hourly wages. Moreover, some of the survey responses do not
0
0.2
0.4
0.6
0.8
Urban areas Rural areas
Shar
e of
wom
enAA. By location
Working Seeking work Not seeking work, willing to take offer
0
0.2
0.4
0.6
0.8
1
<Primary Primary Jr.Secondary
Sr.Secondary
Tertiary
Shar
e of
wom
en
BB. By education
Working Seeking work Not seeking work, willing to take offer
0
0.2
0.4
0.6
0.8
20–2426–29
30–3435–39
40–4445–49
50–5455–59
60–6465–70
Shar
e of
wom
en
CC. By age
Working Seeking Work Not seeking work, willing to take offer
0
0.2
0.4
0.6
0.8
1
Single Married Divorced Widowed
Shar
e of
wom
en
DD. By marital status
Working Seeking work Not seeking work, willing to take offer
Female Labor Force Participation in Asia: Indonesia Country Study | 31
address gender-specific issues (e.g., “family or child care obligations” is not a potential answer to the question “Why did you stop working?”).
Moreover, we found no systematic data on benefits, working conditions, or discrimination,
which is information that could shed light on drivers of the gender wage gap and provide guidance regarding policies the government could use to empower female workers. A time-use survey has not been conducted in Indonesia since 1999. Regular collection of such data is essential for understanding the constraints that household responsibilities impose on FLFP. Finally, while the SUSENAS asks whether individuals have been a victim of crime, the number of reports of incidents like rape and family violence are extremely low, which suggests a risk of reporting bias. (In general, such questions require specialized training of enumerators and careful survey design.) B. The Need for Research on Specific Interventions ADB gender programming could be especially impactful when directed toward areas where observational evidence suggests that a policy intervention is needed, but where well-identified evidence is scant. The right high-quality empirical research would help clarify the convoluted relationship between labor demand and supply, while identifying effective strategies to promote FLFP. To this end, we encourage pilots of potential policy solutions that incorporate rigorous impact assessments (e.g., randomized controlled trials). This would direct resources to high potential return areas while providing critical evidence as to both the efficacy of the policy under study and the relative importance of different supply- and demand-based constraints to FLFP.
Our literature review and diagnostic analysis have identified several important constraints to FLFP and have highlighted areas in which further research is needed. Our hope is that this country paper will serve as a launching pad for such efforts in Indonesia. As an example, in the next subsection we will draw on the results of our diagnostic analysis to elaborate on a particularly promising area for research-policy engagement—female-focused vocational training paired with job matching services. C. Policy Focus: Job Matching Services and Vocational Training Over the course of our diagnostic assessment, one clear theme that has emerged is that wage jobs appear to be, in many ways, “better” jobs. Participation in wage labor is strongly associated with better education and greater empowerment. Moreover, our analysis of latent labor supply suggests that a substantial share of women would be willing to work provided they could find a suitable job. Job matching and placement services could help draw these latent workers into the labor force by (i) reducing women’s job search costs through the cultivation of strong relationships with employers, (ii) providing career counseling, and (iii) serving as a source of information. Well-designed services could also help women match with high-productivity jobs that generate higher returns.
Several evaluations of job-matching services have already been conducted. However, the majority have taken place in the US or Europe and many have targeted youth exclusively. Perhaps most relevant for our context is Jensen’s (2012) finding that sending business process outsourcing recruiters to Indian villages increased female employment in this sector while delaying marriage and reducing fertility. In the US, Meyer (1995) analyzed data from a series of policy experiments on those receiving unemployment insurance and found that job-matching services increased in a cost-effective way the individual rate of transition to work. Using data from a French public employment agency in 1986, Fougère, Pradel, and Roger (2005) found that job-matching services raised transitions to employment
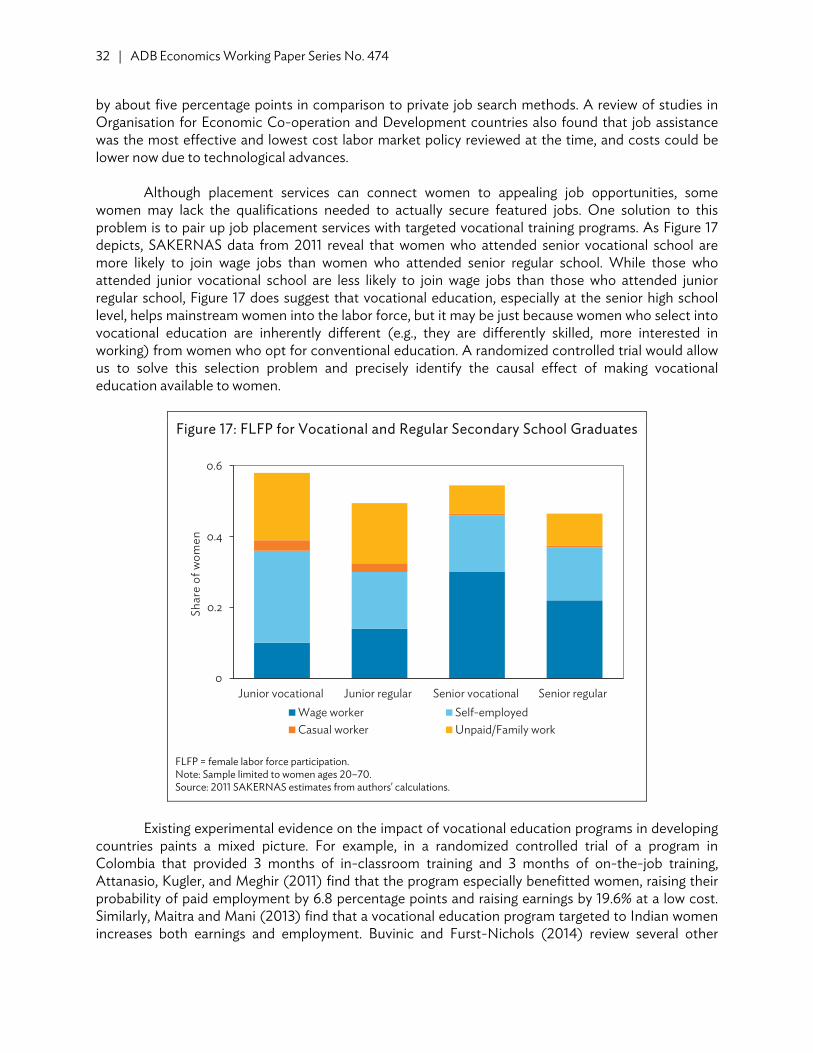
32 | ADB Economics Working Paper Series No. 474
by about five percentage points in comparison to private job search methods. A review of studies in Organisation for Economic Co-operation and Development countries also found that job assistance was the most effective and lowest cost labor market policy reviewed at the time, and costs could be lower now due to technological advances.
Although placement services can connect women to appealing job opportunities, some
women may lack the qualifications needed to actually secure featured jobs. One solution to this problem is to pair up job placement services with targeted vocational training programs. As Figure 17 depicts, SAKERNAS data from 2011 reveal that women who attended senior vocational school are more likely to join wage jobs than women who attended senior regular school. While those who attended junior vocational school are less likely to join wage jobs than those who attended junior regular school, Figure 17 does suggest that vocational education, especially at the senior high school level, helps mainstream women into the labor force, but it may be just because women who select into vocational education are inherently different (e.g., they are differently skilled, more interested in working) from women who opt for conventional education. A randomized controlled trial would allow us to solve this selection problem and precisely identify the causal effect of making vocational education available to women.
Figure 17: FLFP for Vocational and Regular Secondary School Graduates
FLFP = female labor force participation. Note: Sample limited to women ages 20–70. Source: 2011 SAKERNAS estimates from authors' calculations.
Existing experimental evidence on the impact of vocational education programs in developing
countries paints a mixed picture. For example, in a randomized controlled trial of a program in Colombia that provided 3 months of in-classroom training and 3 months of on-the-job training, Attanasio, Kugler, and Meghir (2011) find that the program especially benefitted women, raising their probability of paid employment by 6.8 percentage points and raising earnings by 19.6% at a low cost. Similarly, Maitra and Mani (2013) find that a vocational education program targeted to Indian women increases both earnings and employment. Buvinic and Furst-Nichols (2014) review several other
0
0.2
0.4
0.6
Junior vocational Junior regular Senior vocational Senior regular
Shar
e of
wom
en
Wage worker Self-employedCasual worker Unpaid/Family work
Female Labor Force Participation in Asia: Indonesia Country Study | 33
programs that delivered a mixture of skills training and job placement services to women in developing countries to positive effect. In contrast, Cho et al. (2013) find that a vocational training program in Malawi failed to improve labor market outcomes for young women. The authors argue that program dropout driven by household and family obligations may have limited the efficacy of the program. This supports the idea that training and placement programs should be tailored to account for the constraints and needs of women in the relevant country context.
Our analysis shows that women develop a propensity for pursuing informal labor after having
children and suggests that women have a need for flexibility on the job. A female-centered job placement service could explicitly address this by highlighting part-time work opportunities or coordinating half-day shifts with cooperative employers. This could be a natural extension of existing efforts, like those of some placement agencies that go as far as providing women with clothing for interviews and providing childcare in vulnerable communities. Based on our finding that empowerment is significantly correlated with both formal work and education (Figure 11), it may be particularly impactful to target the program described above for young women at risk of dropping out of school to start a family or those who work informally.
Even so, such a job matching-vocational education policy package would prove ineffectual if
women face harassment at work, or if jobs are not locally available and women cannot overcome social norms restricting mobility and participation. Moreover, some employers may be averse to hiring women due to their own discriminatory views or the cost of employing women: in Indonesia, some employers provide security for female employees, and employers are usually responsible for the cost of maternal leave. Employers may also be more likely to hire woman at lower wages, perpetuating gender-inequality on the job.
VI. CONCLUSION At first glance, official statistics suggest that FLFP in Indonesia has been stagnant for many years. However, our diagnostic assessment has found evidence of important changes below the surface. First, our analysis of historical SAKERNAS data reveals a strong U-shaped relationship between FLFP and education. This suggests that Indonesia’s flat overall FLFP rate reflects two opposing forces at work: an increasing share of women with tertiary education have brought about gains in FLFP, but these gains have been offset by reductions in FLFP owing to educational growth at the bottom end of the socioeconomic distribution. Both of these patterns likely reflect welfare gains—highly educated young women are gaining access to well-paid, meaningful work, while women in poorer families are becoming less likely to resort to unappealing informal work to make ends meet. These patterns are reinforced by our cohort-based lifecycle analysis, which finds that young rural women are opting out of unpaid work, while young urban women are increasingly likely to hold wage jobs.
Of course, not all wage jobs are good jobs, and it is important to keep in mind that most women work in the informal sector. One key challenge for policy makers is therefore ensuring that lower-income, more vulnerable women have access to rewarding work opportunities. Although we find suggestive evidence that wage jobs are especially beneficial for women, we believe that any inclusive approach must account for the fact that most low-skilled women work in the informal sector, either by working for family members or by running their own business. In the preceding section, we discussed how job placement services, paired with vocational education, could address these issues.
34 | ADB Economics Working Paper Series No. 474
Alternatively, programs and policies that help women develop more profitable microenterprises could also be impactful.16
More broadly, there is a substantial need for more well-identified research on barriers to FLFP
in Indonesia. For example, the lifecycle patterns that we have found suggest that many women wait to enter the labor market until after their children are older. If this behavior is driven by a simple need for childcare, community-based childcare centers could help boost FLFP. However, if this behavior is also governed by social norms dictating that “good mothers stay home with their children,” then additional behavioral change communication may be needed for a childcare center policy to be effective. One way to generate evidence while simultaneously making progress on the policy front is to incorporate rigorous monitoring and evaluation into pilots of new policy innovations. The data from these evaluations would aid decision makers in introducing policies that help Indonesian women contribute to the labor market while fulfilling their goals outside the workplace.
16 One potential entry point is Indonesia's massive community-based block grant program, called the National Program for
Community Empowerment. While most of the grants are used for community infrastructure, a portion can be allocated toward a revolving loan fund, which can be accessed by (mostly) female microentrepreneurs.
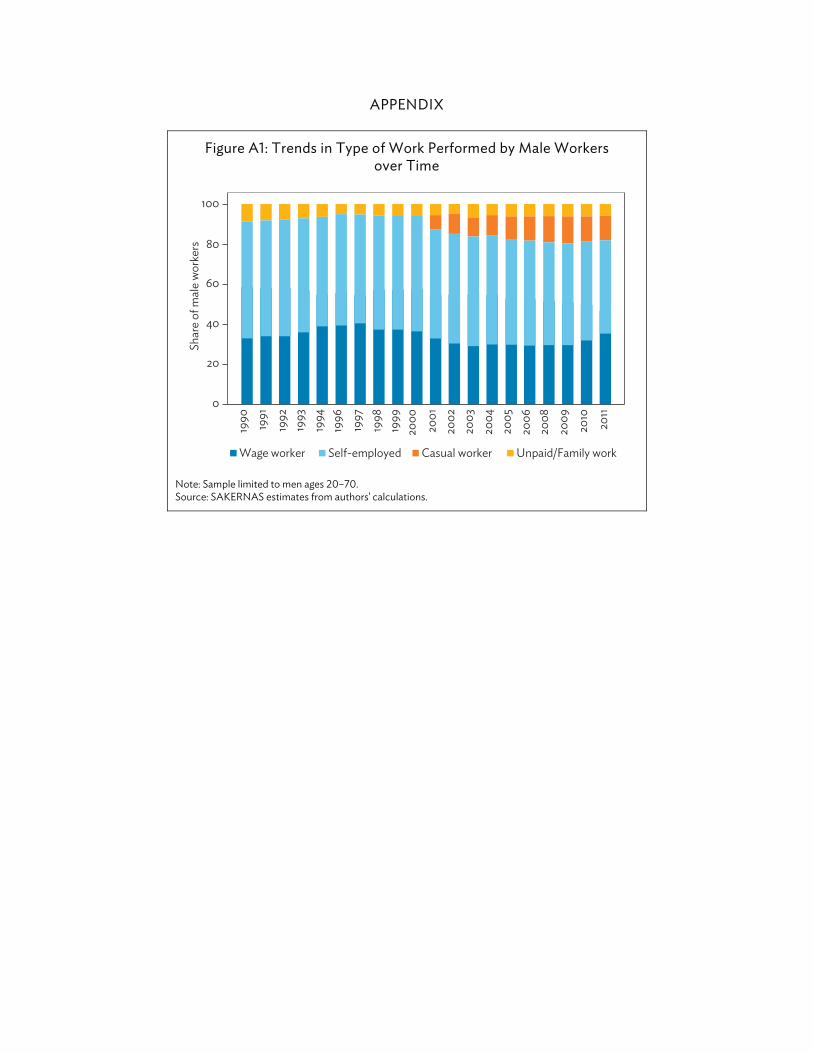
APPENDIX
Figure A1: Trends in Type of Work Performed by Male Workers over Time
Note: Sample limited to men ages 20–70. Source: SAKERNAS estimates from authors' calculations.
1990
0
20
40
Shar
e of
mal
e w
orke
rs
60
80
100
1991
1992
1993
1994
1996
1997
1998
1999
2000
2001
2002
2003
2004
2005
2006
2008
2009
2010
2011
Wage worker Self-employed Casual worker Unpaid/Family work
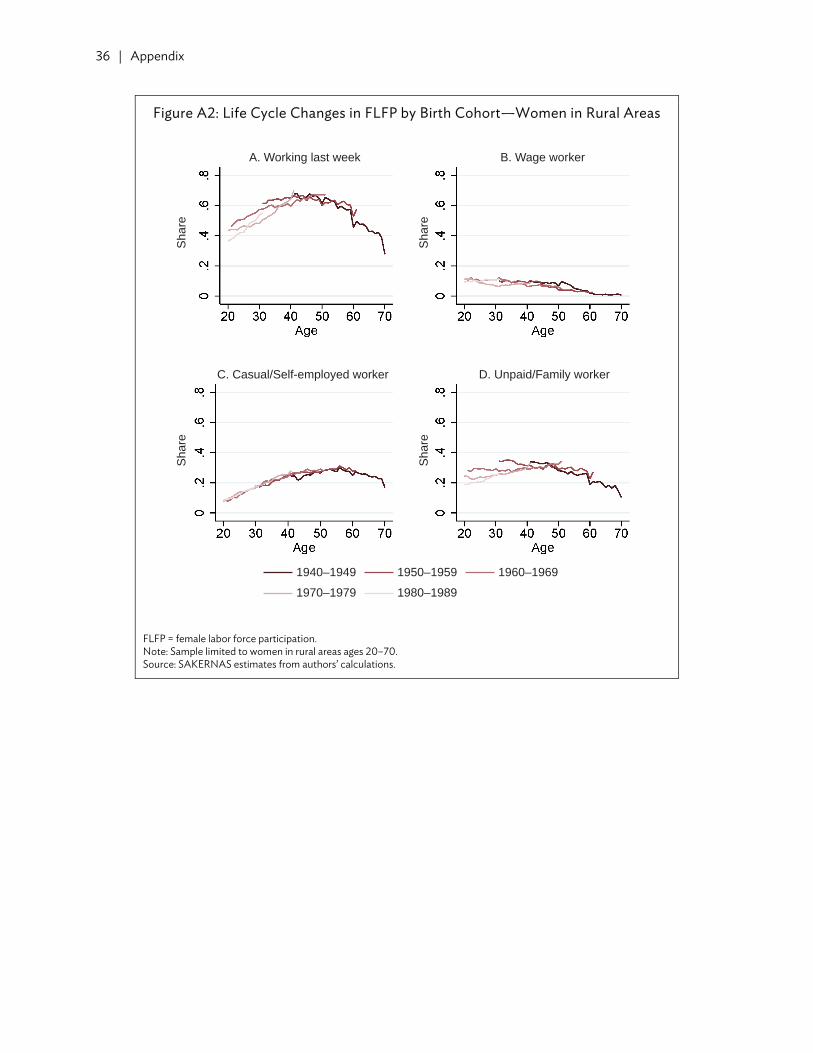
36 | Appendix
Figure A2: Life Cycle Changes in FLFP by Birth Cohort—Women in Rural Areas
FLFP = female labor force participation. Note: Sample limited to women in rural areas ages 20–70. Source: SAKERNAS estimates from authors’ calculations.
1940–1949
1970–1979
1950–1959
1980–1989
1960–1969
A. Working last week B. Wage worker
C. Casual/Self-employed worker
Sh
are
Sh
are
Sh
are
Sh
are
D. Unpaid/Family worker
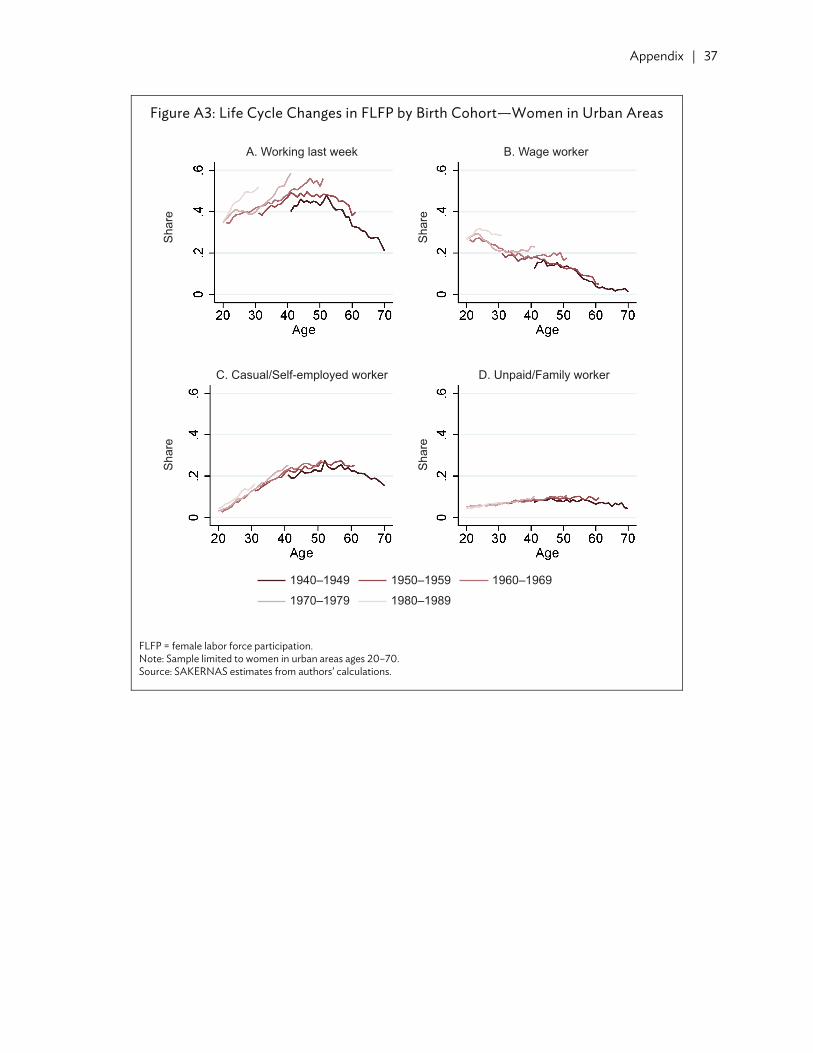
Appendix | 37
Figure A3: Life Cycle Changes in FLFP by Birth Cohort—Women in Urban Areas
FLFP = female labor force participation. Note: Sample limited to women in urban areas ages 20–70. Source: SAKERNAS estimates from authors’ calculations.
1940–1949
1970–1979
1950–1959
1980–1989
1960–1969
A. Working last week
C. Casual/Self-employed worker
Sh
are
Sh
are
Sh
are
Sh
are
D. Unpaid/Family worker
B. Wage worker
REFERENCES Addati, L., N. Cassier, and K. Gilchrist. 2014. Maternity and Paternity at Work: Law and Practice across
the World. Technical report. International Labour Organization. Alatas, V., and L. Cameron. 2003. The Impact of Minimum Wages on Employment in a Low-Income
Country: An Evaluation using the Difference-in-Differences Approach. World Bank Policy Research Working Paper 2985.
Amnesty International. 2012. Indonesia: Briefing to the UN Committee on the Elimination of
Discrimination against Women, 52nd session. Technical report. Angrist, J. D., and W. N. Evans. 1998. Children and Their Parents’ Labor Supply: Evidence from
Exogenous Variation in Family Size. The American Economic Review. 88 (3). pp. 450–77. Atkin, D. 2012. Endogenous Skill Acquisition and Export Manufacturing in Mexico. NBER Working
Paper No. 18266. Attanasio, O., A. Kugler, and C. Meghir. 2011. Subsidizing Vocational Training for Disadvantaged Youth
in Colombia: Evidence from a Randomized Trial. American Economic Journal: Applied Economics. 3 (3). pp. 188–220.
Bauernschuster, S., and M. Schlotter. 2015. Public Child Care and Mothers’ Labor Supply-Evidence
from Two Quasi-experiments. Journal of Public Economics. 123. pp. 1 – 16. Beaman, L., N. Keleher, and J. Magruder. 2013. Do Job Networks Disadvantage Women? Evidence
from a Recruitment Experiment in Malawi. Unpublished. http://faculty.wcas.northwestern.edu/ ~lab823/BKM_recruitment_Oct2013.pdf
Beaman, L., and J. Magruder. 2012. Who Gets the Job Referral? Evidence from a Social Networks
Experiment. The American Economic Review. 102 (7). pp. 3574–93. Better Work Indonesia. 2012. Indonesia Baseline Report: Worker Perspectives from the Factory and
Beyond. Technical report. Blackburn, S. 2004. Women and the State in Modern Indonesia. Cambridge: Cambridge University Press. Buvinic, M., and R. Furst-Nichols. 2014. Promoting Women’s Economic Empowerment: What Works?
The World Bank Research Observer. http://wbro.oxfordjournals.org/content/early/ 2014/11/27/ wbro.lku013.short
Cameron, L. A., J. M. Dowling, and C. Worswick. 2001. Education and Labor Market Participation of
Women in Asia: Evidence from Five Countries. Economic Development and Cultural Change. 49 (3). pp. 459–477.
Card, D., and A. B. Krueger. 1995. Time-Series Minimum-Wage Studies: A Meta-analysis. The American
Economic Review. 85 (2). pp. 238–43.
40 | References
Central Intelligence Agency (CIA). 2014. CIA World Fact Book. https://www.cia.gov/library/ publications/resources/the-world-factbook/ (accessed 11 January 2015).
Cho, Y., D. Kalomba, A. M. Mobarak, and V. Orozco. 2013. Gender Differences in the Effects of
Vocational Training: Constraints on Women and Drop-Out Behavior. World Bank Policy Research Working Paper No. 6545.
Cribb, R. 1999. Nation: Making Indonesia. In D. K. Emmerson and A. Society, eds. Indonesia Beyond
Suharto: Polity, Economy, Society, Transition, pp. 3–38. Armonk, NY: M. E. Sharpe. Fallon, P. R., and R. E. Lucas. 2002. The Impact of Financial Crises on Labor Markets, Household
Incomes, and Poverty: A Review of Evidence. The World Bank Research Observer, 17 (1). pp. 21–45.
Federman, M., and D. I. Levine. 2005. The Effects of Industrialization on Education and Youth Labor in
Indonesia. The B.E. Journal of Macroeconomics. 5 (1). pp. 1–34. Field, E., and A. Ambrus. 2008. Early Marriage, Age of Menarche, and Female Schooling Attainment in
Bangladesh. Journal of Political Economy. 116 (5). pp. 881–930. Fougère, D., J. Pradel, and M. Roger. 2005. Does Job-Search Assistance Affect Search Effort and
Outcomes? A Microeconometric Analysis of Public versus Private Search Methods. IZA Discussion Paper No. 1825.
Frankenberg, E., J. P. Smith, and D. Thomas. 2003. Economic Shocks, Wealth, and Welfare. Journal of
Human Resources. 38 (2). pp. 280–321. Goldin, C. 1995. The U-Shaped Female Labor Force Function in Economic Development and
Economic History. In T. P. Schultz Investment in Women's Human Capital and Economic Development, pp. 61–90. Chicago, IL: University of Chicago Press.
Heath, R., and A. M. Mobarak. 2014. Manufacturing Growth and the Lives of Bangladeshi Women.
Unpublished. Iaccino, L. 2014. Indonesia: Aceh Province Enforces Sharia for Non-Muslims. International Business
Times. http://www.ibtimes.co.uk/indonesia-aceh-province-enforces-sharia-non-muslims-1435497
International Labour Organization (ILO). 2011. Key Indicators of the Labor Market Database (KILM).
Seventh Edition. http://www.ilo.org/empelm/pubs/WCMS_114060/lang--en/index.htm
International Monetary Fund (IMF). 2013. International Financial Statistics. UK Data Service. http:// www.esds.ac.uk/international/doipages/imfifs.asp
Ioannides, Y. M., and L. D. Loury. 2004. Job Information Networks, Neighborhood Effects, and
Inequality. Journal of Economic Literature. 42 (4). pp. 1056–93. Jensen, R. 2012. Do Labor Market Opportunities Affect Young Women's Work and Family Decisions?
Experimental Evidence from India. The Quarterly Journal of Economics. 127 (2). pp. 753–92.
References | 41
Jensen, R., and R. Thornton. 2003. Early Female Marriage in the Developing World. Gender and
Development. 11 (2). pp. 9–19. Kawata, H., and S. Naganuma. 2010. Labor Force Participation Rate in Japan. Bank of Japan Review
Series. E-7. Lee, S.-A., J.-E. Cho, S. Park, and S. S.-Y. Lee. 2013. It's More than an M-shape: The Political Economy
of Female Non-standard Workers in the Republic of Korea. Asian Social Work and Policy Review. 7 (1). pp. 1–17.
Levine, D., and M. Kevane. 2003. Are Investments in Daughters Lower When Daughters Move Away?
Evidence From Indonesia. World Development. 31 (6). pp. 1065–84. Maccini, S., and D. Yang. 2009. Under the Weather: Health, Schooling, and Economic Consequences
of Early-Life Rainfall. The American Economic Review. 99 (3). pp. 1006–26. Maitra, P., and S. Mani. 2013. Learning and Earning: Evidence from a Randomized Evaluation in India.
Fordham University, Department of Economics, Discussion Paper Series 2013-02. Meyer, B. D. 1995. Lessons from the US Unemployment Insurance Experiments. Journal of Economic
Literature. 33. pp. 91–131. Oaxaca, R. 1973. Male-Female Wage Differentials in Urban Labor Markets. International Economic
Review. 14 (3). pp. 693–709. Organisation for Economic Co-Operation and Development (OECD). 2013. National Accounts at a
Glance. http://www.oecd-ilibrary.org/economics/main-economic-indicators-volume-2015 -issu12/indonesia_mei-v2015-12-table97-en
Priebe, J. 2010. Child Costs and the Causal Effect of Fertility on Female Labor Supply: An Investigation
for Indonesia 1993–2008. Courant Research Centre – Poverty, Equity and Growth Discussion Papers. 45. http://www.uni-goettingen.de/en/67061.html
Quota Project. 2014. Global Database of Quotas for Women. http://www.quotaproject.org/uid/
countryview.cfm?CountryCode=ID Radhakrishnan, U. 2010. A Dynamic Structural Model of Contraceptive Use and Employment Sector
Choice for Women in Indonesia. US Census Bureau Center for Economic Studies Paper No. CES-WP-10-28. http://www2.census.gov/ces/wp/2010/CES-WP-10-28.pdf
Reerink, A. 2006. Report on a Survey of Women and Gender Issues in Trade Union Organizations in
Indonesia. Technical report. International Labour Organization. http://www.ilo.org/jakarta/ whatwedo/ publications/WCMS_117189/lang--en/index.htm
Rutstein, S. O., and K. Johnson. 2004. The DHS Wealth Index. DHS Comparative Reports No. 6.
Calverton, Maryland: ORC Macro.
42 | References
Smith, J. P., D. Thomas, E. Frankenberg, K. Beegle, and G. Teruel. 2002. Wages, Employment and Economic Shocks: Evidence from Indonesia. Journal of Population Economics. 15 (1). pp. 161–93.
Statistics Indonesia. National Labor Force Survey (SAKERNAS) Database. http://microdata.bps.go.id/
mikrodata/index.php/catalog/SAKERNAS Statistics Indonesia, National Population and Family Planning Board, and Kementerian Kesehatan, and
ICF International. 2013. Indonesia Demographic and Health Survey 2012. Jakarta, Indonesia. https://dhsprogram.com/pubs/pdf/FR275/FR275.pdf
Thomas, D., K. Beegle, E. Frankenberg, B. Sikoki, J. Strauss, and G. Teruel. 2004. Education in a Crisis.
Journal of Development Economics. 74 (1). pp. 53-85. United Nations Committee on the Elimination of Discrimination Against Women (CEDAW). 2005.
Consideration of reports submitted by States Parties under Article 18 of the Convention on the Elimination of All Forms of Discrimination against Women, Combined Fourth and Fifth Periodic Reports of States Parties, CEDAW/C/IDN/4-5. Indonesia. 27 July. http://www.refworld.org/docid/453778220.html
————. 2011. Consideration of reports submitted by States Parties under Article 18 of the Convention
on the Elimination of All Forms of Discrimination against Women, Combined Sixth and Seventh Periodic Reports of States Parties, CEDAW/C/IDN/6-7. Indonesia. 7 January. http://www.refworld.org/docid/50604fa92.html
United Nations Development Program (UNDP). 1997. Guidelines on Women's Empowerment.
Technical report, United Nations Population Division. ————. 2013. Human Development Report. http://hdr.undp.org/sites/default/files/reports/14/hdr2013
_en_complete.pdf United Nations Educational, Scientific, and Cultural Organization. (UNESCO). 2012. UNESCO
Institute for Statistics. http://www.uis.unesco.org/Library/Documents/global_education _digest_2011_en.pdf
United Nations Office on Drugs and Crime (UNODC). 2010. International Statistics on Crime and
Justice. In S. Harrendorf, M. Heskanen, and M. Steven, eds. HEUNI Publication Series No. 64. Helsinki.
Win, T. L. 2014. Time Running Out for Indonesia’s Stalled Gender Equality Bill. Thomson Reuters
Foundation News. http://news.trust.org//item/20140407102159-sdf37/ World Bank. 2013. World Development Indicators. http://data.worldbank.org/data-catalog/world
-development-indicators/wdi-2013
ASIAN DEVELOPMENT BANK
AsiAn Development BAnk6 ADB Avenue, Mandaluyong City1550 Metro Manila, Philippineswww.adb.org
Female Labor Force Participation in Asia: Indonesia Country Study
This paper uses over 20 years of data from Indonesia’s labor force survey to study trends in and constraints to female labor force participation. We also survey existing evidence, identify data gaps, and outline a research-policy evaluation of female-centered vocational training and job placement services, which may be effective tools to increase female labor force participation.
About the Asian Development Bank
ADB’s vision is an Asia and Pacific region free of poverty. Its mission is to help its developing member countries reduce poverty and improve the quality of life of their people. Despite the region’s many successes, it remains home to the majority of the world’s poor. ADB is committed to reducing poverty through inclusive economic growth, environmentally sustainable growth, and regional integration.
Based in Manila, ADB is owned by 67 members, including 48 from the region. Its main instruments for helping its developing member countries are policy dialogue, loans, equity investments, guarantees, grants, and technical assistance.
FemALe LABor ForCe PArtICIPAtIon In ASIA: InDoneSIA Country StuDySimone Schaner and Smita Das
adb economicsworking paper series
no. 474
February 2016

![Fertility Model and Female Labour Force Participation in Selected … · 2013-05-08 · between fertility and female labour force participation [9]. Most studies on labour force participation](https://img.pdfslide.us/doc/110x75/5e98a78712fceb60083365ee/fertility-model-and-female-labour-force-participation-in-selected-2013-05-08-between.jpg)