Embed Size (px)
Citation preview
Fellesseminar fredag 16. februar kl. 14:15 i aud. A:
N t f h d tNaturgass fra hydratreservoarer -en global energiressurs?en global energiressurs?Arne Graue og Bjørn Kvamme

OUTLINEOUTLINE•• Gas hydrates and thermodynamic stabilityGas hydrates and thermodynamic stabilityGas hydrates and thermodynamic stabilityGas hydrates and thermodynamic stability
•• Global resources of hydrates and hydrate Global resources of hydrates and hydrate reservoir exploitationreservoir exploitation
COCO t i h d t i itht i h d t i ith•• COCO22 storage in hydrate reservoirs with storage in hydrate reservoirs with associated natural gas productionassociated natural gas production
•• Theoretical modellingTheoretical modelling
•• ConclusionsConclusions

What is natural gas hydrate?What is natural gas hydrate?
•• Methane and other Methane and other The glass to the right contains water at 0 C
small nosmall no--polar (or polar (or slightly polar) slightly polar)
l l i d il l i d i
water at 0 C
The pipe to the left contains molecules immersed in molecules immersed in water will induce water will induce organisation of theorganisation of the
hydrate at 5 C
organisation of the organisation of the water structure that water structure that maximizes the entropy.maximizes the entropy.
•• Above certain Above certain pressures and belowpressures and belowpressures, and below pressures, and below certain temperatures , certain temperatures , this results in a phase this results in a phase transition over to a transition over to a solid like structure.solid like structure.

Structure I : Ratio of 3 to 1 of large and small cavitiesStructure I : Ratio of 3 to 1 of large and small cavitiesSt t II R ti f 1 t 2 f l d ll itiSt t II R ti f 1 t 2 f l d ll itiStructure II : Ratio of 1 to 2 of large and small cavitiesStructure II : Ratio of 1 to 2 of large and small cavities
Pure methane and pure CO2 forms structure I
Content of propane and butane results in structure II

Regions of pressure and temperature Regions of pressure and temperature g p pg p pfor stability of some hydratesfor stability of some hydrates
Solid line Solid line is liquid/ice is liquid/ice coexistence curvecoexistence curve 120
Dashed line Dashed line is for is for methane hydratemethane hydrate
80
100
DashDash--dotdot is for 2 per is for 2 per cent ethane in cent ethane in 60
80
P(b
ar)
ce t et a ece t et a emethanemethane
+ are hydrate formed+ are hydrate formed40
P
+ are hydrate formed + are hydrate formed from water and an from water and an ethaneethane--rich mixture rich mixture 0
20
with methane (3 per with methane (3 per cent)cent)
250 260 270 2800
T(K)

Some verified hydrate reservoirsSome verified hydrate reservoirs(( dd ikkikk kj tkj t G lG l t k tt k t ii d k jd k j ))((røderøde pikkerpikker erer kjentekjente reservoarreservoar. . GuleGule trekantertrekanter erer reservoarreservoar ii produksjonproduksjon))

Utbyggingsprosjektet Ormen Lange Utbyggingsprosjektet Ormen Lange ligger midt i ”Storegga slide”ligger midt i ”Storegga slide”ligger midt i Storegga slideligger midt i Storegga slide
Ormen Lange er Et vanlig olje/gass feltMen transporten inn til land går over berggrunn med hydratforekomster.

Flodbølgen som fulgte av den første, store Flodbølgen som fulgte av den første, store kollapsen på Storegga for 7000 år sidenkollapsen på Storegga for 7000 år sidenkollapsen på Storegga for 7000 år siden kollapsen på Storegga for 7000 år siden
druknet Skotland druknet Skotland Betydelig Betydelig nedsmelting nedsmelting av hydrat og av hydrat og tilhørende tilhørende kollapser kan kollapser kan ha skjedd så ha skjedd så sent som for sent som for 250 år siden250 år siden
Gjenværende hydrati Storegga utgjør cai Storegga utgjør ca.4000 kvadratkilometerav tykkelser 40 – 50 m

Hvor står hydrat i dag som global energiHvor står hydrat i dag som global energi--kilde?kilde?
•• I dag er hovedmotivasjonene for I dag er hovedmotivasjonene for hydratutvinning enten knapphet på egne hydratutvinning enten knapphet på egne fossile brensel og/eller ønske om mer fossile brensel og/eller ønske om mer g øg øuavhengighet mht fossile brensler eller rent uavhengighet mht fossile brensler eller rent kommersiellekommersiellekommersiellekommersielle
•• India har nylig investert 300 Mill $ til India har nylig investert 300 Mill $ til y g $y g $kartlegging (USGS kontrakt) og bygger opp kartlegging (USGS kontrakt) og bygger opp målrettet utdanning Har tidligere hevdetmålrettet utdanning Har tidligere hevdetmålrettet utdanning. Har tidligere hevdet målrettet utdanning. Har tidligere hevdet oppstart av produksjon i 2008 (”Fiery Ice oppstart av produksjon i 2008 (”Fiery Ice f Th S ” W hi t 2002f Th S ” W hi t 2002))from The Seas”, Washington, 2002from The Seas”, Washington, 2002))

Distribution of Methane Hydrate around Japan
: MH bearing zone
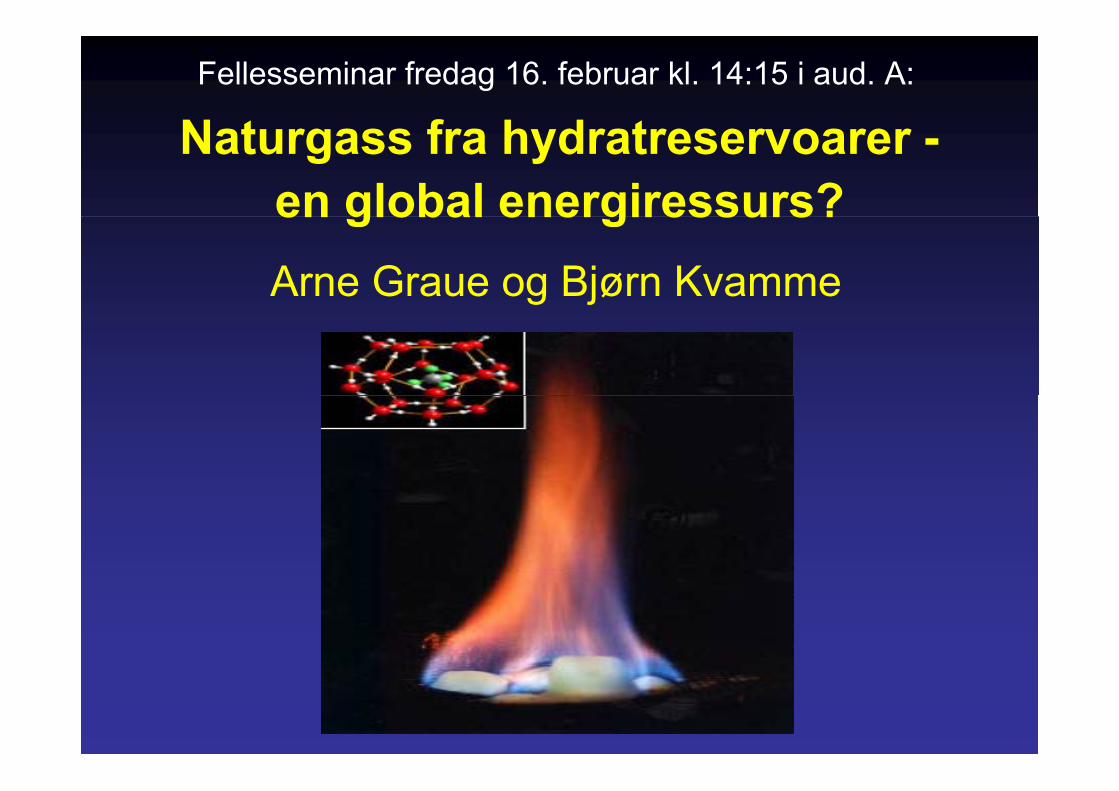
It is estimated that the MH reserves around Japan would be sufficient to last over 100 years based on present levels of natural gas consumption
MH21 Research Consortium 10February 22, 2007
over 100 years, based on present levels of natural gas consumption.
Japan’s Methane Hydrate Exploitation Programb th Mi i t f E T d d I d t J l 2001by the Ministry of Economy, Trade and Industry, July 2001.
MH21 Research Consortium
11 February 22, 2007

”Classical” approaches to hydrate production”
Dissociation aloneBrings the system out of P,T stability zone but Costly and require extra
costs roughly 5%of produced HC
ydissociation heat mustbe supplied from surroundings or added
processing. Dilution from dissociated waterLimits efficiency
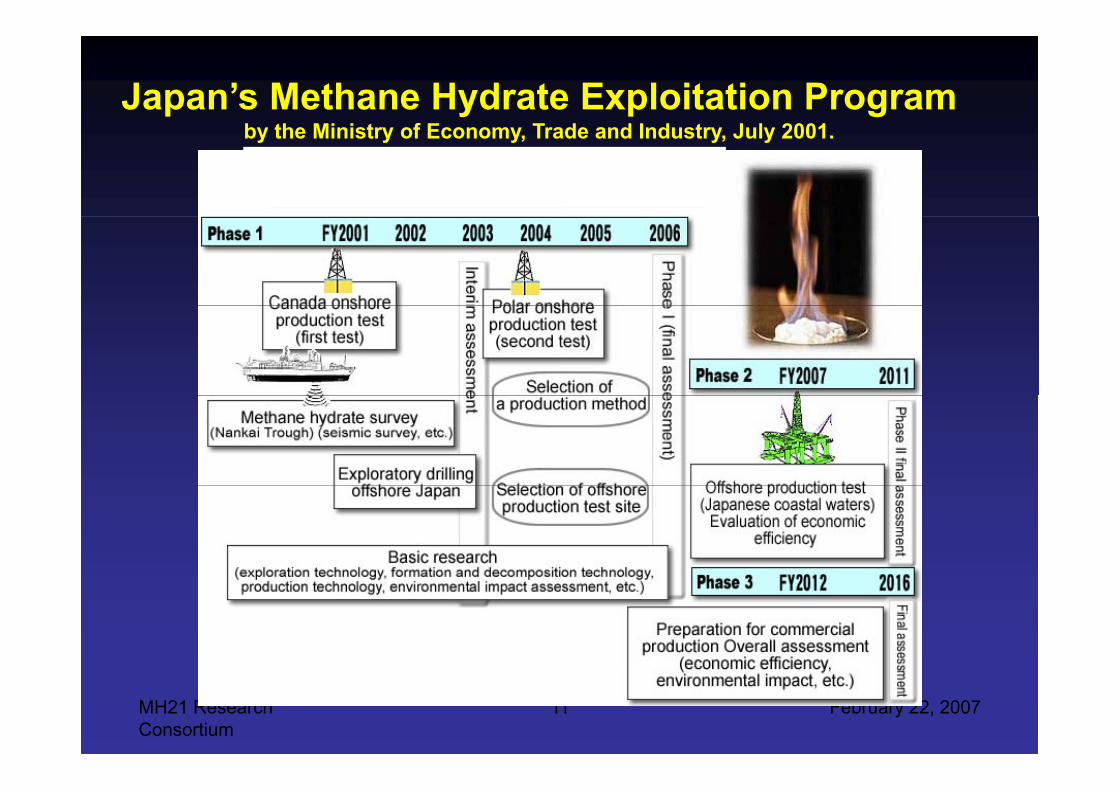
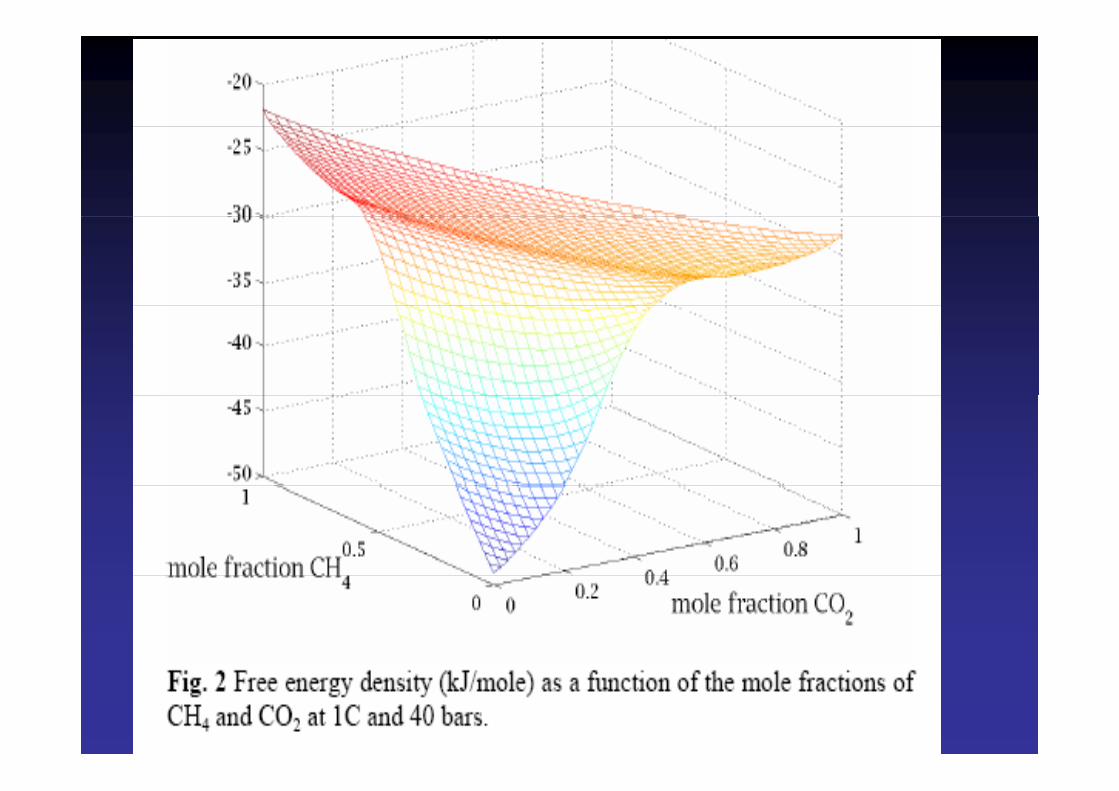
CO2 hydrateis more stablethan methane hydrate
The free energy profile isconstructed fromMD simulations( &(Kvamme &Tanaka,1995)and verified to
dreproduceexperimental stability regions(Svandal et al(Svandal et.al., 2006)
Can it beCan it be experimentallyverified that thiswill practicallywill practicallywork in porous Medium?

Project ObjectiveProject ObjectiveProject ObjectiveProject Objective
Experimentally Verify:Experimentally Verify:•• Sequestering Greenhouse Gas (COSequestering Greenhouse Gas (CO22))Sequestering Greenhouse Gas (COSequestering Greenhouse Gas (CO22))
–– Determine hydrate formation and distributionDetermine hydrate formation and distribution•• Gas Production from HydratesGas Production from Hydrates
–– Determine the rate of CODetermine the rate of CO22--CHCH44 exchangeexchange22 44 gg
N i ll P di tN i ll P di tNumerically Predict:Numerically Predict:–– The hydrate reformation and gas productionThe hydrate reformation and gas production

C fChallenges for Laboratory ExperimentsExperiments
• Form CH4 Hydrate in Sandstone4• Expose Methane Hydrate to CO2 and
Determine the Exchange Mechanisms for theDetermine the Exchange Mechanisms for the Replacement of CH4 by CO2 in the Hydrate
• Measure the Produced Methane• Measure the Produced Methane

Experimental ApproachExperimental Approach
Use Magnetic Resonance Imaging (MRI)Use Magnetic Resonance Imaging (MRI) to Image the Formation and Dissociation of Gas Hydrates In Porous Mediaof Gas Hydrates In Porous Media.

Conditions for Methane Hydrate Conditions for Methane Hydrate Formation/DissociationFormation/Dissociation

Hydrate Experiments Setupy p p
Cooled non-imagingCore
Liquid CO2/CH4Const. Pressure
Water
non imaging confining fluidplug
Const. Pressure

Experimental SetupExperimental Setup
Pore Pressure Pumps
MRI High Pressure Cell
Core PlugP P
Out
In
Out
In
CH4
CO2
Pore Pressure Pumps Core PlugPore Pressure
MRI Magnet
Confining Pressure
MRI Magnet
PCooling
Bath
Insulated Lines Confining PressurePump
Bath
ReciprocatingPumpPump
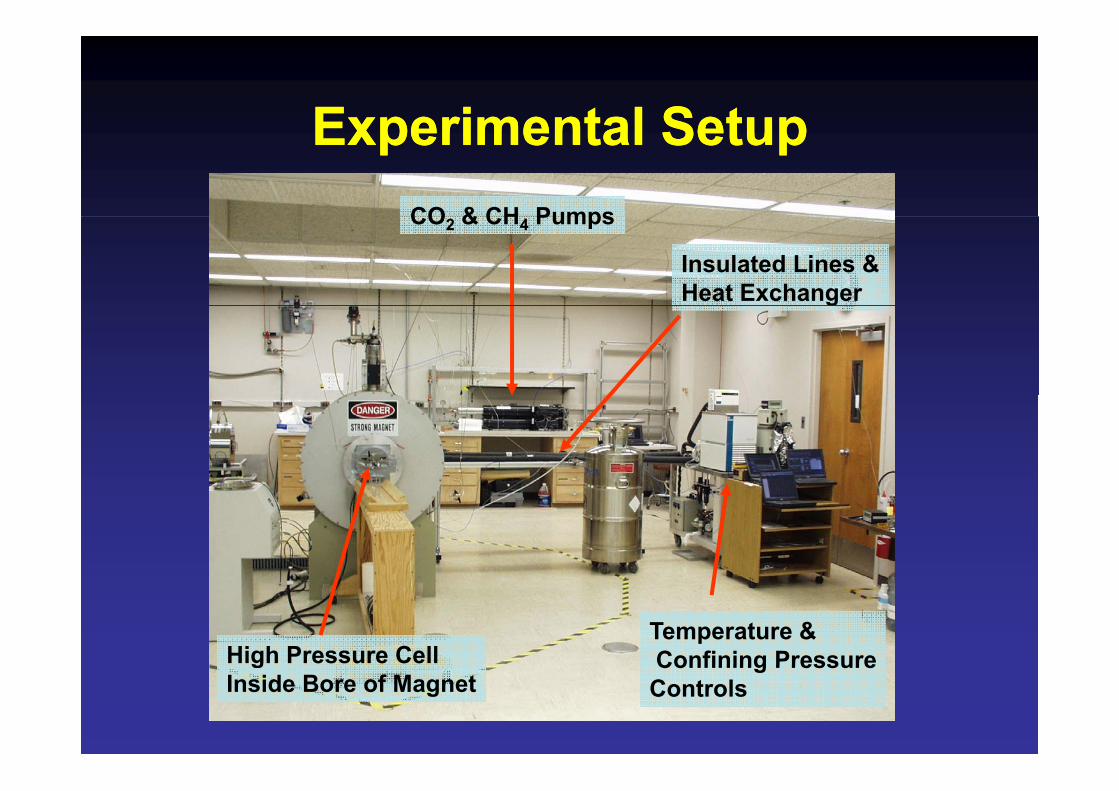
Experimental SetupExperimental SetupExperimental SetupExperimental SetupCO & CH PumpsCO2 & CH4 Pumps
Insulated Lines &Heat Exchangerg
Temperature &Confining PressureHigh Pressure Cell Confining PressureControls
gInside Bore of Magnet

Monitoring Hydrates with MRIMonitoring Hydrates with MRIMonitoring Hydrates with MRIMonitoring Hydrates with MRI
•• Form CHForm CH44 Hydrate in SandstoneHydrate in Sandstone44 yy–– Monitor Hydrate Formation Rate and Monitor Hydrate Formation Rate and
DistributionDistributionDistributionDistribution•• Exchange CHExchange CH44 with COwith CO22 in Hydratein Hydrate
–– Monitor Presence of FreeMonitor Presence of Free--WaterWater–– Monitor CHMonitor CH44 Production RateProduction Rate
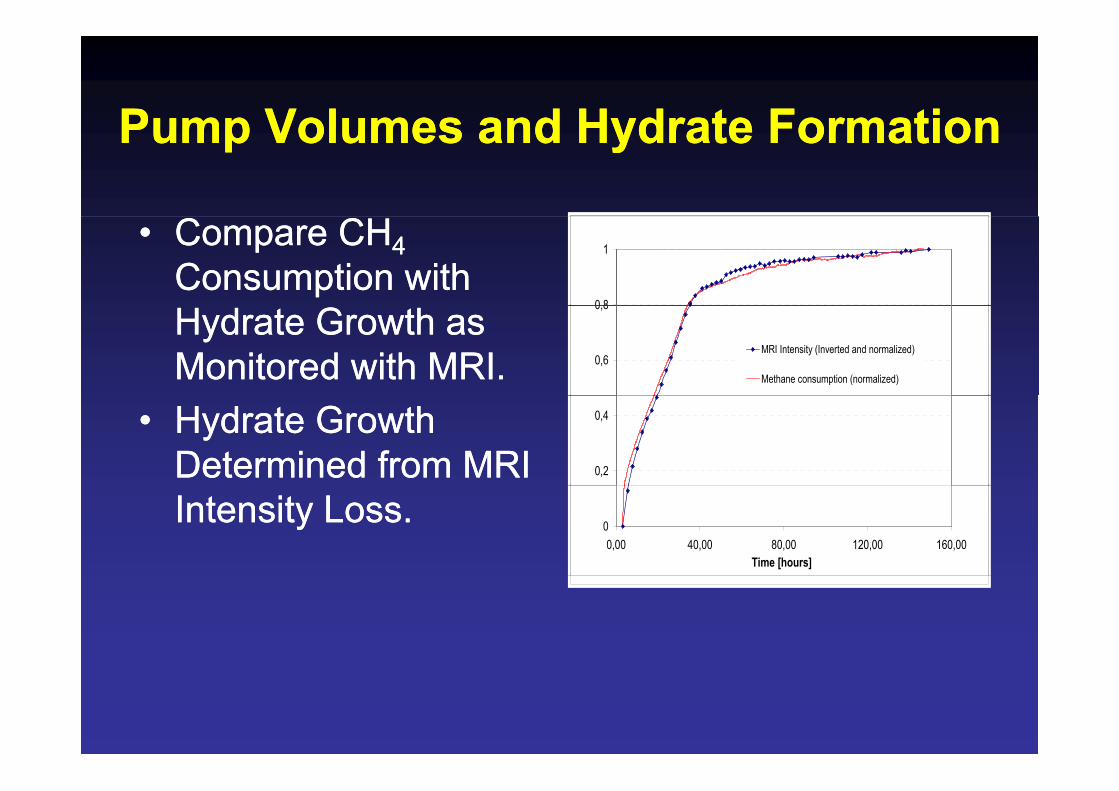
Pump Volumes and Hydrate FormationPump Volumes and Hydrate FormationPump Volumes and Hydrate FormationPump Volumes and Hydrate Formation
•• Compare CHCompare CH44Consumption with Consumption with
0 8
1
Hydrate Growth as Hydrate Growth as Monitored with MRI.Monitored with MRI. 0,6
0,8
MRI Intensity (Inverted and normalized)
Methane consumption (normalized)
•• Hydrate Growth Hydrate Growth Determined from MRI Determined from MRI 0,2
0,4
Intensity Loss.Intensity Loss. 00,00 40,00 80,00 120,00 160,00
Time [hours]

Monitoring Hydrates with MRIMonitoring Hydrates with MRIMonitoring Hydrates with MRIMonitoring Hydrates with MRI
•• Form CHForm CH44 Hydrate in SandstoneHydrate in Sandstone44 yy–– Monitor Hydrate Formation Rate and Monitor Hydrate Formation Rate and
DistributionDistributionDistributionDistribution•• Exchange CHExchange CH44 with COwith CO22 in Hydratein Hydrate
–– Monitor Presence of FreeMonitor Presence of Free--WaterWater–– Monitor CHMonitor CH44 Production RateProduction Rate

Core Sample DesignCore Sample DesignCore Sample DesignCore Sample Design
•• Bentheim Sandstone Bentheim Sandstone ––WaterWater--SaturatedSaturated
•• Longitudinal Cut Longitudinal Cut –– Fitted Fitted Spacer Simulates Open Spacer Simulates Open FractureFracture
•• Experimental Conditions:Experimental Conditions:Experimental Conditions: Experimental Conditions: Flow Loop ~ 4Flow Loop ~ 4ooC C –– 8.3 MPa 8.3 MPa (1200 (1200 psipsi).). 1 cmpp )) 1 cm

Experiment TimelineExperiment TimelineExperiment TimelineExperiment Timeline
CO2 Flush
Fill Core with CH4 & H2O (Sw~0.5)
N2 Flush
H2O Signal
Temperature
C 4
CO2 Flush N2 Flush
H2O Signal in Matrix
CH4 in Fracture
0 5 10 15 20 25 30 35
Time (Days)
n.b. Schematic Representation Only.

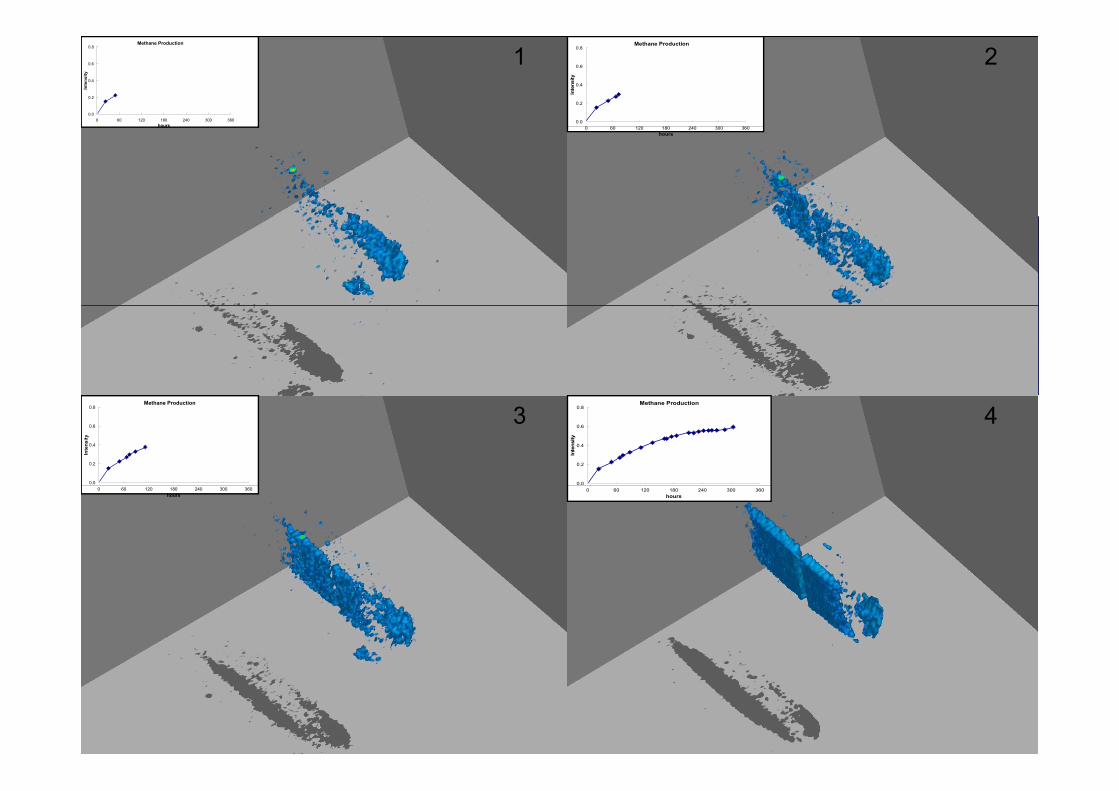
Formation and Dissociation of Formation and Dissociation of Hydrates in Porous MediaHydrates in Porous Media
•• WaterWater--Saturated Core Saturated Core with Methanewith Methane--Filled Filled t et a et et a e ededFracture.Fracture.
•• CHCH44 Hydrate FormsHydrate Forms•• CHCH44 Hydrate Forms.Hydrate Forms.•• COCO22 Introduced into Introduced into
FractureFractureFracture.Fracture.•• CHCH44 –– COCO22 Exchange.Exchange.•• CHCH44 Production Production
Measured.Measured.
Methane Production
0.0
0.2
0.4
0.6
0.8
0 60 120 180 240 300 360hours
Inte
nsity
Methane Production
0.0
0.2
0.4
0.6
0.8
Inte
nsity
1 2
hours 0 60 120 180 240 300 360hours
Methane Production
0.0
0.2
0.4
0.6
0.8
Inte
nsity
Methane Production
0.0
0.2
0.4
0.6
0.8
Inte
nsity
3 4
0 60 120 180 240 300 360hours
0 60 120 180 240 300 360hours
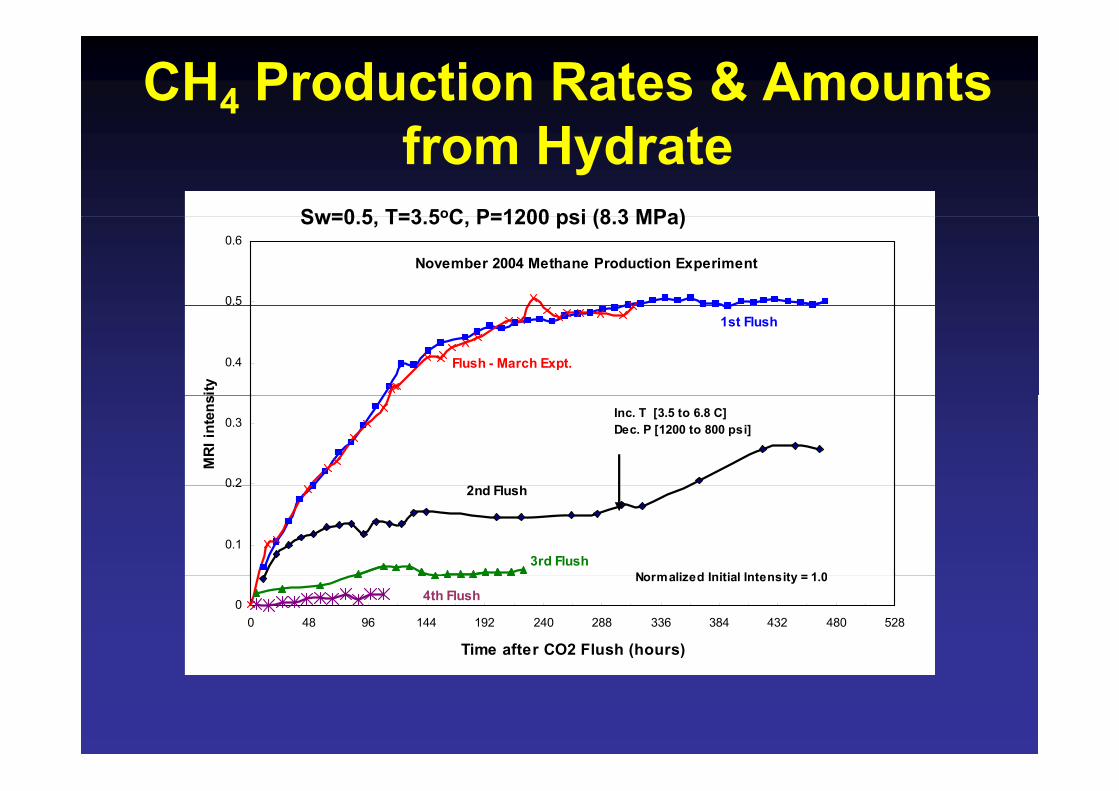
CH4 Production Rates & Amounts f H dfrom Hydrate
Sw=0 5 T=3 5oC P=1200 psi (8 3 MPa)
0.5
0.6
November 2004 Methane Production Experiment
Sw=0.5, T=3.5oC, P=1200 psi (8.3 MPa)
0.4
ity
1st Flush
Flush - March Expt.
0 2
0.3
MRI
inte
ns Inc. T [3.5 to 6.8 C]Dec. P [1200 to 800 psi]
0.1
0.2
Normalized Initial Intensity = 1 0
2nd Flush
3rd Flush
00 48 96 144 192 240 288 336 384 432 480 528
Time after CO2 Flush (hours)
Normalized Initial Intensity = 1.04th Flush
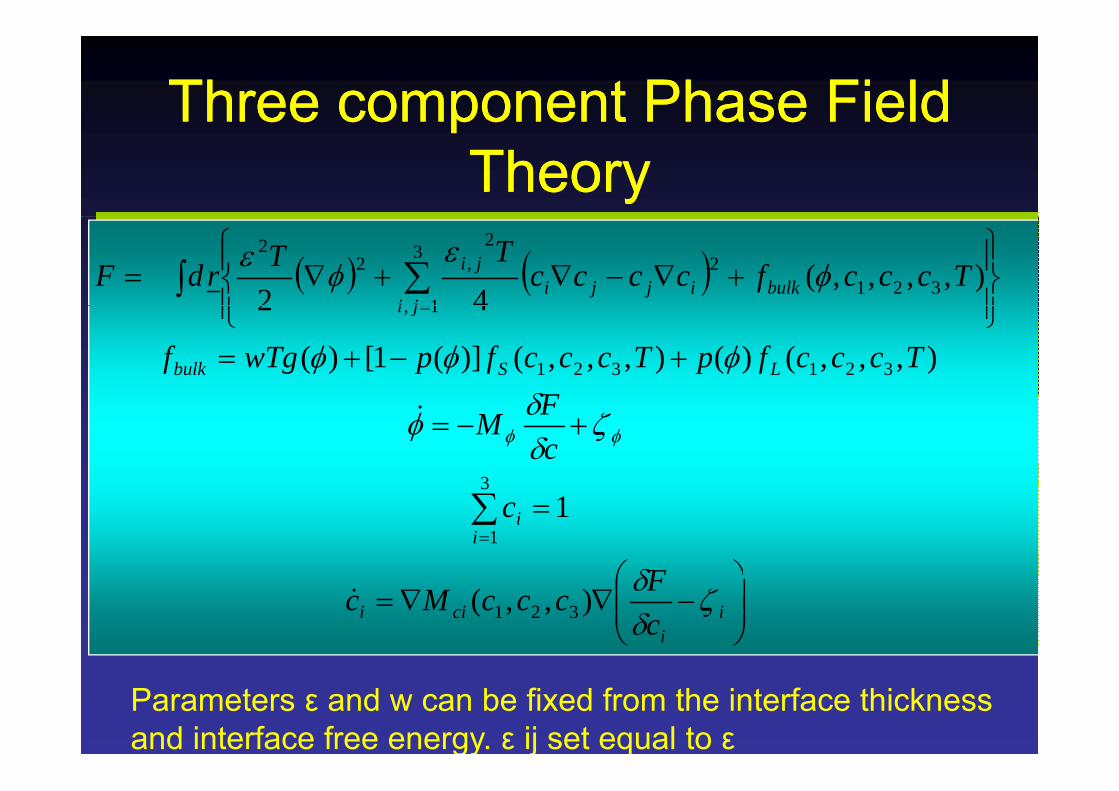
Three component Phase Field Three component Phase Field ppTheoryTheory
( ) ( )⎪⎭
⎪⎬⎫
⎪⎩
⎪⎨⎧
+∇−∇+∇= ∫ ∑=
bulkji
ijjiji Tcccfcccc
TTrdF φε
φε ),,,,(42 321
3
1
22
,22
+−+=
⎪⎭⎪⎩ =
LSbulk
ji
FTcccfpTcccfpwTgf
δφφφ ),,,()(),,,()](1[)(
42
321321
1,
+−=cFM ζδδφ φφ
3
&
⎞⎛
=∑=i
i
F
c
δ
13
1
⎟⎟⎠
⎞⎜⎜⎝
⎛−∇∇= i
icii c
FcccMc ζδδ),,( 321&
Parameters ε and w can be fixed from the interface thickness and interface free energy. ε ij set equal to ε
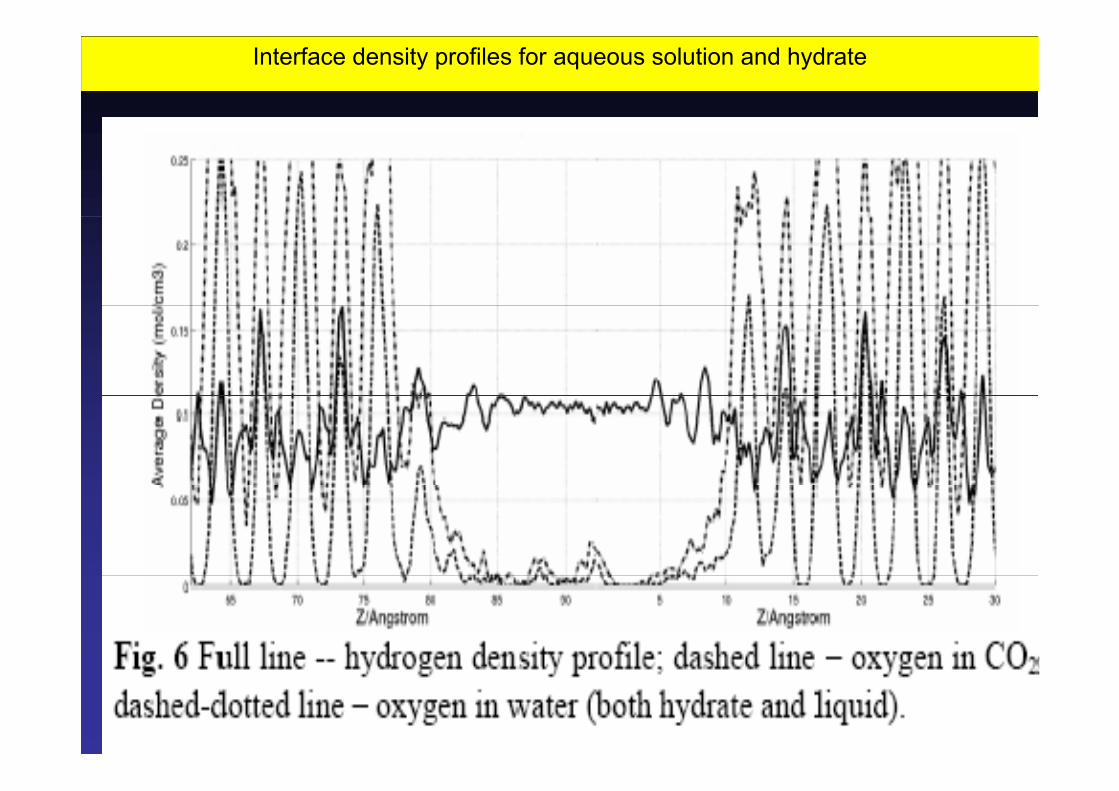
Interface density profiles for aqueous solution and hydrate


Interface thickness d and interface free energy fixes the Interface thickness d and interface free energy fixes the two model parameterstwo model parameters ww andand εε in the Phase FieldTheoryin the Phase FieldTheorytwo model parameters two model parameters ww and and εε in the Phase FieldTheory. in the Phase FieldTheory. Evaluation of these parameters from model systems by Evaluation of these parameters from model systems by
Molecular Dynamics simulations of model systemsMolecular Dynamics simulations of model systemsMolecular Dynamics simulations of model systemsMolecular Dynamics simulations of model systemsEstimated to 8.5 Å – see previous overhead
{ }1/2 0.952
1/2[ , ( )]2Td d f cε ξ ξ ξ −⎛ ⎞
= Δ⎜ ⎟⎝ ⎠
∫Phase Field Theory parameter w is in the free energy f { }
0.05
[ , ( )]2
fξ ξ ξ⎜ ⎟⎝ ⎠
∫ gy(see PFT slide)
{ }∫ Δ=∞
12/12/12 )](,[)( ξξξεγ cfdT where Δf = f − f0, and
∫0
)()()(0eqLc
LeqLL cc
cfcff eq
L−
∂∂
+=Phase Field Theory parameter ε
)()()( eqSc
SeqSS cc
cfcf eq
S−
∂∂
+=Interface free energy ≈ 29 mJ/m2


Phase field predictions for the conversion of a 10 nm thick methane hydrate Phase field predictions for the conversion of a 10 nm thick methane hydrate layer into mixed CO2 layer into mixed CO2 −− CH4 hydrate in the presence of liquid CO2 at CH4 hydrate in the presence of liquid CO2 at TT = = yy y p qy p q
276.15 K and 276.15 K and pp = 8.3 = 8.3 MPaMPa. The liquid CO2 phase is on the right. . The liquid CO2 phase is on the right. The spatial step size is The spatial step size is ΔΔxx = 0.05 nm.= 0.05 nm.
(a)(a) the phase field (solid) CO2 (dashed) CH4 (dotted) and H2O (dashthe phase field (solid) CO2 (dashed) CH4 (dotted) and H2O (dash--dot)dot)(a)(a) the phase field (solid), CO2 (dashed), CH4 (dotted), and H2O (dashthe phase field (solid), CO2 (dashed), CH4 (dotted), and H2O (dash dot) dot) concentration profiles corresponding to instances concentration profiles corresponding to instances tt = 0.0, 0.08, 0.16, 0.24, = 0.0, 0.08, 0.16, 0.24, 0.32, and 0.4 0.32, and 0.4 μμs. The initial profiles are shown by thinner lines. Note the s. The initial profiles are shown by thinner lines. Note the thin water layer slightly right of the thin water layer slightly right of the zz = 10 nm position, and the respective = 10 nm position, and the respective d l ti f th d bd l ti f th d b di id i th idi id i th idepletion of methane and carbondepletion of methane and carbon--dioxide in the same region. dioxide in the same region.
(b)(b) An enlarged view of the methane and carbonAn enlarged view of the methane and carbon--dioxide profiles in the solid dioxide profiles in the solid hydrate phase is presented in panel (b). hydrate phase is presented in panel (b).

Detailed analysis of the simulated results indicate that the Detailed analysis of the simulated results indicate that the conversion process is essentially dominated by transport conversion process is essentially dominated by transport p y y pp y y plimitations. I.e.: we should expect that Fick’s law would limitations. I.e.: we should expect that Fick’s law would
represent the kinetic progress of conversion to a fair extentrepresent the kinetic progress of conversion to a fair extent
Fitting the phase fieldpsimulated progressto Fick’s law gives a nice fit.Initial deviationsdeviations from zero due to initial relaxationrelaxation of the hydrate interface
Displacement h of the half-height (cCO2 = 0.055) position for the CO2 profile as a function of t1/2. Ds = 5 × 10⁻¹² m2/s is assumed.

So how does this value of diffusivity So how does this value of diffusivity t h i t l ltt h i t l ltmatch experimental resultsmatch experimental results
”Bulk” experiment without porousmedium indicate D ~ 1.1·10-11
Effects of liquid channels separating theEffects of liquid channels separating thehydrate from the mineral surfaces and thestate of non-equilibrium is systems withmineral surfaces (adsorption is an additionalmineral surfaces (adsorption is an additional phase which reduces the number of degrees of freedom with 1) may account for the difference

ConclusionsConclusionsCo c us o sCo c us o s•• We have demonstrated experimentally that We have demonstrated experimentally that p yp y
injection of CO2 into CH4 hydrate results in injection of CO2 into CH4 hydrate results in CH4 release while at the same timeCH4 release while at the same timeCH4 release while at the same time CH4 release while at the same time providing safe storage option for CO2providing safe storage option for CO2
•• MRI Visualizations Provide Insights in MRI Visualizations Provide Insights in Hydrate Growth and StabilityHydrate Growth and StabilityHydrate Growth and StabilityHydrate Growth and Stability
•• Theoretical predictions based on molecularTheoretical predictions based on molecularTheoretical predictions based on molecular Theoretical predictions based on molecular simulations and Phase Field Theory simulations and Phase Field Theory reproduce the experimental conversionreproduce the experimental conversionreproduce the experimental conversion reproduce the experimental conversion ratesrates
A k l dA k l dAcknowledgementAcknowledgement
We acknowledge financial support from We acknowledge financial support from th R l N i R h C ilth R l N i R h C ilthe Royal Norwegian Research Council the Royal Norwegian Research Council and from ConocoPhillips.and from ConocoPhillips.
Fiery Ice from the SeasFiery Ice from the SeasyyA series of workshops arranged byBjørn Kvamme, UoB, NorwayStephen Masutani, UoH, USARick Coffin, ONR, USA,Tsutomu Uchida, Hokkaido Univ., Japan
6th workshopBergen, May 6 – 8, 2008
Purpose: Contribute to the establishmentPurpose: Contribute to the establishment of large international interdisciplinary research programs on fundamentalresearch programs on fundamental properties of hydrate reservoirs, hydrate quantification and feasible exlotitation