Embed Size (px)
Citation preview
DISTRIBUTION OF FIBERS IN SFRC SEGMENTS FOR TUNNEL LININGS
SERGIO CARMONA1
Departamento de Obras Civiles, Universidad Técnica Federico Santa María
Valparaíso, Chile
CLIMENT MOLINS
ANTONIO AGUADO
Departamento de Ingeniería de la Construcción,
Universitat Politècnica de Catalunya,
Barcelona, España
and
FELIPE MORA
MINMETAL
ABSTRACT
This paper presents research results regarding the distribution of steel fibers in concrete
used to build precast tunnel segments for Line 9 of the Barcelona Metro. The fiber
distribution was studied using the actual fiber contents obtained by means of crushed
cores drilled from different points of three full-scale tunnel lining segments. A statistical
analysis determined that the fiber content in the ends of segments tend to be greater than
in the central zone. In addition, cores with a diameter of 150 mm were found to have a
lower scatter in the fiber content than smaller diameter specimens. Finally, based on
probabilistic approaches, a minimum of 11 cores is proposed to control the fiber content
in FRC segments.
KEYWORDS: fiber distribution, fiber content, fiber reinforced concrete, tunnel linings.
1Corresponding author: [email protected], Casilla 110- V Valparaíso, Chile. Tel. +56322654382 Fax +56322654115
*ManuscriptClick here to view linked References

1. INTRODUCTION
Fiber-reinforced concretes (FRCs) are increasingly applied in structural engineering
because fibers enable the reduction or replacement of reinforcement bars. In general,
FRCs are used mainly for pavements and shotcrete that are applied to slopes and tunnel
supports. However, currently, FRCs are particularly used in the precast industry
(Ferreira and Branco 2007; Walraven 2009; De la Fuente et al., 2012a) and in tunnel
building projects (Gettu et al., 2004; Kasper et al., 2008; Chiaia et al., 2007, 2009;
Caratelli et al., 2001; De la Fuente et al., 2012b), as reflected in various papers
presented in international workshops and conferences in recent years (RILEM 2004,
2008, 2012).
Replacing traditional reinforced concrete by FRC has many advantages regarding both
structural performance and costs. These advantages are highlighted in the use of precast
elements in industrialized processes (Ferrara and Meda, 2006).
The absorption of energy during cracking is one of the most important properties of
FRC; however, the reinforcement efficiency provided by fibers depends on (1) the fiber
properties: strength, stiffness, and bonding; (2) the fiber distribution: relative fraction,
contents, and orientation (Zollo, 1997). Currently, fibers are made of different materials,
shapes, and sizes. Choosing the correct fibers depends on the property to be improved.
Regarding the influence of the spatial distribution in the concrete mass, many research
studies indicate how the variability in FRC properties depends on: (1) the fiber
orientation with respect to the stress lines and (2) the variability of the fiber spatial
distribution.
To determine the actual reinforcement available in each direction of the concrete
volume, due to the relevance of the distribution and orientation of the fibers in the
development of suitable and reliable material properties for structural design, many
researchers have studied the distribution of fibers theoretically and/or at the laboratory
level, for example, Akkaya et al. (2000), Chermant et al. (2001), Chung (2001), Lawler
et al. (2003), Dupont and Vandewalle (2005), Ozyurt (2007), Lataste et al. (2008), Lee
and Kim (2010), and the comprehensive RILEM TC 162 (2003), among others.
Nevertheless, such studies have generally been conducted with small specimens, and
only in a very few occasions was the distribution of fibers in real-size structures

measured (Ferrara and Meda, 2006; Kooiman 1997, 2000).In the present research, the
actual distribution of the fibers in precast segments was determined.
According to the above background, in this paper, the results of an experimental
campaign performed to determine the volumetric fiber distribution in precast tunnel
lining segments that were solely reinforced with fibers for an experimental section of L9
of the Barcelona metro are presented. Based on the results, an estimation of the number
of samples required for assessing the fiber content of a tunnel lining segments is
presented.
2. FIBER DISTRIBUTION IN THE FRC
Factors related to fiber dispersion in the concrete mass are a crucial point to be
addressed to promote the reliable use of steel-fiber reinforced concrete (SFRC) as a
structural material (Boulekbache et al., 2010). Therefore, controlling and characterizing
the fiber dispersion are important topics for developing structural applications of FRC to
maximize their mechanical properties and material performance (Woo et al., 2005;
Pujadas et al., 2012).
The fiber spatial distribution in the concrete volume is associated with the casting
process, i.e., the manner in which concrete is poured into the mold and the vibrating
time (Ozyurt, 2007), which depends on the rheological properties of the concrete and
the boundary conditions (wall effects) imposed by the mold. In this sense, using self-
compacting concrete (SCC) can help to ensure a uniform fiber dispersion due to their
self-compacting rheological stability; as a result, compaction by vibration is not
required (Ferrara et al., 2008).
Different destructive and nondestructive techniques have been used to characterize the
dispersion and orientation of fiber in a laboratory setting. The fiber distribution may be
evaluated through video recording during casting. However, this information is limited
to the mass surface (Lataste et al., 2008). Image analysis has been used to determine the
distribution inside the concrete mass (Akkaya et al., 2000; Chermant et al., 2001;
Lawler et al., 2003). However, this process can be slow and expensive. Chung (2001)
investigated the FRC properties during exposure to DC currents and attributed the
variations in resistance to microstructural change, such as fiber slip, changes in
alignment and/or fiber spacing, when subjected to static or dynamic loads. The electrical
characterization method called alternating current - impedance spectroscopy (AC-IS)

has proven to be effective in monitoring the fiber dispersion, as well as the fiber
orientation, segregation and grouping (Manson et al., 2002; Woo et al., 2003).
Measuring the electrical resistivity was also found to be able to help to determine the
fiber distribution (Lataste et al., 2008). Such electromagnetic methods can be used
either for laboratory specimens or small elements (Torrents et al., 2012) or for real size
structures
The fiber distribution in precast elements, in an industrial setting, was studied using
drilled cores from the FRC, with the fiber orientation determined using X-ray analysis
and the fiber content determined by crushing the cores. Using this technique, Kooiman
(2000) studied the fiber orientation and distribution in precast tunnel lining segments
reinforced with 60 kg/m3 of steel fibers and concluded that the fibers were not randomly
oriented spatially and that bleeding was observed during vibration of the segment,
which causes differences in the concrete quality over the thickness of segment, resulting
in variations in the FRC properties.
Grunewald et al. (2003), using X-ray images from the cores of precast tunnel lining
segments, observed that specimens that were cut perpendicular to the concrete pouring
direction exhibited a preferred orientation and that the fiber content was greater than the
content obtained in the cores cut along the concrete pouring direction. In addition, the
fibers were observed to be distributed homogeneously along the height of the cores.
Ferrara and Meda (2006) studied the relationship among the workability, mechanical
properties and fiber distribution of precast elements for roof structures built with
ordinary SFRC and self-compacting steel-fiber reinforced concrete (SCSFRC), with the
fiber distribution determined by crushing the drilled cores. Based on their results, the
dispersion in the fiber distribution is good for specimens larger than 43 mm. Comparing
the fiber content through the element thickness, the scatter in the fiber distribution is
higher in the cast surface of the SFRC, but with the addition of a viscosity enhancing
admixture, the dispersion of the fiber content is lower. The absolute difference between
the bottom and top fiber contents reaches 45 kg/m3 for ordinary SFRC and 18 kg/m3 for
SCSFRC. They also used X-ray images of the cores to study the fiber distribution
through the cross section of cores and found good homogeneity in most of the tested
cores. However, the decrease of viscosity due to environmental effects could influence
the segregation of fibers.

A more recent approach is the use of numerical models based on fluid dynamics to
predict the fiber orientation, especially in self-compacting concrete, taking in account
the type of structural element and the concrete casting method in works (Orbe, 2013).
3. CONSTRUCTION OF THE TUNNEL LINING SEGMENTS AND THE EXPERIMENTAL DETAILS
This research is part of a series of studies aimed to optimize the use of a steel-fiber
based reinforcement in the precast segments used for the lining of the Line 9 tunnel of
the Barcelona subway. These studies were performed by the Department of
Construction Engineering at the Universitat Politècnica de Catalunya at the request of
Gestió d’Infraestructures S.A., the public company managing the project.
In 2004,an experimental section was built, composed of thirty segments for the tunnel
lining, which were reinforced solely with 60 kg/m3 of steel fibers, that is, the maximum
amount that allowed the use of the available resources, to gain experience in this type of
work, as concluded in earlier studies (Gettu et al., 2005). The instruments for measuring
and loading were placed in one of the rings to perform tests on site (Molins and Arnau,
2013). Similarly, other segments reinforced with fibers were built to obtain more
information on their actual behavior (Mora et al., 2009).
The tunnel section under this investigation is lined with five standard segments (A) and
2 skewed segments (B and C) to allocate the key segment (K). Each segment
encompasses a sector a 48°, except the key one, which covers 24 °, as shown in Figure
1. The ring is a universal type ring, with an average width of 1.80 m.
3.1. Tunnel lining segments
The 350-mm thick tunnel lining segments were precast in the factory with concrete of a
characteristic compressive strength (fck) of 50 MPa at 28 days and a deformation
modulus of approximately 38.0 GPa at the same age. Concrete was reinforced with
60kg/m3of hooked-end steel fibers of a 1-mm diameter and 50-mm length, provided in
bags and bulk. The steel yielding strength was 1000 MPa, which ensured that failure did
not occur by fiber tension, but by pulling them out. The steel was specified to have a
flexural strength equivalent to a 3-mm deflection (fct,keq300) of 3.2 MPa, as determined
according to the Belgian flexural test (NBN 15-238, 1992). The concrete mix
proportions are presented in Table 1.

In the study, each segment has a volume of approximately3.3 m3, and the casting is
performed by taking concrete from the mixer to the mold in a 1.5-m3 capacity mobile
hopper, as shown in Figure 2. Compaction is performed during casting concrete by four
vibrators placed at the bottom of the mold. The compaction energy could be regulated if
necessary by decreasing the power of some vibrators or turning them off. This way, a
great homogeneity of concrete is achieved, avoiding the segregation of coarse aggregate
and/or fibers by excessive vibration.
Once casting is completed, the top surface of the tunnel lining is smoothed manually.
Next, the segments are moved to a fog room at a temperature between 40° to 45° C for 5
hours. The segments are demolded after curing, and then, gaskets and packers are
placed. Next, the segments are moved to the stockyard, where the cores used for this
research were drilled.
3.2. Results of Quality Control of the SFRC
The concrete used in the segments was controlled through the compressive strength (fc)
and the flexural strength (fct) according to the UNE 83507 (AENOR, 2004a) and UNE
83509 (AENOR, 2004b) standards, respectively. The results obtained from the control
test are presented in Table2. As found in the table, the compressive strengths vary from
a minimum of 47.6 MPa to a maximum of 60.2 MPa; in the flexural tests, the first crack
strength varies between 5.5 MPa and 7.3 MPa and the equivalent tensile strengths
(fct,eq300k) vary between a minimum of 4.8 MPa and a maximum of 7.4 MPa, according
to standard NBN B 15-238 (1992).
Table 2 also indicates that the compressive strength has a coefficient of variation (CoV)
significantly lower than the flexural strengths and that the CoV of the equivalent tensile
strength is higher than the CoV of the resistance to the first crack.
3.3. Drilling and testing of the cores
The fiber content at different locations of the segments was measured from cores drilled
from 3 different segments, corresponding to different rings cast at different ages. The
fiber distribution along the segments was analyzed by dividing them in three zones: (1)
center, (2) corners, and (3) intermediate zone of the segment. Figure 3 shows all of the
cores drilled in each segment, using 3 different diameters (d = 150mm, d = 100mm and
d = 75mm) in the central zone and only one diameter (d = 150mm) in the other two
other zones (corners and intermediate).
Figure 4 shows the drilling process, which is straight and perpendicular to the surface of
tunnel lining segment. The drill was continuously watered throughout the process to
reduce the temperature, thus preventing the cores from being damaged by heat, and to
reduce dust.
All of the cores had an average length of 350 mm and three different diameters (150
mm, 100 mm and 75 mm), as aforementioned; each of the cores was cut to obtain
cylinders that were slender and that had a height/diameter (h/d) ratio of 1. This
geometry is required to perform the Barcelona (BCN) test, according to the UNE 83515
(AENOR, 2010) standard. In this manner, 2, 3 and 4 specimens were obtained from the
cores of 150 mm, 100 mm, and 75-mm diameters, respectively. The Wall effect in the
volume of the studied concrete was minimized by discarding the core ends. After
cutting, the samples were weighed. The height and circumference of each sample were
measured, and then the average volume was calculated.
3.4. Barcelona test
The Barcelona (BCN) test was developed by Molins et al. (2006, 2009) based on the
Double Punch Test (DPT) proposed by Chen (1970), with the aim of having a suitable
test for the characterization of the properties and the systematic quality control of FRC
in works. This test was standardized in Spain by AENOR (2010).
The BCN test has many advantages with respect to the flexural tests, among which, the
following are highlighted: (1) the use of relatively small cylindrical specimens of d = h
= 150 mm, i.e., h/d = 1, which can be molded or cut from standardized cylinders of d =
150 mm × h = 300 mm or from cores drilled from existing structures; (2) a conventional
compression testing machine is required; and (3) the specimens present a high fracture
surface so that the properties of the FRC may be quantified through various fracture
planes.
As seen in Figure 5a, in this test, the specimen is subjected to compressive stress by
means of two wedges with a diameter of a = d/4. The test is conducted under actuator
displacement control at a rate of 0.5 mm/min. During the test, the applied load and the
circumferential deformation measured at half the height of the specimen should be
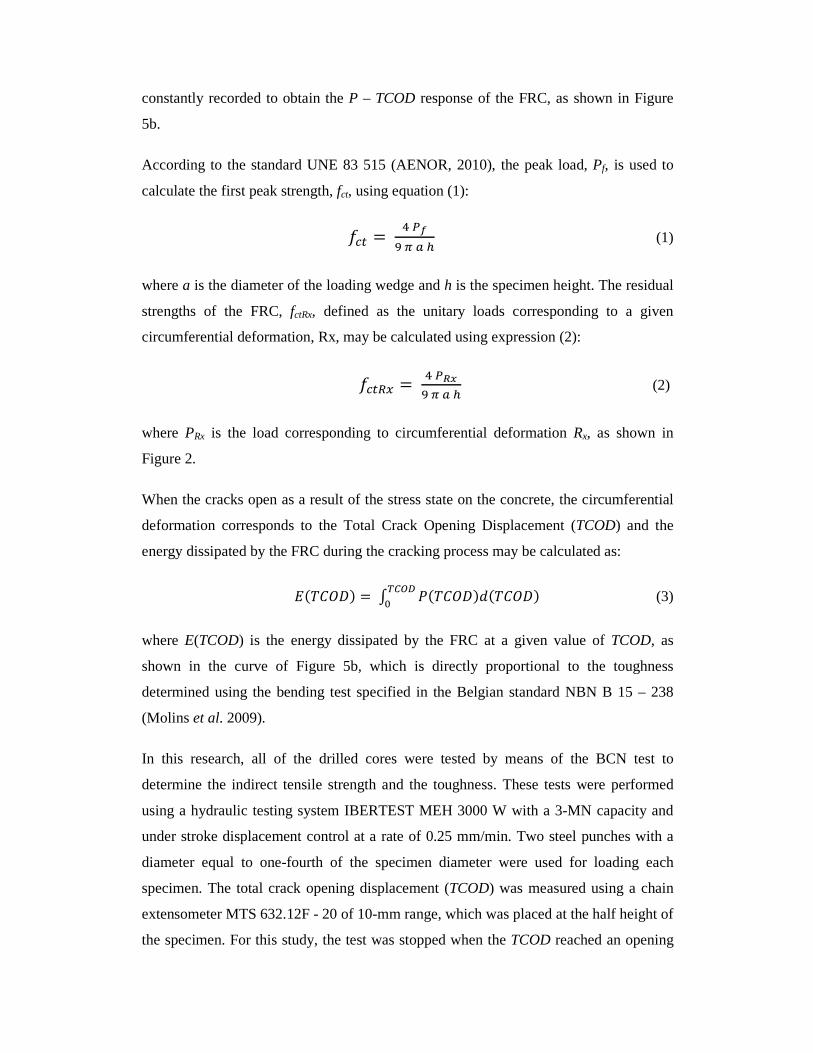
constantly recorded to obtain the P – TCOD response of the FRC, as shown in Figure
5b.
According to the standard UNE 83 515 (AENOR, 2010), the peak load, Pf, is used to
calculate the first peak strength, fct, using equation (1):
(1)
where a is the diameter of the loading wedge and h is the specimen height. The residual
strengths of the FRC, fctRx, defined as the unitary loads corresponding to a given
circumferential deformation, Rx, may be calculated using expression (2):
(2)
where PRx is the load corresponding to circumferential deformation Rx, as shown in
Figure 2.
When the cracks open as a result of the stress state on the concrete, the circumferential
deformation corresponds to the Total Crack Opening Displacement (TCOD) and the
energy dissipated by the FRC during the cracking process may be calculated as:
(3)
where E(TCOD) is the energy dissipated by the FRC at a given value of TCOD, as
shown in the curve of Figure 5b, which is directly proportional to the toughness
determined using the bending test specified in the Belgian standard NBN B 15 – 238
(Molins et al. 2009).
In this research, all of the drilled cores were tested by means of the BCN test to
determine the indirect tensile strength and the toughness. These tests were performed
using a hydraulic testing system IBERTEST MEH 3000 W with a 3-MN capacity and
under stroke displacement control at a rate of 0.25 mm/min. Two steel punches with a
diameter equal to one-fourth of the specimen diameter were used for loading each
specimen. The total crack opening displacement (TCOD) was measured using a chain
extensometer MTS 632.12F - 20 of 10-mm range, which was placed at the half height of
the specimen. For this study, the test was stopped when the TCOD reached an opening
of 6 mm. The tests results are presented in Table 3, where the cracking load (Pmax), the
residual strength, and the energy dissipated by the FRC for TCOD values equal to 2 mm
and 6 mm are given along with the coefficient of variation and the minimum and
maximum values.
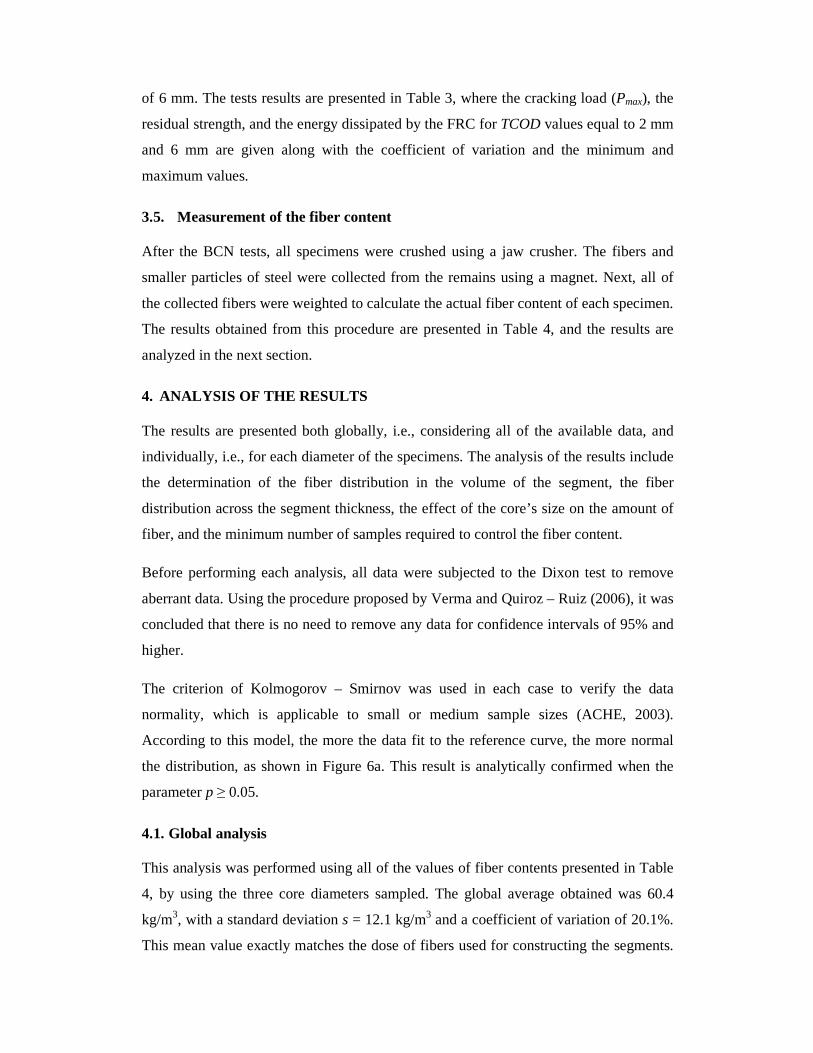
3.5. Measurement of the fiber content
After the BCN tests, all specimens were crushed using a jaw crusher. The fibers and
smaller particles of steel were collected from the remains using a magnet. Next, all of
the collected fibers were weighted to calculate the actual fiber content of each specimen.
The results obtained from this procedure are presented in Table 4, and the results are
analyzed in the next section.
4. ANALYSIS OF THE RESULTS
The results are presented both globally, i.e., considering all of the available data, and
individually, i.e., for each diameter of the specimens. The analysis of the results include
the determination of the fiber distribution in the volume of the segment, the fiber
distribution across the segment thickness, the effect of the core’s size on the amount of
fiber, and the minimum number of samples required to control the fiber content.
Before performing each analysis, all data were subjected to the Dixon test to remove
aberrant data. Using the procedure proposed by Verma and Quiroz – Ruiz (2006), it was
concluded that there is no need to remove any data for confidence intervals of 95% and
higher.
The criterion of Kolmogorov – Smirnov was used in each case to verify the data
normality, which is applicable to small or medium sample sizes (ACHE, 2003).
According to this model, the more the data fit to the reference curve, the more normal
the distribution, as shown in Figure 6a. This result is analytically confirmed when the
parameter p ≥ 0.05.
4.1. Global analysis
This analysis was performed using all of the values of fiber contents presented in Table
4, by using the three core diameters sampled. The global average obtained was 60.4
kg/m3, with a standard deviation s = 12.1 kg/m3 and a coefficient of variation of 20.1%.
This mean value exactly matches the dose of fibers used for constructing the segments.
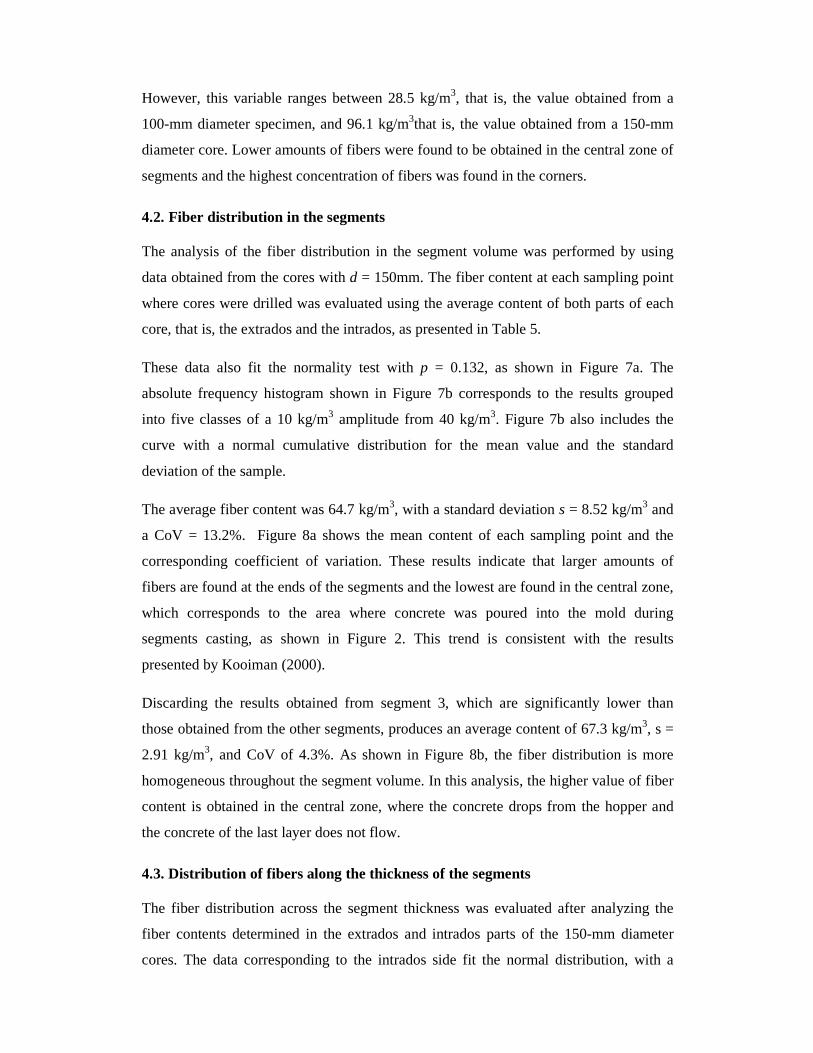
However, this variable ranges between 28.5 kg/m3, that is, the value obtained from a
100-mm diameter specimen, and 96.1 kg/m3that is, the value obtained from a 150-mm
diameter core. Lower amounts of fibers were found to be obtained in the central zone of
segments and the highest concentration of fibers was found in the corners.
4.2. Fiber distribution in the segments
The analysis of the fiber distribution in the segment volume was performed by using
data obtained from the cores with d = 150mm. The fiber content at each sampling point
where cores were drilled was evaluated using the average content of both parts of each
core, that is, the extrados and the intrados, as presented in Table 5.
These data also fit the normality test with p = 0.132, as shown in Figure 7a. The
absolute frequency histogram shown in Figure 7b corresponds to the results grouped
into five classes of a 10 kg/m3 amplitude from 40 kg/m3. Figure 7b also includes the
curve with a normal cumulative distribution for the mean value and the standard
deviation of the sample.
The average fiber content was 64.7 kg/m3, with a standard deviation s = 8.52 kg/m3 and
a CoV = 13.2%. Figure 8a shows the mean content of each sampling point and the
corresponding coefficient of variation. These results indicate that larger amounts of
fibers are found at the ends of the segments and the lowest are found in the central zone,
which corresponds to the area where concrete was poured into the mold during
segments casting, as shown in Figure 2. This trend is consistent with the results
presented by Kooiman (2000).
Discarding the results obtained from segment 3, which are significantly lower than
those obtained from the other segments, produces an average content of 67.3 kg/m3, s =
2.91 kg/m3, and CoV of 4.3%. As shown in Figure 8b, the fiber distribution is more
homogeneous throughout the segment volume. In this analysis, the higher value of fiber
content is obtained in the central zone, where the concrete drops from the hopper and
the concrete of the last layer does not flow.
4.3. Distribution of fibers along the thickness of the segments
The fiber distribution across the segment thickness was evaluated after analyzing the
fiber contents determined in the extrados and intrados parts of the 150-mm diameter
cores. The data corresponding to the intrados side fit the normal distribution, with a
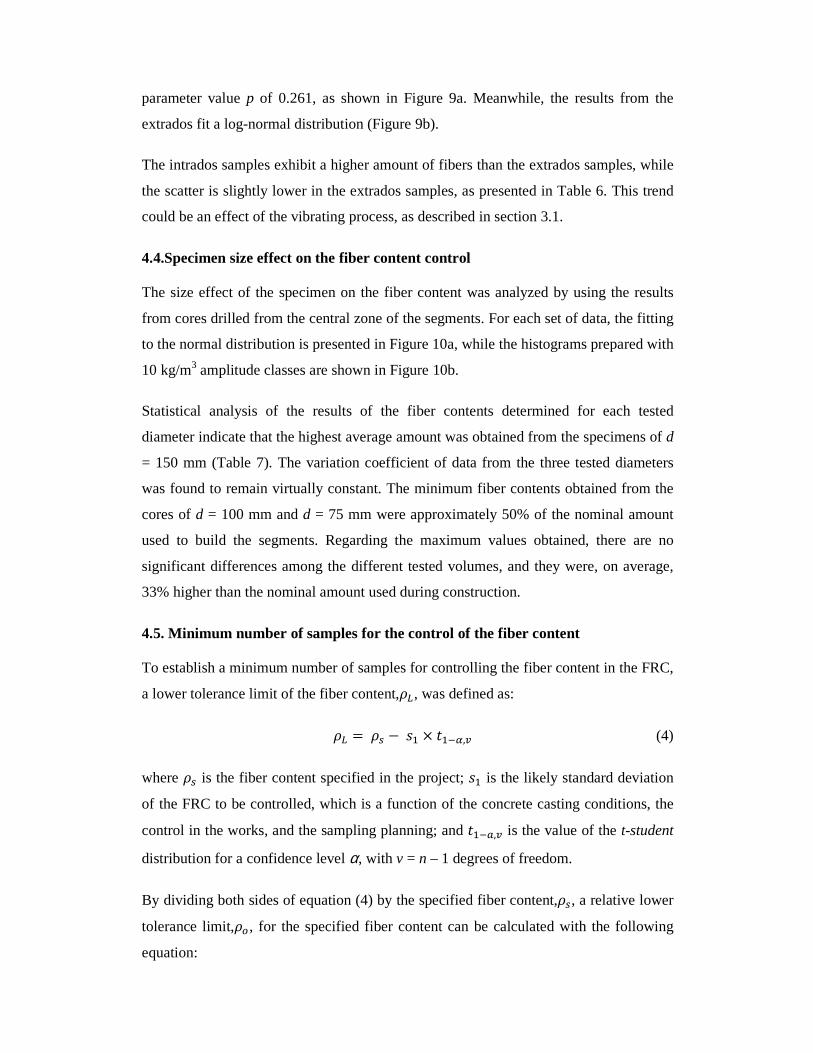
parameter value p of 0.261, as shown in Figure 9a. Meanwhile, the results from the
extrados fit a log-normal distribution (Figure 9b).
The intrados samples exhibit a higher amount of fibers than the extrados samples, while
the scatter is slightly lower in the extrados samples, as presented in Table 6. This trend
could be an effect of the vibrating process, as described in section 3.1.
4.4.Specimen size effect on the fiber content control
The size effect of the specimen on the fiber content was analyzed by using the results
from cores drilled from the central zone of the segments. For each set of data, the fitting
to the normal distribution is presented in Figure 10a, while the histograms prepared with
10 kg/m3 amplitude classes are shown in Figure 10b.
Statistical analysis of the results of the fiber contents determined for each tested
diameter indicate that the highest average amount was obtained from the specimens of d
= 150 mm (Table 7). The variation coefficient of data from the three tested diameters
was found to remain virtually constant. The minimum fiber contents obtained from the
cores of d = 100 mm and d = 75 mm were approximately 50% of the nominal amount
used to build the segments. Regarding the maximum values obtained, there are no
significant differences among the different tested volumes, and they were, on average,
33% higher than the nominal amount used during construction.
4.5. Minimum number of samples for the control of the fiber content
To establish a minimum number of samples for controlling the fiber content in the FRC,
a lower tolerance limit of the fiber content, !, was defined as:
! " #$% & '%(),+ (4)
where " is the fiber content specified in the project; $% is the likely standard deviation
of the FRC to be controlled, which is a function of the concrete casting conditions, the
control in the works, and the sampling planning; and '%(,+ is the value of the t-student
distribution for a confidence level α, with v = n – 1 degrees of freedom.
By dividing both sides of equation (4) by the specified fiber content, ", a relative lower
tolerance limit, ,, for the specified fiber content can be calculated with the following
equation:

, -.-/ 1 #1% & '%(),+ (5)
where 1% is the expected coefficient of variation, CoV, for fiber content in concrete.
Using values of the CoV of 5, 10, 15, and 20%, the diagrams shown in Figure 11 were
produced by taking data from between 3 and 21 samples and of the confidence levels of
90 and 95%.
Diagrams of Figure 11 show that if few samples are available, then a tolerance limit
must be established that is quite low with respect to the specified fiber content.
Furthermore, this limit is significantly lower when both the level of confidence and the
expected coefficient of variation are increased.
The diagrams show that for sample sizes smaller than 7 and 11 specimens, for levels of
confidence of 90% and 95%, respectively, the relative lower limit of tolerance is highly
sensitive and varies sharply when the number of specimens decreases.
To apply this criterion to the available data, the results of the 21 cores with a150-mm
diameter given in Table 5 were used to produce 1000 confidence intervals, 2%%()%,
with confidence levels, α,of 90% and 95% and random samples of size n from 3 to 21
data. The lower limit of each confidence interval was determined by using the mean and
standard deviation of each random sample, defined as (Devore, 2012):
2%%()% 456 #'%(),+ "√8 ; ∞4 (6)
where 5is the mean and sis the standard deviation of each random sample.
Taking the minimum value of the lower limits among the 1000 confidence intervals, for
each sample size and confidence interval, the diagrams in Figure 12 were obtained for
both confidence levels: 90% and 95%. These minimum values are plotted along with the
lower limits of tolerance for the fiber content obtained using equation (6) for " = 60
kg/m3 and the coefficients of variation given in Figure 11.
According to the diagrams shown in Figure 12, it is proposed that the minimum
number of samples required to control the fiber content should be such that the
minimum value of the lower limits of the confidence intervals are above the lower limit
of tolerance defined by the following equation:
! ;1 #1%'%(),+< & " (7)
In this case, it can be established that, to expect a coefficient of variation of the fiber
content of less than 10%, it will require at least 11 samples, with both confidence levels
of 90% as 95%; in this manner, none of the minimum values of the confidence intervals
will be less than the lower limit of tolerance of the fiber content calculated using
equation (7).
5. CONCLUSIONS
It can be concluded from the study that the global average fiber content in the analyzed
segments is 60.4 kg/m3, with a standard deviation s = 12.1 kg/m3 (CoV of 20.1%). This
measured average content fits the nominal content of 60 kg/m3of fibers prescribed in the
design of the segments.
Analyzing the fiber content in different sized specimens was found to produce different
results. An average fiber content of 64.7 kg/m3 was obtained using 150 – mm diameter
cores. Although this value is greater than the dose of fibers used, it can be justified
because of the high concentration of fibers in the corners, which reaches 67.4 kg/m3,
while throughout the central zone, the concentration is 61.2 kg/m3 (including the
intermediate zone). At the same time, the concentration of the fiber results obtained
with smaller diameter specimens, all of which were cut in the central zone of segments,
are slightly lower, averaging 55.8 kg/m3 for specimens of d = 100 mm and 60.2 kg/m3
for specimens of d = 75 mm.
The available results for the 150-mm diameter cores drilled from different points of the
segments indicate a greater fiber content at the corners, tending to be higher in the
intrados than in the extrados. This trend is consistent with the results available in the
literature.
The results of segments 1 and 2 exhibit a more homogeneous distribution of fibers. In
this analysis, higher value of fiber content was reached in the center zone, where the
concrete drops from the hopper and the last layer does not flow.
As expected, comparing the fiber contents obtained in specimens with different
diameters, the lowest variation coefficient is obtained for the specimens of d = 150 mm.
As a result, the use of 150-mm cores is recommended for determining the fiber content.

Finally, a criterion to establish a lower limit of tolerance for the fiber content is
proposed as a function of the design fiber content, the expected coefficient of variation,
and the confidence level. In the case of the studied SFRC, a minimum of 11 samples are
required to obtain a CoV lower than 10% for both confidence levels used (90% and
95%).
6. ACKNOWLEDGEMENTS
The authors thank Gestió d’Infrastructures S.A. (G.I.S.A.) (At present
Infraestructures.cat) for providing facilities to develop this research. The stay in
Barcelona of Dr. Carmona during this research was financed by Project USM 26.11.43,
and the Department of Construction Engineering of the UPC, Barcelona, Spain.
7. REFERENCES
AENOR, 2004. UNE 83507 – Hormigones con fibras de acero y/o polipropileno. Rotura
por compresión. AEN/CNT 83 – Hormigón, Madrid (in Spanish).
AENOR, 2004. UNE 83509 – Hormigones con fibras de acero. Rotura por
flexotracción. AEN/CNT 83 – Hormigón, Madrid (in Spanish).
AENOR, 2010. UNE 83515 - Hormigones con fibras. Determinación de la resistencia a
fisuración, tenacidad y resistencia residual a tracción. Método Barcelona. AEN/CTN 83
– Hormigón, Madrid (in Spanish).
ACHE, 2003. Control Estadístico del Hormigón Estructural, Ed. ACHE, Madrid (in
Spanish).
Akkaya, Y., Picka, J., Shah, S. P., 2000. Spatial distribution of aligned short fibers in
cement composites. ASCE J Mater Civ Eng. 12, 272 – 279.
Boulekbache, B., Hamrat, M., Chemrouk, M., Amziane, S., 2010. Flowability of fibre-
reinforced concrete and its effect on the mechanical properties of the material. Constr
Build Mater. 24, 1664 – 1671.
Caratelli, A., Meda, A., Rinaldi, Z., Romualdi, P., 2011. Structural behavior of precast
tunnel segments in fiber reinforced concrete. Tunn Undergr Space Technol. 26, 284 –
291.
Chiaia, B., Fantilli, A. P., Vallini, P., 2007. Evaluation of minimum reinforcement ratio
in FRC members and application to tunnel linings. Mater Struct. 40, 593 – 604.
Chiaia, B., Fantilli, A., Vallini, P., 2009. Combining fiber-reinforced concrete with
traditional reinforcement in tunnel linings. Engineering Structures. 31, 1600 – 1606.
Chermant, J., Chermant, L., Coster, M., Dequiedt, A., Redon, C., 2001. Some fields of
applications of automatic image analysis in Civil Engineering. Cem Concr Compos. 23,
157 – 169.
Chung, D., 2001. Applied materials science: applications of engineering materials in
structural, electronics, thermal, and other industries.CRC Press, Boca Raton.
De La Fuente, A., Escariz, R. C., De Figueiredo, A.D., Molins, C. Aguado, A., 2012.A
new design method for steel fibre reinforced concrete pipes. Constr Build Mater. 30,
547 – 555.
De La Fuente, A., Pujadas, P., Blanco, A.,Aguado, A., 2012. Experiences in Barcelona
with the use of fibres in segmental linings. Tunn Undergr Space Technol. 27, 60 – 71.
Devore, J., 2012. Probabilidad y estadística para ingeniería y ciencias, 8th ed.Thomson,
México (in Spanish).
Dupont, D., Vandewalle, L., 2005. Distribution of steel fibres in rectangular sections.
Cem Concr Compos. 27, 391 – 398.
Ferrara, L.,Meda, A., 2006. Relationships between fibre distribution, workability and
the mechanical properties of SFRC applied to precast roof elements. Mater Struct. 39,
411 – 420.
Ferrara, L., Park, Y., Shah, S. P., 2008. Correlations among fresh state behavior, fiber
dispersion and toughness properties of SFRCs. ASCE J Mater Civ Eng. 20, 493 – 501.
Ferreira, J. C., Branco, F. A., 2007.Structural application of GRC in telecommunication
towers. Constr Build Mater. 21, 19 – 28.
Gettu, R., Barragan, B., Garcia, T., Ramos, G., Fernandez, C., Oliver, R., 2004. Steel
fiber reinforced concrete for the Barcelona metro line 9 tunnel lining, in: Di Prisco, M.,
Felicetti, R., Plizzari, G.A. (Eds.),Proceedings of the 6th RILEM Symposium on FRC
(BEFIB 2004)RILEM PRO 39, Bagneux, pp. 141 – 156.
Gettu, R., Gardner, D. R., Saldivar, H., Barragan, B.E., 2005. Study of the distribution
and orientation of fibers in SRFC specimens”. Mater Struct. 38, 31 – 37.
Grünewald, S., Walraven, J.C., Obladen, B., Zegwaard,J.W., Langbroek, M.,Nemegeer,
D., 2003.Tunnel segments of self-compacting steel fibre reinforced concrete,
inWallevik, O., Nielsson, I. (Eds.), Proceedings of the 3rd International RILEM
Symposium on Self-Compacting Concrete RILEM PRO 33, Bagneux, pp 715 – 724.
Kasper, T., Edvardsen, C., Wittneben, G., Neumann, D., 2008.Lining design for the
district heating tunnel in Copenhagen with steel fibre reinforced concrete segments.
Tunn Undergr Space Technol. 23, 574 – 587.
Kooiman, A. G., 1997. Design calculations of SFRC segments for application in the
Second Heinenoord tunnel (in Dutch). Delft University of Technology, Netherlands.
Kooiman, A. G., 2000. Modelling steel fibre reinforced concrete for structural design,
Delf University of Technology, Netherlands.
Lataste, J. F., Behloul, M., Breysse, D., 2008. Characterization of fibres distribution in a
steel fibre reinforced concrete with electrical resistivity measurements. NDT&E
International. 41, 638 – 347.
Lawler, J., Wilhelm, T., Zampini, D., Shah, S. P., 2003. Fracture processes of hybrid
fiber-reinforced mortar. Mater Struct. 36, 197 – 208.
Manson, T. O., Campo, M.A., Hixson, A. D., Woo, L. Y., 2002. Impedance
spectroscopy of fiber reinforced cement composites. Cem Concr Compos. 24, 457 –
465.
Molins, C., Aguado, A., Marí, A.R., 2006, Quality Control test for SFRC to be used in
precast segments. Tunn Undergr Space Technol. 21, 423 – 424.
Molins, C., Aguado, A., Saludes, S., 2009, Double Punch Test to control the energy
dissipation in tension of FRC (Barcelona test). Mater Struct. 42, 415 – 425.

Molins, C., Arnau, O., 2012. Experimental and analytical study of the structural
response of segmental tunnel linings based on an in situ loading test. Part 1: Test
configuration and execution. Tunn Undergr Space Technol. 26, 764 – 777.
Mora, F., Aguado, C., Molins, C., 2009.Distribución y orientación de fibras en dovelas
aplicando el ensayo Barcelona.Hormigón. 931, 28 – 37 (in Spanish).
NBN 15-238, 1992.Tests on Fibre Reinforced Concrete - Bending Test on Prismatic
Samples. Norme Belge, Institut Belge de Normalisation (IBN), Brussels, Belgium.
Orbe, A., 2013. Optimización del uso de hormigones autocompactantes reforzados con
fibras de acero en aplicaciones convencionales de resistencias moderadas. Universidad
del País Vasco. Bilbao.
Ozyurt, N., Mason, T., Shah, S., 2007. Correlation of fiber dispersion, rheology and
mechanical performance of FRCs. CemConcrCompos. 29, 70 – 79.
Pujadas, P. Blanco, A. De La Fuente, A., Aguado A., 2012. Cracking behaviour of FRC
slabs with traditional reinforcement. Mater Struct. 45, 707 – 725.
RILEM, 2004. Proceedings Pro039: 6th International RILEM Symposium on Fiber –
Reinforced Concrete (BEFIB 2004). Ed M. Di Prisco, R. Felicetti, G.A. Plizzari,
Bagneux, France.
RILEM, 2008. Proceedings Pro060: 7th RILEM International Symposium of Fibre
Reinforced Concrete: Design and Applications (BEFIB 2008). Ed R. Gettu, Bagneux,
France.
RILEM, 2012. Proceedings Pro088: 8th RILEM International Symposium of Fibre
Reinforced Concrete: challenges and opportunities (BEFIB 2012). Ed J. A.O. Barros,
Bagneux, France.
RILEM TC 162-TDF, 2003.Round-robin analysis of the RILEM TC 162-TDF Beam-
bending test: Part 3 – Fibre distribution.MaterStruct. 36, 631 – 635.
Torrents, J.M., Blanco, A., Pujades, P., Aguado, A., Juan, P., Sánchez, M.A., 2012.
Inductive method for assessing the amount and orientation of steel fiber in concrete.
Mater Struct. 45, 1577 – 1592.
Verma, S., Quiroz - Ruiz, A., 2006. Critical values for six Dixon tests for outliers in
normal samples up to sizes 100, and applications in science and engineering. Revista
Mexicana de Ciencias Geológicas. 23, 133 – 161.
Walraven, J. C., 2009. High performance fiber reinforced concrete: progress in
knowledge and design codes. Mater Struct. 42, 1247 – 1260.
Woo, L. Y., Wansom, S., Hixson, A. D., Campo, M.A., Mason, T. O., 2003. A universal
equivalent circuit model for the impedance response of composites. ASCE J Mater Civ
Eng. 38, 2265 – 2270.
Woo, L. Y., Wansom, S., Ozyurt, N., Mu, B., Shah, S. P., Mason, T. O.,
2005.Characterizing fiber dispersion in cement composites using AC-impedance
spectroscopy. Cem Concr Compos. 27, 627 – 636.
Zollo, R. F., 1997. Fiber-reinforced concrete: an overview after 30 years of
development. Cem Concr Compos. 19, 107 – 122.

Graphical Abstract (for review)

Figure 1: Sketch with the cross section of rings used in construction of the
experimental section of Line 9 of the Barcelona underground.
Figure
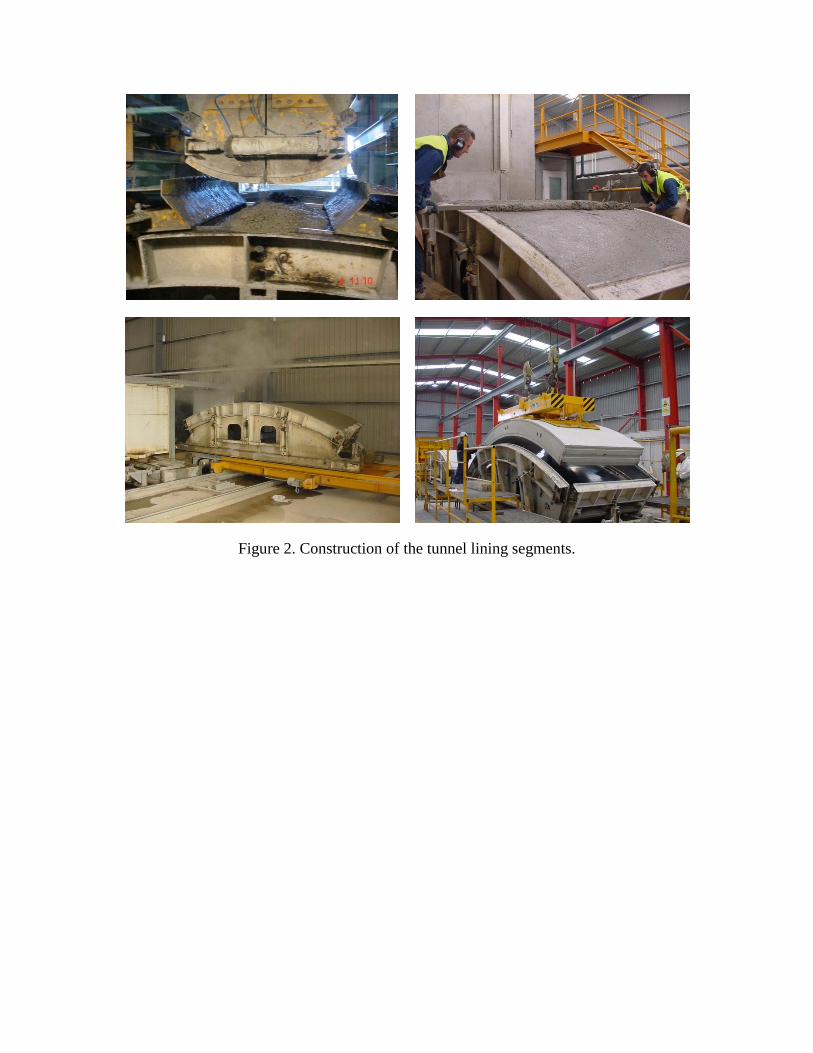
Figure 2. Construction of the tunnel lining segments.

Figure 3. Sampling locations where cores were drilled in each of the three tunnel lining
segments.
Figure 4. Drilling cores from tunnel lining segments
75 mm
100 mm
150 mm
Intermediate Zone
Corner Zone
Center Zone
Corner Zone

(a) (b)
Figure 5. (a) BCN test setup; (b) Typical Load – TCOD and Energy – TCOD diagrams
obtained by the BCN test.
Figure 6. Global analysis results: (a) normality test, (b) histogram.

(a)
(b)
Figure 7 (a) Checking data normality, (b) Cumulative frequency histogram and cumulative
normal distribution.

(a)
(b)
Figure 8. Fiber content () at each sampling point: (a) Average of all studied segments
and (b) Average of only Segments 1 and 2.
66,7 12,3
68,8 9,7
63,5 10,7
72,1 11,3 66,6
8,8
6,5
68,9 25,2
9,1
64,5 7,7
(kg/m
3)
CoV (%)
64,8 6,0
65,7 10,4
59,0 21,8
66,0 10,2
73,0 24,1
63,4 23,5
61,0 11,2

(a)
(b)
Figure 9. Amount of fibers through the segments thickness: (a) Extrados side, and (b)
Intrados side.

(a)
(b)
Figure 10. Fibers contents of each tested diameter: (a) tests of normality, (b) histograms and
normal distribution curve.

Figure 11. Relative lower tolerance limits for the fibers content of the FRC, with levels
of confidence (CL) of 90% and 95%, and different values of the expected coefficients
of variation.
Figure 12. Minimum values of the lower limits of the confidence intervals for
confidence levels of 90% and 95%, and lower limits of tolerance of the fibers content
as function of expected coefficient of variation
CL = 90% CL = 95%

Table 1- Concrete mix proportions used to build the tunnel lining segments.
Component Proportion
kg/m3
Cement CEM I 52,5R 410
Sand, 0-5 mm 580
Granitic sand, 0-5 mm 333
Granitic gravel, 5-12 mm 410
Granitic gravel, 12-20 mm 595
Water 115
Super plasticizer admixture 3
Steel fibers Wirand FF1 60
Table 2. Control tests results of SFRC used in the tunnel lining segments.
Compressive
strength
fc
First crack
strength
fct
Equivalent
tensile strength
fct,keq300
Number of tests 36 10 12
Mean strength (MPa) 54.13 6.67 5.62
Minimum strength (MPa) 47.57 5.51 4.80
Maximum strength (MPa) 60.20 7.30 7.35
CoV (%) 5.37 9.3 11.9
Table 3. Characterization of the properties of concrete by means of BCN test.
Pmax
kN
P2
kN
T2
Nm
P6
kN
T6
Nm
Mean value 117.8 59.0 182.8 22.9 322.2
CoV (%) 9.3 39.5 23.1 46.4 29.2
Minimum 116.4 17.2 87.2 5.5 160.2
Maximum 202.5 110.6 263.4 55.5 514.5
Table

Table 4. Fiber contents (kg/m3) determined from specimens with different diameter.
Fiber content kg/m3
Central zone
Intermediate
zone
Corner
zone
d = 75 mm d = 100 mm d = 150 mm
In It It Ex In It Ex Ex In Ex In Ex In
Seg
men
t 1 70.9 59.9 63.5 73.2 55.9 65.5 52.4
64.9 78.1
73.2 59.3
56.9 89.8
69.6 80.1 86.9 61.4 57.1 61.1 52.9 62.8 75.6
64.8 71.8 72.3 65.1 60.9 68.7 67.7 67.8 71.5
61.2 71.3
65.6 69.9 73.8 75.4 60.8 62.6 59.1 65.2 70.6
Seg
men
t 2
66.7 48.6 59.4 67.4 66.7 64.0 75.2 80.1 65.2
58.3 63.1
52.6 76.3
46.5 84.7 77.2 47.6 57.4 73.1 55.6 63.3 73.5
49.0 60.4 49.0 53.8 74.6 58.5 50.6 69.1 58.1
58.5 75.8
57.5 70.7 63.7 54.6 61.9 70.5 62.3 58.6 63.7
Seg
men
t 3
52.4 54.1 41.6 51.5 50.3 51.3 37.6 45.6 46.3
52.9 59.4
96.1 66.4
51.7 57.0 31.5 - 46.0 50.4 28.5 60.3 60.6
45.5 38.0 60.4 54.5 40.7 39.7 37.4 40.6 46.8
66.9 60.6
67.0 43.0 45.6 52.4 46.2 42.2 42.7 66.4 64.0
In: Intrados It: Intermediate Ex: Extrados

Table 5. Fibers contents at each sampling point with specimens of d = 150 mm.
Zone Segment Sample Fiber contents kg/m
3
Individual, i Average
CENTRAL
1 1 71.5 70.6
(8.1) 2 69.7
2 3 72.7 68.1
(13.5) 4 63.6
3 5 46.0 44.9
(6.4) 6 43.7
CORNER
1
7 73.4
69.2
(14.9)
8 69.2
9 66.3
10 67.9
2
11 64.5
65.3
(13.7)
12 68.4
13 67.2
14 61.2
3
15 81.3
67.7
(17.5)
16 60.5
17 63.8
18 65.2
INTERMEDIATE
1 19 66.3 66.3
2 20 60.7 60.7
3 21 56.2 56.2
( ): Coefficient of variation, %
Table 6. Statistical parameters of the samples used to evaluate the fiber content across the
segments thickness.
Parameter Extrados
side
Intrados
side
Average, kg/m3 62.9 66.5
Standard deviation, kg/m3 11.6 10.3
CoV, % 18.5 15.5
Minimum, kg/m3 40.6 46.3
Maximum, kg/m3 96.1 89.8

Table 7. Statistical parameters of each analyzed samples.
Parameter Diameter (mm)
75 100 150
Data number 47 36 12
Mean , kg/m3 60.2 55.8 61.2
Standard deviation, kg/m3 12.4 11.5 13.5
CoV, % 20.6 20.6 22.0
Minimum, kg/m3 31.5 28.5 40.6
Maximum, kg/m3 86.9 75.2 80.1