Embed Size (px)
Citation preview

F E E D I N G U R F U T U R E :THE FIRST- AND SECOND-YEAR
EVALUATION
E a s w a r a m o o r t h y M u t h u s w a m y , R e s e a r c h C o o r d i n a t o rR e s e a r c h & I n f o r m a t i o n S e r v i c e sT o r o n t o D i s t r i c t S c h o o l B o a r d1 1 / 1 2 - 0 6
1
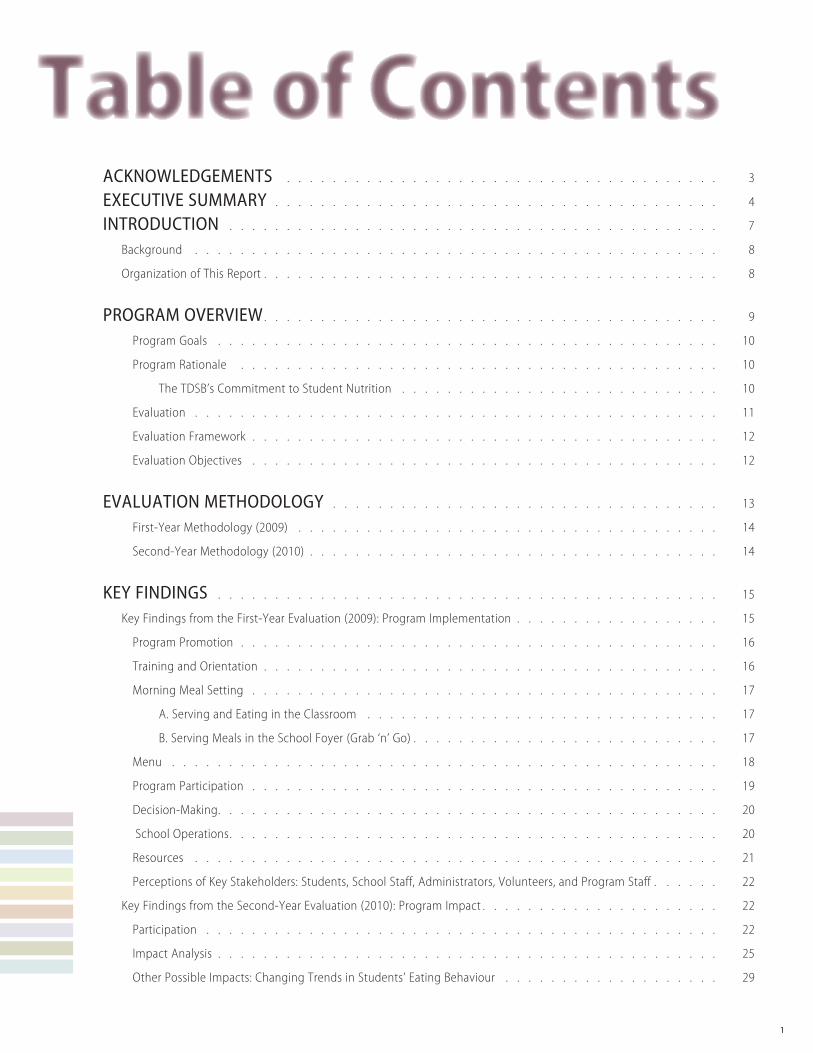
ACKNOWLEDGEMENTS . . . . . . . . . . . . . . . . . . . . . . . . . . . . . . . . . . . . . . 3
EXECUTIVE SUMMARY . . . . . . . . . . . . . . . . . . . . . . . . . . . . . . . . . . . . . . . 4
INTRODUCTION . . . . . . . . . . . . . . . . . . . . . . . . . . . . . . . . . . . . . . . . . . . 7
Background . . . . . . . . . . . . . . . . . . . . . . . . . . . . . . . . . . . . . . . . . . . . . . 8
Organization of This Report . . . . . . . . . . . . . . . . . . . . . . . . . . . . . . . . . . . . . . . . 8
PROGRAM OVERVIEW . . . . . . . . . . . . . . . . . . . . . . . . . . . . . . . . . . . . . . . . 9
Program Goals . . . . . . . . . . . . . . . . . . . . . . . . . . . . . . . . . . . . . . . . . . . . 10
Program Rationale . . . . . . . . . . . . . . . . . . . . . . . . . . . . . . . . . . . . . . . . . . 10
The TDSB’s Commitment to Student Nutrition . . . . . . . . . . . . . . . . . . . . . . . . . . . . 10
Evaluation . . . . . . . . . . . . . . . . . . . . . . . . . . . . . . . . . . . . . . . . . . . . . . 11
Evaluation Framework . . . . . . . . . . . . . . . . . . . . . . . . . . . . . . . . . . . . . . . . . 12
Evaluation Objectives . . . . . . . . . . . . . . . . . . . . . . . . . . . . . . . . . . . . . . . . . 12
EVALUATION METHODOLOGY . . . . . . . . . . . . . . . . . . . . . . . . . . . . . . . . . . 13
First-Year Methodology (2009) . . . . . . . . . . . . . . . . . . . . . . . . . . . . . . . . . . . . . 14
Second-Year Methodology (2010) . . . . . . . . . . . . . . . . . . . . . . . . . . . . . . . . . . . . 14
KEY FINDINGS . . . . . . . . . . . . . . . . . . . . . . . . . . . . . . . . . . . . . . . . . . . . 15
Key Findings from the First-Year Evaluation (2009): Program Implementation . . . . . . . . . . . . . . . . . . 15
Program Promotion . . . . . . . . . . . . . . . . . . . . . . . . . . . . . . . . . . . . . . . . . . 16
Training and Orientation . . . . . . . . . . . . . . . . . . . . . . . . . . . . . . . . . . . . . . . . 16
Morning Meal Setting . . . . . . . . . . . . . . . . . . . . . . . . . . . . . . . . . . . . . . . . . 17
A. Serving and Eating in the Classroom . . . . . . . . . . . . . . . . . . . . . . . . . . . . . . . 17
B. Serving Meals in the School Foyer (Grab ‘n’ Go) . . . . . . . . . . . . . . . . . . . . . . . . . . . 17
Menu . . . . . . . . . . . . . . . . . . . . . . . . . . . . . . . . . . . . . . . . . . . . . . . . 18
Program Participation . . . . . . . . . . . . . . . . . . . . . . . . . . . . . . . . . . . . . . . . . 19
Decision-Making . . . . . . . . . . . . . . . . . . . . . . . . . . . . . . . . . . . . . . . . . . . . 20
School Operations . . . . . . . . . . . . . . . . . . . . . . . . . . . . . . . . . . . . . . . . . . . 20
Resources . . . . . . . . . . . . . . . . . . . . . . . . . . . . . . . . . . . . . . . . . . . . . . 21
Perceptions of Key Stakeholders: Students, School Staff, Administrators, Volunteers, and Program Staff . . . . . . 22
Key Findings from the Second-Year Evaluation (2010): Program Impact . . . . . . . . . . . . . . . . . . . . . 22
Participation . . . . . . . . . . . . . . . . . . . . . . . . . . . . . . . . . . . . . . . . . . . . . 22
Impact Analysis . . . . . . . . . . . . . . . . . . . . . . . . . . . . . . . . . . . . . . . . . . . . 25
Other Possible Impacts: Changing Trends in Students’ Eating Behaviour . . . . . . . . . . . . . . . . . . . 29
Table of Contents
2
CONCLUSIONS AND RECOMMENDATIONS . . . . . . . . . . . . . . . . . . . . . . . 31
NEXT STEPS . . . . . . . . . . . . . . . . . . . . . . . . . . . . . . . . . . . . . . . . . . . . . 33
REFERENCES . . . . . . . . . . . . . . . . . . . . . . . . . . . . . . . . . . . . . . . . . . . . . 34
TABLES Table 1: Profile of Students Served in the First Year of the Feeding Our Future Program . . . . . . . . . . . . . . 12
FIGURES Figure 1: Conceptual Framework for Analyzing the Effects of a Universal-Free School Breakfast Program (USBP) . . . . 12
Figure 2: Average Daily Program Participation Rate, 2008-09 . . . . . . . . . . . . . . . . . . . . . . . . . . 19
Figure 3: Students’ Eating Habits on Most Days During a School Week . . . . . . . . . . . . . . . . . . . . . 22
Figure 4: Participation in the Morning Meal Program During a School Week, 2009-10 . . . . . . . . . . . . . . . 23
Figure 5: Participation in the Program by Student Characteristics . . . . . . . . . . . . . . . . . . . . . . . . 23
Figure 6: Perceived School Meal Characteristics . . . . . . . . . . . . . . . . . . . . . . . . . . . . . . . . 24
Figure 7: Top Ten Student Perspectives on Increasing Participation . . . . . . . . . . . . . . . . . . . . . . . 24
Figure 8: Student Satisfaction with the Program . . . . . . . . . . . . . . . . . . . . . . . . . . . . . . . 25
Figure 9: Top Ten Student Perspectives on the Benefits of the Morning Meal Program . . . . . . . . . . . . . . . 25
Figure 10: Percentage of Students Suspended . . . . . . . . . . . . . . . . . . . . . . . . . . . . . . . . 26
Figure 11: Absenteeism Rate . . . . . . . . . . . . . . . . . . . . . . . . . . . . . . . . . . . . . . . . 26
Figure 12: Percentage of Grade 7 and 8 Students Who Achieved “Excellent” or “Good” on the
Nine Learning Skills (2009-10 Term 3 Report Card) . . . . . . . . . . . . . . . . . . . . . . . . . . . . 27
Figure 13: Grade 7 and 8 Student Academic Achievement (2009-10 Term 3 Report Card) and
Eating in the Morning During a School Week . . . . . . . . . . . . . . . . . . . . . . . . . . . . . . . 27
Figure 14: Secondary School Student Academic Achievement (2009-10) and Eating in the Morning During a School Week . . . . . . . . . . . . . . . . . . . . . . . . . . . . . 28
Figure 15: Health in Comparison to Other Students . . . . . . . . . . . . . . . . . . . . . . . . . . . . . . 29
Figure 16: Health Compared to Previous School Year . . . . . . . . . . . . . . . . . . . . . . . . . . . . . 29
Figure 17: Eating Behaviour Snapshots, 2006-07 and 2009-10 . . . . . . . . . . . . . . . . . . . . . . . . . 30
Figure 18: Eating Behaviour Cohort Comparison, 2006-07 and 2009-10 . . . . . . . . . . . . . . . . . . . . . 30
APPENDICES Appendix 1: Student Nutrition Program Grant Application Guide 2011/2012 . . . . . . . . . . . . . . . . . . . 35
Appendix 2: School Operations: First-Year Findings Trends in Achievement, Behaviour and Absenteeism . . . . . . . 50
3
I would like to acknowledge a number of people who contributed to this evaluation and to the preparation of this report:
The evaluation advisory committee whose members provided guidance and input regarding the development of the evaluation framework,
methods, tools, and communication materials; the committee members are:
• Toronto District School Board (TDSB): Glenford Duffus (Superintendent of Education), Monica Jacobs (Vice Principal), Patricia Manousos
(District Manager, Nutrition Services), Larry Maloney (Vice Principal), Barbara Fry (Teacher), Meghan Roberts (Teacher), Patricia Vanetti (Vice
Principal), Sunita Joshi (Vice Principal), Grace Lewis-Antoine (Teacher), Angela Dozzi (Nutrition Liaison Officer), Mena Paternostro (Coordinator
Student Nutrition Program), Lorna Looby-Crosse (Vice Principal), Frankie Halls (Vice Principal), Monday Gala (Vice Principal), Ed Malabre
(Principal), Carmen Wynter-Ellis (Principal), and Shosh Brenner (Principal).
• Toronto Foundation for Student Success (TFSS): John Embry (Chairman), Steven Harper (Finance Director), and Catherine Parsonage
(Executive Director and CEO).
• Toronto Public Health (TPH): Judi Wilkie (Manager, Healthy Living), Denise Vavaroutsos (Supervisor, Student Nutrition Program), and Neera
Chaudhary (Consultant, Nutrition Promotion).
• Toronto Partners for Student Nutrition: Fiona Bowser (Manager) and Lori Nikkel (Manager).
I would also like to thank Jennifer Ghadiali, (Program Evaluator, TPH) and Kimberly McColl (Consultant, Nutrition Promotion, TPH) for reviewing
the student surveys and providing valuable suggestions, and Anne Turpin from the TFSS (Senior Student Nutrition Program Budget Analyst) for
providing the program-related data and documents.
At Research and Information Services, TDSB: Tammy Denike (Office Manager), for coordination and support at all stages of this project, its
development, and production of all communication materials, including this report; Karen Kozovski (Research and Information Analyst) who created
the survey in Teleform, assisted in coordinating the survey printing and distribution process, coordinated the scanning and verification process, and
prepared the dataset for further analysis; Matthew Botts (Data/Research Technician) for scanning and verifying all of the survey data; Pascal Huang
(Research and Information Analyst) for data analyses and graphs required for this project; Bryce Archer (Research Assistant) for comments and
suggestions on an early draft of this report; Research Coordinators, Jan O’Reilly, Maria Yau, and Rob Brown for providing guidance and support; and
Silvia Girod (Manager) and Roula Anastasakos (Superintendent) for their encouragement and support throughout this project.
Thanks to the TDSB Nutrition Task Force Chair, Trustee Michael Couteau and The Nutrition Task Force members for supporting this evaluation and
ensuring funding to do this research.
Finally, thanks to all the students who participated in the focus groups and survey, and the school staff, teachers, school administrators, and
volunteers for participating in the interviews and sharing their candid thoughts about the program.
Acknowledgements
4
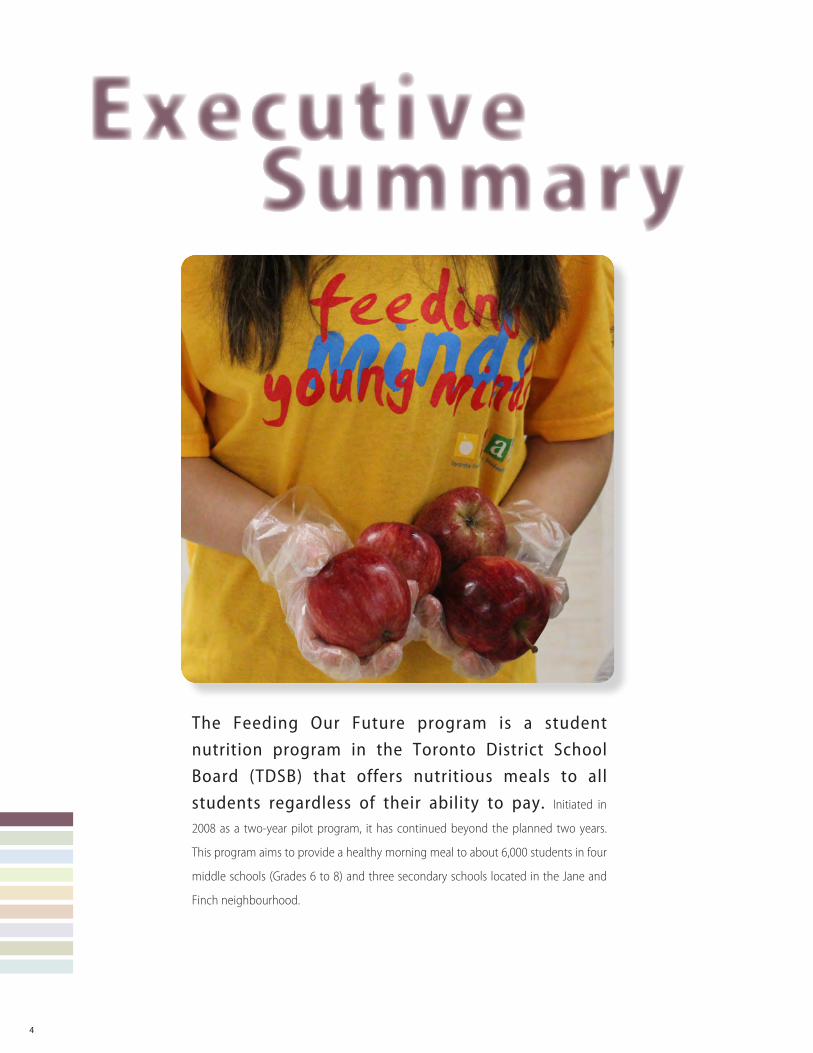
The Feeding Our Future program is a student nutrition program in the Toronto District School Board (TDSB) that offers nutritious meals to all students regardless of their ability to pay. Initiated in
2008 as a two-year pilot program, it has continued beyond the planned two years.
This program aims to provide a healthy morning meal to about 6,000 students in four
middle schools (Grades 6 to 8) and three secondary schools located in the Jane and
Finch neighbourhood.
Executive Summary
5
The objective of this evaluation was to monitor the implementation
of the program across these seven sites to gain an in-depth
understanding of strengths and areas for improvement and to
determine the impact of the program on student health, behaviour,
attendance, attention, and achievement.
Both qualitative and quantitative methods were used to evaluate the
Feeding Our Future program. Qualitative methods were predominantly
used in the first year of the program evaluation. The first-year
evaluation mostly focused on implementation-related topics such
as training and orientation, meal setting, promotion, participation,
decision-making, school operations, menu, and resources. These
findings were shared with school administrators and program staff,
leading to modifications in the implementation of the program. A
student survey was conducted at the end of the second year of the
program (Spring 2010). It covered topics such as student participation
in the program, eating habits, quality and quantity of the food
provided, perceived well-being, and satisfaction with the program.
This evaluation also used student data (e.g., attendance, suspensions,
achievement) from the Student Information System.
Program Delivery and Student ParticipationStudents from six of the seven schools participating in the program
had the morning meal served and eaten in the classroom around 10:00
a.m. The remaining school, a secondary school, chose to distribute the
morning meal in the school foyer before the start of school; students
then ate their meal in the school hallways, classroom (if allowed by the
teacher), cafeteria, or other parts of the school. In all seven schools, the
morning meal was also available in the school office. Toronto Public
Health (TPH) provided expertise and ensured compliance with respect
to the nutritional value of the meal and food safety, handling, and
sanitation issues by regularly sending in its dieticians and public health
inspectors. They also offered free workshops on safe food handling,
sanitation, and nutrition. Generally, the meal program affected the
school operations in a minor way only.
Almost all middle school students (97%) participated in the program,
with the vast majority (82%) participating at least three days in a school
week. In the participating secondary schools, the majority of students
(85%) participated in the program and nearly half (46%) participated at
least three days in a school week.
Morning meals served in classrooms around 10:00 a.m. provided all
students with an opportunity to eat a nutritious meal. However, meals
provided in the school foyer tended to restrict student participation in
the program. Student participation was also affected by perceptions
about the nature of the food (e.g., freshness, taste, variety) and the
ways it was prepared.
OutcomesIn the interviews conducted at the end of the first year of the
implementation of this program, most of the school administrators,
teachers, and school and program staff indicated numerous
benefits resulting from eating morning meals, such as:
• improved student behaviour or attitude;
• reduced tardiness;
• reduced incidence of disciplinary problems; and
• improved ability to stay on task.
At the end of the second year of the implementation of this program,
outcomes related to attendance, suspensions, and achievement were
studied using data from 4,050 student surveys, the Student Information
System, and Safe Schools data.
To measure the relationship between academic achievement
and eating a morning meal, survey responses from students who
participated in the program were matched with the
students’ achievement data. The findings indicate that:
• The Grade 7 and 8 students who ate morning meals most days
in a school week achieved better results on their learning skills
(i.e., excellent or good) compared to those students who ate in
the morning on only one to two days or who never ate in the
morning. Differences were noticeable in the areas of independent
work (70% vs. 56%), initiative (65% vs. 51%), problem solving (66%
vs. 53%), and class participation (72% vs. 60%).
• The information from report card data for the Grade 7 and 8
students shows significant differences in the case of Reading,
where 61% of students who ate the morning meal on most
E X E C U T I V E S U M M A R YF E E D I N G O U R F U T U R E : T H E F I R S T - A N D S E c O N D - Y E A R E v A l U A T I O N
6
days in a school week achieved or exceeded the provincial
standard (Levels 3 and 4) compared to half (50%) of the
students who ate morning meals on only a few days or
not at all. Fewer students (28%) who ate morning meals at
least three days in a school week were at-risk in Science,
compared to nearly half (44%) of those students who ate
morning meals only one to two days or who never ate them.
• Secondary school students who ate morning meals on most
days during a school week were on-track for graduation by
accumulating sufficient credits and achieved better scores
in Mathematics than those who ate morning meals on
fewer days during the school week or who never ate in the
morning.
• Most students indicated that the program fulfilled their basic
needs and improved their well-being. Students who ate
morning meals on most days during a school week were
more likely to rate their health as excellent or good (75% vs.
58%) and to indicate that their health had improved since
the last school year (63% vs. 45%).
• Students who ate morning meals on most days during a
school week were less likely to be suspended and more likely
to come to school regularly.
The findings in general suggest that school breakfast programs
providing access to a healthy morning meal to all students in their
classrooms can be a valuable intervention measure to facilitate
student success and well-being.
RecommendationsBased on these findings, it is recommended that the Feeding
Our Future program should continue to:
• provide morning meals, preferably in the classroom so as to
ensure maximum participation;
• promote the meal as cleanly prepared and nutritious fresh
food;
• explore the possibility of rotating menus more frequently
and making regular changes based on student surveys;
• seek to involve more students, parents, and community
members as volunteers; and
• explore ways to better meet the best practices outlined in
the TPH Student Nutrition Program Funding Criteria (see
Appendix 1).
7
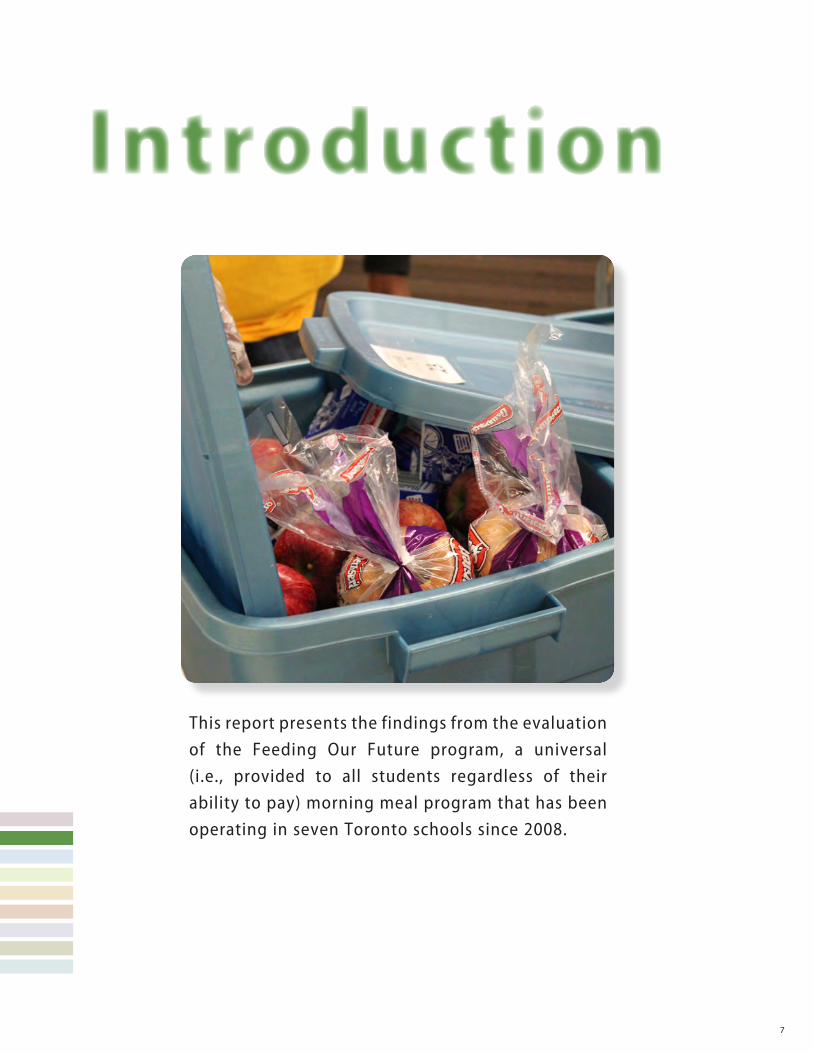
This report presents the findings from the evaluation of the Feeding Our Future program, a universal (i.e., provided to all students regardless of their ability to pay) morning meal program that has been operating in seven Toronto schools since 2008.
Introduction
8
BackgroundData from the Toronto District School Board’s (TDSB) 2006
Student Census1 indicated that the majority of students (51%
of elementary school students and 68% of secondary school
students) from the Jane and Finch neighbourhood in Toronto
came to school without eating breakfast every day. These
findings are not surprising; the Jane and Finch neighbourhood
faces considerable socio-economic challenges, such as elevated
rates of poverty, immigration, and violent incidents, and health
challenges, such as elevated rates of diabetes, obesity, and
nutrition/eating disorders (e.g., Williams & Clarke, 2003; Prescod,
2008; Glazier & Booth, 2007). The findings from the 2006 Student
Census coupled with the request from school administrators for a
nutritious morning meal for all students led to the launch of the
Feeding Our Future program.
The pilot program was jointly funded by the Ministry of Children
and Youth Services, the City of Toronto, and the Toronto
Foundation for Student Success (TFSS). Parental contributions and
fundraising were also required to fund this program. The TFSS
managed the funding and administration of the program along
with the TDSB’s Student Nutrition Services, with the support of
Toronto Pubic Health (TPH) and the Toronto Partners for Student
Nutrition, which includes organizations such as FoodShare.
Participating schools were required to qualify for the program
through an application process administered by TPH in order to
access the funding from the City of Toronto.2
As part of the funding criteria, both TPH and the Ministry of
Children and Youth Services required the schools to provide
nutritious food based on Canada’s Food Guide and to offer a
variety of healthy food choices suitable to the cultures of the
community.3 There were also requirements for food safety,
handling and sanitation, accessibility, budget, and other
accountability and best practices (see Appendix 1). As part of the
funding arrangements, TPH ensured compliance with respect
to the nutritional value of the food provided through periodic
evaluations of and consultations on the menus and food by a
public health dietician/nutritionist, and with respect to food safety
handling and sanitation through inspection of kitchen facilities by
a public health inspector. It also offered free workshops on safe
food handling, sanitation, and nutrition.
In May 2008, the TDSB approved a recommendation from the
Nutrition Task Force to evaluate the impact of the Feeding Our
Future program. The TDSB’s Research and Information Services
department was asked to carry out this evaluation.
Organization of This ReportThis report is divided into four major sections. The first section
presents an overview of the program, its goals and rationale, the
evaluation, and its objectives. The second section describes the
evaluation methodology. The third section presents key findings
organized into two subsections: the first-year evaluation (2009)
focuses on the implementation of the program; the second-year
evaluation (2010) focuses on the program’s impact. The last
section of the report provides a summary of the main findings,
discusses their implications, and provides recommendations
for action.
1 For an overview of the 2006 Student Census see http://www.tdsb.on.ca/wwwdocuments/about_us/external_research_application/docs/2006StudentCensusSystemOverview1.pdf.
2 See http://www.toronto.ca/health/student_nutrition_program/ for complete details on the application process.3 See the Ministry of Children and Youth Services nutrition guidelines: http://www.children.gov.on.ca/htdocs/English/topics/schoolsnacks/nutrition_guidelines.aspx.
9
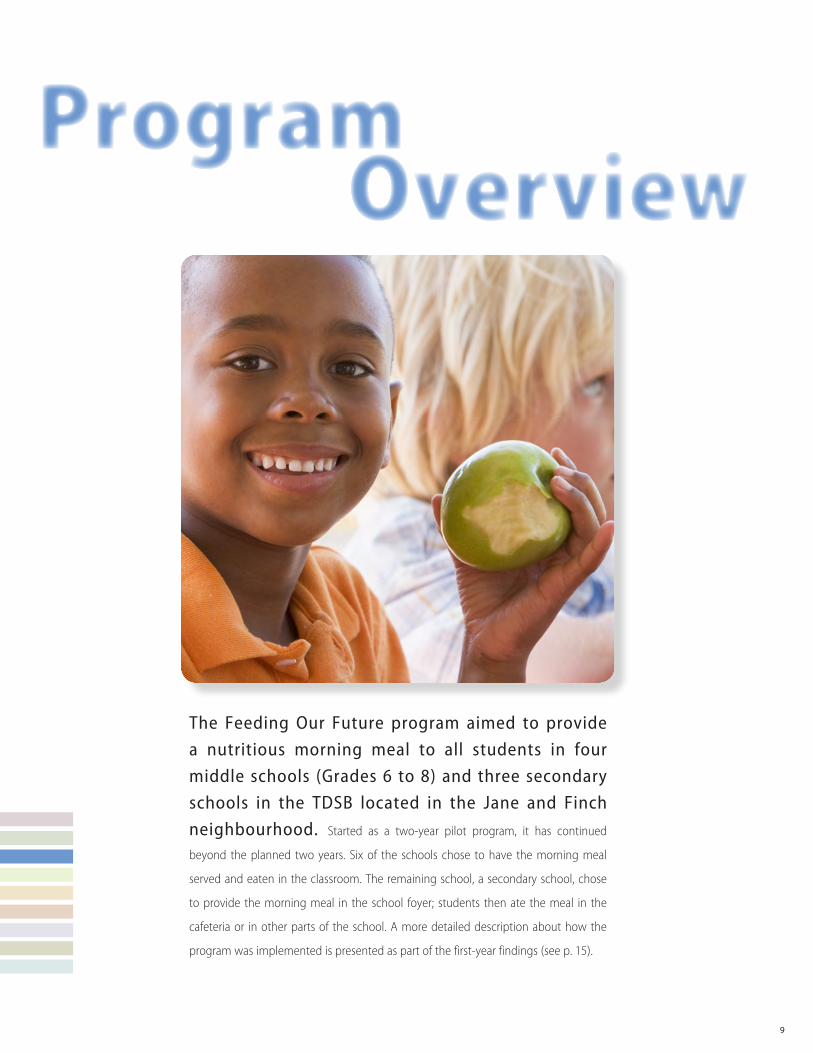
The Feeding Our Future program aimed to provide a nutritious morning meal to all students in four middle schools (Grades 6 to 8) and three secondary schools in the TDSB located in the Jane and Finch neighbourhood. Started as a two-year pilot program, it has continued
beyond the planned two years. Six of the schools chose to have the morning meal
served and eaten in the classroom. The remaining school, a secondary school, chose
to provide the morning meal in the school foyer; students then ate the meal in the
cafeteria or in other parts of the school. A more detailed description about how the
program was implemented is presented as part of the first-year findings (see p. 15).
Program Overview
10
Program GoalsThe following are the short-term and long-term goals of the
program:
Short-term Goals • �To�improve
• health;
• student behaviour;
• attention in school;
• attendance; and
• student achievement.
Long-term Goals • �To�improve
• graduation rates; and
• nutrition for entire families; and
• �To�reduce
• violence in the school and community; and
• diabetes and hypertension.
Program RationaleProponents of universal school breakfast programs (i.e., programs
that are available to all students regardless of their ability to pay)
believe that making school breakfast free to all students removes
social stigma and financial barriers to participation and that, as a
result, more children, especially those who might otherwise not
eat breakfast or might eat nutritionally inadequate breakfasts,
will consume breakfast at school. Since school breakfasts
are nutritious and improve student cognition and classroom
behaviour, it is expected that universal school breakfast programs
will improve student academic achievement (Ponza et al., 1999).
The reasons for implementing student nutrition programs such as
the Feeding Our Future program are well illustrated in the TDSB’s
commitment to student nutrition programs.
The TDSB’s Commitment to Student NutritionTheTorontoDistrictSchoolBoard(TDSB)recognizesthedirect
relationshipbetweenhealthynutritionandtheacademic
achievementofourstudents.
Healthyfoodisnecessaryforstudentdevelopment-physical,
emotional,intellectualand social.Well-nourishedchildrenare
readyandabletolearninourclassrooms.Studentsparticipatingin
nutritionprogramsareabletoconcentratebetter,retainandapply
informationmoreeffectively,andaremorelikelytodemonstrate
positivebehavioursandrelationshipswithpeers.
NutritionprogramsareopentoallstudentsfromKindergartento
Grade12,regardlessoftheirabilitytocontributefinanciallytothe
program.
Nutritionprogramsalsoprovideteacherswiththeopportunityto
eatwiththechildrenandincorporatenutritioneducationintothe
curriculum.
TheTDSBiscommittedtoworkingwithitscommunitypartners
toensurethatstudentshaveequitableaccesstohighquality
school-basednutritionprograms;andthroughcurriculum
activities,theyhaveopportunitiestodevelopanappreciation
forgoodnutritionhabitsthatwilllastalifetime.(TDSB Nutrition
Liaison Team, n.d., p. 1)
The TDSB’s commitment to student nutrition is supported by an
international literature review by the Board’s Nutrition Task Force
(NTF) and other recent literature reviews. In a 2009 report, based
on their literature review, the NTF observed:
Wewerenotsurprisedtofindthattherearestrongphysiological
foundationstoexplainthelinkbetweennutritionalintakeand
academicachievement,aswellasevidencethatchildrenwho
experiencemalnutritionshowincreasedbehaviouraldisordersand
aggressivebehaviourastheygrowolder.Whatweweresurprised
tofindwasthatCanadaistheonlywesternizedcountrythatdoes
nothaveanationalsubsidizedstudentmealprogram.(Nutrition
Task Force, 2009, p. 4)
11
An earlier study by the Toronto Board of Education (Brown, 1993)
indicated school food programs have some effect on student
absence and lateness, and improved students’ knowledge of
nutrition principles.
Below are some findings from recent literature reviews that capture the
reasoning behind providing a morning meal or breakfast at school.
Researchers at the Harvard School of Public Health and Harvard
Medical School analyzed scientific research on the impact of school
breakfasts on children’s health and learning. They concluded the
following:
• Serving breakfast to school children who don’t get it elsewhere
significantly improves their cognitive or mental abilities, enabling
them to be more alert, pay better attention, and to do better on
Reading, Math, and other standardized test scores.
• Children who eat breakfast are sick less often, have fewer
problems associated with hunger (such as dizziness, lethargy,
stomach aches, and earaches), and do significantly better
than their non-breakfasted peers in terms of cooperation,
discipline, and interpersonal behaviours (Brown, Beardslee,
& Prothrow-Stith, 2008).
J. M. Murphy (2007), in his updated review on Breakfast and Learning,
notes that literature reviews published in the late 1990s set the stage
for understanding this new evidence by showing the associations
between regular breakfast consumption/non-consumption and
student outcomes. Research over the past five years has provided new
evidence for these associations and definitive evidence for others:
• Most notably, universally free school breakfast programs increase
the rate of overall breakfast eating and are judged to improve
learning by teachers and school principals.
• These findings, along with accumulating evidence for the danger
of nutritional risks, provide a clear rationale for continued efforts to
promote breakfast eating for children, schools, and the nation as a
whole.
A more succinct review of literature by Levin (2011) illustrates the
following:
• Skipping breakfast and experiencing hunger impair children’s
ability to learn.
• Eating breakfast at school helps improve children’s academic
performance.
• School breakfasts improve student behaviour and learning
environments.
• Breakfast in classroom programs and programs offering breakfast
free to all children in the cafeteria yield other positive results for
health and learning.
• Beliefs about breakfast can influence participation in school
breakfasts.
• School breakfasts can improve children’s nutrition and protect
against obesity.
• School breakfasts decrease the risk of food insecurity.
EvaluationEvaluating a universal morning meal program requires a clear
understanding of the linkages of various aspects or processes of
the program and background variables and how they influence
the outcomes. For this evaluation, an evidence-based conceptual
framework by Ponza et al. (1999) informed the development of the
evaluation methodology (see Figure 1).
P R O G R A M O V E R V I E WF E E D I N G O U R F U T U R E : T H E F I R S T - A N D S E c O N D - Y E A R E v A l U A T I O N
12
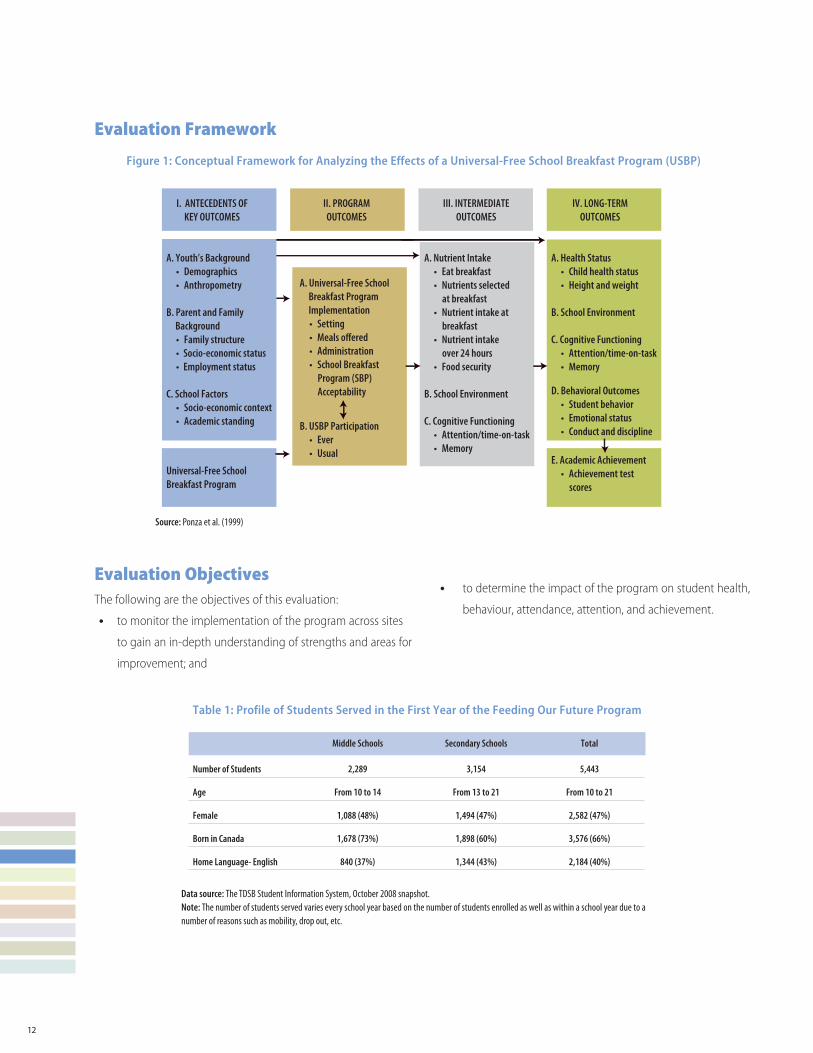
Evaluation ObjectivesThe following are the objectives of this evaluation:
• to monitor the implementation of the program across sites
to gain an in-depth understanding of strengths and areas for
improvement; and
• to determine the impact of the program on student health,
behaviour, attendance, attention, and achievement.
Evaluation Framework
A. Nutrient Intake • Eat breakfast • Nutrients selected at breakfast • Nutrient intake at breakfast • Nutrient intake over 24 hours • Food security
B. School Environment
C. Cognitive Functioning • Attention/time-on-task • Memory
A. Universal-Free School Breakfast Program Implementation • Setting • Meals oered • Administration • School Breakfast Program (SBP) Acceptability
B. USBP Participation • Ever • Usual
Universal-Free SchoolBreakfast Program
I. ANTECEDENTS OFKEY OUTCOMES
A. Health Status • Child health status • Height and weight
B. School Environment
C. Cognitive Functioning • Attention/time-on-task • Memory
D. Behavioral Outcomes • Student behavior • Emotional status • Conduct and discipline
E. Academic Achievement • Achievement test scores
II. PROGRAMOUTCOMES
III. INTERMEDIATEOUTCOMES
IV. LONG-TERMOUTCOMES
A. Youth’s Background • Demographics • Anthropometry
B. Parent and Family Background • Family structure • Socio-economic status • Employment status
C. School Factors • Socio-economic context • Academic standing
Middle Schools Secondary Schools Total
2,289 3,154 5,443Number of Students
From 10 to 14 From 13 to 21 From 10 to 21Age
1,088 (48%) 1,494 (47%) 2,582 (47%)Female
1,678 (73%) 1,898 (60%) 3,576 (66%)Born in Canada
840 (37%) 1,344 (43%) 2,184 (40%)Home Language- English
Source: Ponza et al. (1999)
Data source: The TDSB Student Information System, October 2008 snapshot.Note: The number of students served varies every school year based on the number of students enrolled as well as within a school year due to a number of reasons such as mobility, drop out, etc.
Table 1: Profile of Students Served in the First Year of the Feeding Our Future Program
Figure 1: Conceptual Framework for Analyzing the Effects of a Universal-Free School Breakfast Program (USBP)
13
The evaluation methodology was informed by literature reviews and studies, the conceptual framework by Ponza et al. (1999), and an evaluation advisory committee. The evaluation advisory committee was constituted
to advise on the evaluation framework, methods, tools, and communication materials.
This committee consisted of school administrators, teachers, and staff from the
participating schools; representatives from partner organizations (TPH, FoodShare, and
TFSS); program staff; and the Board’s Superintendent of Education for the area.
Evaluation Methodology
14
Both qualitative and quantitative methods were used to evaluate
the Feeding Our Future program. The first-year evaluation focused
on program implementation (i.e., training and orientation,
meal setting, promotion, participation, decision-making, school
operations, menu, and resources). The second-year evaluation
focused on the program’s impact on students.
First-Year Methodology (2009)The first-year evaluation was based on the following:
1. A total of 52 interviews with:
a. School administrators (7);
b. School nutrition coordinators (7);
c. Teachers and educational assistants (18);
d. School head caretakers (7);
e. Program managers/staff (2); and
f. Volunteers (i.e., students, parents, grandparents, and
others) (11).
2. Three student focus groups (one middle school and two
secondary schools).
3. Site visits to all seven schools.
4. A review of the program records for estimates on participation
rates and implementationrelated communications.
5. A review of system data for pre- and post-program
comparisons of school level changes in terms of achievement,
absenteeism, and suspensions (See Appendix 2).
These findings were shared with the school administrators and
program staff, leading to modifications in the implementation of
the program.
Second-Year Methodology (2010)The second-year evaluation was based on a student survey
that was sent to all students in the participating schools. It was
voluntary and confidential but not anonymous. The student
survey covered topics such as student participation in the
program, eating habits, quality and quantity of the food provided,
perceived well-being, and satisfaction with the program. The
overall response rate for the survey was 76%. The return rate
for the middle schools was higher (93%) than it was for the
secondary schools (64%).
The student surveys (4,050) were matched with information
collected from the TDSB’s Student Information System and
other datasets such as the 2008 Parent Census,4 the 2006
Student Census, and Safe Schools to review the program and
its outcomes.
4 For an overview of the 2008 Parent Census seehttp://www.tdsb.on.ca/wwwdocuments/about_us/external_research_application/docs/2008ParentCensusK-6SystemOverviewAndDetailedFindings.pdf.
15
Key Findings from the First-Year Evaluation (2009): Program Implementation
This section presents the description of the following key implementation components, their strengths, and areas for improvement: •Program Promotion •Training and Orientation •Morning Meal Setting • Menu •Program Participation •Decision-Making •School Operations •Resources •Perceptions of Key Stakeholders
Key Findings
16
Program PromotionDescription • Letters about the program were sent to students’ homes.
• Mention was made of the program in school newsletters.
• The program was verbally explained to students in school
announcements.
• The program was mentioned on TV and radio and in
newspapers.
• Posters about the program were displayed within
participating schools.
• To inaugurate the program, in one secondary school all
students were invited to the school cafeteria and were served
breakfast by the vice principal.
Strengths • The program was promoted to parents, students, and the
community in multiple ways.
Areas for Improvement • Teachers�and�staff:�The program needs to be promoted
among secondary school teachers and school staff so that
they know about the program and its implications for
teaching and learning.
• New�students:�There should be special promotion of the
program to new students who enter the school after the
beginning of term.
• Menus�and�nutritional�value:�The menu needs to be
promoted through posters in classrooms, providing students
and teachers with information on the nutritional value of the
menu, and stressing the cultural background of food. Menus
should also be sent home with students so parents are aware
of the nutritional value and can be assured that the menu is
culturally appropriate. These measures will help to increase
participation by boosting buy-in to the program.
Training and OrientationDescription • Almost all school nutrition coordinators have experience
working in school food programs or in school settings (e.g.,
school cafeteria, lunch room).
• Two-day program orientation sessions were held by TDSB
nutrition liaisons or the staff from Student Nutrition Services
for school nutrition coordinators and school administrators
on operational aspects of the program (e.g., preparing food,
serving food, etc.).
• Most school nutrition coordinators also attended TPH food
safety and nutrition workshops, as did student volunteers
from one of the secondary schools.
• The TFSS and nutrition liaison/Nutrition Services staff
provided support to school staff in the initial set-up of the
program and guidance throughout the year.
Strengths • Staff who attended the orientation sessions and workshops
expressed satisfaction with the training/orientation and
found it useful.
• Considerable support was provided by the TFSS and nutrition
liaison/Nutrition Services staff in the initial set-up of the
program, and guidance was given throughout the year.
Areas for Improvement • Provide orientation/training�for�teachers,�school�staff,�
and�student�volunteers to assist them in managing
the morning meal in the classroom (e.g., serving, eating,
cleaning, trash removal, and regular classroom activities
during the meal).
• Provide volunteer�management�training�for�
administrative�and�school�coordinators/staff�(e.g.,
recruitment, retention, training, the role of the volunteer,
parent/family volunteers, community and corporate
volunteers) through the use of the motivations identified in
this study (see p. 21).
17
Morning Meal SettingOf the seven schools that participated in the program, six chose
to have the morning meal served and eaten in the classroom. The
remaining school, a secondary school, chose to distribute the morning
meal in the school foyer; students then ate their meal in the school
hallways, classroom (when allowed by teachers), cafeteria, or other
parts of the school. In all seven schools, the morning meal was also
available in the school office, and in one school it was also available in
the guidance counsellor’s office.
A. Serving and Eating in the Classroom Description • The morning meal was distributed to classrooms by student
volunteers.
• The meal was served between 9:40 a.m. and 10:30 a.m. in most
schools, and in one secondary school students were allowed to
eat the meal after 11:00 a.m.
• Some teachers participated in serving food, which required gloves,
and did minor cleanup, although clean-up was usually done by
students.
• During the morning meal time, most teachers (except for those in
special education classes) asked students to do seated work (e.g.,
reading, independent work, answering language questions, etc.).
• In one of the secondary schools, the meal time was used for
making school announcements.
• Generally it took about 10 to 15 minutes to serve and eat the meal
and to clean up.
Strengths • More students were likely to participate because of timing,
convenience, familiarity, reduction in stigma, and eating as a social
activity.
• Many teachers acted as models by eating the morning meal with
their students.
• There were opportunities for teachers to encourage students to
eat, talk about healthy eating habits, model proper table etiquette,
share information, appreciate the value of food, promote
recycling, etc.
• Eating together in the class has the potential to create social
bonding with peers and teachers.
Areas for Improvement • Hygiene: An alternative area should be provided for eating
during gym class. Schools need adequate cleaning materials (i.e.,
sprays, cleaners, sponges, paper towels, nonalcoholic wipes, and
hand sanitizers).
• School�cleanliness: Students need enough time to eat and
clean-up. Recycling bins and carpets need to be cleaned more
frequently.
• Supervision: Protocols are needed for supervision and classroom
activities during meals.
• Timing/delivery: Students should be allowed to eat around
10:00 a.m. (especially in secondary schools), and food must be
maintained at the proper temperature (e.g., hot foods in insulated
bags, fruit stored in a refrigerator).
• Access�to�water: Although students have access to water, there
is a need to explore ways to provide readily available access to
drinking water in classrooms.
B. Serving Meals in the School Foyer (Grab ‘n’ Go)
Description • Between 8:00 a.m. and 9:00 a.m., the morning meals for students
were placed in the school foyer; students picked them up and
usually ate in the cafeteria, hallways, or in other parts of the
school.
• Toasters and/or warmers were provided for selected food items as
required.
• Grab ‘n’ Go meals were generally not allowed in the classrooms.
Strengths • Easier to administer and lower cost than classroom meals (e.g., did
not require food bins, fewer volunteers were required, avoided a
mess in the classrooms, required less clean-up, etc.).
• The cafeteria supplied the necessary clean space and access to
water or drinks.
• The time for serving the meal catered more to those who did not
eat breakfast before coming to school.
• Had the ability to provide hot food.
K E Y F I N D I N G SF E E D I N G O U R F U T U R E : T H E F I R S T - A N D S E c O N D - Y E A R E v A l U A T I O N
18
Areas for Improvement • Timing: Serving meals too early restricts participation in the
program. Many students indicted that they felt hungry only
around 10:00 a.m. or around the second period.
• Late�arrivals: Meals were not available for those who
arrived late. Late arrivals could usually only get fruit.
• Time�to�eat: Since the meals were not generally allowed in
the classrooms, students had less time to eat.
• Food�pick-up�location:�Students who do not enter the
school through the main door tended not to pick up the
meal. Even though the meals were available in the school
office, some students felt uncomfortable picking them
up there.
• School�cleanliness:�Students tended to eat in various
parts of the school thereby increasing the need for cleaning
and garbage collection in various parts of the school.
• Availability�of�food:�To improve the students’ access to
the school meal program, the school needs to consider
making all food items available until 10:30 a.m. in the school
foyer. The best solution, however, would be to allow the
morning meal to be served and eaten in classrooms.
Menu
Description • The menu was developed by the TDSB Student Nutrition
Services department in consultation with TPH and with input
from partners and schools. Menus are based on Canada’s
Food Guide as outlined by TPH.
• Meals generally included the three food groups with at least
one full serving from each (i.e., vegetable and fruit, grain
products, milk and alternatives). However, at least one school
tended to provide food from only two food groups. Over
the year, the menu was modified several times for various
reasons (e.g., availability of menu items, to reduce cost and
waste, to cater to student needs, to ensure variety, as a
result of suggestions from TPH and partners, or for ease in
preparation, packing, and delivery).
• Drinking water was always available.
• All food items were culturally appropriate, peanut free, and
accommodated students’ allergies.
• Initially there was considerable food waste (e.g., because
students were unfamiliar with certain food items, because
of stigma, and because of problems with the temperature of
some foods).
• The menu was improved with input from TPH, student menu
surveys, and school staff associated with the program.
• Food waste was reduced when the menu improved, the
stigma associated with the program decreased and/or was
eliminated, and when food ordering was based on actual
consumption.
• TPH dieticians made unannounced visits to schools to
monitor compliance with nutritional standards and provide
feedback for improvements.
Menu Quality and Quantity • Almost all teachers and students indicated that the food
provided was of good quality, nutritious, and sufficient.
• Students reported that it reduced cravings and they ate less
junk food, while teachers reported increased concentration,
calming effect on students, etc.
• School nutrition coordinators mentioned that food items
usually declined by students were white milk, wraps,
hummus, broccoli, waffles, apple sauce, tuna sandwiches,
cereal, bagels without jam, pizza served cold, pita bread,
salsa, English muffins, carrots without dip, and bananas.
Student Wish List • More choice and variety, especially to accommodate different
ethnic backgrounds.
• More warm food and more spicy food.
• Food served at the proper temperature.
• Fruits (strawberries, fruit bowls) instead of vegetables.
• Beverages every day (“After eating, we feel thirsty”): water
and a larger variety of juices.
• More carrots with dip, toast, carrot muffins, chocolate milk,
banana cake, yogurt tubes, and granola bars.
19
Areas for Improvement • Modifications�to�menu�items: While periodic modifications to
the menu are desirable, changes to the menu need to be done
in consultation with students and any changes made need to
be appropriately communicated to students and teachers. For
example, students did not like the discontinuation of pancakes
and granola bars and the reduction in availability of chocolate
milk (it was reduced from being served twice a week to only twice
a month) and did not understand the rationale behind those
changes.
• Monitoring: Menus should be monitored to ensure uniformity
and consistency (e.g., two teachers mentioned that there were
instances where students in different grades in the same school
got different food items).
• Menu�surveys: Almost all students and teachers agreed that
the menu implemented in March 2009 was the best and hoped
it would continue in the next school year; almost all expressed
the need for a menu survey in the next school year.
• Communications: Parents and students (especially new
students) need to be made aware of the menu and that meals
are available to all students regardless of their ability to pay.
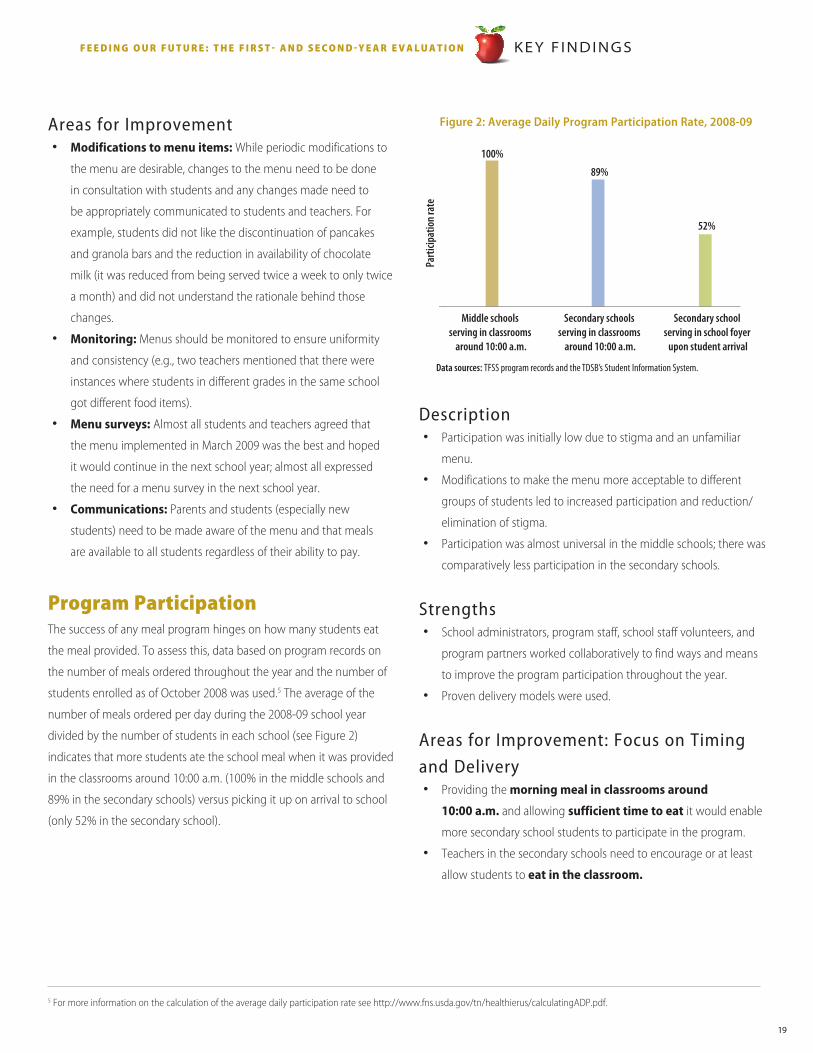
Program ParticipationThe success of any meal program hinges on how many students eat
the meal provided. To assess this, data based on program records on
the number of meals ordered throughout the year and the number of
students enrolled as of October 2008 was used.5 The average of the
number of meals ordered per day during the 2008-09 school year
divided by the number of students in each school (see Figure 2)
indicates that more students ate the school meal when it was provided
in the classrooms around 10:00 a.m. (100% in the middle schools and
89% in the secondary schools) versus picking it up on arrival to school
(only 52% in the secondary school).
Description • Participation was initially low due to stigma and an unfamiliar
menu.
• Modifications to make the menu more acceptable to different
groups of students led to increased participation and reduction/
elimination of stigma.
• Participation was almost universal in the middle schools; there was
comparatively less participation in the secondary schools.
Strengths • School administrators, program staff, school staff volunteers, and
program partners worked collaboratively to find ways and means
to improve the program participation throughout the year.
• Proven delivery models were used.
Areas for Improvement: Focus on Timing and Delivery • Providing the morning�meal�in�classrooms�around��
10:00�a.m. and allowing sufficient�time�to�eat it would enable
more secondary school students to participate in the program.
• Teachers in the secondary schools need to encourage or at least
allow students to�eat�in�the�classroom.
K E Y F I N D I N G SF E E D I N G O U R F U T U R E : T H E F I R S T - A N D S E c O N D - Y E A R E v A l U A T I O N
5 For more information on the calculation of the average daily participation rate see http://www.fns.usda.gov/tn/healthierus/calculatingADP.pdf.
Middle schools serving in classrooms
around 10:00 a.m.
Parti
cipat
ion r
ate
Secondary schools serving in classrooms
around 10:00 a.m.
Secondary school serving in school foyer
upon student arrival
100%
89%
52%
Data sources: TFSS program records and the TDSB’s Student Information System.
Figure 2: Average Daily Program Participation Rate, 2008-09
20
Decision-MakingDescription • A centrally planned common menu was decided on by TDSB
Nutrition Services with input from partners and schools.
• Schools generally had substantial autonomy in how the
program was implemented.
• Schools determined when and where the meals were to be
served, the time allocated for eating, and the mechanism for
delivery.
• Stakeholder participation in decision-making included
school administrators, teachers, students through feedback
surveys, input from student volunteers, and school nutrition
coordinators. Parents were kept informed through letters and
school council meetings.
• Generally, vice principals supervised the program by working
with nutrition liaison/Nutrition Services staff, school nutrition
coordinators, teachers, students, parents, and caretakers; they
were also involved in program promotion.
• Teachers were involved primarily through informal
consultations and staff meetings; two schools mentioned that
they had teachers represented on a formal committee.
• When implementing the program, schools took into
consideration how to:
• maximize the time spent on classroom teaching;
• ensure students had time to eat the meal;
• keep teachers happy; and
• avoid mess in the classroom.
• After implementation, teachers’ main concerns were loss of
teaching time, disruption, mess in the classroom, hygiene, and
additional responsibilities.
Strengths • Program staff, program partners, school administration,
volunteers, and school staff collaborated to make modifications
to the program to meet the needs of their particular school.
Areas for Improvement • Involvement: Steps are needed to boost formal involvement
of teachers, parents, students, school nutrition coordinators,
and head caretakers in the decision-making process.
School OperationsDescription • One of the key issues in running a school meal program is
the impact the program has on regular school and classroom
activities and overall administration. School administrators
and teachers were asked how the program affects their day-
to-day running of the school.
�School�Administrators
• The program requires additional staffing (i.e., the need to
hire school nutrition coordinators).
• It increases the workload for school administrators,
teachers, student volunteers, office staff, school nutrition
coordinators, and caretakers.
• There is no impact on the time classes begin.
• One secondary school integrated meal preparation and
delivery into its special education program and leadership
development classes to promote skill development.
• Almost all administrators perceived that overall student
attitude and behaviour improved following the
implementation of this program.
• Four of the seven administrators perceived a drop in the
rate of tardiness.
• Five out of seven administrators perceived a reduction in
the incidence of disciplinary problems.
�Teachers
• Nine of the 14 teaching staff in whose classrooms the
morning meal was served played some role in serving the
meal.
• A few teachers (4) had to clean up after the morning meal
was served.
• Twelve of the 14 teachers indicated that there was only a
minor reduction or little or no reduction in instructional
time due to serving the morning meal in the classroom.
• Almost all teaching staff (13 out of 14) were either very
positive or positive about serving/eating breakfast in the
classroom.
• Many teaching staff (9 out of 14) reported that they had
minor problems due to spillage. • Most teaching staff perceived an improvement in student
behaviour or attitude and student ability to stay on task.
21
�Volunteers�and�Their�Motivations
• Volunteers helped the school nutrition coordinators in
activities related to the preparation of food, packing, filling bins,
organizing bins, recycling packing materials, cleaning, serving
food in the classroom (or the school foyer), carrying bins to
classrooms, etc.
• Student volunteers reported the following motivations: the
work was interesting, they got to know people and make
friends, volunteering enabled them to meet their community
service requirements for graduation, and they developed skills
(e.g., people skills and work experience).
• Adult volunteers (e.g., parents, grandparents, etc.) reported the
following motivations: they liked to help the school and the
kids, it helped them learn English, they enjoyed working with
children, and they wanted to give back to community.
• Some adult volunteers also mentioned that the school was
nearby and made it easier for them to volunteer. A couple
of volunteers mentioned that volunteering for this program
helped them fulfill requirements to receive social assistance.
Strengths • School administrators, teachers, and school staff were committed
to taking on additional responsibilities.
• The program has resulted in no major changes in the school’s
day-to-day functioning.
• It has resulted in no major reduction in instructional time for most
teachers.
• It has improved student behaviour or attitude, reduced tardiness,
reduced incidence of disciplinary problems, and improved student
ability to stay on task (see also Appendix 2).
• It has provided an opportunity for students and other volunteers
to contribute and develop skills.
Areas for Improvement • Workload: Measures need to be taken to see how the increased
workload reported by school administrators, school nutrition
coordinators, caretakers, and teachers/staff directly associated with
the program can be reduced, perhaps by enhancing the role of
volunteers and/or recruiting more volunteers.
• Volunteers:�Steps need to be taken to recruit, train and retain
more volunteers.
• Coordination: Better coordination of the meal is needed on
days when students go on trips or have tests.
• Integration�with�other�school�programs: In one secondary
school the program was integrated with special education and
leadership classes. While the idea behind this method of delivery
is a good one (i.e., fulfilling the educational goals of the students
with special education needs and leadership class students),
it delayed delivery of the morning meal and reduced the
opportunity for others to volunteer.
ResourcesDescription • Over the 2008-09 school year, more resources were allocated to
participating schools in the form of refrigerators; retrofits to modify
the storage space into preparation areas; installation of sinks and
electric plugs; and provision of extra garbage bins, storage bins,
carts, and other food-preparation-related materials.
• Retrofits were also made to meet the public health code.
• Parents were asked to make a voluntary contribution of $20 to
meet program costs, resulting in a total contribution of $6,878.
• Volunteers contributed more than 5,000 hours with an estimated
value of about $50,000.
Strengths • Considerable resources were allocated to schools to implement
the program.
Areas for Improvement • Storage�space: This remains an issue in a few schools. In two
schools, the program was operated out of classrooms; in one
school, it operated out of the staff room.
• Ventilation: In some of the storage rooms, excess heat from
refrigerators and lack of ventilation created operational difficulties
and the inability to keep proper food temperatures.
• Temperature: Refrigerators used in the program need
temperature indicators to ensure that food items are maintained
at the correct temperature.
• Preparation�space: Some schools lacked sufficient space for
meal preparation.
• Hair�restraints:�All staff/volunteers involved in preparing/
K E Y F I N D I N G SF E E D I N G O U R F U T U R E : T H E F I R S T - A N D S E c O N D - Y E A R E v A l U A T I O N
22
packing the meals need to be provided with hair restraints.
• Family�volunteers: More could be done to solicit parents
and family members to volunteer through the use of the
volunteer motivations identified above (see p. 21).
• Additional�volunteers:�Community organizations,
school settlement workers from the Settlement Education
Partnership in Toronto (SEPT), and corporations should be
considered as potential sources for recruiting volunteers.
Perceptions of Key Stakeholders: Students, School Staff, Administrators,Volunteers, and Program Staff • All school administrators believed that major stakeholders
were either extremely positive or positive toward the
program.
• Almost all teachers viewed the program as either extremely
positive or positive.
• All teachers interviewed understood the importance of a
morning meal in preparing a student to learn.
• All school nutrition coordinators indicated that students
and staff attitudes toward the meal program became more
positive over the year.
• Volunteers mentioned that it was a great program and very
helpful to students who do not eat breakfast at home.
• Students generally spoke very positively about the program.
• Caretakers were more neutral toward the program; a few
felt that it was not a good idea to allow food in classrooms.
Almost all indicated that the program has increased their
workload.
• The TFSS and nutrition liaison/Nutrition Services staff as well
as school nutrition coordinators were highly committed to
and extremely positive about the program.
The findings from the first-year evaluation (2009) were shared
with the evaluation advisory committee, of which all key
players of the program are members. While program managers
indicated that there were not sufficient funds to implement all
the suggested improvements, the findings were used to make a
number of program improvements such as modifications to the
time of meal delivery and consumption in secondary schools,
posting of menus, sending menus home, and improved
coordination of food delivery within schools. The secondary school
that served meals in the school foyer has continued to do so due to
teacher and staff support for a Grab n’ Go delivery model.
Key Findings from the Second-Year Evaluation (2010): Program ImpactA student survey was conducted at the end of the second
year of the program (Spring 2010). The survey responses were
matched with the student data collected from the TDSB’s Student
Information System, the 2008 Parent Census, and Safe Schools.
The second-year evaluation focused on understanding the
participation of students, which is a key factor in determining
the impact of the program in terms of student health, behaviour,
attendance, and achievement.
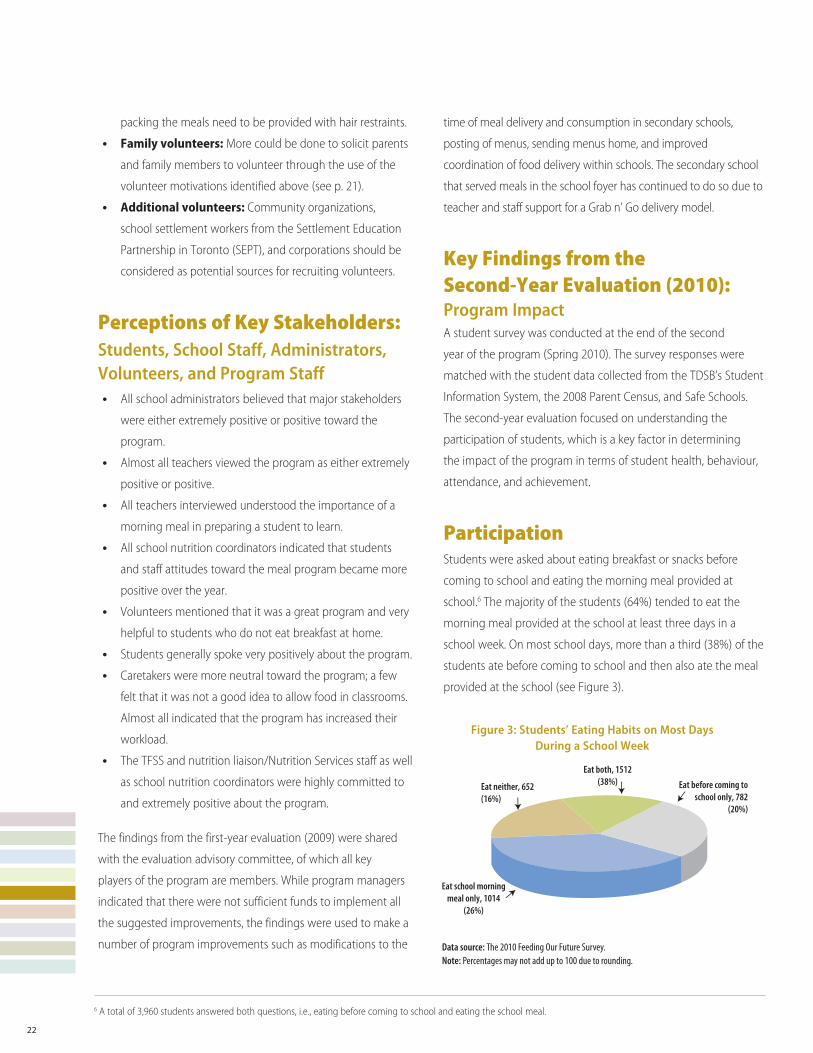
Participation Students were asked about eating breakfast or snacks before
coming to school and eating the morning meal provided at
school.6 The majority of the students (64%) tended to eat the
morning meal provided at the school at least three days in a
school week. On most school days, more than a third (38%) of the
students ate before coming to school and then also ate the meal
provided at the school (see Figure 3).
6 A total of 3,960 students answered both questions, i.e., eating before coming to school and eating the school meal.
Eat neither, 652(16%)
Eat both, 1512(38%) Eat before coming to
school only, 782(20%)
Eat school morningmeal only, 1014
(26%)
Data source: The 2010 Feeding Our Future Survey.Note: Percentages may not add up to 100 due to rounding.
Figure 3: Students’ Eating Habits on Most Days During a School Week
23
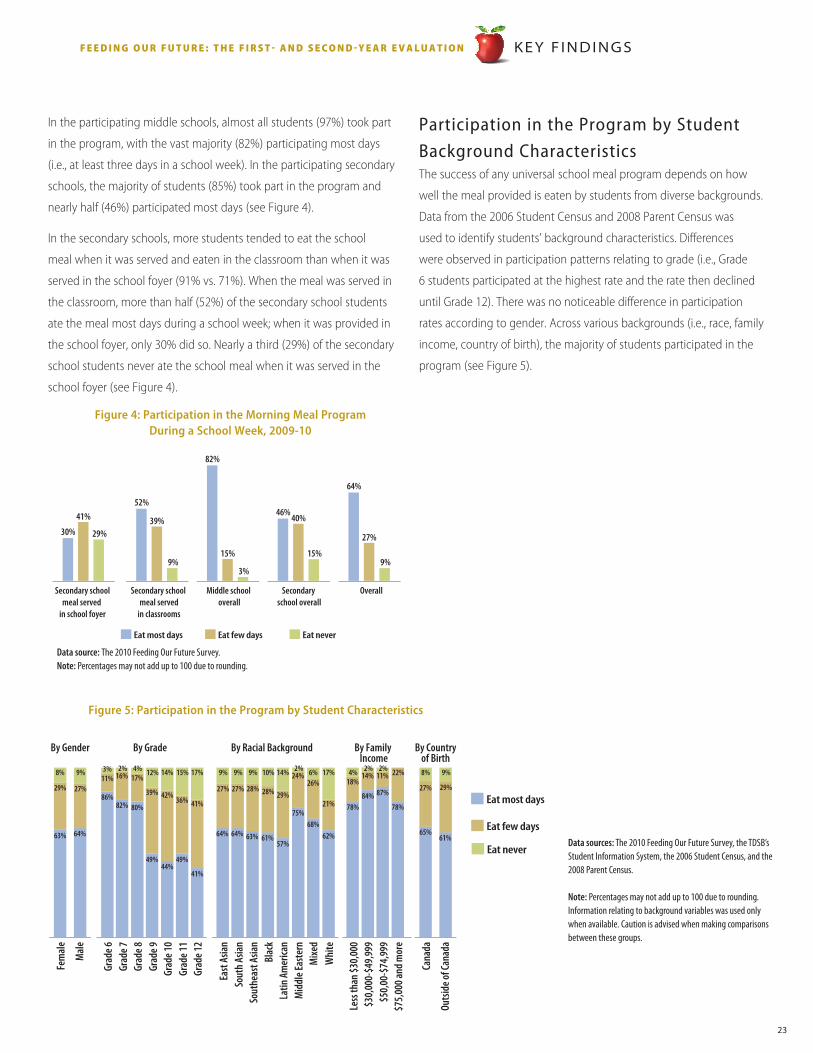
In the participating middle schools, almost all students (97%) took part
in the program, with the vast majority (82%) participating most days
(i.e., at least three days in a school week). In the participating secondary
schools, the majority of students (85%) took part in the program and
nearly half (46%) participated most days (see Figure 4).
In the secondary schools, more students tended to eat the school
meal when it was served and eaten in the classroom than when it was
served in the school foyer (91% vs. 71%). When the meal was served in
the classroom, more than half (52%) of the secondary school students
ate the meal most days during a school week; when it was provided in
the school foyer, only 30% did so. Nearly a third (29%) of the secondary
school students never ate the school meal when it was served in the
school foyer (see Figure 4).
Participation in the Program by Student Background Characteristics The success of any universal school meal program depends on how
well the meal provided is eaten by students from diverse backgrounds.
Data from the 2006 Student Census and 2008 Parent Census was
used to identify students’ background characteristics. Differences
were observed in participation patterns relating to grade (i.e., Grade
6 students participated at the highest rate and the rate then declined
until Grade 12). There was no noticeable difference in participation
rates according to gender. Across various backgrounds (i.e., race, family
income, country of birth), the majority of students participated in the
program (see Figure 5).
K E Y F I N D I N G SF E E D I N G O U R F U T U R E : T H E F I R S T - A N D S E c O N D - Y E A R E v A l U A T I O N
Secondary schoolmeal served
in school foyer
Secondary school meal served
in classrooms
Middle school overall
Secondary school overall
Overall
Eat most days Eat few days Eat never
30%
41%
29%
52%
39%
9% 9%
82%
15%
3%
46%40%
15%
64%
27%
90%
80%
70%
60%
50%
40%
30%
20%
10%
0%
Data source: The 2010 Feeding Our Future Survey.Note: Percentages may not add up to 100 due to rounding.
Figure 4: Participation in the Morning Meal Program During a School Week, 2009-10
64%
27%
9%
Fem
ale
Mal
e
By Gender By Grade
Eat most days
Eat few days
Eat never63%
29%
8%
64%
27%
9%
64%
27%
9%
Cana
da
Outsi
de of
Cana
da
By Countryof Birth
65%
27%
8%
61%
29%
9%
61%
28%
10%
Grad
e 6Gr
ade 7
86%
3%
82%
2%
Grad
e 8Gr
ade 9
80%
17%
39%
49% 49%
36%
12%
Grad
e 10
Grad
e 11
44%
42%
14%
57%
29%
14%15%
Grad
e 12
41%
41%
17%90%
80%
70%
60%
50%
40%
30%
20%
10%
0%
63%
28%
9%11% 16%
2%11%
2%14%
4%
By Racial Background
East
Asia
nSo
uth A
sian
Sout
heas
t Asia
nBl
ack
Latin
Am
erica
nM
iddl
e Eas
tern
Mixe
dW
hite
62%
21%
17%
68%
26%6%
By Family Income
Less
than
$30,
000
18%87%
4%
$30,
000-
$49,
999
$50,
00-$
74,9
99
84%
2%24%
75%
$75,
000 a
nd m
ore
78%78%
22%
Data sources: The 2010 Feeding Our Future Survey, the TDSB’s Student Information System, the 2006 Student Census, and the 2008 Parent Census.
Note: Percentages may not add up to 100 due to rounding. Information relating to background variables was used only when available. Caution is advised when making comparisons between these groups.
Figure 5: Participation in the Program by Student Characteristics
24
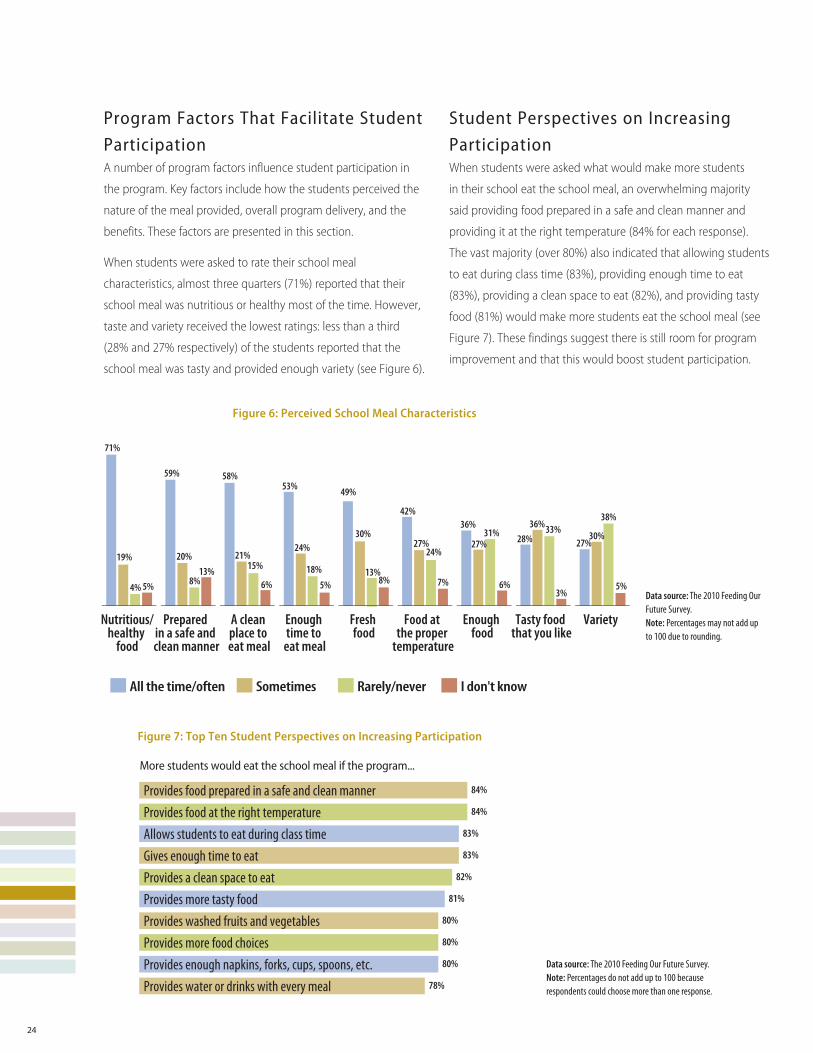
Program Factors That Facilitate Student Participation A number of program factors influence student participation in
the program. Key factors include how the students perceived the
nature of the meal provided, overall program delivery, and the
benefits. These factors are presented in this section.
When students were asked to rate their school meal
characteristics, almost three quarters (71%) reported that their
school meal was nutritious or healthy most of the time. However,
taste and variety received the lowest ratings: less than a third
(28% and 27% respectively) of the students reported that the
school meal was tasty and provided enough variety (see Figure 6).
Student Perspectives on Increasing Participation When students were asked what would make more students
in their school eat the school meal, an overwhelming majority
said providing food prepared in a safe and clean manner and
providing it at the right temperature (84% for each response).
The vast majority (over 80%) also indicated that allowing students
to eat during class time (83%), providing enough time to eat
(83%), providing a clean space to eat (82%), and providing tasty
food (81%) would make more students eat the school meal (see
Figure 7). These findings suggest there is still room for program
improvement and that this would boost student participation.
Nutritious/healthy
food
All the time/often Sometimes Rarely/never I don't know
71%
19%
4% 5%
90%
80%
70%
60%
50%
40%
30%
20%
10%
0%Prepared
in a safe and clean manner
59%
20%
8%13%
A clean place to eat meal
58%
21%15%
6%
Enough time to
eat meal
53%
24%
18%5%
Fresh food
49%
30%
13%8%
Food at the proper
temperature
42%
27%24%
7%
Enough food
36%31%
6%
Tasty food that you like
28%36%33%
3%
Variety
27%
38%
5%
27%30%
Provides food prepared in a safe and clean manner 84%
Provides food at the right temperature 84%
Allows students to eat during class time 83%
Gives enough time to eat 83%
Provides a clean space to eat 82%
Provides more tasty food 81%
Provides washed fruits and vegetables 80%
Provides more food choices 80%
Provides enough napkins, forks, cups, spoons, etc. 80%
Provides water or drinks with every meal 78%
Data source: The 2010 Feeding Our Future Survey.Note: Percentages may not add up to 100 due to rounding.
Data source: The 2010 Feeding Our Future Survey.Note: Percentages do not add up to 100 because respondents could choose more than one response.
Figure 6: Perceived School Meal Characteristics
Figure 7: Top Ten Student Perspectives on Increasing Participation
More students would eat the school meal if the program...
25
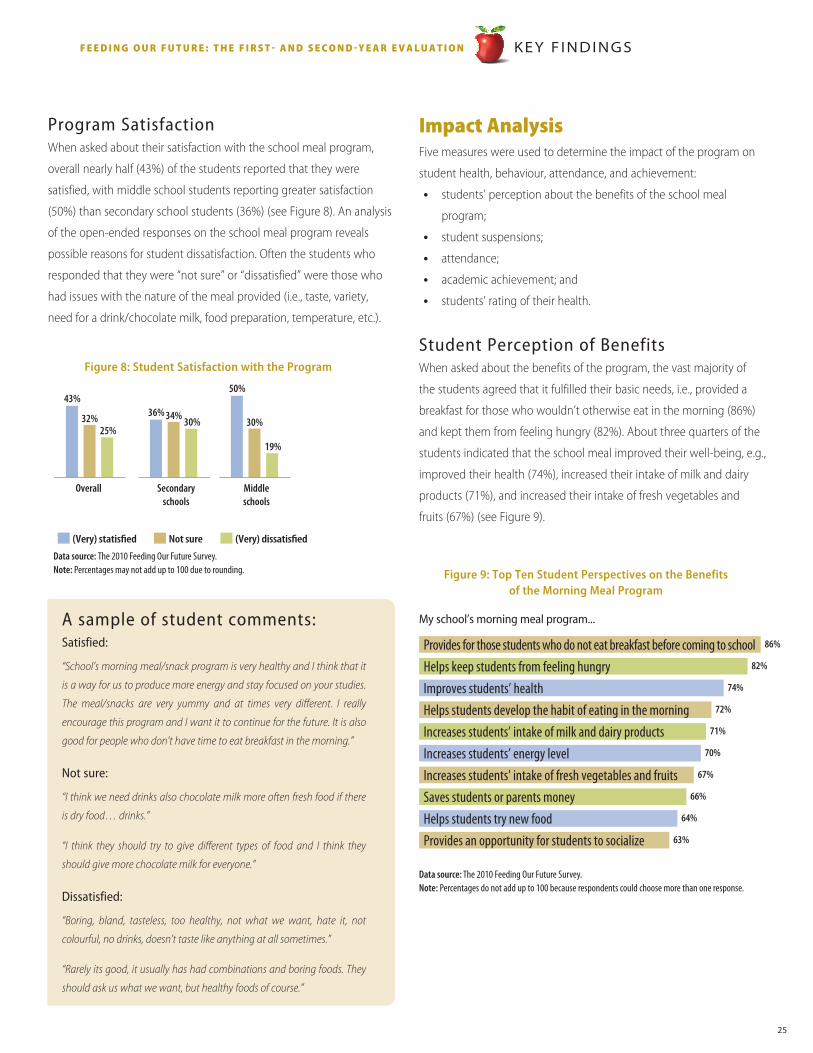
Program Satisfaction When asked about their satisfaction with the school meal program,
overall nearly half (43%) of the students reported that they were
satisfied, with middle school students reporting greater satisfaction
(50%) than secondary school students (36%) (see Figure 8). An analysis
of the open-ended responses on the school meal program reveals
possible reasons for student dissatisfaction. Often the students who
responded that they were “not sure” or “dissatisfied” were those who
had issues with the nature of the meal provided (i.e., taste, variety,
need for a drink/chocolate milk, food preparation, temperature, etc.).
Impact AnalysisFive measures were used to determine the impact of the program on
student health, behaviour, attendance, and achievement:
• students’ perception about the benefits of the school meal
program;
• student suspensions;
• attendance;
• academic achievement; and
• students’ rating of their health.
Student Perception of BenefitsWhen asked about the benefits of the program, the vast majority of
the students agreed that it fulfilled their basic needs, i.e., provided a
breakfast for those who wouldn’t otherwise eat in the morning (86%)
and kept them from feeling hungry (82%). About three quarters of the
students indicated that the school meal improved their well-being, e.g.,
improved their health (74%), increased their intake of milk and dairy
products (71%), and increased their intake of fresh vegetables and
fruits (67%) (see Figure 9).
K E Y F I N D I N G SF E E D I N G O U R F U T U R E : T H E F I R S T - A N D S E c O N D - Y E A R E v A l U A T I O N
Overall Secondaryschools
Middleschools
(Very) statised Not sure (Very) dissatised
43%
32%25%
36% 34% 30%
50%
30%
19%
90%
80%
70%
60%
50%
40%
30%
20%
10%
0%
Data source: The 2010 Feeding Our Future Survey.Note: Percentages may not add up to 100 due to rounding.
Figure 8: Student Satisfaction with the Program
A sample of student comments:Satisfied:
“School’smorningmeal/snackprogramisveryhealthyandIthinkthatit
isawayforustoproducemoreenergyandstayfocusedonyourstudies.
The meal/snacks are very yummy and at times very different. I really
encouragethisprogramandIwantittocontinueforthefuture.Itisalso
goodforpeoplewhodon’thavetimetoeatbreakfastinthemorning.”
Not sure:
“Ithinkweneeddrinksalsochocolatemilkmoreoftenfreshfoodifthere
isdryfood…drinks.”
“I think they should try to give different types of food and I think they
shouldgivemorechocolatemilkforeveryone.”
Dissatisfied:
“Boring, bland, tasteless, too healthy, not what we want, hate it, not
colourful,nodrinks,doesn’ttastelikeanythingatallsometimes.”
“Rarelyitsgood,itusuallyhashadcombinationsandboringfoods.They
shouldaskuswhatwewant,buthealthyfoodsofcourse.”
Provides for those students who do not eat breakfast before coming to school 86%
Helps keep students from feeling hungry 82%
Improves students’ health 74%
Helps students develop the habit of eating in the morning 72%
Increases students’ intake of milk and dairy products 71%
Increases students’ energy level 70%
Increases students' intake of fresh vegetables and fruits 67%
Saves students or parents money 66%
Helps students try new food 64%
Provides an opportunity for students to socialize 63%
Data source: The 2010 Feeding Our Future Survey.Note: Percentages do not add up to 100 because respondents could choose more than one response.
Figure 9: Top Ten Student Perspectives on the Benefits of the Morning Meal Program
My school’s morning meal program...
26
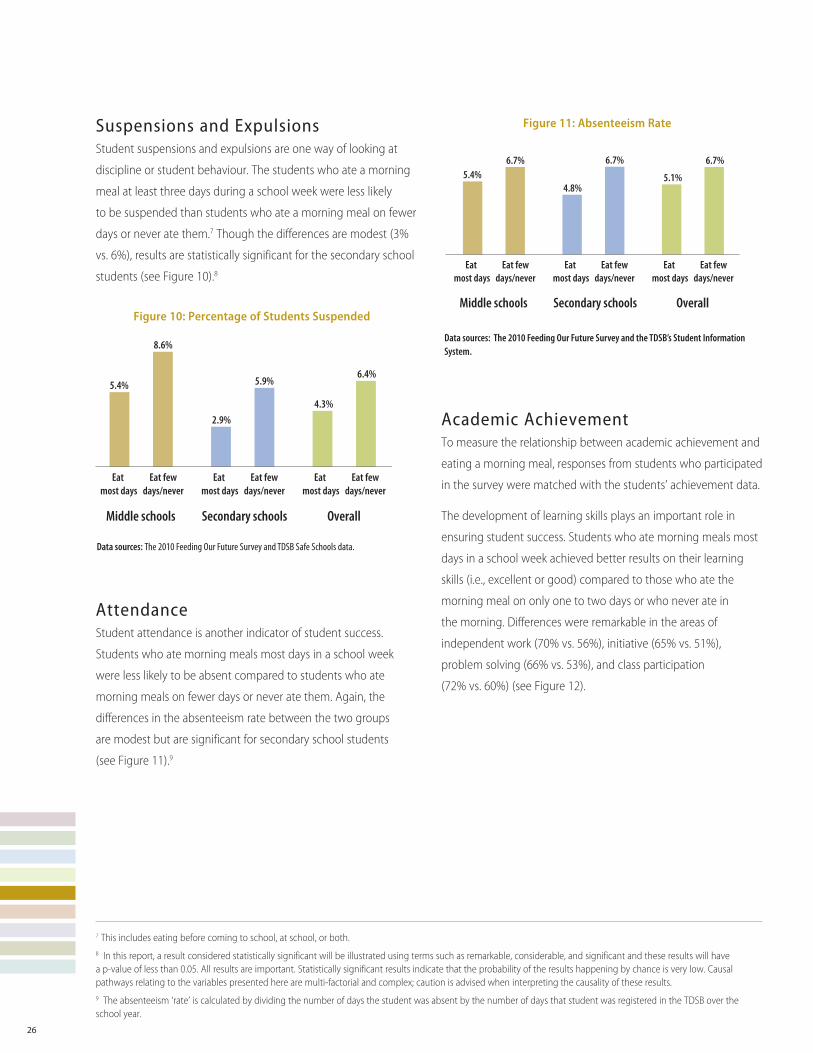
Suspensions and ExpulsionsStudent suspensions and expulsions are one way of looking at
discipline or student behaviour. The students who ate a morning
meal at least three days during a school week were less likely
to be suspended than students who ate a morning meal on fewer
days or never ate them.7 Though the differences are modest (3%
vs. 6%), results are statistically significant for the secondary school
students (see Figure 10).8
AttendanceStudent attendance is another indicator of student success.
Students who ate morning meals most days in a school week
were less likely to be absent compared to students who ate
morning meals on fewer days or never ate them. Again, the
differences in the absenteeism rate between the two groups
are modest but are significant for secondary school students
(see Figure 11).9
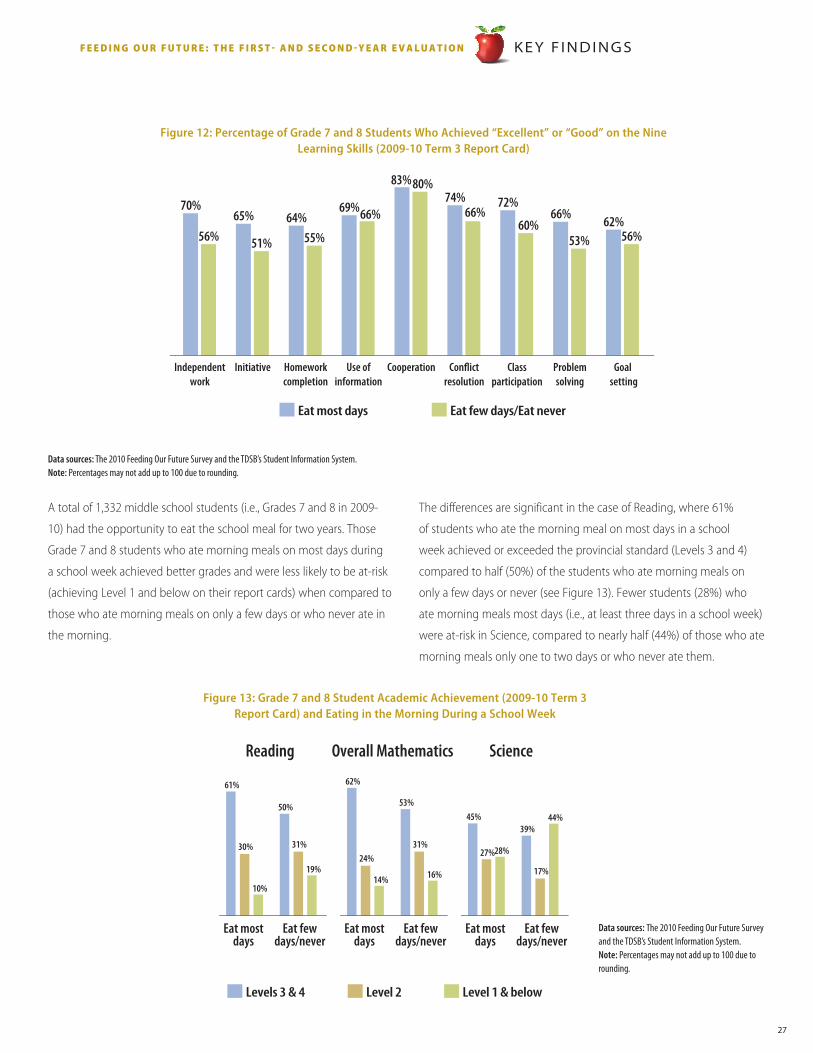
Academic AchievementTo measure the relationship between academic achievement and
eating a morning meal, responses from students who participated
in the survey were matched with the students’ achievement data.
The development of learning skills plays an important role in
ensuring student success. Students who ate morning meals most
days in a school week achieved better results on their learning
skills (i.e., excellent or good) compared to those who ate the
morning meal on only one to two days or who never ate in
the morning. Differences were remarkable in the areas of
independent work (70% vs. 56%), initiative (65% vs. 51%),
problem solving (66% vs. 53%), and class participation
(72% vs. 60%) (see Figure 12).
7 This includes eating before coming to school, at school, or both.8 In this report, a result considered statistically significant will be illustrated using terms such as remarkable, considerable, and significant and these results will have a p-value of less than 0.05. All results are important. Statistically significant results indicate that the probability of the results happening by chance is very low. Causal pathways relating to the variables presented here are multi-factorial and complex; caution is advised when interpreting the causality of these results.9 The absenteeism ‘rate’ is calculated by dividing the number of days the student was absent by the number of days that student was registered in the TDSB over the school year.
Eat most days
Eat fewdays/never
Middle schools Secondary schools Overall
Eat most days
Eat fewdays/never
Eat most days
Eat fewdays/never
5.4%
2.9%4.3%
5.9%6.4%
8.6%
Eat most days
Eat fewdays/never
Middle schools Secondary schools Overall
Eat most days
Eat fewdays/never
Eat most days
Eat fewdays/never
5.4%4.8%
5.1%
6.7% 6.7%6.7%
Data sources: The 2010 Feeding Our Future Survey and TDSB Safe Schools data.
Data sources: The 2010 Feeding Our Future Survey and the TDSB’s Student Information System.
Figure 10: Percentage of Students Suspended
Figure 11: Absenteeism Rate
27
A total of 1,332 middle school students (i.e., Grades 7 and 8 in 2009-
10) had the opportunity to eat the school meal for two years. Those
Grade 7 and 8 students who ate morning meals on most days during
a school week achieved better grades and were less likely to be at-risk
(achieving Level 1 and below on their report cards) when compared to
those who ate morning meals on only a few days or who never ate in
the morning.
The differences are significant in the case of Reading, where 61%
of students who ate the morning meal on most days in a school
week achieved or exceeded the provincial standard (Levels 3 and 4)
compared to half (50%) of the students who ate morning meals on
only a few days or never (see Figure 13). Fewer students (28%) who
ate morning meals most days (i.e., at least three days in a school week)
were at-risk in Science, compared to nearly half (44%) of those who ate
morning meals only one to two days or who never ate them.
K E Y F I N D I N G SF E E D I N G O U R F U T U R E : T H E F I R S T - A N D S E c O N D - Y E A R E v A l U A T I O N
Independentwork
70%
56%
Initiative
65%
51%
Homeworkcompletion
64%55%
Use ofinformation
69%66%
Cooperation
83%80%
Con�ictresolution
74%66%
Classparticipation
72%
60%
Problemsolving
66%
53%
Goal setting
62%56%
Eat most days Eat few days/Eat never
Data sources: The 2010 Feeding Our Future Survey and the TDSB’s Student Information System.Note: Percentages may not add up to 100 due to rounding.
Figure 12: Percentage of Grade 7 and 8 Students Who Achieved “Excellent” or “Good” on the NineLearning Skills (2009-10 Term 3 Report Card)
61%
30%
10%
50%
31%
19%
Eat mostdays
Levels 3 & 4 Level 2 Level 1 & below
90%
80%
70%
60%
50%
40%
30%
20%
10%
0%Eat few
days/never
Reading
62%
24%
14%
53%
31%
16%
Eat mostdays
Eat fewdays/never
Overall Mathematics
45%
27%28%
39%
17%
44%
Eat mostdays
Eat fewdays/never
Science
Data sources: The 2010 Feeding Our Future Survey and the TDSB’s Student Information System.Note: Percentages may not add up to 100 due to rounding.
Figure 13: Grade 7 and 8 Student Academic Achievement (2009-10 Term 3 Report Card) and Eating in the Morning During a School Week
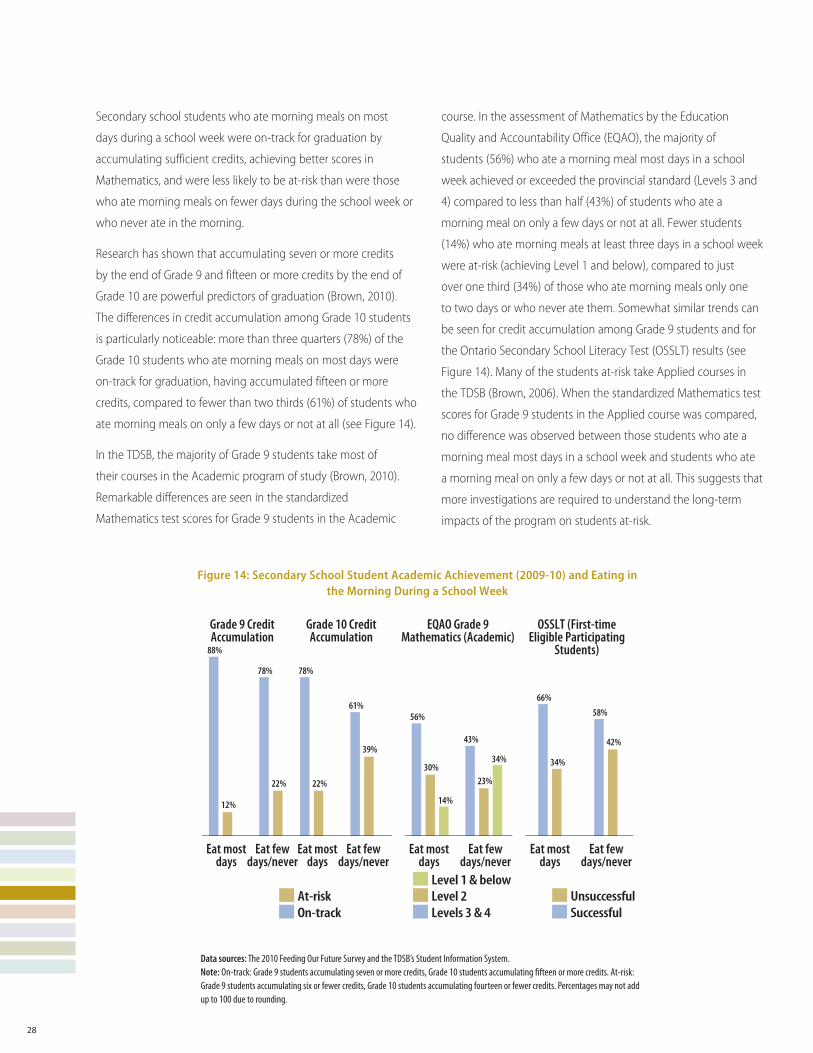
28
Secondary school students who ate morning meals on most
days during a school week were on-track for graduation by
accumulating sufficient credits, achieving better scores in
Mathematics, and were less likely to be at-risk than were those
who ate morning meals on fewer days during the school week or
who never ate in the morning.
Research has shown that accumulating seven or more credits
by the end of Grade 9 and fifteen or more credits by the end of
Grade 10 are powerful predictors of graduation (Brown, 2010).
The differences in credit accumulation among Grade 10 students
is particularly noticeable: more than three quarters (78%) of the
Grade 10 students who ate morning meals on most days were
on-track for graduation, having accumulated fifteen or more
credits, compared to fewer than two thirds (61%) of students who
ate morning meals on only a few days or not at all (see Figure 14).
In the TDSB, the majority of Grade 9 students take most of
their courses in the Academic program of study (Brown, 2010).
Remarkable differences are seen in the standardized
Mathematics test scores for Grade 9 students in the Academic
course. In the assessment of Mathematics by the Education
Quality and Accountability Office (EQAO), the majority of
students (56%) who ate a morning meal most days in a school
week achieved or exceeded the provincial standard (Levels 3 and
4) compared to less than half (43%) of students who ate a
morning meal on only a few days or not at all. Fewer students
(14%) who ate morning meals at least three days in a school week
were at-risk (achieving Level 1 and below), compared to just
over one third (34%) of those who ate morning meals only one
to two days or who never ate them. Somewhat similar trends can
be seen for credit accumulation among Grade 9 students and for
the Ontario Secondary School Literacy Test (OSSLT) results (see
Figure 14). Many of the students at-risk take Applied courses in
the TDSB (Brown, 2006). When the standardized Mathematics test
scores for Grade 9 students in the Applied course was compared,
no difference was observed between those students who ate a
morning meal most days in a school week and students who ate
a morning meal on only a few days or not at all. This suggests that
more investigations are required to understand the long-term
impacts of the program on students at-risk.
Figure 14: Secondary School Student Academic Achievement (2009-10) and Eating in the Morning During a School Week
Data sources: The 2010 Feeding Our Future Survey and the TDSB’s Student Information System.Note: On-track: Grade 9 students accumulating seven or more credits, Grade 10 students accumulating fifteen or more credits. At-risk: Grade 9 students accumulating six or fewer credits, Grade 10 students accumulating fourteen or fewer credits. Percentages may not add up to 100 due to rounding.
88%
12%
78%
22%
78%
22%
Eat mostdays
On-trackAt-risk
Levels 3 & 4Level 2Level 1 & below
90%
80%
70%
60%
50%
40%
30%
20%
10%
0%Eat few
days/never
61%
39%
Eat mostdays
Eat fewdays/never
Grade 9 CreditAccumulation
Grade 10 CreditAccumulation
EQAO Grade 9Mathematics (Academic)
OSSLT (First-timeEligible Participating
Students)
56%
30%
14%
43%
23%
34%
Eat mostdays
Eat fewdays/never
66%
34%
58%
42%
Eat mostdays
Eat fewdays/never
SuccessfulUnsuccessful
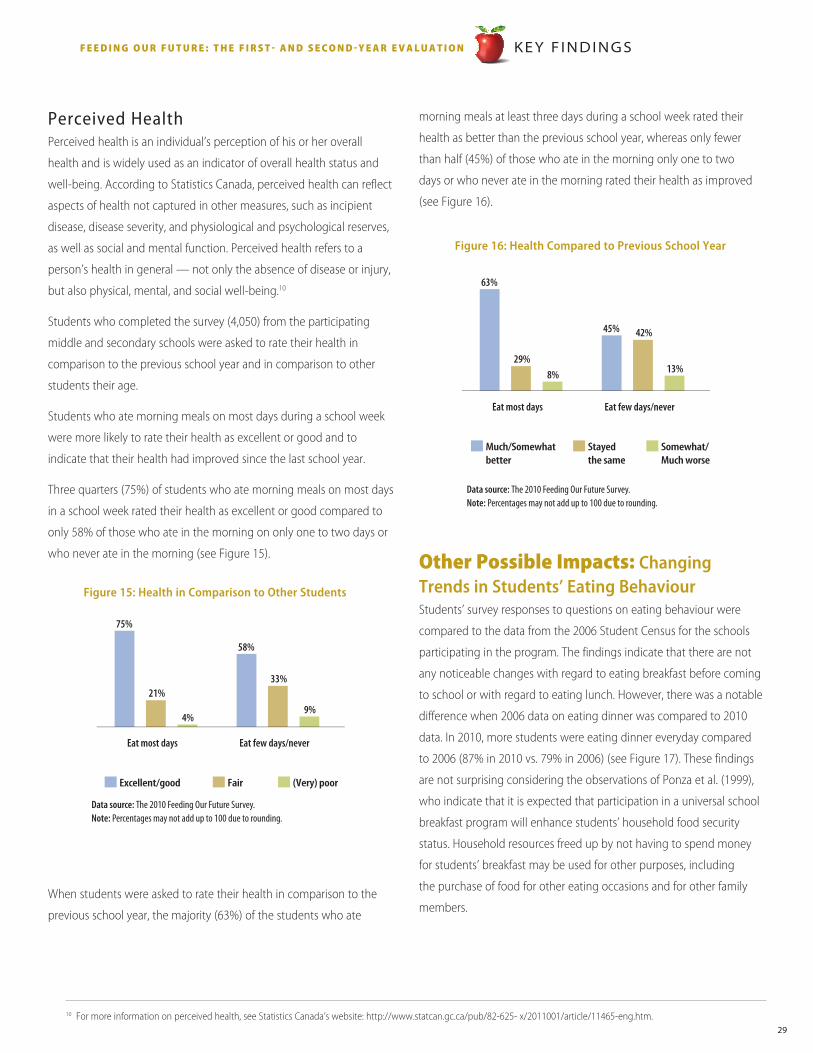
29
Perceived HealthPerceived health is an individual’s perception of his or her overall
health and is widely used as an indicator of overall health status and
well-being. According to Statistics Canada, perceived health can reflect
aspects of health not captured in other measures, such as incipient
disease, disease severity, and physiological and psychological reserves,
as well as social and mental function. Perceived health refers to a
person’s health in general — not only the absence of disease or injury,
but also physical, mental, and social well-being.10
Students who completed the survey (4,050) from the participating
middle and secondary schools were asked to rate their health in
comparison to the previous school year and in comparison to other
students their age.
Students who ate morning meals on most days during a school week
were more likely to rate their health as excellent or good and to
indicate that their health had improved since the last school year.
Three quarters (75%) of students who ate morning meals on most days
in a school week rated their health as excellent or good compared to
only 58% of those who ate in the morning on only one to two days or
who never ate in the morning (see Figure 15).
When students were asked to rate their health in comparison to the
previous school year, the majority (63%) of the students who ate
morning meals at least three days during a school week rated their
health as better than the previous school year, whereas only fewer
than half (45%) of those who ate in the morning only one to two
days or who never ate in the morning rated their health as improved
(see Figure 16).
Other Possible Impacts: Changing Trends in Students’ Eating BehaviourStudents’ survey responses to questions on eating behaviour were
compared to the data from the 2006 Student Census for the schools
participating in the program. The findings indicate that there are not
any noticeable changes with regard to eating breakfast before coming
to school or with regard to eating lunch. However, there was a notable
difference when 2006 data on eating dinner was compared to 2010
data. In 2010, more students were eating dinner everyday compared
to 2006 (87% in 2010 vs. 79% in 2006) (see Figure 17). These findings
are not surprising considering the observations of Ponza et al. (1999),
who indicate that it is expected that participation in a universal school
breakfast program will enhance students’ household food security
status. Household resources freed up by not having to spend money
for students’ breakfast may be used for other purposes, including
the purchase of food for other eating occasions and for other family
members.
K E Y F I N D I N G SF E E D I N G O U R F U T U R E : T H E F I R S T - A N D S E c O N D - Y E A R E v A l U A T I O N
10 For more information on perceived health, see Statistics Canada’s website: http://www.statcan.gc.ca/pub/82-625- x/2011001/article/11465-eng.htm.
Eat most days
75%
21%
4%
Eat few days/never
58%
33%
9%
Excellent/good Fair (Very) poor
Eat most days
63%
29%8%
Eat few days/never
45% 42%
13%
Much/Somewhat better
Stayed the same
Somewhat/Much worse
Data source: The 2010 Feeding Our Future Survey.Note: Percentages may not add up to 100 due to rounding.
Data source: The 2010 Feeding Our Future Survey.Note: Percentages may not add up to 100 due to rounding.
Figure 15: Health in Comparison to Other Students
Figure 16: Health Compared to Previous School Year
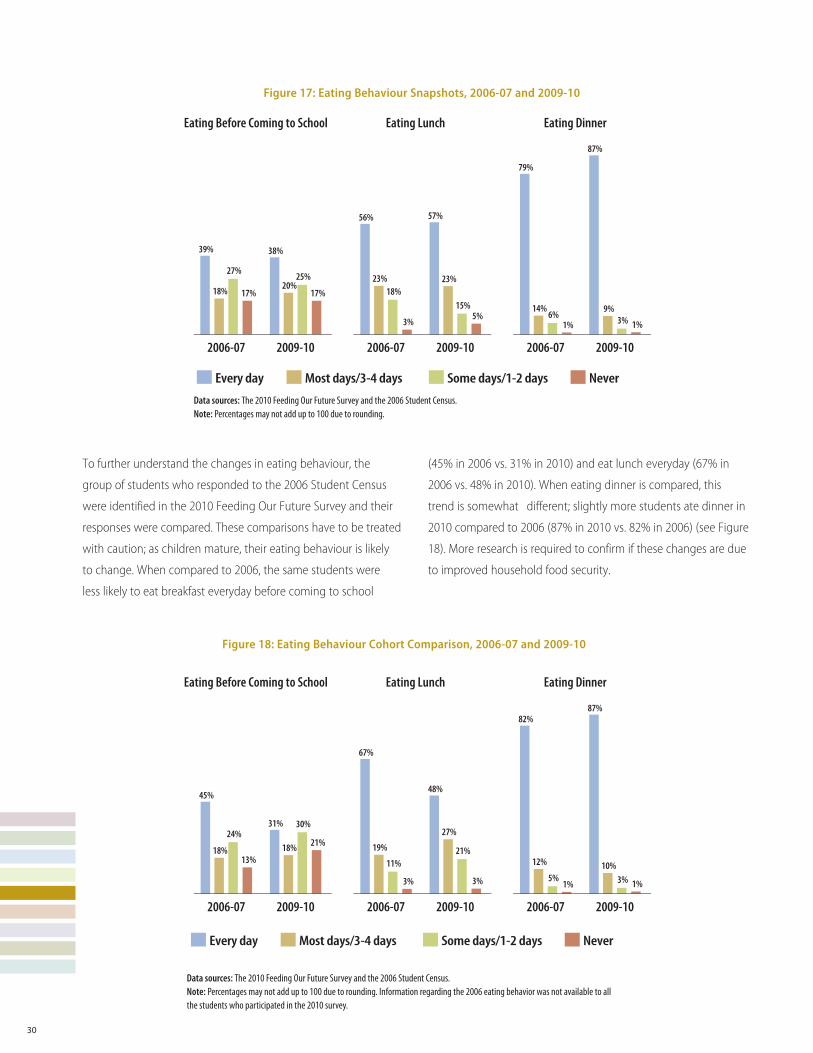
30
To further understand the changes in eating behaviour, the
group of students who responded to the 2006 Student Census
were identified in the 2010 Feeding Our Future Survey and their
responses were compared. These comparisons have to be treated
with caution; as children mature, their eating behaviour is likely
to change. When compared to 2006, the same students were
less likely to eat breakfast everyday before coming to school
(45% in 2006 vs. 31% in 2010) and eat lunch everyday (67% in
2006 vs. 48% in 2010). When eating dinner is compared, this
trend is somewhat different; slightly more students ate dinner in
2010 compared to 2006 (87% in 2010 vs. 82% in 2006) (see Figure
18). More research is required to confirm if these changes are due
to improved household food security.
18%
27%
17%
2006-07
90%
80%
70%
60%
50%
40%
30%
20%
10%
0%
Eating Before Coming to School
38%39%
20%25%
17%
2009-10
56%
23%18%
3%
2006-07
Eating Lunch
57%
23%
15%5%
2009-10
79%
14%6%
1%
2006-07
Eating Dinner
87%
9%3% 1%
2009-10
Every day Most days/3-4 days Some days/1-2 days Never
Every day Most days/3-4 days Some days/1-2 days Never
45%
18%
24%
13%
2006-07
90%
80%
70%
60%
50%
40%
30%
20%
10%
0%
Eating Before Coming to School
31%
18%
30%
21%
2009-10
67%
19%
11%
3%
2006-07
Eating Lunch
48%
27%
21%
3%
2009-10
82%
12%
5%1%
2006-07
Eating Dinner
87%
10%3% 1%
2009-10
Data sources: The 2010 Feeding Our Future Survey and the 2006 Student Census.Note: Percentages may not add up to 100 due to rounding.
Data sources: The 2010 Feeding Our Future Survey and the 2006 Student Census.Note: Percentages may not add up to 100 due to rounding. Information regarding the 2006 eating behavior was not available to allthe students who participated in the 2010 survey.
Figure 17: Eating Behaviour Snapshots, 2006-07 and 2009-10
Figure 18: Eating Behaviour Cohort Comparison, 2006-07 and 2009-10
31
In summary, the Feeding Our Future program can be an effective tool to enhance student learning and health:
• A free morning meal in classrooms, served around 10:00 a.m., provided all
students with an opportunity to benefit from a nutritious meal.
• Students, irrespective of gender, socio-economic, or cultural backgrounds,
tended to benefit from the program.
• School meals provided in the school foyer tended to restrict student participation
in the meal program.
Conclusions and Recommendations
conclusions
32
• Student perceptions about the nature of the food and the
ways it was prepared affected participation.
• The program did not affect school operations in general;
however, there was an increase in workload reported by
school administrators and school staff directly associated
with the program.
• Most of the teaching staff interviewed perceived an
improvement in student behaviour or attitude and student
ability to stay on task.
• School administrators indicated that after the
implementation of the program, overall student attitude and
behaviour improved; there was a drop in the rate of tardiness
and a reduction in the incidence of disciplinary problems.
• Students who ate in the morning were more likely to
succeed academically, were more likely to come to school
regularly, and were less likely to be suspended.
• Students who ate in the morning were more likely to be
healthy.
• The program lacks sufficient funding to make further
improvements.
Recommendations
• Feeding Our Future should continue to provide the school
meal in the classroom and allow students to eat around
10:00 a.m.
• Providing meals in the school foyer is an impediment to
student participation; either this method of delivery should
be discontinued or students should be allowed to collect the
meal until 11:00 a.m. and eat it in the classroom.
• The school meal should be promoted as cleanly prepared
fresh food.
• The possibility of rotating the menu more frequently and
making changes regularly, based on menu surveys, should be
explored.
• Steps should be taken to involve more students, parents, and
community members as volunteers.
• Overall, the improvements made so far and exploring ways
to address all the issues outlined in this report as well as the
best practices outlined in the TPH Student Nutrition Program
Funding Criteria should continue.
33
Program impacts will be further investigated using cohort analyses and the 2011 Student Census to see how the program affects changes in eating behaviour, improvements in achievement, reduction of suspensions and absenteeism, acceptance to post-secondary institutions, and overall well-being, especially for the at-risk students.
Data from the 2011 Student Census will be used to track the students participating
in school meal programs and to study the educational outcomes for meal-skipping
students in a larger context. Comparisons of different school meal delivery models will
be made to further understand the outcomes.
Next Steps in the Evaluation
34
ReferencesBrown, J. L., Beardslee, W. H., & Prothrow-Stith, D. (2008).
Impactofschoolbreakfastonchildren’shealthandlearning:Ananalysisofthescientificresearch.
Retrieved from http://www.breakfastfirst.org/pdfs/HarvardAssessmentSchoolBreakfast[Sodexo2008].pdf
Brown, R. S. (1993). AnevaluationofthepilotjointschoolfoodprogramsintheTorontoBoardofEducation (Research Report No. 203).
Toronto, Ontario, Canada: Toronto Board of Education.
Brown, R. S. (2006). TheTDSBgrade9cohortstudy:Afive-yearanalysis,2000-2005 (Research Report 05/06-05). Toronto, Ontario, Canada:
Toronto District School Board.
Brown, R. S. (2010). Thegrade9cohortoffall2004(Research Report 09/10-15). Toronto, Ontario, Canada: Toronto District School Board.
Glazier, R., & Booth, G. (2007). Neighbourhoodenvironmentsandresourcesforhealthyliving:AfocusondiabetesinToronto.
Toronto, Ontario, Canada: Institute for Clinical Evaluative Sciences.
Retrieved from http://www.ices.on.ca/webpage.cfm?site_id=1&org_id=67&morg_id=0&gsec_id=0&item_id= 4406&type=atlas
Levin, M. (2011). Breakfastforlearning:Scientificresearchonthelinkbetweenchildren’snutritionandacademicperformance.
Retrieved from http://frac.org/wpcontent/ uploads/2009/09/breakfastforlearning.pdf
Murphy, J. M. (2007). Breakfast and learning: An updated review. JournalofCurrentNutritionandFoodScience,3(1), 3-36.
Nutrition Liaison Team. (n.d.). Studentnutritionhandbook. Toronto, Ontario, Canada: Toronto District School Board.
Retrieved from http://www.tdsb.on.ca/wwwdocuments/parents/nutrition_programs/docs/handbook_webversion.pdf
Nutrition Task Force. (2009). NutritiontaskforcereportApril2009. Toronto, Ontario, Canada: Toronto District School Board.
Retrieved from http://www.tdsb.on.ca/wwwdocuments/Trustees/Ward_99/docs/nutrition%20task%20force%20report_09.pdf
O’Reilly, J., & Yau, M. (2009). 2008 parent census, kindergarten-grade 6: System overview and detailed findings.
(Research Report 08/09-16). Toronto, Ontario, Canada: Toronto District School Board.
Ponza, M., Briefel, R., Corson, W., Devaney, B., Glaserman, S., Gleason, P., … Ohls, J. (1999).
Universal-freeschoolbreakfastprogramevaluationdesignproject;FinalEvaluationDesign (MPR Reference No.: 8640-600).
Retrieved from http://www.fns.usda.gov/oane/MENU/DemoProjects/sbppilot/SBPdesign.pdf
Prescod, C. (2008). Diversity and inclusion community of practice. Report on the community of practice project development;
Submitted to Circle of Care Central LHIN Diversity and Inclusion Advisory group.
Williams, C., & Clarke, J., working with James C., Benjamin, A., & Moss, K. (2003). TorontoCommunityProfile.
Retrieved from http://rvh.socialwork.dal.ca/04%20Community%20Profiles/Toronto/profile2003to.html#jane
Yau, M., & O’Reilly, J. (2007). 2006studentcensus,grades7-12:Systemoverview(Research Report 07/08-01). Toronto, Ontario, Canada:
Toronto District School Board.
35
References
Appendix 1: Student Nutrition Program Grant Application Guide 2011/2012
Appendix 2: School Operations: First-Year Findings
Trends in Achievement, Behaviour and Absenteeism
Appendices
36
Student Nutrition Program – Grant Application Guide 2011/2012
Please�read�the�following�information�before�you�complete�your�application.
If�you�are�completing�your�application�by�computer,�Macros�must�be�enabled.�Please�refer�to�page�41�for�further�information�on�how�
to�complete�and�/�or�submit�your�application�electronically.
The�Application�is�divided�into�four�sections:
Section I: Program Description
Section II: Financial Information
Section III: Nutrition
Section IV: Authorization and Execution
Attachments:
1. Student Nutrition Program Funding Criteria
2. Guide to the Nutrition Standard, Toronto Student Nutrition Programs for Children and Youth
3. Food Safety Requirements for Student Nutrition Programs
4. Sample Menus: Breakfast and Morning Meal menus; Dinner and Lunch menus; Snack menus
SEcTION I – Program Description (Refer�to�Application�Form,�pages�1�and�2)
Select definitions • Location�Type�–�� Check mark the box that corresponds to your school board or indicate if your program is in a community site.
• Name�of�School/Site�–�Provide the name of the school or community site that your program is affiliated with.
• Program�Name�–�Provide the full name of your program (e.g., Acme Snack Program).
• School/Site�Address�– Provide the complete address where your program operates.
• ��Mailing�Address�– If different from the School / Site Address (above), please provide the complete address where cheques and program
information should be sent.
• ���Name�of�Sponsoring�Agency�– Cheques are not sent to individuals. Cheques for programs in schools will be payable to the school.
If your program is in a community site, provide the name and address of the agency that will administer your funds.
Application Deadlines:For September 2011 funding: Friday February 25, 2011 by 4:30 p.m. For late applications and January 2012 funding: Friday,
October 28, 2011 by 4:30 p.m.
Appendix 1
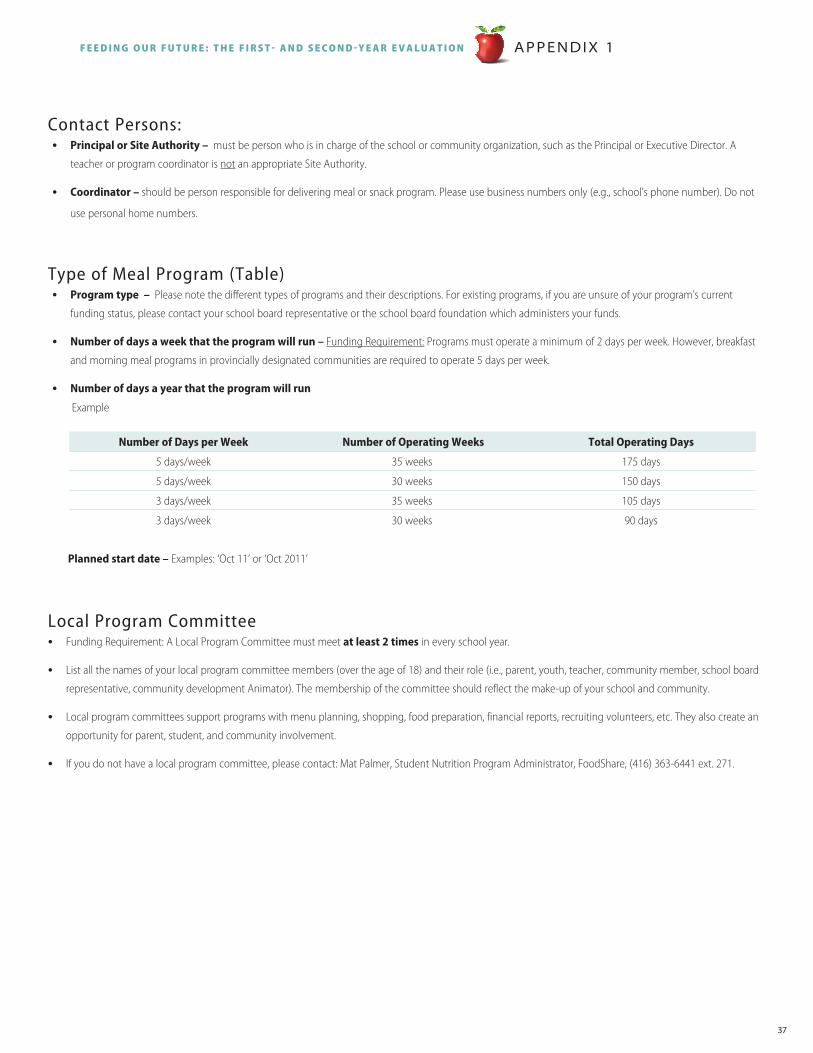
37
Contact Persons: • Principal�or�Site�Authority�–��must be person who is in charge of the school or community organization, such as the Principal or Executive Director. A
teacher or program coordinator is�not an appropriate Site Authority.
• Coordinator�–�should be person responsible for delivering meal or snack program. Please use business numbers only (e.g., school’s phone number). Do not
use personal home numbers.
Type of Meal Program (Table) • Program�type��–��Please note the different types of programs and their descriptions. For existing programs, if you are unsure of your program’s current
funding status, please contact your school board representative or the school board foundation which administers your funds.
• Number�of�days�a�week�that�the�program�will�run�–�Funding Requirement: Programs must operate a minimum of 2 days per week. However, breakfast
and morning meal programs in provincially designated communities are required to operate 5 days per week.
• Number�of�days�a�year�that�the�program�will�run
Example
Number�of�Days�per�Week �Number�of�Operating�Weeks Total�Operating�Days
5 days/week 35 weeks 175 days
5 days/week 30 weeks 150 days
3 days/week 35 weeks 105 days
3 days/week 30 weeks 90 days�
�Planned�start�date�– Examples: ‘Oct 11’ or ‘Oct 2011’�
Local Program Committee• Funding Requirement: A Local Program Committee must meet at�least�2�times in every school year.
• List all the names of your local program committee members (over the age of 18) and their role (i.e., parent, youth, teacher, community member, school board
representative, community development Animator). The membership of the committee should reflect the make-up of your school and community.
• Local program committees support programs with menu planning, shopping, food preparation, financial reports, recruiting volunteers, etc. They also create an
opportunity for parent, student, and community involvement.
• If you do not have a local program committee, please contact: Mat Palmer, Student Nutrition Program Administrator, FoodShare, (416) 363-6441 ext. 271.
A P P E N D I X 1F E E D I N G O U R F U T U R E : T H E F I R S T - A N D S E c O N D - Y E A R E v A l U A T I O N
Appendix 1
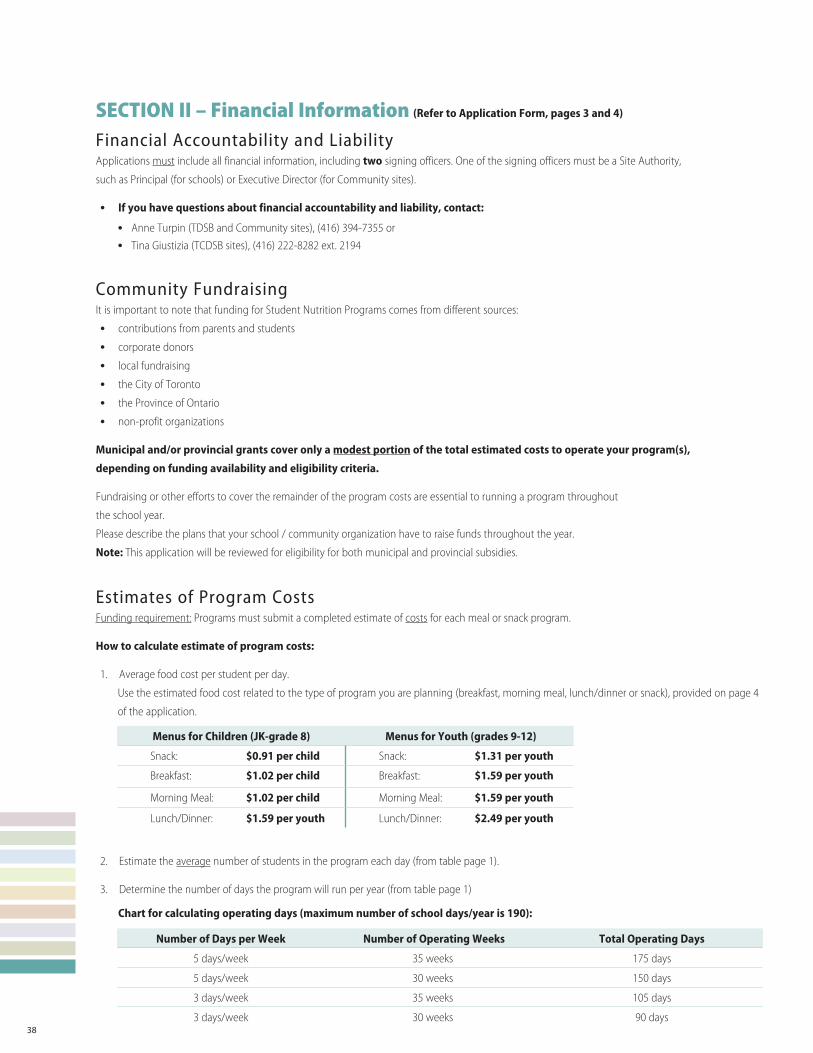
38
SEcTION II – Financial Information (Refer�to�Application�Form,�pages�3�and�4)
Financial Accountability and LiabilityApplications must include all financial information, including two signing officers. One of the signing officers must be a Site Authority,
such as Principal (for schools) or Executive Director (for Community sites).
• If�you�have�questions�about�financial�accountability�and�liability,�contact:�
• Anne Turpin (TDSB and Community sites), (416) 394-7355 or
• Tina Giustizia (TCDSB sites), (416) 222-8282 ext. 2194
Community FundraisingIt is important to note that funding for Student Nutrition Programs comes from different sources:
• contributions from parents and students
• corporate donors
• local fundraising
• the City of Toronto
• the Province of Ontario
• non-profit organizations
Municipal�and/or�provincial�grants�cover�only�a�modest�portion�of�the�total�estimated�costs�to�operate�your�program(s),�� �
depending�on�funding�availability�and�eligibility�criteria.�
Fundraising or other efforts to cover the remainder of the program costs are essential to running a program throughout
the school year.
Please describe the plans that your school / community organization have to raise funds throughout the year.
Note:�This application will be reviewed for eligibility for both municipal and provincial subsidies.
Estimates of Program CostsFunding requirement: Programs must submit a completed estimate of costs for each meal or snack program.
How�to�calculate�estimate�of�program�costs:
1. Average food cost per student per day.
Use the estimated food cost related to the type of program you are planning (breakfast, morning meal, lunch/dinner or snack), provided on page 4
of the application.
Menus�for�Children�(JK-grade�8) �Menus�for�Youth�(grades�9-12)
Snack: $0.91�per�child Snack: $1.31�per�youth
Breakfast: $1.02�per�child Breakfast: $1.59�per�youth
Morning Meal: $1.02�per�child Morning Meal: $1.59�per�youth
Lunch/Dinner: $1.59�per�youth Lunch/Dinner: $2.49�per�youth �
2. Estimate the average number of students in the program each day (from table page 1).
3. Determine the number of days the program will run per year (from table page 1)
���������Chart�for�calculating�operating�days�(maximum�number�of�school�days/year�is�190):
Number�of�Days�per�Week �Number�of�Operating�Weeks Total�Operating�Days
5 days/week 35 weeks 175 days
5 days/week 30 weeks 150 days
3 days/week 35 weeks 105 days
3 days/week 30 weeks 90 days �
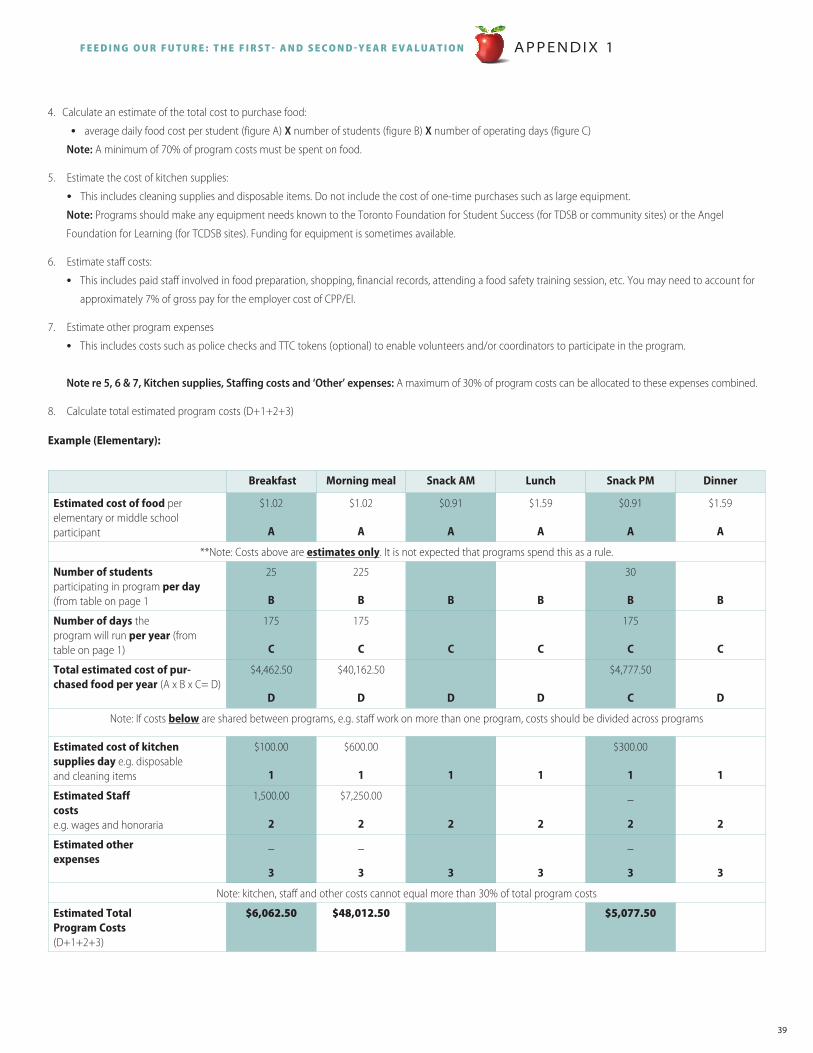
39
4. Calculate an estimate of the total cost to purchase food: • average daily food cost per student (figure A) X number of students (figure B) X number of operating days (figure C)
Note: A minimum of 70% of program costs must be spent on food.
5. Estimate the cost of kitchen supplies: • This includes cleaning supplies and disposable items. Do not include the cost of one-time purchases such as large equipment.
Note: Programs should make any equipment needs known to the Toronto Foundation for Student Success (for TDSB or community sites) or the Angel
Foundation for Learning (for TCDSB sites). Funding for equipment is sometimes available.
6. Estimate staff costs:
• This includes paid staff involved in food preparation, shopping, financial records, attending a food safety training session, etc. You may need to account for
approximately 7% of gross pay for the employer cost of CPP/EI.
7. Estimate other program expenses
• This includes costs such as police checks and TTC tokens (optional) to enable volunteers and/or coordinators to participate in the program.
Note re 5, 6 & 7, Kitchen supplies, Staffing costs and ‘Other’ expenses: A maximum of 30% of program costs can be allocated to these expenses combined.
8. Calculate total estimated program costs (D+1+2+3)
Example�(Elementary):
A P P E N D I X 1F E E D I N G O U R F U T U R E : T H E F I R S T - A N D S E c O N D - Y E A R E v A l U A T I O N
�Breakfast Morning�meal Snack�AM Lunch Snack�PM Dinner
Estimated�cost�of�food per elementary or middle school participant
$1.02
A
$1.02
A
$0.91
A
$1.59
A
$0.91
A
$1.59
A
**Note: Costs above are estimates�only. It is not expected that programs spend this as a rule.
Number�of�students participating in program�per�day (from table on page 1
25
B
225
B B B
30
B B
Number�of�days the program will run�per�year (from table on page 1)
175
C
175
C C C
175
C C
Total�estimated�cost�of�pur-chased�food�per�year (A x B x C= D)
$4,462.50
D
$40,162.50
D D D
$4,777.50
C D
Note: If costs below are shared between programs, e.g. staff work on more than one program, costs should be divided across programs
Estimated�cost�of�kitchensupplies�day e.g. disposableand cleaning items
$100.00
1
$600.00
1 1 1
$300.00
1 1
Estimated�Staffcosts e.g. wages and honoraria
1,500.00
2
$7,250.00
2 2 2
_
2 2
Estimated�otherexpenses
_
3
_
3 3 3
_
3 3
Note: kitchen, staff and other costs cannot equal more than 30% of total program costs
Estimated�TotalProgram�Costs (D+1+2+3)
$6,062.50 $48,012.50 $5,077.50
40
SEcTION III – Nutrition (Refer�to�Application�Form,�page�4)
Nutrition Education - It is a funding requirement that your Student Nutrition Program include plans for nutrition
education for your students.
If your school or site has not provided Nutrition Education activities before, please call Toronto Health Connection, 416-338-7600.
Sample Menu Funding Requirement: Programs must submit a separate one-week sample menu meeting the nutrition standards for each meal or snack program.
• Complete the Program�Menu�Form (page7). Blank copies of the menu page are also available at
www.toronto.ca/health/student_nutrition_program.
• Follow the Guide to the Nutrition Standard, Toronto Student Nutrition Programs for Children and Youth (attached) to plan your menu.
• You may also use the Sample Menus for Toronto Student Nutrition Programs (attached) for ideas.
Part Iv – Authorization and Execution Funding Requirement: The Site Authority is required to review and authorize the application with a signature. Applications received by mail and e-mail
must have the original signature of the Site Authority. Applications received by e-mail require the electronic signature of the Site Authority; applications
received must be in PDF format. Incomplete applications and those without authorizing signatures will be returned. Faxes and photocopies will not be
accepted.
Review list of Commitments• Before signing, the Site Authority should review the list of commitments that are a component of applying for funding. Check mark each
commitment to indicate that the site authority has read, reviewed and agreed to each.
Background on some of the commitments: Accessibility What�it�means�to�be�an�accessible�program:
• Student Nutrition Programs must be offered to all students regardless of their ability to pay.
• Programs must be non-stigmatizing or efforts to reduce stigma must be made.
• All students are made to feel welcome.
• The program location must be safe, clean and comfortable.
• Measures are taken to ensure that all families and students are aware of the program.
If�you�are�not�sure�that�your�program�meets�all�the�above�criteria,�contact:
• Mat Palmer, Student Nutrition Program Administrator, FoodShare, (416) 363-6441 ext. 271
• Mena Paternostro (TDSB Coordinator, Student Nutrition Programs), (416) 394-7435, or
• David Letra (TCDSB Community Relations Officer), (416) 222-8282 ext. 2687 Food�Safety Funding�requirement:
• As per Public Health’s requirements, each program will receive a visit from a Public Health Inspector to inspect kitchen facilities and/or food
preparation areas.
• At least one person trained in food safety within the past two years must be on site every day the program operates.
• It is recommended that every staff member or volunteer involved in food purchasing, preparation or serving receive food safety training which is
renewed at least every 2 years.
If you are not sure how to meet the above criteria, please call Toronto Health Connection, (416) 338-7600.
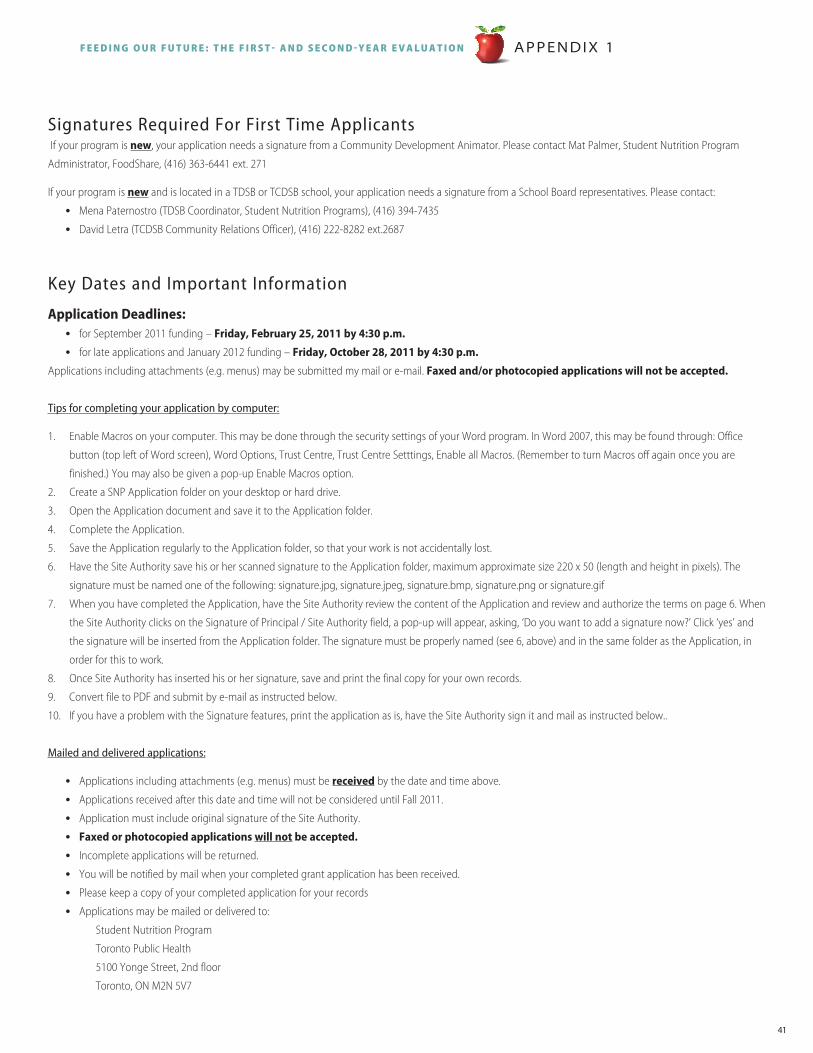
41
Signatures Required For First Time Applicants If your program is new, your application needs a signature from a Community Development Animator. Please contact Mat Palmer, Student Nutrition Program
Administrator, FoodShare, (416) 363-6441 ext. 271
If your program is new�and is located in a TDSB or TCDSB school, your application needs a signature from a School Board representatives. Please contact:
• Mena Paternostro (TDSB Coordinator, Student Nutrition Programs), (416) 394-7435
• David Letra (TCDSB Community Relations Officer), (416) 222-8282 ext.2687
Key Dates and Important Information
Application�Deadlines:�� • for September 2011 funding – Friday,�February�25,�2011�by�4:30�p.m.
• for late applications and January 2012 funding – Friday,�October�28,�2011�by�4:30�p.m.
Applications including attachments (e.g. menus) may be submitted my mail or e-mail. Faxed�and/or�photocopied�applications�will�not�be�accepted.
Tips for completing your application by computer:
1. Enable Macros on your computer. This may be done through the security settings of your Word program. In Word 2007, this may be found through: Office
button (top left of Word screen), Word Options, Trust Centre, Trust Centre Setttings, Enable all Macros. (Remember to turn Macros off again once you are
finished.) You may also be given a pop-up Enable Macros option.
2. Create a SNP Application folder on your desktop or hard drive.
3. Open the Application document and save it to the Application folder.
4. Complete the Application.
5. Save the Application regularly to the Application folder, so that your work is not accidentally lost.
6. Have the Site Authority save his or her scanned signature to the Application folder, maximum approximate size 220 x 50 (length and height in pixels). The
signature must be named one of the following: signature.jpg, signature.jpeg, signature.bmp, signature.png or signature.gif
7. When you have completed the Application, have the Site Authority review the content of the Application and review and authorize the terms on page 6. When
the Site Authority clicks on the Signature of Principal / Site Authority field, a pop-up will appear, asking, ‘Do you want to add a signature now?’ Click ‘yes’ and
the signature will be inserted from the Application folder. The signature must be properly named (see 6, above) and in the same folder as the Application, in
order for this to work.
8. Once Site Authority has inserted his or her signature, save and print the final copy for your own records.
9. Convert file to PDF and submit by e-mail as instructed below.
10. If you have a problem with the Signature features, print the application as is, have the Site Authority sign it and mail as instructed below..
Mailed and delivered applications:
• Applications including attachments (e.g. menus) must be received by the date and time above.
• Applications received after this date and time will not be considered until Fall 2011.
• Application must include original signature of the Site Authority.
• Faxed�or�photocopied�applications�will�not�be�accepted.
• Incomplete applications will be returned.
• You will be notified by mail when your completed grant application has been received.
• Please keep a copy of your completed application for your records
• Applications may be mailed or delivered to:
Student Nutrition Program
Toronto Public Health
5100 Yonge Street, 2nd floor
Toronto, ON M2N 5V7
A P P E N D I X 1F E E D I N G O U R F U T U R E : T H E F I R S T - A N D S E c O N D - Y E A R E v A l U A T I O N
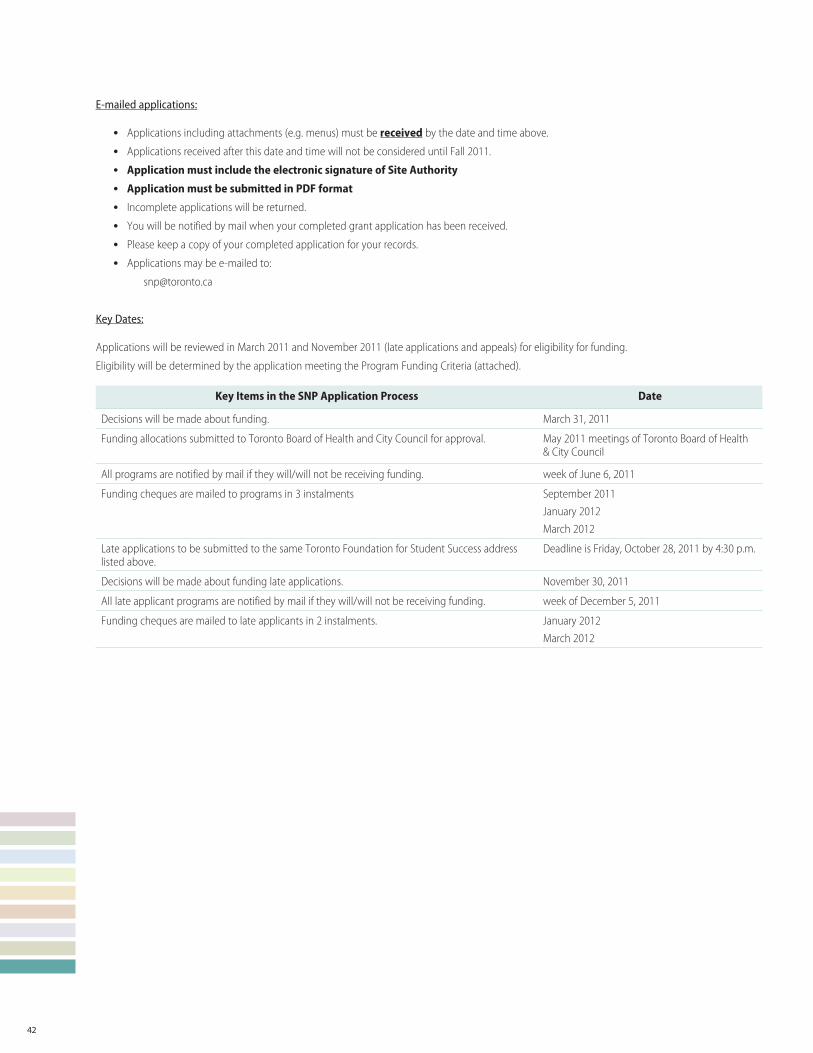
42
E-mailed applications:
• Applications including attachments (e.g. menus) must be received by the date and time above.
• Applications received after this date and time will not be considered until Fall 2011.
• �Application�must�include�the�electronic�signature�of�Site�Authority
• Application�must�be�submitted�in�PDF�format
• Incomplete applications will be returned.
• You will be notified by mail when your completed grant application has been received.
• Please keep a copy of your completed application for your records.
• Applications may be e-mailed to:
Key Dates:
Applications will be reviewed in March 2011 and November 2011 (late applications and appeals) for eligibility for funding.
Eligibility will be determined by the application meeting the Program Funding Criteria (attached).
Key�Items�in�the�SNP�Application�Process Date
Decisions will be made about funding. March 31, 2011
Funding allocations submitted to Toronto Board of Health and City Council for approval. May 2011 meetings of Toronto Board of Health & City Council
All programs are notified by mail if they will/will not be receiving funding. week of June 6, 2011
Funding cheques are mailed to programs in 3 instalments September 2011January 2012March 2012
Late applications to be submitted to the same Toronto Foundation for Student Success address listed above.
Deadline is Friday, October 28, 2011 by 4:30 p.m.
Decisions will be made about funding late applications. November 30, 2011
All late applicant programs are notified by mail if they will/will not be receiving funding. week of December 5, 2011
Funding cheques are mailed to late applicants in 2 instalments. January 2012 March 2012
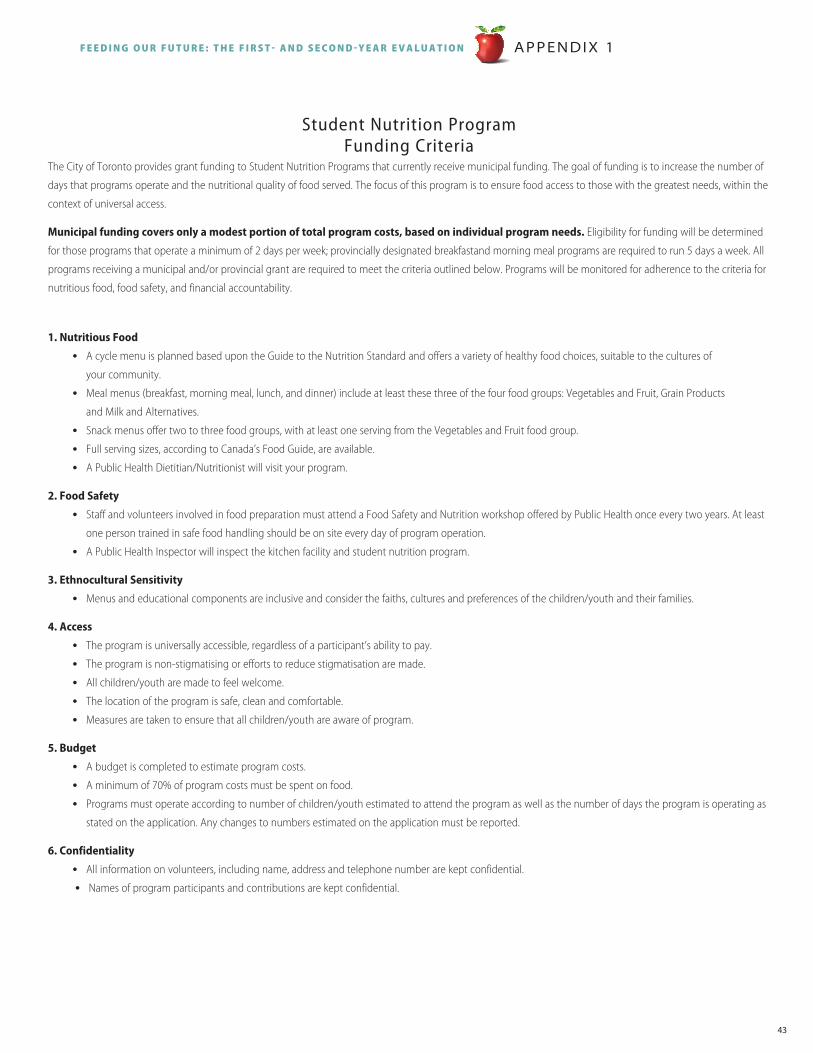
43
Student Nutrition ProgramFunding Criteria
The City of Toronto provides grant funding to Student Nutrition Programs that currently receive municipal funding. The goal of funding is to increase the number of
days that programs operate and the nutritional quality of food served. The focus of this program is to ensure food access to those with the greatest needs, within the
context of universal access.
Municipal�funding�covers�only�a�modest�portion�of�total�program�costs,�based�on�individual�program�needs. Eligibility for funding will be determined
for those programs that operate a minimum of 2 days per week; provincially designated breakfastand morning meal programs are required to run 5 days a week. All
programs receiving a municipal and/or provincial grant are required to meet the criteria outlined below. Programs will be monitored for adherence to the criteria for
nutritious food, food safety, and financial accountability.
1.�Nutritious�Food
• A cycle menu is planned based upon the Guide to the Nutrition Standard and offers a variety of healthy food choices, suitable to the cultures of
your community.
• Meal menus (breakfast, morning meal, lunch, and dinner) include at least these three of the four food groups: Vegetables and Fruit, Grain Products
and Milk and Alternatives.
• Snack menus offer two to three food groups, with at least one serving from the Vegetables and Fruit food group.
• Full serving sizes, according to Canada’s Food Guide, are available.
• A Public Health Dietitian/Nutritionist will visit your program.
2.�Food�Safety
• Staff and volunteers involved in food preparation must attend a Food Safety and Nutrition workshop offered by Public Health once every two years. At least
one person trained in safe food handling should be on site every day of program operation.
• A Public Health Inspector will inspect the kitchen facility and student nutrition program.
3.�Ethnocultural�Sensitivity
• Menus and educational components are inclusive and consider the faiths, cultures and preferences of the children/youth and their families.
4.�Access
• The program is universally accessible, regardless of a participant’s ability to pay.
• The program is non-stigmatising or efforts to reduce stigmatisation are made.
• All children/youth are made to feel welcome.
• The location of the program is safe, clean and comfortable.
• Measures are taken to ensure that all children/youth are aware of program.
5.�Budget
• A budget is completed to estimate program costs.
• A minimum of 70% of program costs must be spent on food.
• Programs must operate according to number of children/youth estimated to attend the program as well as the number of days the program is operating as
stated on the application. Any changes to numbers estimated on the application must be reported.
6.�Confidentiality
• All information on volunteers, including name, address and telephone number are kept confidential.
• Names of program participants and contributions are kept confidential.
A P P E N D I X 1F E E D I N G O U R F U T U R E : T H E F I R S T - A N D S E c O N D - Y E A R E v A l U A T I O N
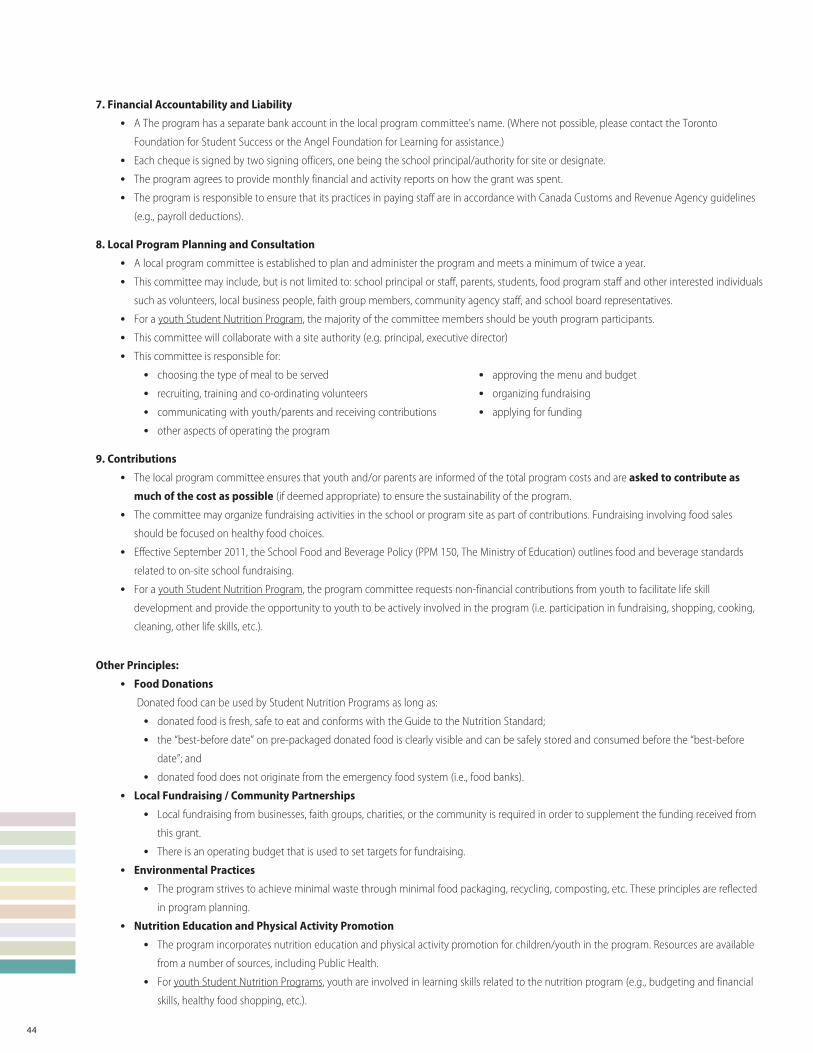
44
7.�Financial�Accountability�and�Liability
• A The program has a separate bank account in the local program committee’s name. (Where not possible, please contact the Toronto
Foundation for Student Success or the Angel Foundation for Learning for assistance.)
• Each cheque is signed by two signing officers, one being the school principal/authority for site or designate.
• The program agrees to provide monthly financial and activity reports on how the grant was spent.
• The program is responsible to ensure that its practices in paying staff are in accordance with Canada Customs and Revenue Agency guidelines
(e.g., payroll deductions).
8.�Local�Program�Planning�and�Consultation
• A local program committee is established to plan and administer the program and meets a minimum of twice a year.
• This committee may include, but is not limited to: school principal or staff, parents, students, food program staff and other interested individuals
such as volunteers, local business people, faith group members, community agency staff, and school board representatives.
• For a youth Student Nutrition Program, the majority of the committee members should be youth program participants.
• This committee will collaborate with a site authority (e.g. principal, executive director)
• This committee is responsible for:
• choosing the type of meal to be served • approving the menu and budget
• recruiting, training and co-ordinating volunteers • organizing fundraising
• communicating with youth/parents and receiving contributions • applying for funding
• other aspects of operating the program
9.�Contributions
• The local program committee ensures that youth and/or parents are informed of the total program costs and are�asked�to�contribute�as�
much�of�the�cost�as�possible (if deemed appropriate) to ensure the sustainability of the program.
• The committee may organize fundraising activities in the school or program site as part of contributions. Fundraising involving food sales
should be focused on healthy food choices.
• Effective September 2011, the School Food and Beverage Policy (PPM 150, The Ministry of Education) outlines food and beverage standards
related to on-site school fundraising.
• For a youth Student Nutrition Program, the program committee requests non-financial contributions from youth to facilitate life skill
development and provide the opportunity to youth to be actively involved in the program (i.e. participation in fundraising, shopping, cooking,
cleaning, other life skills, etc.).
Other�Principles:
• Food�Donations
Donated food can be used by Student Nutrition Programs as long as:
• donated food is fresh, safe to eat and conforms with the Guide to the Nutrition Standard;
• the “best-before date” on pre-packaged donated food is clearly visible and can be safely stored and consumed before the “best-before
date”; and
• donated food does not originate from the emergency food system (i.e., food banks).
• Local�Fundraising�/�Community�Partnerships
• Local fundraising from businesses, faith groups, charities, or the community is required in order to supplement the funding received from
this grant.
• There is an operating budget that is used to set targets for fundraising.
• Environmental�Practices
• The program strives to achieve minimal waste through minimal food packaging, recycling, composting, etc. These principles are reflected
in program planning.
• Nutrition�Education�and�Physical�Activity�Promotion
• The program incorporates nutrition education and physical activity promotion for children/youth in the program. Resources are available
from a number of sources, including Public Health.
• For youth Student Nutrition Programs, youth are involved in learning skills related to the nutrition program (e.g., budgeting and financial
skills, healthy food shopping, etc.).
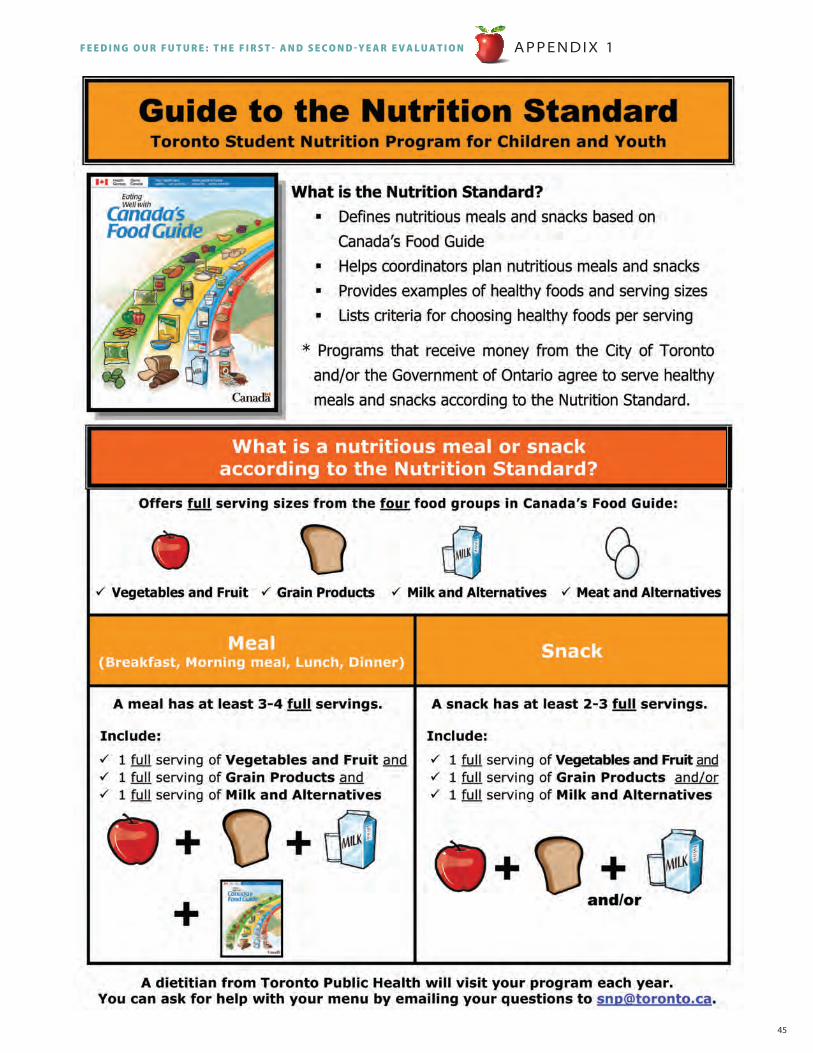
45
A P P E N D I X 1F E E D I N G O U R F U T U R E : T H E F I R S T - A N D S E c O N D - Y E A R E v A l U A T I O N
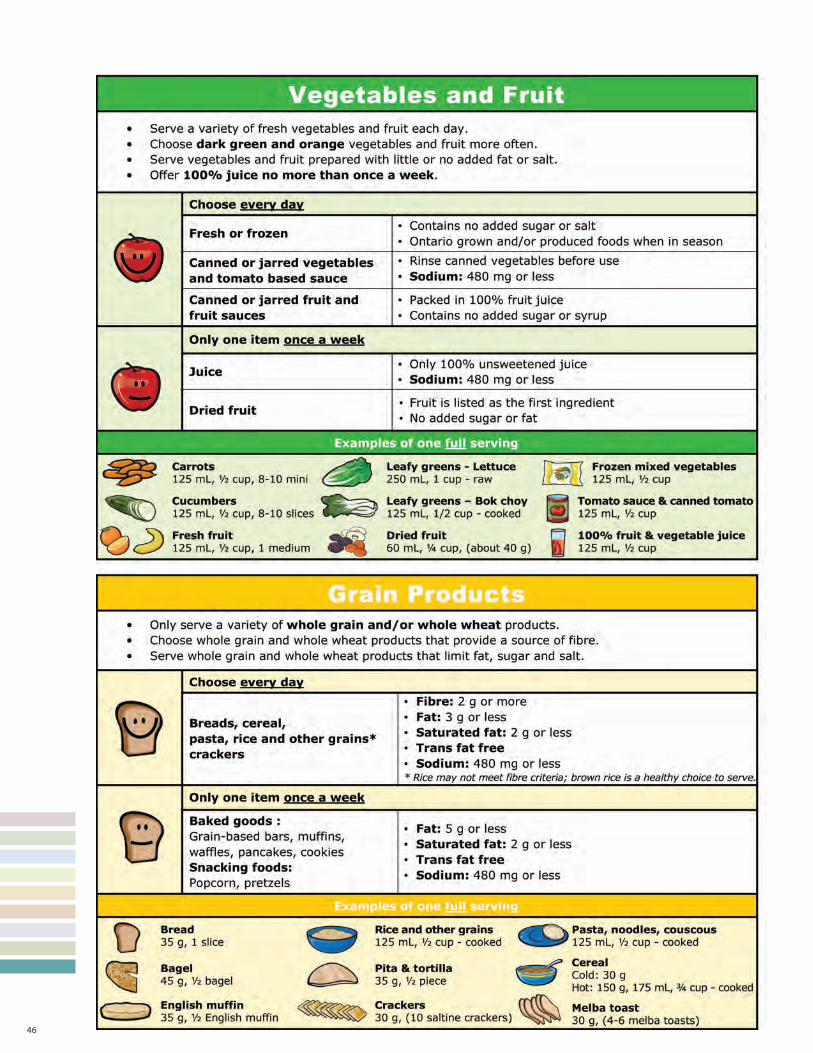
46
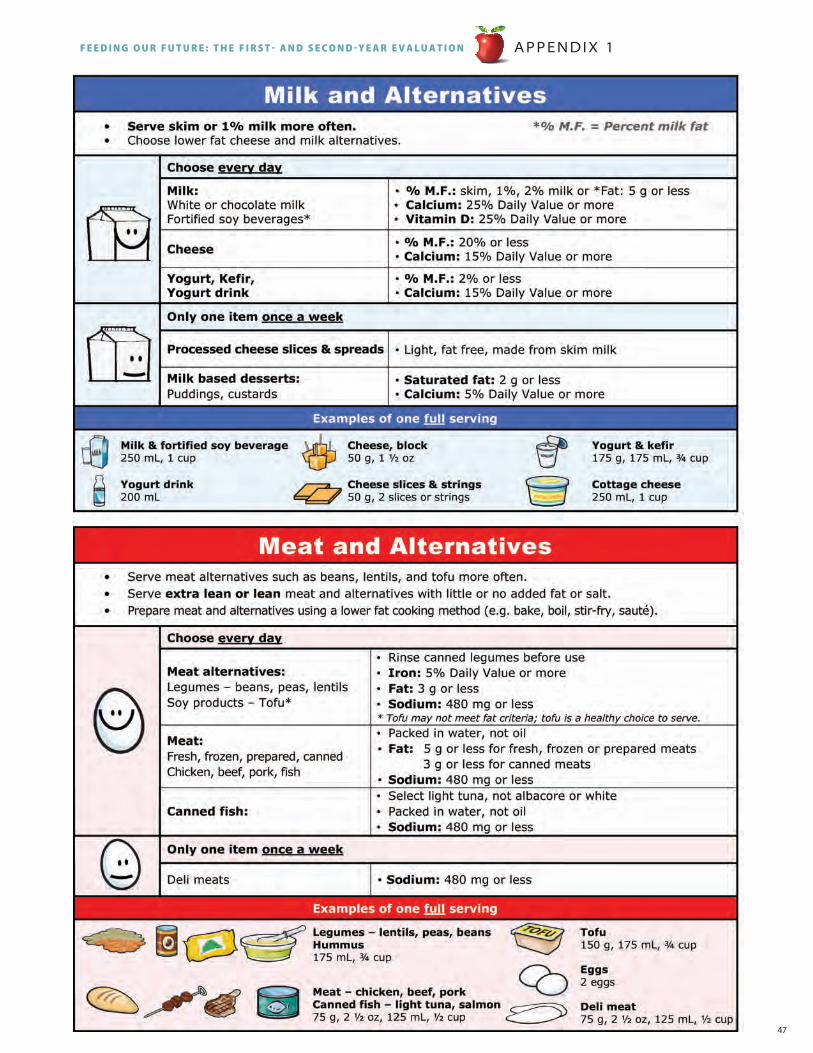
47
A P P E N D I X 1F E E D I N G O U R F U T U R E : T H E F I R S T - A N D S E c O N D - Y E A R E v A l U A T I O N
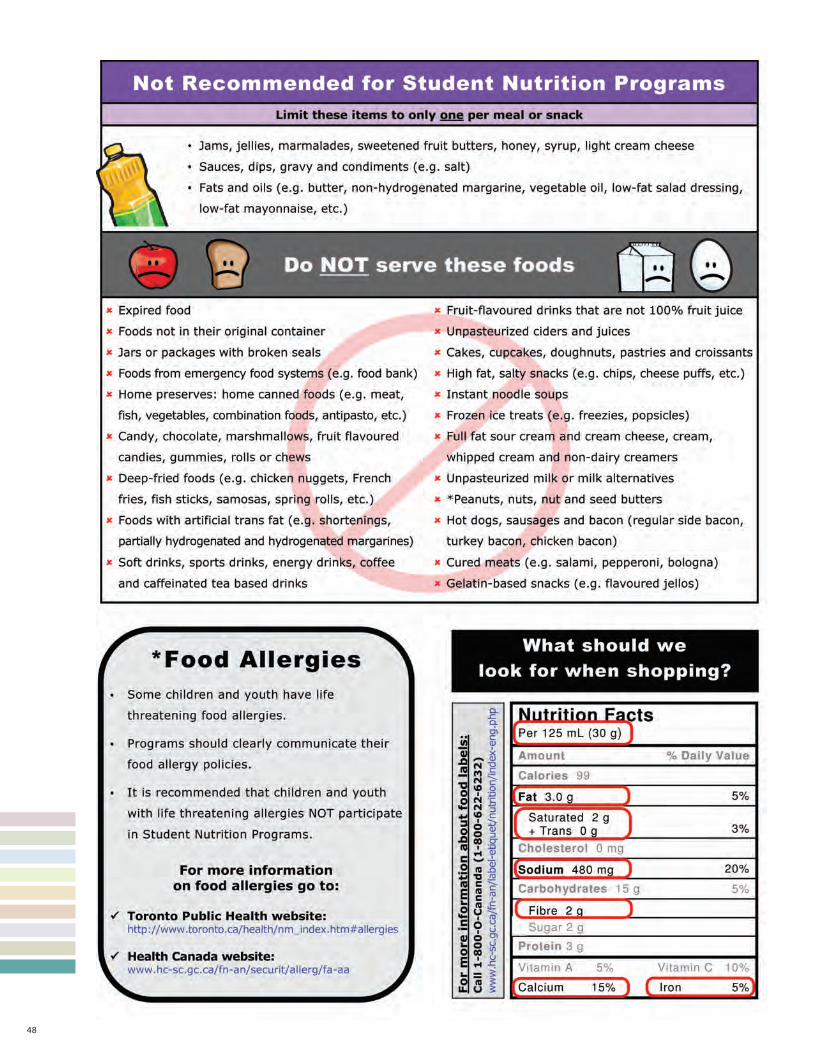
48
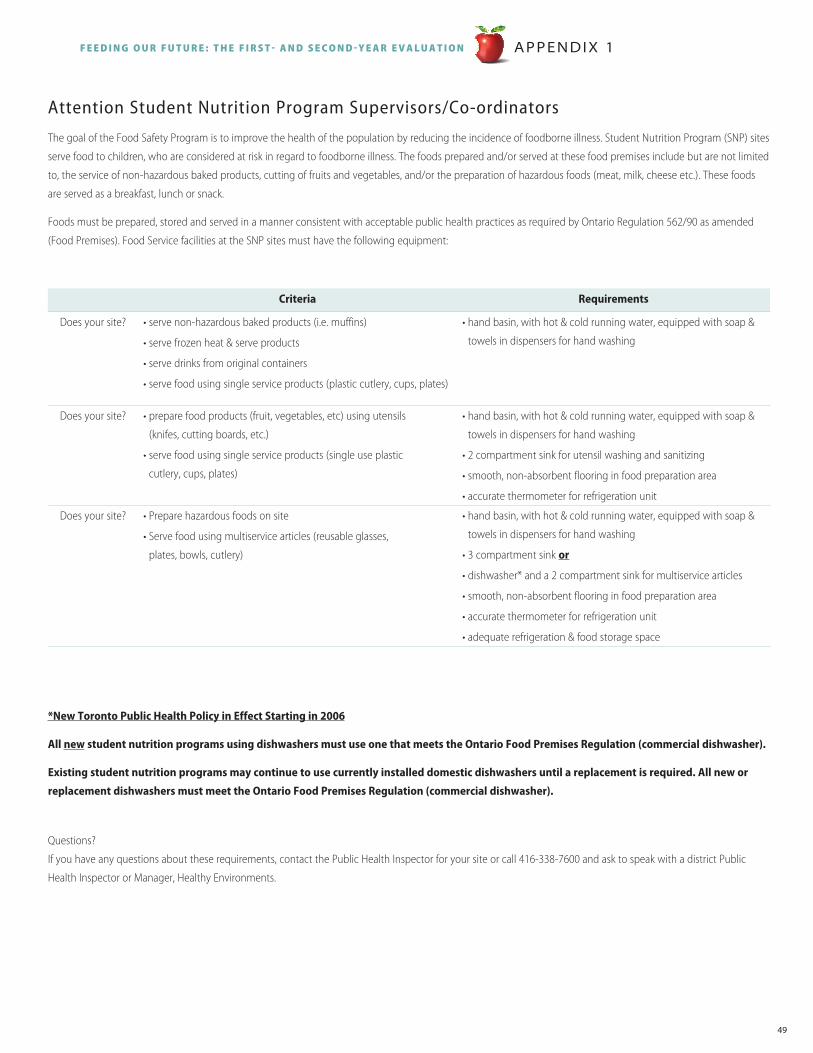
49
Attention Student Nutrition Program Supervisors/Co-ordinators
The goal of the Food Safety Program is to improve the health of the population by reducing the incidence of foodborne illness. Student Nutrition Program (SNP) sites
serve food to children, who are considered at risk in regard to foodborne illness. The foods prepared and/or served at these food premises include but are not limited
to, the service of non-hazardous baked products, cutting of fruits and vegetables, and/or the preparation of hazardous foods (meat, milk, cheese etc.). These foods
are served as a breakfast, lunch or snack.
Foods must be prepared, stored and served in a manner consistent with acceptable public health practices as required by Ontario Regulation 562/90 as amended
(Food Premises). Food Service facilities at the SNP sites must have the following equipment:
Criteria Requirements
Does your site? • serve non-hazardous baked products (i.e. muffins)
• serve frozen heat & serve products
• serve drinks from original containers
• serve food using single service products (plastic cutlery, cups, plates)
• hand basin, with hot & cold running water, equipped with soap &
towels in dispensers for hand washing
Does your site? • prepare food products (fruit, vegetables, etc) using utensils
(knifes, cutting boards, etc.)
• serve food using single service products (single use plastic
cutlery, cups, plates)
• hand basin, with hot & cold running water, equipped with soap &
towels in dispensers for hand washing
• 2 compartment sink for utensil washing and sanitizing
• smooth, non-absorbent flooring in food preparation area
• accurate thermometer for refrigeration unit
Does your site? • Prepare hazardous foods on site
• Serve food using multiservice articles (reusable glasses,
plates, bowls, cutlery)
• hand basin, with hot & cold running water, equipped with soap &
towels in dispensers for hand washing
• 3 compartment sink or
• dishwasher* and a 2 compartment sink for multiservice articles
• smooth, non-absorbent flooring in food preparation area
• accurate thermometer for refrigeration unit
• adequate refrigeration & food storage space
*New�Toronto�Public�Health�Policy�in�Effect�Starting�in�2006
All�new�student�nutrition�programs�using�dishwashers�must�use�one�that�meets�the�Ontario�Food�Premises�Regulation�(commercial�dishwasher).
Existing�student�nutrition�programs�may�continue�to�use�currently�installed�domestic�dishwashers�until�a�replacement�is�required.�All�new�or�
replacement�dishwashers�must�meet�the�Ontario�Food�Premises�Regulation�(commercial�dishwasher).
Questions?
If you have any questions about these requirements, contact the Public Health Inspector for your site or call 416-338-7600 and ask to speak with a district Public
Health Inspector or Manager, Healthy Environments.
A P P E N D I X 1F E E D I N G O U R F U T U R E : T H E F I R S T - A N D S E c O N D - Y E A R E v A l U A T I O N
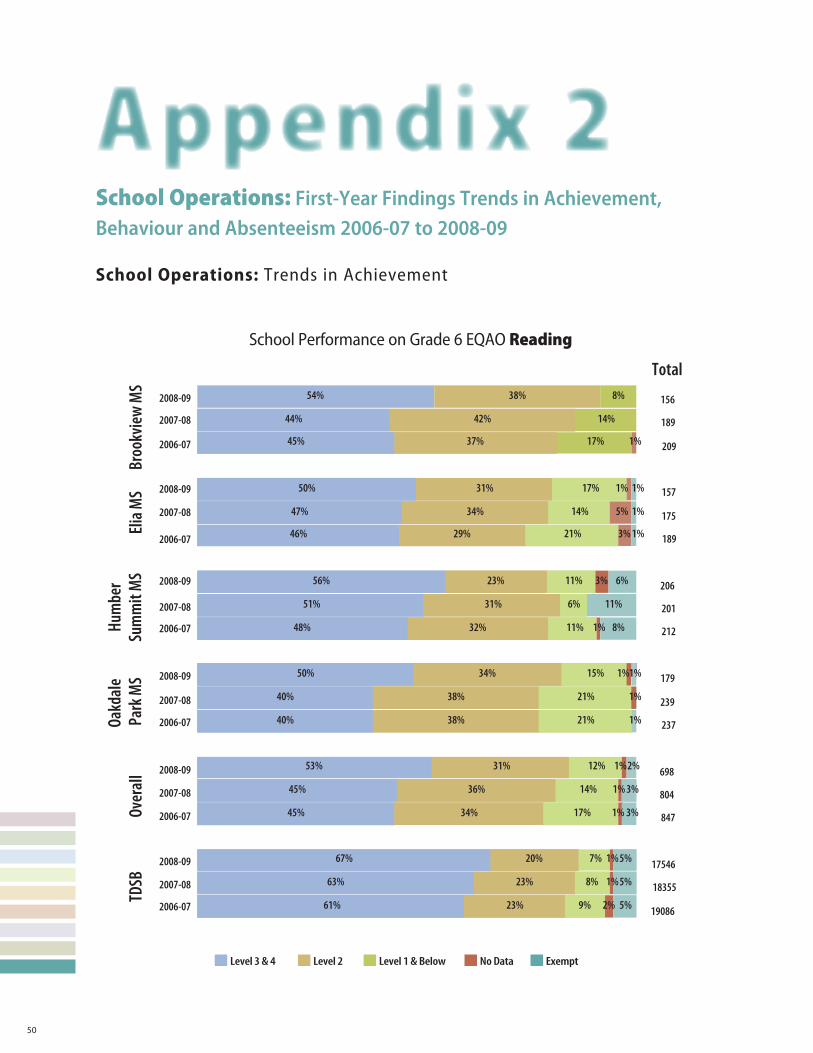
50
School Operations: First-Year Findings Trends in Achievement,Behaviour and Absenteeism 2006-07 to 2008-09
School�Operations:�Trends in Achievement
�
2006-07
2007-08
2008-09
2006-07
2007-08
2008-09
2006-07
2007-08
2008-09
2006-07
2007-08
2008-09
2006-07
2007-08
2008-09
Over
all
TDSB
Broo
kvie
w M
SEli
a MS
2006-07
2007-08
2008-09
Hum
ber
Sum
mit
MS
Oakd
ale
Park
MS
Level 3 & 4 Level 2 Level 1 & Below No Data Exempt
Total
19086
18355
17546
847
804
698
237
239
179
212
201
206
189
175
157
209
189
156
7%
17%
14%
12%
21%
21%
15%
6%
21%
17%
2%
1%
1%
1%
1%
1%
1%
1%
1%
3%
3%
5%
3%
3%
2%
1%
8%
1%
9%
8%
11%
11%
14%
5%
5%
5%
1%
11%
6%
1%
1%1%
45%
44%
54%
37%
42%
38%
17%
14%
8%
1%
61%
63%
67%
45%
45%
53%
40%
40%
50%
48%
51%
56%
46%
47%
50%
23%
23%
20%
34%
36%
31%
38%
38%
34%
32%
31%
23%
29%
34%
31%
School Performance on Grade 6 EQAO Reading
Appendix 2
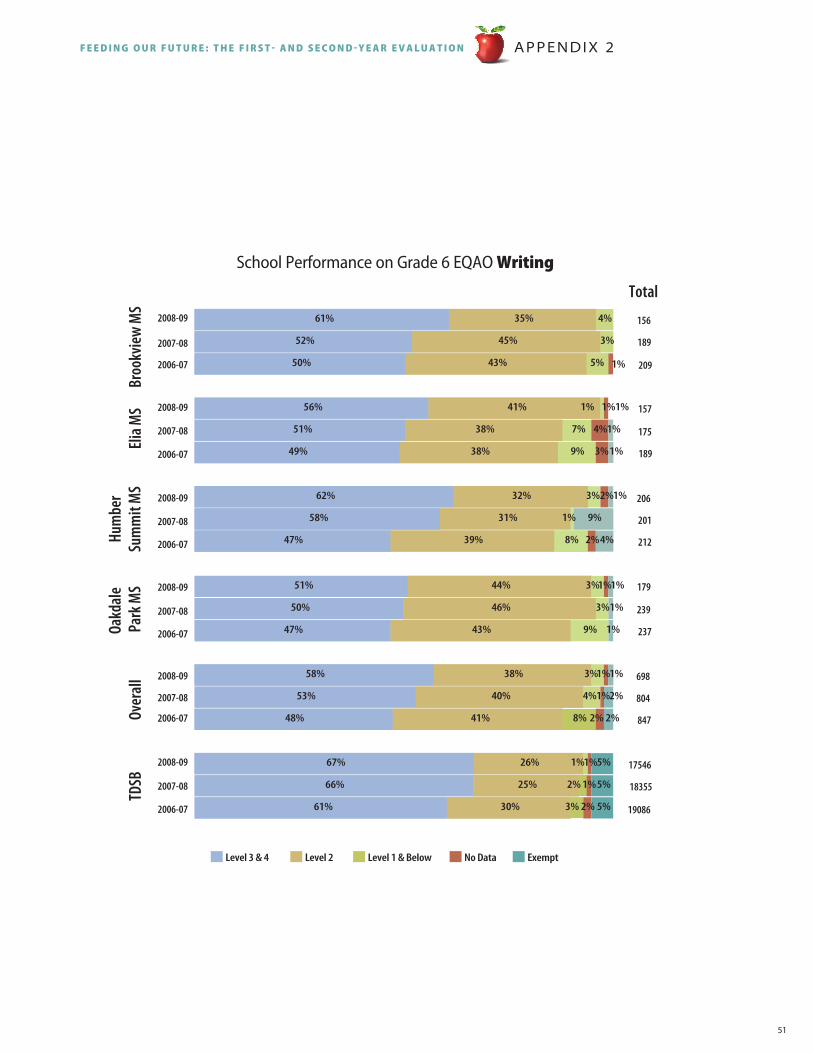
51
A P P E N D I X 2F E E D I N G O U R F U T U R E : T H E F I R S T - A N D S E c O N D - Y E A R E v A l U A T I O N
2006-07
2007-08
2008-09
2006-07
2007-08
2008-09
2006-07
2007-08
2008-09
2006-07
2007-08
2008-09
2006-07
2007-08
2008-09
Over
all
TDSB
Broo
kvie
w M
SEli
a MS
2006-07
2007-08
2008-09
Hum
ber
Sum
mit
MS
Oakd
ale
Park
MS
Level 3 & 4 Level 2 Level 1 & Below No Data Exempt
Total
19086
18355
17546
847
804
698
237
239
179
212
201
206
189
175
157
209
189
156
61%
66%
67%
48%
53%
58%
47%
50%
51%
47%
58%
62%
49%
51%
56%
50%
52%
61%
30%
25%
26%
41%
40%
38%
43%
46%
44%
39%
31%
32%
38%
38%
41%
43%
45%
35%
8%
4%
3%
9%
3%
8%
1%
3%
5%
2%
1%
1%
2%
1%
1%
1%
1%
2%
2%
3%
4%
1%
1%
2%
2%
1%
1%
4%
1%
3%
2%
1%
3%
9%
7%
1%
3%
4%
5%
5%
5%
1%
9%
1%
1%
1%
School Performance on Grade 6 EQAO Writing
Appendix 2
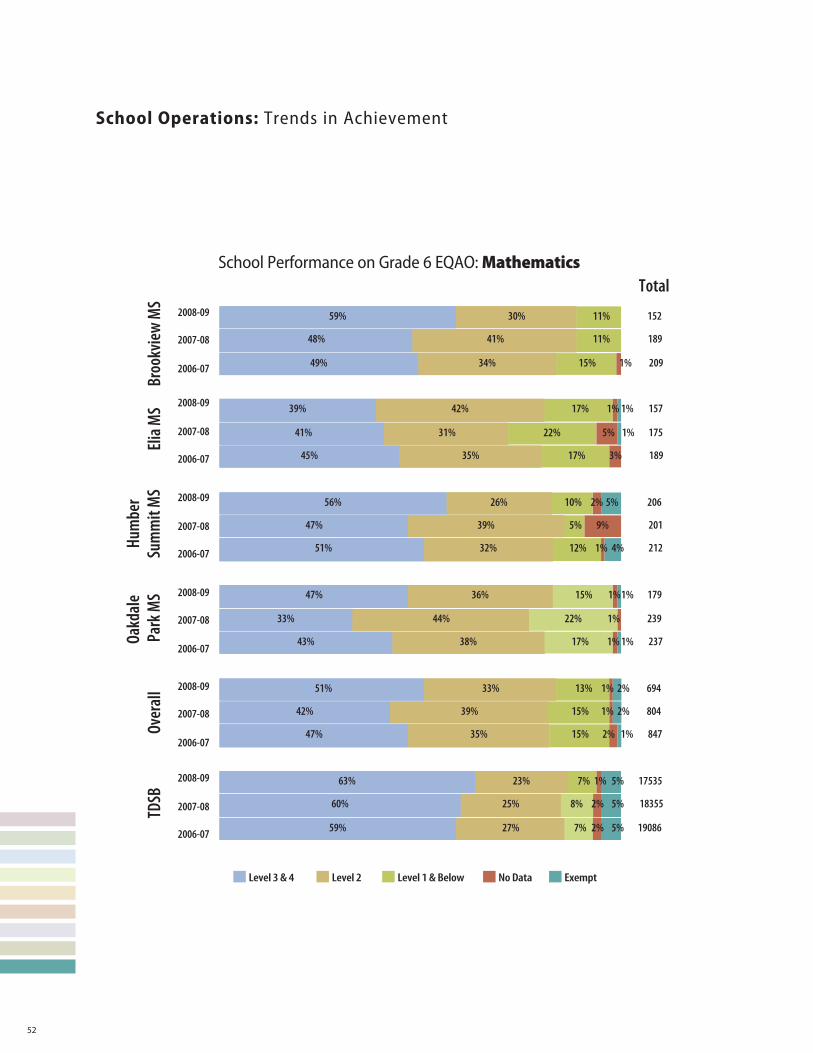
52
School�Operations:�Trends in Achievement
�
10%
2006-07
2007-08
2008-09
2006-07
2007-08
2008-09
2006-07
2007-08
2008-09
2006-07
2007-08
2008-09
2006-07
2007-08
2008-09
Over
all
TDSB
Broo
kview
MS
Elia M
S
2006-07
2007-08
2008-09
Hum
ber
Sum
mit
MS
Oakd
ale
Park
MS
Level 3 & 4 Level 2 Level 1 & Below No Data Exempt
Total
19086
18355
17535
847
804
694
237
239
179
212
201
206
189
175
157
209
189
152
59%
60%
63%
47%
42%
51%
43%
33%
47%
51%
47%
56%
45%
41%
39%
49%
48%
59%
23%
35%
39%
33%
38%
44%
36%
32%
39%
26%
35%
31%
42%
34%
41%
30%
15%
15%
13%
17%
22%
15%
12%
15%
11%
11%
2%
2%
1%
2%
1%
1%
1%
1%
1%
1%
2%
3%
5%
1%
1%
1%
2%
2%
1%
4%
1%
1%
27%
25%
7%
8%
7%
5%
17%
22%
17%
5%
5%
5%
1%
9%
5%
School Performance on Grade 6 EQAO: Mathematics
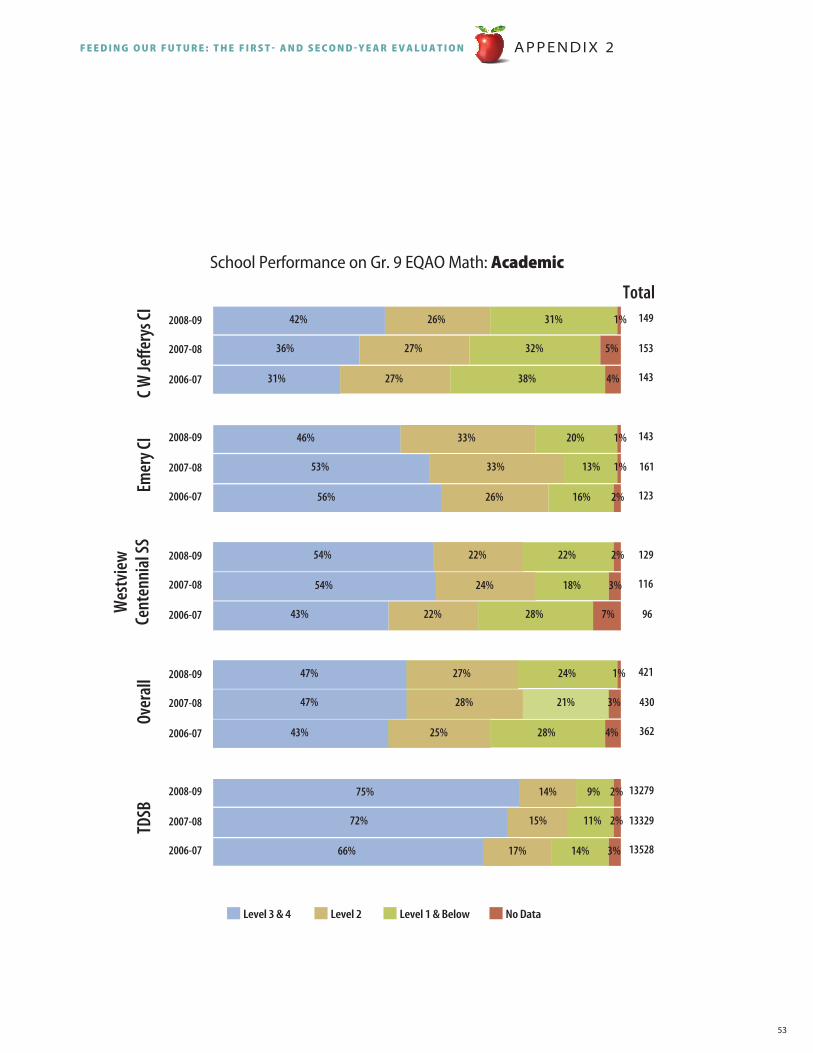
53
A P P E N D I X 2F E E D I N G O U R F U T U R E : T H E F I R S T - A N D S E c O N D - Y E A R E v A l U A T I O N
School Performance on Gr. 9 EQAO Math: Academic
31%
36%
42%
27%
27%
26%
38%
32%
31%
4%
5%
1%
56%
53%
46%
26%
33%
33%
16%
13%
20%
2%
1%
1%
43%
54%
54%
22%
24%
22%
28%
18%
22%
7%
3%
2%
43%
47%
47%
25%
28%
27%
28%
21%
24%
4%
3%
1%
13528
13329
13279
362
430
421
96
116
129
123
161
143
143
153
149
2006-07
2007-08
2008-09
2006-07
2007-08
2008-09
2006-07
2007-08
2008-09
2006-07
2007-08
2008-09
2006-07
2007-08
2008-09
Wes
tview
Cent
enni
al SS
Over
all
TDSB
C W Je
�ery
s CI
Emer
y CI
Total
Level 3 & 4 Level 2 Level 1 & Below No Data
66%
72%
75%
17%
15%
14%
14%
11%
9%
3%
2%
2%
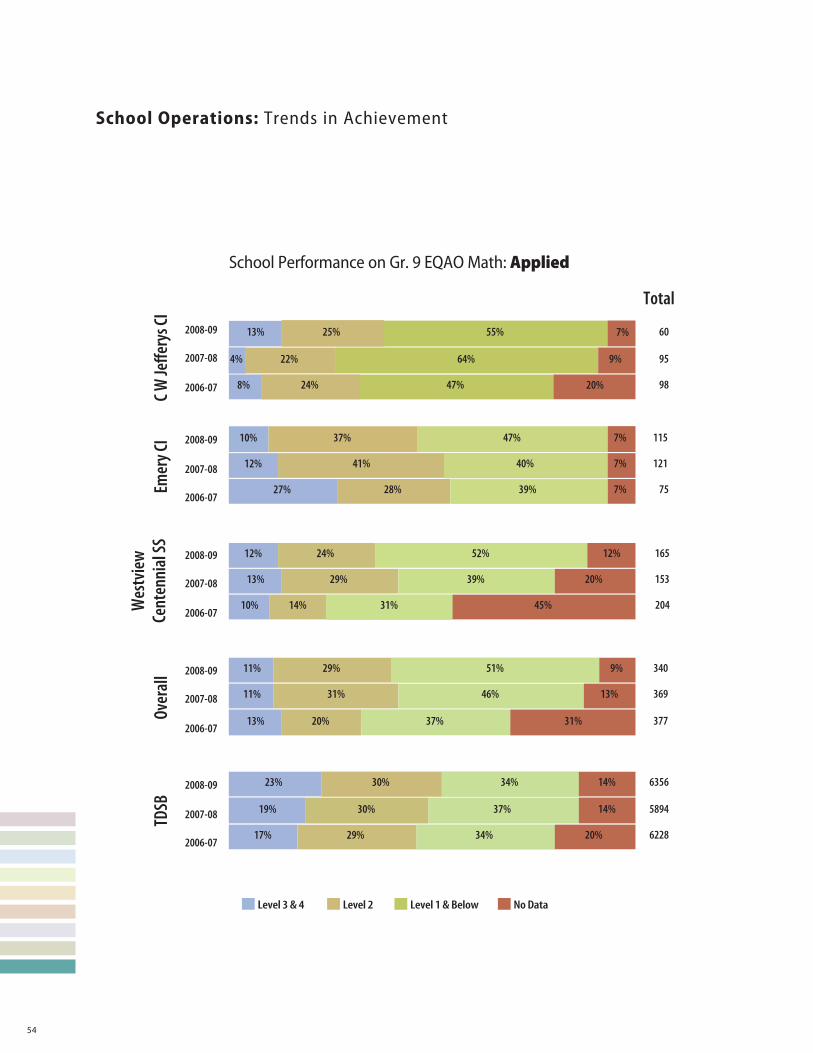
54
School�Operations:�Trends in Achievement
�
School Performance on Gr. 9 EQAO Math: Applied
2006-07
2007-08
2008-09
2006-07
2007-08
2008-09
2006-07
2007-08
2008-09
2006-07
2007-08
2008-09
2006-07
2007-08
2008-09
Wes
tview
Cent
enni
al SS
Over
all
TDSB
C W Je
�ery
s CI
Emer
y CI
Total
Level 3 & 4 Level 2 Level 1 & Below No Data
17%
19%
23%
13%
11%
11%
10%
13%
12%
27%
12%
10%
8%
4%
13%
29%
30%
30%
20%
31%
29%
14%
29%
24%
28%
41%
37%
24%
22%
25%
34%
37%
34%
37%
46%
51%
31%
39%
52%
39%
40%
47%
47%
64%
55%
20%
14%
14%
31%
13%
9%
45%
20%
12%
7%
7%
7%
9%
20%
7%
6228
5894
6356
377
369
340
204
153
165
75
121
115
98
95
60
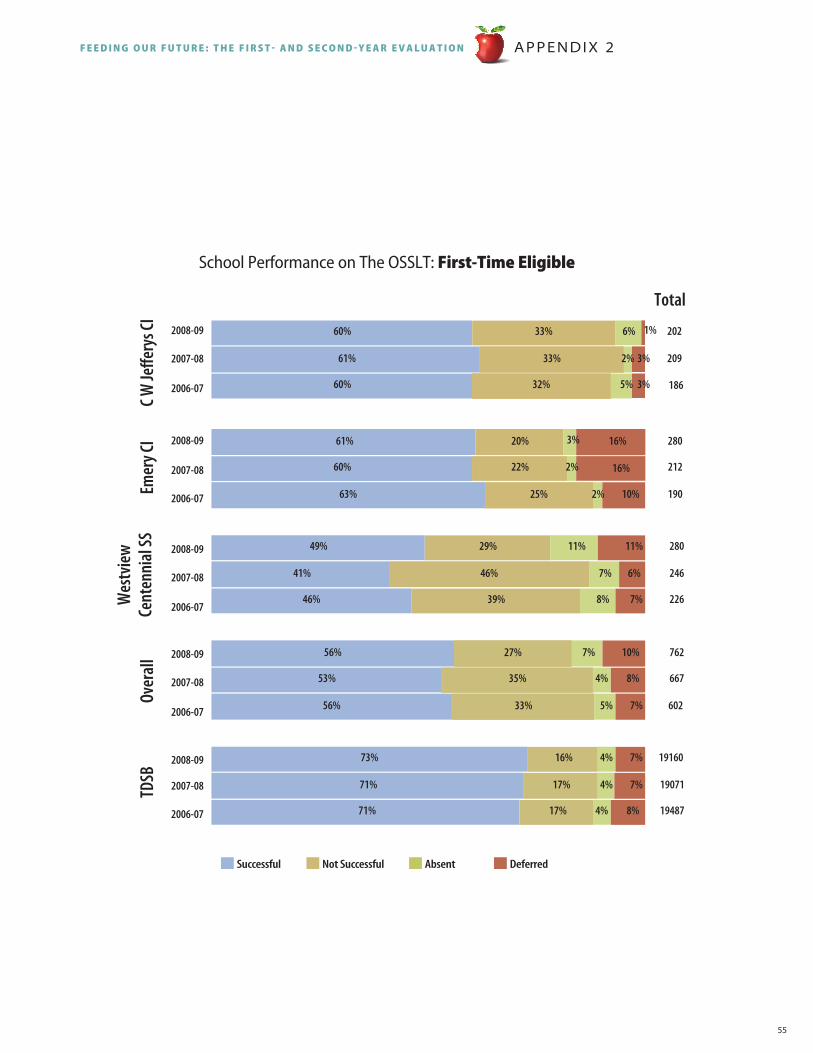
55
A P P E N D I X 2F E E D I N G O U R F U T U R E : T H E F I R S T - A N D S E c O N D - Y E A R E v A l U A T I O N
2006-07
2007-08
2008-09
2006-07
2007-08
2008-09
2006-07
2007-08
2008-09
2006-07
2007-08
2008-09
2006-07
2007-08
2008-09
Wes
tvie
wCe
nten
nial
SSOv
eral
lTD
SBC W
Je�e
rys C
IEm
ery C
I
Total
Successful Not Successful Absent Deferred
17%
17%
16%
33%
35%
27%
39%
46%
29%
25%
22%
20%
32%
33%
33%
4%
4%
4%
5%
4%
7%
7%
11%
2%
8%
7%
7%
7%
8%
10%
8%
2%
3%
5%
6%
2%
6%
11%
16%
3%
1%
7%
10%
16%
3%
19487
19071
19160
602
667
762
226
246
280
190
212
280
186
209
202
71%
71%
73%
56%
53%
56%
46%
41%
49%
63%
60%
61%
60%
61%
60%
School Performance on The OSSLT: First-Time Eligible
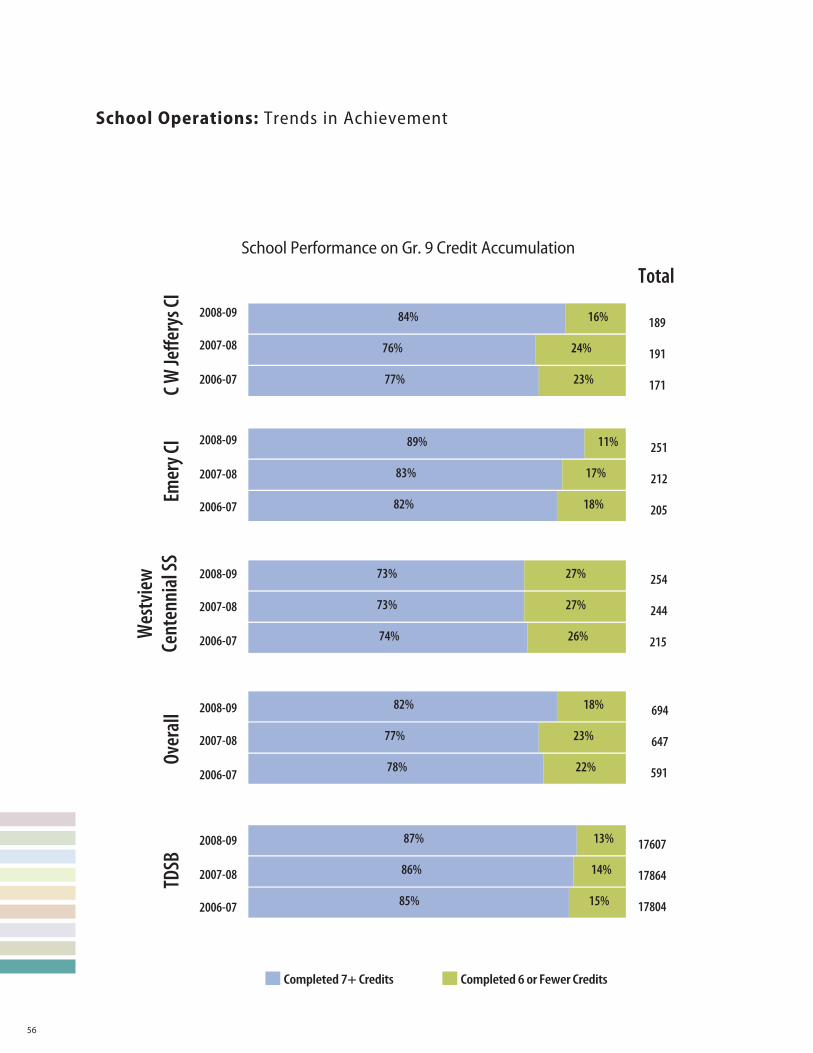
56
School�Operations:�Trends in Achievement
�
2006-07
2007-08
2008-09
2006-07
2007-08
2008-09
2006-07
2007-08
2008-09
2006-07
2007-08
2008-09
2006-07
2007-08
2008-09
Wes
tview
Cent
enni
al SS
Over
all
TDSB
C W Je
�ery
s CI
Emer
y CI
Total
Completed 7+ Credits Completed 6 or Fewer Credits
85%
86%
87%
78%
77%
82%
74%
73%
73%
82%
83%
89%
77%
76%
84%
15%
14%
13%
22%
23%
18%
26%
27%
27%
18%
17%
11%
23%
24%
16%
17804
17864
17607
591
647
694
215
244
254
205
212
251
171
191
189
School Performance on Gr. 9 Credit Accumulation
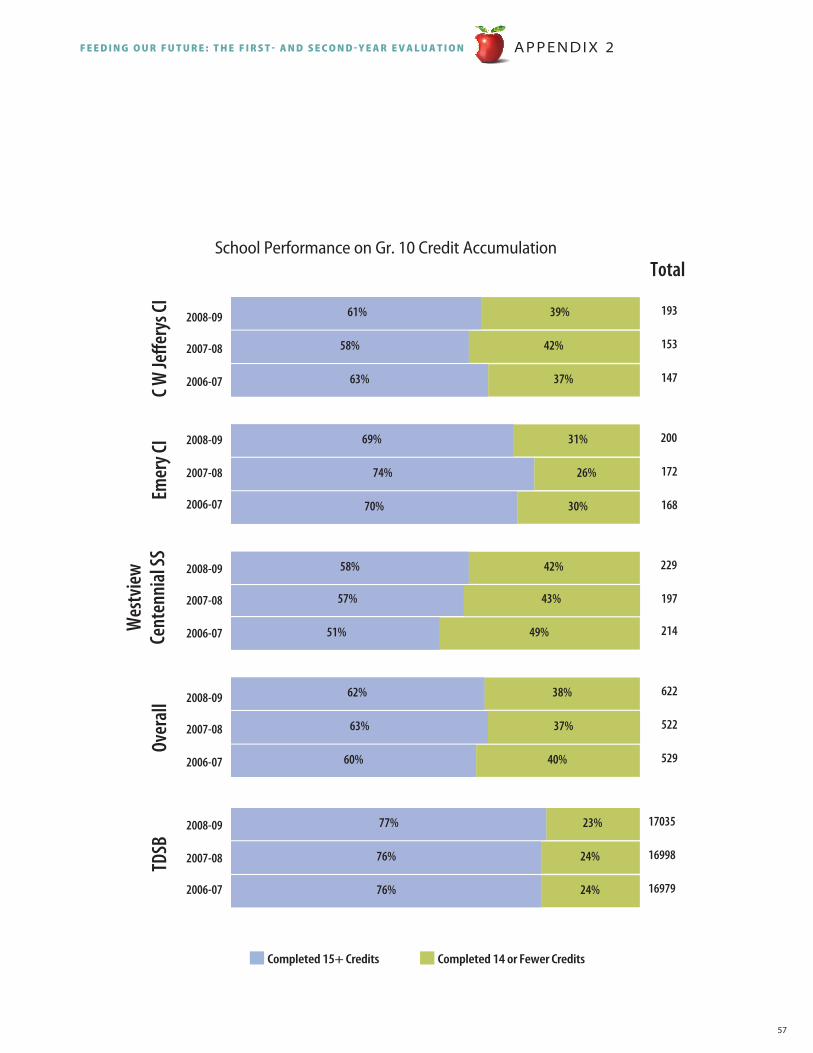
57
A P P E N D I X 2F E E D I N G O U R F U T U R E : T H E F I R S T - A N D S E c O N D - Y E A R E v A l U A T I O N
2006-07
2007-08
2008-09
2006-07
2007-08
2008-09
2006-07
2007-08
2008-09
2006-07
2007-08
2008-09
2006-07
2007-08
2008-09
Wes
tview
Cent
enni
al SS
Over
all
TDSB
C W Je
�ery
s CI
Emer
y CI
Total
Completed 15+ Credits Completed 14 or Fewer Credits
76%
76%
77%
60%
63%
62%
51%
57%
58%
70%
74%
69%
63%
58%
61%
24%
24%
23%
40%
37%
38%
49%
43%
42%
30%
26%
31%
37%
42%
39%
16979
16998
17035
529
522
622
214
197
229
168
172
200
147
153
193
School Performance on Gr. 10 Credit Accumulation
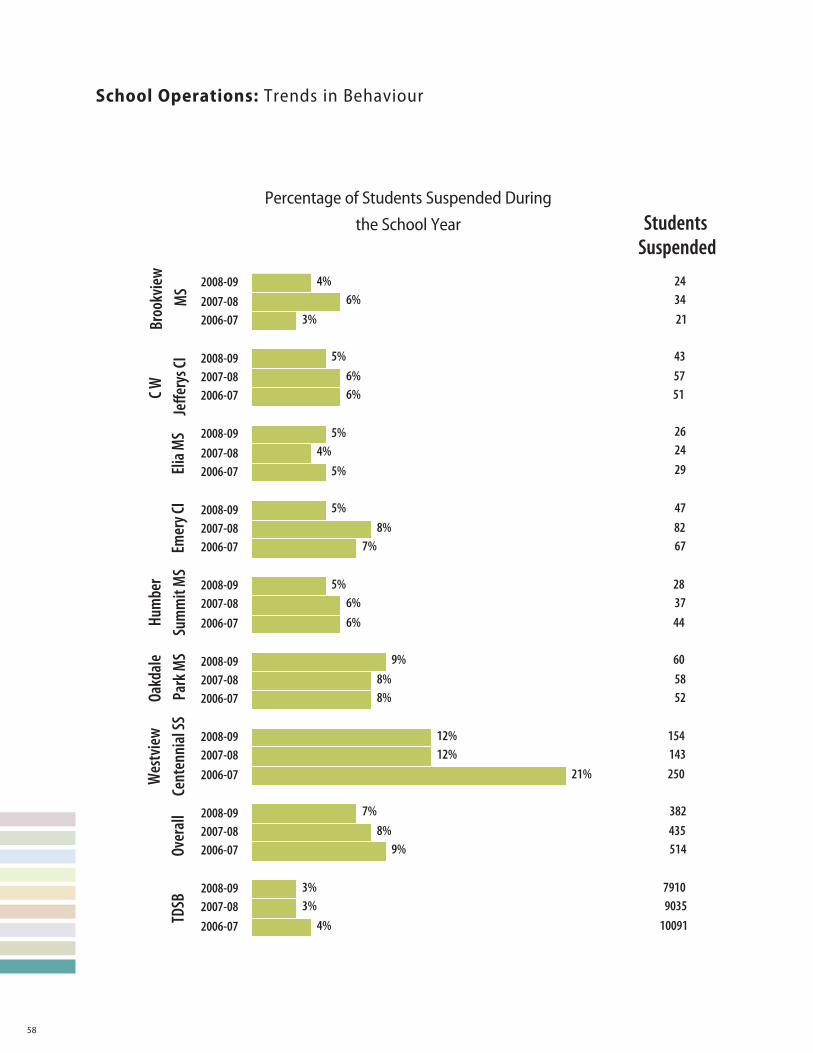
58
School�Operations:�Trends in Behaviour
�
Wes
tview
Cent
enni
al SS
Over
all
TDSB
C W
Je�e
rys C
IEm
ery C
I
4%3%3%
9%8%
7%
21%12%12%
8%8%
9%
6%6%
5%
7%8%
5%
5%4%
5%
6%6%
5%
3%6%
4%
1009190357910
514435382
250143154
525860
443728
678247
292426
515743
213424
2006-072007-082008-09
2006-072007-082008-09
2006-072007-082008-09
2006-072007-082008-09
2006-072007-082008-09
2006-072007-082008-09
2006-072007-082008-09
2006-072007-082008-09
2006-072007-082008-09
Students Suspended
Broo
kview
M
SEli
a MS
Hum
ber
Sum
mit
MS
Oakd
ale
Park
MS
Percentage of Students Suspended Duringthe School Year
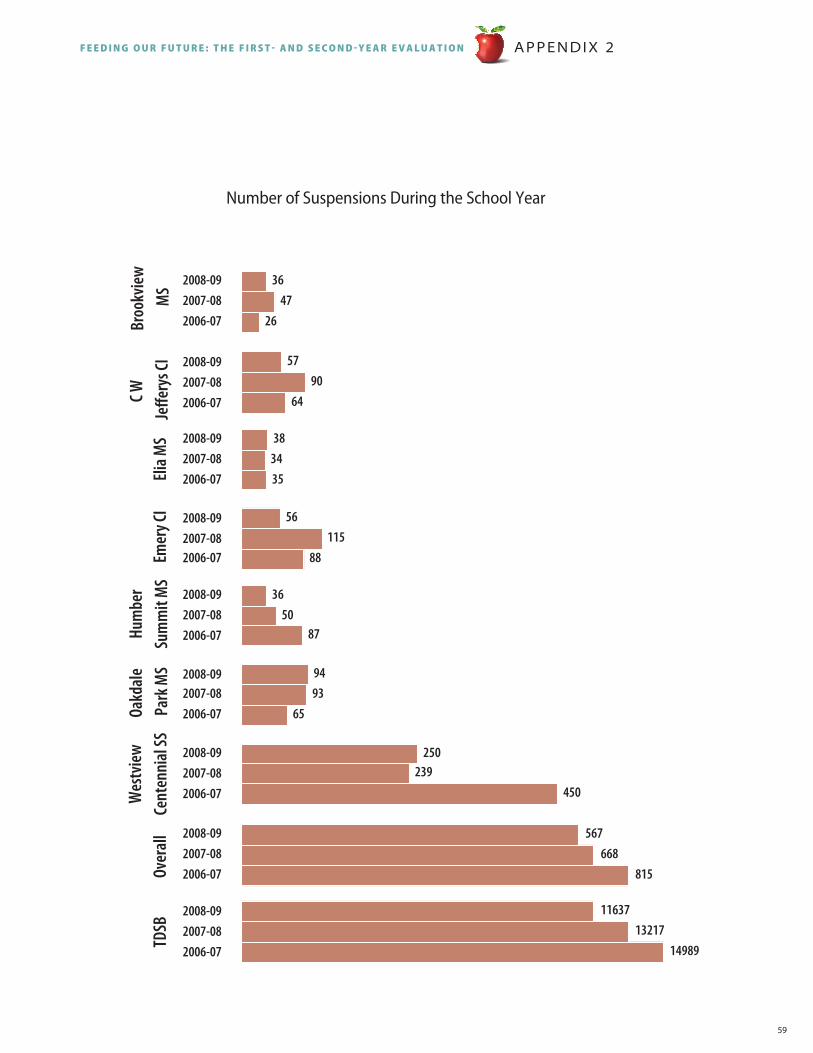
59
A P P E N D I X 2F E E D I N G O U R F U T U R E : T H E F I R S T - A N D S E c O N D - Y E A R E v A l U A T I O N
Wes
tview
Cent
enni
al SS
Over
all
TDSB
C W
Je�e
rys C
IEm
ery C
IBr
ookv
iew
MS
Elia M
SHu
mbe
rSu
mm
it M
SOa
kdal
e Pa
rk M
S
450239
250
659394
8750
36
88115
56
353438
6490
57
2647
36
815668
567
1498913217
11637
2006-072007-082008-09
2006-072007-082008-09
2006-072007-082008-09
2006-072007-082008-09
2006-072007-082008-09
2006-072007-082008-09
2006-072007-082008-09
2006-072007-082008-09
2006-072007-082008-09
Number of Suspensions During the School Year
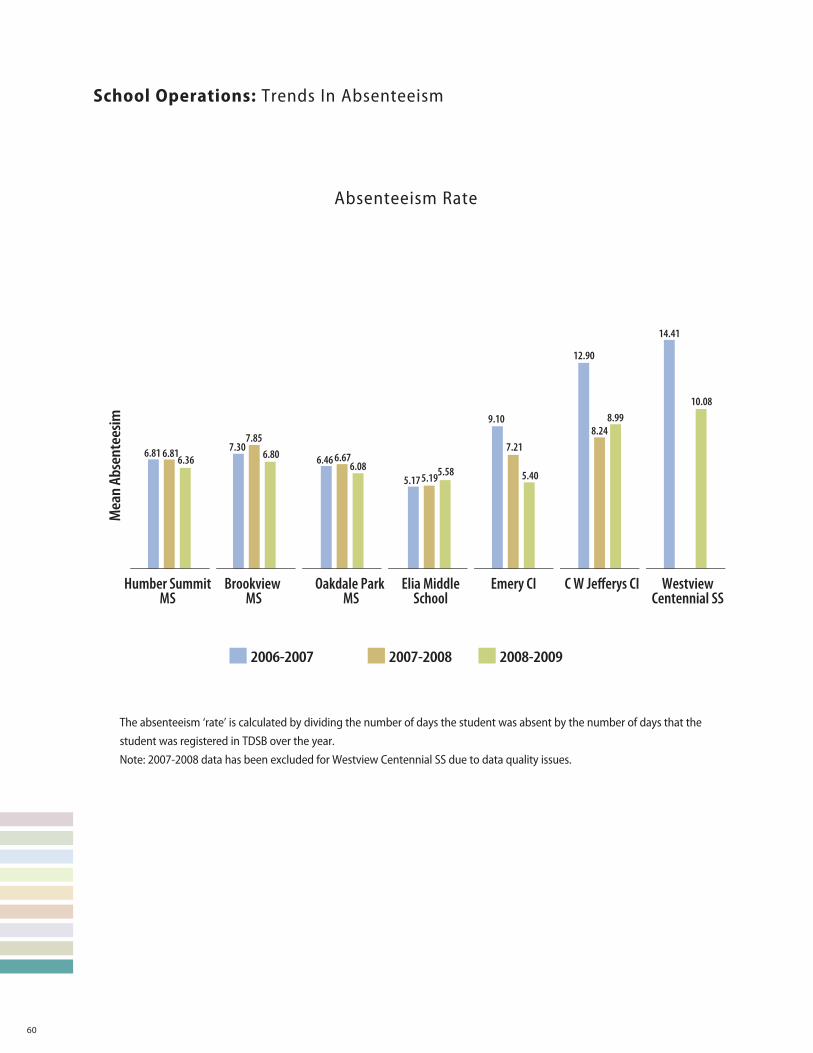
60
School�Operations:�Trends In Absenteeism �
7.857.30
6.806.086.46 6.67
5.17 5.195.58
9.10
7.21
5.40
12.90
8.998.24
14.41
10.08
6.81 6.816.36
2006-2007 2007-2008 2008-2009
Humber SummitMS
Brookview MS
Oakdale Park MS
Elia MiddleSchool
Emery CI C W Je�erys CI WestviewCentennial SS
Mea
n Ab
sent
eesim
Absenteeism Rate
The absenteeism ‘rate’ is calculated by dividing the number of days the student was absent by the number of days that thestudent was registered in TDSB over the year.Note: 2007-2008 data has been excluded for Westview Centennial SS due to data quality issues.
Copyright © (March 2012) Toronto District School Board
Reproduction of this document for use in the schools of the TorontoDistrict School Board is encouraged.
For any other purpose, permission must be requested and obtained in writing from: Research and Information Services Toronto District School Board 1 Civic Centre Court, Lower Level Etobicoke, ON M9C 2B3 Tel. : 416-394-4929 Fax: 416-394-4946
Every reasonable precaution has been taken to trace the owners of copyrighted material and to make due acknowledgement. Any omission will gladly be rectified in future printings.
R10(FeedingOurFuture\2011-12\EvaluationFOFProgram19Mar12)em.3457
THE FIRST- AND SECOND-YEAR EVALUATIONEaswaramoorthy Muthuswamy
F E E D I N G U R F U T U R E :