Embed Size (px)
Citation preview
Feeding Preferences of Abyssal Macrofauna Inferredfrom In Situ Pulse Chase ExperimentsRachel M. Jeffreys1*, Ciara Burke2¤, Alan J. Jamieson2, Bhavani E. Narayanaswamy3, Henry A. Ruhl4,
Kenneth L. Smith Jr.5, Ursula Witte2
1 School of Environmental Sciences, University of Liverpool, Liverpool, Merseyside, United Kingdom, 2 Oceanlab, University of Aberdeen, Newburgh, Aberdeenshire,
United Kingdom, 3 Ecology Department, Scottish Association for Marine Science, Scottish Marine Institute Oban, Argyll, United Kingdom, 4 National Oceanography
Centre, University of Southampton Waterfront Campus, Southampton, Hampshire, United Kingdom, 5 Monterey Bay Aquarium Research Institute, Moss Landing,
California, United States of America
Abstract
Climatic fluctuations may significantly alter the taxonomic and biochemical composition of phytoplankton blooms andsubsequently phytodetritus, the food source for the majority of deep-sea communities. To examine the response of abyssalbenthic communities to different food resources we simulated a food sedimentation event containing diatoms andcoccolithophorids at Station M in the NE Pacific. In one set of experiments we measured incorporation of diatomC and coccoNinto the macrofauna using isotopically enriched 13C-diatoms and 15N-coccolithophores. In a second experiment wemeasured incorporation of C and N from dual-labelled (13C and 15N) diatoms. The second experiment was repeated 2months later to assess the effect of seasonality. The simulated food pulses represented additions of 650 – 800 mg C m22
and 120 mg N m22 to the seafloor. In all cases rapid incorporation of tracer was observed within 4 days, with between 20%and 52% of the macrofauna displaying evidence of enrichment. However, incorporation levels of both diatomC and coccoNwere low (,0.05% and 0.005% of the added C and N). Incorporation of labelled diatoms was similar during both June andSeptember suggesting that the community was not food limited during either period. We found no evidence for selectiveingestion of the different food types in the metazoan fauna suggesting that macrofauna do not have strong preferences fordiatom vs. coccolithophore dominated phytodetrital pulses. C:N ratios from both experiments suggest that the metazoanmacrofauna community appear to have higher C demands and/or assimilation efficiencies compared to N. Concomitantly,the foraminifera preferentially selected for diatomN over coccoN, and we suggest that this may be related to foraminiferalrequirements for intracellular nitrate. These experiments provide evidence that abyssal faunal feeding strategies are in partdriven by an organism’s internal stoichiometric budgets and biochemical requirements.
Citation: Jeffreys RM, Burke C, Jamieson AJ, Narayanaswamy BE, Ruhl HA, et al. (2013) Feeding Preferences of Abyssal Macrofauna Inferred from In Situ PulseChase Experiments. PLoS ONE 8(11): e80510. doi:10.1371/journal.pone.0080510
Editor: Martin Solan, University of Southampton, United Kingdom
Received June 6, 2013; Accepted October 3, 2013; Published November 26, 2013
Copyright: � 2013 Jeffreys et al. This is an open-access article distributed under the terms of the Creative Commons Attribution License, which permitsunrestricted use, distribution, and reproduction in any medium, provided the original author and source are credited.
Funding: This work was supported by Natural Environment Research Council Grant (UK) awarded to UW and the National Science Foundation (US) and the Davidand Lucile Packard Foundation awarded to KLS. The funders had no role in study design, data collection and analysis, decision to publish, or preparation of themanuscript.
Competing Interests: The authors have declared that no competing interests exist.
* E-mail: [email protected]
¤ Current address: Marine Ecological Surveys Ltd, Bath, Somerset, United Kingdom
Introduction
The abyssal seafloor is a vast ecosystem covering ,54% of the
Earth’s surface [1]. Abyssal communities are energy limited and
rely on the input of particulate organic matter (POM) produced
through photosynthesis in the surface waters for food [2,3]. A
portion of the flux of POM is deposited at the seafloor as large
aggregates of intact phytoplankton cells known as phytodetritus
[4,5], and a tight coupling between this external food source and
abyssal benthic community structure and functioning has been
documented [6–8]. Recent time-series data from two abyssal
observatories have revealed that climate-driven variations in food
supply in terms of its timing and magnitude, has resulted in broad
changes in both community structure and ecosystem functioning
[9–11].
Energy limitation at abyssal depths (.4000 m) has led to a
reduced standing stock of macrofaunal organisms when compared
to smaller size classes i.e. bacteria and meiofauna [12]. In spite of
this the macrofauna are an important facet of abyssal communi-
ties. Macrofauna can influence organic matter processing, burial
and nutrient cycles through feeding processes [13,14], bioturba-
tion [15,16] and remineralization [17]. More recently macrofau-
nal activity (e.g. grazing and microhabitat destruction) has been
linked to lower incorporation of labelled carbon by bacteria
[18,19].
Given the connectedness of climate to deep sea systems and that
macrofaunal communities are known to be sensitive to changes in
food supply [7,9,20], the importance of understanding feeding
preferences/resource selection and the consequences for biogeo-
chemical processes in the deep sea is increasing. Macrofauna
respond within 36 hours to phytodetritus deposition by ingestion
and bioturbation [21–24]. Pulse chase experiments have demon-
strated that macrofauna can dominate the incorporation of
labelled carbon [25–27]. These experiments also show differential
utilization of phytodetritus and nutrients between macrofaunal
PLOS ONE | www.plosone.org 1 November 2013 | Volume 8 | Issue 11 | e80510

taxa [21,28–30]. Similarly, lipid distributions of deep-sea poly-
chaetes show selective ingestion of fatty acids and sterols indicative
of microalgae [31,32]. In shallower waters, pulse-chase experi-
ments have shown that macrofauna are capable of selecting for a
particular type of microalgae, i.e. ice algae over phytoplankton
[33,34]. In the deep sea little is known about macrofaunal resource
selection. While macrofauna have been shown to have long-term
variations in functional group abundances in polychaetes, for
example, the links to food supply remain unclear [35].
The long-term abyssal monitoring site ‘Station M’ in the NE
Pacific provides a good setting to study macrofaunal resource
selection. Benthopelagic coupling has been studied in detail at
Station M since 1989 [10,36]. The macrofauna are known to
respond to pulses of phytodetritus and climate-driven changes in
food supply [9,20,30]. This study aims to test the hypotheses: (1)
that macrofauna will preferentially select for a particular type of
phytodetritus (2) uptake of simulated phytodetrital pulses varies
seasonally and, (3) that processing of phytodetritus by macrofauna
will be dictated by internal biochemical (i.e. C and N) demands.
The results are discussed in the context of macrofaunal community
and food web structure.
Materials and Methods
Study siteStation M (34u509 N, 123u009 W) is located at a water depth of
ca. 4100 m in the Northeast Pacific. This site is located at the base
of the Monterey deep-sea fan, ,220 km west of Point Conception,
California. An overview of the biology, chemistry and oceanog-
raphy of Station M are given in Smith and Druffel [37]. Fluxes of
particulate organic carbon (POC) and particulate total nitrogen
(PTN) are generally highest during the spring and autumn months,
reaching up to 25 mg C m22 d21 and 3.4 mg N m22 d21,
respectively (50 metres above bottom, m.a.b.) and display high
inter-annual variability [36,38,39]. Detrital aggregates are present
at the seafloor from June to December, with highest occurrences
observed during the months of September and October [40].
Detrital aggregate organic carbon (OC) at the seafloor can reach
peaks of 161 mg C m22 with aggregates having OC and TN
values ranging from 5 to 110 mg OC g21 and 2 to 13 mg N g21,
respectively [40,41]. This study took place within the US EEZ on
the US RV Western Flyer cruise PULSE 52 (5th–10th June 2007) and
PULSE 53 (17th–24th September 2007). The experiments and
sampling were conducted as part of a routine sampling event and
no specific permission was needed for this sampling. The
experiments and sampling did not involve vertebrates or any
endangered/protected species.
Cultivation of labelled food sourcesThe centric diatoms Thalassiosira weissflogii, Chaetoceros mullerri
and Skeletonema costatum (Coscinodiscophyceae) and the coccolitho-
phore Emiliania huxleyi (Prymnesiophyceae) were chosen as food
sources as they have been observed both in the California current
spring bloom and within detrital aggregates sampled at the
seafloor at Station M [42,43]. Algae were cultured in artificial
seawater using L1 medium [44] at 16uC (light:dark = 16:8; salinity
= 35; pH = 7.8 to 8.2; duration = 21 days; [45]. The artificial
seawater medium inoculating the T. weissflogii, C. mullerri and S.
costatum was amended with 13C-bicarbonate (99% atom %
enriched NaH13CO3, Cambridge Isotope Laboratories). Similarly,
the medium inoculating E. huxleyi and S. costatum was amended
with 15N-sodium nitrate (98% atom enriched Na15NO3). Algae
were harvested by centrifugation (1500 rpm at 16uC for 15 mins)
and washed 3 times in an isotonic solution to remove excess label.
Algae were flash frozen using liquid nitrogen, N2(l) to reduce cell
damage and then lypholized. Cell sizes and the biochemical
composition of the amended food sources are given in Table 1.
Three different diatom species were used in these experiments,
which may present difficulty in comparing experimental data.
However, the biochemical composition of these three genera, are
known to be similar [46] and we feel comparisons between
diatoms (including the three species used) and coccolithophorids
are justified.
Experimental designIsotopically labelled food choice experiments were conducted in
situ using a prototype of the Oceanlab spreader mesocosms
[19,21]. Each spreader consisted of a transparent acrylic tube
(diameter: 29 cm, height 50 cm) with a centrally fixed cartridge of
isotopically labelled food sources, which is released by depressing
an elastically tensioned plunger. Spreaders were deployed by the
ROV Tiburon, releasing known doses of isotopically labelled
phytodetritus onto replicate 0.066 m22 areas of the seafloor.
During June 2007 three spreaders were deployed containing a
slurry of C. mulleri and E. huxleyi representing an addition of 0.8 g
C m22 and 0.12 g N m22, equivalent to ,40% and 58% of the
annual POC and PTN flux, at the seafloor (Experiment 1). The
fourth spreader was deployed containing the dual labelled diatom
S. costatum slurry, here an addition of 0.7 g C m22 and 0.12 g N
m22, equivalent to ,35% and 58% of the annual POC and PTN
flux, respectively was applied to the seafloor (Experiment 2).
Following this during September 2007 four replicate spreaders
were deployed containing a suspension of the diatom T. weissflogii,
representing an addition of 0.65 g C m22, equivalent to 34% of
the annual POC flux at the seafloor.
Spreaders were deployed on undisturbed areas of the seafloor
and after any resuspended sediment had settled the experiments
commenced. Experiments were terminated after four days and
sub-sampled using 70 mm diameter push cores recovered by the
ROV. Three pushcores from each spreader were retrieved in June
and a single core from each spreader in September. Cores for
macrofaunal analyses were sectioned 1 cm intervals to 5 cm in
June and at 0–2 cm and 2–5 cm in September. In order to
compare data between seasons we combined data obtained
Table 1. Biochemical composition of algal cultures used in this study.
Species Cell Size (mm) C (%) 13C (atom %) N (%) 15N (atom %) C:N
Chaetoceros muelleri 4–10 11.1 14.8 2.0 0.4 5.6
Emiliania huxleyi 4–10 7.7 1.1 0.9 7.0 8.5
Skeletonema costatum 4–10 13.8 21.7 2.6 4.6 5.3
Thalassiosira weissflogii 6–10 19.8 48.8 n.d. n.d. n.d.
doi:10.1371/journal.pone.0080510.t001
Feeding Preferences of Abyssal Macrofauna
PLOS ONE | www.plosone.org 2 November 2013 | Volume 8 | Issue 11 | e80510
(abundance, biomass, label incorporation) from the 1 cm intervals
in June to 0–2 cm and 2–5 cm for comparison with September.
Background/control push cores were taken close to the spreaders
at the start of the experiments to provide natural stable isotope
values of the macrofauna and sediments (n = 8 in June and n = 3
for September).
Sampling procedures and isotope analysesSectioned cores were wet-sieved through a 250 mm mesh, using
filtered seawater and fixed in buffered 4% formaldehyde solution.
Sections were sorted under x12 and x20 magnification. Macro-
fauna were identified to phylum/sub-phylum and polychaetes to
the lowest taxonomic level i.e. genus or species and abundances
were recorded. Macrofauna were rinsed in Milli Q water placed in
tin cups and dried at 60uC. Organisms containing calcareous parts
were decalcified in double boated silver cups with 2 M HCl and
dried as above. Cores for sediment isotopes were lyophilised prior
to analysis. Lyophilised sediments were decarbonated by addition
of excess 1 M HCl, incubated for 24 h at 30uC in an acid-fumed
environment and dried to constant weight.
Macrofaunal and sediment total C and N contents and isotopic
ratios were determined using a Flash EA 1112 Series Elemental
Analyser connected via a Conflo III to a DeltaPlus XP isotope
ratio mass spectrometer (Thermo Finnigan). Isotope ratios were
calculated with respect to CO2 and N2 reference gases injected
with each sample. Isotopic values of gases were directly referenced
against IAEA reference materials USGS40 and USGS41 (both
L-glutamic acid), both certified for d13C (%VPDB) and d15N (%air
N2). The C and N content of the samples were calculated from the
area output of the mass spectrometer calibrated against the
National Institute of Standards and Technology (NIST) standard
reference material 1547 peach leaves, which was analysed with
every batch of ten samples. Long-term isotope measurement
precisions relative to a quality control standard (milled flour) were:
total C = 40.360.42%, d13C = 225.560.29%, total N = 1.76
0.04% and d15N = 0.36760.0002% (mean 6 SD, n = 200).
Isotope ratio data were expressed in d units (%) and used to
estimate faunal 13C and 15N uptake and incorporation.
Owing to natural variation observed in the natural abundance
stable isotopic data in both this study and that of Sweetman &
Witte [30], fauna from the experiments were considered to be
enriched in 13C and 15N when their isotopic composition was
.214% and .20%, respectively. Nematodes and foraminifera
had high natural d15N values and were considered to be enriched
in 15N if their isotopic composition was .25%. Foraminifera also
had isotopically heavy natural d13C values and were therefore
considered to be enriched in 13C when their signatures were
.25%.
Enrichment of 13C or 15N in macrofauna was calculated as
excess above natural abundance levels and is expressed as specific
uptake: Dd= (dsample – dbackground). Specific uptake is a qualitative
measure of label uptake based on isotope ratio data. Incorporation
of 13C and 15N into faunal biomass is a quantitative measure [23]
and was calculated as the product of the excess atom % of 13C or15N (difference in atom %13C or 15N between sample and
background) and C or N content (expresses as unit weight): 13C or15N incorporation (unit wt13C or 15N) = (atom% 13Csample or15Nsample – atom % 13Cbackground or 15Nbackground) 6 (unit wt C or
N of organism). Incorporation of 13C or 15N was then adjusted to
account for algal labeling, yielding total C or N uptake: uptake
(unit wt C or N) = 13C or 15N incorporation/15 atom % (for 13C
labelled diatoms) or 7 atom % (for 15N labelled coccolithophores).
The data used in the incorporation and biomass specific
calculations are given in Tables S1 to S3.
Unfortunately, d15N analysis was not conducted on the
polychaetes from Exp. 2. Only the elemental C and d13C values
were determined on fauna from September.
Data analysesThe multivariate community data on major groups (standard-
ized fourth root transformed, Bray-Curtis similarity was used to
calculate resemblance) was analysed by means of non-parametric
permutational (9999 permutation) ANOVA (PERMANOVA),
[47,48] to assess differences between controls and experimental
cores, between seasons and between sediment layers. The data set
was analysed using a 3-factor mixed model design factors:
Treatment (experiment or control) - fixed Season - fixed and
Sediment Depth - fixed in PERMANOVA+ for PRIMER. For the
experimental data each organism analysed represented a data
point in the matrices.
Isotope data from the June experiments were analysed in
PERMANOVA. Models were run on normalized fourth root
transformed, Euclidean distance similarity matrices. The d13C and
d15N tracer incorporation data from the two experiments (Exp. 1
diatomC and coccoN; Exp.2 diatomC and diatomN) was analysed by
using mixed model designs to assess (1) if there were differences in
incorporation of C and N between Exps.1 and 2, (2) if there were
differences in the incorporation of C and N between taxa and (3) if
there were differences in incorporation between sediment layers.
Model factors include: Experiment - fixed, Taxonomic group -
fixed and Sediment Depth - fixed. The taxonomic groups analysed
in the model included: Foraminifera, Nematoda and Crustacea.
The data were classified into two sediment layers: 0 to 2 cm and 2
to 5 cm.
The response of the polychaetes to the food choice experiments
were examined by means of a 2 factor mixed model to assess (1) if
there were differences in the incorporation of C and N at the
family level (2) if there were differences in incorporation between
sediment layers. Model factors include: Polychaete family - fixed
and Sediment Depth - fixed. Differences between polychaete
feeding type - fixed were analysed separately in a 1-factor model
with unrestricted permutation of the raw data. Differences in
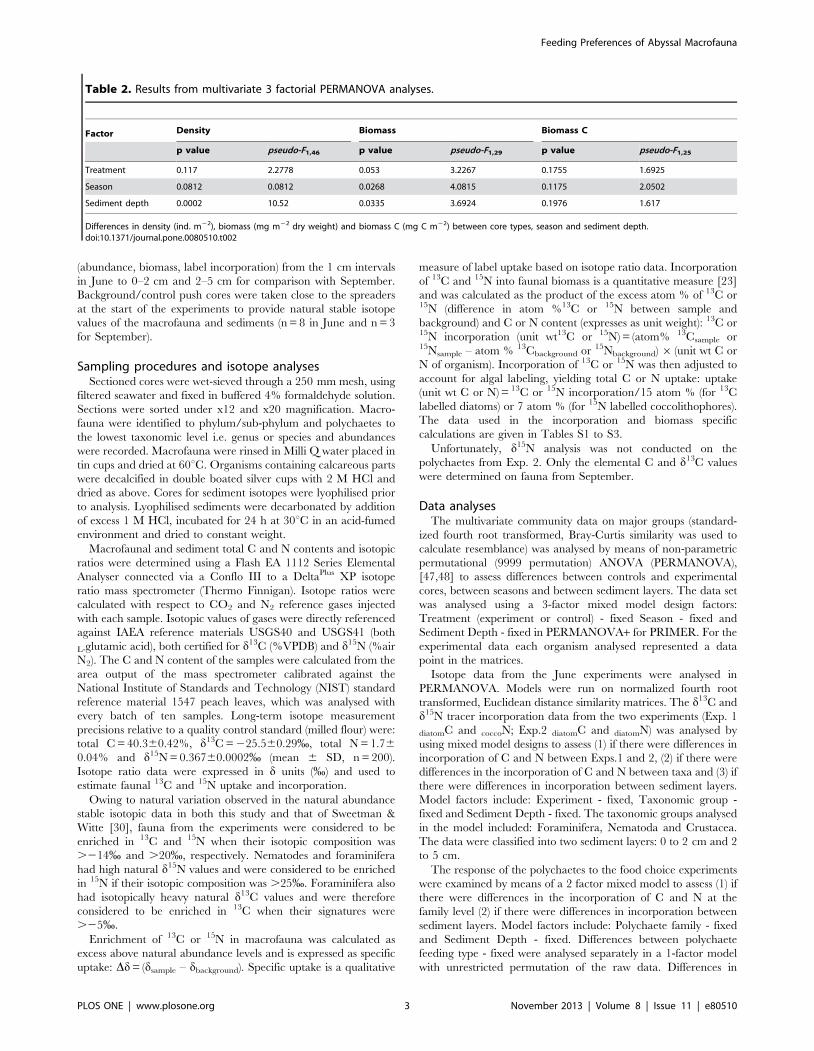
Table 2. Results from multivariate 3 factorial PERMANOVA analyses.
Factor Density Biomass Biomass C
p value pseudo-F1,46 p value pseudo-F1,29 p value pseudo-F1,25
Treatment 0.117 2.2778 0.053 3.2267 0.1755 1.6925
Season 0.0812 0.0812 0.0268 4.0815 0.1175 2.0502
Sediment depth 0.0002 10.52 0.0335 3.6924 0.1976 1.617
Differences in density (ind. m22), biomass (mg m22 dry weight) and biomass C (mg C m22) between core types, season and sediment depth.doi:10.1371/journal.pone.0080510.t002
Feeding Preferences of Abyssal Macrofauna
PLOS ONE | www.plosone.org 3 November 2013 | Volume 8 | Issue 11 | e80510

polychaete d13C tracer incorporation between the two experi-
ments were analysed by means of a 1-factor model, experiment -
fixed with unrestricted permutation of the raw data.
The same data analysis procedures were carried out in
PERMANOVA on both the biomass specific incorporation results
and on the natural abundance C:N ratios, d13C and d15N values of
the fauna from the control cores.
Univariate data, e.g. sediment 13C values and incorporation
of diatom carbon during the September experiments were
tested for normality and eveness (Shapiro-Wilk’s and Levene’s
Figure 1. Vertical distribution of: macrofaunal metazoan abundance during (a) June and (b) September; macrofaunal biomass (mgdry weight m22) during (c) June and (d) September; macrofaunal biomass (mg C m22) during (e) June and (f) September; andmacrofaunal biomass (mg N m22) during (g) June. Bars represent means 61 standard deviation, n = 20 for June and 7 for September.doi:10.1371/journal.pone.0080510.g001
Feeding Preferences of Abyssal Macrofauna
PLOS ONE | www.plosone.org 4 November 2013 | Volume 8 | Issue 11 | e80510
tests, respectively). If the data met these assumptions differences
between factors e.g. taxon or sediment depth were tested for
using a one-way analysis of variance was used (ANOVA) and if
the data were not normally or evenly distributed then a
Kruskal-Wallis or a Mann-Whitney U-test was applied.
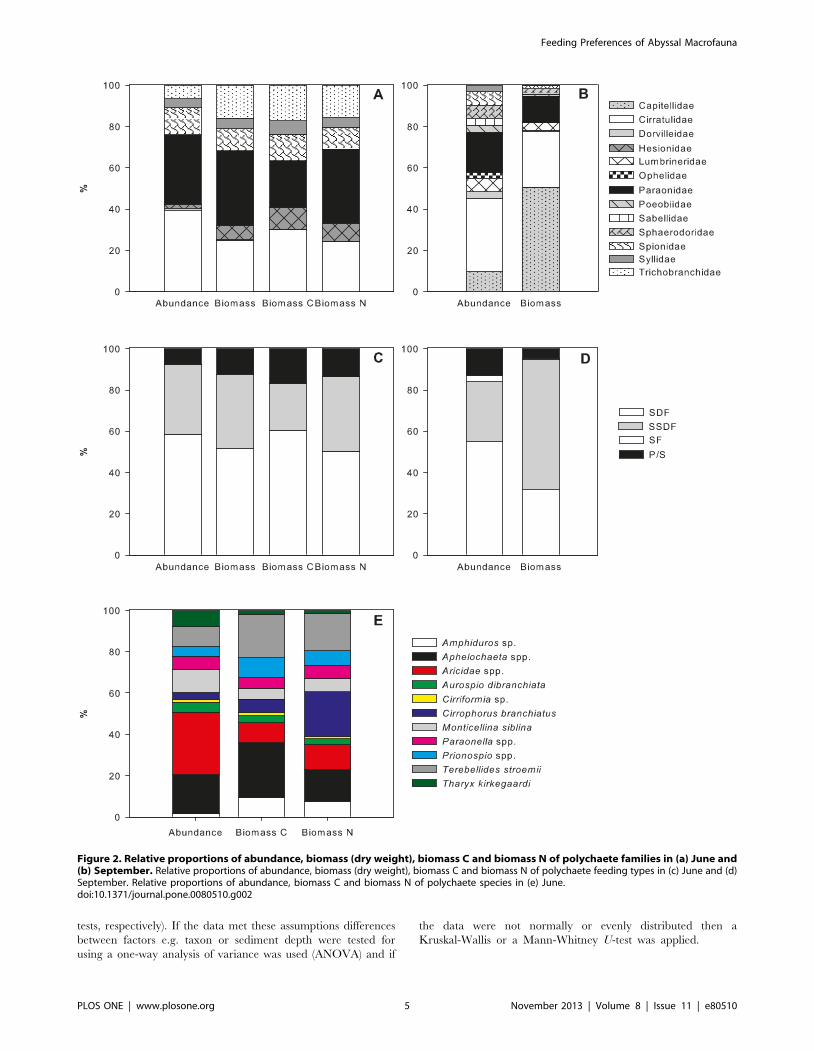
Figure 2. Relative proportions of abundance, biomass (dry weight), biomass C and biomass N of polychaete families in (a) June and(b) September. Relative proportions of abundance, biomass (dry weight), biomass C and biomass N of polychaete feeding types in (c) June and (d)September. Relative proportions of abundance, biomass C and biomass N of polychaete species in (e) June.doi:10.1371/journal.pone.0080510.g002
Feeding Preferences of Abyssal Macrofauna
PLOS ONE | www.plosone.org 5 November 2013 | Volume 8 | Issue 11 | e80510

Results
Macrofaunal assemblageDescription of the macrofaunal community structure at Station
M was based upon specimens recovered from both background
and experimental cores (n = 20 for June and n = 7 for September)
and each core was treated as a single replicate. There was no
significant difference in the macrofaunal density, biomass dry
weight or biomass C normalised to m2 between background cores
and the experimental cores from each spreader (Table 2). There
was no significant difference in density (ind. m22) between seasons
(Fig. 1a & 1b, Table 2). There were significant differences in
density between sediment depths (Fig. 1a & 1b, Table 2). Simper
analyses revealed, foraminifera and crustaceans were responsible
for ,38% and 19% of the variation in density between sediment
depths, respectively. The majority (,80%) of foraminifera were
located at 2–5 cm, whilst 58% of crustaceans were located in the
upper 2 cm of the sediment (Fig. 1a & 1b). Macrofaunal biomass
(dry weight mg m22) did vary significantly between both seasons
and horizons (Fig. 1c &1d, Table 2). Foraminifera and molluscs
accounted for 32% and 26% of the seasonal variation and 34%
and 25% of the variation between sediment depths. There were no
significant differences in biomass C between seasons or sediment
depths (Fig. 1e & 1f, Table 2).
The foraminifera were numerically dominant representing
.70% of the community. The majority of foraminifera in the
samples were agglutinated and calcareous species e.g. Globobulimina
and Cyclammina. The nematodes represented ,10% of the total
macrofaunal community. Crustaceans were the dominant meta-
zoan macrofaunal group followed by the polychaetes accounting
for .70% and ,15%, of the metazoan density respectively.
Conversely, the polychaetes were the dominant taxon in terms of
biomass C and N (Fig. 1e, &1g).
A total of 23 polychaete species were identified from the June
experiments. Polychaete families were numerically dominated by
the Cirratulidae and Paraonidae (Fig. 2a & 2b). Dominant species
within the cirratulids were Aphelochaeta spp. and Monticellina siblina
Figure 3. Natural stable isotopic signatures of sediments and macrofauna at Station M, (a) d13C in % (b) d15N in % and (c) C:N ratios,dotted line represents C:N ratio of POM flux at 50 m.a.b. and solid line represents C:N ratio of surface sediments. Data are means (61standard deviation) from a series of 8 pushcores. For the sediments and foraminifera black symbols represent surface samples (0–2 cm) and greysymbols represent sub-surface samples (2–5 cm).doi:10.1371/journal.pone.0080510.g003
Table 3. Results from multivariate 2 factorial PERMANOVA analyses.
Factor d13C d15N C/N
p value pseudo-F4,50 p value pseudo-F4,35 p value pseudo-F4,28
Taxonomic group 0.001 26.979 0.00225 3.3417 0.0001 12.948
Sediment depth 0.0014 16.303 0.00226 6.3059 0.0181 6.9236
TG vs. SD 0.0001 46.561 0.7744 0.44278 0.0947 2.2668
Differences in d13C and d15N signatures and C/N ratios between taxonomic groups (TG) and sediment depths (SD).doi:10.1371/journal.pone.0080510.t003
Feeding Preferences of Abyssal Macrofauna
PLOS ONE | www.plosone.org 6 November 2013 | Volume 8 | Issue 11 | e80510

(Fig. 2e). The dominant genus within the paraonids was Aricidea
spp.. In terms of biomass cirratulids and paraonids were still
important but a few families with large-sized individuals became
significant contributors to total biomass C and N e.g. Tricho-
branchidae and Hesionidae (Fig. 2a).
Polychaetes were classified into feeding types according to
Fauchald and Jumars [49], and were dominated by surface deposit
feeders (SDF; Fig. 2c & 2d) and subsurface deposit feeders (SSDF).
In terms of biomass C and N SDF were the most important group
followed by SSDF. Surface deposit feeding polychaetes were
Figure 4. Mean incorporation mg C m22 or mg N m22 (±1 standard deviation) of (a) diatomC from Exp. 1 in June; (b) diatomC from Exp. 2in June; (c) diatomC from September; (d) coccoN from Exp. 1; (e) diatomN from Exp. 2. Vertical distribution of (f) phytoC and (g) phytoN. In plots fand g, dark grey bars represent incorporation from Exp. 1, light grey bars represent incorporation from Exp. 2 and white bars represent meanincorporation of tracer from September. Note the data presented from Exp. 2 in June represents total incorporation mg C m22 or mg N m22. Numberof replicates in Exp. 1 = 3 and Exp. 2 = 1 and September = 3.doi:10.1371/journal.pone.0080510.g004
Feeding Preferences of Abyssal Macrofauna
PLOS ONE | www.plosone.org 7 November 2013 | Volume 8 | Issue 11 | e80510
represented by the cirratulids, spionids and trichobranchids. The
subsurface deposit feeders contained paraonids and capitellids.
Predator/scavengers included hesionids, dorvilleids, lumbrinerids
and syllids.
Background isotope levels and food web structureThe natural abundance d13C, d15N values and C:N ratios of
sediments and fauna are summarised in Fig. 3. No significant
difference in the isotopic composition of the sediments was
observed between depths (Figs. 3a, 3b; d13C Mann-Whitney U
test: p = 0.245; d15N F1,6 = 0.801, p = 0.405). There was no
significant difference in faunal d13C composition between June
and September (Mann-Whitney U-test: p = 0.981) and so data in
Fig. 3a include d13C values of fauna from both June and
September. Faunal carbon and nitrogen isotopes exhibited wide
ranges in values, particularly within the foraminifera. The majority
of consumers were enriched in 13C and 15N compared to surficial
sediments (Fig. 3a, 3b).
Values of d13C were significantly different between taxonomic
group and sediment depth and these factors interacted (Fig. 3a,
Table 3). Pairwise comparisons (Table S4) revealed that
polychaetes were significantly enriched in 13C compared to
crustaceans and nematodes in both sediment depths i.e. 0–2 cm
and 2–5 cm. Foraminiferans were significantly enriched in 13C
compared to all taxa in the 2–5 cm sediment layer. Foraminifera
in surface sediments were significantly depleted in 13C compared
to deeper sediments (PERMANOVA p = 0.002, t = 9.39, unique
perms = 700). Deeper living crustaceans were significantly deplet-
ed in 13C compared to surface dwellers (p = 0.001, t = 9.3932,
unique perms = 1287).
There were significant differences in d15N values between
taxonomic groups and sediment depth (Fig. 3b, Table 3.) Pairwise
comparisons revealed that polychaetes were significantly enriched
in 15N compared to crustaceans and foraminifera. Fauna found
deeper in the sediment were significantly lighter compared to those
in the upper 2 cm (mean d15N = 13.463.9% for 0–2 cm and
11.463.0% for 2–5 cm). There were significant differences in C:N
ratio between taxonomic groups and sediment depth (Fig. 3c,
Table 3). Pairwise comparisons revealed that foraminifera had
significantly higher C:N ratios than all other taxa (Table S5).
Fauna in the upper 2 cm of the sediment had lower C:N ratios
than those living deeper (mean C:N = 4.761.5 for 0–2 cm and
7.965.2 for 2–5 cm).
Macrofaunal response to different food sourcesIncorporation of phytodetrital C and N. Rapid ingestion
of label occurred in all experiments. During June in Exp. 1,25%
and 20% of the animals analysed had incorporated 13C and 15N,
respectively. In Exp. 2,52% and 42% of the animals analysed
had incorporated 13C and 15N, respectively. During September
,49% of the animals analysed had incorporated 13C. No
significant difference in label incorporation between taxonomic
groups (foraminifera, nematoda and crustacea) was evident (Fig. 4,
for June see Table 4; for September including all groups, Kruskal-
Wallis: p = 0.218). Significant differences were noted between
sediment depths in June (Table 4), .75% of algal carbon and
nitrogen was incorporated in the upper 2 cm of the sediment
(Fig. 4f–g). No significant difference in algal carbon incorporation
was noted in September (Mann-Whitney U-test: p = 0.067, Fig. 4f–
g). There was no significant difference in incorporation of diatom
carbon between June (Exp. 2) and September (Mann-Whitney U-
test: p = 0.413; Fig. 4b & 4c).
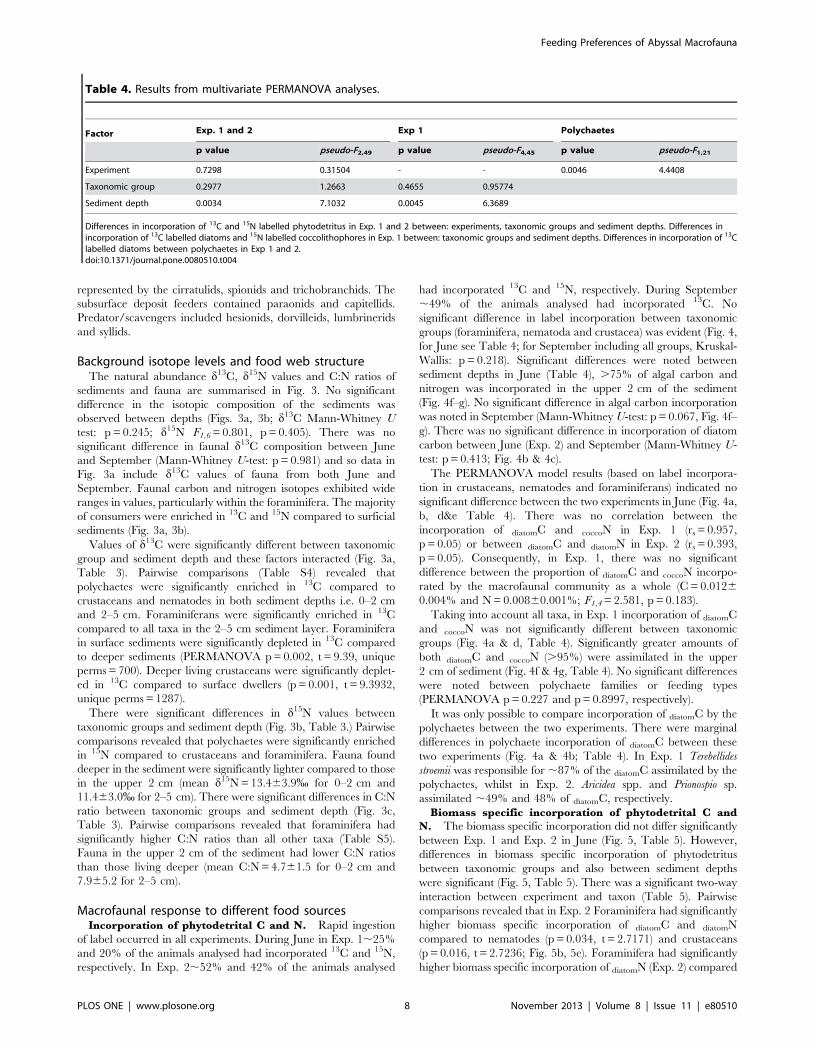
The PERMANOVA model results (based on label incorpora-
tion in crustaceans, nematodes and foraminiferans) indicated no
significant difference between the two experiments in June (Fig. 4a,
b, d&e Table 4). There was no correlation between the
incorporation of diatomC and coccoN in Exp. 1 (rs = 0.957,
p = 0.05) or between diatomC and diatomN in Exp. 2 (rs = 0.393,
p = 0.05). Consequently, in Exp. 1, there was no significant
difference between the proportion of diatomC and coccoN incorpo-
rated by the macrofaunal community as a whole (C = 0.0126
0.004% and N = 0.00860.001%; F1,4 = 2.581, p = 0.183).
Taking into account all taxa, in Exp. 1 incorporation of diatomC
and coccoN was not significantly different between taxonomic
groups (Fig. 4a & d, Table 4). Significantly greater amounts of
both diatomC and coccoN (.95%) were assimilated in the upper
2 cm of sediment (Fig. 4f & 4g, Table 4). No significant differences
were noted between polychaete families or feeding types
(PERMANOVA p = 0.227 and p = 0.8997, respectively).
It was only possible to compare incorporation of diatomC by the
polychaetes between the two experiments. There were marginal
differences in polychaete incorporation of diatomC between these
two experiments (Fig. 4a & 4b; Table 4). In Exp. 1 Terebellides
stroemii was responsible for ,87% of the diatomC assimilated by the
polychaetes, whilst in Exp. 2. Aricidea spp. and Prionospio sp.
assimilated ,49% and 48% of diatomC, respectively.
Biomass specific incorporation of phytodetrital C and
N. The biomass specific incorporation did not differ significantly
between Exp. 1 and Exp. 2 in June (Fig. 5, Table 5). However,
differences in biomass specific incorporation of phytodetritus
between taxonomic groups and also between sediment depths
were significant (Fig. 5, Table 5). There was a significant two-way
interaction between experiment and taxon (Table 5). Pairwise
comparisons revealed that in Exp. 2 Foraminifera had significantly
higher biomass specific incorporation of diatomC and diatomN
compared to nematodes (p = 0.034, t = 2.7171) and crustaceans
(p = 0.016, t = 2.7236; Fig. 5b, 5e). Foraminifera had significantly
higher biomass specific incorporation of diatomN (Exp. 2) compared
Table 4. Results from multivariate PERMANOVA analyses.
Factor Exp. 1 and 2 Exp 1 Polychaetes
p value pseudo-F2,49 p value pseudo-F4,45 p value pseudo-F1,21
Experiment 0.7298 0.31504 - - 0.0046 4.4408
Taxonomic group 0.2977 1.2663 0.4655 0.95774
Sediment depth 0.0034 7.1032 0.0045 6.3689
Differences in incorporation of 13C and 15N labelled phytodetritus in Exp. 1 and 2 between: experiments, taxonomic groups and sediment depths. Differences inincorporation of 13C labelled diatoms and 15N labelled coccolithophores in Exp. 1 between: taxonomic groups and sediment depths. Differences in incorporation of 13Clabelled diatoms between polychaetes in Exp 1 and 2.doi:10.1371/journal.pone.0080510.t004
Feeding Preferences of Abyssal Macrofauna
PLOS ONE | www.plosone.org 8 November 2013 | Volume 8 | Issue 11 | e80510

to coccoN (Exp. 1: p = 0.039, Fig. 5d & 5e). In Exp. 1 there were no
significant differences in biomass specific incorporation of diatomC
and coccoN between taxonomic groups (Fig. 5a & 5d; p = 0.232,
t = 1.9953). Biomass specific C incorporation of the polychaetes
was not significantly different between experiments, families or
feeding types (p = 0.071, p = 0.783 and p = 0.918, respectively,
Fig. 5a & 5b). There was no significant difference in biomass
specific incorporation of diatom C between June (Exp.2) and
September (Mann-Whitney U-test: p = 0.801; Fig. 5b & 5c). No
significant differences between taxonomic groups were noted in
biomass specific incorporation of diatom C in September (Kruskal-
Wallis: p = 0.333; Fig. 5c). There was no significant difference in
biomass specific incorporation of diatom C between sediment
depths in September (Mann-Whitney U-test: p = 0.059; Fig. 5f).
C:N Stoichiometry. Absolute incorporation C:N ratios in
June (Exps. 1 and 2) ranged from 2.3 to 367 (Fig. 6b & 6e).
Figure 5. Mean biomass specific uptake mg C mg21 or mg N mg21 (±1 standard deviation) of (a) diatomC from Exp. 1 in June; (b)
diatomC from Exp. 2 in June; (c) diatomC from September; (d) coccoN from Exp. 1; (e) diatomN from Exp. 2. Vertical distribution of biomassspecific uptake of (f) phytoC and (g) phytoN. In plots f and g, dark grey bars represent incorporation from Exp. 1, light grey bars represent incorporationfrom Exp. 2 and white bars represent mean incorporation of tracer from September. Note the data presented from Exp. 2 in June represents totalbiomass specific uptake mg C mg21 or mg N mg21. Number of replicates in Exp. 1 = 3 and Exp. 2 = 1 and September = 3.doi:10.1371/journal.pone.0080510.g005
Feeding Preferences of Abyssal Macrofauna
PLOS ONE | www.plosone.org 9 November 2013 | Volume 8 | Issue 11 | e80510

Biomass specific C:N ratios ranged from 0.23 to 45.54 (Fig. 6c &
6f). The largest ranges in somatic C:N ratios were seen in the
foraminifera (Fig. 6d). As a result of the small number of organisms
that simultaneously ingested 13C and 15N phytodetritus we were
unable to test for significant differences in absolute incorporation
and biomass specific C:N ratios. Somatic C:N ratios from both
control and experimental cores were not significantly different
(Table 5). Significant differences were observed in somatic C:N
ratios between taxonomic groups (Table 5). Foraminfera had
higher C:N ratios than all other taxa (Figs. 3c, 6a, 6d; Table 5).
Discussion
Macrofaunal assemblageFluxes of POC and PTN to the seafloor were both reaching
seasonal highs leading up to and during this study (Fig. 7).
Concomitantly, estimates of macrofaunal densities were high but
comparable to estimates made by Drazen et al. [20], when
particulate fluxes were of a similar magnitude (12 –18 mg C m22
d21 at 600 m.a.b.) and exceeded estimates made by Sweetman
and Witte [30] during a period of low particulate flux (,8 mg C
m22 d21 at 600 m.a.b.). The macrofaunal community at Station
M during this study may not be food limited as natural food inputs
via particulate organic matter flux are at or near the seasonal high.
Faunal biomass (relative to C and N) was comparable to estimates
for the Whittard canyon and Indian margin [19,21]; both of the
aforementioned study sites are environments sustained by an
abundance of organic matter.
Food availability can influence community composition [9].
Community composition (in terms of density) during this study
resembled the community described by Drazen et al. [20] and
Sweetman and Witte [30]. Switches in the dominant taxonomic
groups with respect to biomass were noted in the community
composition between periods of high (this study) and low [30] food
availability, as well as over longer time scales [9].
The biomass of the foraminifera increased between June and
September and significant inputs of POC were observed at Station
M from May to September (Fig. 7), which may have been
responsible for this increased biomass. Foraminifera are known to
respond rapidly to inputs of fresh POC through reproduction and
growth [3,50,51].
The polychaete community composition is also further evidence
of high food availability at Station M during June 2007. The three
dominant families, Cirratulidae, Paraonidae and Spionidae are
known to be opportunistic and respond quickly to organic
enrichment [28,52].
Macrofaunal feeding preferencesMacrofaunal stable carbon isotope ratios indicate that the basal
food resource is organic C originating from the particulate flux.
Macrofaunal d13C values closely mirrored those of the sediments
and previous measurements on POC [53]. This can be confirmed
by the ingestion of labelled phytodetritus in the experiments.
Faunal incorporation of labelled phytodetritus in all experi-
ments was low ,0.005%, and in agreement with previous pulse
chase experiments at Station M [30]. At the time of this study
Station M did not appear to be food-limited and so the low
incorporation of labelled phytodetritus may be a result of satiation
of the macrofaunal community or provide evidence of dependence
on semi-labile detritus, as demonstrated for the PAP macrofaunal
community [54]. The majority of labelled phytodetritus was
incorporated in the upper 2 cm of the sediment, in agreement with
previous pulse chase studies at abyssal sites and demonstrating that
surface deposit feeding community is relatively more important in
the processing of OM in abyssal settings than the deeper dwelling
fauna [29,30]. A conspicuous facet of the macrofaunal community
at Station M is the opposing zonation of the metazoans and the
forminifera. This suggests that the surface dwelling metazoans may
play a more substantial role in OM processing at Station M, results
from the diatom only treatment support this.
In the diatom treatments incorporation of label by the
metazoan macrofauna was an order of magnitude higher
compared to the mixed algal treatment. This discrepancy may
be a result of experimental design as we were unable to trace the
amount of coccoC incorporated by the fauna in the mixed algal
treatment. Foraminiferal incorporation of carbon was also
comparable during both sampling periods. The response of the
foraminifera in this study was muted compared to the response
observed by Enge et al. [55], at the same site and to foraminifera
in other areas e.g. the Indian and Pakistan margins, Sagami Bay
[27,56,57]. The study of Enge et al. [55] considered foraminifera
larger than 250 mm and macrofaunal foraminifera are known to
exhibit a retarded response to phytodetritus when compared with
smaller foraminifera [58]. Despite the retarded response the
proportion of carbon processed by the foraminifera compared to
metazoans was high, up to 46% and 90% of the C added in June
and September, respectively and is in agreement with previous
studies in the N. Atlantic [26,59]. The majority (.70%) of tracer
uptake was observed in foraminifera in the top 2 cm of sediment,
this suggests that: (1) surface dwelling foraminifera are important
in carbon processing or (2) deeper dwelling foraminifera migrate in
the sediment towards the added food source. Migration of
foraminifera towards simulated food pulses has been reported
previously; by Nomaki et al. [57] and Koho et al. [51]. This seems
likely given that the majority of foraminifera in terms of density
and biomass were concentrated at 2–5 cm.
Macrofaunal d15N values differed between taxonomic groups
indicating that fauna were feeding at different trophic levels and
that there is a degree of niche separation between taxon at Station
M. Assuming a trophic enrichment factor of 2.2% to 3.4%[60,61], foraminifera appear to feed both on relatively depleted
POM at the base of the food web and more degraded material.
Nematodes and crustaceans were more enriched in 15N as has
been previously observed at the Porcupine abyssal plain [62],
indicating that they either feed at a higher trophic level or on other
food sources e.g. degraded POM or bacteria. Crustaceans are
known to prey on foraminifera [63]. Whilst, some studies have
shown that nematodes have been shown to preferentially feed on
Table 5. Results from multivariate 3 factorial PERMANOVAanalyses.
Factor Biomass Specific C/N ratios
p value pseudo-F2,49 p value pseudo-F4,93
Experiment 0.6869 0.37233 0.7712 0.22633
Taxonomicgroup
0.0093 3.9875 0.0001 18.98
Sedimentdepth
0.0011 9.9486 - -
EXP vs. TG 0.0026 3.0641 - -
Differences in biomass specific incorporation of 13C and 15N labelledphytodetritus in Exp. 1 and 2 between: experiments, taxonomic groups andsediment depths. And results from multivariate 2 factorial PERMANOVAanalyses. Differences in somatic C:N ratios of macrofauna between: controls andexperiments (EXP) and taxonomic groups (TG).doi:10.1371/journal.pone.0080510.t005
Feeding Preferences of Abyssal Macrofauna
PLOS ONE | www.plosone.org 10 November 2013 | Volume 8 | Issue 11 | e80510
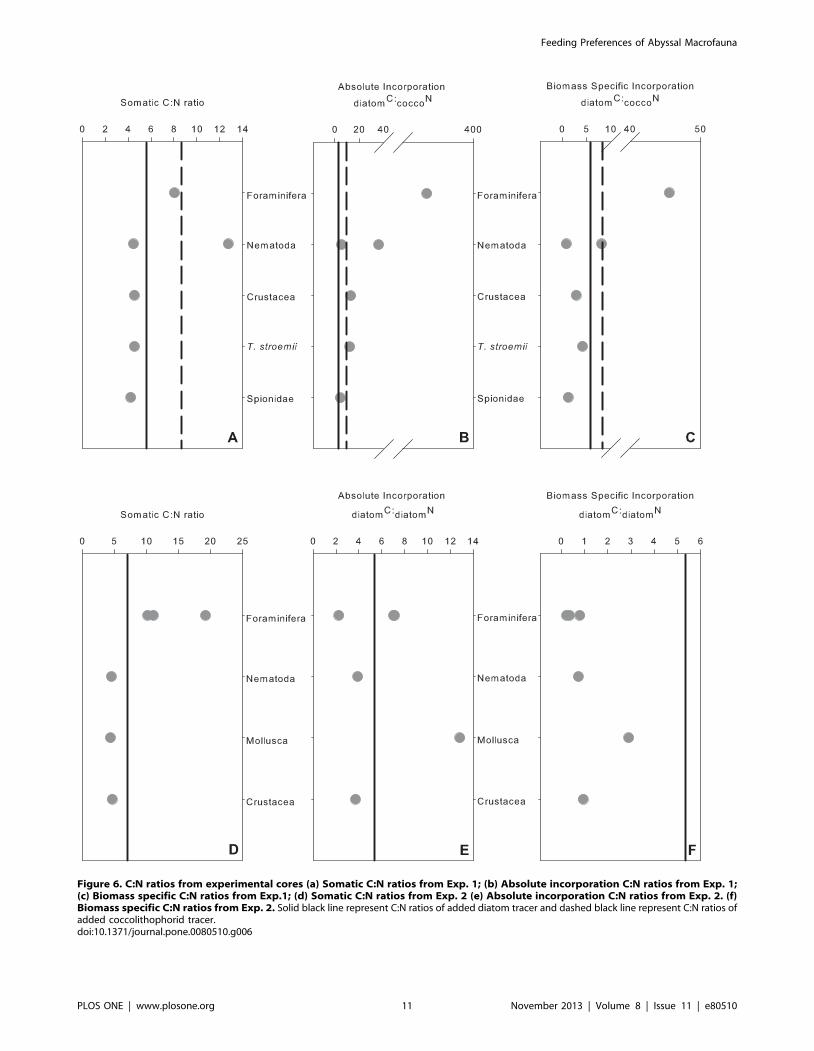
Figure 6. C:N ratios from experimental cores (a) Somatic C:N ratios from Exp. 1; (b) Absolute incorporation C:N ratios from Exp. 1;(c) Biomass specific C:N ratios from Exp.1; (d) Somatic C:N ratios from Exp. 2 (e) Absolute incorporation C:N ratios from Exp. 2. (f)Biomass specific C:N ratios from Exp. 2. Solid black line represent C:N ratios of added diatom tracer and dashed black line represent C:N ratios ofadded coccolithophorid tracer.doi:10.1371/journal.pone.0080510.g006
Feeding Preferences of Abyssal Macrofauna
PLOS ONE | www.plosone.org 11 November 2013 | Volume 8 | Issue 11 | e80510

bacteria [64,65], there is also evidence that nematodes do not
select for bacterial food sources [66]. Further to this, d13C values
of nematodes mirrored those of the sediments, suggesting a
sedimentary food source. The enrichment of 15N in the nematodes
at Station M could result from predation, which has been recently
observed in Arctic nematodes [67]. Polychaetes and molluscs were
at the apex of the macrofaunal food web at Station M and the
associated large ranges in d15N values suggests a degree of
omnivory in their diets [68].
There was no difference in incorporation of labelled phytode-
tritus between the metazoan taxonomic groups during the pulse
chase experiments. This is a surprising result given the taxonomic
differences in metazoan macrofaunal feeding strategies evident
from the natural abundance d13C and d15N values. Closer
inspection of the polychaete species in this study reveals a
community of highly selective deposit feeders e.g. Terebellides
stroemii, Prionospio spp., Tharyx kirkegaardi and Aricidea spp.. Evidence
from the food web analysis and pulse chase experiments indicates
that there is a high degree of plasticity in polychaete feeding
strategies at Station M in agreement with the findings of
Sweetman and Witte [30].
Dual labelling multiple food sources allows for direct appraisal
of selectivity of the macrofaunal community for specific algae
when present simultaneously e.g. Herman et al. [69]. As a result of
our labelling techniques food sources were significantly enriched in13C and 15N compared to non-labelled food sources (Table 2),
therefore the isotope mixing model approach used by Herman et
al. [61] was not appropriate here. Station M is a food-limited
environment, receiving significant food inputs once a year
following a spring phytoplankton bloom. We suggest that if the
suspected selectivity among algal food sources is indeed important,
it may only be evident during certain times. Phytodetritus is
usually present at Station M during late Summer and early
Autumn. We did not find evidence of metazoan macrofauna
selecting for a particular type of phytodetritus at Station M. In our
experiments the proportions of diatomC and coccoN incorporated by
the macrofaunal community in the mixed feeding experiments
were similar. Futhermore, there was no significant difference in the
incorporation of C or N between the mixed feeing experiments or
the diatom only treatment and uptake of C and N was not
correlated (section 3.3.1.). This suggests that macrofauna do not
select for a particular type of phytoplankton when phytodetritus is
readily available. Results from the diatom only treatment revealed
that metazoans were not incorporating C and N simultaneously
(Table S2), suggesting that organism stoichiometry must be
considered when interpreting experimental isotope tracer data.
Macrofaunal C:N StoichiometryTaxonomic differences in C:N ratios were observed at Station
M, foraminifera having the highest C:N ratios indicating that
foraminifera may have a higher demand for C and/or have higher
C assimilation efficiencies. This is not a surprising result given that
foraminifera grow and reproduce over short temporal scales in the
presence of phytodetritus [3,50,51]. In this study somatic C:N
ratios of metazoans ranged from 3 to 9, a single nematode had a
value of 12. Faunal demands for C and N are driven by energy
requirements for somatic growth and reproduction and are
balanced against excretion of nitrogenous waste [70]. Somatic
tissues of marine invertebrates are dominated by protein and
somatic C:N ratios follow those of amino acids i.e. ranging from
1.5 to 9 [71]. Most marine invertebrates exhibit C:N ratios
ranging from 3 to 8, e.g. [63,71,72]. Organisms adapt their
feeding strategies in order to maintain nutrient consumption at an
optimum level in order to achieve stoichiometric homeostasis
[73,74]. In doing so, the resulting C:N ratios observed in
organisms are often species-specific being regulated by a species
physiology [70].
Figure 7. Particulate fluxes at Station M from January to December 2007. Filled circles and open triangles represent the carbon andnitrogen fluxes respectively. Grey-filled squares represent the C/N ratio of flux material. Solid and dashed lines represent flux material from sedimenttraps moored 600 m.a.b and 50 m.a.b., respectively. There is no data available from the 50 m.a.b. trap from August to November.doi:10.1371/journal.pone.0080510.g007
Feeding Preferences of Abyssal Macrofauna
PLOS ONE | www.plosone.org 12 November 2013 | Volume 8 | Issue 11 | e80510

Based on incorporation of tracer, these experiments suggest that
faunal demand and/or assimilation of C is higher than for N. In the
dual-labelled diatom treatment incorporation of C by metazoans
and foraminifera was an order of magnitude higher than for N
(,0.05% of added C was incorporated compared to 0.004% for N).
Our results are in agreement with those for the Indian margin,
where in an experiment tracing the fate of dual labelled (13C and15N) diatoms, more C was processed relative to N [21]. However,
the phytoC:phytoN ratios for biomass incorporation coupled to the
somatic C:N ratios demonstrate a preference for N as has been
shown by Hunter et al. [21]. The higher phytoC:phytoN ratios for
absolute assimilation compared to the lower biomass specific ratios
may indicate preferential consumption/assimilation of carbon rich
molecules such as carbohydrates and lipids as has been previously
observed in shallow water corals, calanoid copepods and deep-sea
foraminifera [75–77]. Furthermore, ammonotelic organisms may
rapidly excret phytoN resulting in higher absolute assimilation ratios
in the fauna [21].
The surface dwelling foraminifera had depleted natural
abundance d13C values indicating that they feed at the base of
the food web on phytodetrital aggregates. Concomitantly, deeper
dwelling foraminifera (2–5 cm) were enriched in 13C indicating
either preferential utilisation of isotopically light cellular fatty acids
during periods of low food availability. Preferential utilisation of
isotopically light cellular fatty acids during periods of low food
availability (fasting/starvation) can lead to enrichment in 13C by
up to 4% [78–80]. Utilisation of cellular fatty acids by deeper
dwelling foraminifera would not explain the large differences in
d13C values observed here. Large isotopic shifts have been
observed in both autotrophic and heterotrophic bacteria [81,82]
and ingestion of bacteria utilizing the reverse tricarboxylic acid
pathway can lead to enrichment in 13C [83–85]. The large ranges
in d13C of foraminifera observed in this study are consistent with
the ranges for the calcareous and agglutinated foraminifera at
Station M during September 2007 [55].
We suggest from the results presented here and previous
observations [3,51], that foraminifera colonize phytodetrital
aggregates and use nitrate in respiration at Station M. Forami-
nifera also had higher biomass specific incorporation of N
compared to other taxonomic groups. Consumption of POM is
proportional to faunal biomass [86]. At the Indian margin
foraminifera have also been shown to incorporate algalN in tracer
experiments [56]. The foraminifera preferentially selected for
diatoms over coccolithophorids and were the only group to show
evidence of preferential selection. Foraminifera may require
higher levels of organic N from phytodetritus in order to catabolise
this food source and fuel intracellular denitrification or to build up
reserves of intracellular nitrate for respiration. Recently forami-
nifera have been shown to carry out complete intracellular
denitrification de novo and in the presence of endobionts, in a wide
range of environments [87–89]. Storage of intracellular nitrate
within foraminiferal vacuoles is known to result in intracellular
d15NNO3 values ranging from 12% – 42% [87,92]. Foraminiferal
d15N values in this study ranged from 6.6% to 20.1%, with three
of these values being .12%, which suggests that some forami-
nifera at Station M may be accumulating intracellular nitrate.
Nitrate respiration has been observed in phytodetrital aggre-
gates at Station M and was attributed to bacteria [90]. A number
of mechanisms for nitrate accumulation in foraminifera have been
suggested, these include: transport of nitrate into cells from
surrounding porewaters, intracellular production of nitrate, or
obtaining nitrate from symbiotic nitrifying bacteria [89]. It is
possible that foraminifera at Station M could produce intracellular
nitrate via decomposition of phytoN to yield NH4+, which is then
converted to nitrate via denitrification either de novo or in the
presence of bacterial symbionts. However, we are not aware that
this process has been observed in foraminifera to date. Alterna-
tively, foraminifera may assimilate nitrate from surrounding
porewaters, which could have been produced by decomposition
of phytoN by bacteria or fauna to yield NH4+, which is then
converted to nitrate by nitrifying bacteria. Koho et al. [91] have
demonstrated that foraminifera collect nitrate both in the presence
and absence of oxygen, and that foraminifera migrate towards
favourable conditions i.e. towards free nitrate and or oxygen. If
this is the case at Station M, it might account for the observed
foraminiferal distributions. Nitrate storage/respiration in forami-
nifera has also recently been proposed as a transport mechanism
for nitrate in sediments [89,92]. Our data suggest that foraminifera
are important players in nitrogen cycling in abyssal environments
and could facilitate the transport of nitrogen through the
sediments. However, further work is required to determine the
role of foraminifera in both organic and inorganic nitrogen cycling
at Station M.
Supporting Information
Table S1 Isotopic composition of macrofauna recovered from
Experiment 1 in June 2007 containing 13C-labeled diatoms and15N-labeled coccolithophores.
(DOCX)
Table S2 Isotopic composition of macrofauna recovered from
Experiment 2 in June 2007 containing 13C and 15N- labeled
diatoms.
(DOCX)
Table S3 Isotopic composition of macrofauna recovered from
the experiment in September 2007 containing 13C-labeled
diatoms.
(DOCX)
Table S4 Pairwise comparisons of d13C composition between
taxonomic groups.
(DOCX)
Table S5 Pairwise comparisons of C:N ratios between taxo-
nomic groups.
(DOCX)
Acknowledgments
We would like to acknowledge one anonymous reviewer and Dr. Hidetaka
Nomaki for their useful comments on the manuscript. We sincerely thank
the Captain, officers and crew of the R.V. Western Flyer and the pilots of
the ROV Tiburon for assistance at sea during PULSE 52. We are also
grateful to Jacob Ellena for logistical support/assistance at sea, Amanda
Khan for helping RJ with sieving sediment cores and Markus Moeseneder
for collecting samples during PULSE 53. We would also like to thank Barry
Thornton for his help with the isotope analyses.
Author Contributions
Conceived and designed the experiments: RMJ UW AJ. Performed the
experiments: RMJ KS HR CB. Analyzed the data: CB RJ. Contributed
reagents/materials/analysis tools: UW KS BN. Wrote the paper: RJ. Gave
critical revisions on the first draft, which improved the manuscript: HR
UW. Participated in the critical revision of the manuscript and gave final
approval of the article: RMJ CB AJ BN HR KS UW.
Feeding Preferences of Abyssal Macrofauna
PLOS ONE | www.plosone.org 13 November 2013 | Volume 8 | Issue 11 | e80510
References
1. Smith CR, De Leo FC, Bernardino AF, Sweetman AK, Arbizu PM (2008)Abyssal food limitation, ecosystem structure and climate change. Trends Ecol
Evol 23: 518–528.
2. Graf G (1989) Benthic Pelagic Coupling in a Deep-Sea Benthic Community.
Nature 341: 437–439.
3. Gooday A (1988) A Response by Benthic Foraminifera to the Deposition ofPhytodetritus in the Deep-Sea. Nature 332: 70–73.
4. Billett D, Lampitt R, Rice A, Mantoura R (1983) Seasonal Sedimentation of
Phytoplankton to the Deep-Sea Benthos. Nature 302: 520–522.
5. Beaulieu S (2002) Accumulation and fate of phytodetritus on the sea floor.Oceanogr Mar Biol 40: 171–232.
6. Smith K, Kaufmann R, Baldwin R (1994) Coupling of near-bottom pelagic and
benthic processes at abyssal depths in the eastern North Pacific Ocean. LimnolOceanogr 39: 1101–1118.
7. Smith C, Berelson W, DeMaster D, Dobbs F, Hammond D, et al. (1997)
Latitudinal variations in benthic processes in the abyssal equatorial Pacific:
control by biogenic particle flux. Deep-Sea Res II 44: 2295–2317.
8. Bett B, Malzone M, Narayanaswamy B, Wigham B (2001) Temporal variabilityin phytodetritus and megabenthic activity at the seabed in the deep Northeast
Atlantic. Prog Oceanogr 50: 349–368.
9. Ruhl HA, Ellena JA, Smith KL (2008) Connections between climate, foodlimitation, and carbon cycling in abyssal sediment communities. P Natl Acad Sci
Usa 105: 17006–17011. doi:10.1073/pnas.0803898105.
10. Smith KL, Ruhl HA, Bett BJ, Billett DSM, Lampitt RS, et al. (2009) Climate,
carbon cycling, and deep-ocean ecosystems. P Natl Acad Sci Usa 106: 19211–19218. doi:10.1073/pnas.0908322106.
11. Vardaro MF, Ruhl HA, Smith KL (2009) Climate variation, carbon flux, and
bioturbation in the abyssal North Pacific. Limnol Oceanogr 54: 2081–2088.
12. Rex M, Etter R, Morris J, Crouse J, McClain C, et al. (2006) Global bathymetricpatterns of standing stock and body size in the deep-sea benthos. Mar Ecol Prog
Ser 317: 1.
13. Thomas C, Blair N (2002) Transport and digestive alteration of uniformly C-13-
labeled diatoms in mudflat sediments. J Mar Res 60: 517–535.
14. Canuel EA, Spivak AC, Waterson EJ, Duffy JE (2007) Biodiversity and food webstructure influence short-term accumulation of sediment organic matter in an
experimental seagrass system. Limnol Oceanogr 52: 590–602.
15. Levin L, Blair N, DeMaster D, Plaia G, Fornes W, et al. (1997) Rapidsubduction of organic matter by maldanid polychaetes on the North Carolina
slope. J Mar Res 55: 595–611.
16. Fornes WL, DeMaster DJ, Levin LA, Blair NE (1999) Bioturbation and particletransport in Carolina slope sediments: A radiochemical approach. J Mar Res 57:
335–355. doi:10.1357/002224099321618245.
17. Sun M-Y, Aller RC, Lee C, Wakeham SG (1999) Enhanced degradation of algal
lipids by benthic macrofaunal activity: Effect of Yoldia limatula. J Mar Res 57:775–804. doi:10.1357/002224099321560573.
18. Hunter W, Veuger B (2012) Macrofauna regulate heterotrophic bacterial carbon
and nitrogen incorporation in low-oxygen sediments. ISME J. doi:10.1038/ismej.2012.244.
19. Hunter WR, Jamieson A, Huvenne VAI, Witte U (2013) Sediment community
responses to marine vs. terrigenous organic matter in a submarine canyon.
Biogeosciences 10: 67–80. doi:10.5194/bg-10-67-2013.
20. Drazen J, Baldwin R, Smith K (1998) Sediment community response to atemporally varying food supply at an abyssal station in the NE Pacific. Deep-Sea
Res II 45: 893–913.
21. Hunter WR, Levin LA, Kitazato H, Witte U (2012) Macrobenthic assemblagestructure and organismal stoichiometry control faunal processing of particulate
organic carbon and nitrogen in oxygen minimum zone sediments. Biogeos-
ciences 9: 993–1006. doi:10.5194/bg-9-993-2012.
22. Gontikaki E, Mayor DJ, Narayanaswamy BE, Witte U (2011) Feeding strategiesof deep-sea sub-Arctic macrofauna of the Faroe-Shetland Channel: Combining
natural stable isotopes and enrichment techniques. Deep-Sea Res I 58: 160–172.doi:10.1016/j.dsr.2010.11.011.
23. Moodley L, Middelburg J, Soetaert K, Boschker H, Herman P, et al. (2005)
Similar rapid response to phytodetritus deposition in shallow and deep-seasediments. J Mar Res 63: 457–469.
24. Woulds C, Andersson JH, Cowie GL, Middelburg JJ, Levin LA (2009) The
short-term fate of organic carbon in marine sediments Comparing the Pakistan
margin to other regions. Deep-Sea Res II 56: 393–402. doi:10.1016/j.dsr2.2008.10.008.
25. Blair N, Levin L, DeMaster D, Plaia G (1996) The short-term fate of fresh algal
carbon in continental slope sediments. Limnol Oceanogr 41: 1208–1219.
26. Witte U, Wenzhofer F, Sommer S, Boetius A, Heinz P, et al. (2003) In situexperimental evidence of the fate of a phytodetritus pulse at the abyssal sea floor.
Nature 424: 763–766. doi:10.1038/nature01799.
27. Woulds C, Cowie GL, Levin LA, Andersson JH, Middelburg JJ, et al. (2007)
Oxygen as a control on seafloor biological communities and their roles insedimentary carbon cycling. Limnol Oceanogr 52: 1698–1709.
28. Levin L, Blair N, Martin C, DeMaster D, Plaia G, et al. (1999) Macrofaunal
processing of phytodetritus at two sites on the Carolina margin: in situexperiments using C-13-labeled diatoms. Mar Ecol Prog Ser 182: 37–54.
29. Aberle N, Witte U (2003) Deep-sea macrofauna exposed to a simulated
sedimentation event in the abyssal NE Atlantic: in situ pulse-chase experiments
using C-13-labelled phytodetritus. Mar Ecol Prog Ser 251: 37–47.
30. Sweetman AK, Witte U (2008) Response of an abyssal macrofaunal community
to a phytodetrital pulse. Mar Ecol Prog Ser 355: 73–84. doi:10.3354/
meps07240.
31. Wurzberg L, Peters J, Schuller M, Brandt A (2011) Diet insights of deep-sea
polychaetes derived from fatty acid analyses. Deep-Sea Res II 58: 153–162.
doi:10.1016/j.dsr2.2010.10.014.
32. Jeffreys RM, Levin LA, Lamont PA, Woulds C, Whitcraft CR, et al. (2012)
Living on the edge: single-species dominance at the Pakistan oxygen minimum
zone boundary. Mar Ecol Prog Ser 470: 79–99. doi:10.3354/meps10019.
33. McMahon KW, Ambrose WG Jr, Johnson BJ, Sun MY, Lopez GR, et al. (2006)
Benthic community response to ice algae and phytoplankton in Ny Alesund,
Svalbard. Mar Ecol Prog Ser 310: 1–14.
34. Sun MY, Clough LM, Carroll ML, Dai J, Ambrose WG Jr, et al. (2009)
Different responses of two common Arctic macrobenthic species (Macoma balthica
and Monoporeia affinis) to phytoplankton and ice algae: Will climate change
impacts be species specific? J Exp Mar Biol Ecol 376: 110–121.
35. Laguionie-Marchais C, Billett DSM, Paterson GLD, Ruhl HA, Soto EH, et al.
(2013) Inter-annual dynamics of abyssal polychaete communities in the North
East Pacific and North East Atlantic—A family-level study. Deep-Sea Res I 75:
175–186. doi:10.1016/j.dsr.2012.12.007.
36. Smith K, Baldwin R, Ruhl H, Kahru M, Mitchell B, et al. (2006) Climate effect
on food supply to depths greater than 4,000 meters in the northeast Pacific.
Limnol Oceanogr 51: 166–176.
37. Smith K, Druffel E (1998) Long time-series monitoring of an abyssal site in the
NE Pacific: an introduction. Deep-Sea Res II 45: 573–586.
38. Baldwin R, Glatts R, Smith K (1998) Particulate matter fluxes into the benthic
boundary layer at a long time-series station in the abyssal NE Pacific
composition and fluxes. Deep-Sea Res II 45: 643–665.
39. Smith K, Kaufmann R, Baldwin R, Carlucci A (2001) Pelagic-benthic coupling
in the abyssal eastern North Pacific: An 8-year time-series study of food supply
and demand. Limnol Oceanogr 46: 543–556.
40. Smith K Jr, Ruhl H, Kaufmann R, Kahru M (2008) Tracing abyssal food supply
back to upper-ocean processes over a 17-year time series in the northeast Pacific.
Limnol Oceanogr 53: 2655–2667.
41. Smith K, Baldwin R, Glatts R, Kaufmann R, Fisher E (1998) Detrital aggregates
on the sea floor: Chemical composition and aerobic decomposition rates at a
time-series station in the abyssal NE Pacific. Deep-Sea Res II 45: 843–880.
42. Beaulieu S, Smith K (1998) Phytodetritus entering the benthic boundary layer
and aggregated on the sea floor in the abyssal NE Pacific: macro- and
microscopic composition. Deep-Sea Res II 45: 781–815.
43. Venrick E (1998) Spring in the California current: the distribution of
phytoplankton species, April 1993 and April 1995. Mar Ecol Prog Ser 167:
73–88.
44. Guillard RRL, Hargraves PE (1993) Stichochrysis immobilis is a diatom, not a
chrysophyte. Phycologia 32: 234–236. doi:10.2216/i0031-8884-32-3-234.1.
45. Grasshoff K, Kremling K, Ehrhardt M (1983) Methods of Seawater Analysis.
Weinheim: Verlag Chemie 419 pp.
46. Brown MR, Jeffrey SW, Volkman JK, Dunstan GA (1997) Nutritional properties
of microalgae for mariculture. Aquaculture 151: 315–331.
47. Anderson MJ (2005) Permutational multivariate analysis of variance. Depart-
ment of Statistics, University of Auckland, Auckland.
48. Anderson MJ, Gorley RN, Clarke KR (2008) Permanova+ for Primer: Guide to
software and statistical methods. PRIMER-E Ltd.214 pp.
49. Fauchald K, Jumars P (1979) The diet of worms: a study of polychaete feeding
guilds. Oceanogr Mar Biol Ann Rev 17: 193–284.
50. Gooday AJ, Hughes JA (2002) Foraminifera associated with phytodetritus
deposits at a bathyal site in the northern Rockall Trough (NE Atlantic): seasonal
contrasts and a comparison of stained and dead assemblages. Mar Micro-
paleontol 46: 83–110. doi:10.1016/S0377-8398(02)00050-6.
51. Koho KA, Langezaal AM, van Lith YA, Duijnstee IAP, van der Zwaan GJ
(2008) The influence of a simulated diatom bloom on deep-sea benthic
foraminifera and the activity of bacteria: A mesocosm study. Deep-Sea Res I 55:
696–719. doi:10.1016/j.dsr.2008.02.003.
52. Smith CR, Hessler RR (1987) Colonization and succession in deep-sea
ecosystems. Trends Ecol Evol 2: 359–363. doi:10.1016/0169-5347(87)90136-4.
53. Druffel E, Griffin S, Bauer J, Wolgast D, Wang X (1998) Distribution of
particulate organic carbon and radiocarbon in the water column from the upper
slope to the abyssal NE Pacific ocean. Deep-Sea Res II 45: 667–687.
54. van Oevelen D, Soetaert K, Heip C (2012) Carbon flows in the benthic food web
of the Porcupine Abyssal Plain: The (un)importance of labile detritus in
supporting microbial and faunal carbon demands. Limnol Oceanogr 57: 645–
664. doi:10.4319/lo.2012.57.2.0645.
55. Enge A, Nomaki H, Ogawa N, Witte U, Moeseneder M, et al. (2011) Response
of the benthic foraminiferal community to a simulated short-term phytodetritus
pulse in the abyssal North Pacific. Mar Ecol Prog Ser 438: 129–142.
doi:10.3354/meps09298.
Feeding Preferences of Abyssal Macrofauna
PLOS ONE | www.plosone.org 14 November 2013 | Volume 8 | Issue 11 | e80510

56. Enge AJ, Witte U, Kucera M, Heinz P (2013) Uptake of phytodetritus by
benthic foraminifera under oxygen depletion at the Indian Margin (ArabianSea). Biogeosci Disc 10: 15305–15335. doi:10.5194/bgd-10-15305-2013.
57. Nomaki H, Heinz P, Nakatsuka T (2006) Different ingestion patterns of 13C-
labeled bacteria and algae by deep-sea benthic foraminifera. Mar Ecol Prog Ser310: 95–108.
58. Sweetman AK, Sommer S, Pfannkuche O, Witte U (2009) Retarded response bymacrofauna-size foraminifera to phytodetritus in a deep Norwegian fjord.
J Foram Res 39: 15–22.
59. Moodley L, Middelburg JJ, Boschker H (2002) Bacteria and Foraminifera: keyplayers in a short-term deep-sea benthic response to phytodetritus. Mar Ecol
Prog Ser 236: 23–29.60. McCutchan J, Lewis W, Kendall C, McGrath C (2003) Variation in trophic shift
for stable isotope ratios of carbon, nitrogen, and sulfur. Oikos 102: 378–390.61. Post D (2002) Using stable isotopes to estimate trophic position: Models,
methods, and assumptions. Ecology 83: 703–718.
62. Iken K, Brey T, Wand U, Voigt J, Junghans P (2001) Food web structure of thebenthic community at the Porcupine Abyssal Plain (NE Atlantic): a stable isotope
analysis. Prog Oceanogr 50: 383–405.63. Nomaki H, Ogawa N, Ohkouchi N, Suga H, Toyofuku T, et al. (2008) Benthic
foraminifera as trophic links between phytodetritus and benthic metazoans:
carbon and nitrogen isotopic evidence. Mar Ecol Prog Ser 357: 153–164.64. Ingels J, Van den Driessche P, De Mesel I, Vanhove S, Moens T, et al. (2010)
Preferred use of bacteria over phytoplankton by deep-sea nematodes in polarregions. Mar Ecol Prog Ser 406: 121–133. doi:10.3354/meps08535.
65. Ingels J, Billett DSM, Van Gaever S, Vanreusel A (2011) An insight into thefeeding ecology of deep-sea canyon nematodes — Results from field
observations and the first in-situ 13C feeding experiment in the Nazare Canyon.
J Exp Mar Biol Ecol 396: 185–193. doi:10.1016/j.jembe.2010.10.018.66. Guilini K, van Oevelen D, Soetaert K (2010) Nutritional importance of benthic
bacteria for deep-sea nematodes from the Arctic ice margin: Results of anisotope tracer experiment. Limnol Oceanogr 55: 1977–1989.
67. Fonseca G, Gallucci F (2008) Direct evidence of predation in deep-sea
nematodes: the case of Pontonema sp. Cah Biol Mar 49: 295–297.68. Sweeting C, Jennings S, Polunin N (2005) Variance in isotopic signatures as a
descriptor of tissue turnover and degree of omnivory. Funct Ecol 19: 777–784.doi:10.1111/j.1365-2435.2005.01019.x.
69. Herman P, Middelburg J, Widdows J, Lucas C, Heip C (2000) Stable isotopes’ astrophic tracers: combining field sampling and manipulative labelling of food
resources for macrobenthos. Mar Ecol Prog Ser 204: 79–92.
70. Raubenheimer D, Simpson SJ (2004) Organismal stoichiometry: quantifyingnon-independence among food components. Ecology 85: 1203–1216.
71. Clarke A (2008) Ecological stoichiometry in six species of Antarctic marinebenthos. Mar Ecol Prog Ser. doi:10.3354/meps07670.
72. Mincks SL, Smith CR, Jeffreys RM, Sumida PYG (2008) Trophic structure on
the West Antarctic Peninsula shelf: Detritivory and benthic inertia revealed bydelta C-13 and delta N-15 analysis. Deep-Sea Res II 55: 2502–2514.
doi:10.1016/j.dsr2.2008.06.009.73. Frost P.C., Stelzer RS, Lamberti GA, Elser JJ (2002) Ecological stoichiometry of
trophic interactions in the benthos: understanding the role of C: N: P ratios inlentic and lotic habitats. J North Am Benth Soc: 515–528.
74. Frost P.C., Evans White MA, Finkel ZV, Jensen TC, Matzek V (2005) Are you
what you eat? Physiological constraints on organismal stoichiometry in anelementally imbalanced world. Oikos 109: 18–28.
75. Suhr SB, Pond DW, Gooday AJ, Smith CR (2003) Selective feeding by benthicforaminifera on phytodetritus on the western Antarctic Peninsula shelf: evidence
from fatty acid biomarker analysis. Mar Ecol Prog Ser 262: 153–162.
76. Tanaka Y, Miyajima T, Koike I, Hayashibara T, Ogawa H (2006)Translocation and conservation of organic nitrogen within the coral-zooxan-
thella symbiotic system of Acropora pulchra, as demonstrated by dual isotope-
labeling techniques. J Exp Mar Biol Ecol 336: 110–119. doi:10.1016/
j.jembe.2006.04.011.
77. Nomaki H, Ohkouchi N, Heinz P, Suga H, Chikaraishi Y, et al. (2009)
Degradation of algal lipids by deep-sea benthic foraminifera: An in situ tracer
experiment. Deep-Sea Res I 56: 1488–1503.
78. Gannes LZ, del Rio CM, Koch P (1998) Natural abundance variations in stable
isotopes and their potential uses in animal physiological ecology. Comp Biochem
Physiol-Part A: Mol & Integr Physiol 119: 725–737.
79. Doi H, Kikuchi E, Takagi S, Shikano S (2007) Changes in carbon and nitrogen
stable isotopes of chironomid larvae during growth, starvation and metamor-
phosis. Rapid Commun Mass Spectrom 21: 997–1002. doi:10.1002/rcm.2925.
80. Graves GR, Newsome SD, Willard DE, Grosshuesch DA, Wurzel WW, et al.
(2012) Nutritional stress and body condition in the Great Gray Owl (Strix
nebulosa) during winter irruptive migrations. Can J Zool 90: 787–797.
doi:10.1139/z2012-047.
81. Macko SA, Fogel ML, Hare PE, Hoering TC (1987) Isotopic fractionation of
nitrogen and carbon in the synthesis of amino acids by microorganisms. Chem
Geol 65: 79–92.
82. McGoldrick DJ, Barton DR, Power M, Scott RW, Butler BJ (2008) Dynamics of
bacteria–substrate stable isotope separation: dependence on substrate availability
and implications for aquatic food web studies. Can J Fish Aquat Sci 65: 1983–
1990. doi:10.1139/F08-109.
83. van der Meer MTJ, Schouten S, Sinninghe Damste JS (1998) The effect of the
reversed tricarboxylic acid cycle on the 13C contents of bacterial lipids. Org
Geochem 28: 527–533.
84. Campbell B, Cary S (2004) Abundance of reverse tricarboxylic acid cycle genes
in free-living microorganisms at deep-sea hydrothermal vents. Appl Environ
Microb 70: 6282–6289. doi:10.1128/AEM.70.10.6282-6289.2004.
85. Williams TJ, Zhang CL, Scott JH, Bazylinski DA (2006) Evidence for
Autotrophy via the Reverse Tricarboxylic Acid Cycle in the Marine
Magnetotactic Coccus Strain MC-1. Appl Environ Microb 72: 1322–1329.
doi:10.1128/AEM.72.2.1322-1329.2006.
86. Middleburg J, Barranguet C, Boschker H (2000) The fate of intertidal
microphytobenthos carbon: An in situ 13C-labeling study. Limnol Oceanogr
45: 1224–1234.
87. Pina-Ochoa E, Hogslund S, Geslin E, Cedhagen T, Revsbech NP, et al. (2010)
Widespread occurrence of nitrate storage and denitrification among Foraminif-
era and Gromiida. P Natl Acad Sci 107: 1148–1153. doi:10.1073/
pnas.0908440107.
88. Risgaard-Petersen N (2003) Coupled nitrification-denitrification in autotrophic
and heterotrophic estuarine sediments: On the influence of benthic microalgae.
Limnol Oceanogr 48: 93–105.
89. Bernhard JM, Casciotti KL, McIlvin MR, Beaudoin DJ, Visscher PT, et al.
(2012) Potential importance of physiologically diverse benthic foraminifera in
sedimentary nitrate storage and respiration. J Geophys Rese 117: G03002.
doi:10.1029/2012JG001949.
90. Wolgast DM, Carlucci AF, Bauer JE (1998) Nitrate respiration associated with
detrital aggregates in aerobic bottom waters of the abyssal NE Pacific. Deep-Sea
Res II 45: 881–892.
91. Koho KA, Pina-Ochoa E, Geslin E, Risgaard-Petersen N (2010) Vertical
migration, nitrate uptake and denitrification: survival mechanisms of foramin-
ifers (Globobulimina turgida) under low oxygen conditions. FEMS Microbiol Ecol
75: 273–283. doi:10.1111/j.1574-6941.2010.01010.x.
92. Prokopenko MG, Sigman DM, Berelson WM, Hammond DE, Barnett B, et al.
(2011) Denitrification in anoxic sediments supported by biological nitrate
transport. Geochim Cosmochim Ac 75: 7180–7199. doi:10.1016/
j.gca.2011.09.023.
Feeding Preferences of Abyssal Macrofauna
PLOS ONE | www.plosone.org 15 November 2013 | Volume 8 | Issue 11 | e80510