Embed Size (px)
Citation preview

MARINE ECOLOGY PROGRESS SERIESMar Ecol Prog Ser
Vol. 452: 269–285, 2012doi: 10.3354/meps09670
Published April 25
INTRODUCTION
Seabirds are a major component of the marineecosystem and generally thought to be at the top ofthe marine food webs (Brooke 2004b, Karpouzi et al.
2007). However, their feeding ecology and move-ments across marine ecosystems remain poorlyknown for many species. This lack of knowledgehampers our understanding of the role of seabirds inmarine ecosystems, our capability to identify the
© Inter-Research 2012 · www.int-res.com*Email: [email protected]
Feeding ecology and movements of the Barolo shearwater Puffinus baroli baroli
in the Azores, NE Atlantic
Verónica C. Neves1,*, Joël Bried1, Jacob González-Solís2, Jose L. Roscales2,3, Malcolm R. Clarke4
1Departamento de Oceanografia e Pescas, Centro do IMAR da Universidade dos Açores, Rua Frederico Machado n°4, 9901-862 Horta, Faial, Azores, Portugal
2Institut de Recerca de la Biodiversitat (IRBio) and Departament de Biologia Animal, Universitat de Barcelona, Avenida Diagonal 645, 08028 Barcelona, Spain
3Departamento de Análisis Instrumental y Química Ambiental, Instituto de Química Orgánica general (IQOG-CSIC), Calle Juan de la Cierva 3, 28006 Madrid, Spain
4Rua do Porto 18, 9930-430 Lajes do Pico, Azores, Portugal
ABSTRACT: Trophic ecology and movements are critical issues for understanding the role ofmarine predators in food webs and for facing the challenges of their conservation. Seabird forag-ing ecology has been increasingly studied, but small elusive species, such as those forming the ‘lit-tle shearwater’ complex, remain poorly known. We present the first study on the movements andfeeding ecology of the Barolo shearwater Puffinus baroli baroli in a colony from the Azores archi-pelago (NE Atlantic), combining global location-sensing units, stable isotope analyses of feathers(δ13C and δ15N), stomach flushings and data from maximum depth gauges. During the chick-rear-ing period, parents visited their nests most nights, foraged mainly south of the colony and fed atlower trophic levels than during the non-breeding period. Squid was the most diverse prey (6 fam-ilies and at least 10 different taxa), but species composition varied considerably between years.Two squid families, Onychoteuthidae and Argonautidae, and the fish family Phycidae accountedfor 82.3% of ingested prey by number. On average, maximum dive depths per foraging tripreached 14.8 m (range: 7.9 to 23.1 m). After the breeding period, birds dispersed offshore in alldirections and up to 2500 km from the breeding colony, and fed at higher trophic levels. Overall,our results indicate that the Barolo shearwater is a non-migratory shearwater feeding at the lowesttrophic level among Macaronesian seabirds, showing both diurnal and nocturnal activity andfeeding deeper in the water column, principally on small schooling squid and fish. These traitscontrast with those of 3 other Azorean Procellariiformes (Cory’s shearwater Calonectris diomedea,the Madeiran storm-petrel Oceanodroma castro and Monteiro’s storm-petrel O. monteiroi), indi-cating ecological segregation within the Azorean seabird community.
KEY WORDS: Barolo shearwater · Puffinus baroli baroli · Diet · Foraging behaviour · Stable isotopes · Activity patterns · At-sea distribution · North-eastern Atlantic
Resale or republication not permitted without written consent of the publisher
OPENPEN ACCESSCCESS

Mar Ecol Prog Ser 452: 269–285, 2012
threats to their populations and, thus, the conserva-tion of these marine predators.
Trophic interactions have been typically studiedthrough diet analyses from e.g. stomach flushing(Wilson 1984, Ridoux 1994, Neves et al. 2011). Thismethod has been extensively used in subantarcticand Antarctic seabirds (e.g. Ridoux 1994, Connan etal. 2008), but species of the sub-tropical northernhemisphere, particularly the Atlantic Ocean, remainpoorly studied (Croxall & Prince 1996). Traditionalstudies of diet composition, however, have mainlybeen conducted during the breeding period, arebiased towards prey with hard parts and only giveinformation from the last meal. Nevertheless, theyare very important for determining prey type andsize, and especially useful when used in associationwith other tracers of feeding ecology which integratethe diet over longer periods, such as ratios of carbonand nitrogen stable isotopes (e.g. Rau et al. 1982,Hobson & Welch 1992, Thompson et al. 1999, Foreroet al. 2004). Despite a few exceptions however (e.g.Petry et al. 2008), our knowledge of seabird diets dur-ing the non-breeding period is very limited (Barrettet al. 2007). Stable isotope analyses have beenincreasingly used and are improving our understand-ing of the role of seabirds in marine food webs, butvalues are often difficult to interpret because in manycases, such as in most Procellariiformes (petrels)breeding in Macaronesian archipelagos, we still lackbasic knowledge of diet composition (Roscales et al.2011a).
Isotope ratios in consumer tissues reflect those oftheir prey in a predictable manner (DeNiro &Epstein 1978, 1981, Hobson & Clark 1992a,b), andsince tissues turn over at different rates, they canintegrate trophic information over different temporalperiods and, if the animal migrates, over differentareas as well (Hobson & Clark 1992b, Ramos &González-Solís 2012). In the marine environment,higher ratios of 13C to 12C (δ13C) in seabird tissuescharacterize inshore and benthic habitats comparedto offshore and pelagic environments (France 1995,Kelly 2000). The ratio of 15N to 14N (δ15N) has beenlargely used to delineate consumer trophic positionsbecause δ15N increases with trophic level due topreferential incorporation of 15N into body tissues(Minagawa & Wada 1984, Owens 1987). Moreover,stable isotopes can also provide information aboutthe spatial component of the trophic niche becausetissues ultimately integrate the isotopic baseline lev-els of the area where they were formed. Feathersare especially useful for this purpose when moultingpatterns are known because they reflect the isotopic
forms assimilated through the diet when and wherethey were grown (Hobson & Clark 1992b). This isimportant in seabirds, whose main feeding areashave been typically difficult to locate due to thepelagic habits of these species. However, the spatialresolution of stable isotopes is low or even null ifbirds just move within a regional scale. For exam-ple, movements within the Northeast Atlantic areun likely to be isotopically detected because baselinevalues are essentially homogeneous (Graham et al.2010, Roscales et al. 2011a). Alternatively, trackingdevices can provide more detailed information onbird movements (Burger & Shaffer 2008). As a con-sequence, the use of light-based geolocators (globallocation-sensing units) has increased substantiallyover the last few years (although very incomplete,the list presented at the British Antarctic Surveywebsite includes 8 peer-reviewed papers up until2005 and 47 up until 2010). Despite their relativelack of accuracy (about 200 km, Shaffer et al. 2005),geolocators are useful for identifying broad foragingareas during both the breeding and the non-breed-ing periods. In addition, geolocators can also pro-vide insights into the temporal component of thetrophic niche, since some of these loggers can alsorecord daily activity patterns at sea (e.g. Passos etal. 2010).
A combination of traditional approaches with morerecent methods can provide a broader picture ofseabird foraging ecology, since each method comple-ments the limitations of the others (Hobson et al.1994, Hobson 1999, Fry 2006, González-Solís et al.2007a). In the present study, we used geolocators, sta-ble isotope analyses of feathers (δ13C and δ15N), stom-ach flushings and maximum depth gauges to studythe movements and feeding ecology of one of the spe-cies forming the ‘little shearwater’ complex, theBarolo shearwater Puffinus baroli. The Barolo shear-water is endemic to the NE Atlantic oceanic islands,breeding only in the Azores, Madeira, Salvages, Ca-nary and Cape Verde archipelagos, with the P. barolibaroli subspecies breeding in the former 4 archipela-gos and the P. b. boydi subspecies breeding on theCape Verde islands (Brooke 2004a). Due to its re-stricted range and its limited numbers (<7000 breed-ing pairs), the Barolo shearwater is considered ‘Rare’in the Palearctic (BirdLife International 2004). Themovements, foraging areas and diet of the smallestand most secretive shearwater of the subtropical At-lantic remain largely unknown. Therefore, it is essen-tial to evaluate the factors that may alter the currentand future dynamics of its populations as well as helpidentify important conservation areas at sea.
270

Neves et al.: Barolo shearwater feeding ecology
The main aims of this study were: (1) to assess thediet composition and main prey of the Barolo shear-water; (2) to characterize its foraging behaviour; and(3) to identify its main foraging areas during thebreeding and non-breeding periods.
MATERIALS AND METHODS
The present study was conducted in the Azores,where the species reaches the northern limit of itsdistribution. At this locality, the population of Baroloshearwaters is estimated to consist of between 840and 1530 breeding pairs (Monteiro et al. 1999), mak-ing it the second most abundant procellariiform inthe region after Cory’s shearwater Calonectrisdiomedea. Fieldwork was conducted on Vila islet(36° 55’ N, 25° 10’ W; 8 ha), located ca. 300 m off SantaMaria island, Azores archipelago, which holds about50 breeding pairs of Barolo shearwaters (Monteiro etal. 1999). Egg laying occurs from late January, chickshatch from mid-March and fledge from mid- to lateMay (Monteiro et al. 1996). Adults stop visiting theco lo nies between June and September. The primaryremiges are moulted in April and May when mostbirds are renewing primaries 1 to 4, and the moult ofthe secondary remiges occurs towards the end of thenon-breeding period (Monteiro et al. 1996).
Diet
Stomach contents were collected under licensebetween 26 and 29 March 1998 and between 20 and25 April 2000, to coincide with the chick-rearingstage. Barolo shearwaters can be very asynchronousbreeders (Monteiro et al. 1996, J. Bried unpubl.data) and when we visited Vila islet in March 1999,very few chicks had hatched, preventing us fromrepeating the sampling. Therefore in 2000, wedecided to visit the islet some weeks later than in1998 to ensure the success of sampling. Diet sam-ples were obtained from adult birds using thewater-offloading technique (Wilson 1984); each indi-vidual was sampled only once. For the water-offloading procedure, we used a syringe and a plas-tic suction catheter with an external diameter of2.3 mm. Birds were ringed using individually num-bered metal rings and released immediately afterbeing sampled. In the field, food samples weredrained and preserved in 70% etha nol. Sampleswere examined and sorted under a bi nocular micro-scope. Otoliths were kept dry and all the other
remains from fish, cephalopods and crustaceanswere stored in 70% ethanol. Fish were identified tothe lowest possible taxon from their otoliths usingavailable keys (Nolf 1985, Härkönnen 1986, Smaleet al. 1996) and reference collections. Otoliths werepaired to estimate the number of fish prey in eachsample. Cephalopods were identified from theirbeaks and, when they were not too digested, fromflesh, shape, color and other physical features. Thebody mass (M) and mantle length (ML) of ce pha lo -pods were estimated from measurements of rostrallength, or hood length for octopods, of well- preserved lower beaks, using the equations pub-lished by Clarke (1986). In the cases of Argonautaargo and Tremoctopus violaceus, the equations ofSmale et al. (1993) were used. Given that the lengthof the arms of cephalopods in relation to ML variesconsiderably among species, we also provided esti-mates of standard length (SL), which is the length ofa squid excluding the tentacles. SL may give a bet-ter idea of the size of the prey from the predator’spoint of view. Estimates of SL are based on ML–SLrelationships from drawings published by Nesis(1987). Diet composition is described by both fre-quency of occurrence (FO, percentage of samplescontaining each type of prey) and numerical fre-quency (NF, individual numbers of each prey type).Differences in the NF of prey types between yearswere as sessed using chi-square tests. Stomach con-tents consisted of a dense grey paste and no preyitems were found whole, precluding weighing indi-vidual items. Crustaceans were too digested, pre-venting specific identification and fish prey couldonly be identified through otoliths since the otherhard structures were very small and eroded. Squidbeaks are known to be more resistant to digestionthan otoliths, and therefore tend to accumulate inbird stomachs for a longer period, leading to anoverestimation of the squid contribution to the over-all diet (Furness et al. 1984, Jackson & Ryan 1986,Neves et al. 2006). To avoid this bias, Neves et al.(2006) suggested using only the beaks that are stillattached to their buccal masses. In our case, how-ever, this would result in an overestimation of fishprey from otoliths by drastically reducing the diver-sity and abundance of squid prey, since only 22 outof 248 intact lower beaks were found on their buccalmasses. Therefore, we used all the lower beaksexcept those that were eroded or partially broken.Upper beaks were not used for species identifica-tion, but we used them to calculate the averagenumber of specimens per sample whenever theirnumber ex ceeded the number of lower beaks.
271

Mar Ecol Prog Ser 452: 269–285, 2012
Stable isotopes analyses
The innermost primary (P1) and the eighth sec-ondary (S8) remiges were taken under license from20 adult birds captured in the colony at night: 10birds were sampled between 17 and 21 April 2004and another 10, including the birds whose geoloca-tors were recovered (see below), between 16 and 22April 2008. Birds were ringed and released immedi-ately after sampling and feathers were stored in poly-ethylene bags prior to isotope analyses. We exam-ined the 13C/12C (δ13C) and 15N/14N (δ15N) ratios inthe P1, generally grown in May, corresponding to theend of the breeding season (Monteiro et al. 1996),and in the S8 remige, which is presumed to be grownin August or September, corresponding to the end ofboth the non-breeding and moulting periods (Mon-teiro et al. 1996). Feathers were cleaned in a solutionof NaOH (0.25 M), oven dried at 40°C, and cut finelywith stainless steel scissors for sample homogeniza-tion. Weighed sub-samples (0.36 mg) of featherswere placed into tin buckets and crimped for com-bustion. Isotopic analyses were carried out by EA-IRMS (elemental analysis-isotope ratio mass spec-trometry) by means of a ThermoFinnigan Flash 1112elemental analyzer coupled to a Delta isotope ratiomass spectrometer via a CONFLO III interface(Serveis Científico-Tècnics, University of Barcelona).Stable isotope ratios were expressed in conventionalnotation as parts per thousand (‰), according to thefollowing equation: δX = [(Rsample/ Rstandard) − 1] whereX is 15N or 13C and R is the corresponding ratio15N/14N and 13C/12C. The standards for 15N and 13Care atmospheric nitrogen (AIR) and Vienna PeedeeBelemnite (VPDB), respectively. Reference materialsfor stable isotope analysis were provided by theInternational Atomic Energy Agency (IAEA). In thecase of δ15N, the standards (certified reference value± SD, ‰air N2 for δ15N) used were IAEA-N-1 (0.4 ±0.2‰), IAEA-NO-3 (4.7 ± 0.2‰) and IAEA-N-2 (20.3± 0.2‰) and the experimentally obtained valueswere 0.5 ± 0.2, 4.6 ± 0.1 and 20.3 ± 0.1‰, respec-tively. USGS 40 (certified reference value ± SD,‰VPDB for δ13C, −26.389 ± 0.042‰), IAEA-CH-7(−32.151 ± 0.050‰) and IAEA-CH-6 (−10.499 ±0.033‰) were the reference materials for δ13C mea-surement. The values obtained in the laboratory forthese standards were −32.17 ± 0.05, −26.37 ± 0.03and −10.46 ± 0.03‰, respectively. Standards spanthe range of sample isotope ratios. Accuracy was≤0.1‰ for δ13C measurements and ≤0.2‰ for δ15N.Precision (RSD, SD × 100/mean) for the referencematerials with isotopic values within the range
obtained in feather samples was 0.28% and 1.3% forδ13C and δ15N, respectively. Results are shown asmeans ± SD. In order to cover more years, stable iso-tope data were analyzed after combining our datawith those of Roscales et al. (2011a), which wereobtained from 10 other adult individuals sampled on27 and 28 August 2003.
In order to simultaneously evaluate the effect offeather type (intra-subject factor with repeated mea-sures) and sampling year (inter-subjects factor) onstable isotope values, we used separated multivariateanalyses of variance (MANOVAs) for δ13C and δ15N.
Diving abilities
From 18 to 21 April 2004, the 2 adults of 3 chick-rearing pairs were captured in their burrows at nightwhile feeding their single chick, ringed for identifica-tion, equipped with a maximum depth gauge (MDG)fitted on the back feathers using waterproof adhesivetape, and released into their burrows. During subse-quent nights, burrows were monitored to check forthe return of the adults. When present, adults werecaptured again, the gauges were recovered and thebirds were eventually equipped with another gaugebefore being released into their burrows. MDGs con-sist of plastic tubes (10 to 12 cm length, 0.8 mm inter-nal diameter, Tygon®) lined with icing sugar andsealed at one extremity (Burger & Wilson 1988). Theyare commonly used to study seabird diving perfor-mances (review in Bocher et al. 2000), and their lowmass (0.8 to 1 g, data from this study) makes themespecially suitable for small-sized species. MDGsonly give the maximum depth reached. The latter iscalculated following Burger & Wilson (1988). To com-pare maximum depths reached between individuals,we used a Kruskal-Wallis test for small samples.
At-sea distribution and activity patterns
Ten global location-sensing loggers (MK14 geolo-cators, British Antarctic Survey) were deployed onbreeding Barolo shearwaters from 11 to 15 April2007, and 4 of these geolocators were recoveredbetween 16 and 21 April 2008 (at this time, featherswere taken from the birds that carried geolocators forisotope analyses, ‘Stable isotopes analyses’). Of the10 equipped birds, 7 had a chick, 2 were still incubat-ing and 1 was of unknown breeding status since thenesting cavity was too deep to confirm the presenceof either an egg or a chick. All the nests were
272

Neves et al.: Barolo shearwater feeding ecology
checked on 14 May 2007, about 1 mo after geolocatordeployment: 1 chick had fledged and the other 6were still in their nests. The 2 nests where the birdswere still incubating when they were equipped hadfailed and the nest of unknown breeding status hadno chick, so either the breeding attempt performedby the owner of this nest failed or the bird did notattempt to breed. Loggers were attached with a cabletie to a darvic ring and represented less than 1.5% ofbird body mass (on average, equipped birds weighed174.1 ± 13.6 g and loggers about 2.5 g, including dar-vic ring and cable tie). Only 1 member of each pairwas equipped. Sex was determined by molecularmethods (Fridolfsson & Ellegren 1999) using a 50 µlblood sample collected from the tarsal vein.
Light values obtained from geolocators are mea-sured every minute and the logger stores the maxi-mum reading (truncated at a value of 64) at the end ofevery 10 min. Light readings range from 0 (completedarkness) to 64 (full light) and sunrise and sunsetthresholds were set at 20. For each bird, latitude andlongitude were estimated twice a day from day andnight length and the time of local midday and mid-night relative to Greenwich mean time (GMT)(Phillips et al. 2004). During processing, we excludedlocations derived from curves with apparent interrup-tions around sunset and sunrise, or that showed aflight speed index greater than 30 km h−1, as calcu-lated by the root of the square speed average of thesegments formed with the 2 preceding and the 2 fol-lowing positions (González-Solís et al. 2007b). Loca-tions around the 21 March and 21 September equi -noxes were also excluded due to their inaccuracy.
Four periods were considered for the analyses (seeTable 7): (1) second-half of chick-rearing, i.e. thetime between logger deployment and the last day ofpresence at the colony, identified from location andactivity data; (2) non-breeding (from the last day ofcolony attendance until the subsequent first dayspent in the burrow during daylight); (3) pre- breeding (from the date of the first day spent in theburrow during daytime until the start of incubationas seen from activity data) and (4) incubation andearly chick-rearing (from the start of incubation asseen from activity data — 2 or more days spent in theburrow — until logger recovery, after excluding thedata around the 21 March equinox). Bird locations atsea were examined using ArcView GIS 3.2 (ESRI).The Animal Movement extension in ArcView wasused to generate kernel density maps in an equal-area cylindrical projection using the least-squarecross validation method, thus identifying key areasfor the 4 periods. Following previous authors (e.g.
Catry et al. 2009, Paiva et al. 2010b), we identified 2main kernel contours, namely ‘core areas of activity’(50% kernel) and ‘home range’ (95% kernel), as themain descriptors of the foraging distribution of Baroloshearwater; the maps also include the areas for the75% kernel. The core areas of activity and homeranges were mapped analyzing all birds together(see Fig. 3). To show the intra-individual variationsand overlap in the core areas of activity (50% ker-nel), we also present individual results for eachmarked bird (see Fig. 4). The loggers also had salt-water immersion sensors recording contact with salt-water every 3 s. Immersion values corresponded tothe number of contacts with saltwater for every10 min period, ranging from 0 (no contact with salt-water) to a maximum of 200 (10 min of continuousimmersion in saltwater). The activity patterns ofBarolo shearwaters were derived from immersiondata and matched with the light data to calculate theproportion of time and the total time spent on thewater and in flight during darkness and daylighteach day during the non-breeding period. During thepre-breeding, incubation and chick-rearing periods,activity patterns were only calculated during day-light because it is difficult to distinguish betweenflight and visits to the colony during darkness. Track-ing data from the period prior to migration have beenpublished by Roscales et al. (2011a).
We used Friedman tests to investigate whethercore area and home range size varied according tothe different periods of the yearly cycle (chick- rearing, pre-breeding, non-breeding; incubation wasnot included because we only have data for 3 individ-uals). We also used Friedman tests to determinewhether bathymetry, chlorophyll a (chl a) concentra-tion and sea surface temperature (SST) within thecore areas of each tracked individual varied accord-ing to the different periods of the yearly cycle (againwe could not use incubation).
Environmental data
Remotely sensed SST (°C) and near-surface primaryproductivity indicated by chl a concentration (mgm−3) were derived from standard mapped images col-lected by the Moderate Resolution Imaging Spectro-radiometer (MODIS) instrument aboard NASA’sAqua satellite and obtained from the Ocean ColorDiscipline Processing System (Campbell et al. 1995).Monthly averages used a 9 km2 spatial resolution forSST and a 4.6 km2 resolution for chl a. The datasetswere handled using a Geographic Information Sys -
273
Mar Ecol Prog Ser 452: 269–285, 2012
tem (GIS; ESRI Arc 9.3), with the aid of the MarineGeo spatial Ecology Tools extension, developed bythe Marine Geospatial Ecology Laboratory of DukeUniversity (Roberts et al. 2010). Bathymetry was de-termined using global 1 min grids in ASCII XYZ-for-mat (http://topex.ucsd.edu). Using ArcView GIS 3.2,we calculated average values of chl a, SST and un-derlying bathymetry for the 50% and 95% kernels foreach of the periods analyzed, that is, late chick- rearing in 2007, non-breeding period, pre-breedingand incubation, and early chick-rearing in 2008.
RESULTS
Diet
A total of 92 samples were collected (44 in 1998, 48in 2000). Nine other birds (8 in 1998, 1 in 2000) hadempty stomachs, and they were not included in analy-ses. The frequency of occurrence of the different preytypes did not differ between years (χ2
4 = 7.970, p =0.093). Cephalopods were the most common prey andwere present in over 90% of samples (Table 1).
Otoliths showed signs of erosion but most of themcould be identified from the shape and diagnostic sul-cus of the Phycis genus (Table 2, Fig. 1). In 1998, 173otoliths were found in 14 samples, 8 were too erodedto be identified and the remaining 165 oto liths wereall from Phycis sp. Overall, a total of 84 specimens ofPhycis sp. were found in 9 samples that contained onaverage 9.3 individuals (min. = 1 and max. = 27). Thesmall size of the otoliths (max. 2 mm) indicates thatthey were from very small fish — perhaps larvalstages. P. blennoides with a length of 60 mm haveotoliths of 4.05 mm (AFORO database, www. cmima.csic. es/ aforo/; Lombarte et al. 2006), so our specimenswere well below that value. This is corroborated bythe fact that some Barolo shearwaters had otolithsfrom up to 27 individual Phycis sp. in their stomach.
Ten different kinds of lower beaks were recog-nized and 8 could be identified to the genus. Table 3shows the numerical frequency of squid estimatedthrough the lower beaks present in the stomach con-tents, as well as their vertical distribution. The beaksoriginated from 6 families and at least 10 differenttaxa. The 18 specimens still attached to their buccalmasses were present in 9 samples from 1998 (allOnychia sp.) and 9 samples from 2000 (1 Tremocto-pus violaceus, 1 Onychoteuthis sp. and 7 Argonautaargo). Additionally, 1 sample contained flesh remainsand an almost complete pen of Onychia sp. or Ony-choteuthis sp. measuring 40 mm.
Argonauta argo was not detected in 1998, but 20samples from 2000 contained beaks of this species.The 20 samples containing A. argo had an average of5.7 specimens (SD = 9.3; range: 1 to 39).
In 1998, fish (inferred from otoliths) comprised61.2% and cephalopods (inferred from lower beaks)38.8% of prey by numbers, but in 2000, fish repre-sented only 10% and cephalopods 90% of prey (χ2
1 =65.533, p < 0.0001).
274
Taxon 1998 2000 Total
Crustaceans 13.6 (6) 14.6 (7) 14.1 (13)Cephalopods 93.2 (41) 93.8 (45) 93.5 (86)Beaks 84.1 (37) 93.8 (45) 89.1 (82)Fish 59.1 (26) 52.1 (25) 55.4 (51)Otoliths 31.8 (14) 6.3 (3) 18.5 (17)
Number of samples 44 48 92
Table 1. Puffinus baroli baroli. Diet. Squid comprised themajority of Barolo shearwater diet (by frequency of occur-rence, %) in the Azores in 1998 and 2000. Numbers of indi-
viduals found are in brackets
Family/Species 1998 2000 Total Phycidae./Phycis sp. 93.3 (84)a 40.0 (4)b 88.0Unidentified 6.7 (6) 60.0 (6) 12.0Number of prey items 90 10 100
aPhycis sp. otoliths were present in 10 samples: average 9.3 individuals (min. = 1 and max. = 27)
bPhycis sp. otoliths were present in only 1 sample
Table 2. Phycis sp. was the only fish prey identified in thediet of Barolo shearwater and the main fish present in theirdiet in 1998 (by numerical frequency, %). Numbers of indi-
viduals found are in brackets
Fig. 1. Phycis sp. Scanning electron microscope image of otoliths obtained from Barolo shearwater food samples

Neves et al.: Barolo shearwater feeding ecology
Estimates of the mean ML of the ce pha lo pod spe-cies (Table 4) ranged from 9.2 to 129.0 mm and esti-mated mean M ranged from 1.0 to 9.1 g. The size ofthe Onychia/Onychoteuthis pen found in 1 of thesamples (40 mm) fell well within the range of ML
estimated from lower rostral lengthmeasurements (Table 4).
Analysis of stable isotopes
δ15N values varied between 4.9 and14.1‰ and between 10.1 and 16.0‰in P1 and S8, respectively (Table 5). Inthe case of δ13C, isotope ratios rangedfrom −19.1 to −16.9‰ in P1 and from−18.4 to −7.2‰ in S8 (Table 5). Sec-ondary remiges showed significantlyhigher δ13C and δ15N values than pri-mary remiges (Wilks’ λ, F1,30 = 34.96and 25.39, respectively; bothp < 0.001) (Fig. 2). Sampling year alsohad a significant influence on seabirdδ13C and δ15N values (F2,30 = 10.93 and7.70, respectively; both p < 0.05). Inthe case of nitrogen, this was due togreater δ15N values in the samplesfrom 2008 compared to those from2003 (post-hoc Bonferroni pairwise
comparison, p < 0.05). Inter-annual differences in car-bon stable isotopes were significant due to the lowerδ13C values obtained in 2008 compared to the rest ofthe sampling years (post-hoc Bonferroni pairwisecomparisons, all p < 0.05). The MANOVA also indi-
275
Family 1998 2000 Total VerticalGenus/species distribution Decapods 39.9 (59) Ommastrephidae 6.8 (10) Todarodes sagittatus – 6.6 (6) 4.1 (6) MesopelagicUnidentified 7.0 (4) – 2.7 (4)
Onychoteuthidae 30.4 (45) Onychia sp. Onychoteuthis sp. 61.4 (35) 6.5 (10) Epipelagic
Cranchiidae 2.0 (3) Liocranchia reinhardti – 1.1 (1) 0.7 (1) EpipelagicTaonius pavo 1.8 (1) 1.1 (1) 1.4 (2) Mesopelagic
Histioteuthidae – 0.7 (1) Histioteuthis A 1.1 (1) Mesopelagic
Octopods – 60.1 (89) Unidentified 28.1 (16) 10.8 (16) Tremoctopodidae – Tremoctopus violaceus 1.1 (1) 1.8 (1) 1.4 (2) Epipelagic
Argonautidae Argonauta argo 78.0 (71) 48.0 (71) Epipelagic
Number of prey items 57 91 148
Table 3. Cephalopod diversity was higher than that of fish in the diet of Baroloshearwater. Birds consumed mainly Onychoteuthidae in 1998 and Argonauti-dae in 2000 (by numerical frequency, %), as identified by lower beaks.
Numbers of individuals are in brackets
Species N Measured LRL (mm)a Estimated ML (mm) Estimated SL (mm) Estimated M (g)
Todarodes sagittatus 6 1.3 ± 0.2 (1.0−1.5) 40.4 ± 8.6 (30.1−50.7) 70.3 ± 14.9 (52.3−88.3) 4.4 ± 1.9 (2.2−6.9)Onychia sp./ 40 1.0 ± 0.3 (0.46−1.5) 36.1 ± 13.8 (4.0−62.6) 51.6 ± 23.4 (6.1−94.0) 2.8 ± 1.9 (0.2−8.0)Onychoteuthis sp.b
Liocranchia reinhardti 1 1.4 86.0 120.4 9.1Taonius pavo 2 2.3−4.2 129.0−245.7 150.3−286.2 5.0−9.2Histioteuthis A 1 0.2 – – –Tremoctopus violaceus 2 0.9−1.3 19.6−28.3 75.3−108.7 6.5−8.5Argonauta argo 71 0.8 ± 0.6 (0.2−4.1) 9.2 ± 7.5 (2.0−49.2) 20.2 ± 16.5 (4.3−108.2) 1.0 ± 3.8 (0.003−30.5)aLower hood length for T. violaceus and A. argobEstimate based on the allometric equation for Onychoteuthis banksi (Clarke 1986)
Table 4. Lower rostral lengths (LRL) and estimated mantle length (ML), standard length (SL) and body mass (M) of the squid consumed by Barolo shearwaters in the Azores. Values given are means ± SD, with ranges in brackets
Year δ13C (P1) Range δ15N (P1) Range δ13C (S8) Range δ15N (S8) Range
2003 (10) −18.3 ± 0.1 −18.7 to −16.9 9.5 ± 0.7 4.9 to 11.5 −17.0 ± 0.2 −18.1 to −15.9 11.8 ± 0.4 10.1 to 13.72004 (10) −17.7 ± 0.2 −19.1 to −17.0 10.3 ± 0.5 6.3 to 11.7 −16.1 ± 0.2 −17.5 to −16.2 12.7 ± 0.2 11.9 to 14.12008 (10) −18.3 ± 0.1 −18.8 to −17.9 11.7 ± 0.6 8.9 to 14.1 −17.9 ± 0.1 −18.4 to −7.2 13.5 ± 0.5 10.5 to 16.0
Table 5. Puffinus baroli baroli. Stable nitrogen isotope values of Barolo shearwater on Vila islet (Azores) are higher at the endof the non-breeding period (S8 = eighth secondary) than at the end of the breeding period (P1 = first primary). Values are
means ± SD ‰. Sample sizes in brackets

Mar Ecol Prog Ser 452: 269–285, 2012
cated that the inter action between feathers and yearswas not significant, which means that the differencesin isotopic values be tween P1 and S8 were uniformacross years for both δ13C and δ15N (Fig. 2, Wilks’ λ,F1,30 = 2.84 and 0.20, respectively; both p > 0.05).
Maximum diving depths
Out of the 6 birds that were equipped with MDGs,2 were equipped once, 3 other birds were equippedtwice, and the sixth bird was equipped 3 times. Tengauges were recovered and all indicated that the
birds had dived. However, 1 tube was not readable,that is, the boundary between dissolved and undis-solved sugar was not clear-cut. Since all the birdsreturned, the missing gauge was lost at sea. Re -corded maximum depths averaged 14.8 m (range: 7.9to 23.1, n = 9 gauges, Table 6), and did not differ sig-nificantly among individuals (Kruskal-Wallis test forsmall samples, H2 = 1.36, p > 0.1; only the individualsfrom which at least 2 gauges were recovered wereconsidered). None of the birds equipped with MDGswere missed at night, so all gauges were recoveredafter a single foraging trip.
At-sea distribution and activity patterns
Only 4 of the 10 geolocators were recovered, 3 frommales and 1 from a bird of undetermined sex (DNAextraction did not work for this bird); Table 7 pro-vides details of geolocator deployment and of thebreeding phenology of each individual inferred from
276
Individual Mean maximum Number of depth (range) recovered gauges
1 19.0 (14.9−23.1) 22 14.5 1a
3 Gauge not readable 14 12.7 (7.9−15.7) 35 14.7 (14.0−15.5) 26 12.9 1
aThis bird was equipped again and returned thesubsequent night but the second gauge was lost at sea
Table 6. Puffinus baroli baroli. Barolo shearwaters from Vilaislet reach a maximum diving depth of 23.1 m, but feedmainly in the upper 15 m of the water column. Each gauge
was deployed during a single foraging trip
Geo (sex) Deployed Recovered End of Start of pre- Start of Breeding Breeding Time away chick- breedingb incubationc output output from rearinga 2007 2008 the colony
2190 (M) 14-04-2007 20-04-2008 23-05-2007 19-12-2007 28-03-2008 Chick Egg 7 mo2200 (M) 11-04-2007 16-04-2008 09-05-2007 15-11-2007 15-02-2008 Chick Chick 6 mo2204 (M) 11-04-2007 21-04-2008 22-04-2007 23-09-2007 Non-breeder Incubation Non-breeder 5 mo failured
2207 (?) 11-04-2007 21-04-2008 27-05-2007 03-10-2007 11-02-2008 Chick Addled egg 4 mo
aDate of the last night that the bird visited the colony, determined from logger activity data; bDate of the first time that thebird visited the colony and spent the day (daylight) inside the nest after the non-breeding period, determined from loggeractivity data; cDate of the first time that the bird remained in the nest for 2 or more d, determined from logger activity data;dIt is unknown if the bird failed as a consequence of the geolocator or if the egg was already doomed
Table 7. Puffinus baroli baroli. Details of logger deployment and breeding phenology of the tracked birds. Dates are given as dd-mm-yr
Fig. 2. Puffinus baroli baroli. Carbon and nitrogen stable iso-tope values (mean ± SD) in primary (P1) and secondary (S8)
remiges of Barolo shearwaters in 2003, 2004 and 2008

Neves et al.: Barolo shearwater feeding ecology
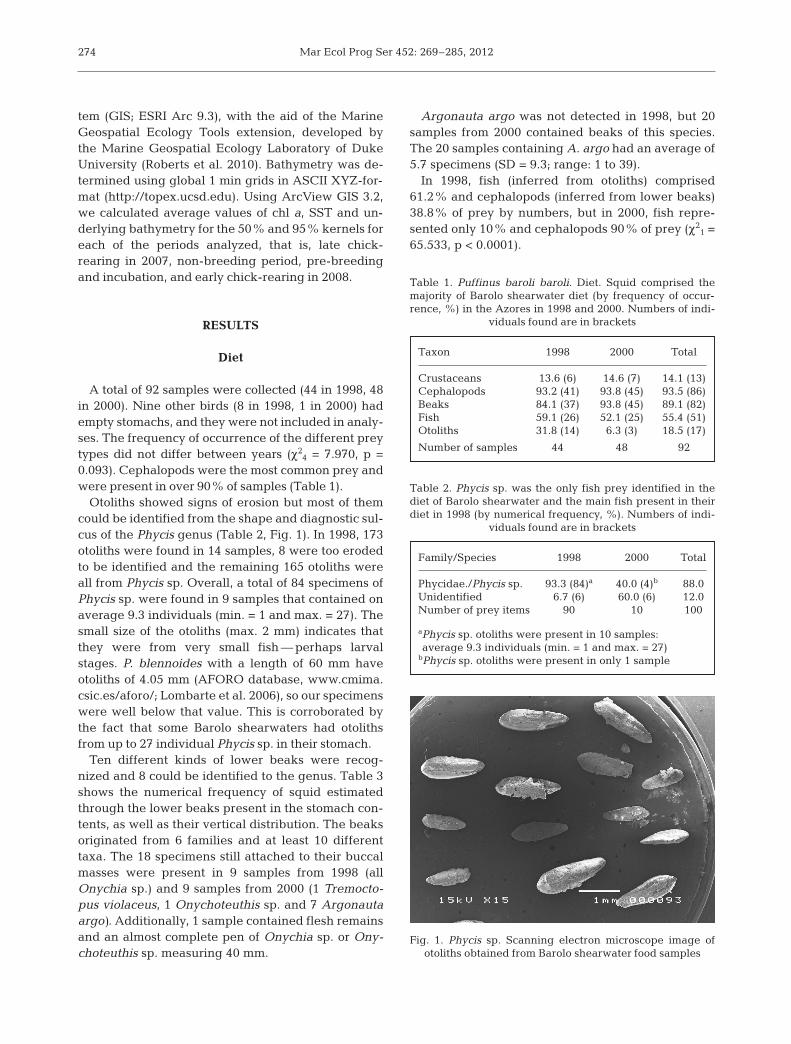
logger data. Three of these birds (loggers 2190, 2200and 2207) had successfully raised a chick while carrying the geolocator and the fourth bird (logger2204) either failed during incubation or did notattempt to breed. During the chick-rearing period of2007, be tween 11 April and 27 May, Barolo shear -waters were tracked for 37.3 ± 6.7 d on average(range: 30 to 43) with a mean of 66.3 ± 20.1 positionsper bird (range: 45 to 85). The core foraging areas(50% kernel) during this period were almost exclu-sively located south of the colony (Fig. 3a) and therewas some overlap in the distribution of the 3 breed-ing birds (Fig. 4a). The bird that failed during incuba-tion still showed some overlap with the breeders inits home range but not in its core area of activity(Fig. 4a). Additionally, it foraged further north, sug-gesting that chick-rearing restricts the movements ofbreeders. The home range area (95% kernel) usedby the 3 chick-rearing individuals exceeded 439 000km2 but the core area of activity (50% kernel) wasmuch smaller, totaling about 61 000 km2. On average,birds spent 77% of their time during daylight sittingon the water (see Table 9).
During the non-breeding period, between 10 Mayand 19 December, birds were tracked for a mean of152.5 ± 54.3 d (range: 106 to 209) with a mean of228.0 ± 61.5 positions per bird (range: 152 to 293).Birds dispersed more extensively in all directions butconcentrated northwards and eastwards, travellinglonger distances (up to 2500 km) to the north than toany other direction (Fig. 3b). The area used by the 4individuals (95% kernel) exceeded 3 250 000 km2,but the core area of activity (50% kernel) was muchsmaller (about 432 000 km2). There was also someoverlap between the tracked individuals, with theexception of bird 2190, which had a core area muchfurther north (Fig. 4b). During the non-breedingperiod, Barolo shearwaters spent a high proportion(89.4%) of the darkness period on the water and onlyabout 1.2 h flying (Table 8). During the daytime, theproportion of time spent on the water decreased butwas still quite high (79.7%) and birds spent on aver-age 2.9 h flying (Table 8).
Birds were very asynchronous regarding the timeat which they started visiting the colony again(Table 7). Bird 2204, which failed incubation in2007, was the first to visit the colony on 7 October2007 and bird 2190 was the last on 20 December2007. During the pre-breeding period, birds spo-radically visited the colony and still foraged on aspatial scale similar to the non-breeding period,mainly north of the colony (Figs. 3c & 4c). The coreareas of birds 2190 and 2200 were mainly situated
within the limits of the Azorean Exclusive EconomicZone (Fig. 4c).
During the pre-breeding period, from 23 Septem-ber to 10 February, birds were tracked for 89.3 ±30.3 d (range: 49 to 115) with a mean of 170.0 ± 57.7positions per bird (range: 93 to 222). Again, birdsmainly foraged north of the colony but they spentmore time there than during the non-breeding period(Fig. 4c). The area used by the 4 individuals ex ceeded2 000 000 km2 but the core area of activity (50% ker-nel) was much smaller, at about 157 000 km2 (Fig. 3c).Birds spent on average 76% of their time during day-light sitting on the water (Table 9).
The incubation and early chick-rearing in 2008included only movements by 2 males which wereincubating or raising a chick upon geolocator recov-ery, namely birds 2190 and 2200 (of the 2 remainingbirds, one — bird 2207 — had failed incubation, andthe other — bird 2204 — did not breed in 2008). Dur-ing the incubation and early chick-rearing periods of2008, between 11 February and 21 April, the 2 breed-ing males were tracked for 23.0 ± 2.8 d with a mean of41.0 ± 8.5 positions per bird (range: 35 to 47). The areaused by these 2 individuals exceeded 2 320 000 km2
but the core area of activity (50% kernel) was muchsmaller, at about 570 000 km2 (Fig. 3d). This was theperiod when the proportion of time spent flying dur-ing the day was highest (84.1%; Table 9).
Throughout the year, birds mostly targeted areas ofdeep waters (3306 to 4701 m; Table 10) and ge nerallylow surface productivity (range: 0.10 to 0.26 mg m−3;Table 10).
Core area size, bathymetry, chl a concentration andSST within the core areas of each individual did notvary significantly between the chick-rearing, non-breeding and pre-breeding periods (Friedman test,all 0.09 ≤ p ≤ 0.98). Conversely, home range areaseemed to vary more importantly between theseperiods (Friedman test, p = 0.039) but these varia-tions were no more significant after sequential Bon-ferroni correction.
Foraging trip duration
In 2004, gauge deployment duration equaled forag-ing trip duration (see above), that is, 1.27 ± 0.65 d onaverage (range: 1 to 3, n = 11 trips) and 82% of tripslasted only 1 d. In 2007, geolocators also providedsome information on foraging trip duration duringchick-rearing, in addition to activity patterns: individ-ual foraging trips in April and May 2007 lasted on av-erage 1.13 ± 0.34 d (range: 1 to 2, n = 97 trips), 87% of
277

Mar Ecol Prog Ser 452: 269–285, 2012278
Fig. 3. Puffinus baroli baroli. Density distribution (50%, 75% and 95% kernel contours) of Barolo shearwaters during: (a) thesecond half of chick-rearing, (b) non-breeding, (c) pre-breeding and (d) incubation and early chick-rearing periods. The
colony is marked with a star. Data from all tracked birds combined
Neves et al.: Barolo shearwater feeding ecology 279
Individual (sex) Time on water (%) Total time on water (h) Total time in flight (h) Daylight Darkness Daylight Darkness Daylight Darkness
2190 (M) 79.0 ± 11.7 91.2 ± 10.2 10.7 ± 2.5 9.6 ± 2.2 2.8 ± 1.8 0.9 ± 1.02200 (M) 85.1 ± 10.8 84.7 ± 18.4 11.9 ± 2.3 8.3 ± 1.6 2.0 ± 1.4 1.8 ± 2.22204 (M) 75.6 ± 15.1 87.8 ± 18.6 11.4 ± 2.7 7.8 ± 1.5 3.6 ± 2.1 1.2 ± 1.92207 (?) 79.0 ± 13.1 93.7 ± 10.6 11.6 ± 2.5 8.7 ± 1.2 3.0 ± 1.7 0.7 ± 1.2Mean 79.7 ± 14.4 89.4 ± 15.5 11.4 ± 2.8 8.6 ± 1.4 2.9 ± 1.8 1.2 ± 1.8
Table 8. Puffinus baroli baroli. During the non-breeding period, Barolo shearwaters spend more time on the water than in flight. Values are means ± SD
Fig. 4. Puffinus baroli baroli. Density distribution (50% kernel contours) of Barolo shearwaters during (a) the second half ofchick-rearing, (b) non-breeding, (c) pre-breeding and (d) incubation and early chick-rearing periods. Data are presented for
each tracked individual. EEZ: Economic Exclusive Zone

Mar Ecol Prog Ser 452: 269–285, 2012
them being single-day trips. On average, however,individuals did not perform significantly longer tripsin 2004 than in 2007 (Mann-Whitney U = 5, N1 = 6,N2 = 3, p > 0.2). Additionally, in 2008, geolocators provided some information on the durations of incu-bation shifts and foraging trips during incubation,which were 6.2 ± 2.4 d (range: 3 to 10, n = 6 trips) and6.3 ± 2.4 d (range: 3 to 9, n = 6 trips), respectively.
DISCUSSION
This is the first detailed study on the feeding ecol-ogy of the Barolo shearwater merging information ondiet, trophic level, diving ability, foraging move-ments and at-sea activity patterns.
Diving abilities, activity patterns and diet composition
Maximum depth gauges showed that Barolo shear-waters exploit the upper 15 m of the water columnduring chick-rearing. On average, the maximumdive depths of this species were much greater thanthose reached by other small Azorean Procellari-iformes (Bulwer’s petrel Bulweria bulwerii: 2.4 m,Mougin & Mougin 2000; Monteiro’s storm-petrelOceanodroma monteiroi: 0.85 m, Bried 2005), butthey were similar to those of its close relativeAudubon’s shearwater Puffinus lherminieri (15 m,Burger 2001). Burger (2001) also showed that theabsolute maximum depths reached by Puffinusshearwaters equipped with MDGs were close tothose predicted by his allometric equation for pen-guins and alcids (Burger 1991). According to thisequation, the 172 g (value obtained by Monteiro etal. 1996 from 157 individuals, close to that obtainedin this study) Barolo shearwater should be able toreach 43.5 m underwater. The absolute maximumdepth recorded here was 23.1 m, that is, about halfthe predicted value, and well below the 35 m re -corded for the 168 g Audubon shearwater (Burger2001). These results suggest that Barolo shearwatersmight have a limited diving capacity compared toother shearwater species, or that they do not need todive as deep as they could to find their prey duringthe chick-rearing period. Barolo shearwaters arethought to be mainly diurnal at sea but activity dataduring the non-breeding period show that birdsspend most of the time resting on the sea surface dur-ing both night and day. On average, the amount oftime that birds spent in the water during daylightexceeded 75%, a value about 20% higher than that
280
Individual Time on water (%) Total time on water (h) Total time in flight (h)(sex) CR PB Incub. CR PB Incub. CR PB Incub.
2190 (M) 80.7 ± 5.5 79.7 ± 12.2 85.0 ± 6.6 11.5 ± 0.8 8.9 ± 1.7 11.4 ± 0.9 2.8 ± 0.8 2.2 ± 1.2 2.0 ± 0.92200 (M) 80.2 ± 7.1 91.0 ± 6.5 90.9 ± 6.4 11.2 ± 1.1 9.6 ± 0.8 11.4 ± 0.8 2.8 ± 0.9 1.1 ± 1.2 1.2 ± 0.82204 (M) 71.6 ± 8.3a 65.2 ± 16.9b – 9.7 ± 1.0 6.8 ± 2.0 – 3.9 ± 1.2 3.6 ± 1.8 –2207 (?) 75.1 ± 8.2 68.1 ± 16.8 76.5 ± 12.4c 10.7 ± 1.3 7.0 ± 1.6 9.4 ± 1.7 3.6 ± 1.2 3.3 ± 1.8 2.8 ± 1.4Mean 76.9 ± 7.3 76.0 ± 13.1 84.1 ± 8.5 10.8 ± 1.1 8.1 ± 1.5 10.7 ± 1.1 3.3 ± 1.0 2.6 ± 1.0 2.0 ± 1.0
aCorresponds to the period between 12 and 22 April 2007, after that the bird abandoned the nest. The data refers to incu-bation since this bird did not have a chick; bCorresponds to the period from when the bird started visiting the colony (23September 2007) until the logger stopped recording activity data (21 February 2008). At this time, the bird had not startedincubation and did not have an egg when we recovered the geolocator on the 21 April 2008; cThe logger stopped collectingactivity data on the 31 March 2008
Table 9. Puffinus baroli baroli. Birds spend more time on the water than in flight during the chick-rearing, pre-breeding andincubation periods. Values are means ± SD. Only values for daylight are included since during darkness it is not possible to
distinguish between flight and nest attendance. CR: Chick-rearing; PB: Pre-breeding; Incub.: Incubation
Breeding Water Chl a concen- SST (°C)stage depth (m) tration (mg m−3)
Chick-rearing (2190, 2200, 2207) 50% kernel 4355 ± 805 0.10 ± 0.02 18.9 ± 0.795% kernel 4701 ± 898 0.10 ± 0.04 19.6 ± 1.0
Non-breeding (2190, 2200, 2204, 2207) 50% kernel 4133 ± 771 0.18 ± 0.09 18.5 ± 1.795% kernel 3689 ± 1034 0.25 ± 0.23 17.7 ± 3.6
Pre-breeding (2190, 2200, 2204, 2207) 50% kernel 3306 ± 673 0.24 ± 0.08 17.0 ± 2.495% kernel 3371 ± 889 0.24 ± 0.11 15.3 ± 2.7
Incubation and early-chick rearing (2190, 2200) 50% kernel 3734 ± 1186 0.26 ± 0.16 16.9 ± 2.295% kernel 4004 ± 1158 0.22 ± 0.15 17.6 ± 3.3
Table 10. Puffinus baroli baroli. Barolo shearwater targetedareas of deep waters and generally low surface productivity.Birds used in each stage in brackets. Values are means ± SD.SST = sea surface temperature. Areas of the 50% and 95%
kernels are presented in Fig. 3

Neves et al.: Barolo shearwater feeding ecology
found for the congeneric wedge-tailed shearwater P.pacificus (Catry et al. 2009). Indeed, activity patternsduring the non-breeding period showed that Baroloshearwaters do not have a marked diurnal or noctur-nal cycle but they may forage both in darkness and indaylight conditions, although birds showed a slightlygreater tendency to fly during daytime.
The cephalopods Argonauta argo, Tremoctopus violaceus, and very small Onychia/Onychoteuthis sp.,Liocranchia reinhardti and Todarodes sagittatus areknown to come near the surface (to the upper 50 cm)at night (M. R. Clarke pers. obs.), although adults areusually found at greater depths. During the day, thesespecies are not sampled at the surface by conventionalmethods but it is likely that they move to the surface attwilight, shortly after sunset. The squid HistioteuthisA and Taonius pavo are also considered to live atgreater depths but our results indicate that the juve-niles of these species may come to the surface. Thelower hood length of beaks of adult A. argo varies be-tween 3 and 5 mm (Clarke 1986), but that of the A.argo consumed by Barolo shearwaters in the Azoreswas generally shorter than 1.5 mm, indicating birdswere feeding on juveniles. The dietary spectrum ofBarolo shearwaters in the Azores showed a con -siderable diversity of cephalopods, in cluding repre-sentatives of 6 families. On the Hawaiian Islands,Harrison et al. (1983) showed that wedge-tailedshear waters and Christmas shearwaters Puffinus na-tivitatis mainly fed on squid of the Omastrephidaefamily (99%, by number of identified squid) but someOctopoda and Onychoteutidae were also consumed.However, the frequency of occurrence of squid wasonly 28% in the diet of short-tailed shearwaters P.tenuirostris in Tasmania (Skira 1986). In wedge-tailedshearwaters and Christmas shearwaters, squid ac-counted for 29% and 48% of the total volume of in-gested prey, respectively. It remains unknown whetherthis reflects higher versatility from Barolo shearwaters,a higher diversity of the cephalopod prey availablein the Azores area, or both. A. argo has been found inthe stomachs of longnose lancet fish Alepisaurusferox, dolphinfish Cory pha ena hippurus (Clarke1986), swordfish Xiphias gladius from the easternMediterranean (Bello 1991) and from the Azores re-gion (Clarke et al. 1995) and also blue shark Prionaceglauca from the Azores (Clarke et al. 1996). A. argowas the most abundant ce pha lo pod in the stomachs ofBarolo shearwaters and was also the most abundantce pha lo pod prey (occurrence = 18%) found in stom-achs of swordfish in the Azores (Clarke et al. 1995),suggesting that this species might be common aroundthe archipelago.
Similarly to Barolo shearweaters, the Bulwer’spetrels from the Azores also feed on a high diversityof small cephalopods (Neves et al. 2011). Previousstudies of the diet of Cory’s shearwater in the Azores(Granadeiro et al. 1998) found a smaller contributionof cephalopods than we did here, both in terms ofoccurrence (FO = 24%) and number (NF = 4.4%).Conversely, the frequency of occurrence of squid inthe diet of Barolo shearwaters exceeded 90%. Thelarge occurrence and diversity of small squid in theirdiet, together with the fact that they may forage byday and by night, strongly suggest that Barolo shear-waters are able to exploit the diel vertical migrationof these prey, feeding extensively when juvenilecephalopods move up to the epipelagic zone at night.Our study also confirms that seabirds are amongstthe best samplers of cephalopod populations cur-rently available (Croxall & Prince 1996). In thisregard, the wide variety and the inter-annualchanges in the squid composition found in the diet ofthe Barolo shearwater indicates its potential useful-ness for monitoring the Azores squid community.
Concerning fish prey, Phycis sp. of the size rangefound in Barolo shearwater stomachs (max. size<60 mm) have never been caught by scientific crui -ses in the Azores, the smallest individual caughtbeing 150 mm long (J. Fontes pers. comm.). Mature P.phycis females are found from October to February(Â. Canha pers. comm.), so it is possible that thesmall Phycidae found in Barolo shearwater stomachsin late March resulted from recent spawning. Thelow diversity of fish prey found in Barolo shearwaterstomachs may be a true reflection of their diet butmay also be due to the fact that this seabird feeds onsmall prey with small otoliths that are easily digestedand often not detected in the diet samples. In fact,only 17 out of 51 samples with fish remains also con-tained otoliths. This limitation, typical of conven-tional dietary studies, suggests the diet compositionpresented above represents minimum values of preyrichness. Additionally, the lower number of otolithsfound in 2000 may be a reflection of otolith digestionand not a true indicator of a decrease in fish num-bers; despite the fact that fish was present in 52% ofsamples, otoliths only appeared in 6% of samples.
Trophic level and trophic niche
Overall, the main prey species found in the diet ofthe Barolo shearwater were very small epipelagicsquid and fish species, which together with low nitro-gen values in their feathers confirm that these shear-
281

Mar Ecol Prog Ser 452: 269–285, 2012
waters are the seabirds with the lowest trophic levelin the NE Atlantic (Roscales et al. 2011a). These find-ings are consistent with previous studies based onbiomagnificative contaminants (whose concentrationin tissues or feathers tends to increase with trophiclevel), which showed that mean mercury and persis-tent organic pollutant (POP) concentrations in thebreast feathers and blood of Barolo shearwaters,respectively, were the lowest amongst the AzoreanProcellariiformes (Monteiro 1996, Roscales et al.2011b). Moreover, Barolo shearwaters showed abroader range of variation for both δ13C and δ15Ncompared to the 2 storm petrels Oceanodroma spp.and Cory’s shearwaters breeding in Azores (Bolton etal. 2008, Roscales et al. 2011a). This result is consis-tent with the broad prey spectrum found in the dietand probably reflects the ability of Barolo shearwa-ters to exploit a greater portion of the water columncompared to many other Azorean seabirds as well asto feed both by day and by night. When comparingthe results of geolocators to those of stable isotopeswe found no relationship between δ15N or δ13C andforaging areas. This result is not surprising given thatiso topic landscapes in the NE Atlantic context arerelatively homogeneous, especially among the north-ern Macaronesian archipelagos (Graham et al. 2010,Roscales et al. 2011a). Given that Barolo shearwatersdo not migrate far from their colonies and their feed-ing areas at the end of the breeding period widelyoverlap with those exploited during the non-breed-ing period (Fig. 4), the consistent increase in nitrogenvalues from P1 to S8 over 3 yr probably indicates adietary switch from the breeding to the non-breedingperiod, when these feathers are respectively thoughtto be grown. Alternatively, these changes in the iso-topic signatures may reflect seasonal changes inbaseline values. Nevertheless, some dietary changesare expected as seasonal changes in baseline stableisotope values within the north Atlantic levels aremarkedly lower than those we found between P1 andS8 (Montoya et al. 2002). The enrichment of δ15N inS8 suggests a higher trophic level during the non-breeding period, which may indicate a more selec-tive foraging on larger prey, related to an uncon-strained foraging range out of the breeding period orto a selection of smaller prey for chick feeding duringthe breeding period (Badalamenti et al. 2002, Cherel& Hobson 2005). In the present study, stable isotopicvalues of P1 and S8 also showed significant differ-ences among years due to the anomalous δ15N andδ13C values found in 2008. It is difficult to explain thehigher δ15N and lower δ13C values obtained in 2008for P1 and S8, respectively. Given that Barolo shear-
waters perform short foraging trips during chick-rearing it is hard to conceive that they could afford toexploit different isotopic landscapes from one year tothe next. These values could be due to stochasticabundance and availability of a given prey with dif-ferent isotopic values than the common prey or to dif-ferences in the baseline values of carbon and nitro-gen isotopes in 2008 caused by changes in watermass driven by climate or oceanography.
Seasonal distribution at sea
On Vila islet, adults visited their nests on mostnights during the chick-rearing period. Our resultstherefore confirm those of Hamer (1994) on Sel-vagem Grande, situated ca. 1100 km from Vila islet,where Barolo shearwater chicks received food fromtheir parents on 95% of nights. High visitation rateshave also been observed in other small shearwaters:chicks of Puffinus assimilis assimilis were visited byone or both parents during 94% of nights (Priddel etal. 2003), P. a. haurakiensis chicks were fed during90% of nights (Booth et al. 2000) and P. a. kermade-censis chicks were visited by 1 or both parents eachnight (Warham 1955). Overall, these results suggestall ‘little’ shearwaters mostly forage close to theirbreeding colony when rearing their chicks. This wasconfirmed by the geolocator data concerning the sec-ond half of the chick-rearing period, which showedthat core foraging areas were located at relativelyclose proximity to the colony, and by the duration ofthe foraging trips, most of which lasted only 1 d. Theabsence of oil in the stomachs of Barolo shearwaters,which suggests that adults deliver fresh meals totheir chicks, was also consistent with these findings.Interestingly, the birds from Vila islet seemed to tar-get oceanic areas with very deep bathymetry even ifthey had seamounts and higher productivity areaswithin reach (Tempera et al. 2009). Similarly, wedge-tailed shearwaters also forage over deep, warm andrelatively unproductive oceanic waters in the IndianOcean (Catry et al. 2009). This habitat segregationpossibly minimizes competition with the larger andmore abundant Cory’s shearwater, which foragesmostly in low depth (i.e. seamounts) and productivesea scapes in the Azores (Magalhães et al. 2008, Paivaet al. 2010b). During incubation, Barolo shearwatersseemed to forage over a considerably larger areathan during chick-rearing, and the duration of theforaging trips was also longer during incubation thanduring chick-rearing. Foraging trips have also beenshown to be longer on average during incubation
282

Neves et al.: Barolo shearwater feeding ecology
than during chick-rearing in several procellariiformspecies (e.g. wandering albatross Diomedea exulans,Weimerskirch et al. 1993; Cory’s shearwater, Paiva etal. 2010a,c; white-chinned petrel Procellaria aequi -noctialis, Berrow et al. 2000).
During the non-breeding period, Barolo shearwa-ters increased their core foraging area 10-fold (up to2500 km from the colony) compared with the chick-rearing period, but overall they remained in the northAtlantic region, confirming previous hypo theses(Monteiro et al. 1996) that this species does not per-form large-scale migrations. In contrast, the Azoreanpopulations of Cory’s shearwaters (González-Solís etal. 2007a), Bulwer’s petrels (J. González-Solís unpubl.data), common terns Sterna hirundo and roseate ternsS. dougallii (Hays et al. 2002, Neves et al. 2002) over-winter in the southern Atlantic. The only otherAzorean petrel that may remain in the Azoreanwaters throughout the year is the endemic Monteiro’sstorm-petrel (Bolton et al. 2008).
Overall, our results illustrate how integrating dif-ferent methods increases understanding of the feed-ing ecology and foraging behaviour of an elusivespecies and indicate that the Barolo shearwater feedson a diverse spectrum of small squid and fish of lowtrophic level, during both day and night, on areaswith a deep bathymetry and in a relatively large por-tion of the water column. The contrasting foragingecology of this species when compared to the otherAzorean Procellariiformes confirms the existence ofan important degree of ecological segregation withinthe seabird community from the Azores (Roscales etal. 2011a). In this regard, the sharp differences in theexploited areas highlight the need to consider themovements of several seabird species with a widerange of ecological requirements when definingimportant bird areas at sea.
Acknowledgements. This work was co-financed by the Por-tuguese Foundation for Science and Technology (researchcontracts PRAXIS/2/2.1/MAR/1680/95 and grant PRAXIS/XXI/BIC/17094/98 and FCT/BPD/26657/2006 to V.C.N.,grants IMAR/FCT-PDOC-001/2001-BirdEco and FRH/ BPD/20291/2004 to J.B.), by POCI 2010 and FSE, and by the Ministerio de Ciencia e Innovación and Fondos FEDER(CGL2009-11278/BOS). Fieldwork was funded by the Pro-grammes ‘OGAMP’ (Planning and Management of MarineProtected Areas, Interreg IIIB-MAC/4.2/A2), and ‘MAR-MAC’ (Knowledge, Promotion and Valorization for a Sus-tainable Utilization of Marine Protected Areas in Macarone-sia, Interreg IIIB-05/FEDER/MAC/4.2/A4). IMAR-DOP/UAçis funded through the pluri-annual and programmatic fund-ing schemes of FCT and DRCT (Azores, Portugal) as Re -search Unit No. 531 and Associate Laboratory No. 9. Thanksto R. Medeiros for help with Figs. 3 & 4. We thank A.Mendes, A. Paixão, A. Tavares, J. Pereira, M. Carvalho, M.
Laranjo, P. Pedro and R. Ceia for field assistance, as well asthe Clube Naval of Santa Maria (especially M. Cabral) andJ. M. Soares and his family for transport to Vila Islet. Finallywe thank B. Zonfrillo and 4 anonymous referees whose use-ful suggestions greatly improved the manuscript. This studywould not have been possible without L. Monteiro, who diedin a plane accident before the fieldwork was concluded. Theexperimental procedure complied with the Portuguese lawand was conducted under licenses Nos. 1/98 and 1/CN/2004issued by the Direcção Regional do Ambiente from theAzores.
LITERATURE CITED
Badalamenti F, D’Anna G, Pinnegar JK, Polunin NVC (2002)Size-related trophodynamic changes in three target fishspecies recovering from intensive trawling. Mar Biol 14: 561−570
Barrett RT, Camphuysen CJ, Anker-Nilssen T, Chardine JWand others (2007) Diet studies of seabirds: a review andrecommendations. ICES J Mar Sci 64: 1675−1691
Bello G (1991) Role of cephalopods in the diet of the sword-fish Xiphias gladius, from the Eastern MediterraneanSea. Bull Mar Sci 49: 312−324
Berrow SD, Wood AG, Prince PA (2000) Foraging locationand range of white-chinned petrels Procellaria aequinoc-tialis breeding in the South Atlantic. J Avian Biol 31: 303−311
BirdLife International (2004) Birds in Europe: populationestimates, trends and conservation status. BirdLife Inter-national, Cambridge
Bocher P, Labidoire B, Cherel Y (2000) Maximum divedepths of common diving petrels (Pelecanoides urinatrix)during the annual cycle at Mayes Island, Kerguelen. JZool (Lond) 251: 517−524
Bolton M, Smith AL, Gómez-Díaz E, Friesen VL and others(2008) Monteiro’s storm-petrel Oceanodroma monteiroi: a new species from the Azores. Ibis 150: 717−727
Booth AM, Minot EO, Fordham RA, Imber MJ (2000) Coor-dinated food provisioning in the little shearwater Puffi-nus assimilis haurakiensis: a previously undescribed for-aging strategy in the Procellariidae. Ibis 142: 139−158
Bried J (2005) Diving ability of the Madeiran storm petrel.Waterbirds 28: 162−166
Brooke ML (2004a) Albatrosses and petrels across the world.Oxford University Press, Oxford
Brooke ML (2004b) The food consumption of the world’sseabirds. Biol Lett 271: 246−248
Burger AE (1991) Maximum diving depths and underwaterforaging in alcids and penguins. In: Montevecchi WAGaston AJ (eds) Studies of high latitude seabirds 1.Behavioural, energetic and oceanographic aspects ofseabird feeding ecology. Canadian Wildlife ServiceOccasional Paper 68, p 9–15
Burger AE (2001) Diving depths of shearwaters. Auk 118: 755−759
Burger AE, Shaffer SA (2008) Application of tracking anddata-logging technology in research and conservation ofseabirds. Auk 125: 253−264
Burger AE, Wilson RP (1988) Capillary tube depth gaugesfor diving animals: an assessment of their accuracy andtheir applicability. J Field Ornithol 59: 345−354
Campbell JW, Blaisdell JM, Darzi M (1995) Level-3 Sea -WiFS data products: spatial and temporal binning algo-
283
Mar Ecol Prog Ser 452: 269–285, 2012
rithms. In: Hooker SB, Firestone ER, Acker, JG (eds)NASA Tech Memo 104566, Vol 32. NASA GoddardSpace Flight Center, Greenbelt, MD, 1–80
Catry T, Ramos JA, Le Corre M, Phillips RA (2009) Move-ments, at-sea distribution and behaviour of a tropicalpelagic seabird: the wedge-tailed shearwater in thewestern Indian Ocean. Mar Ecol Prog Ser 391: 231−242
Cherel Y, Hobson KA (2005) Stable isotopes, beaks andpredators: a new tool to study the trophic ecology ofcephalopods, including giant and colossal squids. ProcBiol Sci 272: 1601−1607
Clarke MR (1986) A handbook of identification of cephalo-pod beaks. Clarendon Press, Oxford
Clarke MR, Clarke DC, Martins HR, Silva HM (1995) Thediet of swordfish (Xiphias gladius) in Azorean waters.Arquipél Life Mar Sci 13: 53−56
Clarke MR, Clarke DC, Martins HR, Silva HM (1996) Thediet of the blue shark (Prionace glauca L.) in Azoreanwaters. Arquipél Life Mar Sci 14: 41−56
Connan M, Mayzaud P, Trouvé C, Barbraud C, Cherel Y(2008) Interannual dietary changes and demographicconsequences in breeding blue petrels from KerguelenIslands. Mar Ecol Prog Ser 373: 123−135
Croxall JP, Prince PA (1996) Cephalopods as prey: seabirds.Philos Trans R Soc Lond B 351: 1023−1043
DeNiro MJ, Epstein S (1978) Influence of diet on the distrib-ution of carbon isotopes in animals. Geochim CosmochimActa 42: 495−506
DeNiro MJ, Epstein S (1981) Influence of diet on the distrib-ution of nitrogen isotopes in animals. Geochim Cos-mochim Acta 45: 341−351
Forero MG, Bortolotti GR, Hobson KA, Donazar JA, Bertel-loti M, Guillermo B (2004) High trophic overlap withinthe seabird community of Argentinean Patagonia: a mul-tiscale approach. J Anim Ecol 73: 789−801
France RL (1995) Differentiation between littoral andpelagic food webs in lakes using carbon isotopes. LimnolOceanogr 40: 1310−1313
Fridolfsson AK, Ellegren H (1999) A simple and universalmethod for molecular sexing of non-ratite birds. J AvianBiol 30: 116−121
Fry B (2006) Stable isotope ecology. Springer, New York, NYFurness R, Laugksch LRC, Duffy DC (1984) Cephalopod
beaks and the study of seabird diets. Auk 101: 619−620González-Solís J, Croxall JP, Oro D, Ruiz X (2007a) Transe-
quatorial migration and mixing in the wintering areas ina pelagic seabird. Front Ecol Environ 5: 297−301
González-Solís J, Croxall JP, Afanasyev V (2007b) Offshorespatial segregation in giant petrels Macronectes spp.: differences between species, sexes and seasons. AquatConserv 17: S22−S36
Graham BS, Koch PL, Newsome SD, McMahon KW, Auri-oles D (2010) Using isoscapes to trace the movementsand foraging behavior of top predators in oceanic ecosys-tems. In: West JB, Bowen GJ, Tawson DE, Tu KP (eds)Isoscapes: understanding movement, pattern, and pro-cess on earth through isotope mapping. Springer, NewYork, NY, p 299−318
Granadeiro JP, Monteiro LR, Furness RW (1998) Diet andfeeding of Cory’s shearwater Calonectris diomedea inthe Azores, north-east Atlantic. Mar Ecol Prog Ser 166: 267−276
Hamer KC (1994) Variability and stochasticity of meal sizeand feeding frequency in the little shearwater Puffinusassimilis. Ibis 136: 271−278
Härkönnen TJ (1986) Guide to the otoliths of the bony fishesof the northeast Atlantic. Danbiu ApS. Biological consul-tants, Hellerup
Harrison CS, Hida S, Seki M (1983) Hawaiian seabird feed-ing ecology. Wildl Monogr 85: 1−71
Hays H, Neves VC, Lima P (2002) Banded roseate terns fromdifferent continents trapped in the Azores. J FieldOrnithol 73: 180−184
Hobson KA (1999) Tracing origins and migration of wildlifeusing stable isotopes: a review. Oecologia 120: 314−326
Hobson KA, Clark RG (1992a) Assessing avian diets usingstable isotopes II: factors influencing diet-tissue fraction-ation. Condor 94: 189−197
Hobson KA, Clark RG (1992b) Assessing avian diets usingstable isotopes I: turnover of 13C in tissues. Condor 94: 181−188
Hobson KA, Welch HE (1992) Determination of trophic rela-tionships within a high Arctic marine food web usingδ13C and δ15N analysis. Mar Ecol Prog Ser 84: 9−18
Hobson KA, Piatt JF, Pitocchelli J (1994) Using stable iso-topes to determine seabird trophic relationships. J AnimEcol 63: 786−798
Jackson S, Ryan PG (1986) Differential digestion rates ofprey by white-chinned petrels (Procellaria aequinoc-tialis). Auk 103: 617−621
Karpouzi VS, Watson R, Pauly D (2007) Modelling and map-ping resource overlap between seabirds and fisheries ona global scale: a preliminary assessment. Mar Ecol ProgSer 343: 87−99
Kelly JF (2000) Stable isotopes of carbon and nitrogen in thestudy of avian and mammalian trophic ecology. Can JZool 78: 1−27
Lombarte A, Chic Ò, Parisi-Baradad V, Olivella R, Piera J,Garcá-Ladona E (2006) A web-based environment forshape analysis of fish otoliths, The AFORO database. SciMar 70: 147−152
Magalhães MC, Santos RS, Hamer KC (2008) Dual-foragingstrategy of Cory’s shearwaters in the Azores: feedinglocations, behaviour at sea and implications for food pro-visioning of chicks. Mar Ecol Prog Ser 359: 283−293
Minagawa M, Wada E (1984) Stepwise enrichment of 15Nalong food chains: further evidence and the relationbetween δ15N and animal age. Geochim CosmochimActa 48: 1135−1140
Monteiro LR (1996) Seabirds as monitors of mercury conta-mination in the Portuguese Atlantic. PhD thesis, Univer-sity of Glasgow
Monteiro LR, Ramos JA, Furness RW (1996) Movements,morphology, breeding, molt, diet and feeding of seabirdsin the Azores. Colon Waterbirds 19: 82−97
Monteiro LR, Ramos JA, Pereira JC, Monteiro PR and others(1999) Status and distribution of Fea’s petrel, Bulwer’spetrel, Manx shearwater, little shearwater and band-rumped storm-petrel in the Azores archipelago. Water-birds 22: 358−366
Montoya JP, Carpenter EJ, Capone DG (2002) Nitrogen fix-ation and nitrogen isotope abundances in zooplankton ofthe oligotrophic north Atlantic. Limnol Oceanogr 47: 1617−1628
Mougin JL, Mougin MC (2000) Maximum diving depths forfeeding attained by Bulwer’s petrels (Bulweria bulwerii)during the incubation period. J Zool (Lond) 250: 75−77
Nesis K (1987) Cephalopods of the world. TNP Publications,New York, NY
Neves VC, Bremer E, Hays H (2002) Recovery in Punta Rasa,
284

Neves et al.: Barolo shearwater feeding ecology
Argentina of common terns banded in the Azores Archi-pelago, North Atlantic. Waterbirds 25: 459−461
Neves VC, Bolton M, Monteiro LR (2006) Validation of thewater offloading technique for diet assessment: anexperimental study with Cory’s shearwaters Calonectrisdiomedea. J Ornithol 147: 474−478
Neves V, Nolf D, Clarke MR (2011) Diet of Bulwer’s petrel(Bulweria bulwerii) in the Azores, NE Atlantic. Water-birds 34: 357−362
Nolf D (1985) Otolithi Piscium. Handbook of paleoichthyol-ogy, Vol 10. Gustav Fisher Verlag, New York, NY
Owens NJP (1987) Natural variations in 15N in the marineenvironment. Adv Mar Biol 24: 389−451
Paiva VH, Geraldes P, Ramírez I, Meirinho A, Garthe S,Ramos JA (2010a) Foraging plasticity in a pelagic seabirdspecies along a marine productivity gradient. Mar EcolProg Ser 398: 259−274
Paiva VH, Geraldes P, Ramírez I, Meirinho A, Ramos JA,Garthe S (2010b) Oceanographic characteristics of areasused by Cory’s shearwaters during short and long forag-ing trips in the North Atlantic. Mar Biol 157: 1385−1399
Paiva VH, Xavier J, Geraldes P, Ramírez I, Meirinho A,Ramos JA, Garthe S (2010c) Foraging ecology of Cory’sshearwaters in different ecological environments of theNorth Atlantic. Mar Ecol Prog Ser 410: 257−268
Passos C, Giudici A, Navarro J, González-Solís J (2010)Effects of an experimental mass increase on the foragingactivity of Cory’s shearwaters. Auk 127: 100−107
Petry MV, Fonseca VSS, Garcia LK, Piuco RC (2008) Shear-water diet during migration along the coast of RioGrande do Sul. Mar Biol 154: 613−621
Phillips RA, Silk JRD, Croxall JP, Afanasyev V, Briggs DR(2004) Accuracy of geolocation estimates for flyingseabirds. Mar Ecol Prog Ser 266: 265−272
Priddel D, Hutton I, Carlile N, Bester A (2003) Little shear-waters, Puffinus assimilis assimilis, breeding on LordHowe Island. Emu 103: 67−70
Ramos R, González-Solís J (2012) Trace me if you can: re -viewing the usage of intrinsic biogeochemical markersin marine top predators. Front Ecol Environ, in press
Rau GH, Sweeney RE, Kaplan IR (1982) Plankton 13C/12Cchange with latitude: differences between northern andsouthern. Deep-Sea Res I 29: 1035−1039
Ridoux V (1994) The diets and dietary segregation of
seabirds at the subantarctic Crozet islands. Mar Ornithol22: 1−192
Roberts JJ, Best BD, Dunn DC, Treml EA, Halpin PN(2010) Marine geospatial ecology tools: an integratedframework for ecological geoprocessing with ArcGIS,Python, R, MATLAB, and C++. Environ Model Softw 25: 1197−1207
Roscales JL, Gómez-Díaz E, Neves V, González-Solís J(2011a) Trophic versus geographic structure in stableisotope signatures of pelagic seabirds breeding in thenortheast Atlantic. Mar Ecol Prog Ser 434: 1−13
Roscales JL, González-Solís J, Muñoz-Arnanz J, Jiménez B(2011b) Geographic and trophic patterns of OCs inpelagic seabirds from the NE Atlantic and the Mediter-ranean: a multi-species/multi-locality approach. Chemo -sphere 85: 432−440
Shaffer SA, Tremblay Y, Awkerman JA, Henry RW and oth-ers (2005) Comparison of light- and SST-based geoloca-tion with satellite telemetry in free-ranging albatrosses.Mar Biol 147: 833−843
Skira IJ (1986) Food of the short-tailed shearwater, Puffinustenuirostis in Tasmania. Aust Wildl Res 13: 481−488
Smale MJ, Clarke MR, Klages NTW, Roeleveld MAC (1993)Octopod beak identification—resolution at a regionallevel (Cephalopoda, Octopoda: Southern Africa). S Afr JMar Sci 13: 269−293
Smale MJ, Watson G, Hecht T (1996) Otolith atlas of South-ern African marine fishes. Ichthyological Monograph I,JLB Smith Institute of Ichthyology, Grahamstown
Tempera F, Medeiros R, Machete M, Morato T (2009). Cartamorfobatimétrica dos Montes Submarinos dos Açores.Departamento de Oceanografia e Pescas
Thompson DR, Lilliendahl K, Solmundsson J, Furness RW,Waldron S, Phillips RA (1999) Trophic relationshipsamong six species of Iceland seabirds as determinedthrough stable isotope analysis. Condor 101: 898−899
Warham J (1955) Observation on the little shearwater at thenest. West Aust Nat 5: 31−39
Weimerskirch H, Salamolard M, Sarrazin F, Jouventin P(1993) Foraging strategy of wandering albatrossesthrough the breeding season: a study using satellitetelemetry. Auk 110: 325−342
Wilson RP (1984) An improved stomach pump for penguinsand other seabirds. J Field Ornithol 55: 109−112
285
Editorial responsibility: Rory Wilson, Swansea, UK
Submitted: December 15, 2010; Accepted: February 8, 2012Proofs received from author(s): April 7, 2012