Embed Size (px)
Citation preview
Feeding and managing for maximum milk protein production
Thomas R. Overton, Ph.D.Professor and Chair
Department of Animal ScienceDirector, PRO-DAIRY programCornell University, Ithaca, NY DBM 0021b
1
Northeast Milk Price Forecasts 2019-2020
Accessed 5/20/20 at
https://www.agrimark.coop/PDFs/AM_Weekly_Updates.pdf
2
“Feeding strategies during challenging times”
• Know and track Income Over Feed Cost (IOFC) Over Purchased Feed Cost (IOPurFC)
• Make sure optimizing use of (homegrown) forages and feeds
• Fine tune feeding management• Strategically review rations• Carefully review cow and heifer inventories and
needs
Available at prodairy.cals.cornell.edu
3
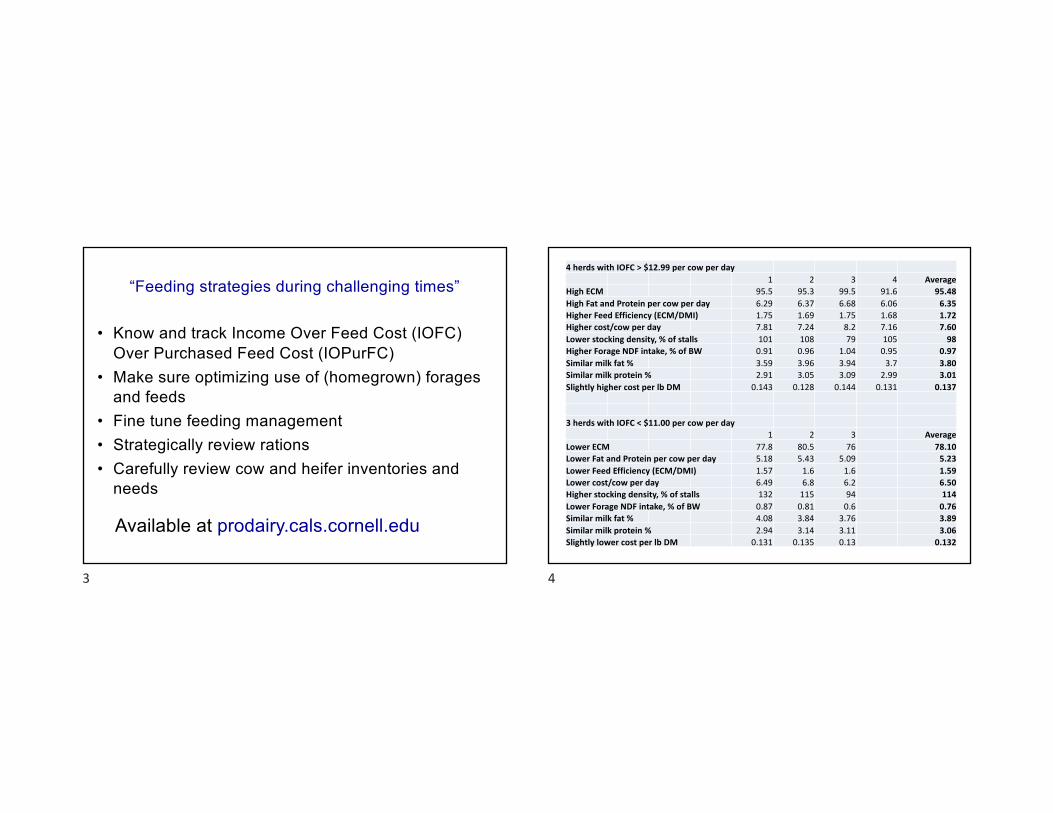
4 herds with IOFC > $12.99 per cow per day1 2 3 4 Average
High ECM 95.5 95.3 99.5 91.6 95.48High Fat and Protein per cow per day 6.29 6.37 6.68 6.06 6.35Higher Feed Efficiency (ECM/DMI) 1.75 1.69 1.75 1.68 1.72Higher cost/cow per day 7.81 7.24 8.2 7.16 7.60Lower stocking density, % of stalls 101 108 79 105 98Higher Forage NDF intake, % of BW 0.91 0.96 1.04 0.95 0.97Similar milk fat % 3.59 3.96 3.94 3.7 3.80Similar milk protein % 2.91 3.05 3.09 2.99 3.01Slightly higher cost per lb DM 0.143 0.128 0.144 0.131 0.137
3 herds with IOFC < $11.00 per cow per day1 2 3 Average
Lower ECM 77.8 80.5 76 78.10Lower Fat and Protein per cow per day 5.18 5.43 5.09 5.23Lower Feed Efficiency (ECM/DMI) 1.57 1.6 1.6 1.59Lower cost/cow per day 6.49 6.8 6.2 6.50Higher stocking density, % of stalls 132 115 94 114Lower Forage NDF intake, % of BW 0.87 0.81 0.6 0.76Similar milk fat % 4.08 3.84 3.76 3.89Similar milk protein % 2.94 3.14 3.11 3.06Slightly lower cost per lb DM 0.131 0.135 0.13 0.132
4
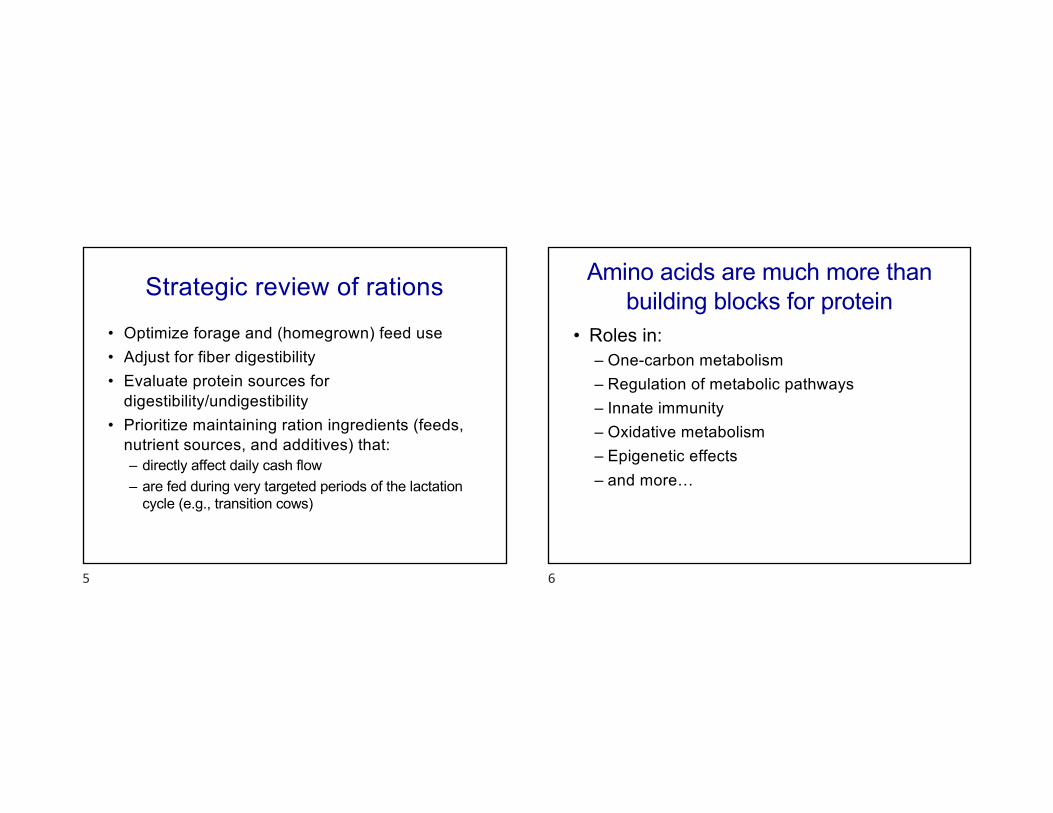
Strategic review of rations
• Optimize forage and (homegrown) feed use• Adjust for fiber digestibility• Evaluate protein sources for
digestibility/undigestibility• Prioritize maintaining ration ingredients (feeds,
nutrient sources, and additives) that:– directly affect daily cash flow– are fed during very targeted periods of the lactation
cycle (e.g., transition cows)
5
Amino acids are much more than building blocks for protein
• Roles in:– One-carbon metabolism– Regulation of metabolic pathways– Innate immunity– Oxidative metabolism– Epigenetic effects– and more…
6
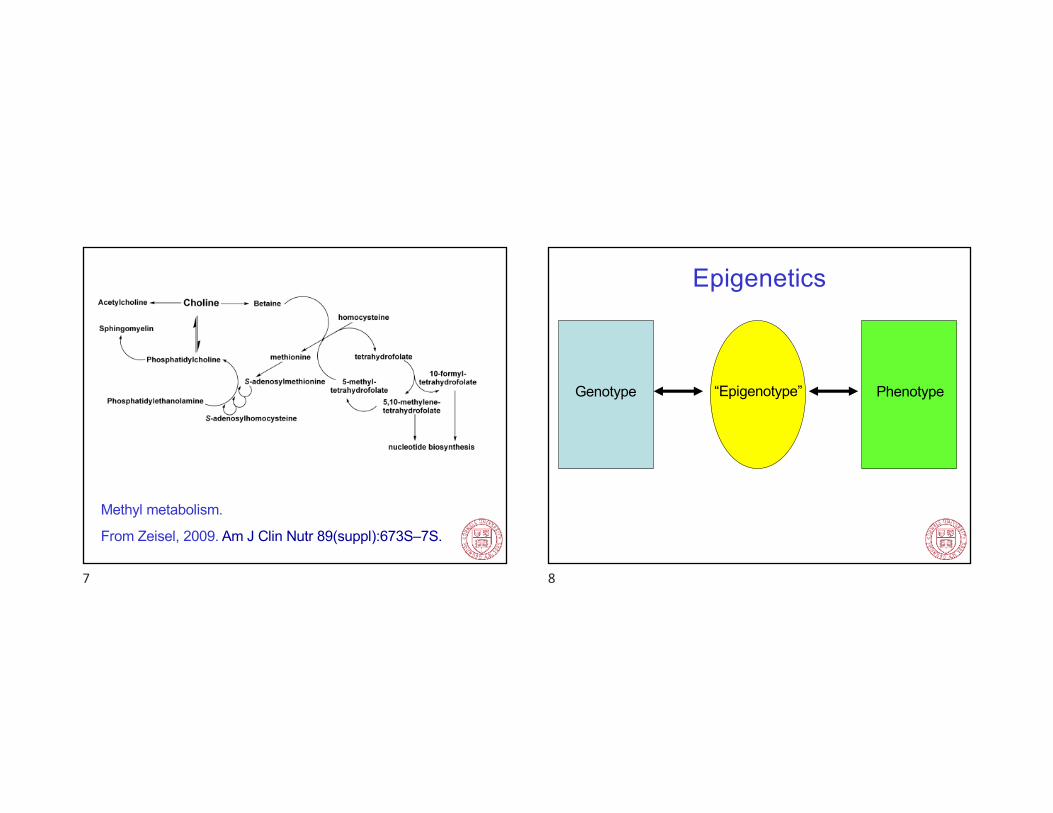
Methyl metabolism.
From Zeisel, 2009. Am J Clin Nutr 89(suppl):673S–7S.
7
Genotype Phenotype“Epigenotype”
Epigenetics
8
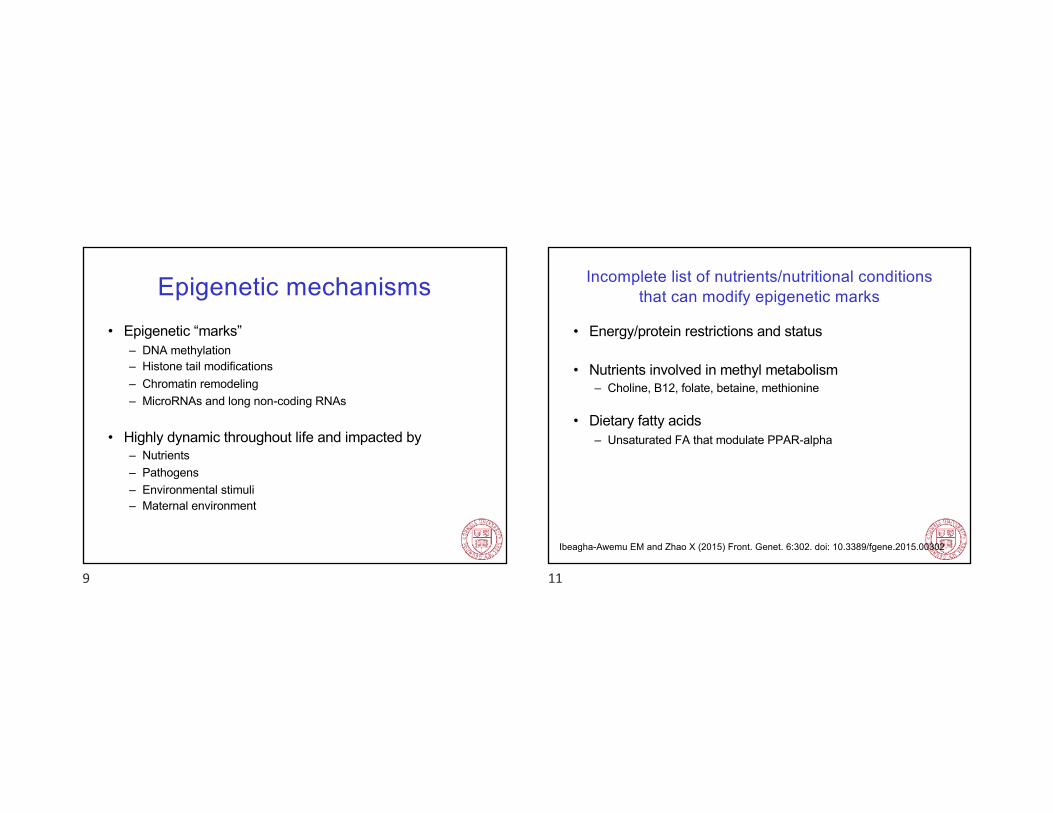
Epigenetic mechanisms• Epigenetic “marks”
– DNA methylation– Histone tail modifications– Chromatin remodeling– MicroRNAs and long non-coding RNAs
• Highly dynamic throughout life and impacted by– Nutrients– Pathogens– Environmental stimuli– Maternal environment
9
Incomplete list of nutrients/nutritional conditions that can modify epigenetic marks
• Energy/protein restrictions and status
• Nutrients involved in methyl metabolism– Choline, B12, folate, betaine, methionine
• Dietary fatty acids– Unsaturated FA that modulate PPAR-alpha
Ibeagha-Awemu EM and Zhao X (2015) Front. Genet. 6:302. doi: 10.3389/fgene.2015.00302
11
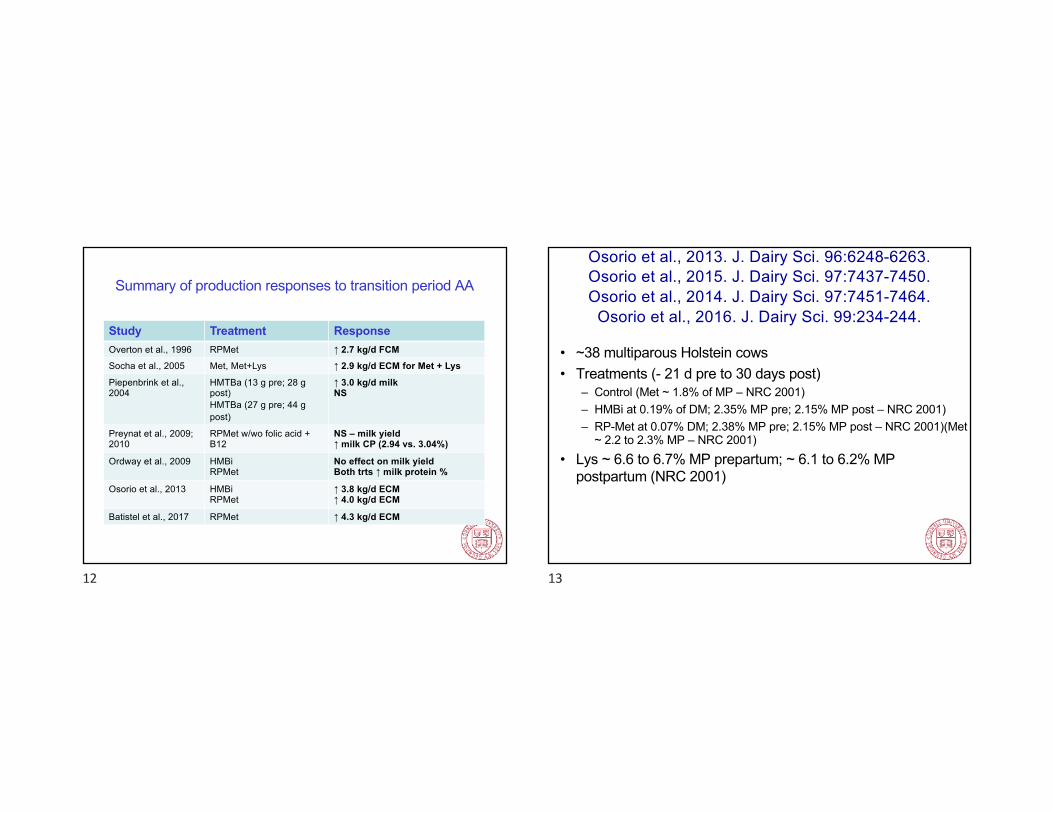
Summary of production responses to transition period AA
Study Treatment ResponseOverton et al., 1996 RPMet ↑ 2.7 kg/d FCMSocha et al., 2005 Met, Met+Lys ↑ 2.9 kg/d ECM for Met + LysPiepenbrink et al.,2004
HMTBa (13 g pre; 28 g post)HMTBa (27 g pre; 44 g post)
↑ 3.0 kg/d milkNS
Preynat et al., 2009; 2010
RPMet w/wo folic acid + B12
NS – milk yield↑ milk CP (2.94 vs. 3.04%)
Ordway et al., 2009 HMBiRPMet
No effect on milk yieldBoth trts ↑ milk protein %
Osorio et al., 2013 HMBiRPMet
↑ 3.8 kg/d ECM↑ 4.0 kg/d ECM
Batistel et al., 2017 RPMet ↑ 4.3 kg/d ECM
12
Osorio et al., 2013. J. Dairy Sci. 96:6248-6263.Osorio et al., 2015. J. Dairy Sci. 97:7437-7450.Osorio et al., 2014. J. Dairy Sci. 97:7451-7464.
Osorio et al., 2016. J. Dairy Sci. 99:234-244.
• ~38 multiparous Holstein cows• Treatments (- 21 d pre to 30 days post)
– Control (Met ~ 1.8% of MP – NRC 2001)– HMBi at 0.19% of DM; 2.35% MP pre; 2.15% MP post – NRC 2001)– RP-Met at 0.07% DM; 2.38% MP pre; 2.15% MP post – NRC 2001)(Met
~ 2.2 to 2.3% MP – NRC 2001)• Lys ~ 6.6 to 6.7% MP prepartum; ~ 6.1 to 6.2% MP
postpartum (NRC 2001)
13
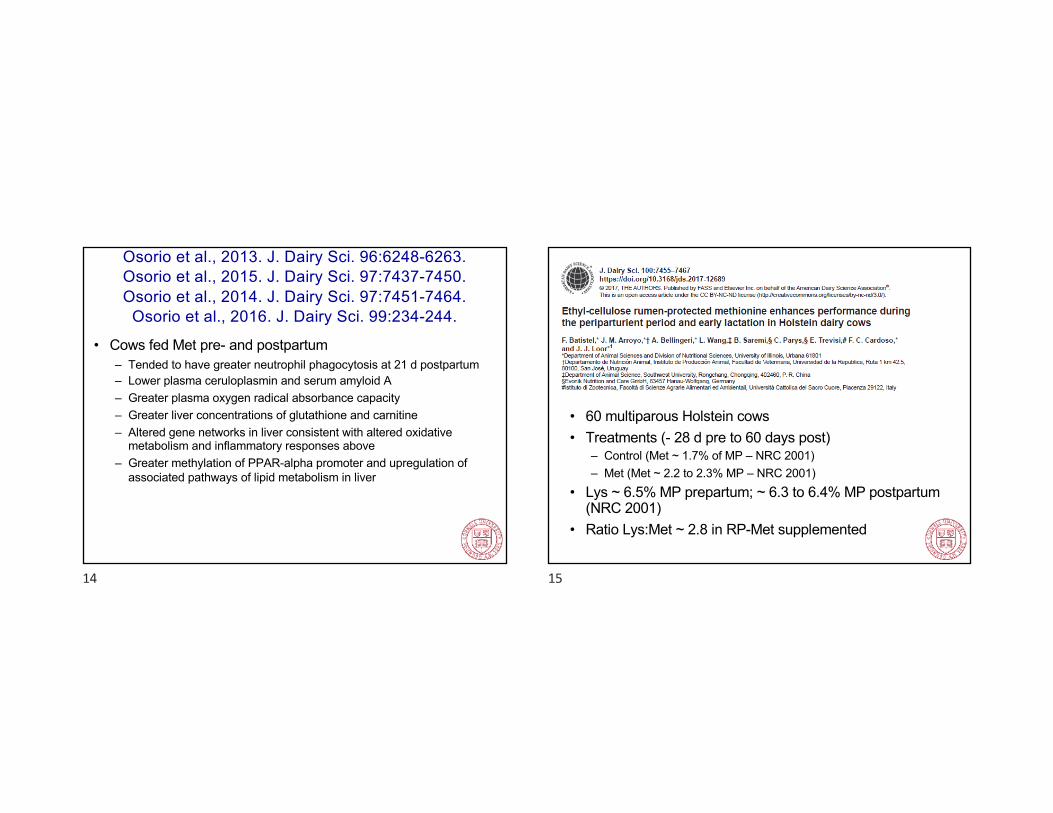
Osorio et al., 2013. J. Dairy Sci. 96:6248-6263.Osorio et al., 2015. J. Dairy Sci. 97:7437-7450.Osorio et al., 2014. J. Dairy Sci. 97:7451-7464.
Osorio et al., 2016. J. Dairy Sci. 99:234-244.
• Cows fed Met pre- and postpartum– Tended to have greater neutrophil phagocytosis at 21 d postpartum– Lower plasma ceruloplasmin and serum amyloid A– Greater plasma oxygen radical absorbance capacity– Greater liver concentrations of glutathione and carnitine– Altered gene networks in liver consistent with altered oxidative
metabolism and inflammatory responses above– Greater methylation of PPAR-alpha promoter and upregulation of
associated pathways of lipid metabolism in liver
14
• 60 multiparous Holstein cows• Treatments (- 28 d pre to 60 days post)
– Control (Met ~ 1.7% of MP – NRC 2001)– Met (Met ~ 2.2 to 2.3% MP – NRC 2001)
• Lys ~ 6.5% MP prepartum; ~ 6.3 to 6.4% MP postpartum (NRC 2001)
• Ratio Lys:Met ~ 2.8 in RP-Met supplemented
15
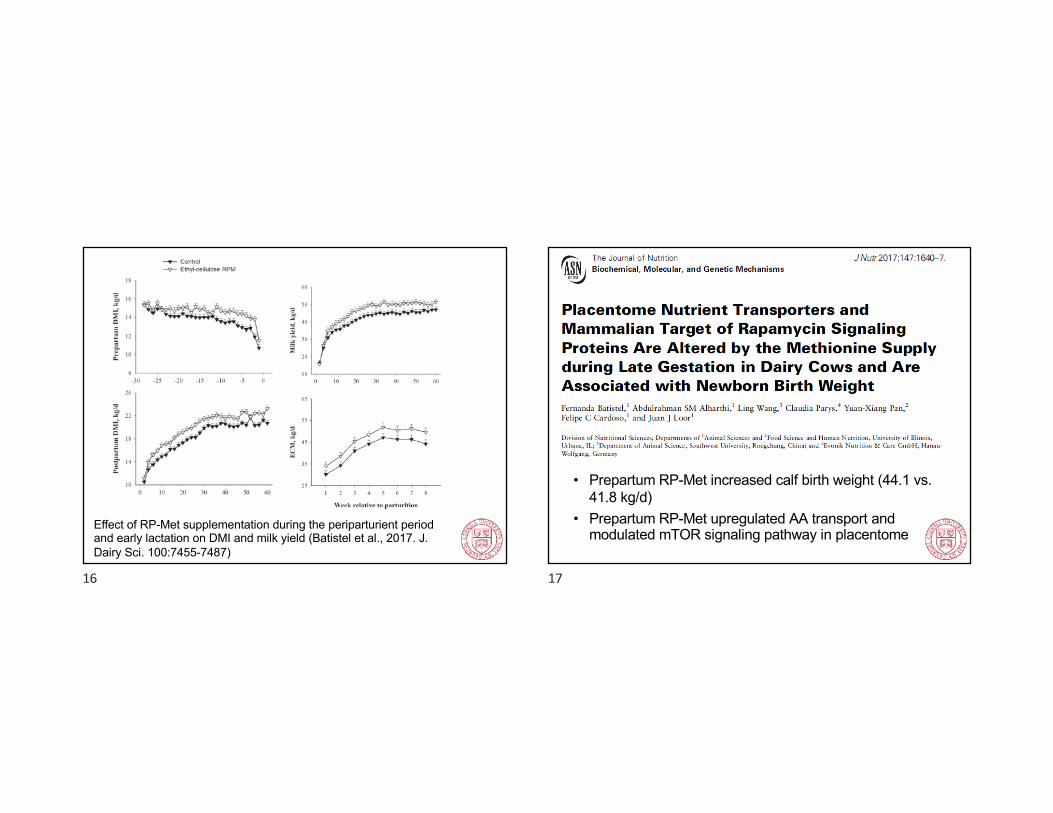
Effect of RP-Met supplementation during the periparturient period and early lactation on DMI and milk yield (Batistel et al., 2017. J. Dairy Sci. 100:7455-7487)
16
• Prepartum RP-Met increased calf birth weight (44.1 vs. 41.8 kg/d)
• Prepartum RP-Met upregulated AA transport and modulated mTOR signaling pathway in placentome
17
Jacometo et al., 2016. J. Dairy Sci. 99:6753-6763.Jacometo et al., 2017. J. Dairy Sci. 100:3209-3219.
• Cows fed from 21 d prepartum to calving:– control (Met ~1.9% of MP – NRC 2001)– RP-Met (0.08% of DM; Met ~2.4% of MP – NRC
2001)• Calves from cows fed RP-Met had:
– Similar birth weight and ADG to 7 wk– Lower reactive oxygen metabolites at 14 d and trend
for lower ceruloplasmin– Altered insulin signaling and glucose metabolism– Altered liver Met, choline, and homocysteine
metabolism
18
What about milk components and using AA to improve efficiency of N use?
19
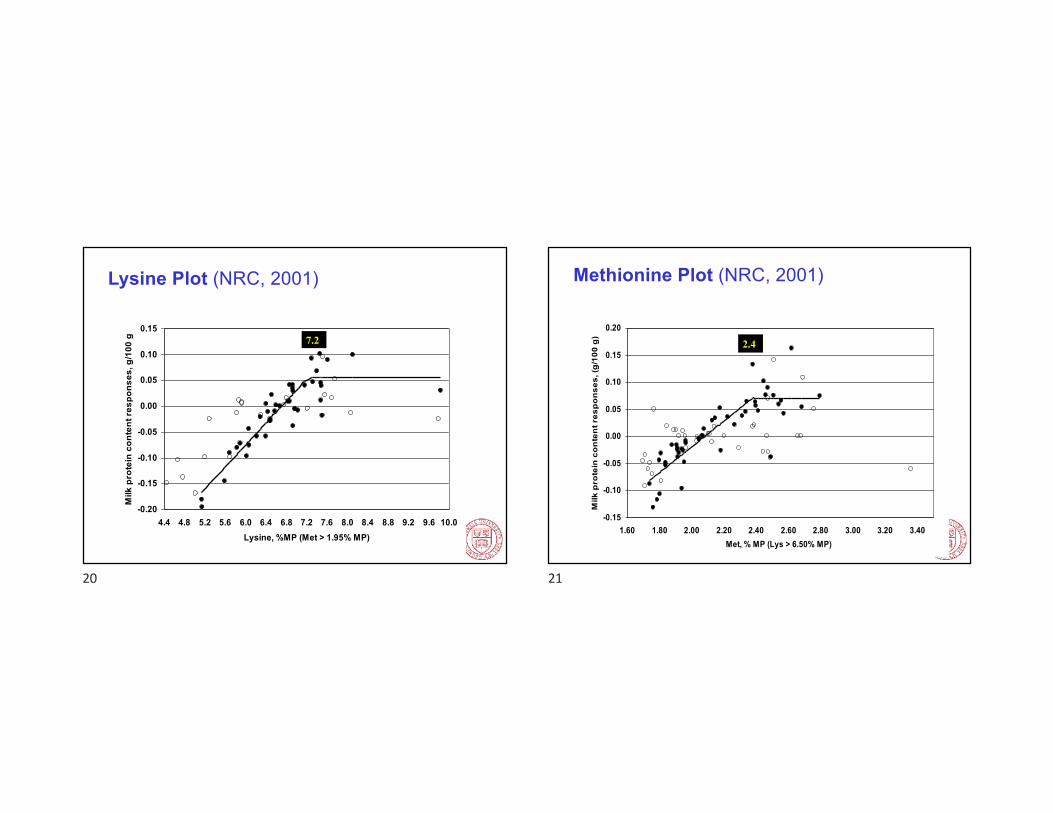
Lysine Plot (NRC, 2001)
-0.20
-0.15
-0.10
-0.05
0.00
0.05
0.10
0.15
4.4 4.8 5.2 5.6 6.0 6.4 6.8 7.2 7.6 8.0 8.4 8.8 9.2 9.6 10.0Lysine, %MP (Met > 1.95% MP)
Milk
pro
tein
con
tent
resp
onse
s, g
/100
g 7.2
20
-0.15
-0.10
-0.05
0.00
0.05
0.10
0.15
0.20
1.60 1.80 2.00 2.20 2.40 2.60 2.80 3.00 3.20 3.40Met, % MP (Lys > 6.50% MP)
Milk
pro
tein
con
tent
res
pons
es, (
g/10
0 g) 2.4
Methionine Plot (NRC, 2001)
21
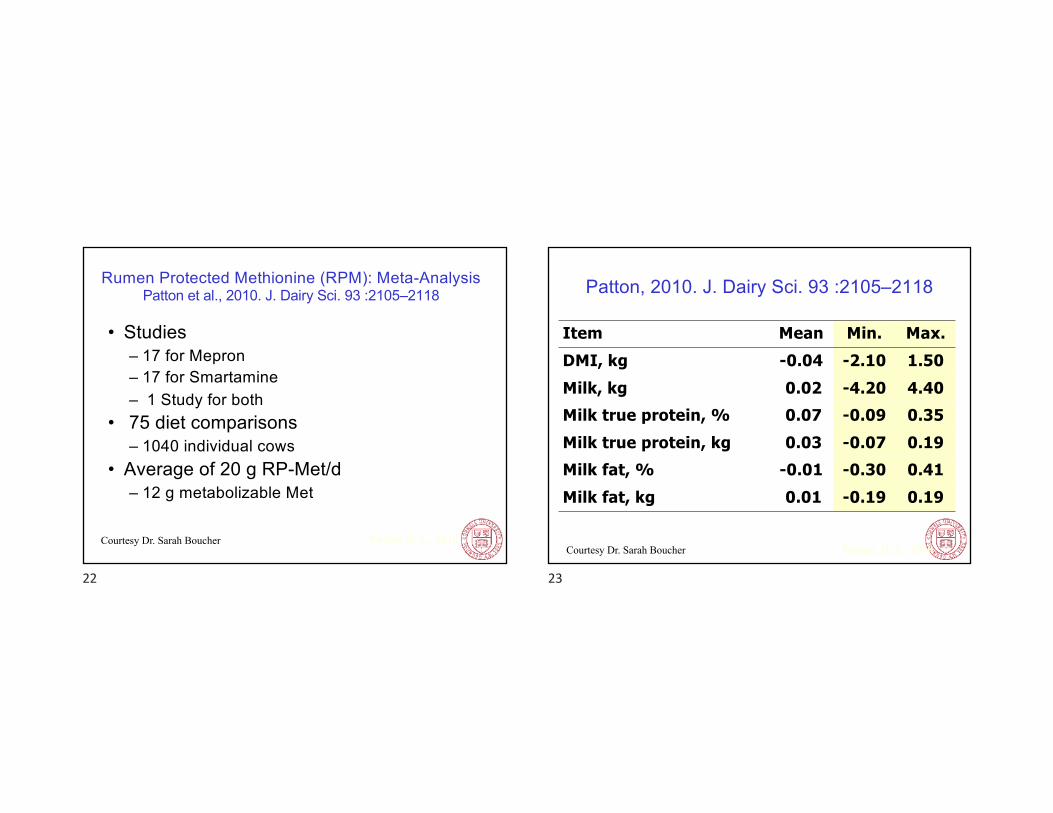
Rumen Protected Methionine (RPM): Meta-AnalysisPatton et al., 2010. J. Dairy Sci. 93 :2105–2118
• Studies– 17 for Mepron– 17 for Smartamine– 1 Study for both
• 75 diet comparisons – 1040 individual cows
• Average of 20 g RP-Met/d – 12 g metabolizable Met
Patton R.A., 2010Courtesy Dr. Sarah Boucher
22
Patton, 2010. J. Dairy Sci. 93 :2105–2118
Item Mean Min. Max.DMI, kg -0.04 -2.10 1.50Milk, kg 0.02 -4.20 4.40Milk true protein, % 0.07 -0.09 0.35Milk true protein, kg 0.03 -0.07 0.19Milk fat, % -0.01 -0.30 0.41Milk fat, kg 0.01 -0.19 0.19
Patton, R.A., 2010Courtesy Dr. Sarah Boucher
23
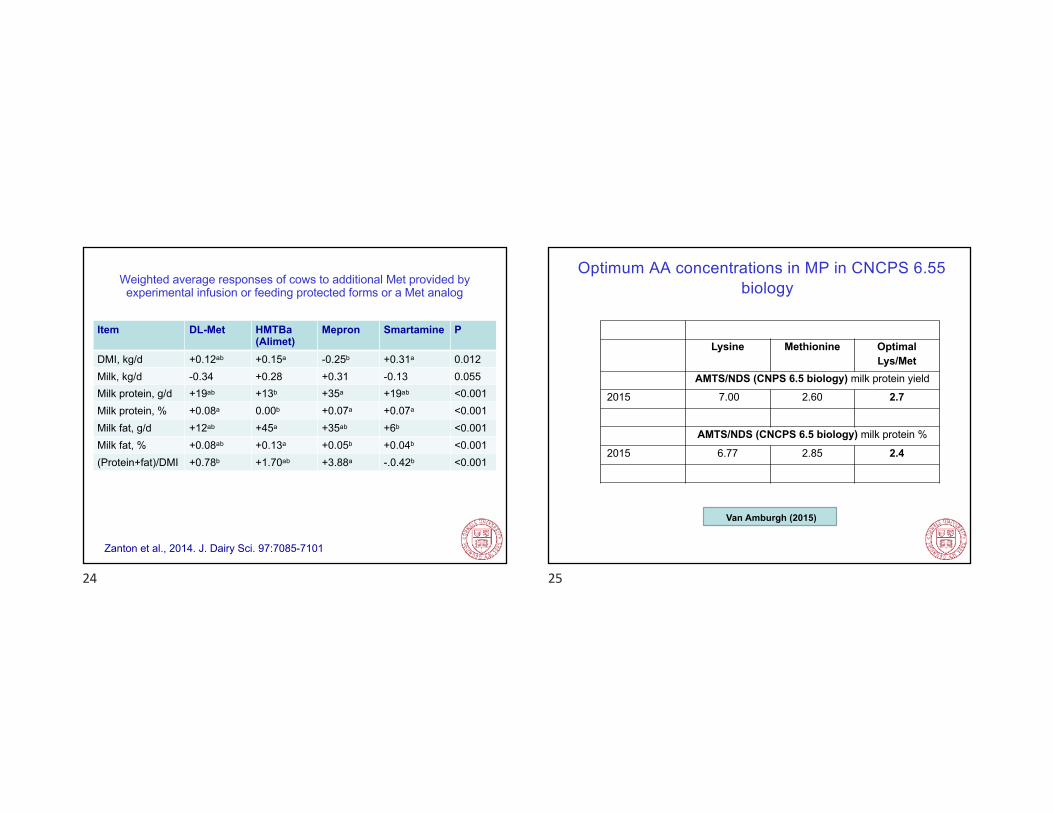
Weighted average responses of cows to additional Met provided by experimental infusion or feeding protected forms or a Met analog
Item DL-Met HMTBa(Alimet)
Mepron Smartamine P
DMI, kg/d +0.12ab +0.15a -0.25b +0.31a 0.012Milk, kg/d -0.34 +0.28 +0.31 -0.13 0.055Milk protein, g/d +19ab +13b +35a +19ab <0.001Milk protein, % +0.08a 0.00b +0.07a +0.07a <0.001Milk fat, g/d +12ab +45a +35ab +6b <0.001Milk fat, % +0.08ab +0.13a +0.05b +0.04b <0.001(Protein+fat)/DMI +0.78b +1.70ab +3.88a -.0.42b <0.001
Zanton et al., 2014. J. Dairy Sci. 97:7085-7101
24
Optimum AA concentrations in MP in CNCPS 6.55 biology
Lysine Methionine Optimal Lys/Met
AMTS/NDS (CNPS 6.5 biology) milk protein yield
2015 7.00 2.60 2.7
AMTS/NDS (CNCPS 6.5 biology) milk protein %
2015 6.77 2.85 2.4
Van Amburgh (2015)
25
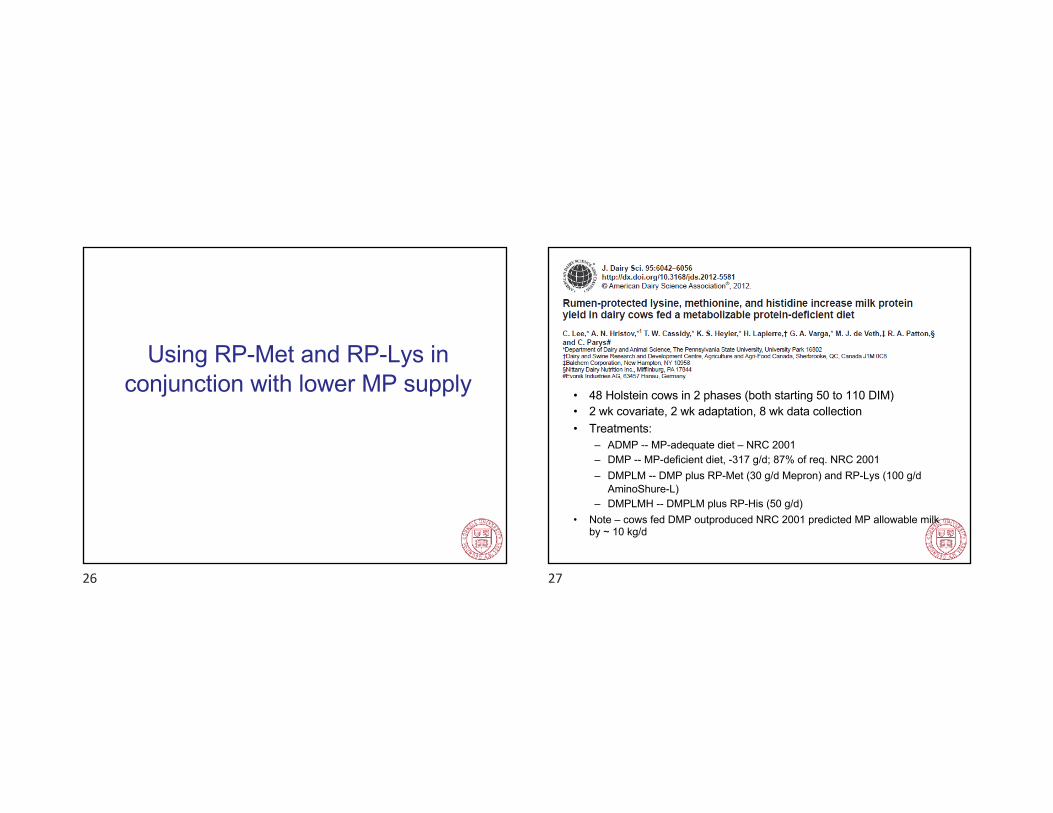
Using RP-Met and RP-Lys in conjunction with lower MP supply
26
• 48 Holstein cows in 2 phases (both starting 50 to 110 DIM)• 2 wk covariate, 2 wk adaptation, 8 wk data collection• Treatments:
– ADMP -- MP-adequate diet – NRC 2001– DMP -- MP-deficient diet, -317 g/d; 87% of req. NRC 2001– DMPLM -- DMP plus RP-Met (30 g/d Mepron) and RP-Lys (100 g/d
AminoShure-L) – DMPLMH -- DMPLM plus RP-His (50 g/d)
• Note – cows fed DMP outproduced NRC 2001 predicted MP allowable milk by ~ 10 kg/d
27

Lee et al., 2012. J. Dairy Sci. 95:6042-6056.
Item P1–ADMP P1-DMP P2-ADMP P2-DMPIngredient, % of DMCorn silage 40.7 40.7 39.7 39.7Alf haylage 16.7 16.6 16.7 16.6Grass hay 5.8 5.8 5.8 5.8CS hulls 1.1 1.1 1.1 1.1Corn meal 5.7 11.7 5.7 11.7Bakery 7.4 7.4 7.4 7.4WRSB 5.5 6.6 5.5 6.6Canola, mech 5.0 3.0 5.0 3.0Expeller SBM 5.0 0.0 6.0 1.0Molasses 4.2 4.2 4.2 4.2Min-vit 2.9 2.8 2.9 2.9
28
Lee et al., 2012. J. Dairy Sci. 95:6042-6056.
Item P1–ADMP P1-DMP P2-ADMP P2-DMPComposition, % of DMCP 15.7 13.6 15.7 13.5RDP 9.8 9.1 9.8 9.0RUP 5.9 4.4 5.9 4.5
NDF 29.5 30.0 29.3 29.0EE 4.8 4.7 4.1 4.5NEL balance, Mcal 2 3 2 2NFC 44.6 45.8 46.0 48.4
29
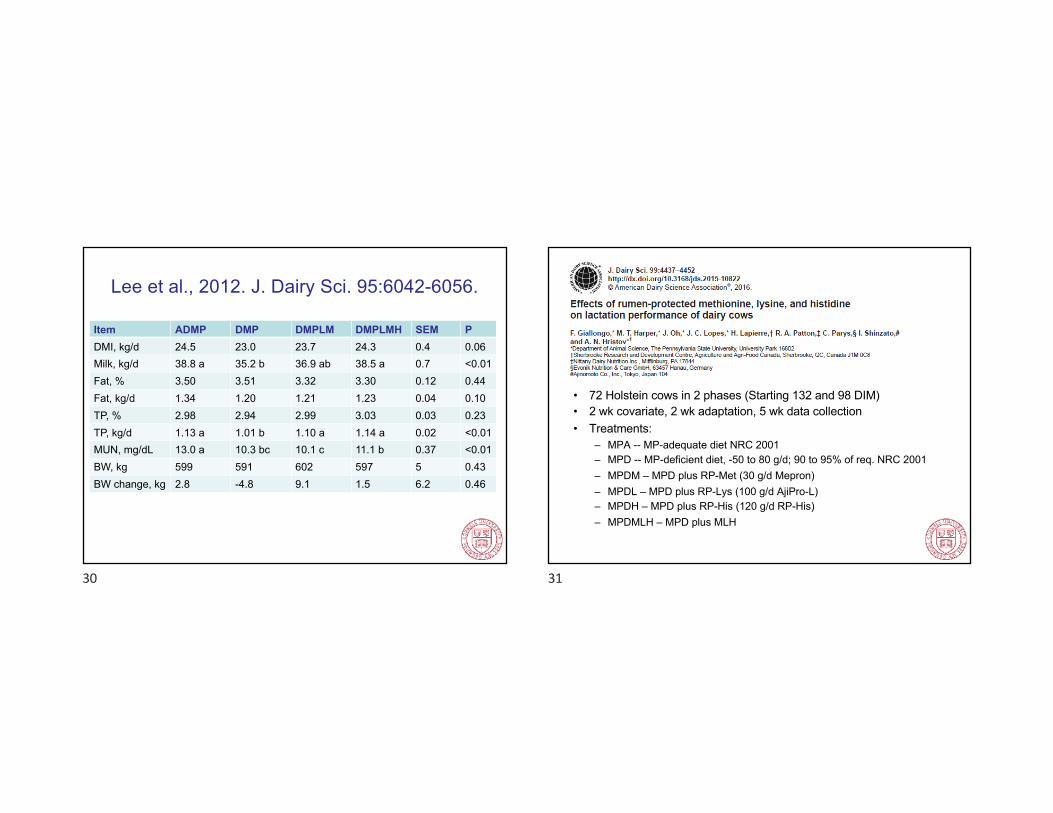
Lee et al., 2012. J. Dairy Sci. 95:6042-6056.
Item ADMP DMP DMPLM DMPLMH SEM PDMI, kg/d 24.5 23.0 23.7 24.3 0.4 0.06Milk, kg/d 38.8 a 35.2 b 36.9 ab 38.5 a 0.7 <0.01Fat, % 3.50 3.51 3.32 3.30 0.12 0.44Fat, kg/d 1.34 1.20 1.21 1.23 0.04 0.10TP, % 2.98 2.94 2.99 3.03 0.03 0.23TP, kg/d 1.13 a 1.01 b 1.10 a 1.14 a 0.02 <0.01MUN, mg/dL 13.0 a 10.3 bc 10.1 c 11.1 b 0.37 <0.01BW, kg 599 591 602 597 5 0.43BW change, kg 2.8 -4.8 9.1 1.5 6.2 0.46
30
• 72 Holstein cows in 2 phases (Starting 132 and 98 DIM)• 2 wk covariate, 2 wk adaptation, 5 wk data collection• Treatments:
– MPA -- MP-adequate diet NRC 2001– MPD -- MP-deficient diet, -50 to 80 g/d; 90 to 95% of req. NRC 2001– MPDM – MPD plus RP-Met (30 g/d Mepron) – MPDL – MPD plus RP-Lys (100 g/d AjiPro-L)– MPDH – MPD plus RP-His (120 g/d RP-His)– MPDMLH – MPD plus MLH
31
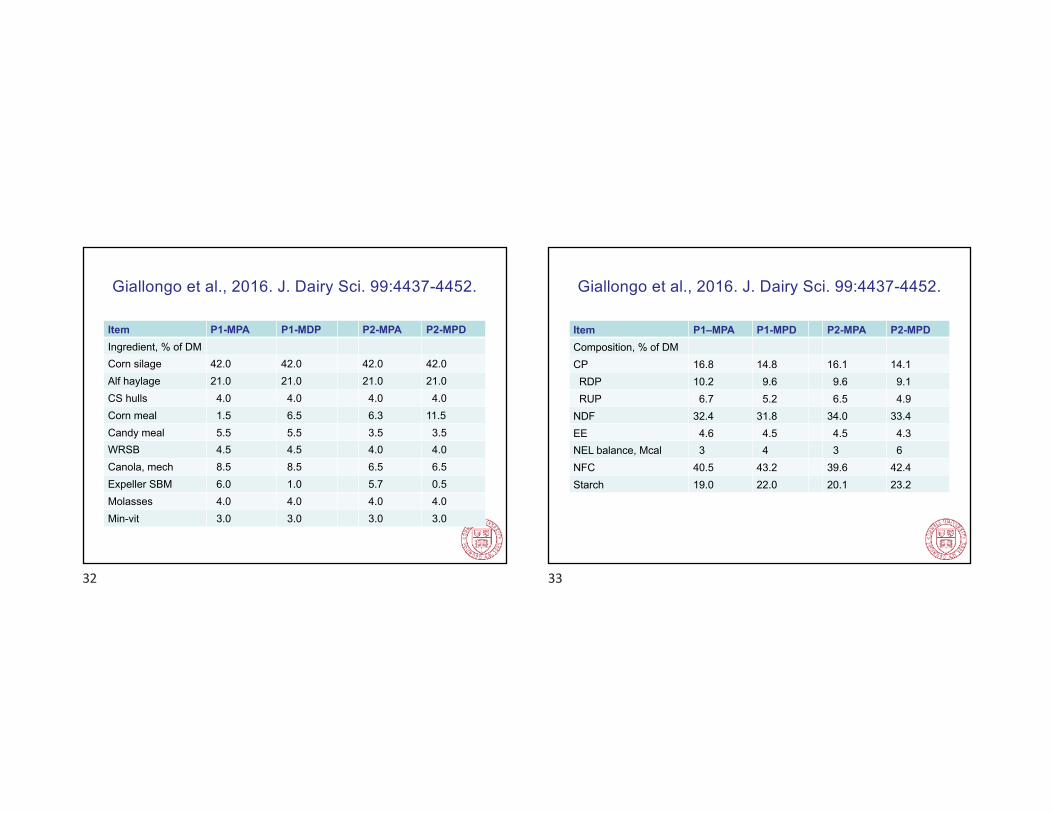
Giallongo et al., 2016. J. Dairy Sci. 99:4437-4452.
Item P1-MPA P1-MDP P2-MPA P2-MPDIngredient, % of DMCorn silage 42.0 42.0 42.0 42.0Alf haylage 21.0 21.0 21.0 21.0CS hulls 4.0 4.0 4.0 4.0Corn meal 1.5 6.5 6.3 11.5Candy meal 5.5 5.5 3.5 3.5WRSB 4.5 4.5 4.0 4.0Canola, mech 8.5 8.5 6.5 6.5Expeller SBM 6.0 1.0 5.7 0.5Molasses 4.0 4.0 4.0 4.0Min-vit 3.0 3.0 3.0 3.0
32
Giallongo et al., 2016. J. Dairy Sci. 99:4437-4452.
Item P1–MPA P1-MPD P2-MPA P2-MPDComposition, % of DMCP 16.8 14.8 16.1 14.1RDP 10.2 9.6 9.6 9.1RUP 6.7 5.2 6.5 4.9
NDF 32.4 31.8 34.0 33.4EE 4.6 4.5 4.5 4.3NEL balance, Mcal 3 4 3 6NFC 40.5 43.2 39.6 42.4Starch 19.0 22.0 20.1 23.2
33
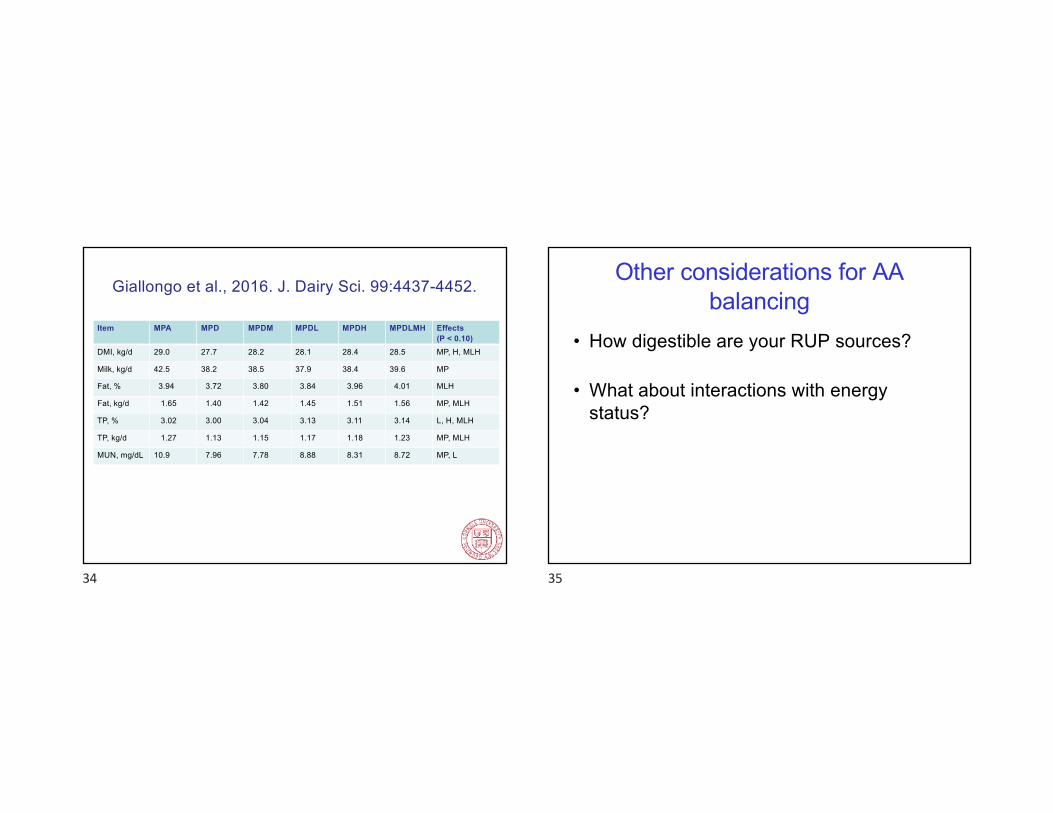
Giallongo et al., 2016. J. Dairy Sci. 99:4437-4452.
Item MPA MPD MPDM MPDL MPDH MPDLMH Effects (P < 0.10)
DMI, kg/d 29.0 27.7 28.2 28.1 28.4 28.5 MP, H, MLH
Milk, kg/d 42.5 38.2 38.5 37.9 38.4 39.6 MP
Fat, % 3.94 3.72 3.80 3.84 3.96 4.01 MLH
Fat, kg/d 1.65 1.40 1.42 1.45 1.51 1.56 MP, MLH
TP, % 3.02 3.00 3.04 3.13 3.11 3.14 L, H, MLH
TP, kg/d 1.27 1.13 1.15 1.17 1.18 1.23 MP, MLH
MUN, mg/dL 10.9 7.96 7.78 8.88 8.31 8.72 MP, L
34
Other considerations for AA balancing
• How digestible are your RUP sources?
• What about interactions with energy status?
35
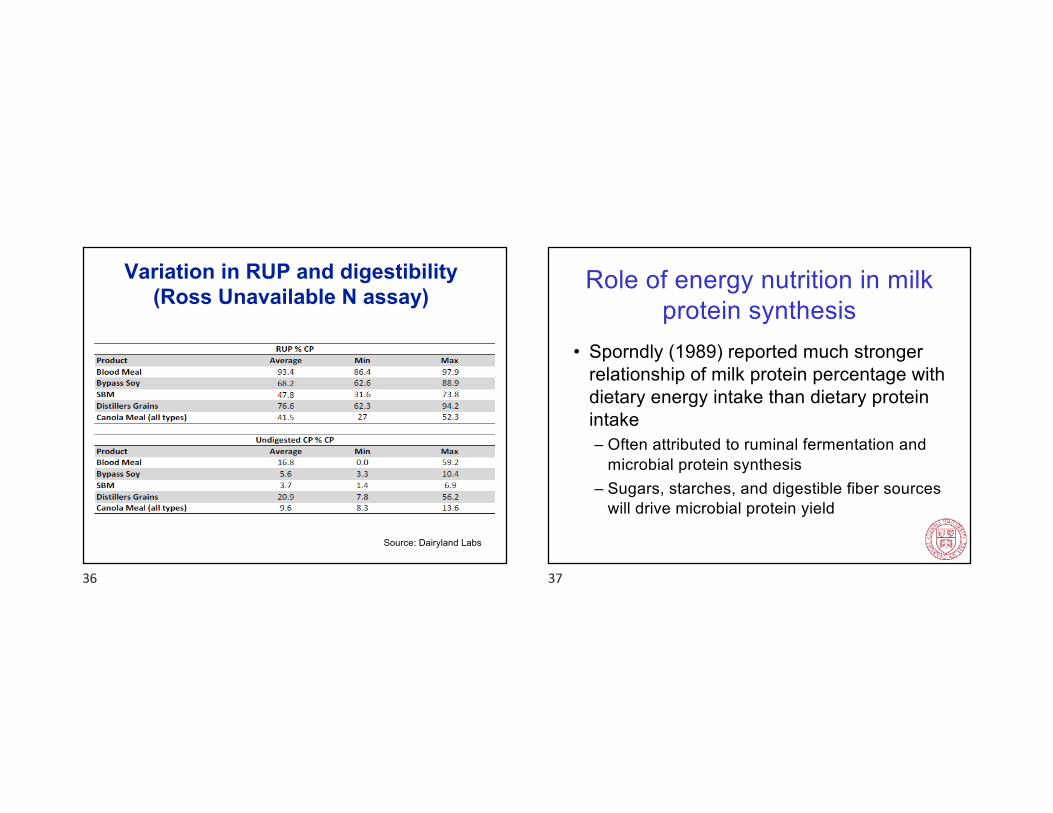
Variation in RUP and digestibility(Ross Unavailable N assay)
Source: Dairyland Labs
36
Role of energy nutrition in milk protein synthesis
• Sporndly (1989) reported much stronger relationship of milk protein percentage with dietary energy intake than dietary protein intake– Often attributed to ruminal fermentation and
microbial protein synthesis– Sugars, starches, and digestible fiber sources
will drive microbial protein yield
37
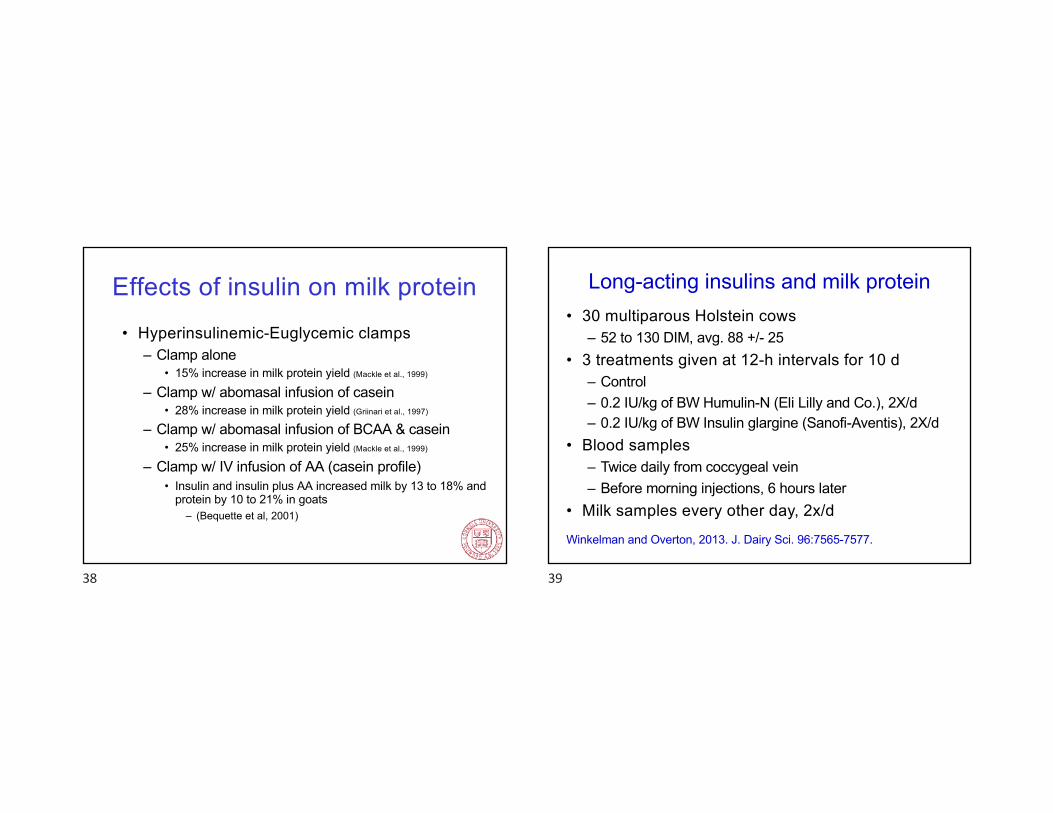
Effects of insulin on milk protein
• Hyperinsulinemic-Euglycemic clamps– Clamp alone
• 15% increase in milk protein yield (Mackle et al., 1999)
– Clamp w/ abomasal infusion of casein• 28% increase in milk protein yield (Griinari et al., 1997)
– Clamp w/ abomasal infusion of BCAA & casein• 25% increase in milk protein yield (Mackle et al., 1999)
– Clamp w/ IV infusion of AA (casein profile)• Insulin and insulin plus AA increased milk by 13 to 18% and
protein by 10 to 21% in goats– (Bequette et al, 2001)
38
Long-acting insulins and milk protein• 30 multiparous Holstein cows
– 52 to 130 DIM, avg. 88 +/- 25• 3 treatments given at 12-h intervals for 10 d
– Control– 0.2 IU/kg of BW Humulin-N (Eli Lilly and Co.), 2X/d– 0.2 IU/kg of BW Insulin glargine (Sanofi-Aventis), 2X/d
• Blood samples– Twice daily from coccygeal vein– Before morning injections, 6 hours later
• Milk samples every other day, 2x/d
Winkelman and Overton, 2013. J. Dairy Sci. 96:7565-7577.
39
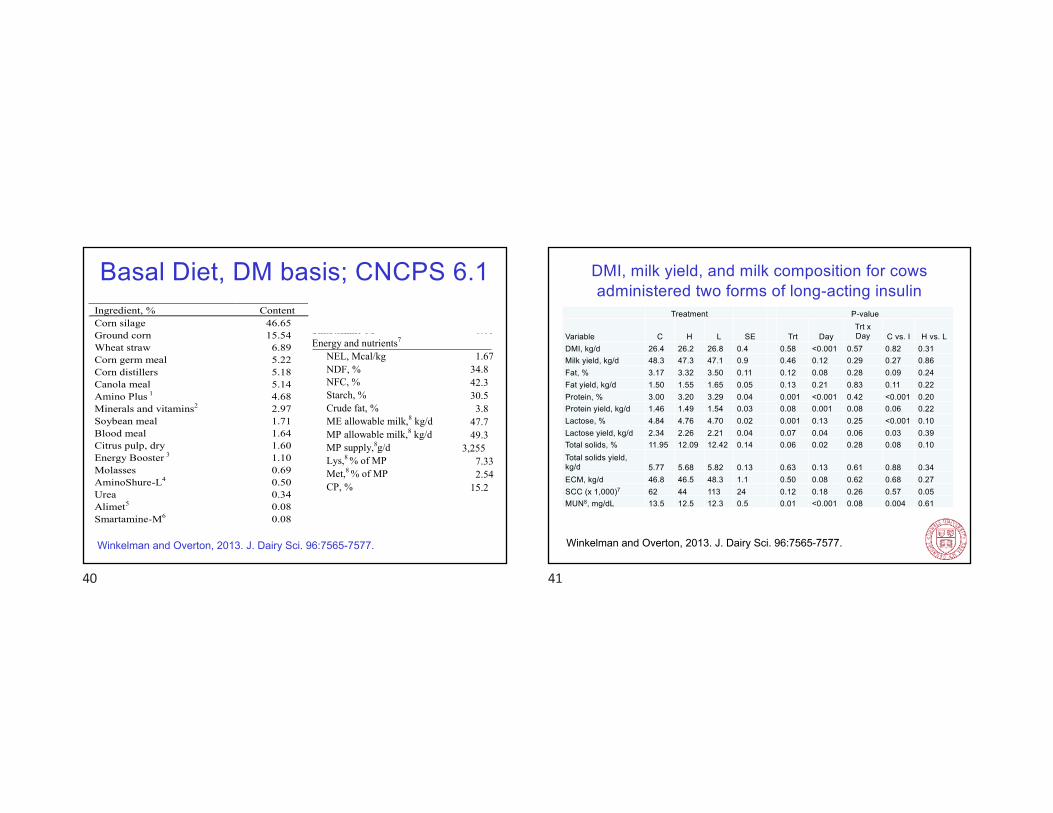
Basal Diet, DM basis; CNCPS 6.1Ingredient, % Content Corn silage 46.65 Ground corn 15.54 Wheat straw 6.89 Corn germ meal 5.22 Corn distillers 5.18 Canola meal 5.14 Amino Plus 1 4.68 Minerals and vitamins2 2.97 Soybean meal 1.71 Blood meal 1.64 Citrus pulp, dry 1.60 Energy Booster 3 1.10 Molasses 0.69 AminoShure-L4 0.50 Urea 0.34 Alimet5 0.08 Smartamine-M6 0.08 Energy and nutrients7
NEL, Mcal/kg 1.67 NDF, % 34.8 NFC, % 42.3 Starch, % 30.5 Crude fat, % 3.8 ME allowable milk,8 kg/d 47.7 MP allowable milk,8 kg/d 49.3 MP supply,8g/d 3,255 Lys,8 % of MP 7.33 Met,8 % of MP 2.54 CP, % 15.2 Lignin, % 3.4 Calcium, % 0.59 Phosphorus, % 0.39 Potassium, % 1.15 Magnesium, % 0.27
1
Ingredient, % Content Corn silage 46.65 Ground corn 15.54 Wheat straw 6.89 Corn germ meal 5.22 Corn distillers 5.18 Canola meal 5.14 Amino Plus 1 4.68 Minerals and vitamins2 2.97 Soybean meal 1.71 Blood meal 1.64 Citrus pulp, dry 1.60 Energy Booster 3 1.10 Molasses 0.69 AminoShure-L4 0.50 Urea 0.34 Alimet5 0.08 Smartamine-M6 0.08 Energy and nutrients7
NEL, Mcal/kg 1.67 NDF, % 34.8 NFC, % 42.3 Starch, % 30.5 Crude fat, % 3.8 ME allowable milk,8 kg/d 47.7 MP allowable milk,8 kg/d 49.3 MP supply,8g/d 3,255 Lys,8 % of MP 7.33 Met,8 % of MP 2.54 CP, % 15.2 Lignin, % 3.4 Calcium, % 0.59 Phosphorus, % 0.39 Potassium, % 1.15 Magnesium, % 0.27
1
Winkelman and Overton, 2013. J. Dairy Sci. 96:7565-7577.
40
Treatment P-value
Variable C H L SE Trt DayTrt x Day C vs. I H vs. L
DMI, kg/d 26.4 26.2 26.8 0.4 0.58 <0.001 0.57 0.82 0.31Milk yield, kg/d 48.3 47.3 47.1 0.9 0.46 0.12 0.29 0.27 0.86Fat, % 3.17 3.32 3.50 0.11 0.12 0.08 0.28 0.09 0.24Fat yield, kg/d 1.50 1.55 1.65 0.05 0.13 0.21 0.83 0.11 0.22Protein, % 3.00 3.20 3.29 0.04 0.001 <0.001 0.42 <0.001 0.20Protein yield, kg/d 1.46 1.49 1.54 0.03 0.08 0.001 0.08 0.06 0.22Lactose, % 4.84 4.76 4.70 0.02 0.001 0.13 0.25 <0.001 0.10Lactose yield, kg/d 2.34 2.26 2.21 0.04 0.07 0.04 0.06 0.03 0.39Total solids, % 11.95 12.09 12.42 0.14 0.06 0.02 0.28 0.08 0.10Total solids yield, kg/d 5.77 5.68 5.82 0.13 0.63 0.13 0.61 0.88 0.34ECM, kg/d 46.8 46.5 48.3 1.1 0.50 0.08 0.62 0.68 0.27SCC (x 1,000)7 62 44 113 24 0.12 0.18 0.26 0.57 0.05MUN8, mg/dL 13.5 12.5 12.3 0.5 0.01 <0.001 0.08 0.004 0.61
DMI, milk yield, and milk composition for cows administered two forms of long-acting insulin
Winkelman and Overton, 2013. J. Dairy Sci. 96:7565-7577.
41
1.0
1.1
1.2
1.3
1.4
1.5
1.6
1.7
0 2 4 6 8 10 12
Day
Prot
ein
yiel
d, k
g/d
Control Humulin Insulin glargine
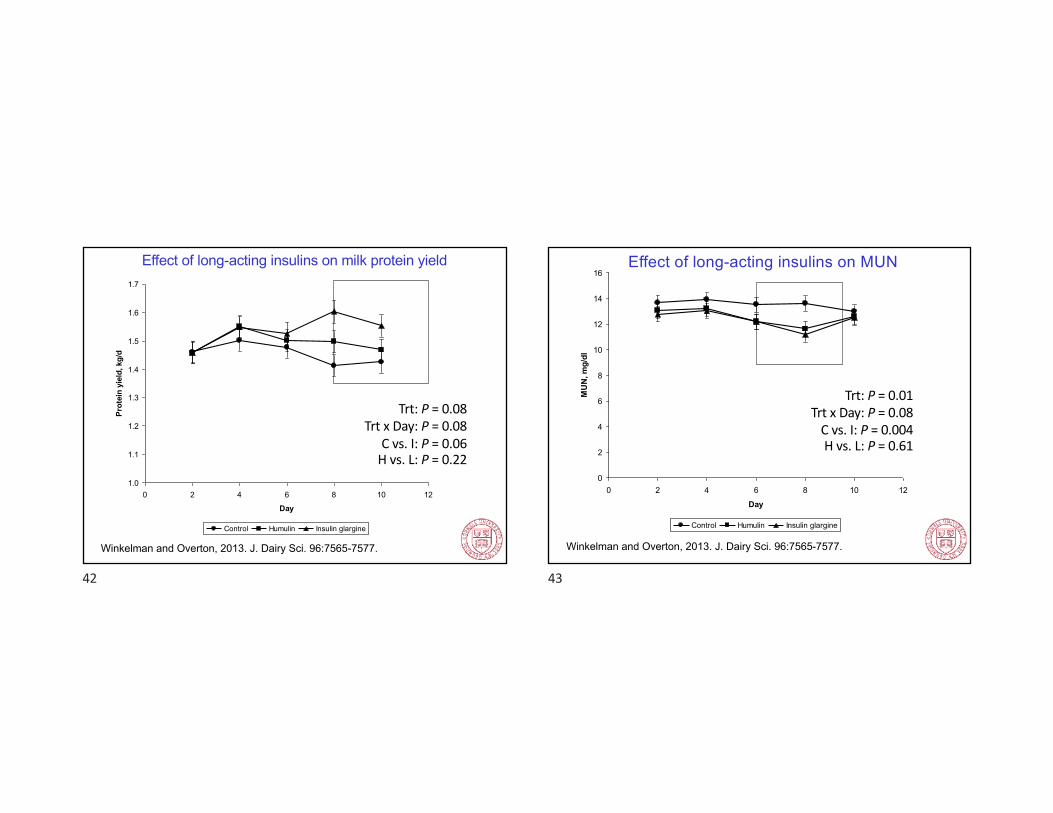
Effect of long-acting insulins on milk protein yield
Trt: P = 0.08Trt x Day: P = 0.08
C vs. I: P = 0.06H vs. L: P = 0.22
Winkelman and Overton, 2013. J. Dairy Sci. 96:7565-7577.
42
0
2
4
6
8
10
12
14
16
0 2 4 6 8 10 12
Day
MU
N, m
g/dl
Control Humulin Insulin glargine
Trt: P = 0.01Trt x Day: P = 0.08
C vs. I: P = 0.004H vs. L: P = 0.61
Effect of long-acting insulins on MUN
Winkelman and Overton, 2013. J. Dairy Sci. 96:7565-7577.
43
0
5
10
15
20
25
30
35
40
45
< C16 C16 > C16
FA c
ompo
sitio
n, g
/100
g F
A
Control H L
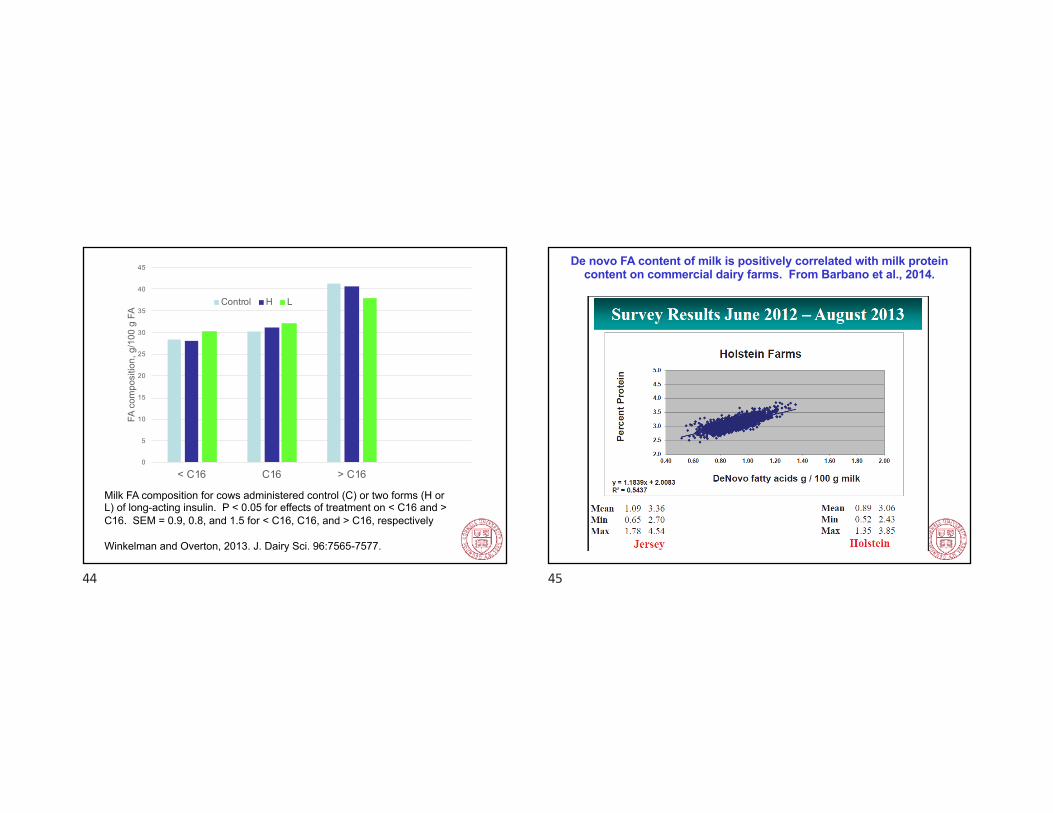
Milk FA composition for cows administered control (C) or two forms (H or L) of long-acting insulin. P < 0.05 for effects of treatment on < C16 and > C16. SEM = 0.9, 0.8, and 1.5 for < C16, C16, and > C16, respectively
Winkelman and Overton, 2013. J. Dairy Sci. 96:7565-7577.
44
De novo FA content of milk is positively correlated with milk protein content on commercial dairy farms. From Barbano et al., 2014.
45
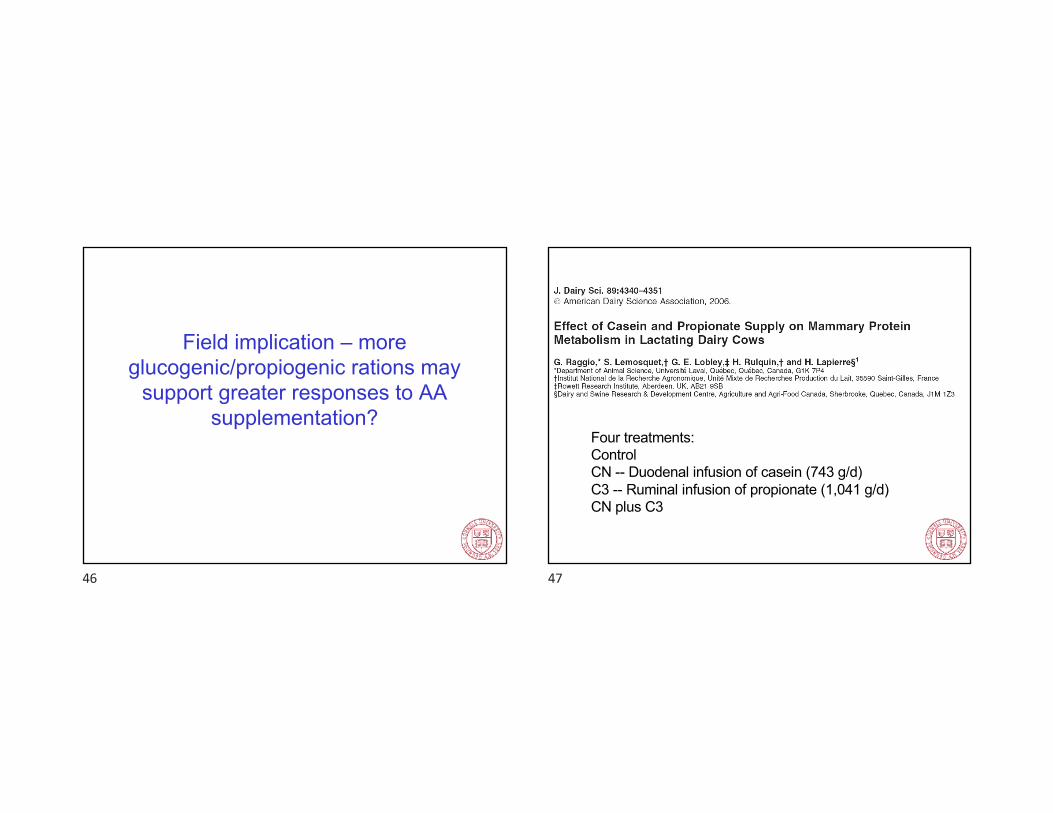
Field implication – more glucogenic/propiogenic rations may
support greater responses to AA supplementation?
46
Four treatments:ControlCN -- Duodenal infusion of casein (743 g/d)C3 -- Ruminal infusion of propionate (1,041 g/d)CN plus C3
47
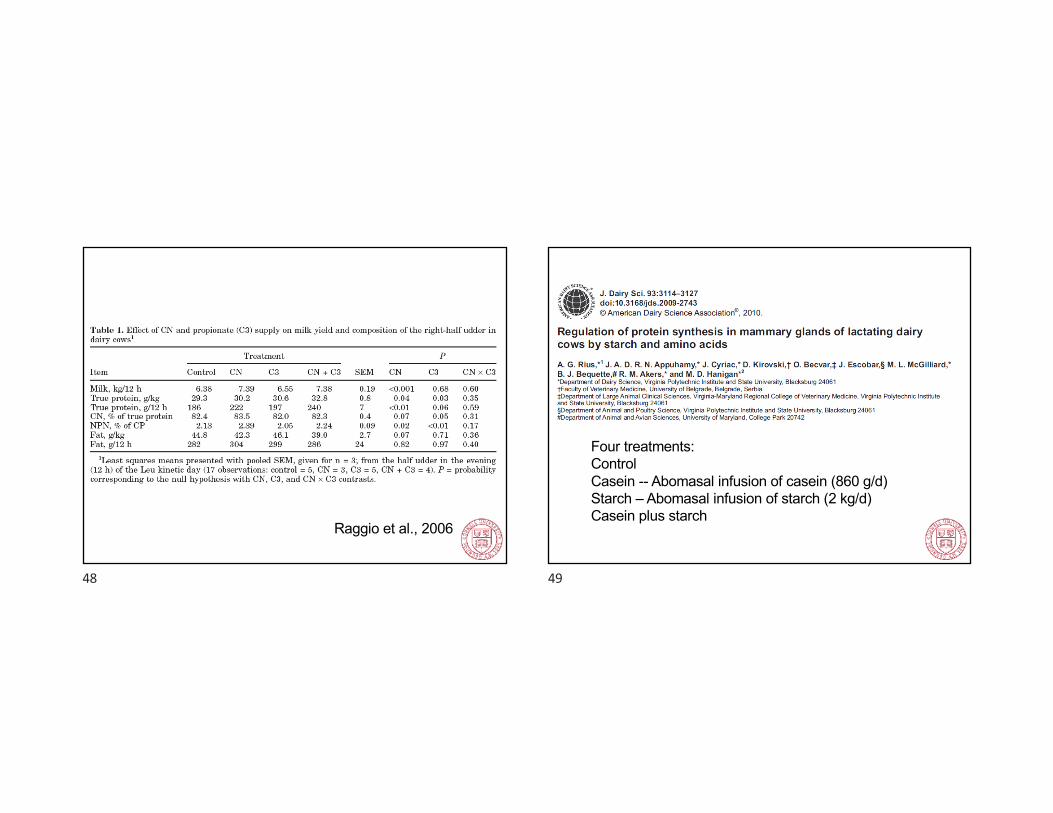
Raggio et al., 2006
48
Four treatments:ControlCasein -- Abomasal infusion of casein (860 g/d)Starch – Abomasal infusion of starch (2 kg/d)Casein plus starch
49
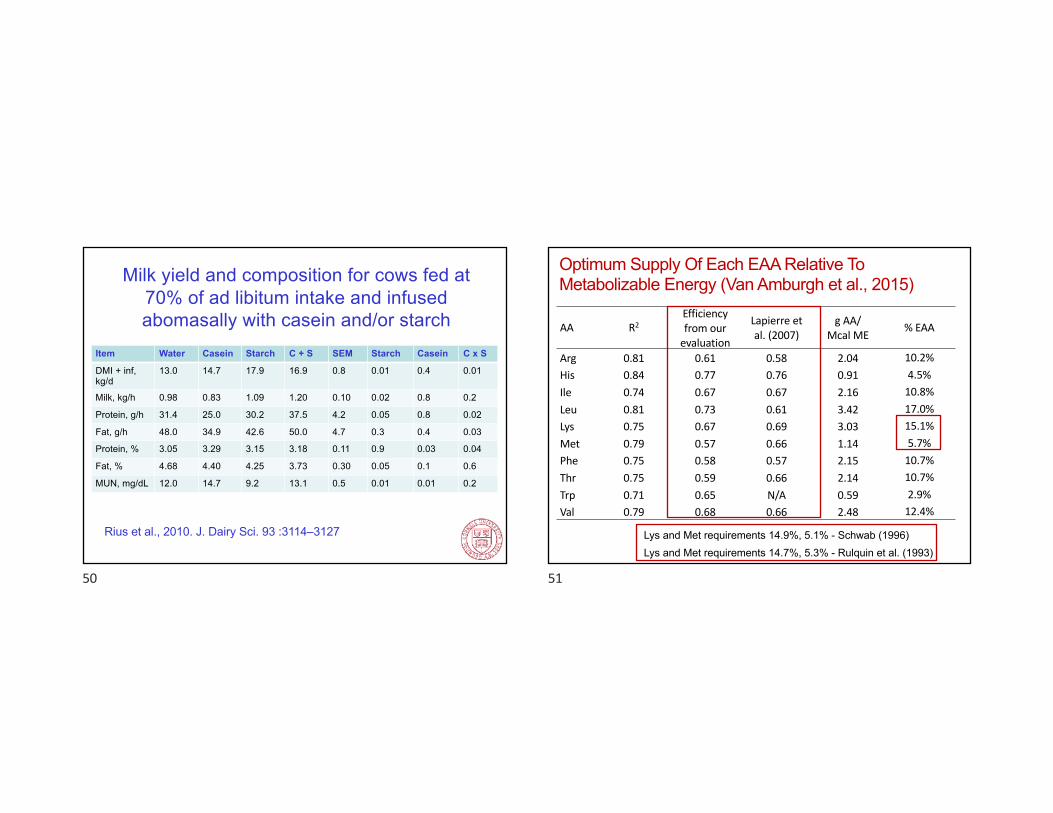
Item Water Casein Starch C + S SEM Starch Casein C x S
DMI + inf, kg/d
13.0 14.7 17.9 16.9 0.8 0.01 0.4 0.01
Milk, kg/h 0.98 0.83 1.09 1.20 0.10 0.02 0.8 0.2
Protein, g/h 31.4 25.0 30.2 37.5 4.2 0.05 0.8 0.02
Fat, g/h 48.0 34.9 42.6 50.0 4.7 0.3 0.4 0.03
Protein, % 3.05 3.29 3.15 3.18 0.11 0.9 0.03 0.04
Fat, % 4.68 4.40 4.25 3.73 0.30 0.05 0.1 0.6
MUN, mg/dL 12.0 14.7 9.2 13.1 0.5 0.01 0.01 0.2
Milk yield and composition for cows fed at 70% of ad libitum intake and infused abomasally with casein and/or starch
Rius et al., 2010. J. Dairy Sci. 93 :3114–3127
50
Optimum Supply Of Each EAA Relative To Metabolizable Energy (Van Amburgh et al., 2015)
AA R2Efficiency from our
evaluation
Lapierre et al. (2007)
g AA/ Mcal ME
% EAA
Arg 0.81 0.61 0.58 2.04 10.2%His 0.84 0.77 0.76 0.91 4.5%Ile 0.74 0.67 0.67 2.16 10.8%Leu 0.81 0.73 0.61 3.42 17.0%Lys 0.75 0.67 0.69 3.03 15.1%Met 0.79 0.57 0.66 1.14 5.7%Phe 0.75 0.58 0.57 2.15 10.7%Thr 0.75 0.59 0.66 2.14 10.7%Trp 0.71 0.65 N/A 0.59 2.9%Val 0.79 0.68 0.66 2.48 12.4%
Lys and Met requirements 14.9%, 5.1% - Schwab (1996)Lys and Met requirements 14.7%, 5.3% - Rulquin et al. (1993)
51
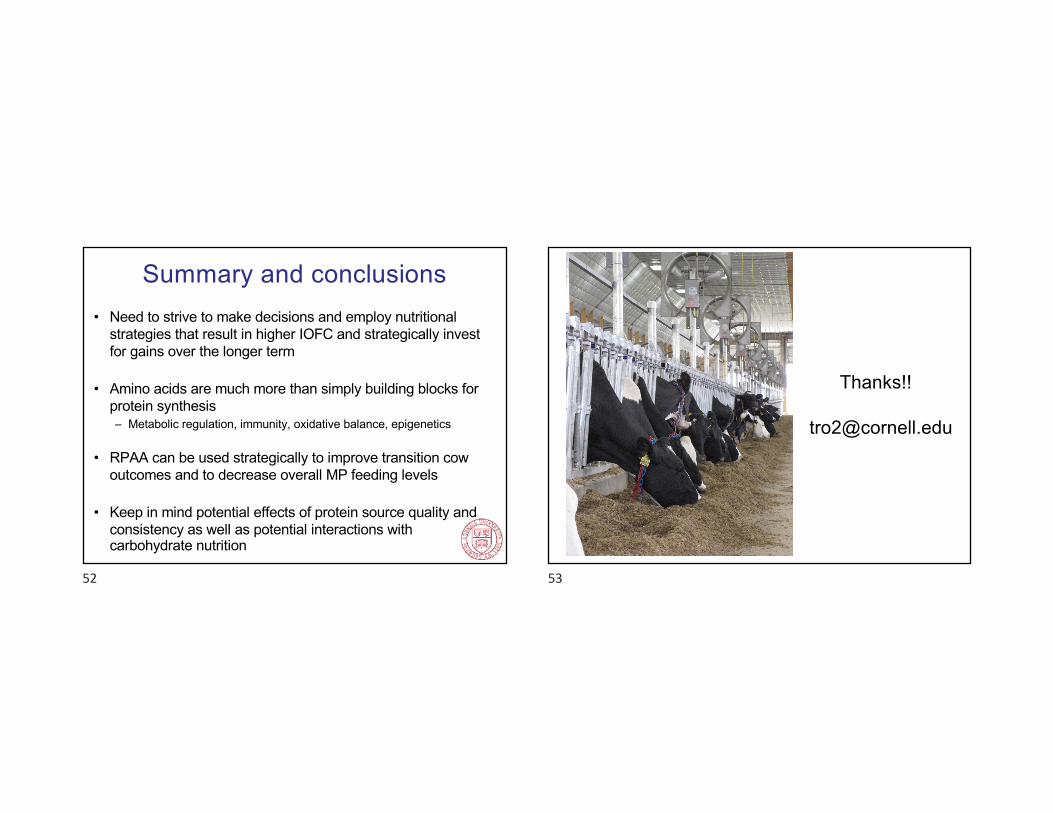
Summary and conclusions• Need to strive to make decisions and employ nutritional
strategies that result in higher IOFC and strategically invest for gains over the longer term
• Amino acids are much more than simply building blocks for protein synthesis– Metabolic regulation, immunity, oxidative balance, epigenetics
• RPAA can be used strategically to improve transition cow outcomes and to decrease overall MP feeding levels
• Keep in mind potential effects of protein source quality and consistency as well as potential interactions with carbohydrate nutrition
52
Thanks!!
53