Embed Size (px)
Citation preview
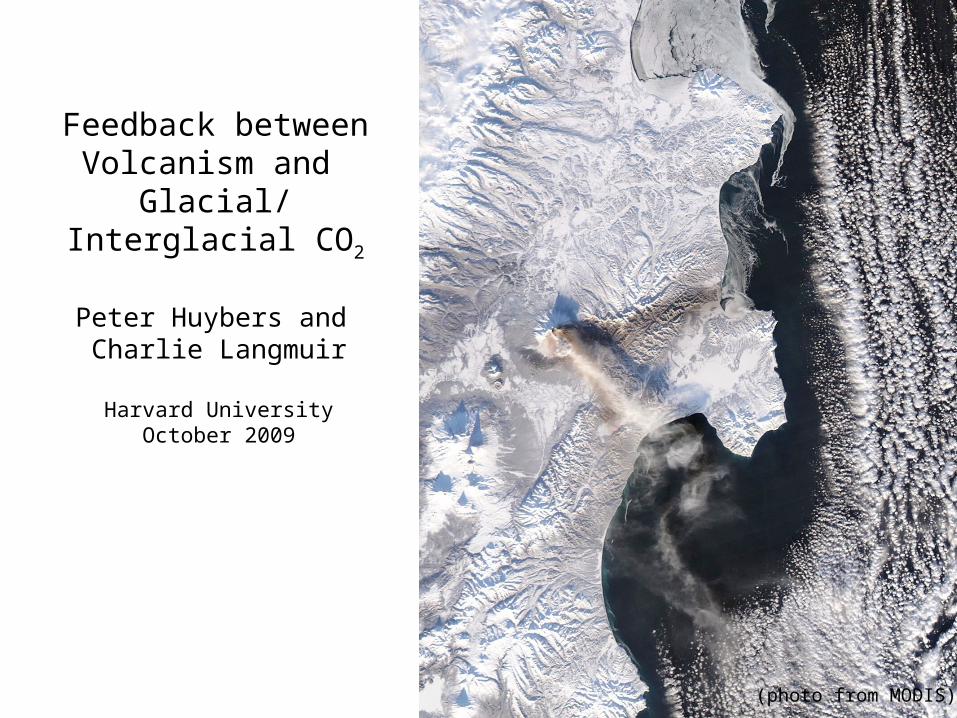
Feedback between Volcanism and
Glacial/Interglacial CO2
Peter Huybers and Charlie Langmuir
Harvard UniversityOctober 2009
(photo from MODIS)
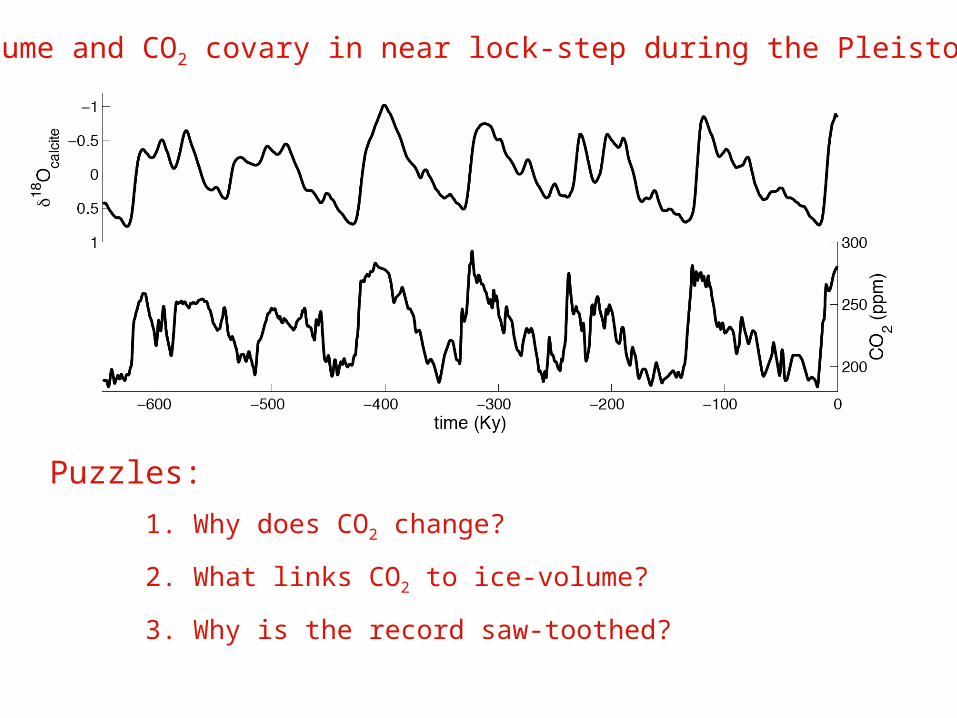
Puzzles:
1. Why does CO2 change?
2. What links CO2 to ice-volume?
3. Why is the record saw-toothed?
Ice-volume and CO2 covary in near lock-step during the Pleistocene…
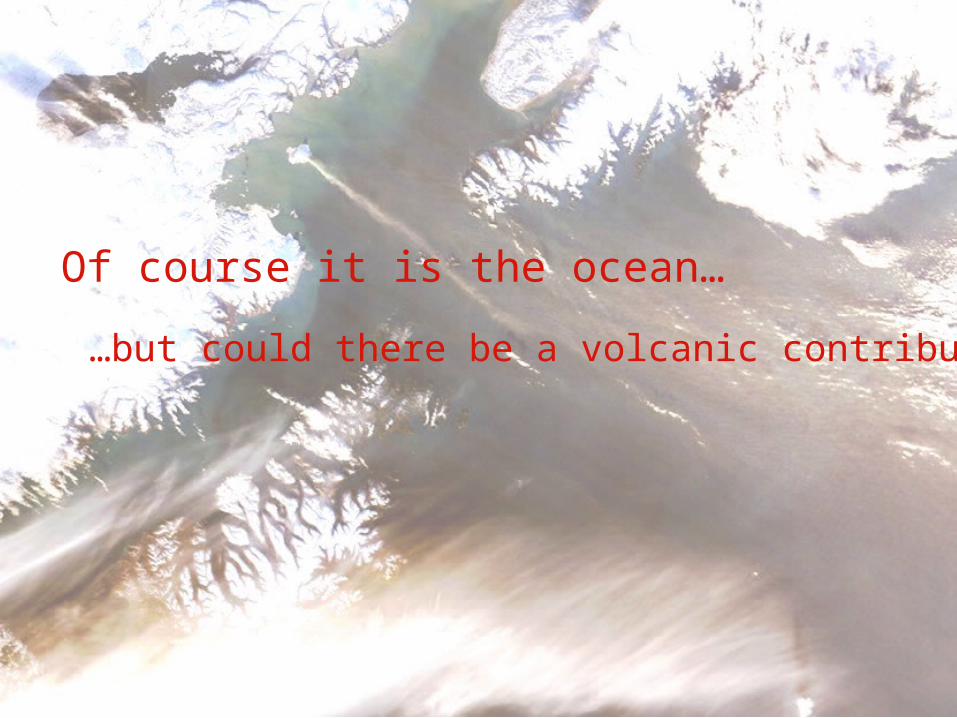
Of course it is the ocean…
…but could there be a volcanic contribution?
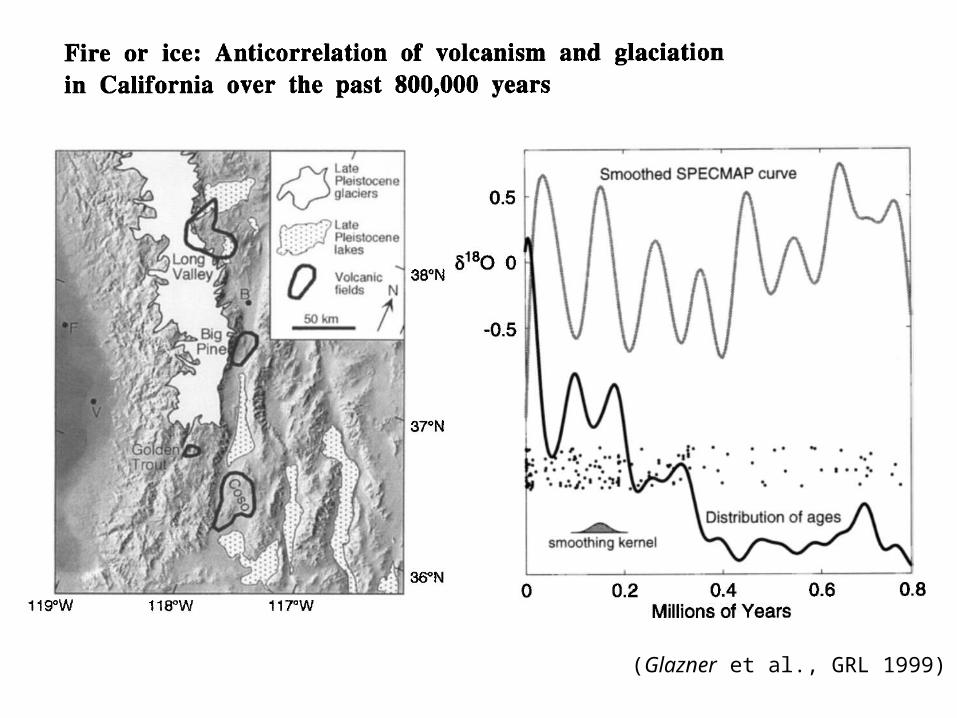
(Glazner et al., GRL 1999)
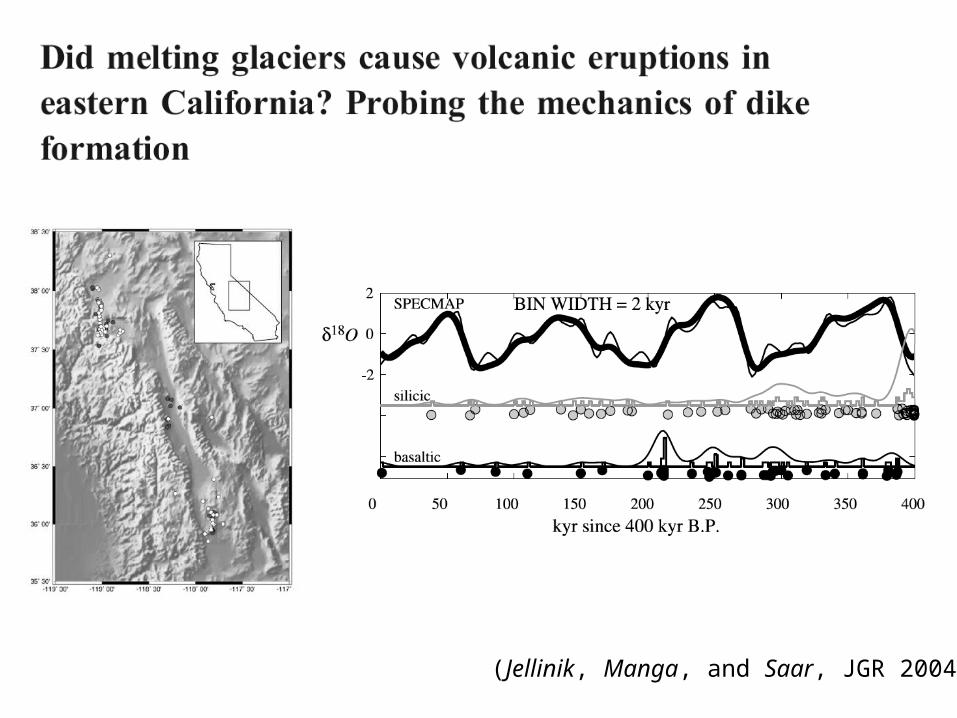
(Jellinik, Manga, and Saar, JGR 2004)
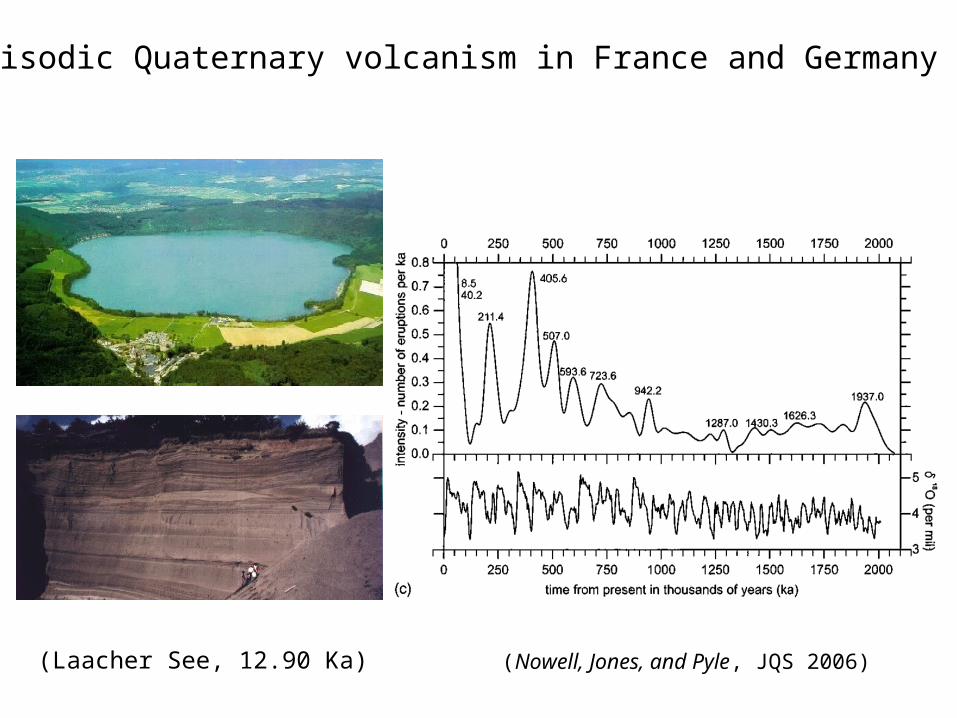
Episodic Quaternary volcanism in France and Germany
(Nowell, Jones, and Pyle, JQS 2006)(Laacher See, 12.90 Ka)
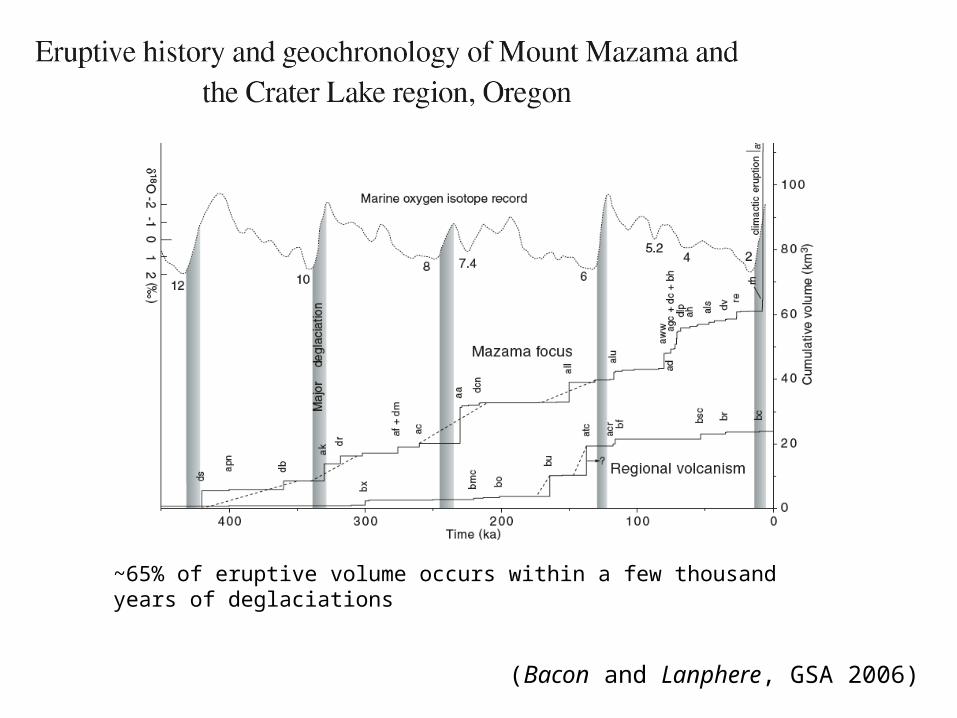
(Bacon and Lanphere, GSA 2006)
~65% of eruptive volume occurs within a few thousand years of deglaciations
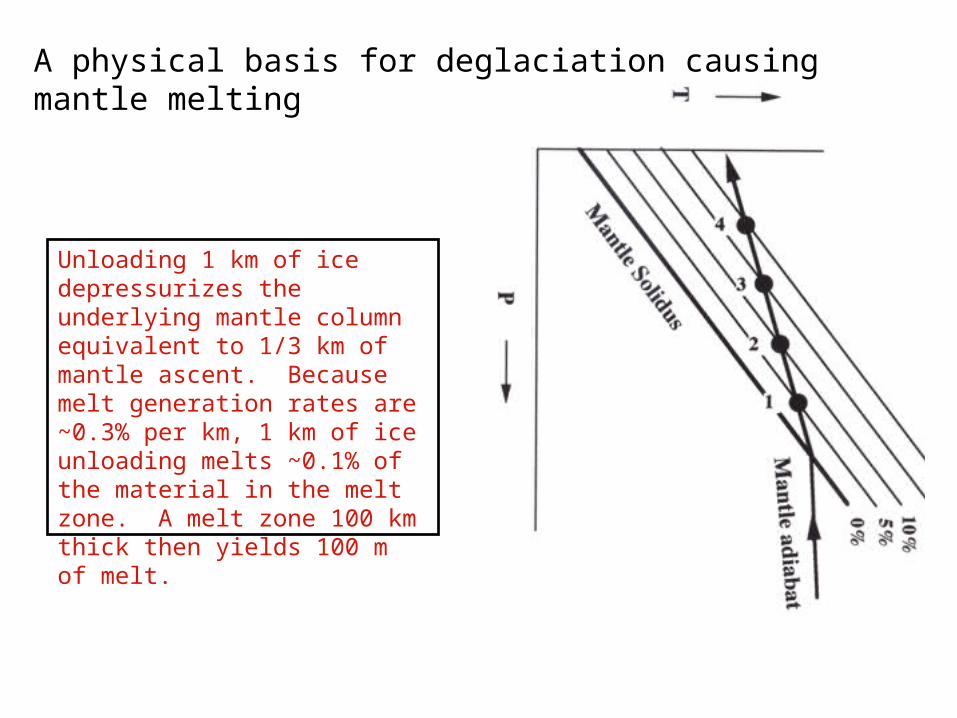
Unloading 1 km of ice depressurizes the underlying mantle column equivalent to 1/3 km of mantle ascent. Because melt generation rates are ~0.3% per km, 1 km of ice unloading melts ~0.1% of the material in the melt zone. A melt zone 100 km thick then yields 100 m of melt.
A physical basis for deglaciation causing mantle melting
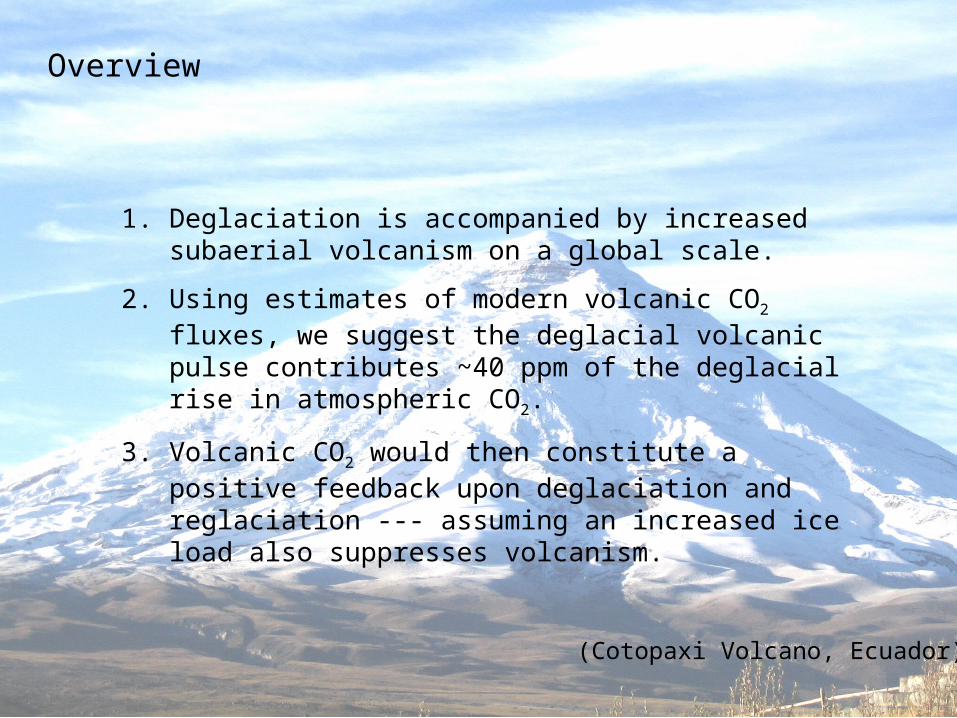
1. Deglaciation is accompanied by increased subaerial volcanism on a global scale.
2. Using estimates of modern volcanic CO2 fluxes, we suggest the deglacial volcanic pulse contributes ~40 ppm of the deglacial rise in atmospheric CO2.
3. Volcanic CO2 would then constitute a positive feedback upon deglaciation and reglaciation --- assuming an increased ice load also suppresses volcanism.
(Cotopaxi Volcano, Ecuador)
Overview
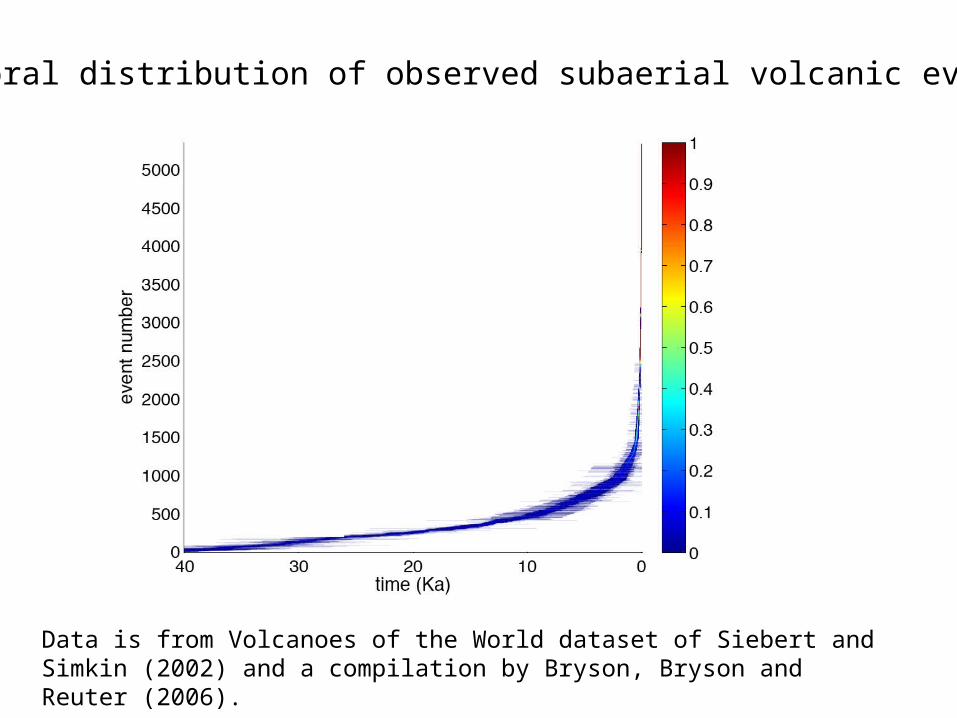
Temporal distribution of observed subaerial volcanic events
Data is from Volcanoes of the World dataset of Siebert and Simkin (2002) and a compilation by Bryson, Bryson and Reuter (2006).
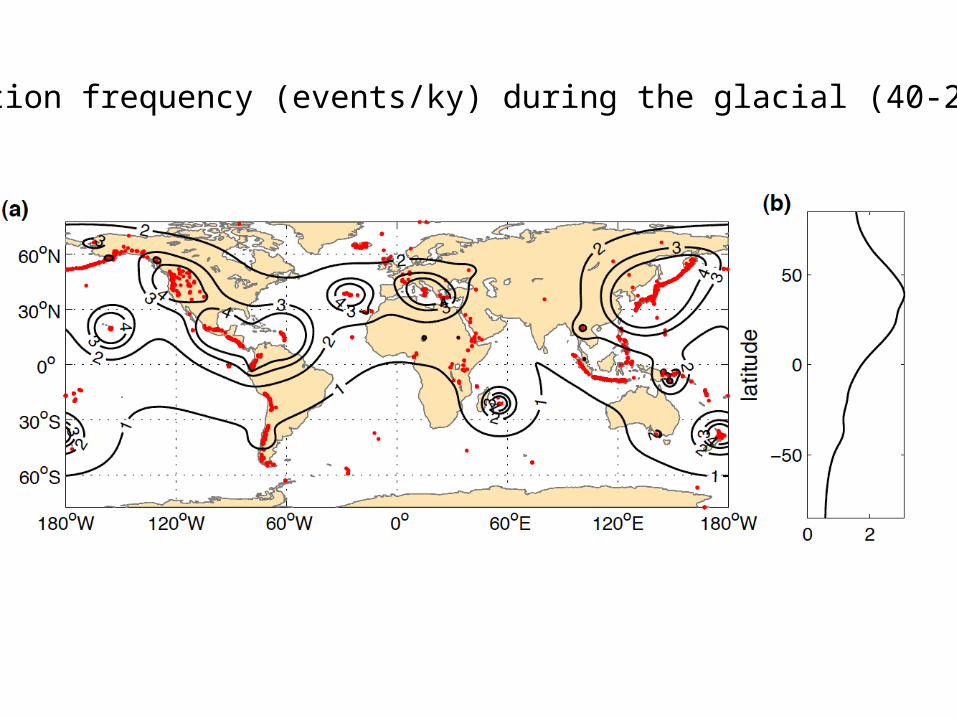
Eruption frequency (events/ky) during the glacial (40-20ka)
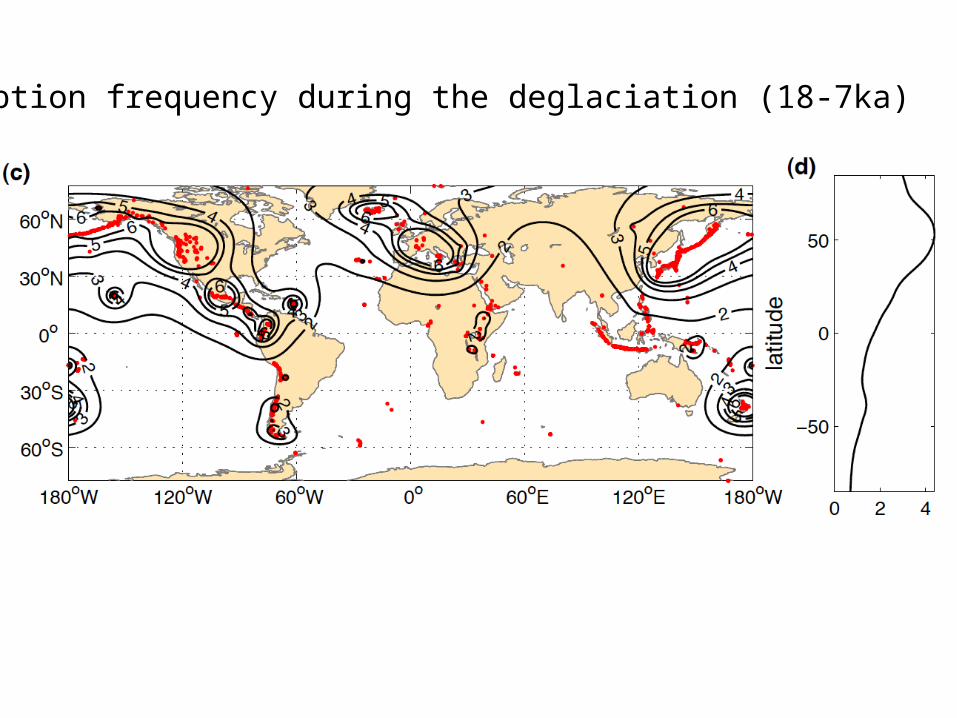
Eruption frequency during the deglaciation (18-7ka)
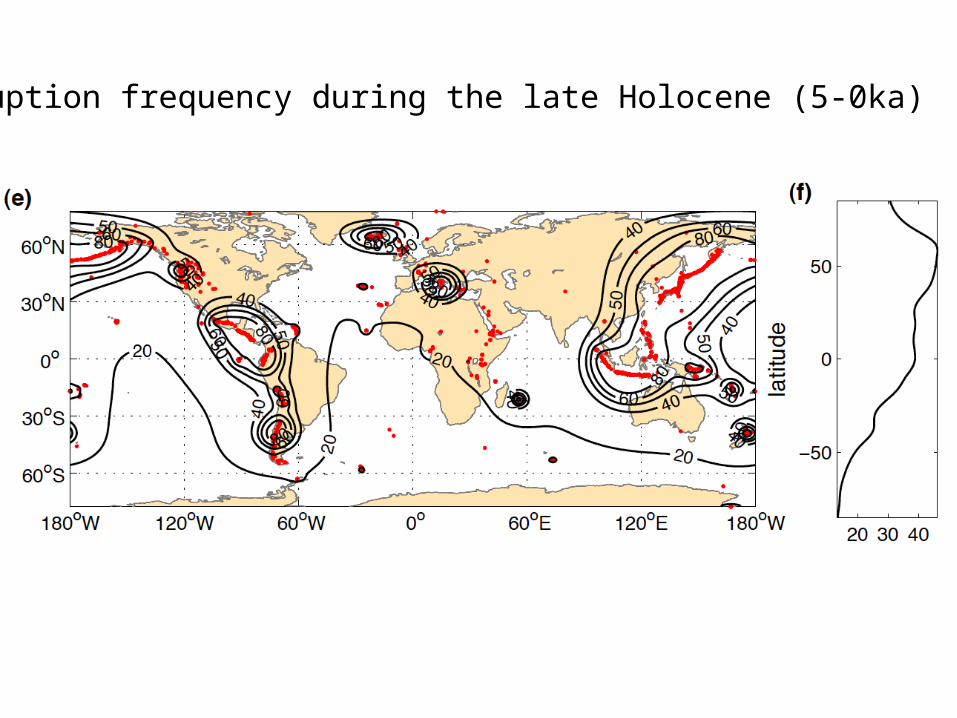
Eruption frequency during the late Holocene (5-0ka)
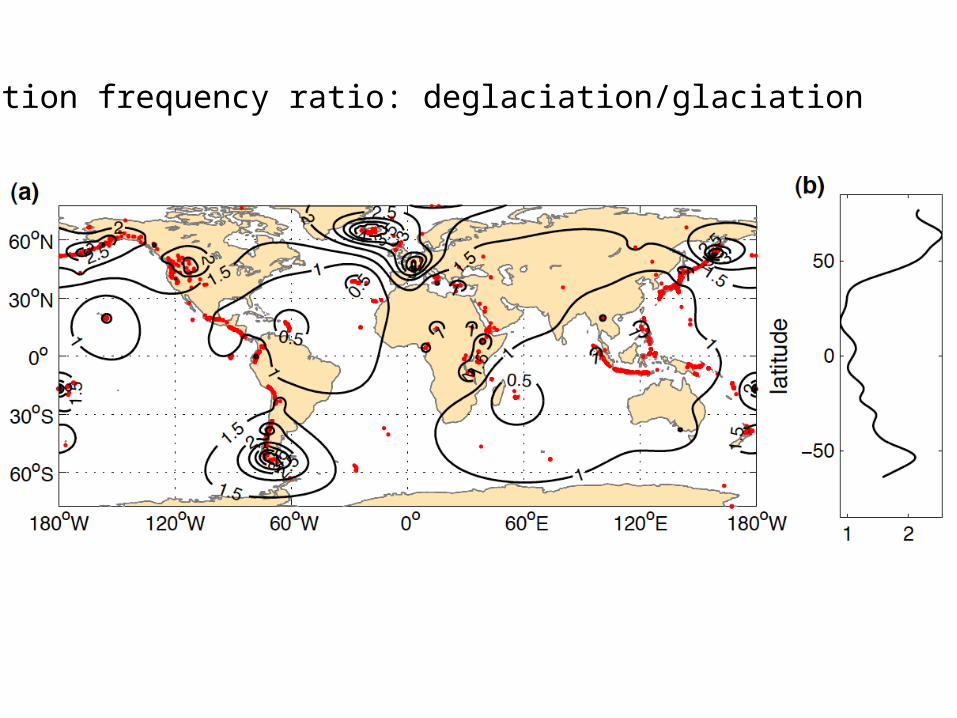
Eruption frequency ratio: deglaciation/glaciation
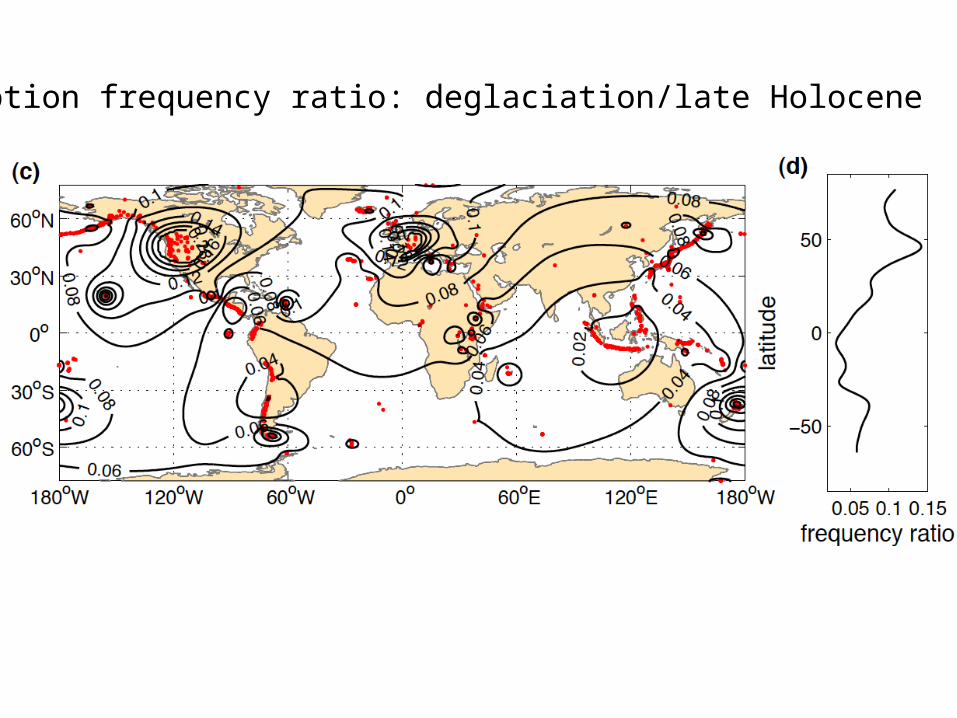
Eruption frequency ratio: deglaciation/late Holocene
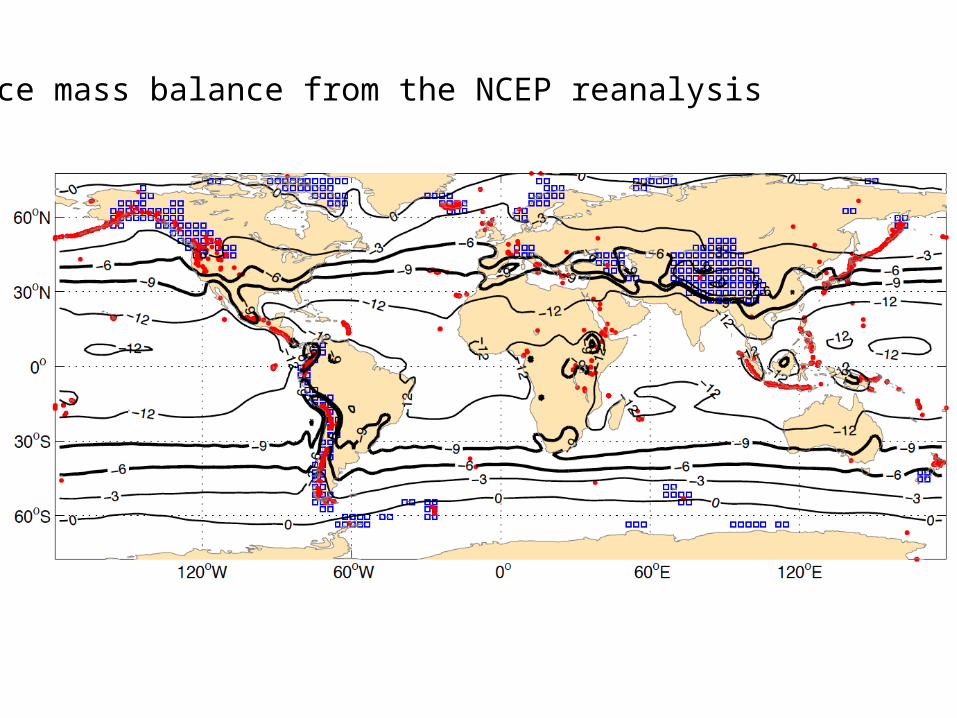
Ice mass balance from the NCEP reanalysis
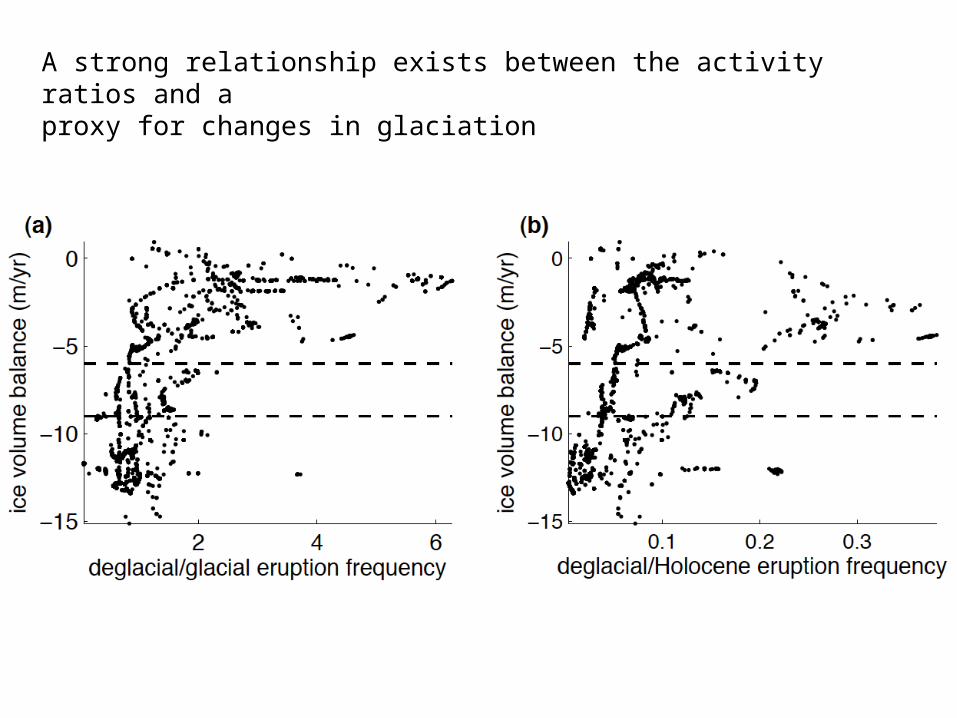
A strong relationship exists between the activity ratios and a proxy for changes in glaciation
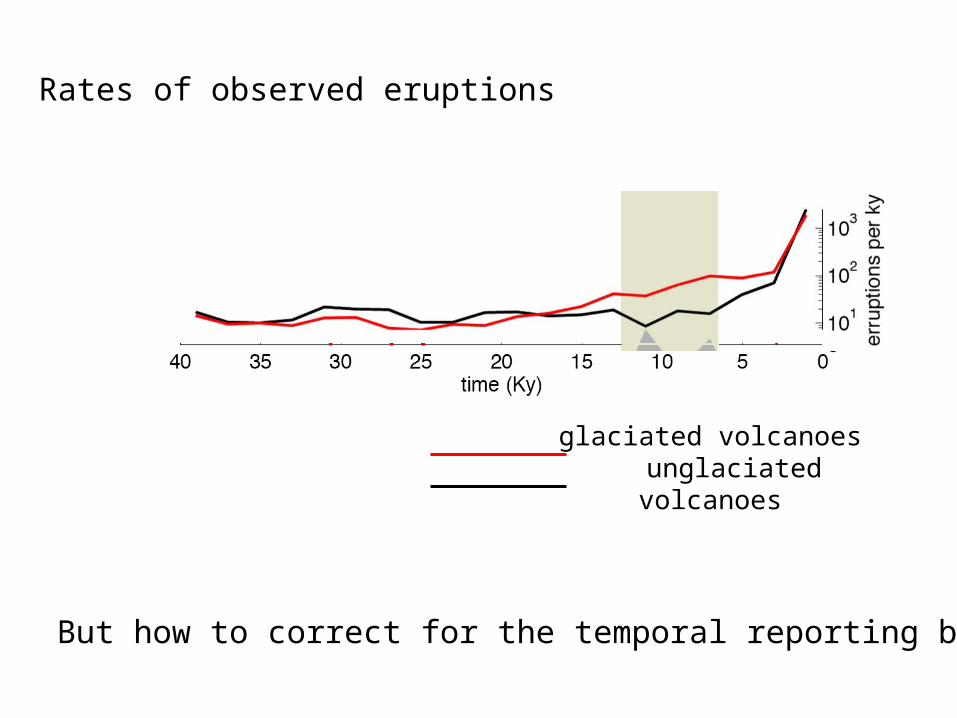
glaciated volcanoes unglaciated volcanoes
Rates of observed eruptions
But how to correct for the temporal reporting bias?
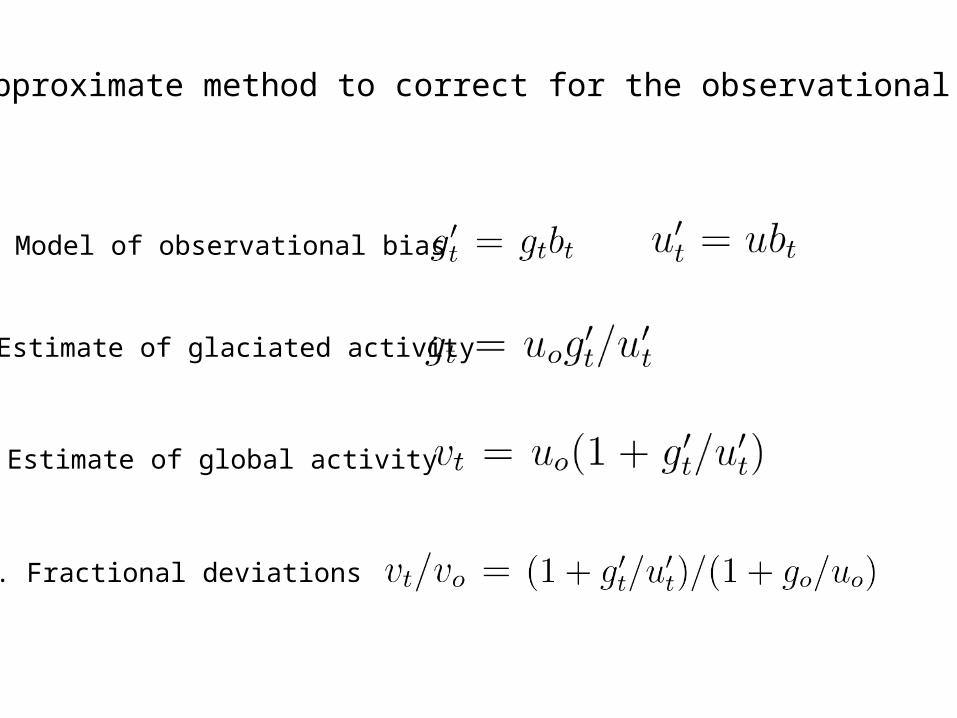
An approximate method to correct for the observational bias
1. Model of observational bias
2. Estimate of glaciated activity
3. Estimate of global activity
4. Fractional deviations
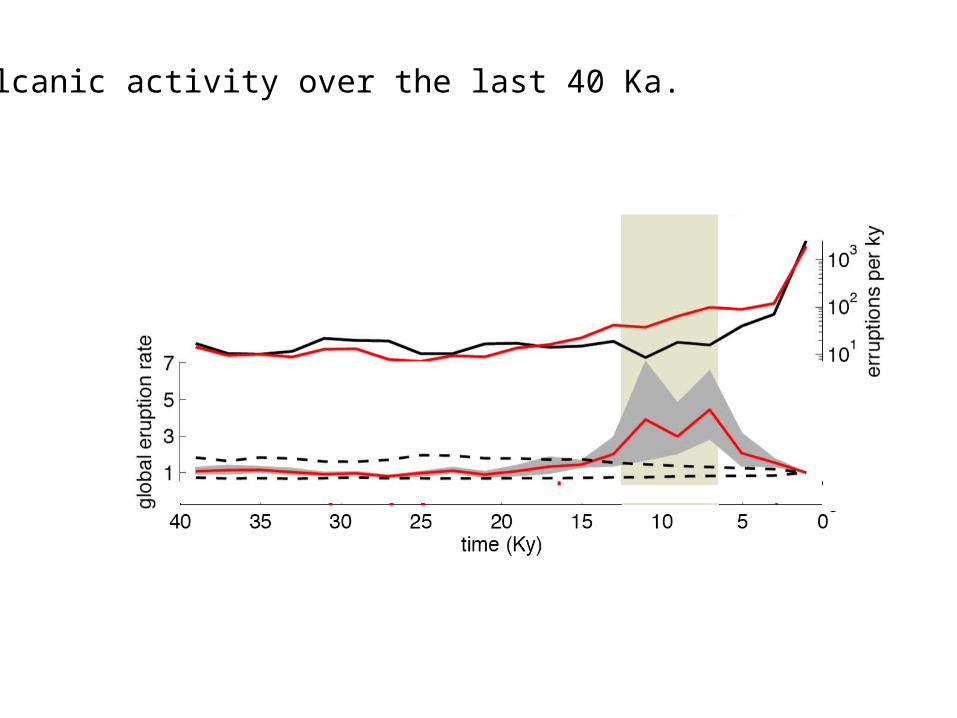
Volcanic activity over the last 40 Ka.
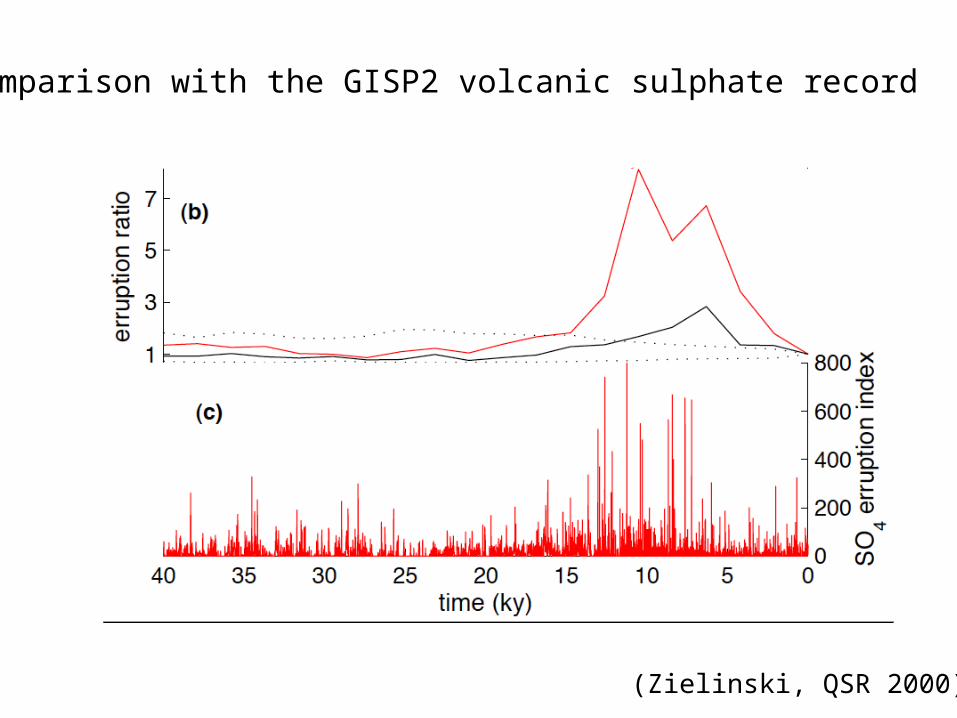
Comparison with the GISP2 volcanic sulphate record
(Zielinski, QSR 2000)
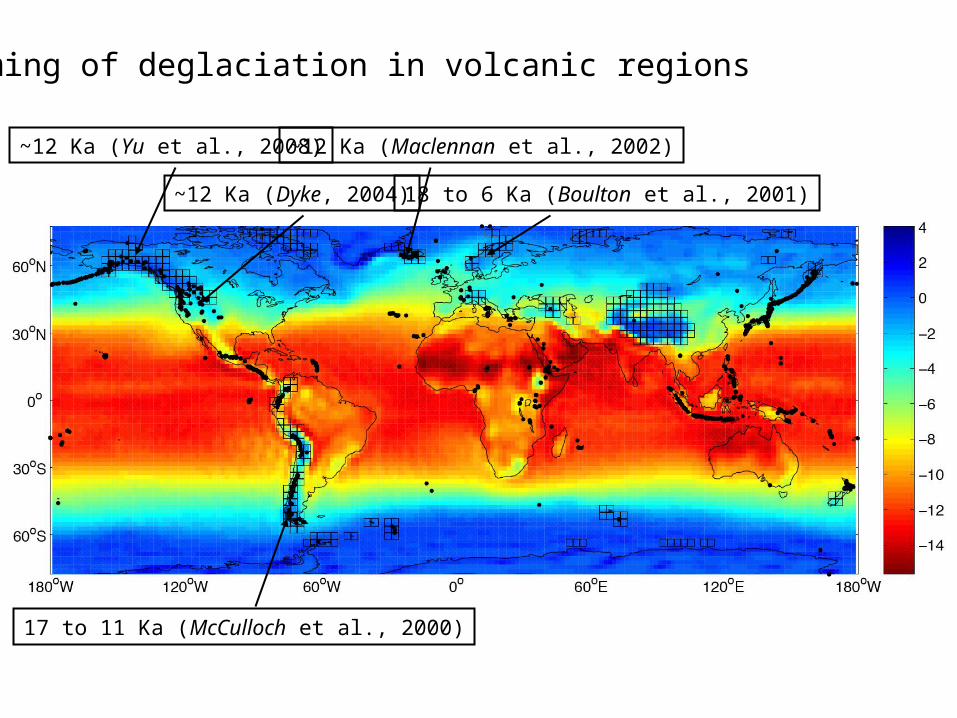
Timing of deglaciation in volcanic regions
~12 Ka (Yu et al., 2008)
~12 Ka (Dyke, 2004) 18 to 6 Ka (Boulton et al., 2001)
17 to 11 Ka (McCulloch et al., 2000)
~12 Ka (Maclennan et al., 2002)
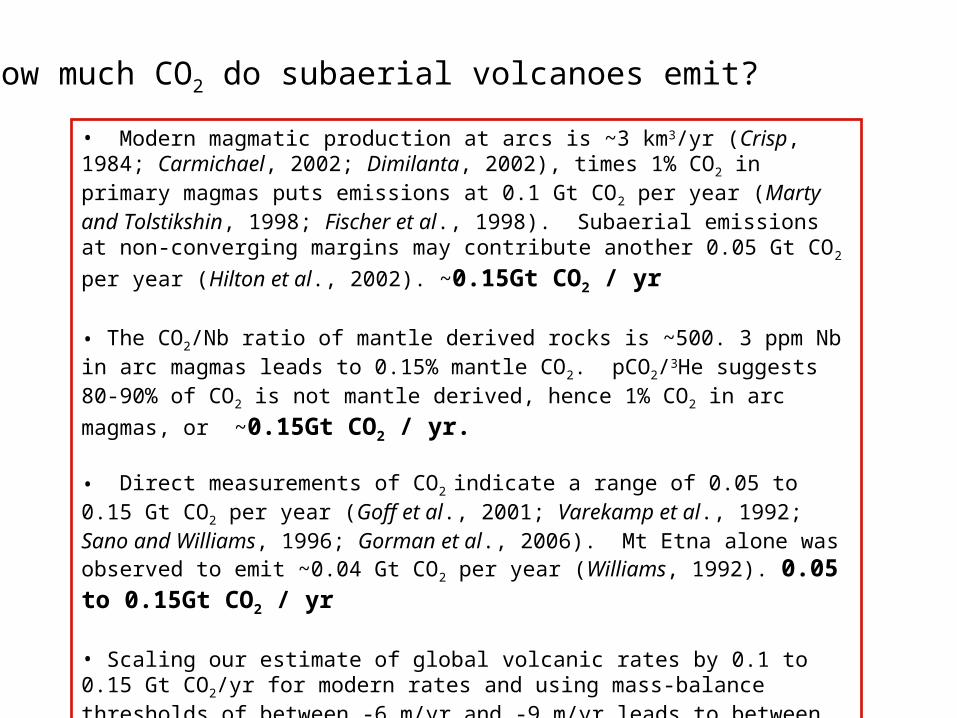
How much CO2 do subaerial volcanoes emit?
• Modern magmatic production at arcs is ~3 km3/yr (Crisp, 1984; Carmichael, 2002; Dimilanta, 2002), times 1% CO2 in primary magmas puts emissions at 0.1 Gt CO2 per year (Marty and Tolstikshin, 1998; Fischer et al., 1998). Subaerial emissions at non-converging margins may contribute another 0.05 Gt CO2 per
year (Hilton et al., 2002). ~0.15Gt CO2 / yr
• The CO2/Nb ratio of mantle derived rocks is ~500. 3 ppm Nb in arc magmas leads to 0.15% mantle CO2. pCO2/3He suggests 80-90% of CO2 is not mantle
derived, hence 1% CO2 in arc magmas, or ~0.15Gt CO2 / yr.
• Direct measurements of CO2 indicate a range of 0.05 to 0.15 Gt CO2 per year (Goff et al., 2001; Varekamp et al., 1992; Sano and Williams, 1996; Gorman et al., 2006). Mt Etna alone was observed to emit ~0.04 Gt CO2 per year (Williams,
1992). 0.05 to 0.15Gt CO2 / yr
• Scaling our estimate of global volcanic rates by 0.1 to 0.15 Gt CO2/yr for modern rates and using mass-balance thresholds of between -6 m/yr and -9 m/yr leads to between 1000 to 5000 Gt CO2 emitted above a baseline scenario of current
emissions during the last deglaciation.
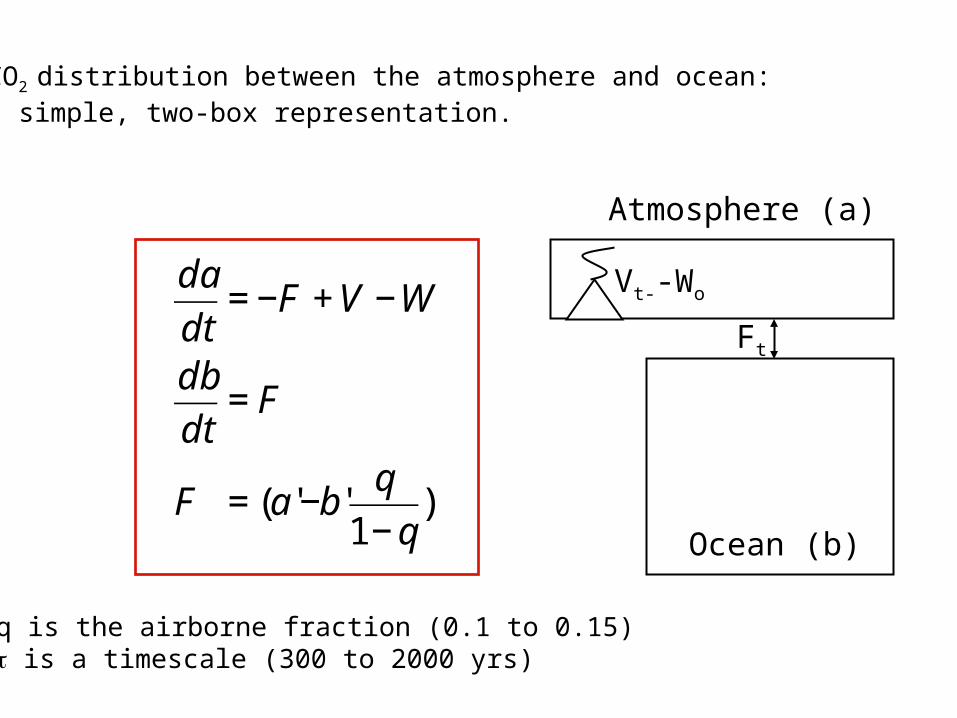
CO2 distribution between the atmosphere and ocean:a simple, two-box representation.
Atmosphere (a)
Ocean (b)
Vt--Wo
Ft
q is the airborne fraction (0.1 to 0.15) is a timescale (300 to 2000 yrs)
€
da
dt= −F +V −W
db
dt= F
F = (a'−b'q
1−q)
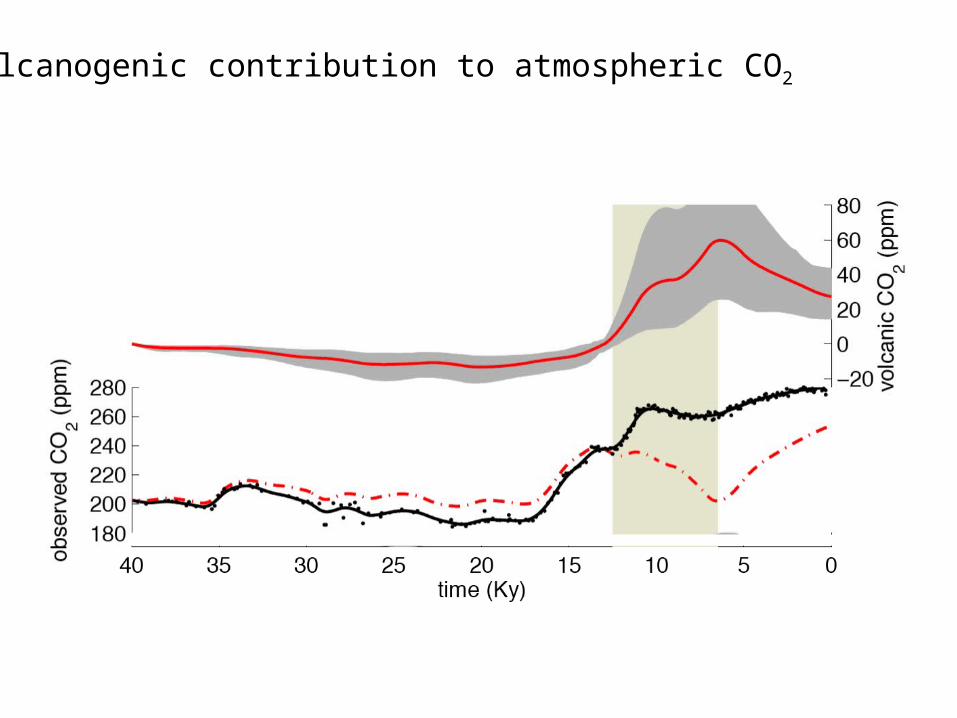
Volcanogenic contribution to atmospheric CO2
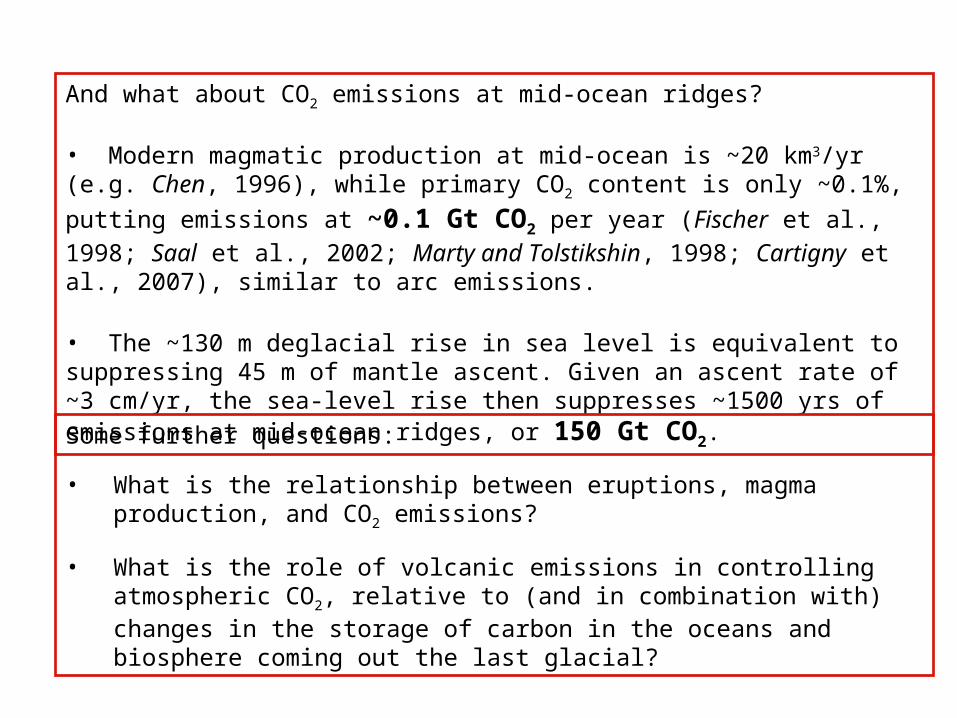
And what about CO2 emissions at mid-ocean ridges?
• Modern magmatic production at mid-ocean is ~20 km3/yr (e.g. Chen, 1996), while primary CO2 content is only ~0.1%, putting emissions at ~0.1 Gt CO2 per
year (Fischer et al., 1998; Saal et al., 2002; Marty and Tolstikshin, 1998; Cartigny et al., 2007), similar to arc emissions.
• The ~130 m deglacial rise in sea level is equivalent to suppressing 45 m of mantle ascent. Given an ascent rate of ~3 cm/yr, the sea-level rise then suppresses ~1500 yrs of emissions at mid-ocean ridges, or 150 Gt CO2.
Some further questions:
• What is the relationship between eruptions, magma production, and CO2 emissions?
• What is the role of volcanic emissions in controlling atmospheric CO2, relative to (and in combination with) changes in the storage of carbon in the oceans and biosphere coming out the last glacial?
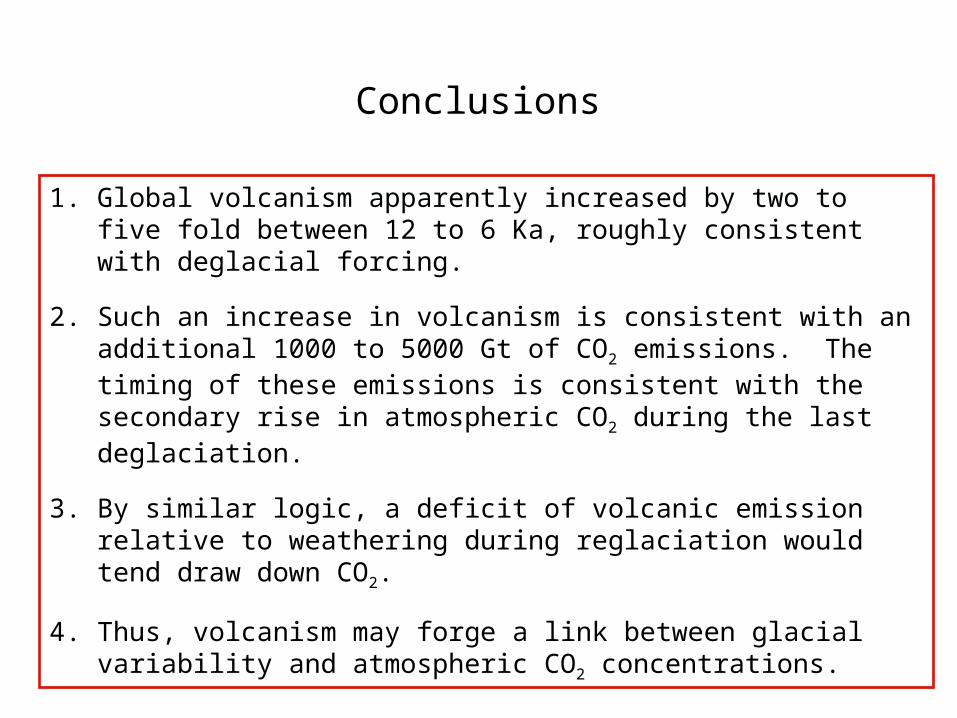
1. Global volcanism apparently increased by two to five fold between 12 to 6 Ka, roughly consistent with deglacial forcing.
2. Such an increase in volcanism is consistent with an additional 1000 to 5000 Gt of CO2 emissions. The timing of these emissions is consistent with the secondary rise in atmospheric CO2 during the last deglaciation.
3. By similar logic, a deficit of volcanic emission relative to weathering during reglaciation would tend draw down CO2.
4. Thus, volcanism may forge a link between glacial variability and atmospheric CO2 concentrations.
Conclusions
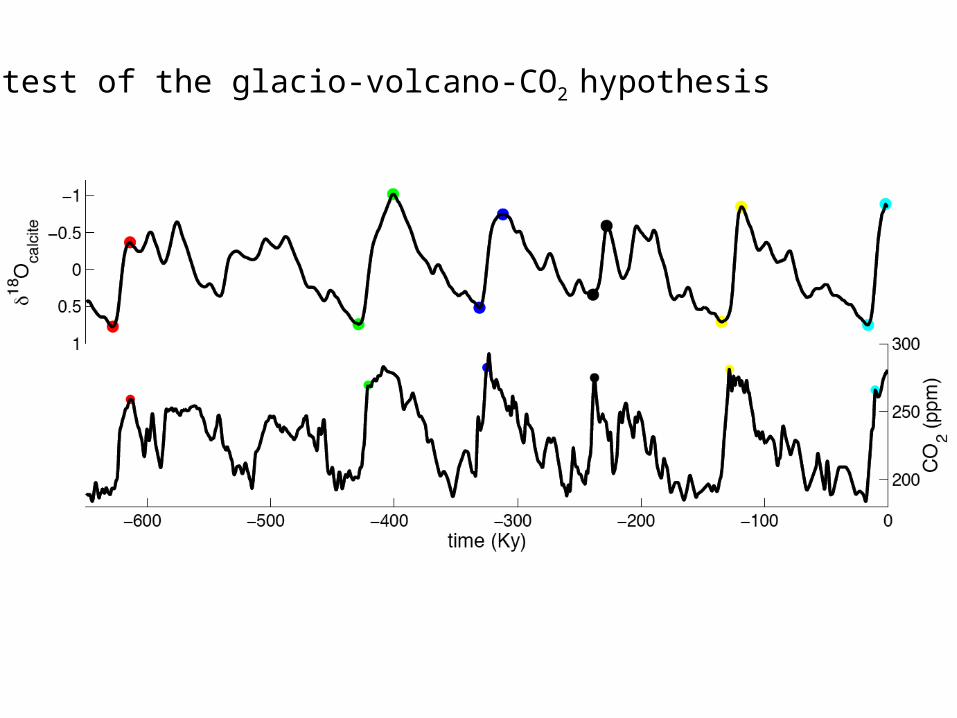
A test of the glacio-volcano-CO2 hypothesis
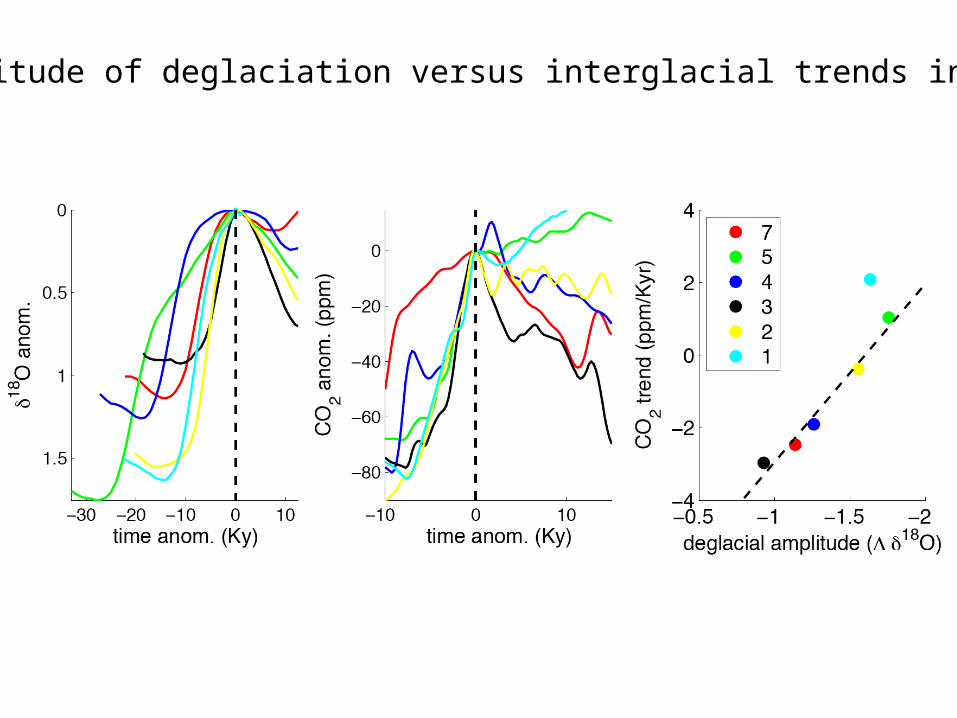
Amplitude of deglaciation versus interglacial trends in CO2