Embed Size (px)
Citation preview
Federal Reserve System Monthly Report on
Credit and Liquidity Programsand the Balance Sheet
September 2011
BOARD OF GOVERNOR S O F THE F EDERAL R E S ERV E SY S T EM
To order additional copies of this or other Federal Reserve Board publications, contact:
Publications Fulfillment
Mail Stop N-127
Board of Governors of the Federal Reserve System
Washington, DC 20551
(ph) 202-452-3245
(fax) 202-728-5886
(e-mail) [email protected]
This and other Federal Reserve Board reports to Congress are also available online at
www.federalreserve.gov/boarddocs/rptcongress/default.htm.
Purpose
The Federal Reserve prepares this monthly report as
part of its efforts to enhance transparency about the
range of programs and tools that have been imple-
mented in response to the financial crisis and to
ensure appropriate accountability to the Congress
and the public. The Federal Reserve’s statutory man-
date in conducting monetary policy is to foster maxi-
mum employment and stable prices. Financial stabil-
ity is a critical prerequisite for achieving sustainable
economic growth and price stability, and the Federal
Reserve implemented a number of credit and liquid-
ity programs to support the liquidity of financial
institutions and to foster improved conditions in
financial markets in response to the extraordinary
strains that began to emerge in the summer of 2007.
This report provides detailed information on the
policy tools that were implemented to address the
financial crisis. It also provides financial reporting for
the Federal Reserve System for the second quarter of
2011.
In fulfillment of Section 129 of the Emergency Eco-
nomic Stabilization Act of 2008, additional informa-
tion on the status of certain credit facilities imple-
mented in response to the financial crisis is included
as Appendix A of this report. Information related to
the Federal Reserve’s temporary liquidity programs
and facilities that have closed or expired is included
in Appendix B of this report.
The Dodd-Frank Wall Street Reform and Consumer
Protection Act of 2010 (the “Dodd-Frank Act”),
which was signed into law on July 21, 2010, included
provisions designed to further promote transparency
by requiring disclosure of certain information about
entities that received loans or otherwise participated
in Federal Reserve credit and liquidity programs. As
provided by the Dodd-Frank Act, transaction-level
details and audit information from December 1,
2007, to July 21, 2010, are now posted on the Federal
Reserve Board’s public website.1 Further information
on the transparency provisions of the Dodd-Frank
Act is included in Appendix C of this report.
For prior editions of this report and other resources,
please visit the Board’s public website at
www.federalreserve.gov/monetarypolicy/clbsreports.htm.
Note: Financial information in this report has not been audited.Financial data are audited annually and are available atwww.federalreserve.gov/monetarypolicy/bst_fedfinancials.htm.
1 This detailed information can be found atwww.federalreserve.gov/newsevents/reform_transaction.htm andwww.federalreserve.gov/newsevents/reform_audit.htm.
i
Abbreviations
ABCP Asset-backed commercial paper
ABS Asset-backed securities
AIA American International AssuranceCompany Ltd.
AIG American International Group, Inc.
AIGFP AIG Financial Products Corp.
ALICO American Life Insurance Company
AMLF Asset-Backed Commercial PaperMoney Market Mutual FundLiquidity Facility
ARM Adjustable rate mortgage
CAMELS Capital, Assets, Management,Earnings, Liquidity, and Sensitivity
CDO Collateralized debt obligations
CMBS Commercial mortgage-backedsecurities
CMO Collateralized mortgage obligations
CPFF Commercial Paper Funding Facility
CUSIP Committee on Uniform SecurityIdentification Procedures
FCB Foreign central bank
FOMC Federal Open Market Committee
FRBNY Federal Reserve Bank of New York
GAAP Generally accepted accountingprinciples in the United States ofAmerica
GSE Government-sponsored entity
JPMC JPMorgan Chase & Co.
LLC Limited liability company
LSAP Large-scale asset purchase programs
MBS Mortgage-backed securities
ML II Maiden Lane II LLC
ML III Maiden Lane III LLC
MMMF Money market mutual fund
NRSRO Nationally recognized statistical ratingorganization
OIG Office of the Inspector General
OMO Open market operations
PDCF Primary Dealer Credit Facility
RMBS Residential mortgage-backedsecurities
SBA Small Business Administration
SOMA System Open Market Account
SPV Special purpose vehicle
TAF Term Auction Facility
TALF Term Asset-Backed Securities LoanFacility
TARP Troubled Asset Relief Program
TBA To be announced
TIPS Treasury inflation-protected securities
TSLF Term Securities Lending Facility
VIE Variable interest entity
ii
Contents
Overview ..................................................................................................................................... 1
Recent Developments ............................................................................................................. 1
System Open Market Account ............................................................................................ 4
Domestic SOMA Portfolio ....................................................................................................... 4
Liquidity Arrangements with Foreign Central Banks .................................................................. 7
Lending Facilities to Support Overall Market Liquidity .......................................... 10
Lending to Depository Institutions .......................................................................................... 10
Term Asset-Backed Securities Loan Facility ........................................................................... 12
Lending in Support of Specific Institutions .................................................................. 17Quarterly Developments ........................................................................................................ 17
Bear Stearns and Maiden Lane LLC ....................................................................................... 17
AIG, Maiden Lane II LLC, and Maiden Lane III LLC ................................................................. 19
Federal Reserve Banks’ Financial Tables ....................................................................... 24
Quarterly Developments ........................................................................................................ 24
Combined Statement of Income and Comprehensive Income .................................................. 24
SOMA Financial Summary ..................................................................................................... 26
Loan Programs Financial Summary ........................................................................................ 27
Consolidated VIEs Financial Summary ................................................................................... 27
Appendix A: Additional Information Provided Pursuant to Section 129of the Emergency Economic Stabilization Act of 2008 ............................................ 29
Appendix B: Information about Closed and Expired Credit and LiquidityFacilities and Programs ........................................................................................................ 31
Appendix C: Federal Reserve Disclosure Requirements and OtherProvisions of the Dodd-Frank Wall Street Reform and ConsumerProtection Act of 2010 ......................................................................................................... 33
iii
Tables and Figures
Overview ..................................................................................................................................... 1
Table 1. Assets, liabilities, and capital of the Federal Reserve System ....................................... 2
Figure 1. Credit and liquidity programs and the Federal Reserve’s balance sheet ....................... 3
System Open Market Account ............................................................................................ 4
Table 2. Domestic SOMA securities holdings ........................................................................... 5
Table 3. Amounts outstanding under dollar liquidity swaps ....................................................... 8
Lending Facilities to Support Overall Market Liquidity .......................................... 10
Table 4. Discount window credit outstanding to depository institutions ................................... 10
Table 5. Concentration of discount window credit outstanding to depository institutions .......... 11
Table 6. Lendable value of collateral pledged by borrowing depository institutions .................. 12
Table 7. Lendable value of securities pledged by depository institutions by rating .................... 12
Table 8. Discount window credit outstanding to borrowing depository institutions—percent of collateral used ................................................................................................. 12
Table 9. TALF: Number of borrowers and loans outstanding ................................................... 13
Table 10. TALF collateral by underlying loan type ................................................................... 14
Table 11. TALF collateral by rating ......................................................................................... 14
Table 12A. Issuers of non-CMBS that collateralize outstanding TALF loans ............................. 15
Table 12B. Issuers of newly issued CMBS that collateralize outstanding TALF loans ................ 15
Table 12C. Issuers of legacy CMBS that collateralize outstanding TALF loans ......................... 15
Lending in Support of Specific Institutions .................................................................. 17Table 13. Fair value asset coverage of FRBNY loan ................................................................ 17
Table 14. Maiden Lane LLC outstanding principal balance of loans ......................................... 17
Table 15. Maiden Lane LLC summary of portfolio composition, cash and cashequivalents, and other assets and liabilities ....................................................................... 17
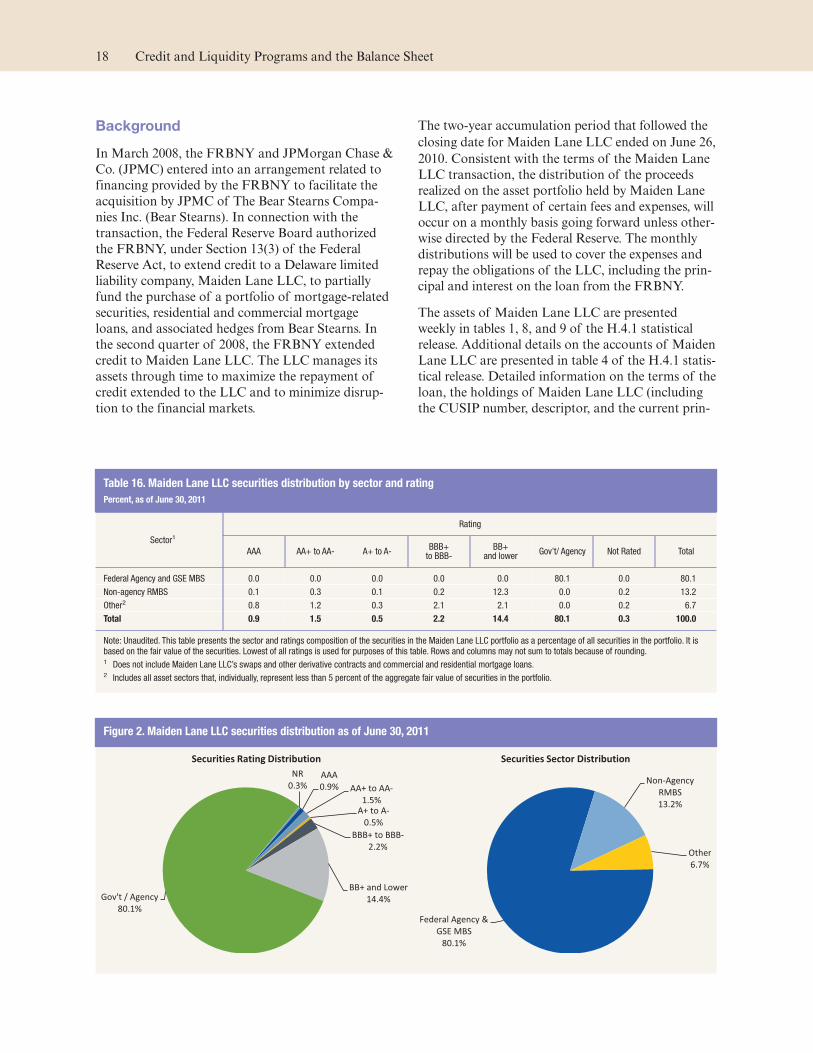
Table 16. Maiden Lane LLC securities distribution by sector and rating ................................... 18
Figure 2. Maiden Lane LLC securities distribution as of June 30, 2011 ..................................... 18
Table 17. Maiden Lane II LLC outstanding principal balance of senior loan and fixeddeferred purchase price ................................................................................................... 20
Table 18. Maiden Lane II LLC summary of RMBS portfolio composition, cash and cashequivalents, and other assets and liabilities ....................................................................... 20
Table 19. Maiden Lane II LLC securities distribution by sector and rating ................................ 20
Figure 3. Maiden Lane II LLC securities distribution as of June 30, 2011 .................................. 20
Table 20. Maiden Lane III LLC outstanding principal balance of senior loan and equitycontribution ..................................................................................................................... 21
Table 21. Maiden Lane III LLC summary of portfolio composition, cash and cashequivalents, and other assets and liabilities ....................................................................... 21
iv
Table 22. Maiden Lane III LLC securities distribution by sector, vintage, and rating .................. 22
Figure 4. Maiden Lane III LLC securities distribution as of June 30, 2011 ................................. 22
Federal Reserve Banks’ Financial Tables ....................................................................... 24
Table 23. Federal Reserve Banks’ Combined Statement of Income and ComprehensiveIncome ............................................................................................................................ 25
Table 24. SOMA financial summary ....................................................................................... 26
Table 25. Loan programs financial summary .......................................................................... 27
Table 26. Consolidated Variable Interest Entities Financial Summary ....................................... 28
v

Overview
Recent Developments
The Overview section of this report highlights devel-
opments in the operations of the Federal Reserve’s
credit and liquidity programs and facilities since last
month’s report, and presents data describing changes
in the assets, liabilities, and total capital of the Fed-
eral Reserve System as of August 31, 2011.
FRBNY Announces Future Plans for Small-
Scale Reverse Repo Exercises
‰ On August 12, 2011, the Federal Reserve Bank of
New York (FRBNY) announced that it plans to
conduct a series of small-scale reverse repurchase
transactions (reverse repos) about every two
months, which will bring the frequency of these
operational exercises in line with that of similar
exercises of the Term Deposit Facility (TDF). As
with earlier operational readiness exercises, this
work is a matter of prudent advance planning by
the Federal Reserve. The operations have been
designed to have no material impact on the avail-
ability of reserves or on market rates, and do not
represent a change in the stance of monetary
policy.
Federal Reserve System Selected Assets,
Liabilities, and Total Capital
Table 1 reports selected assets and liabilities and total
capital of the Federal Reserve System and presents
the change in these components over the past month
and since this time last year.
Figure 1 displays the levels of selected Federal Reserve
assets and liabilities, securities holdings, and credit
extended through liquidity facilities since 2007.
1
Table 1. Assets, liabilities, and capital of the Federal Reserve System
Billions of dollars
ItemCurrent
August 31, 2011Change fromJuly 27, 2011
Change fromSeptember 1, 2010
Total assets 2,858 −10 +553
Selected assets
Securities held outright 2,647 −1 +601
U.S. Treasury securities1 1,652 +14 +866
Federal agency debt securities1 110 −2 −47
Mortgage-backed securities2 885 −12 −218
Memo: Overnight securities lending3 13 −7 +5
Memo: Net commitments to purchase mortgage-backed securities4 0 0 0
Lending to depository institutions5 * +* +*
Central bank liquidity swaps6 0 0 −*
Lending through the Term Asset-Backed Securities Loan Facility7 12 −* −22
Net portfolio holdings of TALF LLC8 1 +* +*
Support for specific institutions 50 −2 −18
Net portfolio holdings of Maiden Lane LLC9 18 −3 −11
Net portfolio holdings of Maiden Lane II LLC9 10 −* −6
Net portfolio holdings of Maiden Lane III LLC9 21 −* −2
Total liabilities 2,806 −10 +557
Selected liabilities
Federal Reserve notes in circulation 996 +7 +86
Term deposits held by depository institutions 0 0 −2
Other deposits held by depository institutions 1,592 −66 +579
U.S. Treasury, general account 42 −25 −4
U.S. Treasury, supplementary financing account 0 −5 −200
Other deposits 48 +37 +48
Total capital 52 +* −5
Note: Unaudited. Components may not sum to totals because of rounding.
* Less than $500 million.1 Face value.2 Guaranteed by Fannie Mae, Freddie Mac, and Ginnie Mae. Current face value, which is the remaining principal balance of the underlying mortgages. Does not includeunsettled transactions.
3 Securities loans under the overnight facility are off-balance-sheet transactions. These loans are shown here as a memo item to indicate the portion of securities held outrightthat have been lent through this program.
4 Current face value. Includes commitments associated with outright purchases, dollar rolls, and coupon swaps.5 Total of primary, secondary, and seasonal credit.6 Dollar value of the foreign currency held under these agreements valued at the exchange rate to be used when the foreign currency is returned to the foreign central bank.7 Book value.8 As of August 31, 2011, TALF LLC had purchased no assets from the FRBNY.9 Fair value, reflecting values as of June 30, 2011. Fair value reflects an estimate of the price that would be received upon selling an asset if the transaction were to beconducted in an orderly market on the measurement date. Fair values are updated quarterly.
2 Credit and Liquidity Programs and the Balance Sheet
Figure 1. Credit and liquidity programs and the Federal Reserve’s balance sheet
September 2011 3
System Open Market Account
Domestic SOMA Portfolio
Recent Developments
‰ Between July 27 and August 31, 2011, the SOMA’s
holdings of longer-term Treasury securities grew
and its holdings of agency debt and agency
mortgage-backed securities (MBS) declined, con-
sistent with the FOMC’s decision in June 2011 to
maintain the existing policy of reinvesting princi-
pal payments on all domestic securities in the
SOMA in Treasury securities. This policy main-
tains the total face value of domestic securities in
the SOMA at approximately $2.6 trillion.
‰ On August 12, 2011, the FRBNY announced that
it plans to conduct a series of small-scale reverse
repos about every two months, which will bring the
frequency of these operational exercises in line
with that of similar exercises of the TDF. As with
earlier operational readiness exercises, this work is
a matter of prudent advance planning by the Fed-
eral Reserve. The operations have been designed to
have no material impact on the availability of
reserves or on market rates, and do not represent a
change in the stance of monetary policy.
‰ Between August 15 and 17, 2011, the FRBNY
conducted a reverse repo operational readiness
exercise that was open to all eligible counterparties,
including the expanded counterparties announced
in July. The results of the reverse repo operations
are available at www.newyorkfed.org/markets/
omo/dmm/temp.cfm.
Background
Open market operations (OMOs)—the purchase and
sale of securities in the open market by a central
bank—are a key tool used by the Federal Reserve in
the implementation of monetary policy. Historically,
the Federal Reserve has used OMOs to adjust the
supply of reserve balances so as to keep the federal
funds rate around the target federal funds rate estab-
lished by the FOMC. OMOs are conducted by the
Trading Desk at the FRBNY, which acts as agent for
the FOMC. The range of securities that the Federal
Reserve is authorized to purchase and sell is relatively
limited. The authority to conduct OMOs is granted
under Section 14 of the Federal Reserve Act.
OMOs can be divided into two types: permanent and
temporary. Permanent OMOs are outright purchases
or sales of securities for the SOMA, the Federal
Reserve’s portfolio. Permanent OMOs traditionally
have been used to accommodate the longer-term fac-
tors driving the expansion of the Federal Reserve’s
balance sheet, principally the trend growth of cur-
rency in circulation. More recently, the expansion of
SOMA securities holdings has been driven by large-
scale asset purchase programs (LSAPs). Temporary
OMOs typically are used to address reserve needs
that are deemed to be transitory in nature. These
operations are either repurchase agreements (repos)
or reverse repurchase agreements (reverse repos).
Under a repo, the Trading Desk buys a security
under an agreement to resell that security in the
future; under a reverse repo, the Trading Desk sells a
security under an agreement to repurchase that secu-
rity in the future. A repo is the economic equivalent
of a collateralized loan; conversely, a reverse repo is
the economic equivalent of collateralized borrowing.
In both types of transactions, the difference between
the purchase and sale prices reflects the interest on
the loan or borrowing. The composition of the
SOMA is presented in table 2.
Each OMO affects the Federal Reserve’s balance
sheet; the size and nature of the effect depend on the
specifics of the operation. The Federal Reserve pub-
lishes its balance sheet each week in the H.4.1 statisti-
cal release, “Factors Affecting Reserve Balances of
Depository Institutions and Consolidated Statement
of Condition of Reserve Banks,” available at
www.federalreserve.gov/releases/h41/. The release
separately reports securities held outright, repos, and
reverse repos.
In addition, the Federal Reserve has long operated an
overnight securities lending facility as a vehicle to
4
address market pressures for specific Treasury securi-
ties. Since July 9, 2009, this facility has also lent
housing-related government-sponsored enterprise
(GSE) debt securities that are particularly sought
after. Amounts outstanding under this facility are
reported weekly in table 1A of the H.4.1 statistical
release.
The FRBNY’s traditional counterparties for OMOs
are the primary dealers with which the FRBNY
trades U.S. government and select other securities.1
In early 2010, the FRBNY revised its policy regard-
ing the administration of its relationships with pri-
mary dealers in order to provide greater transparency
about the significant business standards expected of
primary dealers and to offer clearer guidance on the
process to become a primary dealer. The revised
policy offers a more structured presentation of the
business standards expected of a primary dealer; a
more formal application process for prospective pri-
mary dealers; an increase in the minimum net capital
requirement, from $50 million to $150 million; a sea-
soning requirement of one year of relevant opera-
tions before a prospective dealer may submit an
application; and a clear notice of actions the
FRBNY may take against a noncompliant primary
dealer. Since late 2009, the FRBNY has taken steps
to expand the types of counterparties for some
OMOs to include entities other than primary dealers.
Details on the counterparty expansion effort are pre-
sented below.
Large-Scale Asset Purchase Programs
In November 2008, the Federal Reserve announced
that it would buy direct obligations of the Federal
National Mortgage Association (Fannie Mae), the
Federal Home Loan Mortgage Corporation (Freddie
Mac), and the Federal Home Loan Banks, and MBS
guaranteed by Fannie Mae, Freddie Mac, and the
Government National Mortgage Association (Ginnie
Mae). The goal of these debt purchases was to reduce
the cost and increase the availability of credit for the
purchase of houses. In March 2009, the FOMC
authorized purchases of up to $1.25 trillion of
agency MBS and up to $200 billion of agency direct
obligations. Subsequently, in November 2009, the
FOMC announced that agency debt purchases would
be about $175 billion. This amount, while somewhat
less than the previously announced maximum of
$200 billion, was consistent with the path of pur-
chases and reflected the limited availability of agency
debt.
The Federal Reserve also determined that supporting
the MBS “dollar roll” market promoted the goals of
the MBS purchase program. Dollar roll transactions
consist of a purchase or sale of “to be announced”
(TBA) MBS combined with an agreement to sell or
purchase TBAMBS on a specified future date.
Because of principal and interest payments and, dur-
ing the time in which transactions were being con-
ducted, occasional delays in the settlement of trans-
actions, the Federal Reserve also holds some cash
and short-term investments associated with the MBS
purchase program. On June 28, 2010, the Federal
Reserve began entering into coupon swaps, which are
trades with a single counterparty in which the Fed-
eral Reserve agrees to simultaneously sell TBAMBS
in one coupon and to buy an equal face value of
TBAMBS in a different coupon. MBS dollar roll
transactions and coupon swaps are recorded on
settlement date and may generate realized gains and
losses.
In March 2009, the FOMC announced that it would
also purchase up to $300 billion of longer-term
Treasury securities to help improve conditions in pri-
vate credit markets. The Federal Reserve purchased a
range of securities across the maturity spectrum,
including Treasury Inflation-Protected Securities
(TIPS). The bulk of purchases were in intermediate
maturities. In August 2009, the FOMC announced
that it would gradually slow the pace of these trans-
actions in order to promote a smooth transition in
markets as purchases of these Treasury securities
1 A current list of primary dealers is available on the FRBNY’swebsite at www.newyorkfed.org/markets/pridealers_current.html.
Table 2. Domestic SOMA securities holdings
Billions of dollars, as of August 31, 2011
Security type Total par value
U.S. Treasury bills 18
U.S. Treasury notes and bonds, nominal 1,557
U.S. Treasury notes and bonds, inflation-indexed1 76
Federal agency debt securities2 110
MBS3 885
Total SOMA securities holdings 2,647
Note: Unaudited. Components may not sum to total because of rounding. Does notinclude investments denominated in foreign currencies or unsettled transactions.1 Includes inflation compensation.2 Direct obligations of Fannie Mae, Freddie Mac, and the Federal Home LoanBanks.
3 Guaranteed by Fannie Mae, Freddie Mac, and Ginnie Mae. Current face value ofthe securities, which is the remaining principal balance of the underlyingmortgages.
September 2011 5
were completed. As anticipated, the purchases were
completed by the end of October 2009.
The FRBNY announced in August 2009 that it
would streamline the set of external investment man-
agers for the agency-guaranteed MBS purchase pro-
gram, reducing the number of investment managers
from four to two. As of March 2, 2010, the FRBNY
began to use its own staff on select days to transact
directly in the secondary market for agency MBS as
part of the FOMC’s large-scale asset purchase pro-
grams (LSAPs), consistent with the announcement of
November 2009. These changes were not
performance-related: the FRBNY had anticipated
that it would adjust its use of external investment
managers as it gained more experience with the pro-
gram.
In September 2009, the Federal Reserve began to
purchase on-the-run agency debt securities—the
most recently issued securities—in order to mitigate
market dislocations and promote overall market
functioning. Prior to this change, purchases were
focused on off-the-run agency debt securities.
On September 23, 2009, the FOMC announced its
intention to gradually slow the pace of its purchases
of agency-guaranteed MBS and agency debt. In
implementing this directive, the Trading Desk of the
FRBNY announced that it would scale back the
average weekly purchase amounts of agency MBS
and reduce the size and frequency of agency debt
purchases. As anticipated by the FOMC, these trans-
actions were completed by the end of the first quar-
ter of 2010. As of August 19, 2010, the settlement of
all remaining outstanding MBS from these purchases
was complete. In January 2011, the FRBNY began a
process to streamline the administration of agency
MBS held in the SOMA portfolio by consolidating
these securities through a service offered by Fannie
Mae and Freddie Mac called CUSIP aggregation.
The Federal Reserve’s outright holdings of MBS are
reported weekly in tables 1, 3, 8, and 9 of the H.4.1
statistical release. In addition, detailed data on all
settled agency MBS holdings, including those that
have been aggregated, are published weekly on the
FRBNY website at www.newyorkfed.org/markets/
soma/sysopen_accholdings.html.
On August 10, 2010, the FOMC announced that the
Federal Reserve would maintain the level of domestic
securities holdings in the SOMA portfolio by rein-
vesting principal payments from agency debt and
agency MBS in longer-term Treasury securities. As of
August 4, 2010, outright holdings of securities in the
SOMA portfolio totaled roughly $2 trillion.
On November 3, 2010, the FOMC decided to expand
its holdings of securities and announced that, in
addition to maintaining the existing reinvestment
policy, it intended to purchase a further $600 billion
of longer-term Treasury securities by the end of the
second quarter of 2011. The last purchase under this
program occurred on June 30, 2011.
The FRBNY executed the purchase of additional
Treasury securities and the reinvestment plan, as
directed by the FOMC in November 2010. In doing
so, the FRBNY announced the distribution of
maturities of securities it planned to purchase. In
addition, in order to promote transparency in the
market, the FRBNY began publishing the prices at
which the securities were purchased at the end of
each scheduled monthly purchase period. Finally, to
provide operational flexibility and to ensure that it
was able to purchase the most attractive securities on
a relative-value basis, the FRBNY temporarily
relaxed the 35 percent per-issue limit on SOMA hold-
ings under which it had been operating.
As the asset-purchase program neared completion,
on June 22, 2011, the FOMC announced that it
would maintain its existing policy of reinvesting prin-
cipal payments on all domestic securities in the
SOMA in Treasury securities. This policy maintains
the total face value of domestic securities in the
SOMA at approximately $2.6 trillion. These pur-
chases will be allocated across maturities according
to a distribution outlined at www.newyorkfed.org/
markets/opolicy/operating_policy_110622.html.
As part of the reinvestment policy, the FRBNY pub-
lishes a tentative monthly schedule for Treasury secu-
rity purchases at www.newyorkfed.org/markets/
tot_operation_schedule.html. The FRBNY continues
to disclose securities purchase prices for each
monthly purchase period at www.newyorkfed.org/
markets/pomo/display/index.cfm. Additional infor-
mation is available at www.newyorkfed.org/markets/
lttreas_faq.html.
Reverse Repos
Reverse repos are a tool that could be used to sup-
port a reduction in monetary accommodation at the
appropriate time. Under a reverse repo, the FRBNY
Trading Desk sells a security under an agreement to
repurchase that security in the future. A reverse repo
is the economic equivalent of collateralized borrow-
6 Credit and Liquidity Programs and the Balance Sheet
ing. The FRBNY periodically conducts these trans-
actions to ensure operational readiness at the Federal
Reserve, the major clearing banks, the primary deal-
ers, and other counterparties; the transactions have
no material impact on the availability of reserves or
on market rates.
These activities with respect to reverse repos are a
matter of prudent advance planning by the Federal
Reserve. They do not represent any change in the
stance of monetary policy, and no inference should
be drawn about the timing of any change in the
stance of monetary policy in the future.
Expanded Counterparties
Since late 2009, the FRBNY has taken steps to
expand the types of counterparties for reverse repos
to include entities other than primary dealers. This
initiative is intended to enhance the Federal Reserve’s
capacity to conduct large-scale reverse repo opera-
tions to drain reserves beyond what could likely be
conducted through primary dealers. The additional
counterparties are not eligible to participate in trans-
actions conducted by the FRBNY other than reverse
repos.
To date, the FRBNY has initiated three waves of
counterparty expansions aimed at domestic money
market funds. With each wave, the set of eligibility
criteria was broadened to allow more and smaller
money market funds to participate as counterparties.
With each expansion, the FRBNY published
updated eligibility criteria and the Reverse Repur-
chase Program FormMaster Repurchase Agreement
for Money Funds, which set out the legal terms and
conditions under which the FRBNY and its money
market mutual fund counterparties may undertake
reverse repos.
In addition, on July 27, 2011, the FRBNY announced
that it had accepted two GSEs—Freddie Mac and
Fannie Mae—as reverse repo counterparties. On July
28, the FRBNY announced the criteria for accep-
tance of banks and savings associations as counter-
parties eligible to participate in reverse repos. Further
information on reverse repo counterparties is avail-
able online at www.newyorkfed.org/markets/
rrp_announcements.html.
Each institution accepted as a reverse repo counter-
party submitted an application and meets the criteria
published by the FRBNY pursuant to the relevant
counterparty expansion wave. Acceptance as a coun-
terparty does not constitute a public endorsement by
the FRBNY of any listed counterparty and should
not substitute for prudent counterparty risk manage-
ment and due diligence. The expanded counterparty
list and updated criteria and master agreement are
available on the FRBNY’s website at
www.newyorkfed.org/markets/rrp_counterparties.html.
Transactions
In December 2009, the FRBNY conducted its first
set of small-scale, real-value, triparty reverse repos
with primary dealers. Five additional series of reverse
repos have been conducted in 2010 and 2011, some of
which were open to the sets of expanded counterpar-
ties (money market mutual funds and GSEs)
announced through July 2011.
Additional details and the results of these operations
are available on the FRBNY website at
www.newyorkfed.org/markets/omo/dmm/temp.cfm.
The outstanding amounts of reverse repos are
reported weekly in tables 1, 2, 8, and 9 of the H.4.1
statistical release.
Liquidity Arrangements with ForeignCentral Banks
Recent Developments
‰ During August 2011, the Swiss National Bank and
the European Central Bank each drew on its U.S.
dollar liquidity swap arrangements for 7-day terms
in the amounts of $200 million and $500 million,
respectively. As of August 31, 2011, both of these
draws had matured, and there were no amounts
outstanding under the dollar liquidity swap
arrangements.
‰ On September 14, 2011, the European Central
Bank drew on its U.S. dollar liquidity swap
arrangement in the amount of $575 million.
Background
Because of the global character of bank funding
markets, the Federal Reserve has at times coordi-
nated with other central banks to provide liquidity.
During the financial crisis, the Federal Reserve
entered into agreements to establish temporary recip-
rocal currency arrangements (central bank liquidity
swap lines) with a number of foreign central banks
(FCBs). Two types of temporary swap lines were
established: U.S. dollar liquidity lines and foreign
currency liquidity lines. These temporary arrange-
ments expired on February 1, 2010. However, in May
2010, temporary U.S. dollar liquidity swap lines were
September 2011 7
re-established with certain FCBs in order to address
the re-emergence of strains in global U.S. dollar
short-term funding markets. In December 2010, the
FOMC authorized an extension of the arrangements
through August 1, 2011. In June 2011, the FOMC
authorized another extension of the arrangements
through August 1, 2012.
The FRBNY operates the swap lines under the
authority granted under Section 14 of the Federal
Reserve Act and in compliance with authorizations,
policies, and procedures established by the FOMC.
Dollar Liquidity Swaps
On December 12, 2007, the FOMC announced that
it had authorized dollar liquidity swap lines with the
European Central Bank and the Swiss National Bank
to provide liquidity in U.S. dollars to overseas mar-
kets. Subsequently, the FOMC authorized dollar
liquidity swap lines between the Federal Reserve and
each of the following FCBs: the Reserve Bank of
Australia, the Banco Central do Brasil, the Bank of
Canada, the Bank of Japan, Danmarks National-
bank, the Bank of England, the European Central
Bank, the Bank of Korea, the Banco de Mexico, the
Reserve Bank of New Zealand, Norges Bank, the
Monetary Authority of Singapore, Sveriges Riks-
bank, and the Swiss National Bank. These temporary
dollar liquidity swap arrangements expired on Febru-
ary 1, 2010. In May 2010, the FOMC re-authorized
dollar liquidity swap lines with the Bank of Canada,
the Bank of England, the European Central Bank,
the Bank of Japan, and the Swiss National Bank
through January 2011. Subsequently, these arrange-
ments were first extended through August 1, 2011,
and then through August 1, 2012.
Swaps under these lines consist of two transactions.
When an FCB draws on its swap line with the
FRBNY, the FCB sells a specified amount of its cur-
rency to the FRBNY in exchange for dollars at the
prevailing market exchange rate. The FRBNY holds
the foreign currency in an account at the FCB. The
dollars that the FRBNY provides are then deposited
in an account that the FCB maintains at the
FRBNY. At the same time, the FRBNY and the
FCB enter into a binding agreement for a second
transaction that obligates the FCB to buy back its
currency on a specified future date at the same
exchange rate. The second transaction unwinds the
first at the same exchange rate used in the initial
transaction; as a result, the recorded value of the for-
eign currency amounts is not affected by changes in
the market exchange rate. At the conclusion of the
second transaction, the FCB compensates the
FRBNY at a market-based interest rate.
When the FCB lends the dollars it obtained by draw-
ing on its swap line to institutions in its jurisdiction,
the dollars are transferred from the FCB account at
the FRBNY to the account of the bank that the bor-
rowing institution uses to clear its dollar transactions.
The FCB is obligated to return the dollars to the
FRBNY under the terms of the agreement, and the
FRBNY is not a counterparty to the loan extended
by the FCB. The FCB bears the credit risk associated
with the loans it makes to institutions in its jurisdic-
tion.
The foreign currency that the Federal Reserve
acquires in these transactions is recorded as an asset
on the Federal Reserve’s balance sheet. In tables 1, 8,
and 9 of the weekly H.4.1 statistical release, the dol-
lar value of amounts that the FCBs have drawn but
not yet repaid is reported in the line entitled “Central
bank liquidity swaps.” Dollar liquidity swaps have
maturities ranging from overnight to three months.
Table 2 of the H.4.1 statistical release reports the
maturity distribution of the outstanding dollar
liquidity swaps. Detailed information about drawings
on the swap lines by the participating FCBs is pre-
sented on the FRBNY’s website at
www.newyorkfed.org/markets/fxswap.
Foreign-Currency Liquidity Swap Lines
On April 6, 2009, the FOMC announced foreign-
currency liquidity swap lines with the Bank of Eng-
land, the European Central Bank, the Bank of Japan,
and the Swiss National Bank. These lines were
designed to provide the Federal Reserve with the
capacity to offer liquidity to U.S. institutions in for-
eign currency should a need arise. These lines mir-
rored the existing dollar liquidity swap lines, which
Table 3. Amounts outstanding under dollar liquidity swaps
As of August 31, 2011
Central bankAmount($ billions)
Settlementdate
TermInterestrate
Bank of Canada — — — —
Bank of England — — — —
Bank of Japan — — — —
European Central Bank — — — —
Swiss National Bank — — — —
Total — — — —
Note: Unaudited.
8 Credit and Liquidity Programs and the Balance Sheet

provided FCBs with the capacity to offer U.S. dollar
liquidity to financial institutions in their jurisdictions.
Foreign-currency swap lines provided the Federal
Reserve with the ability to address financial strains
by providing foreign currency-denominated liquidity
to U.S. institutions in amounts of up to £30 billion
(sterling), €80 billion (euro), ¥10 trillion (yen), and
CHF 40 billion (Swiss francs). The Federal Reserve
did not draw on these swap lines, and they expired on
February 1, 2010.
September 2011 9
Lending Facilities to Support Overall MarketLiquidity
Lending to Depository Institutions
Recent Developments
‰ Credit provided to depository institutions through
the discount window remains generally around the
levels seen prior to 2007. As presented in table 6,
the lendable value of collateral pledged by deposi-
tory institutions with discount window loans out-
standing on August 31, 2011, was less than $500
million; discount window credit outstanding on
that date amounted to $111 million.
Background
The discount window helps to relieve liquidity strains
for individual depository institutions and for the
banking system as a whole by providing a source of
funding in times of need. Much of the statutory
framework that governs lending to depository institu-
tions is contained in Section 10B of the Federal
Reserve Act, as amended. The general policies that
govern discount window lending are set forth in the
Federal Reserve Board’s Regulation A.
Depository institutions have, since 2003, had access
to three types of discount window credit: primary
credit, secondary credit, and seasonal credit. Primary
credit is available to depository institutions in gener-
ally sound financial condition with few administra-
tive requirements. Secondary credit may be provided
to depository institutions that do not qualify for pri-
mary credit, subject to review by the lending Reserve
Bank. Seasonal credit provides short-term funds to
smaller depository institutions that experience regu-
lar seasonal swings in loans and deposits.
On August 17, 2007, in order to promote orderly
market functioning, the Federal Reserve narrowed
the spread between the primary credit rate (generally
referred to as the discount rate) and the FOMC’s
target federal funds rate to 50 basis points and began
to allow the provision of primary credit for terms as
long as 30 days. On March 16, 2008, the Federal
Reserve further narrowed the spread between the
primary credit rate and the target federal funds rate
to 25 basis points, and increased the maximum matu-
rity of primary credit loans to 90 days.
On November 17, 2009, in response to improved
financial conditions, the Federal Reserve announced
that the maximum maturity on primary credit loans
would be reduced to 28 days effective January 14,
2010. On February 18, 2010, the Federal Reserve
increased the spread between the primary credit rate
and the top of the target range for the federal funds
rate to 50 basis points, effective February 19, 2010.
The Federal Reserve also announced that, effective
March 18, 2010, the typical maximum maturity of
primary credit loans would be shortened to over-
night. These changes represented further normaliza-
tion of the Federal Reserve’s lending facilities and
did not signal any change in the outlook for the
economy or for monetary policy.
On August 6, 2010, the Federal Reserve announced
changes to its practices for disclosure of discount
Table 4. Discount window credit outstanding to depositoryinstitutions
Daily average borrowing for each class of borrower over five weeks endingAugust 31, 2011
Type and size of borrowerAveragenumber ofborrowers1
Averageborrowing($ billions)2
Commercial banks3
Assets: more than $50 billion * **
Assets: $5 billion to $50 billion * **
Assets: $250 million to $5 billion 3 **
Assets: less than $250 million 28 **
Thrift institutions and credit unions 3 **
Total 33 **
Note: Unaudited. Includes primary, secondary, and seasonal credit. Size categoriesbased on total domestic assets from Call Report data as of June 30, 2011.Components may not sum to totals because of rounding.
* Fewer than one borrower.
** Less than $500 million.1 Average daily number of depository institutions with credit outstanding. Overthis period, a total of 161 institutions borrowed.
2 Average daily borrowing by all depositories in each category.3 Includes branches and agencies of foreign banks.
10
window lending information in accordance with the
provisions of the Dodd-Frank Act. For discount
window loans extended to depository institutions on
or after July 21, 2010, the Federal Reserve will pub-
licly disclose certain information about the transac-
tion approximately two years after the loan is
extended. The disclosure will include the name and
identifying details of the depository institution, the
amount borrowed, the interest rate paid, and infor-
mation identifying the types and amount of collateral
pledged. More detail on these changes is reported on
the Federal Reserve’s Discount Window website at
www.frbdiscountwindow.org.
In extending credit to depository institutions, the
Federal Reserve closely monitors the financial condi-
tion of borrowers. Monitoring the financial condi-
tion of depository institutions is a four-step process
designed to minimize the risk of loss to the Federal
Reserve posed by weak or failing depository institu-
tions. The first step is monitoring, on an ongoing
basis, the safety and soundness of all depository
institutions that access or may access the discount
window and the payment services provided by the
Federal Reserve. The second step is identifying insti-
tutions whose condition, characteristics, or affiliation
would present higher-than-acceptable risk to the Fed-
eral Reserve in the absence of controls on their access
to Federal Reserve lending facilities and other Fed-
eral Reserve services. The third step is
communicating—to staff within the Federal Reserve
System and to other supervisory agencies, if and
when necessary—relevant information about those
institutions identified as posing higher risk. The
fourth step is implementing appropriate measures to
mitigate the risks posed by such entities.
At the heart of the condition-monitoring process is
an internal rating system that provides a framework
for identifying institutions that may pose undue risks
to the Federal Reserve. The rating system relies
mostly on information from each institution’s pri-
mary supervisor, including CAMELS ratings, to
identify potentially problematic institutions and clas-
sify them according to the severity of the risk they
pose to the Federal Reserve.2 Having identified insti-
tutions that pose a higher risk, the Federal Reserve
then puts in place a standard set of risk controls that
become increasingly stringent as the risk posed by an
institution grows; individual Reserve Banks may
implement additional risk controls to further mitigate
risk if they deem it necessary.
Collateral
All extensions of discount window credit by the Fed-
eral Reserve must be secured to the satisfaction of the
lending Reserve Bank by “acceptable collateral.”
Assets accepted as collateral are assigned a lendable
value deemed appropriate by the Reserve Bank; lend-
able value is determined as the market price of the
asset, less a haircut. When a market price is not avail-
able, a haircut may be applied to the outstanding bal-
ance or a valuation based on an asset’s cash flow.
Haircuts reflect credit risk and, for traded assets, the
historical volatility of the asset’s price and the liquid-
ity of the market in which the asset is traded; the
Federal Reserve’s haircuts are generally in line with
typical market practice. The Federal Reserve applies
larger haircuts, and thus assigns lower lendable val-
ues, to assets for which no market price is available
relative to comparable assets for which a market price
is available. A borrower may be required to pledge
additional collateral if its financial condition weak-
ens. Collateral is pledged by depository institutions
under the terms and conditions specified in the Fed-
eral Reserve Banks’ standard lending agreement,
Operating Circular No. 10, available at
www.frbservices.org/files/regulations/pdf/
operating_circular_10.pdf.
Discount window loans are generally made with
recourse to the borrower beyond the pledged collat-
eral. Nonetheless, collateral plays an important role
in mitigating the credit risk associated with these
extensions of credit. The Federal Reserve generally
accepts as collateral for discount window loans any
assets that meet regulatory standards for sound asset
2 CAMELS (Capital, Assets, Management, Earnings, Liquidity,and Sensitivity) is a rating system employed by banking regula-tors to assess the soundness of commercial banks and thrifts.Similar rating systems are used for other types of depositoryinstitutions.
Table 5. Concentration of discount window creditoutstanding to depository institutions
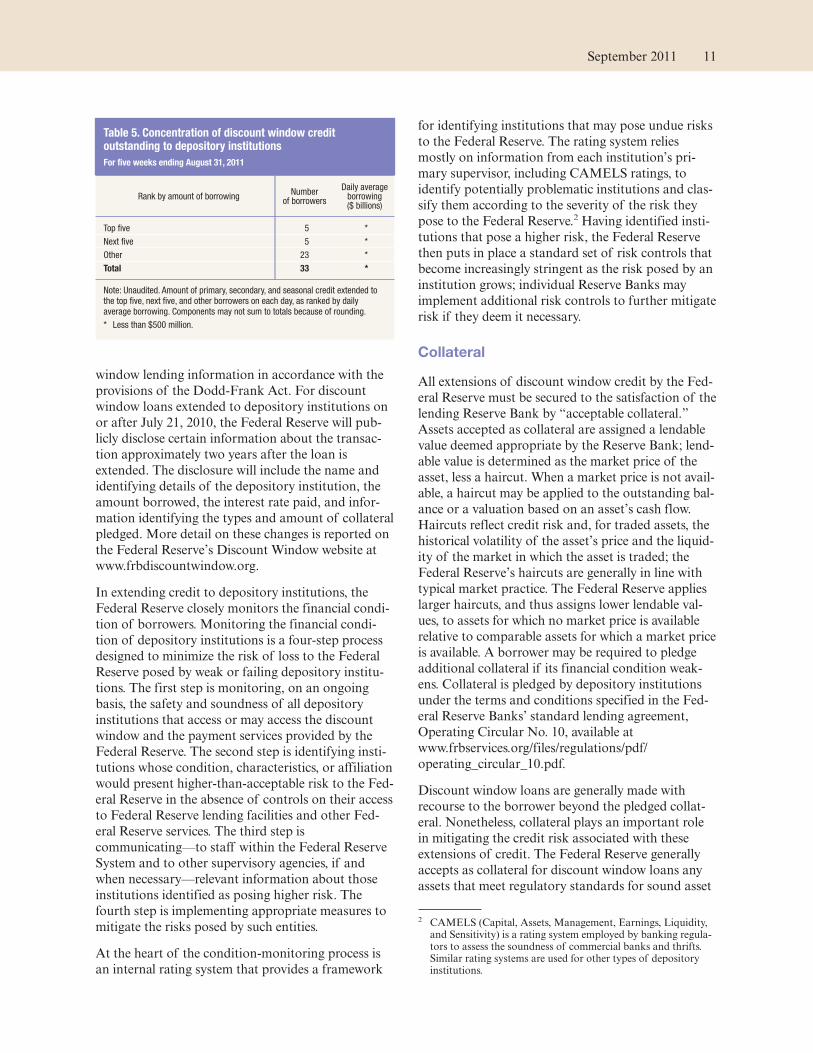
For five weeks ending August 31, 2011
Rank by amount of borrowingNumber
of borrowers
Daily averageborrowing($ billions)
Top five 5 *
Next five 5 *
Other 23 *
Total 33 *
Note: Unaudited. Amount of primary, secondary, and seasonal credit extended tothe top five, next five, and other borrowers on each day, as ranked by dailyaverage borrowing. Components may not sum to totals because of rounding.
* Less than $500 million.
September 2011 11
quality. This category of assets includes most per-
forming loans and most investment-grade securities,
although for some types of securities (including com-
mercial mortgage-backed securities, collateralized
debt obligations, collateralized loan obligations, and
certain non-dollar-denominated foreign securities)
only AAA-rated securities are accepted. An institu-
tion may not pledge as collateral any instruments
that the institution or its affiliates have issued. To
ensure that they can borrow from the Federal
Reserve should the need arise, many depository insti-
tutions that do not have an outstanding discount
window loan nevertheless routinely pledge collateral.
The Federal Reserve periodically reviews its collateral
valuation practices. The most recent changes to the
lending margins on discount window collateral took
effect on October 19, 2009, and reflected the results
of a broad-based review, which began before the
financial crisis, of methodology and data sources.
For more information on collateral margins, refer to
the Discount Window and Payments System Risk
public website, www.frbdiscountwindow.org.
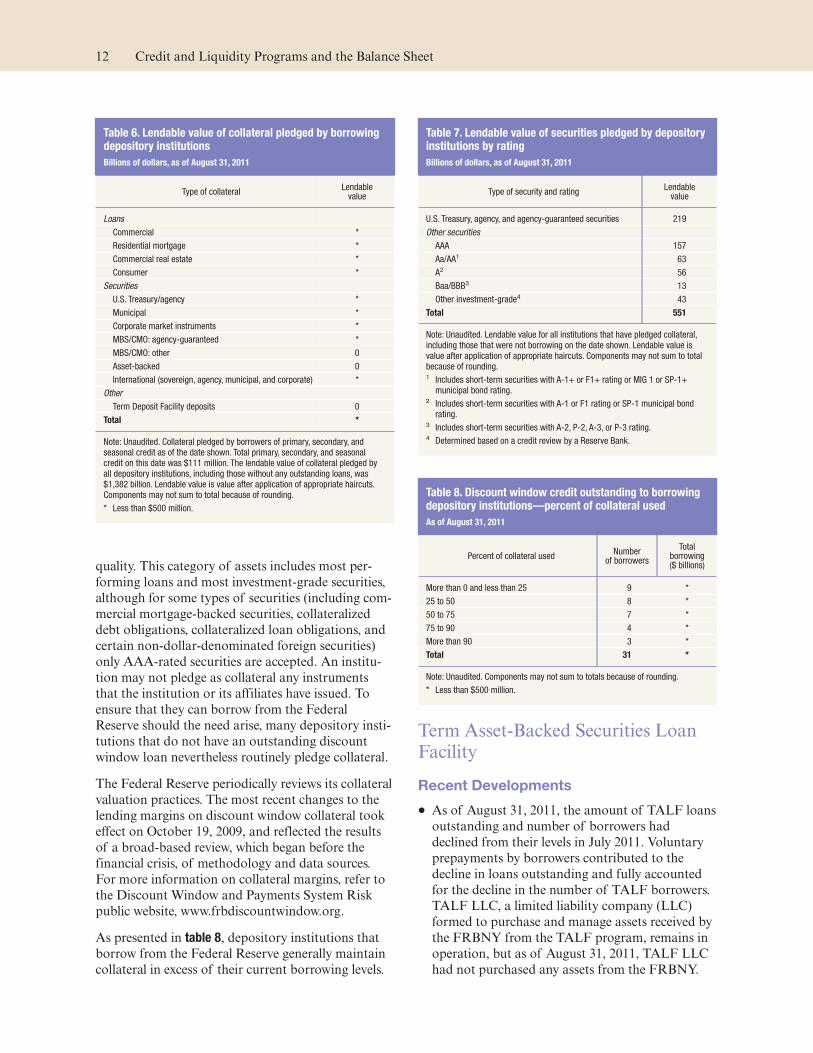
As presented in table 8, depository institutions that
borrow from the Federal Reserve generally maintain
collateral in excess of their current borrowing levels.
Term Asset-Backed Securities LoanFacility
Recent Developments
‰ As of August 31, 2011, the amount of TALF loans
outstanding and number of borrowers had
declined from their levels in July 2011. Voluntary
prepayments by borrowers contributed to the
decline in loans outstanding and fully accounted
for the decline in the number of TALF borrowers.
TALF LLC, a limited liability company (LLC)
formed to purchase and manage assets received by
the FRBNY from the TALF program, remains in
operation, but as of August 31, 2011, TALF LLC
had not purchased any assets from the FRBNY.
Table 6. Lendable value of collateral pledged by borrowingdepository institutions
Billions of dollars, as of August 31, 2011
Type of collateralLendablevalue
Loans
Commercial *
Residential mortgage *
Commercial real estate *
Consumer *
Securities
U.S. Treasury/agency *
Municipal *
Corporate market instruments *
MBS/CMO: agency-guaranteed *
MBS/CMO: other 0
Asset-backed 0
International (sovereign, agency, municipal, and corporate) *
Other
Term Deposit Facility deposits 0
Total *
Note: Unaudited. Collateral pledged by borrowers of primary, secondary, andseasonal credit as of the date shown. Total primary, secondary, and seasonalcredit on this date was $111 million. The lendable value of collateral pledged byall depository institutions, including those without any outstanding loans, was$1,382 billion. Lendable value is value after application of appropriate haircuts.Components may not sum to total because of rounding.
* Less than $500 million.
Table 7. Lendable value of securities pledged by depositoryinstitutions by rating
Billions of dollars, as of August 31, 2011
Type of security and ratingLendablevalue
U.S. Treasury, agency, and agency-guaranteed securities 219
Other securities
AAA 157
Aa/AA1 63
A2 56
Baa/BBB3 13
Other investment-grade4 43
Total 551
Note: Unaudited. Lendable value for all institutions that have pledged collateral,including those that were not borrowing on the date shown. Lendable value isvalue after application of appropriate haircuts. Components may not sum to totalbecause of rounding.1 Includes short-term securities with A-1+ or F1+ rating or MIG 1 or SP-1+municipal bond rating.
2 Includes short-term securities with A-1 or F1 rating or SP-1 municipal bondrating.
3 Includes short-term securities with A-2, P-2, A-3, or P-3 rating.4 Determined based on a credit review by a Reserve Bank.
Table 8. Discount window credit outstanding to borrowingdepository institutions—percent of collateral used
As of August 31, 2011
Percent of collateral usedNumber
of borrowers
Totalborrowing($ billions)
More than 0 and less than 25 9 *
25 to 50 8 *
50 to 75 7 *
75 to 90 4 *
More than 90 3 *
Total 31 *
Note: Unaudited. Components may not sum to totals because of rounding.
* Less than $500 million.
12 Credit and Liquidity Programs and the Balance Sheet
Background
On November 25, 2008, the Federal Reserve
announced the creation of the TALF under the
authority of Section 13(3) of the Federal Reserve
Act. The TALF is a funding facility under which the
FRBNY was authorized to extend up to $200 billion
of credit to holders of eligible asset-backed securities
(ABS).3 The TALF was intended to assist financial
markets in accommodating the credit needs of con-
sumers and businesses of all sizes by facilitating the
issuance of ABS collateralized by a variety of con-
sumer and business loans; it was also intended to
improve market conditions for ABS more generally.
TALF loans backed by commercial mortgage-backed
securities (CMBS) or by ABS backed by government
guaranteed loans have maturities of up to five years;
all other TALF loans have three-year maturities.
Using funds authorized under the Troubled Asset
Relief Program (TARP) of the Emergency Economic
Stabilization Act of 2008, the Treasury committed to
provide $20 billion in credit protection to the
FRBNY in connection with the TALF to support the
$200 billion of authorized lending value under the
program. This commitment was reduced to $4.3 bil-
lion in July 2010 to reflect the fact that only $43 bil-
lion of TALF loans were outstanding when the pro-
gram was closed to new lending.
Eligible collateral for TALF loans included U.S.
dollar-denominated ABS backed by student loans,
auto loans, credit card loans, equipment loans, floor-
plan loans, insurance premium finance loans, loans
guaranteed by the Small Business Administration
(SBA), residential mortgage servicing advances, or
commercial mortgages. At the time a TALF loan was
extended, all eligible collateral was required to have a
credit rating in the highest investment-grade rating
category from two or more eligible nationally recog-
nized statistical rating organizations (NRSROs) and
could not have a credit rating below the highest
investment-grade rating category from an eligible
NRSRO. Certain collateral also had to pass an inter-
nal risk assessment by the FRBNY.
Additionally, all or substantially all of the credit
exposures underlying eligible ABS were required to
be exposures to U.S.-domiciled obligors or with
respect to real property located in the United States
or its territories. Except for ABS for which the under-
lying credit exposures are SBA-guaranteed loans,
eligible newly issued ABS must have been issued on
or after January 1, 2009. Eligible legacy CMBS must
have been issued before January 1, 2009, must be
senior in payment priority to all other interests in the
underlying pool of commercial mortgages, and must
meet certain other criteria designed to protect the
Federal Reserve and the Treasury from credit risk.
Collateral would not be accepted from a particular
borrower if the collateral was backed by loans origi-
nated or securitized by that borrower or its affiliate
except in very limited circumstances.
The loans provided through the TALF were designed
to be limited in recourse to the collateral, generally
allowing borrowers the option of surrendering the
collateral to the FRBNY in full satisfaction of the
TALF loan. The FRBNY’s loan is secured by the
ABS collateral, with the FRBNY lending an amount
equal to the market value of the ABS, less a haircut.
The haircut is a buffer which protects the FRBNY
against a decline in the collateral’s value. The Federal
Reserve set initial haircuts for each type of eligible
collateral to reflect an assessment of the riskiness and
maturity of the various types of eligible ABS. Break-
downs of TALF collateral by underlying loan type
and credit rating are presented in tables 10 and 11,
respectively.
Consistent with previous announcements, the Federal
Reserve closed the TALF for new loan extensions
against newly issued CMBS on June 30, 2010, and for
new loans against all other types of collateral on
March 31, 2010. All TALF loans were extended by
the FRBNY and will mature over the next several
years, with all loans maturing no later than March
30, 2015.
TALF LLC
TALF LLC was formed to purchase and manage any
ABS that might be surrendered by a TALF borrower
or otherwise claimed by the FRBNY in connection
3 For additional information on the TALF, refer towww.federalreserve.gov/monetarypolicy/bst_lendingother.htm.
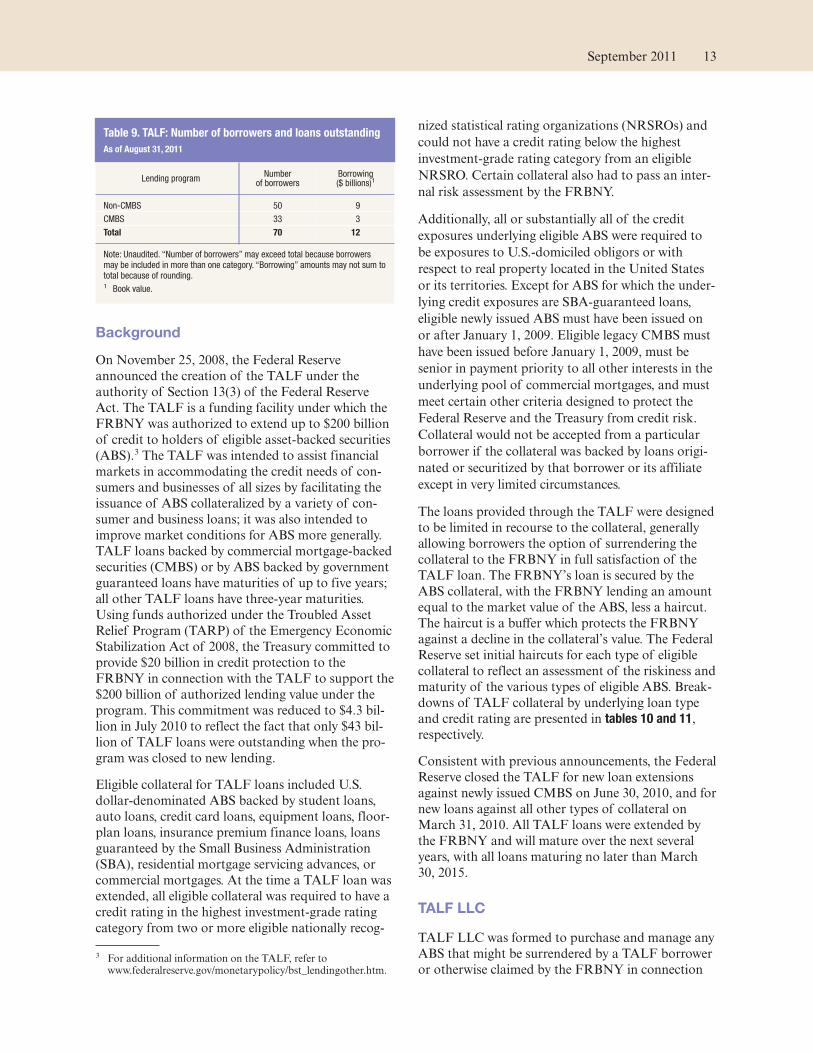
Table 9. TALF: Number of borrowers and loans outstanding
As of August 31, 2011
Lending programNumber
of borrowersBorrowing($ billions)1
Non-CMBS 50 9
CMBS 33 3
Total 70 12
Note: Unaudited. “Number of borrowers” may exceed total because borrowersmay be included in more than one category. “Borrowing” amounts may not sum tototal because of rounding.1 Book value.
September 2011 13
with its enforcement rights to the TALF collateral. In
certain limited circumstances, TALF LLC may also
purchase TALF program loans from the FRBNY.
TALF LLC has committed to purchase, for a fee, all
such assets at a price equal to the TALF loan, plus
accrued but unpaid interest.
Purchases of these securities are funded first through
the fees received by TALF LLC and any interest
TALF LLC has earned on its investments. In the
event that such funding proves insufficient, the
TARP will provide additional subordinated debt
funding to TALF LLC to finance up to $4.3 billion
of asset purchases. Subsequently, the FRBNY will
finance any additional purchases of securities by pro-
viding senior debt funding to TALF LLC. Thus, the
TARP funds provide credit protection to the
FRBNY. Financial information on TALF LLC is
reported weekly in tables 1, 2, 7, 8, and 9 of the H.4.1
statistical release. As of August 31, 2011, TALF LLC
had purchased no assets from the FRBNY.
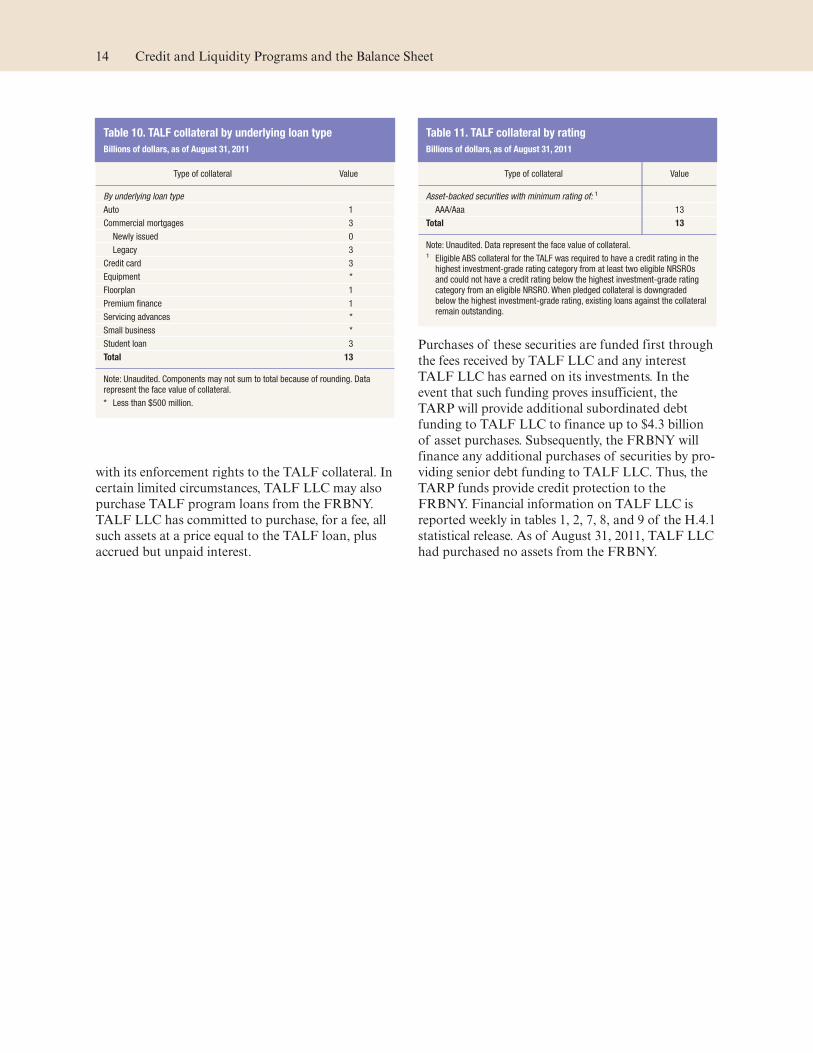
Table 10. TALF collateral by underlying loan type
Billions of dollars, as of August 31, 2011
Type of collateral Value
By underlying loan type
Auto 1
Commercial mortgages 3
Newly issued 0
Legacy 3
Credit card 3
Equipment *
Floorplan 1
Premium finance 1
Servicing advances *
Small business *
Student loan 3
Total 13
Note: Unaudited. Components may not sum to total because of rounding. Datarepresent the face value of collateral.
* Less than $500 million.
Table 11. TALF collateral by rating
Billions of dollars, as of August 31, 2011
Type of collateral Value
Asset-backed securities with minimum rating of: 1
AAA/Aaa 13
Total 13
Note: Unaudited. Data represent the face value of collateral.1 Eligible ABS collateral for the TALF was required to have a credit rating in thehighest investment-grade rating category from at least two eligible NRSROsand could not have a credit rating below the highest investment-grade ratingcategory from an eligible NRSRO.When pledged collateral is downgradedbelow the highest investment-grade rating, existing loans against the collateralremain outstanding.
14 Credit and Liquidity Programs and the Balance Sheet
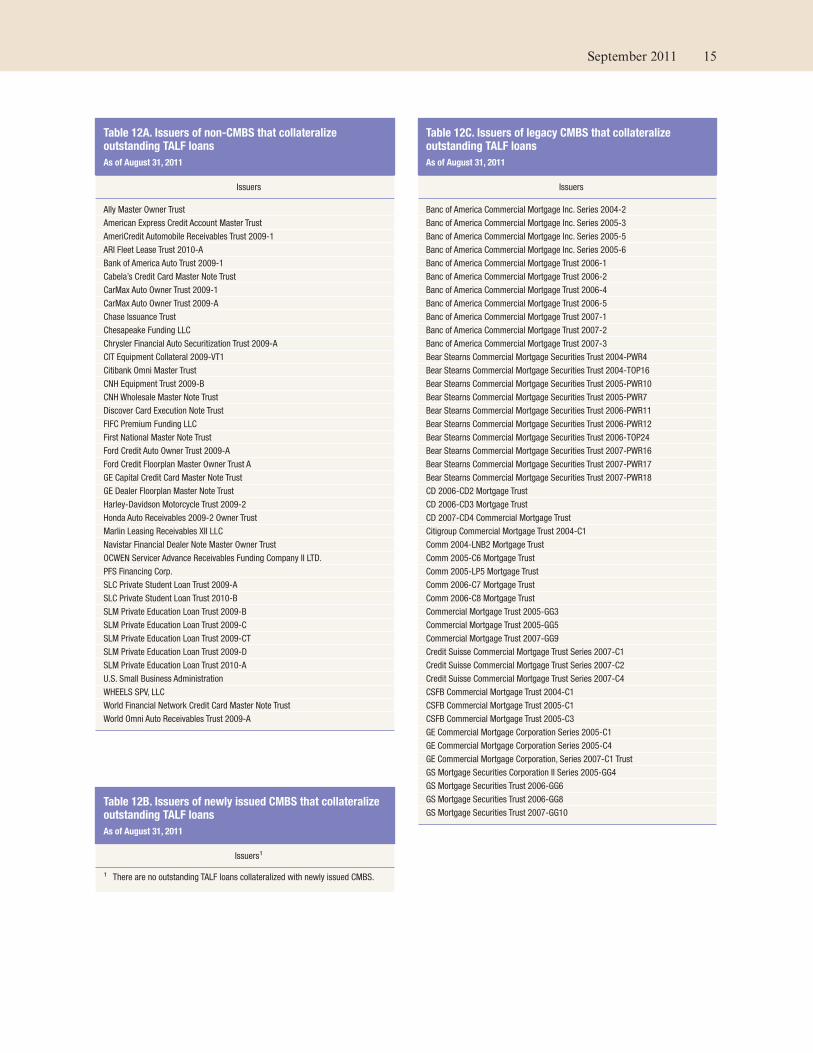
Table 12A. Issuers of non-CMBS that collateralizeoutstanding TALF loans
As of August 31, 2011
Issuers
Ally Master Owner Trust
American Express Credit Account Master Trust
AmeriCredit Automobile Receivables Trust 2009-1
ARI Fleet Lease Trust 2010-A
Bank of America Auto Trust 2009-1
Cabela’s Credit Card Master Note Trust
CarMax Auto Owner Trust 2009-1
CarMax Auto Owner Trust 2009-A
Chase Issuance Trust
Chesapeake Funding LLC
Chrysler Financial Auto Securitization Trust 2009-A
CIT Equipment Collateral 2009-VT1
Citibank Omni Master Trust
CNH Equipment Trust 2009-B
CNH Wholesale Master Note Trust
Discover Card Execution Note Trust
FIFC Premium Funding LLC
First National Master Note Trust
Ford Credit Auto Owner Trust 2009-A
Ford Credit Floorplan Master Owner Trust A
GE Capital Credit Card Master Note Trust
GE Dealer Floorplan Master Note Trust
Harley-Davidson Motorcycle Trust 2009-2
Honda Auto Receivables 2009-2 Owner Trust
Marlin Leasing Receivables XII LLC
Navistar Financial Dealer Note Master Owner Trust
OCWEN Servicer Advance Receivables Funding Company II LTD.
PFS Financing Corp.
SLC Private Student Loan Trust 2009-A
SLC Private Student Loan Trust 2010-B
SLM Private Education Loan Trust 2009-B
SLM Private Education Loan Trust 2009-C
SLM Private Education Loan Trust 2009-CT
SLM Private Education Loan Trust 2009-D
SLM Private Education Loan Trust 2010-A
U.S. Small Business Administration
WHEELS SPV, LLC
World Financial Network Credit Card Master Note Trust
World Omni Auto Receivables Trust 2009-A
Table 12B. Issuers of newly issued CMBS that collateralizeoutstanding TALF loans
As of August 31, 2011
Issuers1
1 There are no outstanding TALF loans collateralized with newly issued CMBS.
Table 12C. Issuers of legacy CMBS that collateralizeoutstanding TALF loans
As of August 31, 2011
Issuers
Banc of America Commercial Mortgage Inc. Series 2004-2
Banc of America Commercial Mortgage Inc. Series 2005-3
Banc of America Commercial Mortgage Inc. Series 2005-5
Banc of America Commercial Mortgage Inc. Series 2005-6
Banc of America Commercial Mortgage Trust 2006-1
Banc of America Commercial Mortgage Trust 2006-2
Banc of America Commercial Mortgage Trust 2006-4
Banc of America Commercial Mortgage Trust 2006-5
Banc of America Commercial Mortgage Trust 2007-1
Banc of America Commercial Mortgage Trust 2007-2
Banc of America Commercial Mortgage Trust 2007-3
Bear Stearns Commercial Mortgage Securities Trust 2004-PWR4
Bear Stearns Commercial Mortgage Securities Trust 2004-TOP16
Bear Stearns Commercial Mortgage Securities Trust 2005-PWR10
Bear Stearns Commercial Mortgage Securities Trust 2005-PWR7
Bear Stearns Commercial Mortgage Securities Trust 2006-PWR11
Bear Stearns Commercial Mortgage Securities Trust 2006-PWR12
Bear Stearns Commercial Mortgage Securities Trust 2006-TOP24
Bear Stearns Commercial Mortgage Securities Trust 2007-PWR16
Bear Stearns Commercial Mortgage Securities Trust 2007-PWR17
Bear Stearns Commercial Mortgage Securities Trust 2007-PWR18
CD 2006-CD2 Mortgage Trust
CD 2006-CD3 Mortgage Trust
CD 2007-CD4 Commercial Mortgage Trust
Citigroup Commercial Mortgage Trust 2004-C1
Comm 2004-LNB2 Mortgage Trust
Comm 2005-C6 Mortgage Trust
Comm 2005-LP5 Mortgage Trust
Comm 2006-C7 Mortgage Trust
Comm 2006-C8 Mortgage Trust
Commercial Mortgage Trust 2005-GG3
Commercial Mortgage Trust 2005-GG5
Commercial Mortgage Trust 2007-GG9
Credit Suisse Commercial Mortgage Trust Series 2007-C1
Credit Suisse Commercial Mortgage Trust Series 2007-C2
Credit Suisse Commercial Mortgage Trust Series 2007-C4
CSFB Commercial Mortgage Trust 2004-C1
CSFB Commercial Mortgage Trust 2005-C1
CSFB Commercial Mortgage Trust 2005-C3
GE Commercial Mortgage Corporation Series 2005-C1
GE Commercial Mortgage Corporation Series 2005-C4
GE Commercial Mortgage Corporation, Series 2007-C1 Trust
GS Mortgage Securities Corporation II Series 2005-GG4
GS Mortgage Securities Trust 2006-GG6
GS Mortgage Securities Trust 2006-GG8
GS Mortgage Securities Trust 2007-GG10
September 2011 15
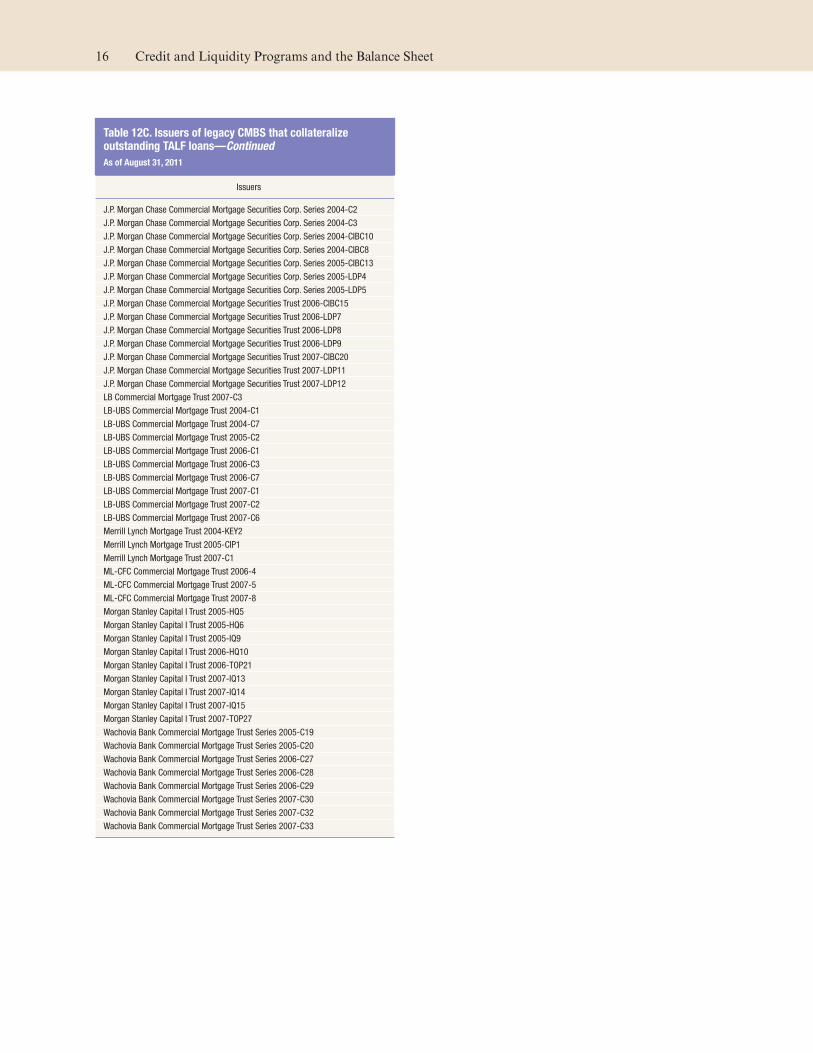
Table 12C. Issuers of legacy CMBS that collateralizeoutstanding TALF loans—Continued
As of August 31, 2011
Issuers
J.P. Morgan Chase Commercial Mortgage Securities Corp. Series 2004-C2
J.P. Morgan Chase Commercial Mortgage Securities Corp. Series 2004-C3
J.P. Morgan Chase Commercial Mortgage Securities Corp. Series 2004-CIBC10
J.P. Morgan Chase Commercial Mortgage Securities Corp. Series 2004-CIBC8
J.P. Morgan Chase Commercial Mortgage Securities Corp. Series 2005-CIBC13
J.P. Morgan Chase Commercial Mortgage Securities Corp. Series 2005-LDP4
J.P. Morgan Chase Commercial Mortgage Securities Corp. Series 2005-LDP5
J.P. Morgan Chase Commercial Mortgage Securities Trust 2006-CIBC15
J.P. Morgan Chase Commercial Mortgage Securities Trust 2006-LDP7
J.P. Morgan Chase Commercial Mortgage Securities Trust 2006-LDP8
J.P. Morgan Chase Commercial Mortgage Securities Trust 2006-LDP9
J.P. Morgan Chase Commercial Mortgage Securities Trust 2007-CIBC20
J.P. Morgan Chase Commercial Mortgage Securities Trust 2007-LDP11
J.P. Morgan Chase Commercial Mortgage Securities Trust 2007-LDP12
LB Commercial Mortgage Trust 2007-C3
LB-UBS Commercial Mortgage Trust 2004-C1
LB-UBS Commercial Mortgage Trust 2004-C7
LB-UBS Commercial Mortgage Trust 2005-C2
LB-UBS Commercial Mortgage Trust 2006-C1
LB-UBS Commercial Mortgage Trust 2006-C3
LB-UBS Commercial Mortgage Trust 2006-C7
LB-UBS Commercial Mortgage Trust 2007-C1
LB-UBS Commercial Mortgage Trust 2007-C2
LB-UBS Commercial Mortgage Trust 2007-C6
Merrill Lynch Mortgage Trust 2004-KEY2
Merrill Lynch Mortgage Trust 2005-CIP1
Merrill Lynch Mortgage Trust 2007-C1
ML-CFC Commercial Mortgage Trust 2006-4
ML-CFC Commercial Mortgage Trust 2007-5
ML-CFC Commercial Mortgage Trust 2007-8
Morgan Stanley Capital I Trust 2005-HQ5
Morgan Stanley Capital I Trust 2005-HQ6
Morgan Stanley Capital I Trust 2005-IQ9
Morgan Stanley Capital I Trust 2006-HQ10
Morgan Stanley Capital I Trust 2006-TOP21
Morgan Stanley Capital I Trust 2007-IQ13
Morgan Stanley Capital I Trust 2007-IQ14
Morgan Stanley Capital I Trust 2007-IQ15
Morgan Stanley Capital I Trust 2007-TOP27
Wachovia Bank Commercial Mortgage Trust Series 2005-C19
Wachovia Bank Commercial Mortgage Trust Series 2005-C20
Wachovia Bank Commercial Mortgage Trust Series 2006-C27
Wachovia Bank Commercial Mortgage Trust Series 2006-C28
Wachovia Bank Commercial Mortgage Trust Series 2006-C29
Wachovia Bank Commercial Mortgage Trust Series 2007-C30
Wachovia Bank Commercial Mortgage Trust Series 2007-C32
Wachovia Bank Commercial Mortgage Trust Series 2007-C33
16 Credit and Liquidity Programs and the Balance Sheet
Lending in Support of Specific Institutions
Quarterly Developments
‰ Cash flows generated from the Maiden Lane LLC,
Maiden Lane II LLC, and Maiden Lane III LLC
portfolios are used to pay down the FRBNY’s
loans to those LLCs. For the second quarter of
2011, repayments totaled approximately $7.5 bil-
lion, as presented in tables 14, 17, and 20.
Background
During the financial crisis, the Federal Reserve
extended credit to certain specific institutions in
order to avert disorderly failures that could result in
severe dislocations and strains for the financial
system as a whole and harm the U.S. economy. In
certain other cases, the Federal Reserve committed to
extend credit, if necessary, to support important
financial firms.
Bear Stearns and Maiden Lane LLC
Recent Developments
‰ The repayments of the senior loan extended by the
FRBNY to Maiden Lane LLC totaled $5.8 billion
during the period from June 30 to August 31,
2011.
Table 13. Fair value asset coverage of FRBNY loan
Millions of dollars
Fair value assetcoverage of FRBNYloan on 6/30/2011
Fair value assetcoverage of FRBNYloan on 3/31/2011
Maiden Lane LLC 2,335 1,875
Maiden Lane II LLC 2,684 3,783
Maiden Lane III LLC 9,841 11,517
Note: Unaudited. Fair value asset coverage is the amount by which the fair valueof the net portfolio assets of each LLC (refer to table 26) is greater or less than theoutstanding balance of the loans extended by the FRBNY, including accruedinterest.
Table 14. Maiden Lane LLC outstanding principal balance ofloans
Millions of dollars
FRBNYseniorloan
JPMCsubordinate
loan
Principal balance at closing 28,820 1,150
Most recent quarterly activity
Principal balance on 3/31/2011 (includingaccrued and capitalized interest) 24,134 1,332
Accrued and capitalized interest from3/31/2011 to 6/30/2011 42 17
Repayment during the period from3/31/2011 to 6/30/20111 (2,575) —
Principal balance on 6/30/2011 (includingaccrued and capitalized interest) 21,601 1,349
Note: Unaudited. As part of the asset purchase agreement, JPMC made a loan toMaiden Lane LLC. For repayment purposes, this obligation is subordinated to thesenior loan extended by the FRBNY.1 Repayment amount for the period includes $1.4 billion of proceeds receivedfrom asset sales. Due to the cash flow cut off date used to calculate the cashavailable for the repayment, the portion of the repayment amount comprised ofsale proceeds may not reconcile to the total sale proceeds reported eachmonth. Proceeds received after the cut off date are applied to the loan in thenext monthly payment cycle.
Table 15. Maiden Lane LLC summary of portfoliocomposition, cash and cash equivalents, and other assetsand liabilities
Millions of dollars
Fair valueon 6/30/20111
Fair valueon 3/31/20111
Federal Agency and GSE MBS 11,177 14,936
Non-agency RMBS 1,838 1,887
Commercial loans2 5,214 5,305
Residential loans 577 601
Swap contracts 570 547
Other investments 937 972
Cash and cash equivalents 3,514 2,206
Other assets3 717 159
Other liabilities4 (608) (603)
Net assets 23,936 26,009
Note: Unaudited. Components may not sum to totals because of rounding.1 Change in fair value from the prior quarter reflects a combination of assetrepayment of principal, change in the price of portfolio securities, realized gainsand losses as a result of sales, and the disbursement of cash to repay theSenior Loan.
2 Includes commercial loans with a fair value of $151 million that, in accordancewith U.S. GAAP, are recorded for financial reporting purposes as Other Assetsbecause Maiden Lane LLC consolidates the variable interest entity to whichthese loans were extended.
3 Including interest and principal receivable and other assets (options included).4 Including amounts payable for securities purchased, collateral posted toMaiden Lane LLC by swap counterparties, and other liabilities and accruedexpenses.
17
Background
In March 2008, the FRBNY and JPMorgan Chase &
Co. (JPMC) entered into an arrangement related to
financing provided by the FRBNY to facilitate the
acquisition by JPMC of The Bear Stearns Compa-
nies Inc. (Bear Stearns). In connection with the
transaction, the Federal Reserve Board authorized
the FRBNY, under Section 13(3) of the Federal
Reserve Act, to extend credit to a Delaware limited
liability company, Maiden Lane LLC, to partially
fund the purchase of a portfolio of mortgage-related
securities, residential and commercial mortgage
loans, and associated hedges from Bear Stearns. In
the second quarter of 2008, the FRBNY extended
credit to Maiden Lane LLC. The LLC manages its
assets through time to maximize the repayment of
credit extended to the LLC and to minimize disrup-
tion to the financial markets.
The two-year accumulation period that followed the
closing date for Maiden Lane LLC ended on June 26,
2010. Consistent with the terms of the Maiden Lane
LLC transaction, the distribution of the proceeds
realized on the asset portfolio held by Maiden Lane
LLC, after payment of certain fees and expenses, will
occur on a monthly basis going forward unless other-
wise directed by the Federal Reserve. The monthly
distributions will be used to cover the expenses and
repay the obligations of the LLC, including the prin-
cipal and interest on the loan from the FRBNY.
The assets of Maiden Lane LLC are presented
weekly in tables 1, 8, and 9 of the H.4.1 statistical
release. Additional details on the accounts of Maiden
Lane LLC are presented in table 4 of the H.4.1 statis-
tical release. Detailed information on the terms of the
loan, the holdings of Maiden Lane LLC (including
the CUSIP number, descriptor, and the current prin-
Table 16. Maiden Lane LLC securities distribution by sector and rating
Percent, as of June 30, 2011
Sector1
Rating
AAA AA+ to AA- A+ to A-BBB+to BBB-
BB+and lower
Gov’t/ Agency Not Rated Total
Federal Agency and GSE MBS 0.0 0.0 0.0 0.0 0.0 80.1 0.0 80.1
Non-agency RMBS 0.1 0.3 0.1 0.2 12.3 0.0 0.2 13.2
Other2 0.8 1.2 0.3 2.1 2.1 0.0 0.2 6.7
Total 0.9 1.5 0.5 2.2 14.4 80.1 0.3 100.0
Note: Unaudited. This table presents the sector and ratings composition of the securities in the Maiden Lane LLC portfolio as a percentage of all securities in the portfolio. It isbased on the fair value of the securities. Lowest of all ratings is used for purposes of this table. Rows and columns may not sum to totals because of rounding.1 Does not include Maiden Lane LLC’s swaps and other derivative contracts and commercial and residential mortgage loans.2 Includes all asset sectors that, individually, represent less than 5 percent of the aggregate fair value of securities in the portfolio.
Figure 2. Maiden Lane LLC securities distribution as of June 30, 2011
18 Credit and Liquidity Programs and the Balance Sheet
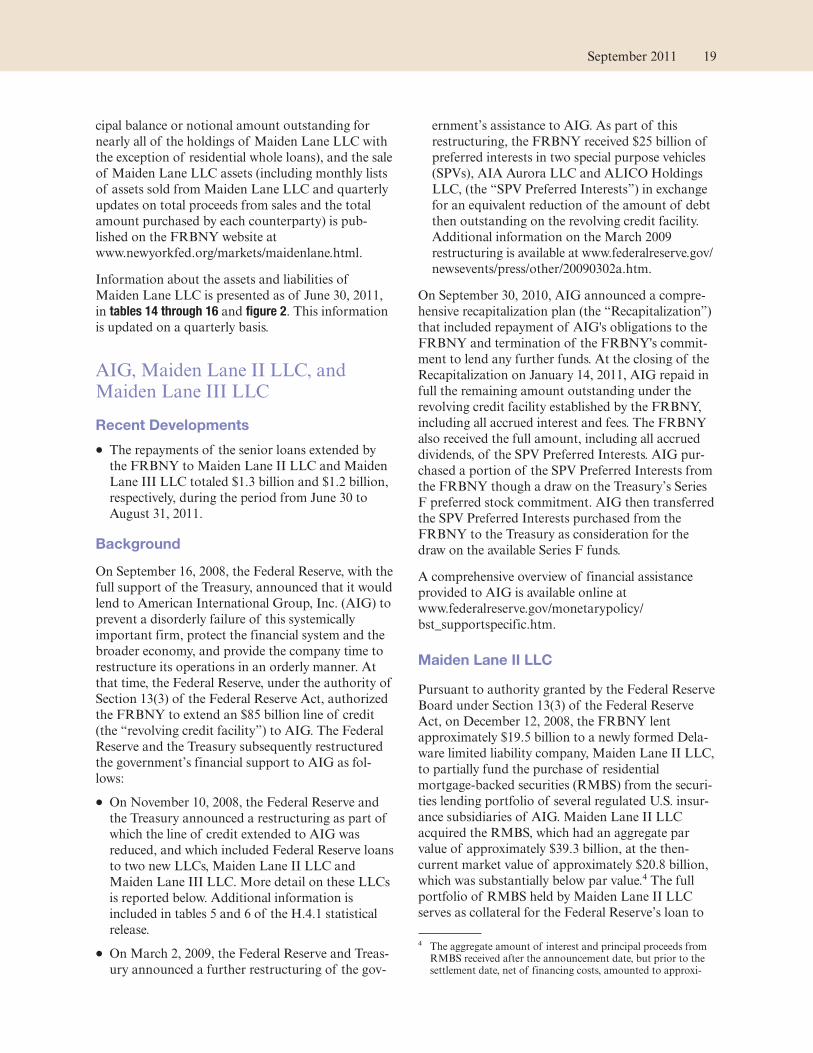
cipal balance or notional amount outstanding for
nearly all of the holdings of Maiden Lane LLC with
the exception of residential whole loans), and the sale
of Maiden Lane LLC assets (including monthly lists
of assets sold fromMaiden Lane LLC and quarterly
updates on total proceeds from sales and the total
amount purchased by each counterparty) is pub-
lished on the FRBNY website at
www.newyorkfed.org/markets/maidenlane.html.
Information about the assets and liabilities of
Maiden Lane LLC is presented as of June 30, 2011,
in tables 14 through 16 and figure 2. This information
is updated on a quarterly basis.
AIG, Maiden Lane II LLC, andMaiden Lane III LLC
Recent Developments
‰ The repayments of the senior loans extended by
the FRBNY to Maiden Lane II LLC and Maiden
Lane III LLC totaled $1.3 billion and $1.2 billion,
respectively, during the period from June 30 to
August 31, 2011.
Background
On September 16, 2008, the Federal Reserve, with the
full support of the Treasury, announced that it would
lend to American International Group, Inc. (AIG) to
prevent a disorderly failure of this systemically
important firm, protect the financial system and the
broader economy, and provide the company time to
restructure its operations in an orderly manner. At
that time, the Federal Reserve, under the authority of
Section 13(3) of the Federal Reserve Act, authorized
the FRBNY to extend an $85 billion line of credit
(the “revolving credit facility”) to AIG. The Federal
Reserve and the Treasury subsequently restructured
the government’s financial support to AIG as fol-
lows:
‰ On November 10, 2008, the Federal Reserve and
the Treasury announced a restructuring as part of
which the line of credit extended to AIG was
reduced, and which included Federal Reserve loans
to two new LLCs, Maiden Lane II LLC and
Maiden Lane III LLC. More detail on these LLCs
is reported below. Additional information is
included in tables 5 and 6 of the H.4.1 statistical
release.
‰ OnMarch 2, 2009, the Federal Reserve and Treas-
ury announced a further restructuring of the gov-
ernment’s assistance to AIG. As part of this
restructuring, the FRBNY received $25 billion of
preferred interests in two special purpose vehicles
(SPVs), AIA Aurora LLC and ALICO Holdings
LLC, (the “SPV Preferred Interests”) in exchange
for an equivalent reduction of the amount of debt
then outstanding on the revolving credit facility.
Additional information on the March 2009
restructuring is available at www.federalreserve.gov/
newsevents/press/other/20090302a.htm.
On September 30, 2010, AIG announced a compre-
hensive recapitalization plan (the “Recapitalization”)
that included repayment of AIG's obligations to the
FRBNY and termination of the FRBNY's commit-
ment to lend any further funds. At the closing of the
Recapitalization on January 14, 2011, AIG repaid in
full the remaining amount outstanding under the
revolving credit facility established by the FRBNY,
including all accrued interest and fees. The FRBNY
also received the full amount, including all accrued
dividends, of the SPV Preferred Interests. AIG pur-
chased a portion of the SPV Preferred Interests from
the FRBNY though a draw on the Treasury’s Series
F preferred stock commitment. AIG then transferred
the SPV Preferred Interests purchased from the
FRBNY to the Treasury as consideration for the
draw on the available Series F funds.
A comprehensive overview of financial assistance
provided to AIG is available online at
www.federalreserve.gov/monetarypolicy/
bst_supportspecific.htm.
Maiden Lane II LLC
Pursuant to authority granted by the Federal Reserve
Board under Section 13(3) of the Federal Reserve
Act, on December 12, 2008, the FRBNY lent
approximately $19.5 billion to a newly formed Dela-
ware limited liability company, Maiden Lane II LLC,
to partially fund the purchase of residential
mortgage-backed securities (RMBS) from the securi-
ties lending portfolio of several regulated U.S. insur-
ance subsidiaries of AIG. Maiden Lane II LLC
acquired the RMBS, which had an aggregate par
value of approximately $39.3 billion, at the then-
current market value of approximately $20.8 billion,
which was substantially below par value.4 The full
portfolio of RMBS held by Maiden Lane II LLC
serves as collateral for the Federal Reserve’s loan to
4 The aggregate amount of interest and principal proceeds fromRMBS received after the announcement date, but prior to thesettlement date, net of financing costs, amounted to approxi-
September 2011 19
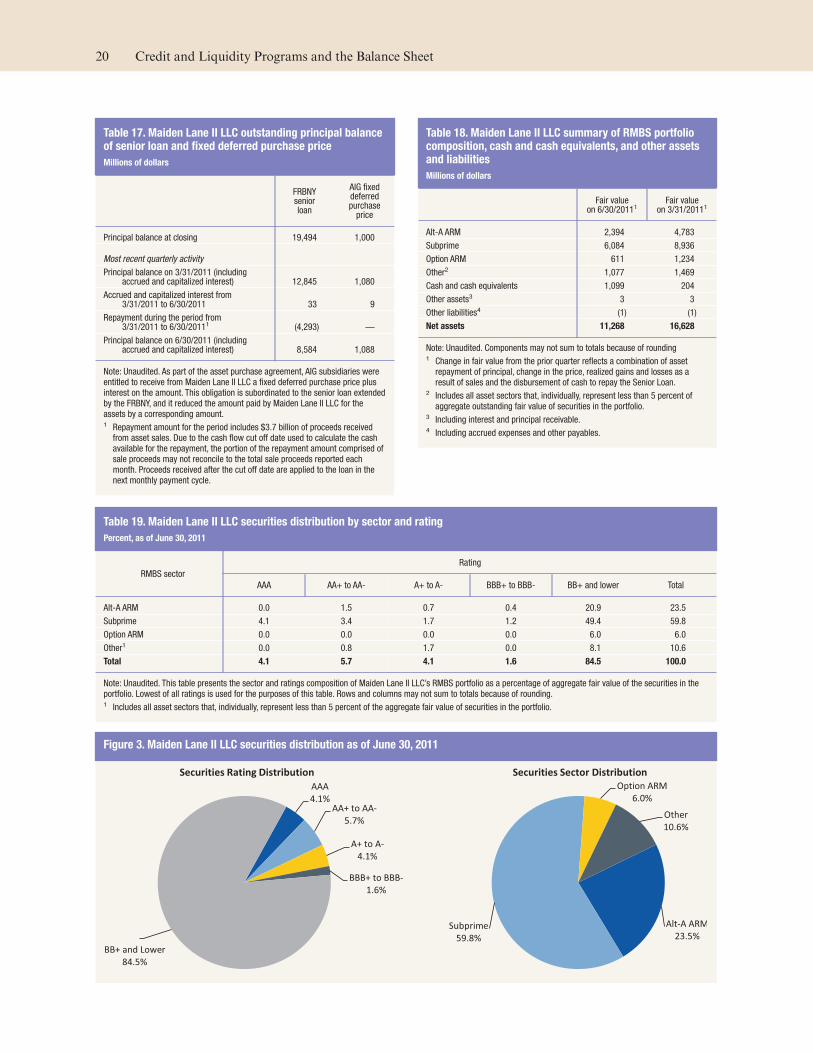
Table 17. Maiden Lane II LLC outstanding principal balanceof senior loan and fixed deferred purchase price
Millions of dollars
FRBNYseniorloan
AIG fixeddeferredpurchaseprice
Principal balance at closing 19,494 1,000
Most recent quarterly activity
Principal balance on 3/31/2011 (includingaccrued and capitalized interest) 12,845 1,080
Accrued and capitalized interest from3/31/2011 to 6/30/2011 33 9
Repayment during the period from3/31/2011 to 6/30/20111 (4,293) —
Principal balance on 6/30/2011 (includingaccrued and capitalized interest) 8,584 1,088
Note: Unaudited. As part of the asset purchase agreement, AIG subsidiaries wereentitled to receive from Maiden Lane II LLC a fixed deferred purchase price plusinterest on the amount. This obligation is subordinated to the senior loan extendedby the FRBNY, and it reduced the amount paid by Maiden Lane II LLC for theassets by a corresponding amount.1 Repayment amount for the period includes $3.7 billion of proceeds receivedfrom asset sales. Due to the cash flow cut off date used to calculate the cashavailable for the repayment, the portion of the repayment amount comprised ofsale proceeds may not reconcile to the total sale proceeds reported eachmonth. Proceeds received after the cut off date are applied to the loan in thenext monthly payment cycle.
Table 18. Maiden Lane II LLC summary of RMBS portfoliocomposition, cash and cash equivalents, and other assetsand liabilities
Millions of dollars
Fair valueon 6/30/20111
Fair valueon 3/31/20111
Alt-A ARM 2,394 4,783
Subprime 6,084 8,936
Option ARM 611 1,234
Other2 1,077 1,469
Cash and cash equivalents 1,099 204
Other assets3 3 3
Other liabilities4 (1) (1)
Net assets 11,268 16,628
Note: Unaudited. Components may not sum to totals because of rounding1 Change in fair value from the prior quarter reflects a combination of assetrepayment of principal, change in the price, realized gains and losses as aresult of sales and the disbursement of cash to repay the Senior Loan.
2 Includes all asset sectors that, individually, represent less than 5 percent ofaggregate outstanding fair value of securities in the portfolio.
3 Including interest and principal receivable.4 Including accrued expenses and other payables.
Table 19. Maiden Lane II LLC securities distribution by sector and rating
Percent, as of June 30, 2011
RMBS sector
Rating
AAA AA+ to AA- A+ to A- BBB+ to BBB- BB+ and lower Total
Alt-A ARM 0.0 1.5 0.7 0.4 20.9 23.5
Subprime 4.1 3.4 1.7 1.2 49.4 59.8
Option ARM 0.0 0.0 0.0 0.0 6.0 6.0
Other1 0.0 0.8 1.7 0.0 8.1 10.6
Total 4.1 5.7 4.1 1.6 84.5 100.0
Note: Unaudited. This table presents the sector and ratings composition of Maiden Lane II LLC’s RMBS portfolio as a percentage of aggregate fair value of the securities in theportfolio. Lowest of all ratings is used for the purposes of this table. Rows and columns may not sum to totals because of rounding.1 Includes all asset sectors that, individually, represent less than 5 percent of the aggregate fair value of securities in the portfolio.
Figure 3. Maiden Lane II LLC securities distribution as of June 30, 2011
20 Credit and Liquidity Programs and the Balance Sheet
Maiden Lane II LLC. AIG’s insurance subsidiaries
also have a $1 billion subordinated position in
Maiden Lane II LLC that is available to absorb first
any losses that may be realized.
On March 30, 2011, the Federal Reserve announced
that the FRBNY, through its investment manager,
BlackRock Solutions, will dispose of the securities in
the ML II portfolio individually and in segments
through a competitive sales process over time as mar-
ket conditions warrant. On June 29, 2011, BlackRock
Solutions announced to broker-dealers that, given
prevailing market conditions for non-agency RMBS,
it does not anticipate any sales of bonds in the near
term or until such time as the FRBNY deems it
appropriate. At such time, the sale of securities from
the Maiden Lane II LLC portfolio may resume.
The net portfolio holdings of Maiden Lane II LLC
are presented in tables 1, 8, and 9 of the weekly H.4.1
statistical release. Additional detail on the accounts
of Maiden Lane II LLC is presented in table 5 of the
H.4.1 statistical release. Detailed information on the
terms of the loan, the holdings of Maiden Lane II
LLC (including the CUSIP number, descriptor, and
the current principal balance or notional amount
outstanding for all the positions in the portfolio), and
the disposition of Maiden Lane II assets (including
offering announcements and results, monthly lists of
assets sold fromMaiden Lane II LLC, and quarterly
updates on total proceeds from sales and the total
amount purchased by each counterparty) is pub-
lished on the FRBNY website at
www.newyorkfed.org/markets/maidenlane.html.
Information about the assets and liabilities of
Maiden Lane II LLC is presented as of June 30,
2011, in tables 17 through 19 and figure 3. This infor-
mation is updated on a quarterly basis.
Maiden Lane III LLC
Pursuant to authority granted by the Federal Reserve
Board under Section 13(3) of the Federal Reserve
Act, the FRBNY in November and December 2008,
lent approximately $24.3 billion to a newly formed
Delaware limited liability company, Maiden Lane III
LLC, to fund the purchase of certain asset-backed
collateralized debt obligations (ABS CDOs) from
certain counterparties of AIG Financial Products
Corp. (AIGFP) on which AIGFP had written credit
default swaps and similar contracts. Maiden Lane III
LLC acquired these CDOs, which had an aggregate
par value of approximately $62.1 billion, at the then-
current market value of approximately $29.6 billion,
which was substantially below par value.5 The full
portfolio of CDOs held by Maiden Lane III LLC
serves as collateral for the Federal Reserve’s loan to
Maiden Lane III LLC. AIG together with an AIG
mately $0.3 billion and therefore reduced the amount of fund-ing required at settlement by $0.3 billion, from $20.8 billion to$20.5 billion.
5 The aggregate amount of interest and principal proceeds fromCDOs received after the announcement date, but prior to thesettlement dates, net of financing costs, amounted to approxi-mately $0.3 billion and therefore reduced the amount of fund-ing required at settlement by $0.3 billion, from $29.6 billion to$29.3 billion.
Table 20. Maiden Lane III LLC outstanding principal balanceof senior loan and equity contribution
Millions of dollars
FRBNYsenior loan
AIG equitycontribution
Principal balance at closing 24,339 5,000
Most recent quarterly activity
Principal balance on 3/31/2011 (includingaccrued and capitalized interest) 12,933 5,409
Accrued and capitalized interest from3/31/2011 to 6/30/2011 38 43
Repayment during the period from3/31/2011 to 6/30/2011 (647) —
Principal balance on 6/30/2011 (includingaccrued and capitalized interest) 12,324 5,452
Note: Unaudited. As part of the asset purchase agreement, AIG purchased a $5billion equity contribution, which is subordinated to the senior loan extended bythe FRBNY.
Table 21. Maiden Lane III LLC summary of portfoliocomposition, cash and cash equivalents, and other assetsand liabilities
Millions of dollars
Fair valueon 6/30/20111
Fair valueon 3/31/20111
High-grade ABS CDO 13,578 15,372
Mezzanine ABS CDO 1,788 1,986
Commercial real estate CDO 5,597 6,174
RMBS, CMBS, and Other 314 317
Cash and cash equivalents 865 576
Other assets2 25 28
Other liabilities3 (3) (3)
Net assets 22,165 24,450
Note: Unaudited. Components may not sum to totals because of rounding.1 Change in fair value from the prior quarter reflects a combination of assetrepayment of principal, change in the price, and realized gains and losses as aresult of sales and the disbursement of cash to repay the Senior Loan.
2 Including interest and principal receivable.3 Including accrued expenses.
September 2011 21
Table 22. Maiden Lane III LLC securities distribution by sector, vintage, and rating
Percent, as of June 30, 2011
Sector and vintage1Rating
AAA AA+ to AA- A+ to A- BBB+ to BBB- BB+ and lower Not Rated Total
High-grade ABS CDO 0.0 0.0 0.0 0.0 62.7 1.1 63.8
Pre-2005 0.0 0.0 0.0 0.0 21.8 0.0 21.8
2005 0.0 0.0 0.0 0.0 28.8 1.1 29.9
2006 0.0 0.0 0.0 0.0 5.6 0.0 5.6
2007 0.0 0.0 0.0 0.0 6.5 0.0 6.5
Mezzanine ABS CDO 0.0 0.0 0.0 0.0 8.2 0.2 8.4
Pre-2005 0.0 0.0 0.0 0.0 4.6 0.2 4.8
2005 0.0 0.0 0.0 0.0 3.0 0.0 3.0
2006 0.0 0.0 0.0 0.0 0.0 0.0 0.0
2007 0.0 0.0 0.0 0.0 0.6 0.0 0.6
Commercial real estate CDO 0.0 0.0 0.0 0.0 26.3 0.0 26.3
Pre-2005 0.0 0.0 0.0 0.0 3.2 0.0 3.2
2005 0.0 0.0 0.0 0.0 0.0 0.0 0.0
2006 0.0 0.0 0.0 0.0 0.0 0.0 0.0
2007 0.0 0.0 0.0 0.0 23.1 0.0 23.1
RMBS, CMBS, and Other 0.1 0.2 0.1 0.1 1.0 0.0 1.5
Pre-2005 0.0 0.0 0.0 0.0 0.1 0.0 0.2
2005 0.1 0.1 0.1 0.1 0.8 0.0 1.2
2006 0.0 0.0 0.0 0.0 0.1 0.0 0.1
2007 0.0 0.0 0.0 0.0 0.0 0.0 0.0
Total 0.1 0.2 0.1 0.1 98.3 1.3 100.0
Note: Unaudited. This table presents the sector, vintage, and rating composition of the securities in the Maiden Lane III LLC portfolio as a percentage of all securities in theportfolio. It is based on the fair value of the securities. Lowest of all ratings is used for purposes of this table. Rows and columns may not sum to totals because of rounding.1 The year of issuance with the highest concentration of underlying assets as measured by outstanding principal balance determines the vintage of the CDO.
Figure 4. Maiden Lane III LLC securities distribution as of June 30, 2011
22 Credit and Liquidity Programs and the Balance Sheet
subsidiary also have a $5 billion subordinated posi-
tion in Maiden Lane III LLC that is available to
absorb first any losses that may be realized. Assets of
the portfolio of the LLC will be managed to maxi-
mize cash flows to ensure repayment of obligations
of the LLC while minimizing disruptions to financial
markets.
The net portfolio holdings of Maiden Lane III LLC
are presented in tables 1, 8, and 9 of the weekly H.4.1
statistical release. Additional detail on the accounts
of Maiden Lane III LLC is presented in table 6 of
the H.4.1 statistical release. Information on the hold-
ings of the Maiden Lane III LLC, including the
CUSIP number, descriptor, and the current principal
balance or notional amount outstanding for all the
positions in the portfolio, is published on the
FRBNY website at www.newyorkfed.org/
markets/maidenlane.html.
Information about the assets and liabilities of
Maiden Lane III LLC is presented as of June 30,
2011, in tables 20 through 22 and figure 4. This infor-
mation is updated on a quarterly basis.
September 2011 23
Federal Reserve Banks’ Financial Tables
Quarterly Developments
‰ The average daily balance of the Federal Reserve
SOMA holdings was approximately $2.5 trillion
during the first half of 2011, as presented in
table 24. Net earnings from the portfolio were
approximately $43.1 billion; most of the earnings
were attributable to interest income on Treasury
securities and federal agency and GSEMBS.
‰ Interest earned from Federal Reserve lending pro-
grams was approximately $0.6 billion during the
first half of 2011, as presented in table 25; interest
earned on credit extended to AIG and loans made
by the TALF accounted for most of the total.
‰ Net income (loss) reported on the consolidated
financial statements of the FRBNY, including
changes in valuation, for the Maiden Lane,
Maiden Lane II, and Maiden Lane III LLCs, was
approximately $1.1 billion, $(0.2) billion, and $0.2
billion, respectively, during the first half of 2011.
‰ After providing for the payment of dividends and
reserving an amount necessary to equate surplus
with capital paid in, distributions to the Treasury
as interest on Federal Reserve notes totaled $40.5
billion during the first half of 2011, as presented in
table 23.
Background
The Federal Reserve Banks prepare annual financial
statements reflecting balances as of December 31,
and income and expenses for the year then ended.
The Federal Reserve Bank financial statements also
include the accounts and results of operations of
several LLCs that have been consolidated with the
FRBNY (the “consolidated LLCs”).
The Board of Governors, the Federal Reserve Banks,
and the consolidated LLCs are all subject to several
levels of audit and review. The Reserve Banks’ finan-
cial statements and those of the consolidated LLC
entities are audited annually by an independent
auditing firm retained by the Board of Governors.
To ensure auditor independence, the Board requires
that the external auditor be independent in all mat-
ters relating to the audit. Specifically, the external
auditor may not perform services for the Reserve
Banks or others that would place it in a position of
auditing its own work, making management deci-
sions on behalf of the Reserve Banks, or in any other
way impairing its audit independence. In addition,
the Reserve Banks, including the consolidated LLCs,
are subject to oversight by the Board.
The Board of Governors’ financial statements are
audited annually by an independent auditing firm
retained by the Board’s Office of Inspector General
(OIG). The audit firm also provides a report on com-
pliance and on internal control over financial report-
ing in accordance with government auditing stan-
dards. The OIG also conducts audits, reviews, and
investigations relating to the Board’s programs and
operations as well as of Board functions delegated to
the Reserve Banks.
Audited annual financial statements for the Reserve
Banks and Board of Governors are available at
www.federalreserve.gov/monetarypolicy/
bst_fedfinancials.htm. In this report, the Federal
Reserve prepares unaudited quarterly updates to
tables included in the Federal Reserve Board’s
Annual Report, available at www.federalreserve.gov/
publications/annual-report/default.htm. As required
by the Dodd-Frank Act, the Federal Reserve posted
an audit webpage on December 3, 2010. This page
will be updated as reports and other information
become available. More information can be found at
www.federalreserve.gov/newsevents/reform_audit.htm.
Combined Statement of Income andComprehensive Income
Table 23 presents unaudited combined Reserve Bank
income and expense information for the first half of
2011. Tables 24 through 26 present information for
the SOMA portfolio, the Federal Reserve loan pro-
24
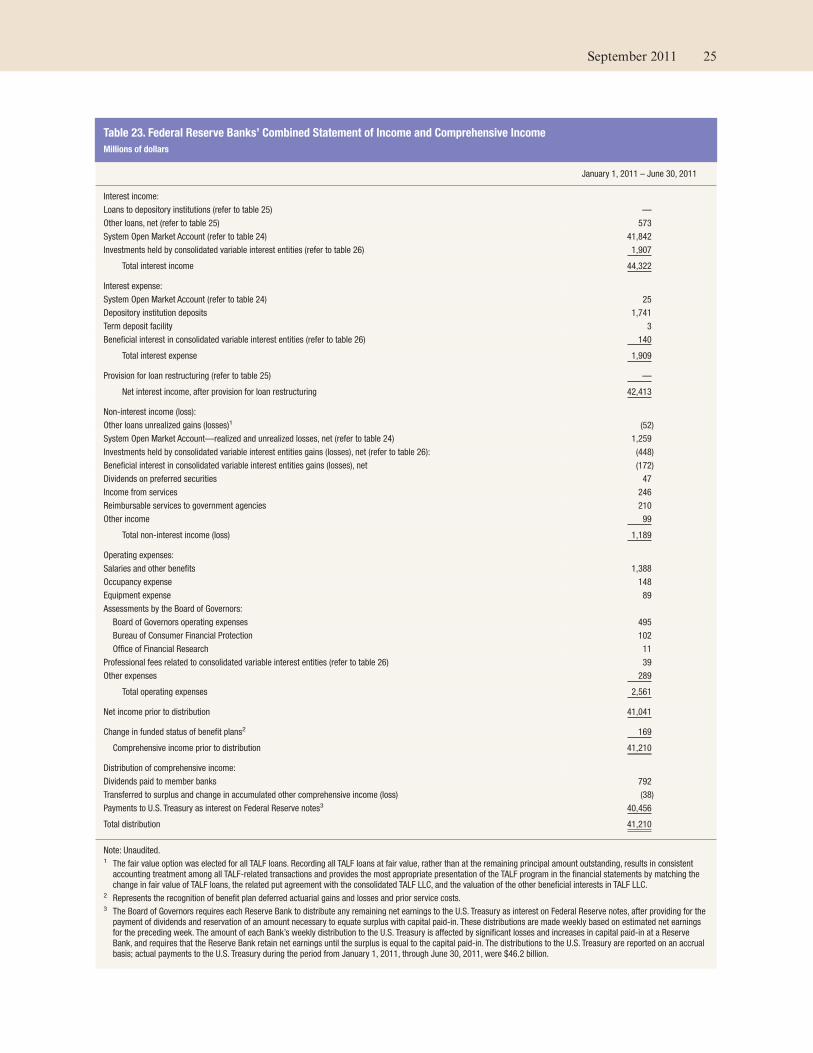
Table 23. Federal Reserve Banks’ Combined Statement of Income and Comprehensive Income
Millions of dollars
January 1, 2011 – June 30, 2011
Interest income:
Loans to depository institutions (refer to table 25) —
Other loans, net (refer to table 25) 573
System Open Market Account (refer to table 24) 41,842
Investments held by consolidated variable interest entities (refer to table 26) 1,907
Total interest income 44,322
Interest expense:
System Open Market Account (refer to table 24) 25
Depository institution deposits 1,741
Term deposit facility 3
Beneficial interest in consolidated variable interest entities (refer to table 26) 140
Total interest expense 1,909
Provision for loan restructuring (refer to table 25) —
Net interest income, after provision for loan restructuring 42,413
Non-interest income (loss):
Other loans unrealized gains (losses)1 (52)
System Open Market Account—realized and unrealized losses, net (refer to table 24) 1,259
Investments held by consolidated variable interest entities gains (losses), net (refer to table 26): (448)
Beneficial interest in consolidated variable interest entities gains (losses), net (172)
Dividends on preferred securities 47
Income from services 246
Reimbursable services to government agencies 210
Other income 99
Total non-interest income (loss) 1,189
Operating expenses:
Salaries and other benefits 1,388
Occupancy expense 148
Equipment expense 89
Assessments by the Board of Governors:
Board of Governors operating expenses 495
Bureau of Consumer Financial Protection 102
Office of Financial Research 11
Professional fees related to consolidated variable interest entities (refer to table 26) 39
Other expenses 289
Total operating expenses 2,561
Net income prior to distribution 41,041
Change in funded status of benefit plans2 169
Comprehensive income prior to distribution 41,210
Distribution of comprehensive income:
Dividends paid to member banks 792
Transferred to surplus and change in accumulated other comprehensive income (loss) (38)
Payments to U.S. Treasury as interest on Federal Reserve notes3 40,456
Total distribution 41,210
Note: Unaudited.1 The fair value option was elected for all TALF loans. Recording all TALF loans at fair value, rather than at the remaining principal amount outstanding, results in consistentaccounting treatment among all TALF-related transactions and provides the most appropriate presentation of the TALF program in the financial statements by matching thechange in fair value of TALF loans, the related put agreement with the consolidated TALF LLC, and the valuation of the other beneficial interests in TALF LLC.
2 Represents the recognition of benefit plan deferred actuarial gains and losses and prior service costs.3 The Board of Governors requires each Reserve Bank to distribute any remaining net earnings to the U.S. Treasury as interest on Federal Reserve notes, after providing for thepayment of dividends and reservation of an amount necessary to equate surplus with capital paid-in. These distributions are made weekly based on estimated net earningsfor the preceding week. The amount of each Bank’s weekly distribution to the U.S. Treasury is affected by significant losses and increases in capital paid-in at a ReserveBank, and requires that the Reserve Bank retain net earnings until the surplus is equal to the capital paid-in. The distributions to the U.S. Treasury are reported on an accrualbasis; actual payments to the U.S. Treasury during the period from January 1, 2011, through June 30, 2011, were $46.2 billion.
September 2011 25
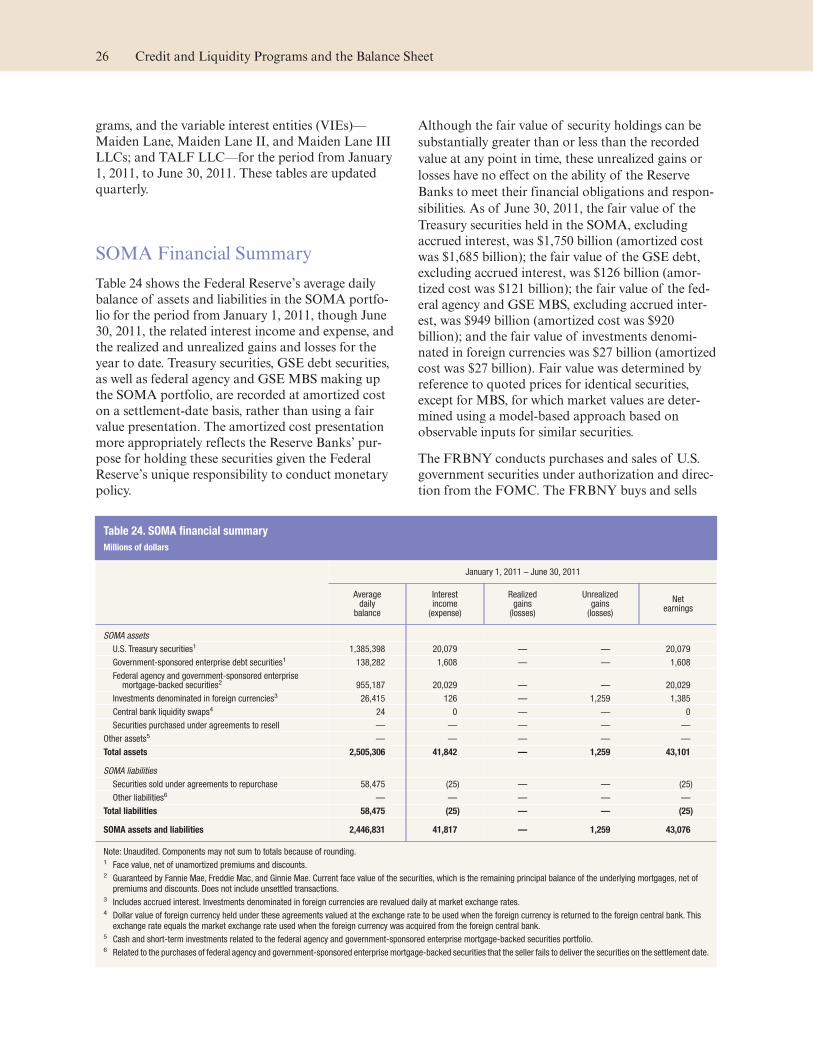
grams, and the variable interest entities (VIEs)—
Maiden Lane, Maiden Lane II, and Maiden Lane III
LLCs; and TALF LLC—for the period from January
1, 2011, to June 30, 2011. These tables are updated
quarterly.
SOMA Financial Summary
Table 24 shows the Federal Reserve’s average daily
balance of assets and liabilities in the SOMA portfo-
lio for the period from January 1, 2011, though June
30, 2011, the related interest income and expense, and
the realized and unrealized gains and losses for the
year to date. Treasury securities, GSE debt securities,
as well as federal agency and GSEMBS making up
the SOMA portfolio, are recorded at amortized cost
on a settlement-date basis, rather than using a fair
value presentation. The amortized cost presentation
more appropriately reflects the Reserve Banks’ pur-
pose for holding these securities given the Federal
Reserve’s unique responsibility to conduct monetary
policy.
Although the fair value of security holdings can be
substantially greater than or less than the recorded
value at any point in time, these unrealized gains or
losses have no effect on the ability of the Reserve
Banks to meet their financial obligations and respon-
sibilities. As of June 30, 2011, the fair value of the
Treasury securities held in the SOMA, excluding
accrued interest, was $1,750 billion (amortized cost
was $1,685 billion); the fair value of the GSE debt,
excluding accrued interest, was $126 billion (amor-
tized cost was $121 billion); the fair value of the fed-
eral agency and GSEMBS, excluding accrued inter-
est, was $949 billion (amortized cost was $920
billion); and the fair value of investments denomi-
nated in foreign currencies was $27 billion (amortized
cost was $27 billion). Fair value was determined by
reference to quoted prices for identical securities,
except for MBS, for which market values are deter-
mined using a model-based approach based on
observable inputs for similar securities.
The FRBNY conducts purchases and sales of U.S.
government securities under authorization and direc-
tion from the FOMC. The FRBNY buys and sells
Table 24. SOMA financial summary
Millions of dollars
January 1, 2011 – June 30, 2011
Averagedaily
balance
Interestincome(expense)
Realizedgains(losses)
Unrealizedgains(losses)
Netearnings
SOMA assets
U.S. Treasury securities1 1,385,398 20,079 — — 20,079
Government-sponsored enterprise debt securities1 138,282 1,608 — — 1,608
Federal agency and government-sponsored enterprisemortgage-backed securities2 955,187 20,029 — — 20,029
Investments denominated in foreign currencies3 26,415 126 — 1,259 1,385
Central bank liquidity swaps4 24 0 — — 0
Securities purchased under agreements to resell — — — — —
Other assets5 — — — — —
Total assets 2,505,306 41,842 — 1,259 43,101
SOMA liabilities
Securities sold under agreements to repurchase 58,475 (25) — — (25)
Other liabilities6 — — — — —
Total liabilities 58,475 (25) — — (25)
SOMA assets and liabilities 2,446,831 41,817 — 1,259 43,076
Note: Unaudited. Components may not sum to totals because of rounding.1 Face value, net of unamortized premiums and discounts.2 Guaranteed by Fannie Mae, Freddie Mac, and Ginnie Mae. Current face value of the securities, which is the remaining principal balance of the underlying mortgages, net ofpremiums and discounts. Does not include unsettled transactions.
3 Includes accrued interest. Investments denominated in foreign currencies are revalued daily at market exchange rates.4 Dollar value of foreign currency held under these agreements valued at the exchange rate to be used when the foreign currency is returned to the foreign central bank. Thisexchange rate equals the market exchange rate used when the foreign currency was acquired from the foreign central bank.
5 Cash and short-term investments related to the federal agency and government-sponsored enterprise mortgage-backed securities portfolio.6 Related to the purchases of federal agency and government-sponsored enterprise mortgage-backed securities that the seller fails to deliver the securities on the settlement date.
26 Credit and Liquidity Programs and the Balance Sheet
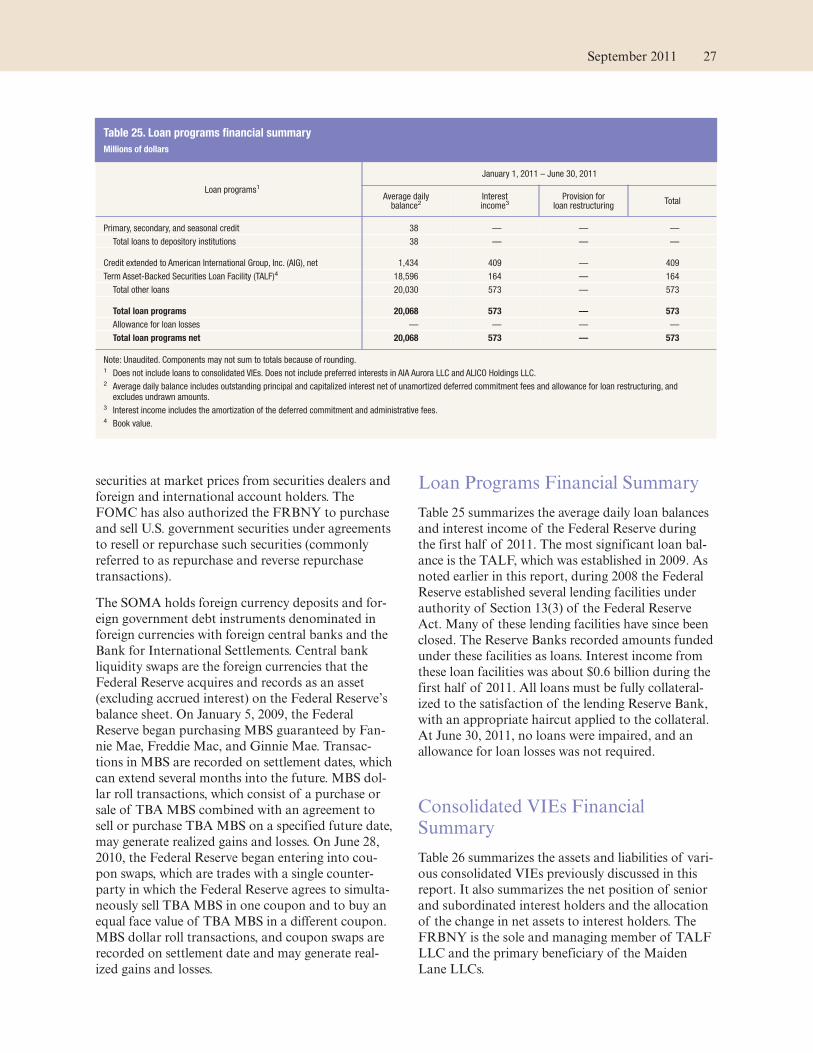
securities at market prices from securities dealers and
foreign and international account holders. The
FOMC has also authorized the FRBNY to purchase
and sell U.S. government securities under agreements
to resell or repurchase such securities (commonly
referred to as repurchase and reverse repurchase
transactions).
The SOMA holds foreign currency deposits and for-
eign government debt instruments denominated in
foreign currencies with foreign central banks and the
Bank for International Settlements. Central bank
liquidity swaps are the foreign currencies that the
Federal Reserve acquires and records as an asset
(excluding accrued interest) on the Federal Reserve’s
balance sheet. On January 5, 2009, the Federal
Reserve began purchasing MBS guaranteed by Fan-
nie Mae, Freddie Mac, and Ginnie Mae. Transac-
tions in MBS are recorded on settlement dates, which
can extend several months into the future. MBS dol-
lar roll transactions, which consist of a purchase or
sale of TBAMBS combined with an agreement to
sell or purchase TBAMBS on a specified future date,
may generate realized gains and losses. On June 28,
2010, the Federal Reserve began entering into cou-
pon swaps, which are trades with a single counter-
party in which the Federal Reserve agrees to simulta-
neously sell TBAMBS in one coupon and to buy an
equal face value of TBAMBS in a different coupon.
MBS dollar roll transactions, and coupon swaps are
recorded on settlement date and may generate real-
ized gains and losses.
Loan Programs Financial Summary
Table 25 summarizes the average daily loan balances
and interest income of the Federal Reserve during
the first half of 2011. The most significant loan bal-
ance is the TALF, which was established in 2009. As
noted earlier in this report, during 2008 the Federal
Reserve established several lending facilities under
authority of Section 13(3) of the Federal Reserve
Act. Many of these lending facilities have since been
closed. The Reserve Banks recorded amounts funded
under these facilities as loans. Interest income from
these loan facilities was about $0.6 billion during the
first half of 2011. All loans must be fully collateral-
ized to the satisfaction of the lending Reserve Bank,
with an appropriate haircut applied to the collateral.
At June 30, 2011, no loans were impaired, and an
allowance for loan losses was not required.
Consolidated VIEs FinancialSummary
Table 26 summarizes the assets and liabilities of vari-
ous consolidated VIEs previously discussed in this
report. It also summarizes the net position of senior
and subordinated interest holders and the allocation
of the change in net assets to interest holders. The
FRBNY is the sole and managing member of TALF
LLC and the primary beneficiary of the Maiden
Lane LLCs.
Table 25. Loan programs financial summary
Millions of dollars
Loan programs1
January 1, 2011 – June 30, 2011
Average dailybalance2
Interestincome3
Provision forloan restructuring
Total
Primary, secondary, and seasonal credit 38 — — —
Total loans to depository institutions 38 — — —
Credit extended to American International Group, Inc. (AIG), net 1,434 409 — 409
Term Asset-Backed Securities Loan Facility (TALF)4 18,596 164 — 164
Total other loans 20,030 573 — 573
Total loan programs 20,068 573 — 573
Allowance for loan losses — — — —
Total loan programs net 20,068 573 — 573
Note: Unaudited. Components may not sum to totals because of rounding.1 Does not include loans to consolidated VIEs. Does not include preferred interests in AIA Aurora LLC and ALICO Holdings LLC.2 Average daily balance includes outstanding principal and capitalized interest net of unamortized deferred commitment fees and allowance for loan restructuring, andexcludes undrawn amounts.
3 Interest income includes the amortization of the deferred commitment and administrative fees.4 Book value.
September 2011 27
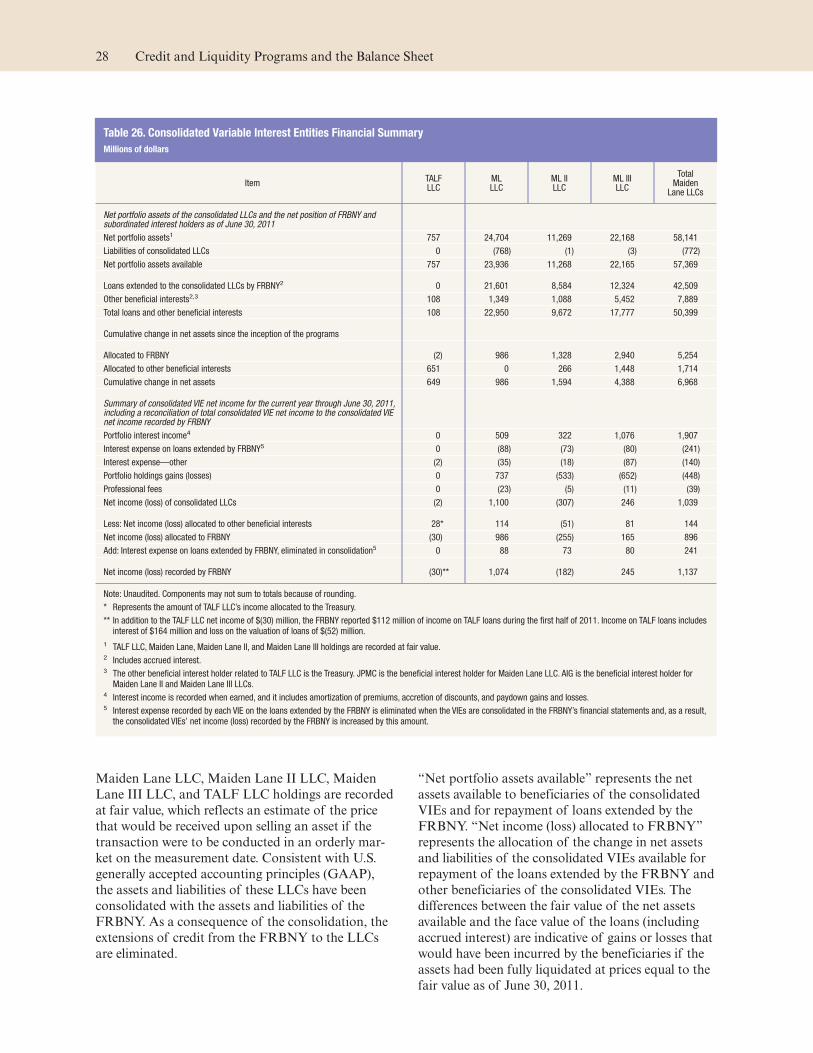
Maiden Lane LLC, Maiden Lane II LLC, Maiden
Lane III LLC, and TALF LLC holdings are recorded
at fair value, which reflects an estimate of the price
that would be received upon selling an asset if the
transaction were to be conducted in an orderly mar-
ket on the measurement date. Consistent with U.S.
generally accepted accounting principles (GAAP),
the assets and liabilities of these LLCs have been
consolidated with the assets and liabilities of the
FRBNY. As a consequence of the consolidation, the
extensions of credit from the FRBNY to the LLCs
are eliminated.
“Net portfolio assets available” represents the net
assets available to beneficiaries of the consolidated
VIEs and for repayment of loans extended by the
FRBNY. “Net income (loss) allocated to FRBNY”
represents the allocation of the change in net assets
and liabilities of the consolidated VIEs available for
repayment of the loans extended by the FRBNY and
other beneficiaries of the consolidated VIEs. The
differences between the fair value of the net assets
available and the face value of the loans (including
accrued interest) are indicative of gains or losses that
would have been incurred by the beneficiaries if the
assets had been fully liquidated at prices equal to the
fair value as of June 30, 2011.
Table 26. Consolidated Variable Interest Entities Financial Summary
Millions of dollars
ItemTALFLLC
MLLLC
ML IILLC
ML IIILLC
TotalMaiden
Lane LLCs
Net portfolio assets of the consolidated LLCs and the net position of FRBNY andsubordinated interest holders as of June 30, 2011
Net portfolio assets1 757 24,704 11,269 22,168 58,141
Liabilities of consolidated LLCs 0 (768) (1) (3) (772)
Net portfolio assets available 757 23,936 11,268 22,165 57,369
Loans extended to the consolidated LLCs by FRBNY2 0 21,601 8,584 12,324 42,509
Other beneficial interests2,3 108 1,349 1,088 5,452 7,889
Total loans and other beneficial interests 108 22,950 9,672 17,777 50,399
Cumulative change in net assets since the inception of the programs
Allocated to FRBNY (2) 986 1,328 2,940 5,254
Allocated to other beneficial interests 651 0 266 1,448 1,714
Cumulative change in net assets 649 986 1,594 4,388 6,968
Summary of consolidated VIE net income for the current year through June 30, 2011,including a reconciliation of total consolidated VIE net income to the consolidated VIEnet income recorded by FRBNY
Portfolio interest income4 0 509 322 1,076 1,907
Interest expense on loans extended by FRBNY5 0 (88) (73) (80) (241)
Interest expense—other (2) (35) (18) (87) (140)
Portfolio holdings gains (losses) 0 737 (533) (652) (448)
Professional fees 0 (23) (5) (11) (39)
Net income (loss) of consolidated LLCs (2) 1,100 (307) 246 1,039
Less: Net income (loss) allocated to other beneficial interests 28* 114 (51) 81 144
Net income (loss) allocated to FRBNY (30) 986 (255) 165 896
Add: Interest expense on loans extended by FRBNY, eliminated in consolidation5 0 88 73 80 241
Net income (loss) recorded by FRBNY (30)** 1,074 (182) 245 1,137
Note: Unaudited. Components may not sum to totals because of rounding.
* Represents the amount of TALF LLC’s income allocated to the Treasury.
** In addition to the TALF LLC net income of $(30) million, the FRBNY reported $112 million of income on TALF loans during the first half of 2011. Income on TALF loans includesinterest of $164 million and loss on the valuation of loans of $(52) million.
1 TALF LLC, Maiden Lane, Maiden Lane II, and Maiden Lane III holdings are recorded at fair value.2 Includes accrued interest.3 The other beneficial interest holder related to TALF LLC is the Treasury. JPMC is the beneficial interest holder for Maiden Lane LLC. AIG is the beneficial interest holder forMaiden Lane II and Maiden Lane III LLCs.
4 Interest income is recorded when earned, and it includes amortization of premiums, accretion of discounts, and paydown gains and losses.5 Interest expense recorded by each VIE on the loans extended by the FRBNY is eliminated when the VIEs are consolidated in the FRBNY’s financial statements and, as a result,the consolidated VIEs’ net income (loss) recorded by the FRBNY is increased by this amount.
28 Credit and Liquidity Programs and the Balance Sheet
Appendix A
Additional Information Provided
Pursuant to Section 129 of the
Emergency Economic Stabilization
Act of 2008
In light of improved functioning of financial mar-
kets, on February 1, 2010, the Federal Reserve closed
the Term Securities Lending Facility (TSLF), Pri-
mary Dealer Credit Facility (PDCF), the Commercial
Paper Funding Facility (CPFF), and the Asset-
Backed Commercial Paper Money Market Mutual
Fund Liquidity Facility (AMLF). As of that date, all
loans under the TSLF, PDCF, and AMLF had been
repaid in full, with interest, in accordance with the
terms of each facility, and each of the facilities
resulted in no loss to the Federal Reserve or taxpay-
ers. All remaining commercial paper holdings of the
CPFF matured on April 26, 2010, and the CPFF
LLC was dissolved on August 30, 2010, following the
payment of expenses and the termination or expira-
tion of existing contractual agreements. The CPFF
did not result in any loss to the Federal Reserve or
taxpayers.
AIG, on September 30, 2010, announced a compre-
hensive recapitalization plan designed to restructure
the assistance provided by the U.S. government to the
company. The company completed the Recapitaliza-
tion on January 14, 2011. At closing of the Recapital-
ization, AIG repaid in full the amount then out-
standing under the revolving credit facility
established by the FRBNY, including all accrued
interest and fees. The FRBNY also received the full
amount, including all accrued dividends, of the SPV
Preferred Interests in AIA Aurora LLC and ALICO
Holdings LLC, two SPVs formed as part of the
March 2009 restructuring of the U.S. government’s
assistance. The FRBNY received the SPV Preferred
Interests as part of the March 2009 restructuring in
exchange for an equivalent reduction of the amount
of debt then outstanding on the revolving credit
facility. As part of the Recapitalization, AIG
redeemed a portion of the FRBNY’s SPV Preferred
Interests with cash proceeds from asset dispositions,
and purchased the remaining SPV Preferred Inter-
ests, valued at approximately $20 billion, from the
FRBNY through a draw on the Treasury’s Series F
preferred stock commitment. AIG then transferred
the SPV Preferred Interests purchased from the
FRBNY to the Treasury as consideration for the
draw on the available Series F funds. At the time of
the closing, the collateral backing the remaining SPV
Preferred Interests received by the Treasury had an
estimated value of more than $25 billion. The revolv-
ing credit facility, and the SPV Preferred Interests
held by the FRBNY in connection with the revolving
credit facility, did not result in any loss to the Federal
Reserve or taxpayers.
For the reasons discussed below, the Board does not
anticipate that the Federal Reserve or taxpayers will
incur any net loss on the loans provided by the
FRBNY under the TALF or to Maiden Lane LLC,
Maiden Lane II LLC, or Maiden Lane III LLC (col-
lectively, the “Maiden Lane facilities”). In making
these assessments, the Board has considered, among
other things, the terms and conditions governing the
relevant facility and the type, nature, and value of the
current collateral or other security arrangements
associated with the facility. As discussed earlier in
this report, the Federal Reserve has established vari-
ous terms and conditions governing the types of col-
lateral that may be pledged in support of a loan
under a facility in order to mitigate the risk of loss.
In the case of the Maiden Lane facilities, the Board
also has considered analyses of the projected returns
on the portfolio holdings of the respective SPV (the
assets of which serve as collateral for the loan(s)
extended to the SPV) conducted by the FRBNY or
its advisors in connection with the most recent quar-
terly revaluation of the assets of each SPV.
TALF
Under the TALF, the FRBNY made loans on a col-
lateralized basis to holders of eligible ABS and
CMBS. The potential for the Federal Reserve or tax-
29
payers to incur any net loss on the TALF loans
extended by the FRBNY to the holders of ABS and
CMBS is mitigated by the quality of the collateral,
the risk assessment performed by the FRBNY on all
pledged collateral, and the margin by which the value
of the collateral exceeds the amount of the loan (the
haircut). Potential losses to the Federal Reserve also
are mitigated by the portion of interest on the TALF
loans to borrowers transferred to TALF LLC and by
the credit protection provided by the Treasury under
the TARP (initially $20 billion and subsequently
reduced to $4.3 billion in light of the $43 billion in
TALF loans outstanding when the TALF closed to
new lending on June 30, 2010), both of which are
available to TALF LLC to purchase any collateral
received by the FRBNY from a borrower in lieu of
repaying a TALF loan or foreclosed upon due to a
default by the borrower. All TALF loans were
extended by the FRBNY and will mature over the
next several years, with all loans maturing no later
than March 30, 2015.
Loans to Maiden Lane LLC, Maiden Lane II
LLC, and Maiden Lane III LLC
The portfolio holdings of each of Maiden Lane LLC
(Maiden Lane), Maiden Lane II LLC (ML II), and
Maiden Lane III LLC (ML III) are revalued in
accordance with GAAP as of the end of each quar-
ter to reflect an estimate of the fair value of the
assets on the measurement date. The fair value deter-
mined through these revaluations may fluctuate over
time. In addition, the fair value of the portfolio hold-
ings that is reported on the weekly H.4.1 statistical
release reflects any accrued interest earnings, princi-
pal repayments, expense payments and, to the extent
any may have occurred since the most recent mea-
surement date, realized gains or losses. The fair values
as of August 31, 2011—as shown in table 1 of this
report and reported in the H.4.1 release for that
date—are based on quarterly revaluations as of June
30, 2011.
Because the collateral assets for the loans to Maiden
Lane, ML II, and ML III are expected to generate
cash proceeds and may be sold over time or held to
maturity, the current reported fair values of the net
portfolio holdings of Maiden Lane, ML II, and
ML III do not reflect the amount of aggregate pro-
ceeds that the Federal Reserve could receive from the
assets of the respective entity over the extended term
of the loan to the entity. The extended terms of the
loans provide an opportunity to dispose of the assets
of each entity in an orderly manner over time and to
collect interest on the assets held by the entity prior
to their sale, other disposition, or maturity. Each of
the loans extended to Maiden Lane, ML II, and
ML III is current under the terms of the relevant
loan agreement.
In addition, JPMorgan Chase will absorb the first
$1.15 billion of realized losses on the assets of
Maiden Lane, should any occur. Similarly, certain
U.S. insurance subsidiaries of AIG have a $1 billion
subordinated position in ML II and an AIG affiliate
has a $5 billion subordinated position in ML III,
which are available to absorb first any loss that ulti-
mately may be incurred by ML II or ML III, respec-
tively. Moreover, under the terms of the agreements,
the FRBNY is entitled to any residual cash flow gen-
erated by the collateral assets held by Maiden Lane
after the loans made by the FRBNY and JPMorgan
Chase are repaid, and five-sixths and two-thirds of
any residual cash flow generated by the assets held by
ML II and ML III, respectively, after the senior note
of the FRBNY and the subordinate positions of
AIG affiliates for these facilities are repaid.
30 Credit and Liquidity Programs and the Balance Sheet
Appendix B
Information about Closed andExpired Credit and LiquidityFacilities and Programs
During the financial crisis that emerged during the
summer of 2007, the Federal Reserve took a number
of important steps aimed at providing liquidity to
important financial markets and institutions to sup-
port overall financial stability. Financial stability is a
critical prerequisite for achieving sustainable eco-
nomic growth, and all of the Federal Reserve’s
actions were directed toward achieving the Federal
Reserve’s statutory monetary policy objectives. Spe-
cifically, the Federal Reserve implemented a number
of programs designed to support the liquidity of
financial institutions and foster improved conditions
in financial markets, and also extended credit to cer-
tain specific institutions and committed to extend
credit to support systemically important financial
firms. Broad-based facilities were open to partici-
pants that met clearly outlined eligibility criteria; par-
ticipation in them reflected the severe market disrup-
tions during the financial crisis and generally did not
reflect participants’ financial weakness.
As financial conditions have improved, the need for
the broad-based facilities has dissipated, and most
were closed in 2010. Specifically, on February 1,
2010, the Federal Reserve closed the AMLF, CPFF,
the PDCF, and the TSLF. On April 26, 2010, all
remaining commercial paper holdings of the CPFF
matured, and the CPFF LLC was dissolved on
August 30, 2010, following the payment of expenses
and the termination or expiration of existing con-
tractual agreements. Also in April 2010, the credit
extended through the last Term Auction Facility
(TAF) auction in March matured, marking the close
of that facility.
The temporary liquidity swap arrangements between
the Federal Reserve and other FCBs also expired on
February 1, 2010. However, the Federal Reserve
re-established temporary liquidity swap arrange-
ments with a group of FCBs in May 2010 and subse-
quently authorized an extension of these arrange-
ments in December 2010, enabling them to offer U.S.
dollar liquidity to financial institutions in their juris-
dictions through August 1, 2011. These arrangements
were subsequently extended through August 1, 2012.
Information related to these arrangements can be
found in the body of this report.
As part of AIG’s Recapitalization plan, completed
on January 14, 2011, AIG fully repaid the amount
outstanding under the revolving credit facility,
including all accrued interest and fees, extended by
the Federal Reserve; the Federal Reserve received the
full amount, including all accrued dividends, of the
preferred interests in AIA Aurora LLC and ALICO
Holdings LLC; and the Federal Reserve’s commit-
ment to lend any further funds to the company was
terminated. Additional information can be found in
the body of this report.
The Federal Reserve followed sound risk-
management practices in administering all of these
programs, incurred no credit losses on programs that
have been wound down, and expects to incur no
credit losses on the few remaining programs. The
Federal Reserve is committed to transparency and
has previously provided extensive aggregate informa-
tion on its liquidity and credit programs in this and
other reports. Background information about the
closed and expired facilities previously included in
this appendix, as well as detailed information on
individual loans under the TAF and PDCF, including
the identities of borrowers and descriptions of
pledged collateral; detailed information on the com-
mercial paper purchased by the CPFF, including the
identities of issuers and the issuers’ parents/sponsors;
detailed information on AMLF loans, including the
identities of money market mutual funds (MMMFs)
that sold asset-backed commercial paper (ABCP)
that was used as AMLF collateral; and information
about the support provided to AIG, Citigroup,
and Bank of America, is now available on the
Federal Reserve’s public website. This detailed
data can be downloaded in multiple formats at
31
www.federalreserve.gov/newsevents/
reform_transaction.htm. Information about the
single-tranche 28-day term repurchase agreements
announced on March 7, 2008, and conducted by the
Federal Reserve between March and December 2008
are available at www.newyorkfed.org/markets/
fast_facts_stomo.html.
Historical data related to these facilities, previously
reported on the H.4.1 statistical release, “Factors
Affecting Reserve Balances of Depository Institu-
tions and Condition Statement of Federal Reserve
Banks,” which includes the weekly publication of the
Federal Reserve’s balance sheet, is available through
the Data Download Program, available at
www.federalreserve.gov/datadownload. The Data
Download Program provides interactive access to
Federal Reserve statistical data in a variety of for-
mats. For prior editions of this report and other
resources, please visit the Board’s public website at
www.federalreserve.gov/monetarypolicy/
clbsreports.htm.
32 Credit and Liquidity Programs and the Balance Sheet
Appendix C
Federal Reserve DisclosureRequirements and Other Provisionsof the Dodd-Frank Wall StreetReform and Consumer ProtectionAct of 2010
On July 21, 2010, the Dodd-Frank Act was signed
into law.6 The Dodd-Frank Act included changes
designed to promote transparency while protecting
monetary policy independence and the efficacy of
the Federal Reserve’s liquidity programs and OMOs.
In addition, the Dodd-Frank Act modified the Fed-
eral Reserve’s authority to provide emergency liquid-
ity to nondepository institutions under Section 13(3)
of the Federal Reserve Act in light of other amend-
ments that provide the U.S. government with new
authority to resolve failing, systemically important
nonbank financial institutions in an orderly manner.
As provided by the Dodd-Frank Act, on December
1, 2010, the Federal Reserve posted to its public web-
site detailed information about entities that received
loans or other financial assistance under a Section
13(3) credit facility between December 1, 2007, and
July 21, 2010, and about persons or entities that par-
ticipated in the agency MBS purchase program, used
foreign currency liquidity swap lines, or borrowed
through the TAF during that time frame. This disclo-
sure includes more than 21,000 individual credit and
other transactions conducted to stabilize markets
during the financial crisis, restore the flow of credit
to American families and businesses, and support
economic recovery and job creation in the aftermath
of the crisis. The Federal Reserve’s disclosure about
these transactions is available at www.federalreserve.gov/
newsevents/reform_transaction.htm.
As required by the Dodd-Frank Act, the Federal
Reserve also posted an audit webpage, available at
www.federalreserve.gov/newsevents/reform_audit.htm.
This page will be updated as reports and other infor-
mation become available.
The Dodd-Frank Act also established a framework
for the delayed disclosure of information on entities
that, after July 21, 2010, received a loan from the dis-
count window under Section 10B of the Federal
Reserve Act or from a Section 13(3) facility, or par-
ticipated in OMO transactions. Generally, this frame-
work requires the Federal Reserve to publicly disclose
certain information about these discount window
borrowers and OMO counterparties approximately
two years after the relevant loan or transaction;
information about borrowers under future Section
13(3) facilities will be disclosed one year after the
authorization for the facility is terminated. Informa-
tion to be disclosed will include the names and identi-
fying details of each borrower or counterparty, the
amount borrowed, the interest rate paid, and infor-
mation identifying the types and amounts of collat-
eral pledged or assets transferred in connection with
the borrowing or transaction.
Going forward, any emergency lending programs and
facilities authorized by the Federal Reserve under
Section 13(3) of the Federal Reserve Act must have
broad-based eligibility, and must be approved by the
Secretary of the Treasury.
6 The full text of the Dodd-Frank Act is available atwww.gpo.gov/fdsys/pkg/BILLS-111hr4173enr/pdf/BILLS-111hr4173enr.pdf.
33


