Embed Size (px)
Citation preview

Fédération Internationale du Béton Proceedings of the 2nd International Congress June 5-8, 2006 – Naples, Italy ID 17-6 Session 17 – Monitoring, maintenance, repair, residual life and failures
Assessment of Load Capacity of Railway RC Slab Spans with Reinforcement Losses Maksymowicz, M. Department of Civil Engineering, University of Minho, Campus de Azurém, 4800 – 053, – Guimarães, Portugal, Tel: +351 253 510 200, Fax: +351 253 510 217, e-mail: [email protected] Bień, J. Department of Civil Engineering, Wrocław University of Technology, Wyb. Wyspiańskiego 27, 50-370 Wrocław, Poland, Tel / Fax: +48 71 320 41 61, e-mail: [email protected] Cruz, P.J.S. Department of Civil Engineering, University of Minho, Campus de Azurém, 4800 – 053, – Guimarães, Portugal, Tel: +351 253 510 200, Fax: +351 253 510 217, e-mail: [email protected] INTRODUCTION In most of countries, about 70 – 80 % of total number of concrete bridges in existing railway infrastructure is single span structures and about 70 – 80 % of slab spans is located on the single track lines. For that reason the solutions presented in this paper supports evaluation of load capacity of single span and single track structures. During years of the bridge constructions operation, many of degradation processes take place. Different damage types can occur [2] and cause decreasing of load capacity. The most frequently damage of RC slabs are losses of reinforcement and concrete. The losses of concrete take place mostly in the tension zone of cross section, especially in the cover of the reinforcement. Only losses of the reinforcement significantly influence on the load capacity and for this reason only this damage kind was taken under consideration. Each railway administration faces the following bridge management problems:
• effective repair or strengthening of damaged structures; • evaluation of acceptable service load; • conditions of bridge replacement.
In order to make rational decisions, a supporting tool is needed. To help in the decision procedures presented DAGA (Damage Assessment Graphical Analyser) software has been developed. This application is a computer-based system supporting assessment of load capacity of RC slab spans taking into account the most frequent damages - losses of reinforcement. This is a tool, which allows making fast decision about the further service, repair, replacement, etc. It also makes budget planning more easy and suitable. Friendly interface (Fig. 1) reduces to the minimum a risk of making any mistakes by the users. The proposed tool is based on results of bridge inspections. This application enables also more precise evaluation of bridge condition based on results of non destructive tests. During the design and implementation of this software, the following requirements were taken into account:
• user-friendly interface as well as very short time required for data input and for problem analysis; • input of the data with the built-in graphical editor; • combination of static and strength analyse; • no need of special training of the users; • possibility of analysis of any combination of reinforcement losses (location, intensity) and – in the
future – combinations also with other damage types; • simultaneous analysis and monitoring of all measures required in bridge management; • possibility of implementation of the presented tool in Bridge Management Systems (BMS) or using
as a special independent application supporting the management process.
Proceedings of the 2nd Congress Session 17
June 5-8, 2006 – Naples, Italy Monitoring, maintenance, repair, residual life and failures
2
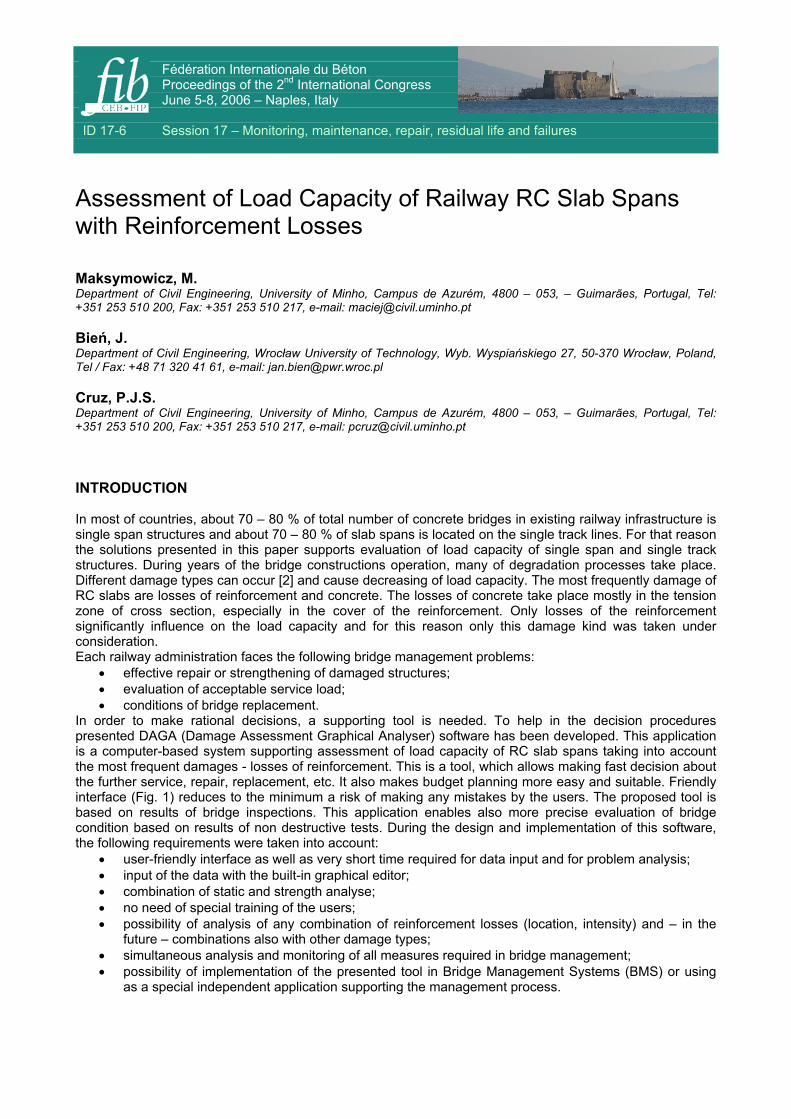
Fig. 1. Main window of DAGA software In the current version of the DAGA software the Polish Standards [3, 4] have been implemented. In further versions of this application analysis based on other codes (e.g. Eurocodes) will be also available. The presented program is being developed within Visual Studio 2003 environment by Visual Basic Net computer language. DAGA software uses the object model of the most frequently used application. There are Microsoft Office v. 2003 and AutoCAD 2000. The further version of this software is going to cooperate also with MicroStation. These applications are very common and for that reason implementation of the DAGA software is very cheap, because most of the design and railway administration offices already have these programs and do not need to buy other tools. The potential users do not need to take any specialist trainings. They need only to know how to use computer on the standard level. To keep the common understanding of the terms being used in this paper the following basic definitions are proposed:
• load capacity of cross section – the biggest value of internal force, which can be safely (and according to the code requirements) transmitted by the analysed cross section of the element; this value is expressed separately for each internal force respectively: for M – bending moment [kNm], for Q – shear forces [kN] etc.;
• load capacity of span (maximum acceptable class of standard service load) – maximum acceptable service load, which can be safely applied for the construction, for example k=+2 (for the railway bridges) or A (for the road bridges) etc.;
• load capacity reserve – value expressed for every cross section by difference SR – SS, where value SR represents actual load capacity of cross section (regarding to the internal force S) and SS – the biggest value of internal force; load capacity is analysed for every internal force separately (bending moment, shearing) and calculated according to the current code;
• damage - effect diminishing of bridge technical condition; • losses - decrease of designed amount of structure material.
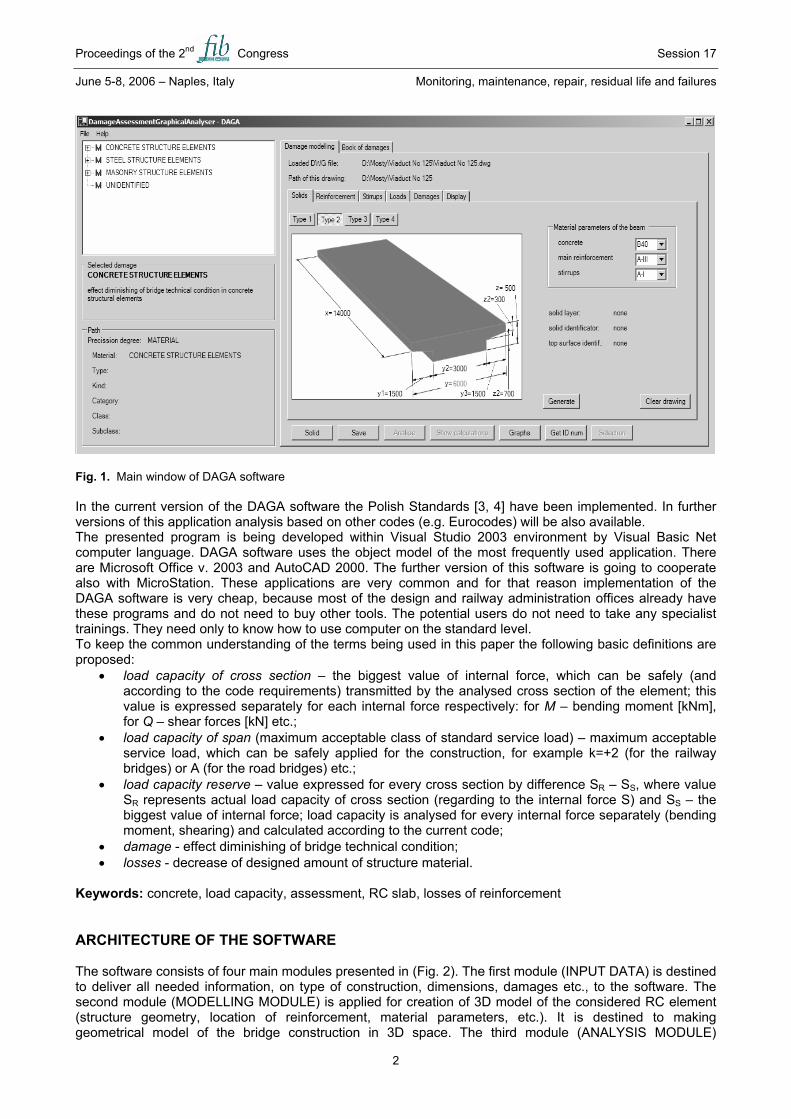
Keywords: concrete, load capacity, assessment, RC slab, losses of reinforcement ARCHITECTURE OF THE SOFTWARE The software consists of four main modules presented in (Fig. 2). The first module (INPUT DATA) is destined to deliver all needed information, on type of construction, dimensions, damages etc., to the software. The second module (MODELLING MODULE) is applied for creation of 3D model of the considered RC element (structure geometry, location of reinforcement, material parameters, etc.). It is destined to making geometrical model of the bridge construction in 3D space. The third module (ANALYSIS MODULE)
Proceedings of the 2nd Congress Session 17
June 5-8, 2006 – Naples, Italy Monitoring, maintenance, repair, residual life and failures
3
processes imported data from the previous one. This part of the software calculates all the coordinates in order to plot graphs supporting evaluation of load capacity. This module presents changes of the load capacity due to damages and evaluation of structure (usefulness for the transportation network) by comparison of current load capacity with load capacity required by various standard loads. The graphical evaluation of condition changes is performed inside the last module (ASSESSMENT MODULE). This part of the application creates information useful in decision process regarding to further service of the bridge. This module plots the graphs, which consist on:
• the envelope of resistance force; • the envelopes of the maximum internal force produced by the total live and dead loads for all
considered load classes.
Fig. 2. Logical scheme of the DAGA program Input data The input data should contain all information needed to building 3D model of the damaged structure. The basic source of information is the technical documentation (calculation and drawings) as well as data stored in the Bridge Management System. From there all dimensions, material properties and other information can be got. Sometimes the mentioned documentation is not completed or does not exist (the old constructions). In these cases the needed information can be collected by measurements and tests during inspections
BRIDGE SPAN
TECHNICAL DOCUMENTATION
INSPECTIONS
STRUCTURE PARAMETERS
DAMAGES
3D MODEL OF DESIGNED STRUCTURE
3D MODEL OF DAMAGED STRUCTURE
ENVELOPE OF DESIGNED LOAD CAPACITY
ENVELOPE OF CURRENT LOAD CAPACITY
EVALUATION OF LOAD CAPACITY CHANGES
INP
UT
DA
TA
MO
DEL
LIN
G
MO
DU
LE
ASSE
SSM
EN
T M
OD
ULE
GRAPHS
ANAL
YSIS
M
OD
ULE
DECISIONS
Proceedings of the 2nd Congress Session 17
June 5-8, 2006 – Naples, Italy Monitoring, maintenance, repair, residual life and failures
4
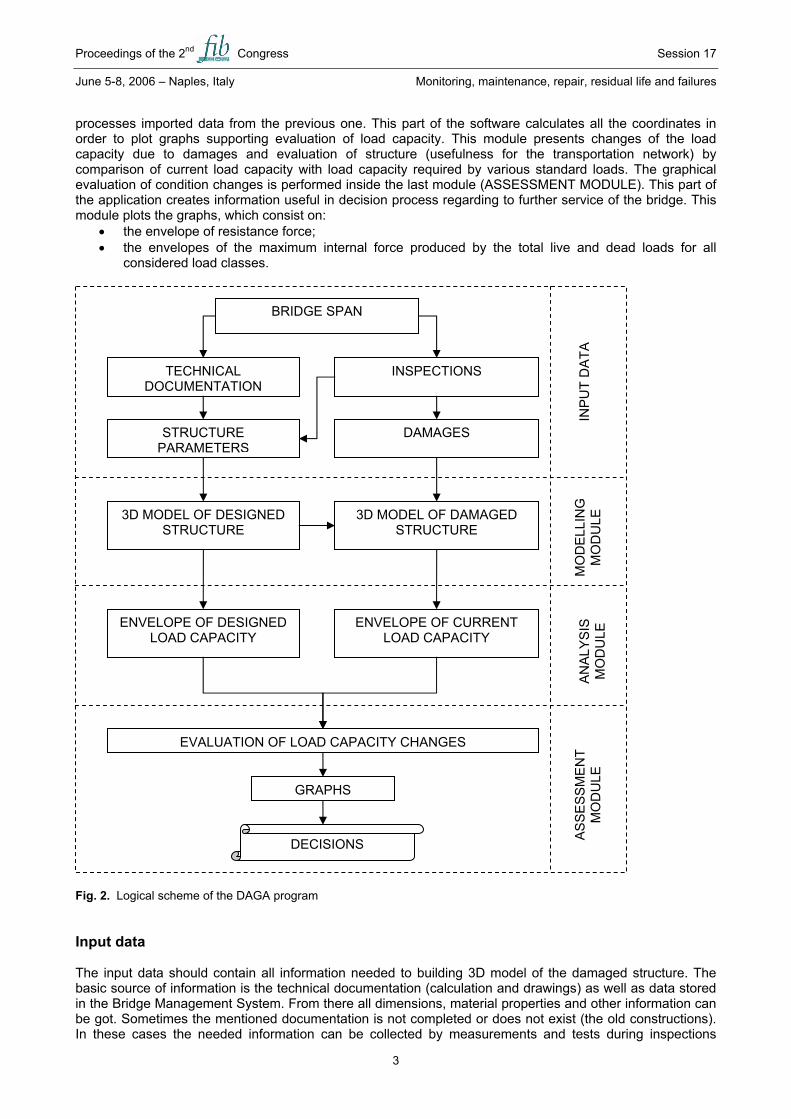
together with informations about damages (location, intensity and extent). In the presented pilot version of the system four types of slab spans are considered (Fig. 3). All dimensions of the structures are editable and should be defined by the user.
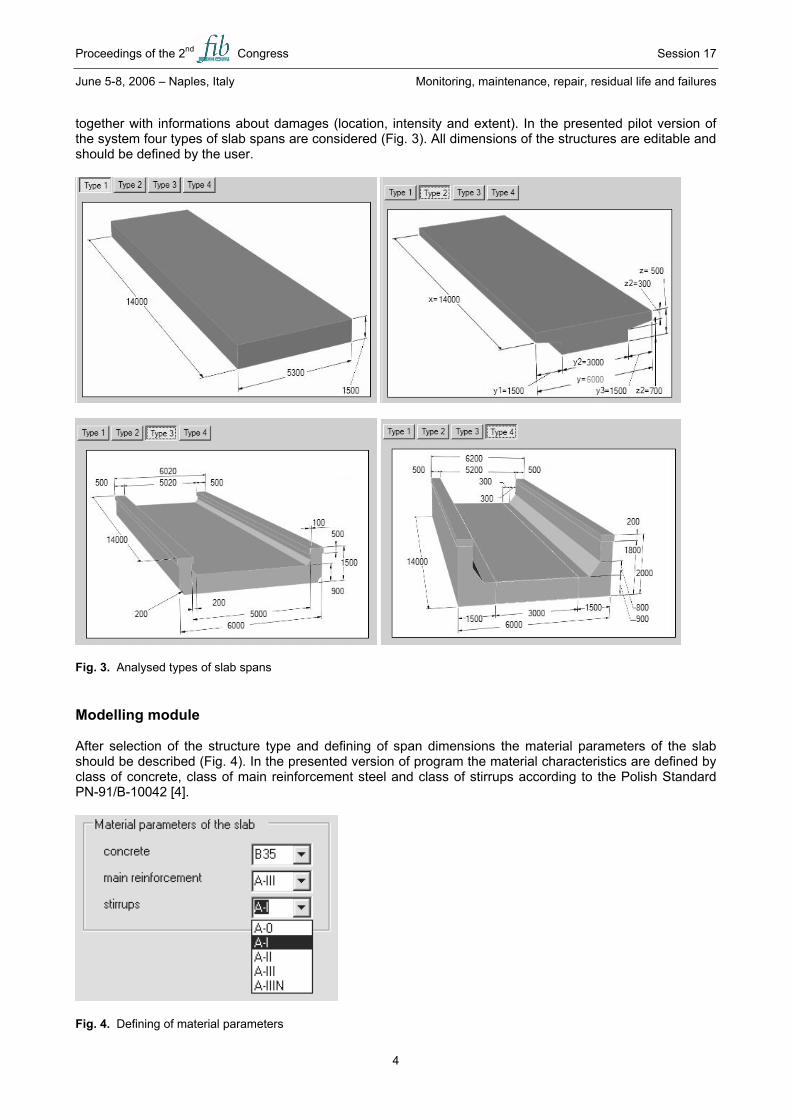
Fig. 3. Analysed types of slab spans Modelling module After selection of the structure type and defining of span dimensions the material parameters of the slab should be described (Fig. 4). In the presented version of program the material characteristics are defined by class of concrete, class of main reinforcement steel and class of stirrups according to the Polish Standard PN-91/B-10042 [4].
Fig. 4. Defining of material parameters
Proceedings of the 2nd Congress Session 17
June 5-8, 2006 – Naples, Italy Monitoring, maintenance, repair, residual life and failures
5
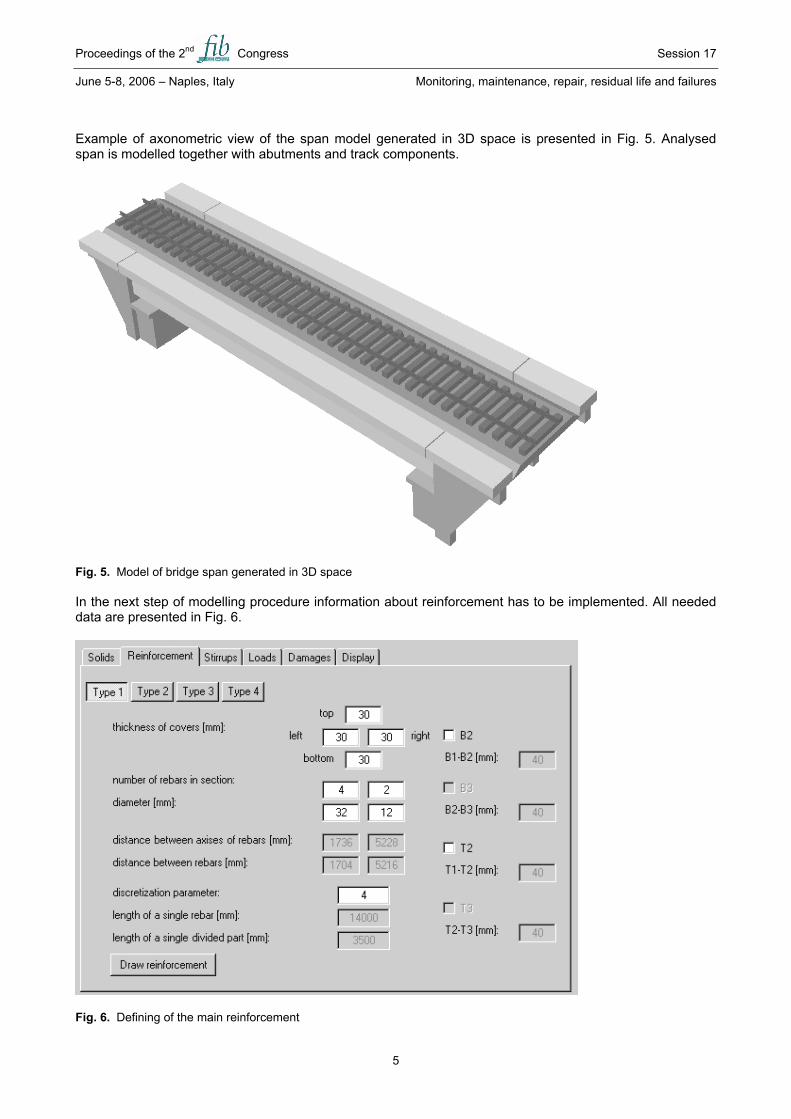
Example of axonometric view of the span model generated in 3D space is presented in Fig. 5. Analysed span is modelled together with abutments and track components.
Fig. 5. Model of bridge span generated in 3D space In the next step of modelling procedure information about reinforcement has to be implemented. All needed data are presented in Fig. 6.
Fig. 6. Defining of the main reinforcement
Proceedings of the 2nd Congress Session 17
June 5-8, 2006 – Naples, Italy Monitoring, maintenance, repair, residual life and failures
6
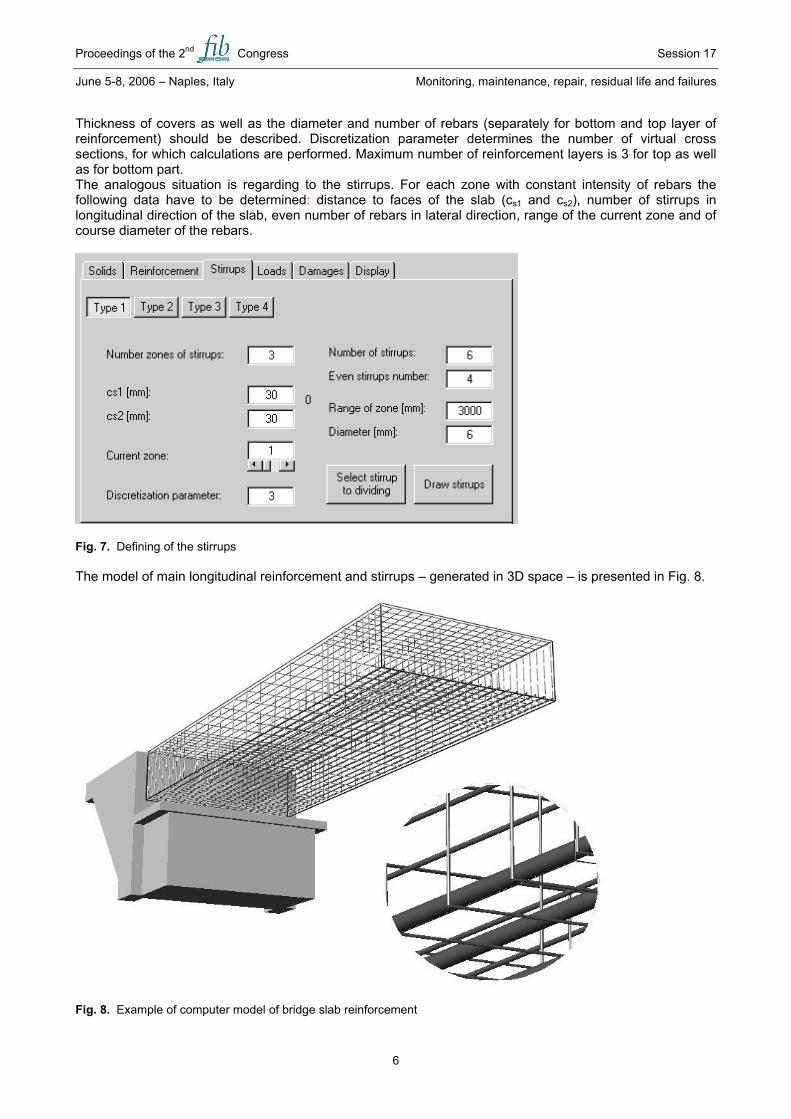
Thickness of covers as well as the diameter and number of rebars (separately for bottom and top layer of reinforcement) should be described. Discretization parameter determines the number of virtual cross sections, for which calculations are performed. Maximum number of reinforcement layers is 3 for top as well as for bottom part. The analogous situation is regarding to the stirrups. For each zone with constant intensity of rebars the following data have to be determined: distance to faces of the slab (cs1 and cs2), number of stirrups in longitudinal direction of the slab, even number of rebars in lateral direction, range of the current zone and of course diameter of the rebars.
Fig. 7. Defining of the stirrups The model of main longitudinal reinforcement and stirrups – generated in 3D space – is presented in Fig. 8.
Fig. 8. Example of computer model of bridge slab reinforcement
Proceedings of the 2nd Congress Session 17
June 5-8, 2006 – Naples, Italy Monitoring, maintenance, repair, residual life and failures
7
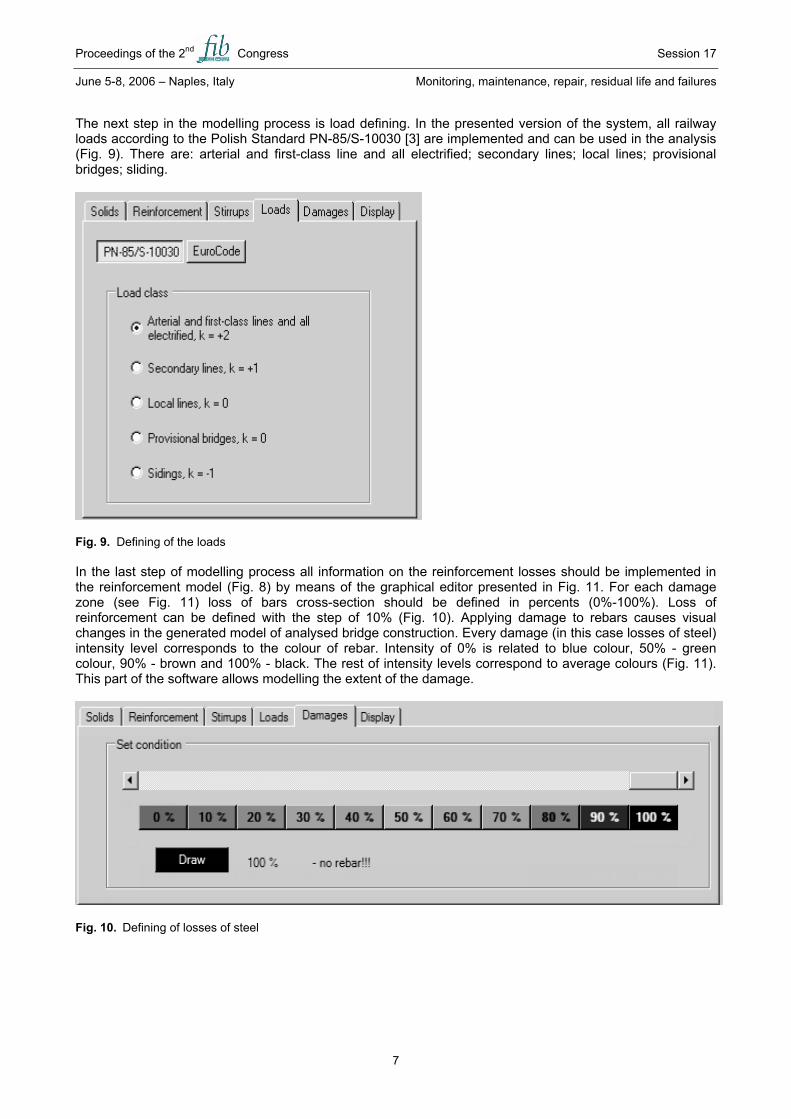
The next step in the modelling process is load defining. In the presented version of the system, all railway loads according to the Polish Standard PN-85/S-10030 [3] are implemented and can be used in the analysis (Fig. 9). There are: arterial and first-class line and all electrified; secondary lines; local lines; provisional bridges; sliding.
Fig. 9. Defining of the loads In the last step of modelling process all information on the reinforcement losses should be implemented in the reinforcement model (Fig. 8) by means of the graphical editor presented in Fig. 11. For each damage zone (see Fig. 11) loss of bars cross-section should be defined in percents (0%-100%). Loss of reinforcement can be defined with the step of 10% (Fig. 10). Applying damage to rebars causes visual changes in the generated model of analysed bridge construction. Every damage (in this case losses of steel) intensity level corresponds to the colour of rebar. Intensity of 0% is related to blue colour, 50% - green colour, 90% - brown and 100% - black. The rest of intensity levels correspond to average colours (Fig. 11). This part of the software allows modelling the extent of the damage.
Fig. 10. Defining of losses of steel
Proceedings of the 2nd Congress Session 17
June 5-8, 2006 – Naples, Italy Monitoring, maintenance, repair, residual life and failures
8
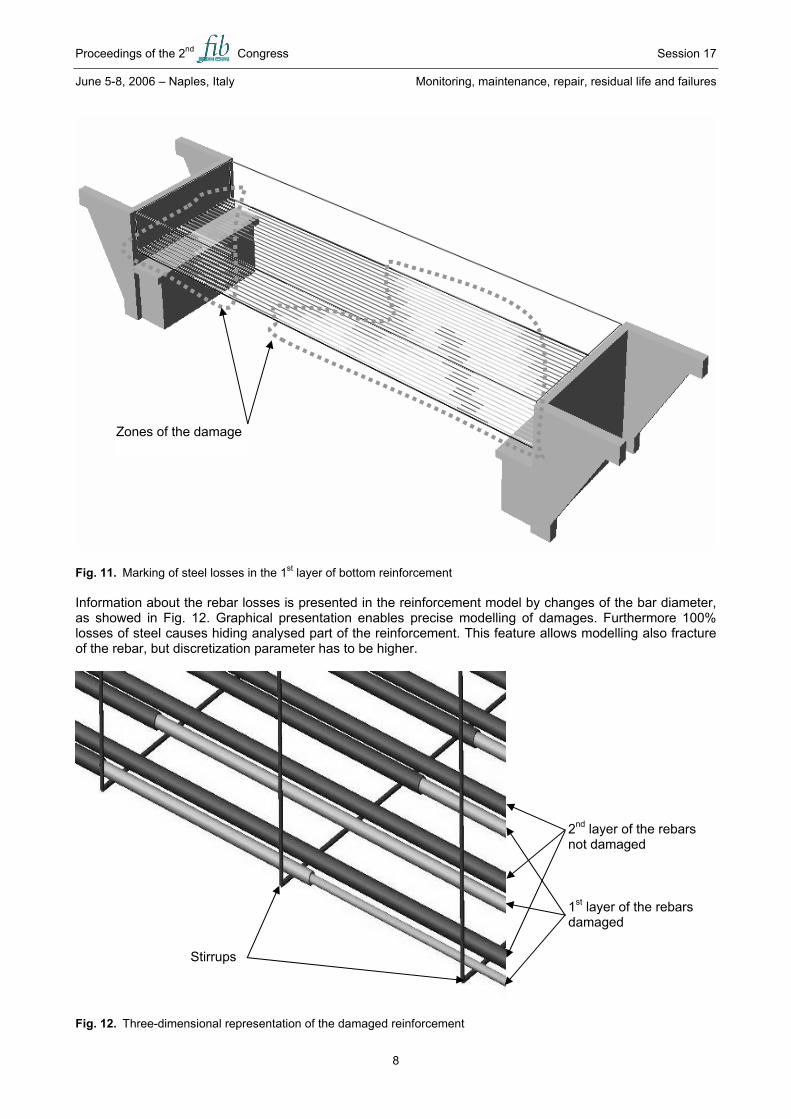
Fig. 11. Marking of steel losses in the 1st layer of bottom reinforcement Information about the rebar losses is presented in the reinforcement model by changes of the bar diameter, as showed in Fig. 12. Graphical presentation enables precise modelling of damages. Furthermore 100% losses of steel causes hiding analysed part of the reinforcement. This feature allows modelling also fracture of the rebar, but discretization parameter has to be higher.
Fig. 12. Three-dimensional representation of the damaged reinforcement
Zones of the damage
Stirrups
1st layer of the rebars damaged
2nd layer of the rebars not damaged
Proceedings of the 2nd Congress Session 17
June 5-8, 2006 – Naples, Italy Monitoring, maintenance, repair, residual life and failures
9
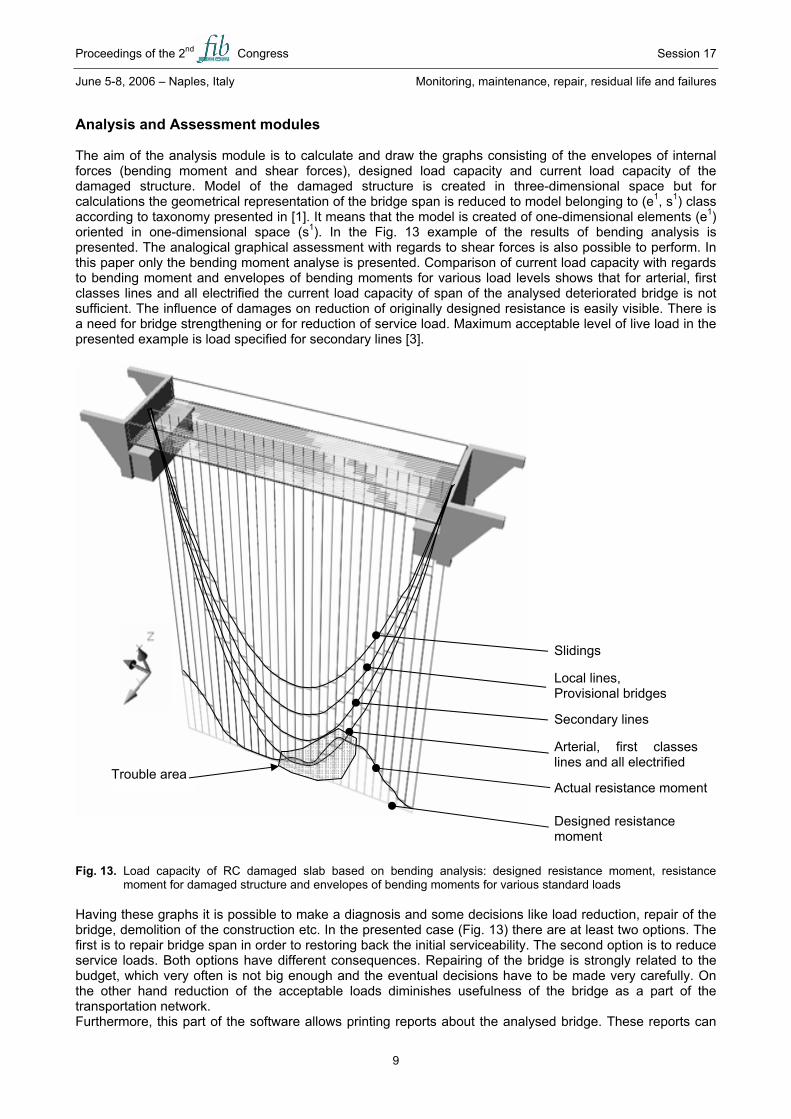
Analysis and Assessment modules The aim of the analysis module is to calculate and draw the graphs consisting of the envelopes of internal forces (bending moment and shear forces), designed load capacity and current load capacity of the damaged structure. Model of the damaged structure is created in three-dimensional space but for calculations the geometrical representation of the bridge span is reduced to model belonging to (e1, s1) class according to taxonomy presented in [1]. It means that the model is created of one-dimensional elements (e1) oriented in one-dimensional space (s1). In the Fig. 13 example of the results of bending analysis is presented. The analogical graphical assessment with regards to shear forces is also possible to perform. In this paper only the bending moment analyse is presented. Comparison of current load capacity with regards to bending moment and envelopes of bending moments for various load levels shows that for arterial, first classes lines and all electrified the current load capacity of span of the analysed deteriorated bridge is not sufficient. The influence of damages on reduction of originally designed resistance is easily visible. There is a need for bridge strengthening or for reduction of service load. Maximum acceptable level of live load in the presented example is load specified for secondary lines [3].
Fig. 13. Load capacity of RC damaged slab based on bending analysis: designed resistance moment, resistance
moment for damaged structure and envelopes of bending moments for various standard loads Having these graphs it is possible to make a diagnosis and some decisions like load reduction, repair of the bridge, demolition of the construction etc. In the presented case (Fig. 13) there are at least two options. The first is to repair bridge span in order to restoring back the initial serviceability. The second option is to reduce service loads. Both options have different consequences. Repairing of the bridge is strongly related to the budget, which very often is not big enough and the eventual decisions have to be made very carefully. On the other hand reduction of the acceptable loads diminishes usefulness of the bridge as a part of the transportation network. Furthermore, this part of the software allows printing reports about the analysed bridge. These reports can
Secondary lines
Arterial, first classes lines and all electrified
Slidings
Local lines, Provisional bridges
Actual resistance moment Trouble area
Designed resistance moment
Proceedings of the 2nd Congress Session 17
June 5-8, 2006 – Naples, Italy Monitoring, maintenance, repair, residual life and failures
10
be used by the railway administration in order to making formal decisions about the bridge and collecting documentation as a part of the bridge history. Generated by means of the DAGA software documentation contains the following informations:
• data of building; • identification of the railway (for example Line No 153, km 348+945); • short description about the obstacle (river Ave, its depth etc.); • static system of the bridge (for instance simply supported beam); • type of the cross section (for instance rectangular); • information about materials; • additional information.
Informations about performed investigations are also presented in the final report generated by the presented computer system. CONCLUSIONS Presented DAGA system enables fast and precise analysis of load capacity of railway RC slab spans taking into account losses of structure reinforcement. Thanks to user-friendly interface and simple graphical editor the program can be used on intuitive way. Applied three-dimensional model of analysed structure and precise model of reinforcement losses can be also used for monitoring of deterioration process. The system does not require user training in modelling, analysis and strength evaluation of damaged RC constructions. This application has several possibilities of the expansion and the developing. In the further version of DAGA the following new elements are planned:
• other types of theoretical models applied in structure analysis, e.g. representing classes (e1, s2) and (e2, s2) [1];
• multi-track bridges constructions; • various types of damages; • other load and design codes; • other static systems of considered bridge spans e.g. hyper-static construction systems; • other methods of strength evaluation.
The DAGA application can be used on every level of infrastructure bridge management. Only standard computer environment is required. The programme makes possible the quick processing of data and immediate results delivering. ACKNOWLEDGEMENTS The proposed methodology was partly developed in the Integrated Project “Sustainable Bridges – Assessment for Future Traffic Demands and Longer Lives”, contract No TIP3-CT-2003-001653, a part of 6. Framework Programme of European Union, for which the authors thank very much. Authors thank also REFER (Portuguese railway administration) and PKP (Polish railway administration) for information and materials used during preparation of this paper. REFERENCES 1. Bień J., Modelling of Bridge During Operation Process, Publishing House of the Wroclaw University of
Technology, Wrocław, Poland, 2002 (in Polish). 2. Bień J., Kmita Cruz P.J.S., Maksymowicz M., Unified classification of damages of railway concrete
bridges, V-th Scientific-Technical Conference – “Design, construction and maintenance problems of short and medium span bridges”, Wrocław 2004, p. 31-40 (in Polish).
3. PN-85/B-10030, Bridges, Loads (in Polish). 4. PN-91/B-10042, Bridges, Concrete, reinforced concrete and prestressed concrete structures, Design (in
Polish).