Embed Size (px)
Citation preview
Federal Trade Commission
Cigarette Report
for 2013
ISSUED: 2016
1
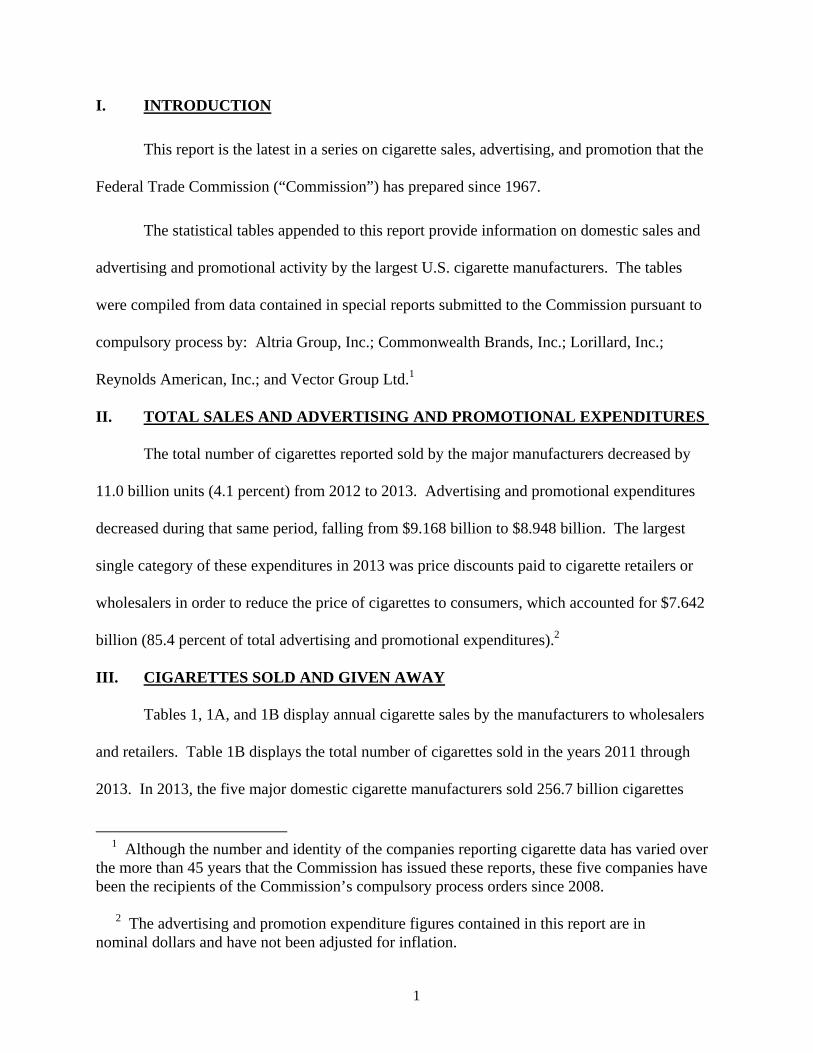
I. INTRODUCTION
This report is the latest in a series on cigarette sales, advertising, and promotion that the
Federal Trade Commission (“Commission”) has prepared since 1967.
The statistical tables appended to this report provide information on domestic sales and
advertising and promotional activity by the largest U.S. cigarette manufacturers. The tables
were compiled from data contained in special reports submitted to the Commission pursuant to
compulsory process by: Altria Group, Inc.; Commonwealth Brands, Inc.; Lorillard, Inc.;
Reynolds American, Inc.; and Vector Group Ltd.1
II. TOTAL SALES AND ADVERTISING AND PROMOTIONAL EXPENDITURES
The total number of cigarettes reported sold by the major manufacturers decreased by
11.0 billion units (4.1 percent) from 2012 to 2013. Advertising and promotional expenditures
decreased during that same period, falling from $9.168 billion to $8.948 billion. The largest
single category of these expenditures in 2013 was price discounts paid to cigarette retailers or
wholesalers in order to reduce the price of cigarettes to consumers, which accounted for $7.642
billion (85.4 percent of total advertising and promotional expenditures).2
III. CIGARETTES SOLD AND GIVEN AWAY
Tables 1, 1A, and 1B display annual cigarette sales by the manufacturers to wholesalers
and retailers. Table 1B displays the total number of cigarettes sold in the years 2011 through
2013. In 2013, the five major domestic cigarette manufacturers sold 256.7 billion cigarettes
1 Although the number and identity of the companies reporting cigarette data has varied over the more than 45 years that the Commission has issued these reports, these five companies have been the recipients of the Commission’s compulsory process orders since 2008. 2 The advertising and promotion expenditure figures contained in this report are in nominal dollars and have not been adjusted for inflation.
2
domestically, down from 267.7 billion in 2012. The Commission is not reporting the number of
cigarettes given away3 in 2013, because – as in 2011 and 2012 – only one company reported
such giveaways.4
IV. ADVERTISING AND PROMOTIONAL EXPENDITURES BY CATEGORY
Tables 2 through 2E show the amounts spent on cigarette advertising and promotion for
the years 1970, and 1975 through 2013.5 These tables list the amounts spent on the different
types of media advertising (e.g., magazines) and sales promotion activities (e.g., distribution of
cigarette samples), and also give the percentage of the total amount spent for the various types of
advertising and promotion.
Table 2E shows that overall, the major manufacturers spent $8.948 billion on cigarette
advertising and promotion in 2013, a decrease from the $9.168 billion spent in 2012.6
The companies reported spending $50.6 million on magazine advertising in 2013, an
3 Cigarettes given away include all cigarettes distributed for free, whether through sampling, coupons for free product, “buy 3 packs, get 1 free” type offers, or otherwise, as long as those cigarettes were not reported as sold. For years prior to 2001, the Commission required the manufacturers to report the number of cigarettes they sold but not the number they gave away. It is possible that in those earlier years, some manufacturers included in their sales figures some cigarettes that were actually given away. 4 Because only one company reported giveaways the Commission does not report the number of cigarettes given away in order to avoid potential disclosure of individual company data.
5 The reported figures include all advertising and promotional expenditures related to cigarettes, regardless of whether such expenditures would constitute “commercial speech” or would be protected from law enforcement action under the First Amendment.
6 Definitions of the advertising and promotional expenditure categories appear in the Appendix to this report. If only one company reported spending money on a particular type of advertising or promotion, that category appears as “N/A” on Tables 2D and 2E and the expenditures are included in the “All Others” category, to avoid potential disclosure of individual company data. For this reason, the Commission is not separately reporting the amounts spent in 2013 on newspapers, sampling, telephone advertising, or Internet advertising, other than on a company’s own web site.
3
increase from the $27.9 million they spent in 2012. The Commission is not reporting the amount
spent on newspaper advertising.
Spending on “outdoor” advertising increased slightly from $2.2 million in 2012 to $2.3
million in 2013. Since 2002, “outdoor” advertising has been defined to mean billboards; signs and
placards in arenas, stadiums, and shopping malls (whether they are open air or enclosed); and any
other advertisements placed outdoors, regardless of their size, including those on cigarette retailer
property. Before 2002, “outdoor” advertising was not precisely defined and it was not clear that
signs in arenas, stadiums, shopping malls, or on retailer property would have been reported in this
category.
As they have since 2001, the companies reported no expenditures on transit advertising (i.e.,
advertising in or on private or public vehicles or any transportation facility) in 2013.
Spending on point-of-sale materials (ads posted at the retail location but excluding outdoor
ads on retailer property) declined from $67.9 million in 2012 to $55.7 million in 2013.
Since 2002, the “promotional allowance” category has been replaced by four separate
categories: price discounts, promotional allowances paid to retailers, promotional allowances paid
to wholesalers, and other promotional allowances. As noted above, the largest of these categories
was price discounts paid to cigarette retailers or wholesalers in order to reduce the price of
cigarettes to consumers (e.g., off-invoice discounts, buy downs, and voluntary price reductions),
which accounted for expenditures of $7.642 billion in 2013 (down from $7.802 billion in 2012). In
addition, the industry spent $291.3 million in 2013 (down from $335.1 million in 2012) on
promotional allowances paid to cigarette retailers in order to facilitate the sale or placement of
cigarettes (e.g., payments for stocking, shelving, displaying, and merchandising brands, volume
rebates, and incentive payments); $397.2 million (up from $391.1 million) on promotional
4
allowances paid to cigarette wholesalers (e.g., payments for volume rebates, incentive payments,
value-added services, and promotional executions); and $548,000 on promotional allowances paid
to persons other than retailers and wholesalers.7 When these four promotional allowance categories
are combined, they total $8.332 billion, and account for 93.1 percent of all 2013 spending.
The Commission is not separately reporting the amount spent in 2013 giving cigarette
samples to the public (“sampling distribution”) because only one company reported spending in that
category. “Sampling” includes the distribution of cigarettes for consumer testing or evaluation
outside the company’s facility, and the distribution of coupons for free cigarettes when no purchase
or payment is required to obtain the coupons or cigarettes.
In 2013, $3.0 million was spent on branded specialty item distribution through the mail, at
promotional events, or by any means other than at the point-of-sale with the purchase of cigarettes;
$29.5 million was spent distributing non-branded, non-cigarette items in connection with the
marketing or promotion of cigarettes.8 In 2012, those figures had been $1.7 million and $26.1
million, respectively.
Expenditures for the adult-only public entertainment category declined from $113.6 million
in 2012 to $104.6 million in 2013. This category includes public entertainment events that take
place in an adult-only facility (e.g., sponsorship of bar nights or concerts) and display the name or
logo of a company’s cigarettes or otherwise refer to cigarettes. The companies reported no 2013
expenditures on public entertainment events in non-adult-only facilities that display the name or
7 The Commission is not separately reporting the amount spent in 2012 on promotional allowances paid to persons other than retailers and wholesalers because only one company reported spending in that category. 8 Specialty item distribution includes the practice of selling or giving to consumers non-cigarette items, such as T-shirts, caps, sunglasses, key chains, lighters, and sporting goods.
5
logo of a company’s cigarettes or otherwise refer or relate to cigarettes.
All reporting companies stated that in 2013 they spent no money on sponsorships,
endorsements and testimonials, or on audio-visual advertising. For 2012, they reported no spending
on sponsorships and the Commission did not separately report the amounts spent on endorsements
and testimonials or audio-visual advertising.
The companies reported spending $38.3 million for direct mail advertising in 2013, down
from $45.6 million in 2012.9
The industry reported spending $248.8 million on coupons to reduce the retail cost of
cigarettes in 2013 (an increase from the $239.6 million reported in 2012).10
Retail-value-added expenditures are the costs associated with offers such as “buy one, get
one free” and “buy three, get a free T-shirt,” where the bonus item is distributed at retail when the
cigarettes are purchased. As they had in 2012, the companies reported spending no money on either
category of retail-value-added in 2013.
In 2013, the companies reported spending $15.4 million on advertising on company
websites, down from the $21.4 million they reported in 2012. The Commission is not separately
reporting the amount spent in 2013 on Internet advertising other than company websites because
only one company reported spending in that category.
The companies reported no spending in 2013 on “social media marketing on Web sites or
other online services or communities, including but not limited to social networking sites,
microblogging sites, content-sharing sites, and blogs,” just as they have each year since the
9 This category does not include direct mail containing coupons, which is reported in the coupons category.
10 As noted above, when coupons are distributed for free cigarettes and no purchase is required to redeem them, such activities are reported as “sampling,” not as “coupons.”
6
Commission started requesting these data.
The Commission requires the cigarette manufacturers to report the amounts they spent
advertising and promoting sports and sporting events.11 This question is separate from, and
duplicative of, the reporting of the individual various advertising and promotion categories. For
example, money spent on a magazine advertisement promoting a cigarette-branded sports
tournament open to those of all ages would be reported under the category “general-audience public
entertainment” and would also be reported as an expenditure on “sports and sporting events.” As
they have each year since 2010, the companies reported that they did not spend any money on
sports and sporting events in 2013.
Since 2001, the Commission has required the manufacturers to report expenditures on
advertisements directed to youth or their parents that are intended to reduce youth smoking. The
companies reported spending $1.9 million in 2013.12 Over the previous seven years, they had
reported expenditures of $57.7 million (2006), $20.7 million (2007), $11.5 million (2008), $8.1
million (2009), and $4.4 million (2010), $2.9 million (2011), and $2.2 million (2012). These
figures do not include contributions to third parties that engage in such programs.
11 This includes expenditures for: (1) the sponsoring, advertising, or promotion of sports or sporting events; support of an individual, group, or sports team; and purchase of or support for equipment, uniforms, sports facilities, and/or training facilities; (2) all expenditures for advertising in the name of the cigarette company or any of its brands in a sports facility, on a scoreboard, or in conjunction with the reporting of sports results; and (3) all expenditures for functional promotional items (clothing, hats, etc.) connected with a sporting event.
12 These expenditures are not included in the $8.948 billion reported in Table 2E (cigarette expenditures by category for 2013).
Cigarette manufacturers reported that neither they nor anyone working for them or on their
behalf paid money or any other form of compensation in connection with the production or filming
of any motion picture or television show in 2013, or paid money or any other form of compensation
7
to anyone engaged in product placement in motion pictures or television shows. The companies
also reported that neither they nor anyone working for them or on their behalf: (1) sought, solicited,
granted approval, or otherwise gave permission for the appearance of any cigarette product or
cigarette brand imagery in any motion picture, television show, or video appearing on the Internet,
or (2) engaged in social media marketing that promoted any cigarette brand or variety or used
cigarette brand imagery. One company did report having video advertising on a website restricted
to age-verified smokers 21 or older and allowing the posting of user-generated content on that
restricted website.
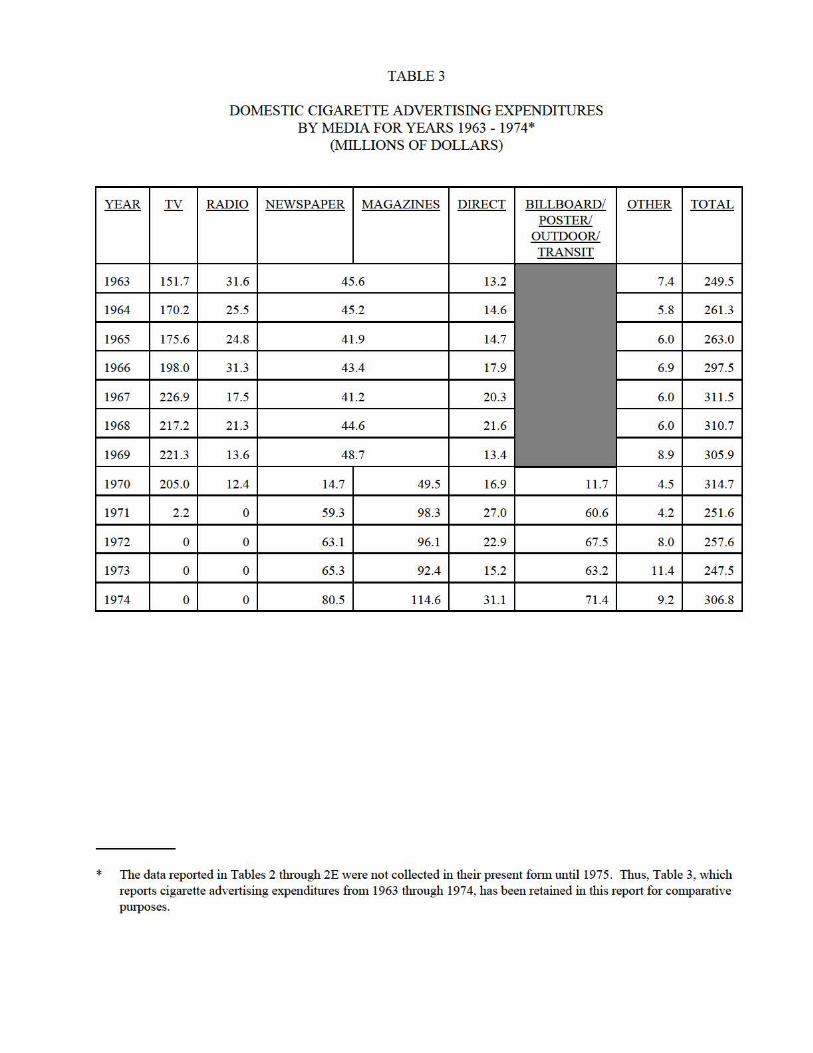
The expenditure data reported in Tables 2 through 2E were not collected in their present
form until 1975. Therefore, Table 3 reports advertising expenditures from 1963 through 1974.
V. TAR RATINGS, FILTERS, LENGTH, AND FLAVOR
Tables 4 and 4A give the domestic market share of cigarettes with tar ratings of 15 mg or
less for the years 1967 through 2013. The data for the years since 1982 are further broken down
into sub-categories according to tar ratings, e.g., 3 mg or less, 6 mg or less, etc. (categories are
presented cumulatively).
The tar yield data reported to the Commission appear to show decreases from 2012 to 2013
in the market share of cigarettes with tar yields of 3 mg or less, 6 mg or less, 9 mg or less, 12 mg or
less, and 15 mg or less. The Commission notes, however, that its compulsory process orders
requesting data for 2011 through 2013 have required the companies only to report tar, nicotine, and
carbon monoxide data that they have available; they were not required to conduct additional testing.
Consequently, market share comparisons within these years or to previous years may no longer be
possible.
As shown in Tables 5 and 5A, filtered cigarettes have dominated the market since the
8
Commission began collecting this information in 1963. Filtered cigarettes account for 99.7 percent
of the market in 2013.
Table 6 provides the market share of the various cigarette length categories. The King size
(79-88 mm) category continues to be the biggest seller, with 57 percent of the market in 2013. This
category is followed by the Long (94-101 mm) group, with 39 percent of the market.
Tables 7 and 7A give the market share of menthol and non-menthol cigarettes. In 2013,
menthol cigarettes were 31 percent of the market, while non-menthols were 69 percent.
Table 8 shows the percentage of cigarettes that disclosed both tar and nicotine yields on their
packs during the years 1994 through 2001; Table 8A shows the percentage that disclosed tar yields
from 2002 to 2011. In 2013, as in every year since 2008, 0.0% of the overall cigarette market
disclosed tar yields on the pack. Therefore, as the Commission first noted in its Cigarette Report for
2011, Table 8A will not be updated unless and until the companies resume printing tar yields on
their product packaging.
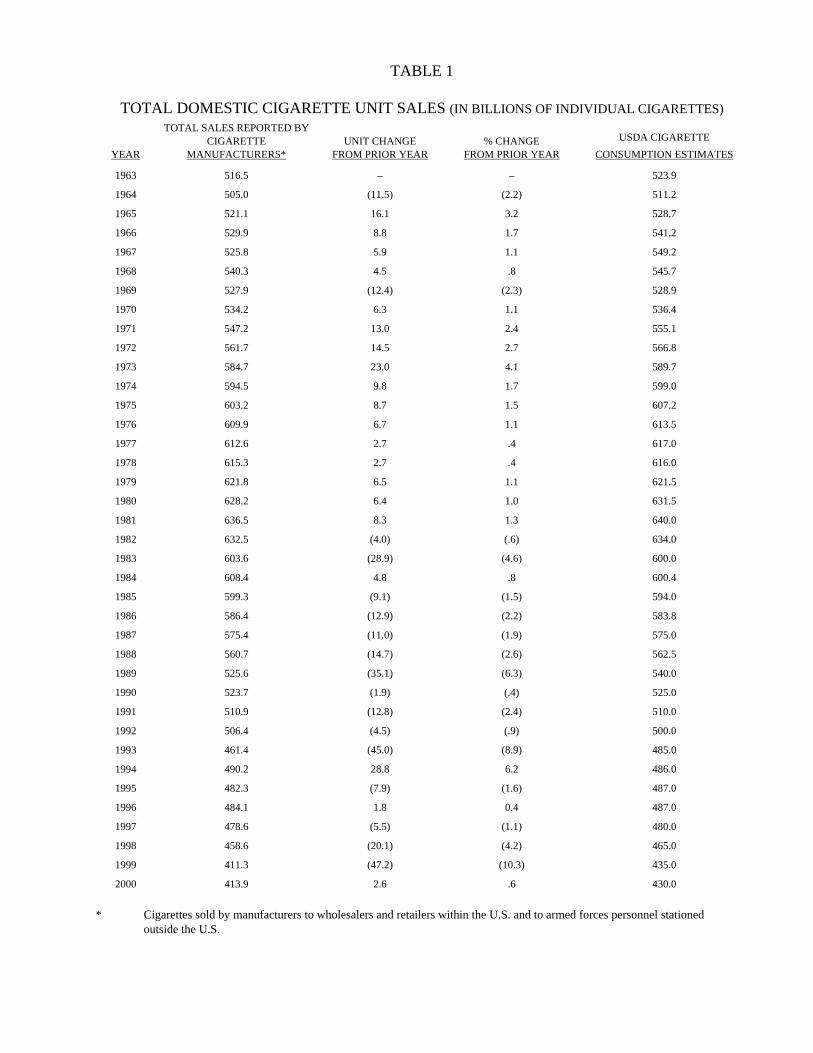
TABLE 1
TOTAL DOMESTIC CIGARETTE UNIT SALES (IN BILLIONS OF INDIVIDUAL CIGARETTES)
YEAR
TOTAL SALES REPORTED BY CIGARETTE
MANUFACTURERS* UNIT CHANGE
FROM PRIOR YEAR
% CHANGE
FROM PRIOR YEAR
USDA CIGARETTE
CONSUMPTION ESTIMATES
1963
516.5
– –
523.9
1964
505.0
(11.5) (2.2)
511.2
1965
521.1
16.1 3.2
528.7
1966
529.9
8.8 1.7
541.2
1967
525.8
5.9 1.1
549.2
1968
540.3
4.5 .8
545.7
1969
527.9
(12.4) (2.3)
528.9
1970
534.2
6.3 1.1
536.4
1971
547.2
13.0 2.4
555.1
1972
561.7
14.5 2.7
566.8
1973
584.7
23.0 4.1
589.7
1974
594.5
9.8 1.7
599.0
1975
603.2
8.7 1.5
607.2
1976
609.9
6.7 1.1
613.5
1977
612.6
2.7 .4
617.0
1978
615.3
2.7 .4
616.0
1979
621.8
6.5 1.1
621.5
1980
628.2
6.4 1.0
631.5
1981
636.5
8.3 1.3
640.0
1982
632.5
(4.0) (.6)
634.0
1983
603.6
(28.9) (4.6)
600.0
1984
608.4
4.8 .8
600.4
1985
599.3
(9.1) (1.5)
594.0
1986
586.4
(12.9) (2.2)
583.8
1987
575.4
(11.0) (1.9)
575.0
1988
560.7
(14.7) (2.6)
562.5
1989
525.6
(35.1) (6.3)
540.0
1990
523.7
(1.9) (.4)
525.0
1991
510.9
(12.8) (2.4)
510.0
1992
506.4
(4.5) (.9)
500.0
1993
461.4
(45.0) (8.9)
485.0
1994
490.2
28.8 6.2
486.0
1995
482.3
(7.9) (1.6)
487.0
1996
484.1
1.8 0.4
487.0
1997
478.6
(5.5) (1.1)
480.0
1998
458.6
(20.1) (4.2)
465.0
1999
411.3
(47.2) (10.3)
435.0
2000
413.9
2.6 .6
430.0
* Cigarettes sold by manufacturers to wholesalers and retailers within the U.S. and to armed forces personnel stationed
outside the U.S.
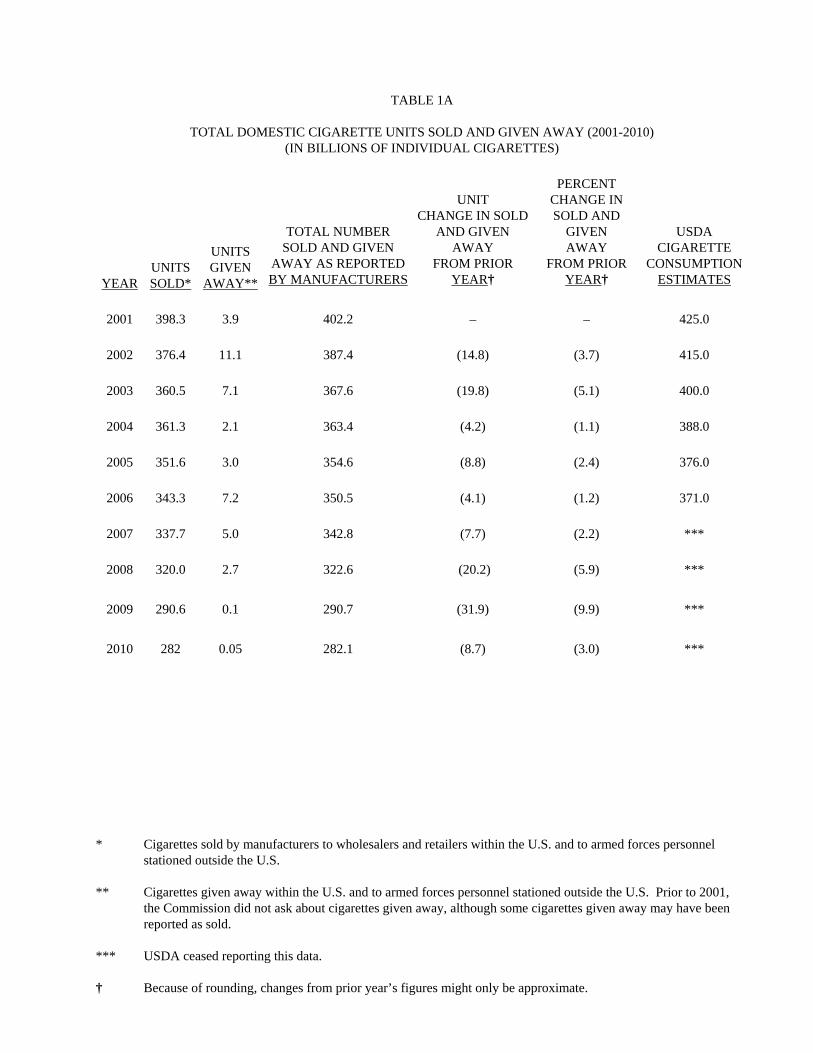
TABLE 1A
TOTAL DOMESTIC CIGARETTE UNITS SOLD AND GIVEN AWAY (2001-2010) (IN BILLIONS OF INDIVIDUAL CIGARETTES)
YEAR
UNITS SOLD*
UNITS GIVEN
AWAY**
TOTAL NUMBER SOLD AND GIVEN
AWAY AS REPORTED BY MANUFACTURERS
UNIT
CHANGE IN SOLD AND GIVEN
AWAY FROM PRIOR
YEAR†
PERCENT CHANGE IN SOLD AND
GIVEN AWAY
FROM PRIOR YEAR†
USDA CIGARETTE
CONSUMPTION ESTIMATES
2001
398.3
3.9
402.2
–
–
425.0
2002
376.4
11.1
387.4
(14.8)
(3.7)
415.0
2003
360.5
7.1
367.6
(19.8)
(5.1)
400.0
2004
361.3
2.1
363.4
(4.2)
(1.1)
388.0
2005
351.6
3.0
354.6
(8.8)
(2.4)
376.0
2006
343.3
7.2
350.5
(4.1)
(1.2)
371.0
2007
337.7
5.0
342.8
(7.7)
(2.2)
***
2008
320.0
2.7
322.6
(20.2)
(5.9)
***
2009
290.6
0.1
290.7
(31.9)
(9.9)
***
2010
282
0.05
282.1
(8.7)
(3.0)
***
* Cigarettes sold by manufacturers to wholesalers and retailers within the U.S. and to armed forces personnel
stationed outside the U.S. ** Cigarettes given away within the U.S. and to armed forces personnel stationed outside the U.S. Prior to 2001,
the Commission did not ask about cigarettes given away, although some cigarettes given away may have been reported as sold.
*** USDA ceased reporting this data. † Because of rounding, changes from prior year’s figures might only be approximate.
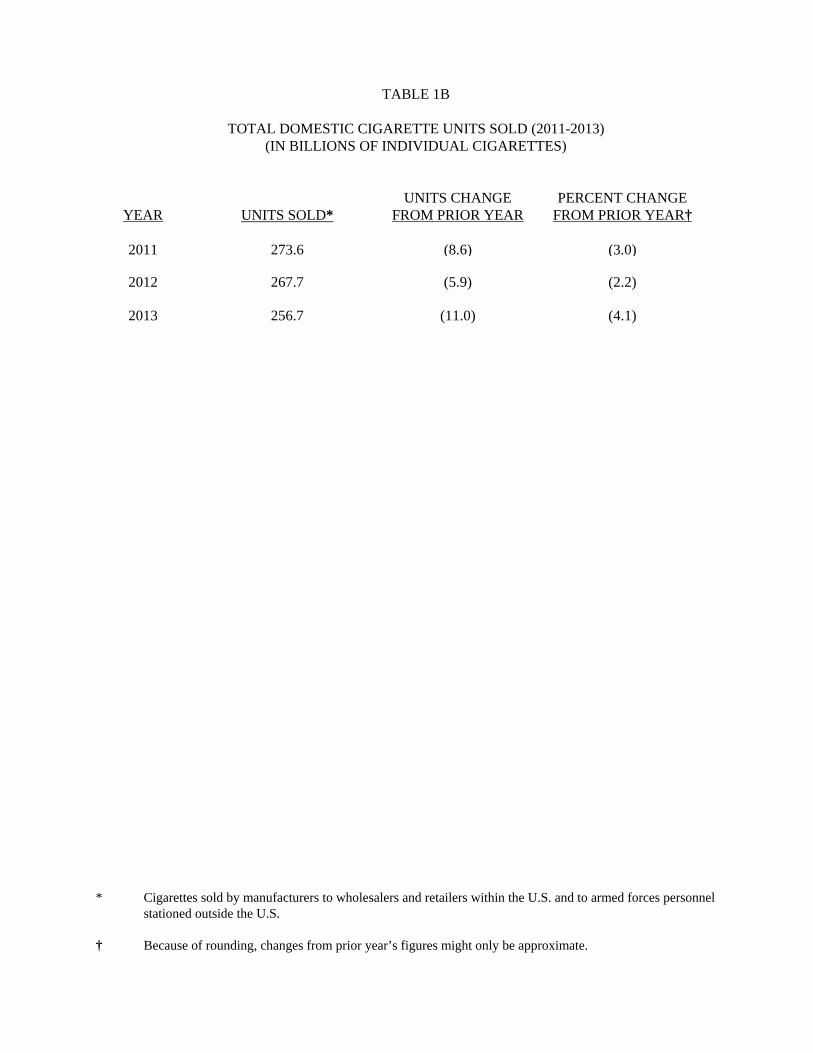
TABLE 1B
TOTAL DOMESTIC CIGARETTE UNITS SOLD (2011-2013) (IN BILLIONS OF INDIVIDUAL CIGARETTES)
YEAR
UNITS SOLD*
UNITS CHANGE
FROM PRIOR YEAR
PERCENT CHANGE
FROM PRIOR YEAR†
2011
273.6
(8.6)
(3.0)
2012 267.7 (5.9) (2.2)
2013 256.7 (11.0) (4.1) * Cigarettes sold by manufacturers to wholesalers and retailers within the U.S. and to armed forces personnel
stationed outside the U.S. † Because of rounding, changes from prior year’s figures might only be approximate.
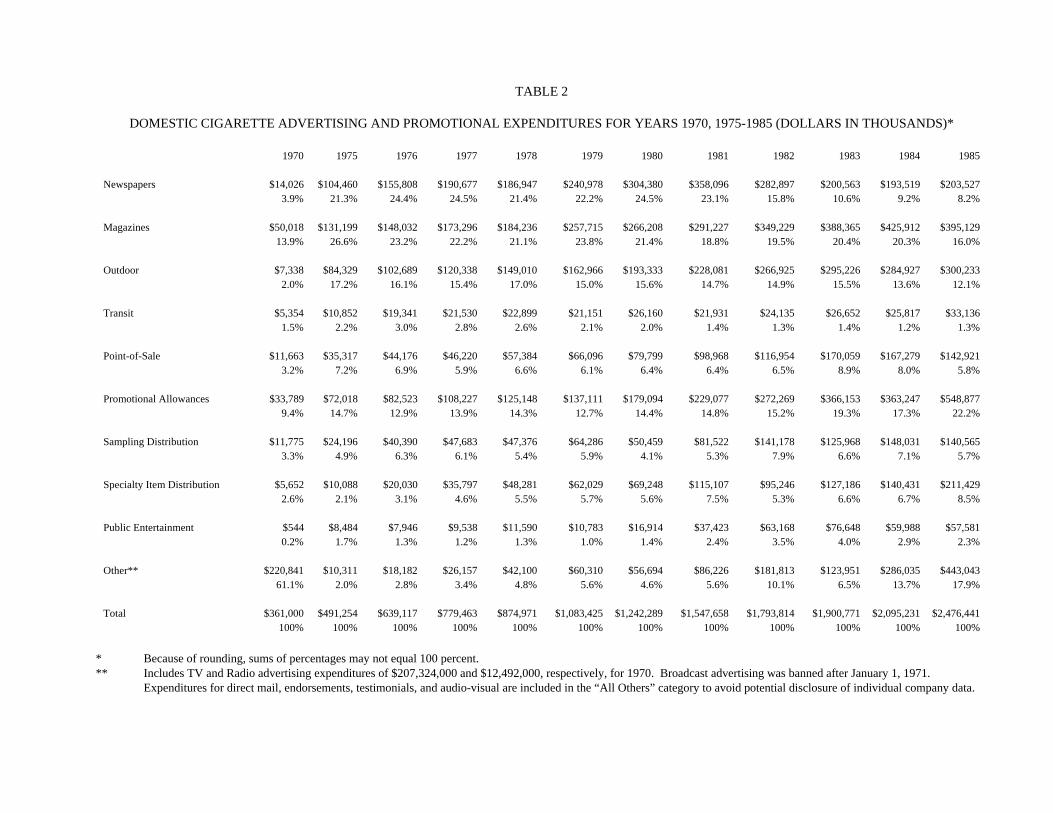
TABLE 2
DOMESTIC CIGARETTE ADVERTISING AND PROMOTIONAL EXPENDITURES FOR YEARS 1970, 1975-1985 (DOLLARS IN THOUSANDS)* 1970 1975 1976 1977 1978 1979 1980 1981 1982 1983 1984 1985 Newspapers $14,026 $104,460 $155,808 $190,677 $186,947 $240,978 $304,380 $358,096 $282,897 $200,563 $193,519 $203,527 3.9% 21.3% 24.4% 24.5% 21.4% 22.2% 24.5% 23.1% 15.8% 10.6% 9.2% 8.2% Magazines $50,018 $131,199 $148,032 $173,296 $184,236 $257,715 $266,208 $291,227 $349,229 $388,365 $425,912 $395,129 13.9% 26.6% 23.2% 22.2% 21.1% 23.8% 21.4% 18.8% 19.5% 20.4% 20.3% 16.0% Outdoor $7,338 $84,329 $102,689 $120,338 $149,010 $162,966 $193,333 $228,081 $266,925 $295,226 $284,927 $300,233 2.0% 17.2% 16.1% 15.4% 17.0% 15.0% 15.6% 14.7% 14.9% 15.5% 13.6% 12.1% Transit $5,354 $10,852 $19,341 $21,530 $22,899 $21,151 $26,160 $21,931 $24,135 $26,652 $25,817 $33,136 1.5% 2.2% 3.0% 2.8% 2.6% 2.1% 2.0% 1.4% 1.3% 1.4% 1.2% 1.3% Point-of-Sale $11,663 $35,317 $44,176 $46,220 $57,384 $66,096 $79,799 $98,968 $116,954 $170,059 $167,279 $142,921 3.2% 7.2% 6.9% 5.9% 6.6% 6.1% 6.4% 6.4% 6.5% 8.9% 8.0% 5.8% Promotional Allowances $33,789 $72,018 $82,523 $108,227 $125,148 $137,111 $179,094 $229,077 $272,269 $366,153 $363,247 $548,877 9.4% 14.7% 12.9% 13.9% 14.3% 12.7% 14.4% 14.8% 15.2% 19.3% 17.3% 22.2% Sampling Distribution $11,775 $24,196 $40,390 $47,683 $47,376 $64,286 $50,459 $81,522 $141,178 $125,968 $148,031 $140,565 3.3% 4.9% 6.3% 6.1% 5.4% 5.9% 4.1% 5.3% 7.9% 6.6% 7.1% 5.7% Specialty Item Distribution $5,652 $10,088 $20,030 $35,797 $48,281 $62,029 $69,248 $115,107 $95,246 $127,186 $140,431 $211,429 2.6% 2.1% 3.1% 4.6% 5.5% 5.7% 5.6% 7.5% 5.3% 6.6% 6.7% 8.5% Public Entertainment $544 $8,484 $7,946 $9,538 $11,590 $10,783 $16,914 $37,423 $63,168 $76,648 $59,988 $57,581 0.2% 1.7% 1.3% 1.2% 1.3% 1.0% 1.4% 2.4% 3.5% 4.0% 2.9% 2.3% Other** $220,841 $10,311 $18,182 $26,157 $42,100 $60,310 $56,694 $86,226 $181,813 $123,951 $286,035 $443,043 61.1% 2.0% 2.8% 3.4% 4.8% 5.6% 4.6% 5.6% 10.1% 6.5% 13.7% 17.9% Total $361,000 $491,254 $639,117 $779,463 $874,971 $1,083,425 $1,242,289 $1,547,658 $1,793,814 $1,900,771 $2,095,231 $2,476,441 100% 100% 100% 100% 100% 100% 100% 100% 100% 100% 100% 100%
* Because of rounding, sums of percentages may not equal 100 percent. ** Includes TV and Radio advertising expenditures of $207,324,000 and $12,492,000, respectively, for 1970. Broadcast advertising was banned after January 1, 1971.
Expenditures for direct mail, endorsements, testimonials, and audio-visual are included in the “All Others” category to avoid potential disclosure of individual company data.
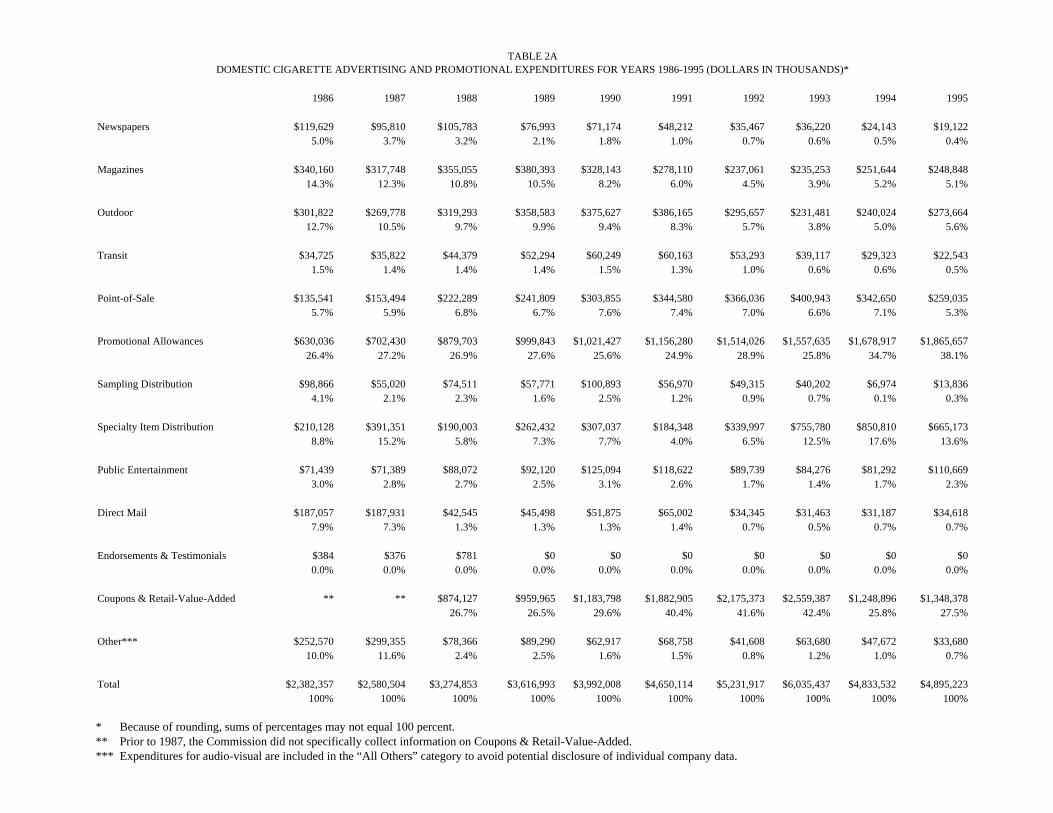
TABLE 2A DOMESTIC CIGARETTE ADVERTISING AND PROMOTIONAL EXPENDITURES FOR YEARS 1986-1995 (DOLLARS IN THOUSANDS)*
1986 1987 1988 1989 1990 1991 1992 1993 1994 1995 Newspapers $119,629 $95,810 $105,783 $76,993 $71,174 $48,212 $35,467 $36,220 $24,143 $19,122 5.0% 3.7% 3.2% 2.1% 1.8% 1.0% 0.7% 0.6% 0.5% 0.4% Magazines $340,160 $317,748 $355,055 $380,393 $328,143 $278,110 $237,061 $235,253 $251,644 $248,848 14.3% 12.3% 10.8% 10.5% 8.2% 6.0% 4.5% 3.9% 5.2% 5.1% Outdoor $301,822 $269,778 $319,293 $358,583 $375,627 $386,165 $295,657 $231,481 $240,024 $273,664 12.7% 10.5% 9.7% 9.9% 9.4% 8.3% 5.7% 3.8% 5.0% 5.6% Transit $34,725 $35,822 $44,379 $52,294 $60,249 $60,163 $53,293 $39,117 $29,323 $22,543 1.5% 1.4% 1.4% 1.4% 1.5% 1.3% 1.0% 0.6% 0.6% 0.5% Point-of-Sale $135,541 $153,494 $222,289 $241,809 $303,855 $344,580 $366,036 $400,943 $342,650 $259,035 5.7% 5.9% 6.8% 6.7% 7.6% 7.4% 7.0% 6.6% 7.1% 5.3% Promotional Allowances $630,036 $702,430 $879,703 $999,843 $1,021,427 $1,156,280 $1,514,026 $1,557,635 $1,678,917 $1,865,657 26.4% 27.2% 26.9% 27.6% 25.6% 24.9% 28.9% 25.8% 34.7% 38.1% Sampling Distribution $98,866 $55,020 $74,511 $57,771 $100,893 $56,970 $49,315 $40,202 $6,974 $13,836 4.1% 2.1% 2.3% 1.6% 2.5% 1.2% 0.9% 0.7% 0.1% 0.3% Specialty Item Distribution $210,128 $391,351 $190,003 $262,432 $307,037 $184,348 $339,997 $755,780 $850,810 $665,173 8.8% 15.2% 5.8% 7.3% 7.7% 4.0% 6.5% 12.5% 17.6% 13.6% Public Entertainment $71,439 $71,389 $88,072 $92,120 $125,094 $118,622 $89,739 $84,276 $81,292 $110,669 3.0% 2.8% 2.7% 2.5% 3.1% 2.6% 1.7% 1.4% 1.7% 2.3% Direct Mail $187,057 $187,931 $42,545 $45,498 $51,875 $65,002 $34,345 $31,463 $31,187 $34,618 7.9% 7.3% 1.3% 1.3% 1.3% 1.4% 0.7% 0.5% 0.7% 0.7% Endorsements & Testimonials $384 $376 $781 $0 $0 $0 $0 $0 $0 $0 0.0% 0.0% 0.0% 0.0% 0.0% 0.0% 0.0% 0.0% 0.0% 0.0% Coupons & Retail-Value-Added ** ** $874,127 $959,965 $1,183,798 $1,882,905 $2,175,373 $2,559,387 $1,248,896 $1,348,378 26.7% 26.5% 29.6% 40.4% 41.6% 42.4% 25.8% 27.5% Other*** $252,570 $299,355 $78,366 $89,290 $62,917 $68,758 $41,608 $63,680 $47,672 $33,680 10.0% 11.6% 2.4% 2.5% 1.6% 1.5% 0.8% 1.2% 1.0% 0.7% Total $2,382,357 $2,580,504 $3,274,853 $3,616,993 $3,992,008 $4,650,114 $5,231,917 $6,035,437 $4,833,532 $4,895,223 100% 100% 100% 100% 100% 100% 100% 100% 100% 100% * Because of rounding, sums of percentages may not equal 100 percent. ** Prior to 1987, the Commission did not specifically collect information on Coupons & Retail-Value-Added. *** Expenditures for audio-visual are included in the “All Others” category to avoid potential disclosure of individual company data.
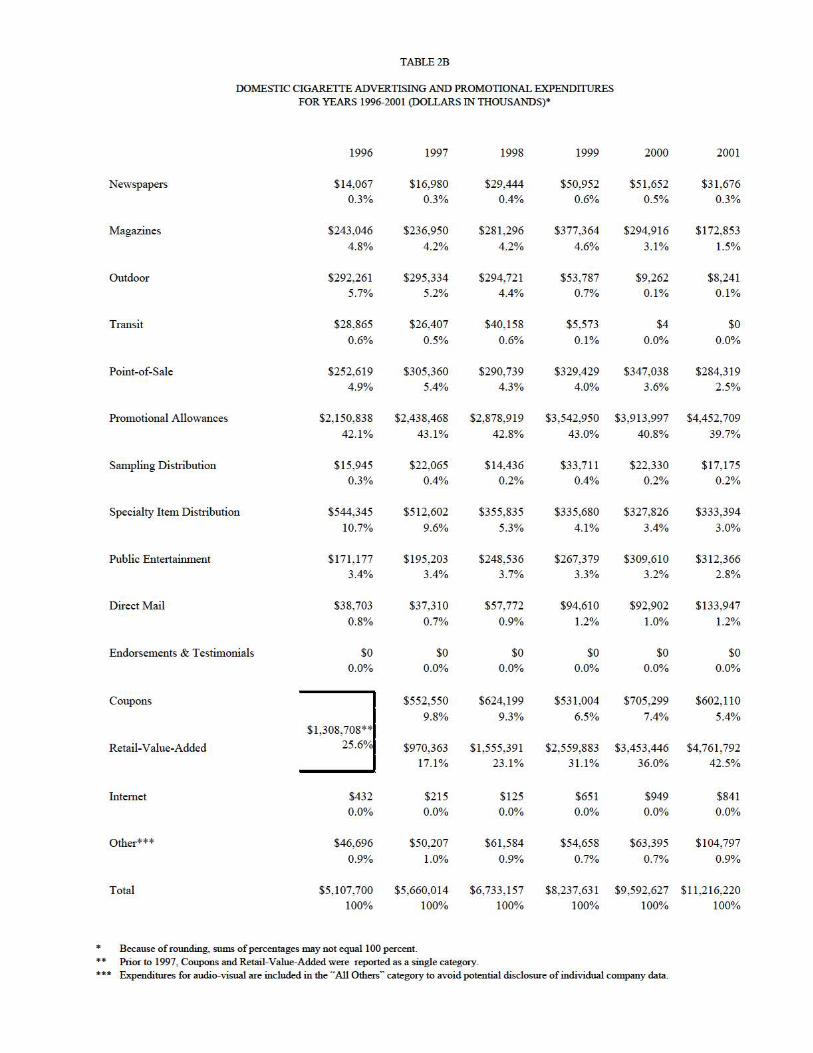
TABLE2B
DOMESTIC CIGARETTE ADVERTISING AND PROMOTIONAL EXPENDITURES FOR YEARS 1996-2001 (DOLLARS IN THOUSANDS)*
1996 1997 1998 1999 2000 2001
Newspapers $14,067 $16,980 $29,444 $50,952 $51,652 $31,676 0.3% 0.3% 0.4% 0.6% 0.5% 0.3%
Magazines $243,046 $236,950 $281,296 $377,364 $294,916 $172,853
4.8% 4.2% 4.2% 4.6% 3.1% 1.5%
Outdoor $292,261 $295,334 $294,721 $53,787 $9,262 $8,241 5.7% 5.2% 4.4% 0.7% 0.1% 0.1%
Transit $28,865 $26,407 $40,158 $5,573 $4 $0
0.6% 0.5% 0.6% 0.1% 0.0% 0.0%
Point-of-Sale $252,619 $305,360 $290,739 $329,429 $347,038 $284,319 4.9% 5.4% 4.3% 4.0% 3.6% 2.5%
Promotional Allowances $2,150,838 $2,438,468 $2,878,919 $3,542,950 $3,913,997 $4,452,709 42.1% 43.1% 42.8% 43.0% 40.8% 39.7%
Sampling Distribution $15,945 $22,065 $14,436 $33,711 $22,330 $17,175 0.3% 0.4% 0.2% 0.4% 0.2% 0.2%
Specialty Item Distribution $544,345 $512,602 $355,835 $335,680 $327,826 $333,394
10.7% 9.6% 5.3% 4.1% 3.4% 3.0%
Public Ente1tainment $171 ,177 $195,203 $248,536 $267,379 $309,610 $312,366 3.4% 3.4% 3.7% 3.3% 3.2% 2.8%
Direct Mail $38,703 $37,310 $57,772 $94,610 $92,902 $133,947
0.8% 0.7% 0.9% 1.2% 1.0% 1.2%
Endorsements & Testimonials $0 $0 $0 $0 $0 $0 0.0% 0.0% 0.0% 0.0% 0.0% 0.0%
Coupons $552,550 $624,199 $531,004 $705,299 $602,110
9.8% 9.3% 6.5% 7.4% 5.4% $1,308,708**
Retail-Value-Added 25.6o/i $970,363 $1,555,391 $2,559,883 $3,453,446 $4,761,792 17.1% 23.1% 31.1% 36.0% 42.5%
Internet $432 $215 $125 $651 $949 $841 0.0% 0.0% 0.0% 0.0% 0.0% 0.0%
Other*"'* $46,696 $50,207 $61,584 $54,658 $63,395 $104,797
0.9% 1.0% 0.9% 0.7% 0.7% 0.9%
Total $5,107,700 $5,660,014 $6,733,157 $8,237,631 $9,592,627 $11,216,220 100% 100% 100% 100% 100% 100%
* Because of rounding, sums of percentages may not equal 100 percent.
** Prior to 1997, Coupons and Retail-Value-Added were reported as a single category.
*** Expenditures for audio-visual are included in the "All Others" category to avoid potential disclosure of individual company data.
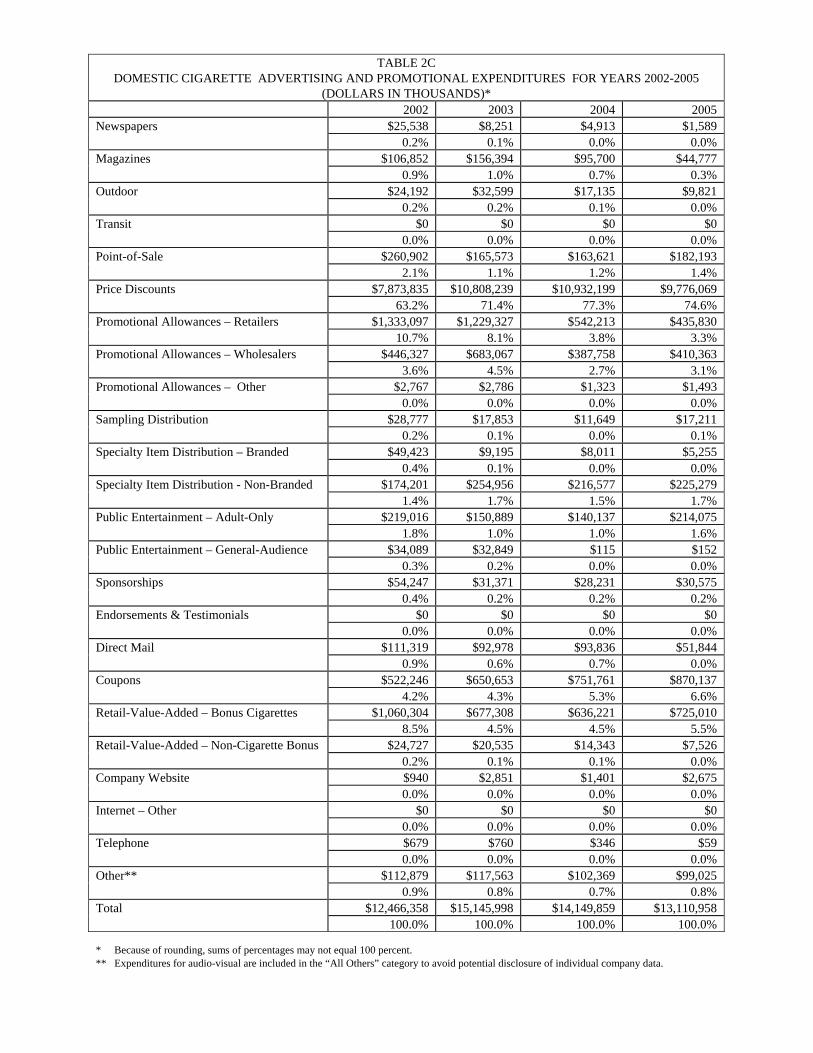
TABLE 2C
DOMESTIC CIGARETTE ADVERTISING AND PROMOTIONAL EXPENDITURES FOR YEARS 2002-2005 (DOLLARS IN THOUSANDS)*
2002 2003 2004 2005 Newspapers $25,538 $8,251 $4,913 $1,589
0.2% 0.1% 0.0% 0.0% Magazines $106,852 $156,394 $95,700 $44,777
0.9% 1.0% 0.7% 0.3% Outdoor $24,192 $32,599 $17,135 $9,821
0.2% 0.2% 0.1% 0.0% Transit $0 $0 $0 $0
0.0% 0.0% 0.0% 0.0% Point-of-Sale $260,902 $165,573 $163,621 $182,193
2.1% 1.1% 1.2% 1.4% Price Discounts $7,873,835 $10,808,239 $10,932,199 $9,776,069
63.2% 71.4% 77.3% 74.6% Promotional Allowances – Retailers $1,333,097 $1,229,327 $542,213 $435,830
10.7% 8.1% 3.8% 3.3% Promotional Allowances – Wholesalers $446,327 $683,067 $387,758 $410,363
3.6% 4.5% 2.7% 3.1% Promotional Allowances – Other $2,767 $2,786 $1,323 $1,493
0.0% 0.0% 0.0% 0.0% Sampling Distribution $28,777 $17,853 $11,649 $17,211
0.2% 0.1% 0.0% 0.1% Specialty Item Distribution – Branded $49,423 $9,195 $8,011 $5,255
0.4% 0.1% 0.0% 0.0% Specialty Item Distribution - Non-Branded $174,201 $254,956 $216,577 $225,279
1.4% 1.7% 1.5% 1.7% Public Entertainment – Adult-Only $219,016 $150,889 $140,137 $214,075
1.8% 1.0% 1.0% 1.6% Public Entertainment – General-Audience $34,089 $32,849 $115 $152
0.3% 0.2% 0.0% 0.0% Sponsorships $54,247 $31,371 $28,231 $30,575
0.4% 0.2% 0.2% 0.2% Endorsements & Testimonials $0 $0 $0 $0
0.0% 0.0% 0.0% 0.0% Direct Mail $111,319 $92,978 $93,836 $51,844
0.9% 0.6% 0.7% 0.0% Coupons $522,246 $650,653 $751,761 $870,137
4.2% 4.3% 5.3% 6.6% Retail-Value-Added – Bonus Cigarettes $1,060,304 $677,308 $636,221 $725,010
8.5% 4.5% 4.5% 5.5% Retail-Value-Added – Non-Cigarette Bonus $24,727 $20,535 $14,343 $7,526
0.2% 0.1% 0.1% 0.0% Company Website $940 $2,851 $1,401 $2,675
0.0% 0.0% 0.0% 0.0% Internet – Other $0 $0 $0 $0
0.0% 0.0% 0.0% 0.0% Telephone $679 $760 $346 $59
0.0% 0.0% 0.0% 0.0% Other** $112,879 $117,563 $102,369 $99,025
0.9% 0.8% 0.7% 0.8% Total $12,466,358 $15,145,998 $14,149,859 $13,110,958
100.0% 100.0% 100.0% 100.0%
* Because of rounding, sums of percentages may not equal 100 percent. ** Expenditures for audio-visual are included in the “All Others” category to avoid potential disclosure of individual company data.
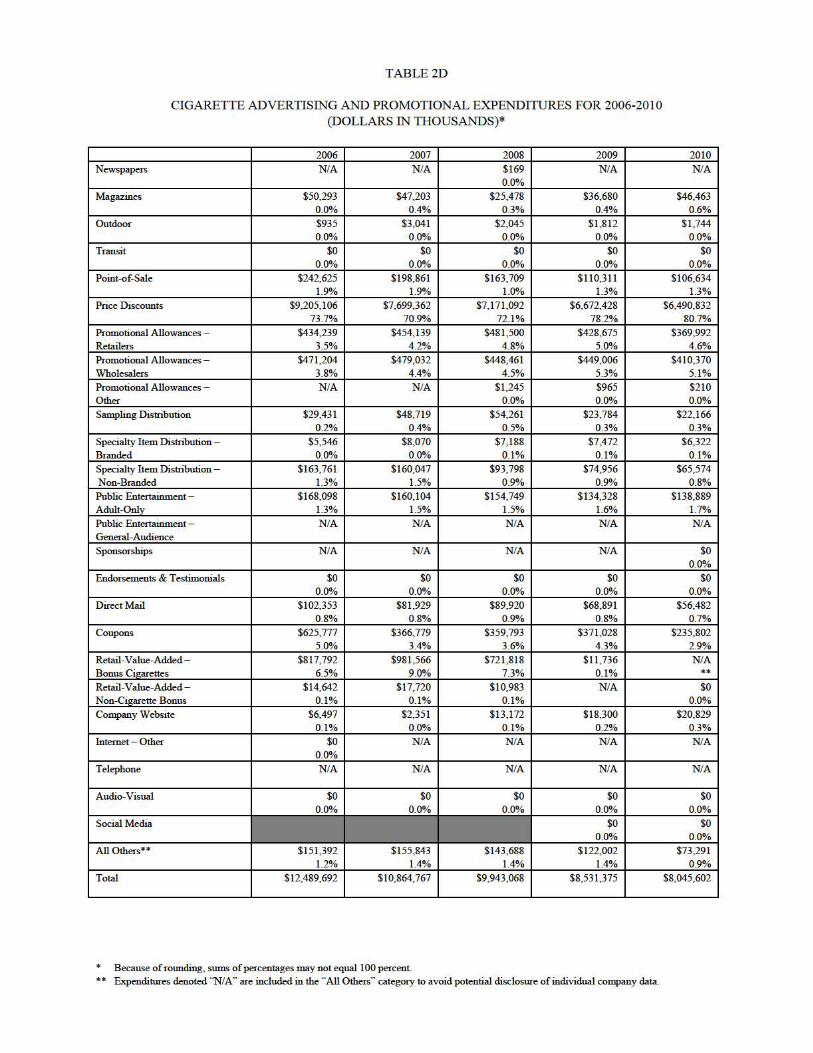
TABLE2D
CIGARETTE ADVERTISING AND PROMOTIONAL EXPENDITURES FOR 2006-2010 (DOLLARS IN THOUSANDS)*
2006 2007 2008 2009 Newspapers NIA NIA $169 NIA
0.00/o Magazines $50,293 $47,203 $25,478 $36,680
0.0% 0.4% 03% 0.4% Outdoor $935 $3,041 $2,045 $1,812
0.0% 0.0% 0.00/o 0.0% Transit $0 $0 $0 $0
0.0% 0.0% 0.00/o 0.0% Point~f-Sale $242,625 $198,861 $163,709 $110,311
1.9% 1.9% 1.00/o 1.3% Price Discounts $9,205,106 $7,699,362 $7,171,092 $6,672,428
73.7% 70.9% 72.1% 78.2% Promotional Allowances - $434,239 $454,139 $481,500 $428,675 Retailers 3.5% 4.2% 4.8% 5.0% Promotional Allowances - $471,204 $479,032 $448,461 $449,006 Wholesalers 3.8% 4.4% 4.5% 53% Promotional Allowances - NIA NIA $1,245 $965 Other 0.00/o 0.0% Sampling Distribution $29,431 $48,719 $54,261 $23,784
0.2% 0.4% 0.5% 03% Specialty Item Distribution - $5,546 $8,070 $7,188 $7,472 Branded 0.0% 0.0% 0.1% 0.1% Specialty Item Distribution - $163,761 $160,047 $93,798 $74,956 Non-Branded 1.3% 1.5% 0.9% 0.9% Public Entertainment - $168,098 $160,104 $154,749 $134,328 Adult-Onlv 1.3% 1.5% 1.5% 1.6% Public Entertainment - NIA NIA NIA NIA General-Audience Sponsorships NIA NIA NIA NIA
Endorsements & Testimonials $0 $0 $0 $0 0.0% 0.0% 0.00/o 0.0%
Direct Mail $102,353 $81,929 $89,920 $68,891 0.8% 0.8% 0.9% 0.8%
Coupons $625,777 $366,779 $359,793 $371,028 5.0% 3.4% 3.6% 43%
Retail-Value-Added - $817,792 $981,566 $721,818 $11,736 Bonus Cigarettes 6.5% 9.0% 7.3% 0.1% Retail-Value-Added - $14,642 $17,720 $10,983 NIA Non-Cigarette Bonus 0.1% 0.1% 0.1% Company Website $6,497 $2,351 $13,172 $18,300
0.1% 0.0% 0.1% 0.2% Internet - Other $0 NIA NIA NIA
0.0% Telephone NIA NIA NIA NIA
Audio-Visual $0 $0 $0 $0 0.0% 0.0% 0.00/o 0.0%
Social Media $0 0.0%
All Others** $151,392 $155,843 $143,688 $122,002 1.2% 1.4% 1.4% 1.4%
Total $12,489,692 $10,864,767 $9,943,068 $8,531,375
• Because of rounding, sums of percentages may not equal l 00 percent . ** Expenditures denoted •'NIA " are included in the .. All Others" category to avoid potential disclosure of individual company data.
2010 NIA
$46,463 0.6%
$1,744 0.0%
$0 0.0%
$106,634 1.3%
$6,490,832 80.7%
$369,992 4.6%
$410,370 5.1% $210 0.0%
$22,166 03%
$6,322 0.1%
$65,574 0.8%
$138,889 1.7% NIA
$0 0.00/o
$0 0.0%
$56,482 0.7%
$235,802 2.9% NIA
** $0
0.0% $20,829
03% NIA
NIA
$0 0.0%
$0 0.0%
$73,291 0.9%
$8,045,602
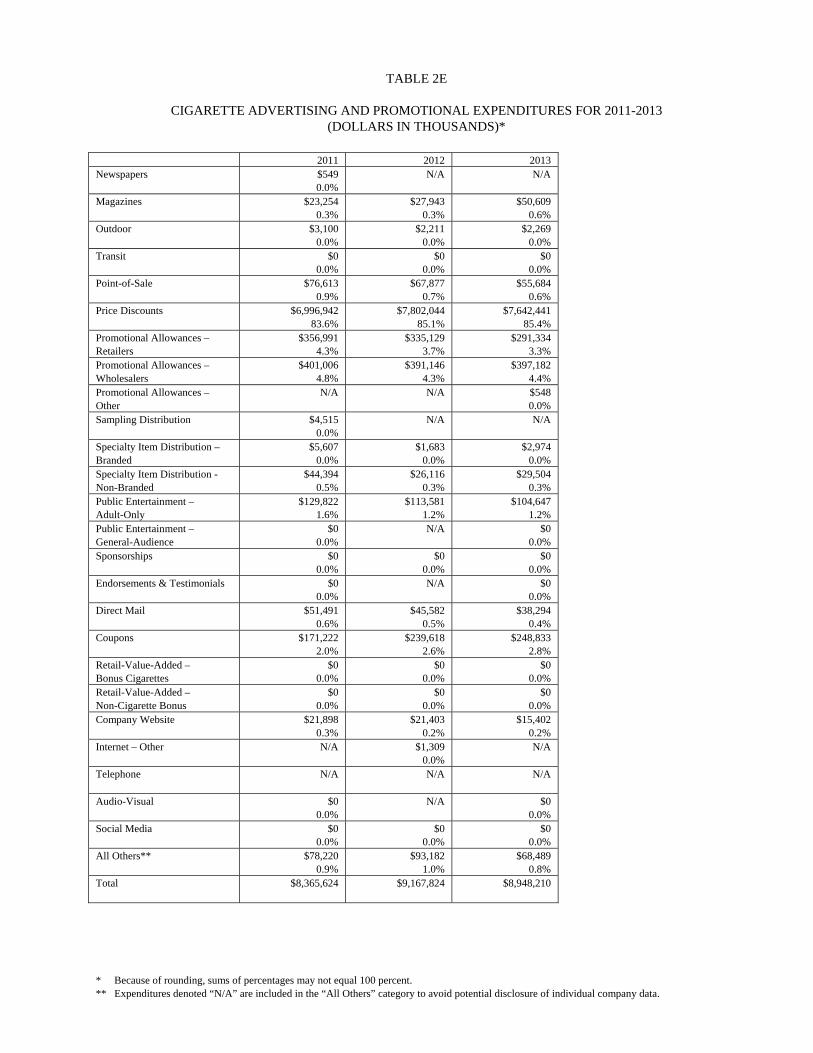
TABLE 2E
CIGARETTE ADVERTISING AND PROMOTIONAL EXPENDITURES FOR 2011-2013 (DOLLARS IN THOUSANDS)*
2011 2012 2013 Newspapers $549
0.0% N/A
N/A
Magazines $23,254
0.3% $27,943
0.3% $50,609
0.6% Outdoor $3,100
0.0% $2,211
0.0% $2,269
0.0% Transit $0
0.0% $0
0.0% $0
0.0% Point-of-Sale $76,613
0.9% $67,877
0.7% $55,684
0.6% Price Discounts $6,996,942
83.6% $7,802,044
85.1% $7,642,441
85.4% Promotional Allowances – Retailers
$356,991 4.3%
$335,129 3.7%
$291,334 3.3%
Promotional Allowances – Wholesalers
$401,006 4.8%
$391,146 4.3%
$397,182 4.4%
Promotional Allowances – Other
N/A
N/A
$548 0.0%
Sampling Distribution $4,515 0.0%
N/A
N/A
Specialty Item Distribution – Branded
$5,607 0.0%
$1,683 0.0%
$2,974 0.0%
Specialty Item Distribution - Non-Branded
$44,394 0.5%
$26,116 0.3%
$29,504 0.3%
Public Entertainment – Adult-Only
$129,822 1.6%
$113,581 1.2%
$104,647 1.2%
Public Entertainment – General-Audience
$0 0.0%
N/A
$0 0.0%
Sponsorships $0 0.0%
$0 0.0%
$0 0.0%
Endorsements & Testimonials $0 0.0%
N/A
$0 0.0%
Direct Mail $51,491 0.6%
$45,582 0.5%
$38,294 0.4%
Coupons $171,222 2.0%
$239,618 2.6%
$248,833 2.8%
Retail-Value-Added – Bonus Cigarettes
$0 0.0%
$0 0.0%
$0 0.0%
Retail-Value-Added – Non-Cigarette Bonus
$0 0.0%
$0 0.0%
$0 0.0%
Company Website $21,898 0.3%
$21,403 0.2%
$15,402 0.2%
Internet – Other N/A
$1,309 0.0%
N/A
Telephone N/A
N/A
N/A
Audio-Visual $0 0.0%
N/A
$0 0.0%
Social Media $0 0.0%
$0 0.0%
$0 0.0%
All Others** $78,220 0.9%
$93,182 1.0%
$68,489 0.8%
Total
$8,365,624 $9,167,824 $8,948,210
* Because of rounding, sums of percentages may not equal 100 percent. ** Expenditures denoted “N/A” are included in the “All Others” category to avoid potential disclosure of individual company data.
*
YEAR TV
1963 151.7
1964 170.2
1965 175.6
1966 198.0
1967 226.9
1968 217.2
1969 221.3
1970 205.0
1971 2.2
1972 0
1973 0
1974 0
TABLE3
DOMESTIC CIGARETTE ADVERTISING EXPENDITURES BY MEDIA FOR YEARS 1963 - 1974*
(MILLIONS OF DOLLARS)
RADIO NEWSPAPER MAGAZINES DIRECT BILLBOARD/ POSTER/
OUTDOOR/
31.6 45.6 13.2
25.5 45.2 14.6
24.8 41.9 14.7
31.3 43.4 17.9
17.5 41.2 20.3
21.3 44.6 21.6
13.6 48.7 13.4
12.4 14.7 49.5 16.9 11.7
0 59.3 98.3 27.0 60.6
0 63.1 96.1 22.9 67.5
0 65.3 92.4 15.2 63.2
0 80.5 114.6 31.1 71.4
OTHER TOTAL
7.4 249.5
5.8 261.3
6.0 263.0
6.9 297.5
6.0 311 .5
6.0 310.7
8.9 305.9
4.5 314.7
4.2 251.6
8.0 257.6
11.4 247.5
9.2 306.8
The data reported in Tables 2 through 2E were not collected in their present fonn until 1975 . Thus, Table 3, which repo1ts cigarette adve1tising expenditures from 1963 through 1974, has been retained in this repo1t for comparative purposes.
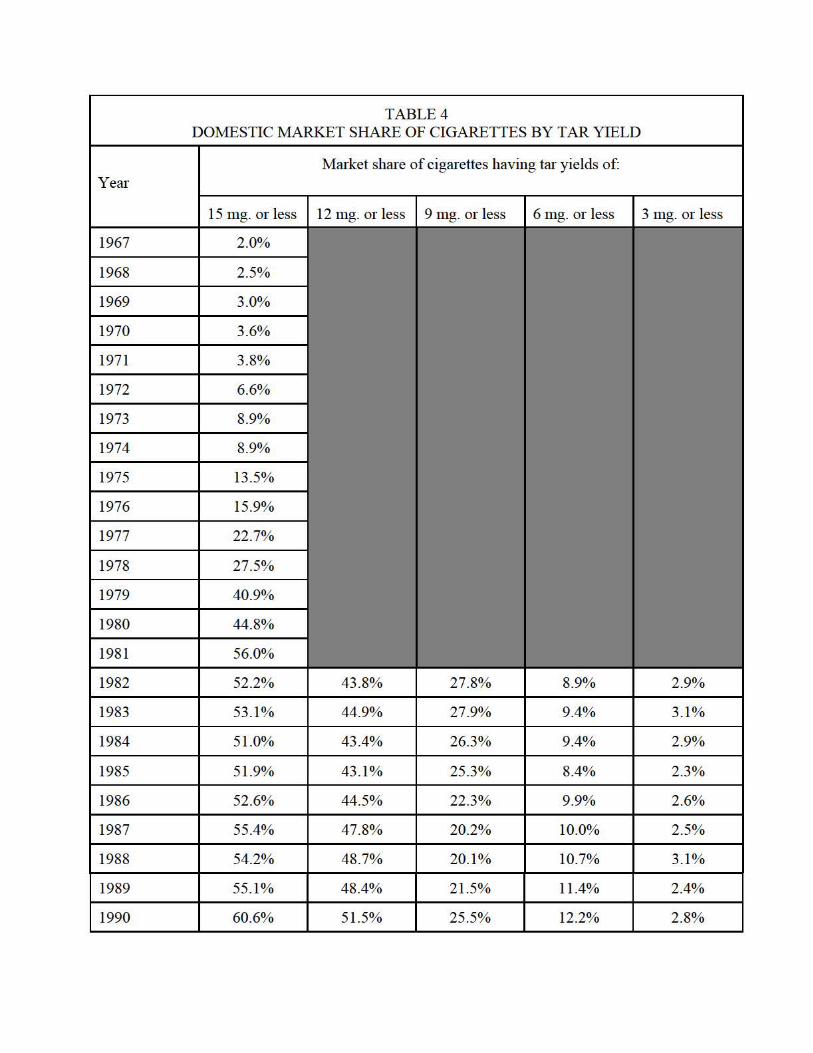
TABLE4 DOMESTIC MARKET SHARE OF CIGARETTES BY TAR YIELD
Market share of cigarettes having tar yields of: Year
15 mg. or less
1967 2.0%
1968 2.5%
1969 3.0%
1970 3.6%
1971 3.8%
1972 6.6%
1973 8.9%
1974 8.9%
1975 13.5%
1976 15.9%
1977 22.7%
1978 27.5%
1979 40.9%
1980 44.8%
1981 56.0%
1982 52.2% 43.8% 27.8% 8.9% 2.9%
1983 53.1% 44.9% 27.9% 9.4% 3.1%
1984 51.0% 43.4% 26.3% 9.4% 2.9%
1985 51.9% 43.1% 25.3% 8.4% 2.3%
1986 52.6% 44.5% 22.3% 9.9% 2.6%
1987 55.4% 47.8% 20.2% 10.0% 2.5%
1988 54.2% 48.7% 20.1% 10.7% 3.1%
1989 55.1% 48.4% 21.5% 11 .4% 2.4%
1990 60.6% 51.5% 25.5% 12.2% 2.8%
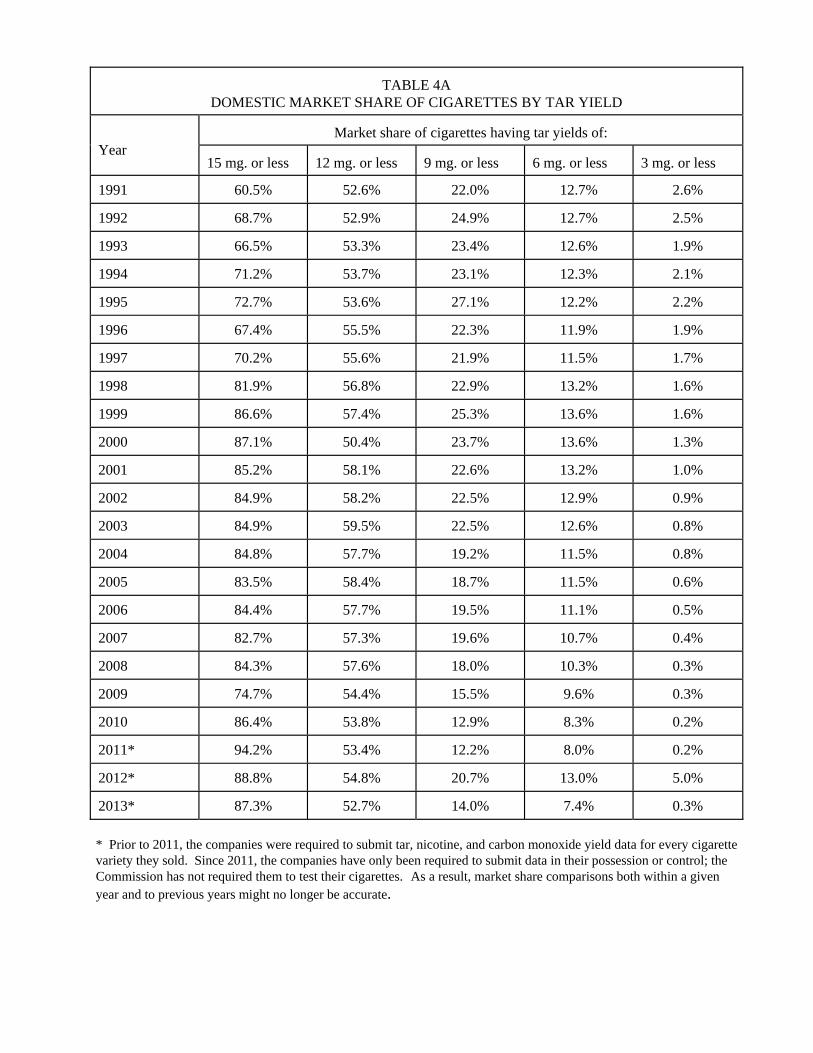
TABLE 4A
DOMESTIC MARKET SHARE OF CIGARETTES BY TAR YIELD Year
Market share of cigarettes having tar yields of:
15 mg. or less
12 mg. or less 9 mg. or less 6 mg. or less
3 mg. or less
1991
60.5%
52.6% 22.0% 12.7%
2.6%
1992
68.7%
52.9% 24.9% 12.7%
2.5%
1993
66.5%
53.3% 23.4% 12.6%
1.9%
1994
71.2%
53.7% 23.1% 12.3%
2.1%
1995
72.7%
53.6% 27.1% 12.2%
2.2%
1996
67.4%
55.5% 22.3% 11.9%
1.9%
1997
70.2%
55.6% 21.9% 11.5%
1.7%
1998
81.9%
56.8% 22.9% 13.2%
1.6%
1999
86.6%
57.4% 25.3% 13.6%
1.6%
2000
87.1%
50.4% 23.7% 13.6%
1.3%
2001
85.2%
58.1% 22.6% 13.2%
1.0%
2002
84.9%
58.2% 22.5% 12.9%
0.9%
2003
84.9%
59.5% 22.5% 12.6%
0.8%
2004
84.8%
57.7% 19.2% 11.5%
0.8%
2005
83.5%
58.4% 18.7% 11.5%
0.6%
2006
84.4%
57.7% 19.5% 11.1%
0.5%
2007
82.7%
57.3% 19.6% 10.7%
0.4%
2008
84.3%
57.6% 18.0% 10.3%
0.3%
2009
74.7%
54.4% 15.5% 9.6%
0.3%
2010
86.4%
53.8% 12.9% 8.3%
0.2%
2011*
94.2%
53.4% 12.2% 8.0%
0.2%
2012*
88.8%
54.8% 20.7% 13.0%
5.0%
2013*
87.3%
52.7% 14.0% 7.4%
0.3%
* Prior to 2011, the companies were required to submit tar, nicotine, and carbon monoxide yield data for every cigarette variety they sold. Since 2011, the companies have only been required to submit data in their possession or control; the Commission has not required them to test their cigarettes. As a result, market share comparisons both within a given year and to previous years might no longer be accurate.
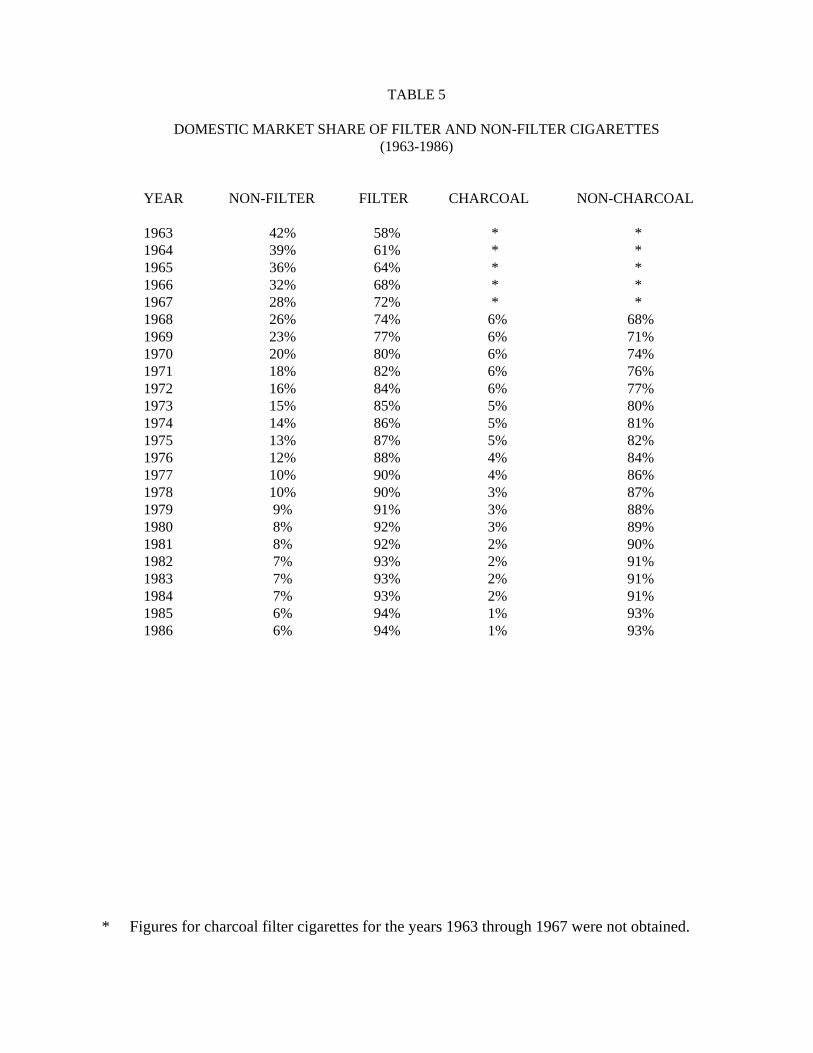
TABLE 5
DOMESTIC MARKET SHARE OF FILTER AND NON-FILTER CIGARETTES
(1963-1986)
YEAR NON-FILTER FILTER CHARCOAL NON-CHARCOAL
1963 42% 58% * * 1964 39% 61% * * 1965 36% 64% * * 1966 32% 68% * * 1967 28% 72% * * 1968 26% 74% 6% 68% 1969 23% 77% 6% 71% 1970 20% 80% 6% 74% 1971 18% 82% 6% 76% 1972 16% 84% 6% 77% 1973 15% 85% 5% 80% 1974 14% 86% 5% 81% 1975 13% 87% 5% 82% 1976 12% 88% 4% 84% 1977 10% 90% 4% 86% 1978 10% 90% 3% 87% 1979 9% 91% 3% 88% 1980 8% 92% 3% 89% 1981 8% 92% 2% 90% 1982 7% 93% 2% 91% 1983 7% 93% 2% 91% 1984 7% 93% 2% 91% 1985 6% 94% 1% 93% 1986 6% 94% 1% 93%
* Figures for charcoal filter cigarettes for the years 1963 through 1967 were not obtained.
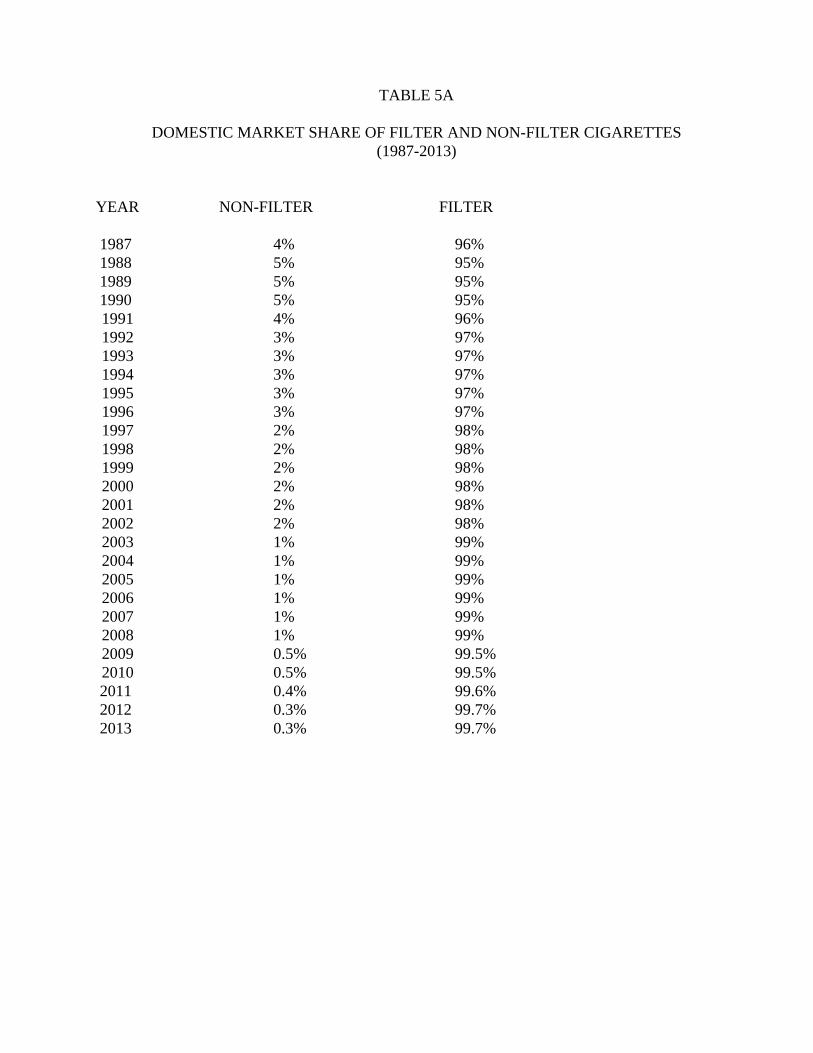
TABLE 5A
DOMESTIC MARKET SHARE OF FILTER AND NON-FILTER CIGARETTES
(1987-2013) YEAR NON-FILTER FILTER
1987 4% 96% 1988 5% 95% 1989 5% 95% 1990 5% 95% 1991 4% 96% 1992 3% 97% 1993 3% 97% 1994 3% 97% 1995 3% 97% 1996 3% 97% 1997 2% 98% 1998 2% 98% 1999 2% 98% 2000 2% 98% 2001 2% 98% 2002 2% 98% 2003 1% 99% 2004 1% 99% 2005 1% 99% 2006 1% 99% 2007 1% 99% 2008 1% 99% 2009 0.5% 99.5% 2010 0.5% 99.5%
2011 0.4% 99.6% 2012 0.3% 99.7% 2013 0.3% 99.7%
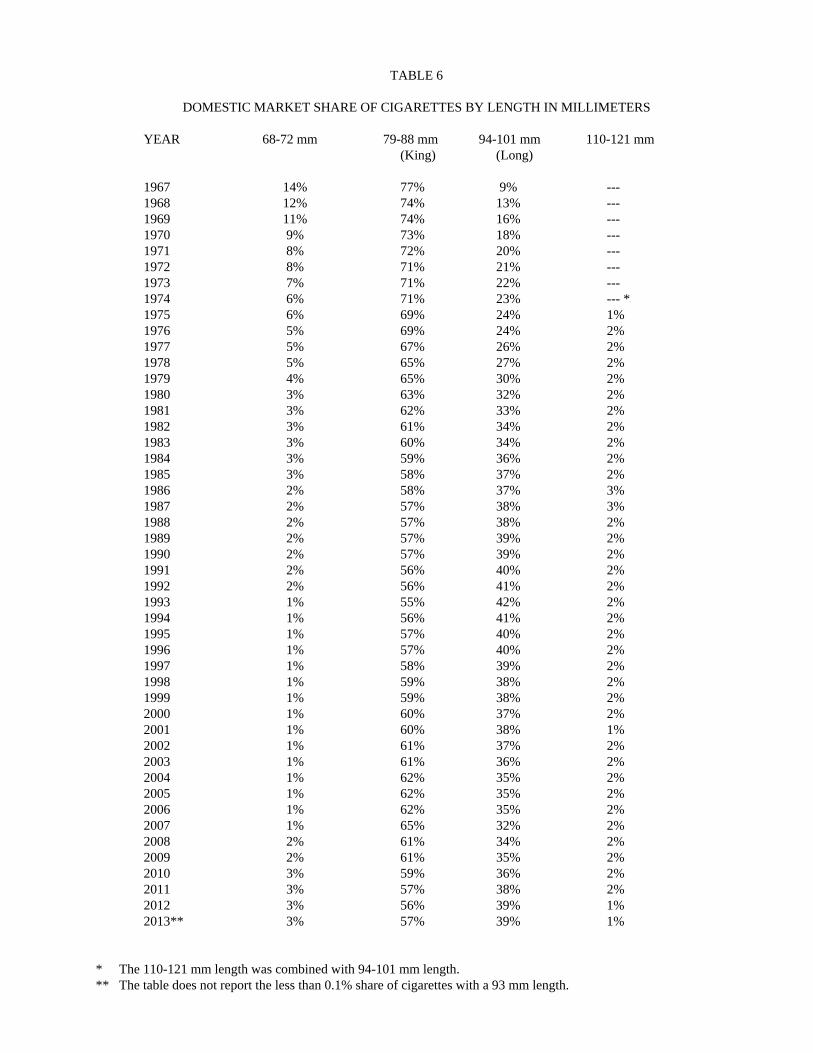
TABLE 6
DOMESTIC MARKET SHARE OF CIGARETTES BY LENGTH IN MILLIMETERS
YEAR 68-72 mm 79-88 mm 94-101 mm 110-121 mm (King) (Long)
1967 14% 77% 9% --- 1968 12% 74% 13% --- 1969 11% 74% 16% --- 1970 9% 73% 18% --- 1971 8% 72% 20% --- 1972 8% 71% 21% --- 1973 7% 71% 22% --- 1974 6% 71% 23% --- * 1975 6% 69% 24% 1% 1976 5% 69% 24% 2% 1977 5% 67% 26% 2% 1978 5% 65% 27% 2% 1979 4% 65% 30% 2% 1980 3% 63% 32% 2% 1981 3% 62% 33% 2% 1982 3% 61% 34% 2% 1983 3% 60% 34% 2% 1984 3% 59% 36% 2% 1985 3% 58% 37% 2% 1986 2% 58% 37% 3% 1987 2% 57% 38% 3% 1988 2% 57% 38% 2% 1989 2% 57% 39% 2% 1990 2% 57% 39% 2% 1991 2% 56% 40% 2% 1992 2% 56% 41% 2% 1993 1% 55% 42% 2% 1994 1% 56% 41% 2% 1995 1% 57% 40% 2% 1996 1% 57% 40% 2% 1997 1% 58% 39% 2% 1998 1% 59% 38% 2% 1999 1% 59% 38% 2% 2000 1% 60% 37% 2% 2001 1% 60% 38% 1% 2002 1% 61% 37% 2% 2003 1% 61% 36% 2% 2004 1% 62% 35% 2% 2005 1% 62% 35% 2% 2006 1% 62% 35% 2% 2007 1% 65% 32% 2% 2008 2% 61% 34% 2% 2009 2% 61% 35% 2% 2010 3% 59% 36% 2% 2011 3% 57% 38% 2%
2012 3% 56% 39% 1% 2013** 3% 57% 39% 1% * The 110-121 mm length was combined with 94-101 mm length. ** The table does not report the less than 0.1% share of cigarettes with a 93 mm length.
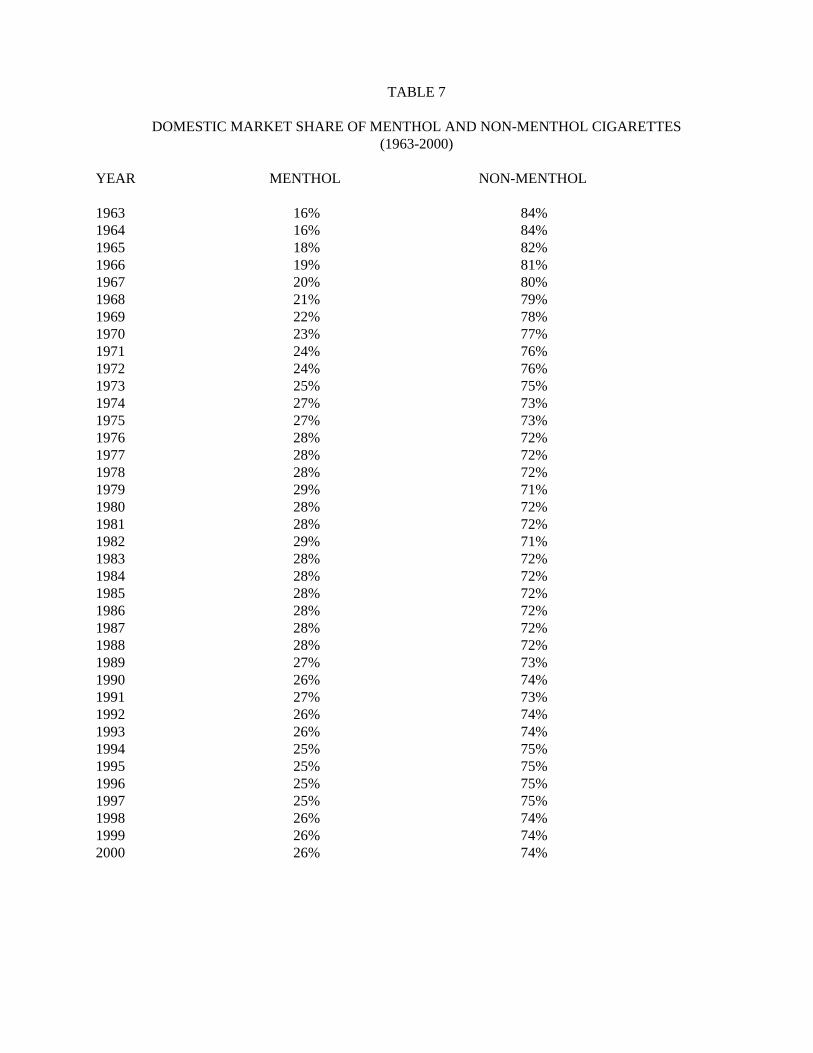
TABLE 7
DOMESTIC MARKET SHARE OF MENTHOL AND NON-MENTHOL CIGARETTES
(1963-2000) YEAR MENTHOL NON-MENTHOL 1963 16% 84% 1964 16% 84% 1965 18% 82% 1966 19% 81% 1967 20% 80% 1968 21% 79% 1969 22% 78% 1970 23% 77% 1971 24% 76% 1972 24% 76% 1973 25% 75% 1974 27% 73% 1975 27% 73% 1976 28% 72% 1977 28% 72% 1978 28% 72% 1979 29% 71% 1980 28% 72% 1981 28% 72% 1982 29% 71% 1983 28% 72% 1984 28% 72% 1985 28% 72% 1986 28% 72% 1987 28% 72% 1988 28% 72% 1989 27% 73% 1990 26% 74% 1991 27% 73% 1992 26% 74% 1993 26% 74% 1994 25% 75% 1995 25% 75% 1996 25% 75% 1997 25% 75% 1998 26% 74% 1999 26% 74% 2000 26% 74%
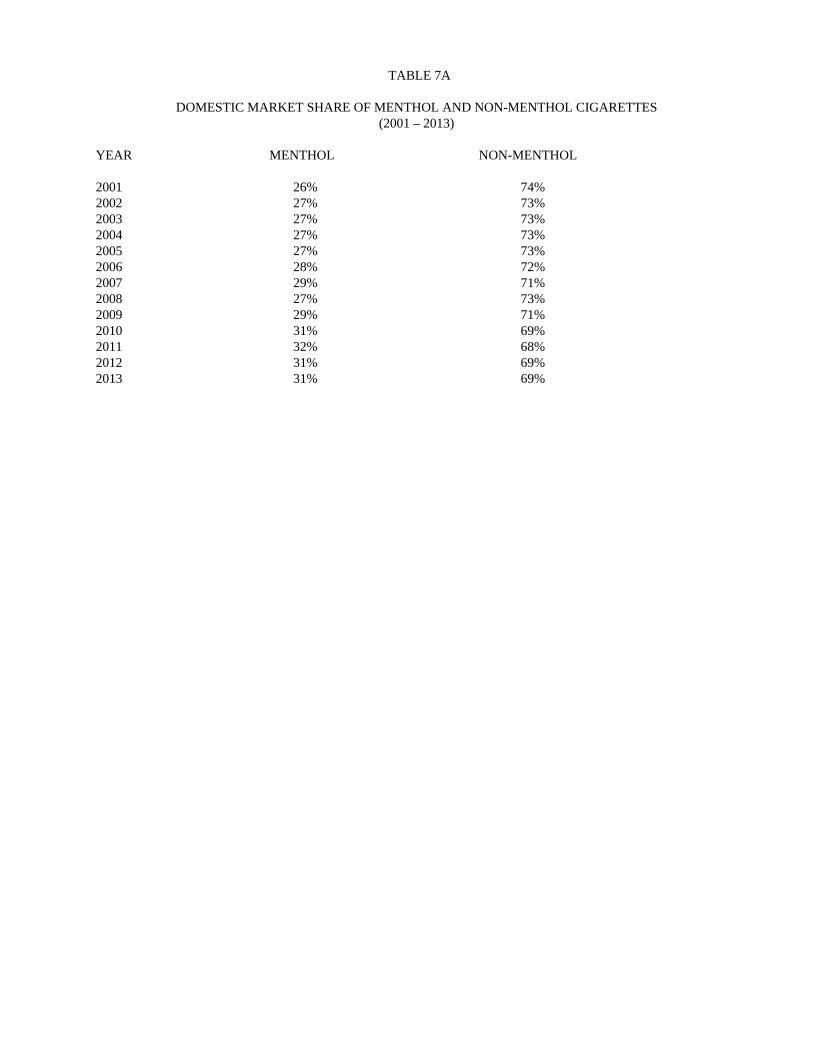
TABLE 7A DOMESTIC MARKET SHARE OF MENTHOL AND NON-MENTHOL CIGARETTES
(2001 – 2013) YEAR MENTHOL NON-MENTHOL 2001 26% 74% 2002 27% 73% 2003 27% 73% 2004 27% 73% 2005 27% 73% 2006 28% 72% 2007 29% 71% 2008 27% 73% 2009 29% 71% 2010 31% 69% 2011 32% 68% 2012 31% 69% 2013 31% 69%
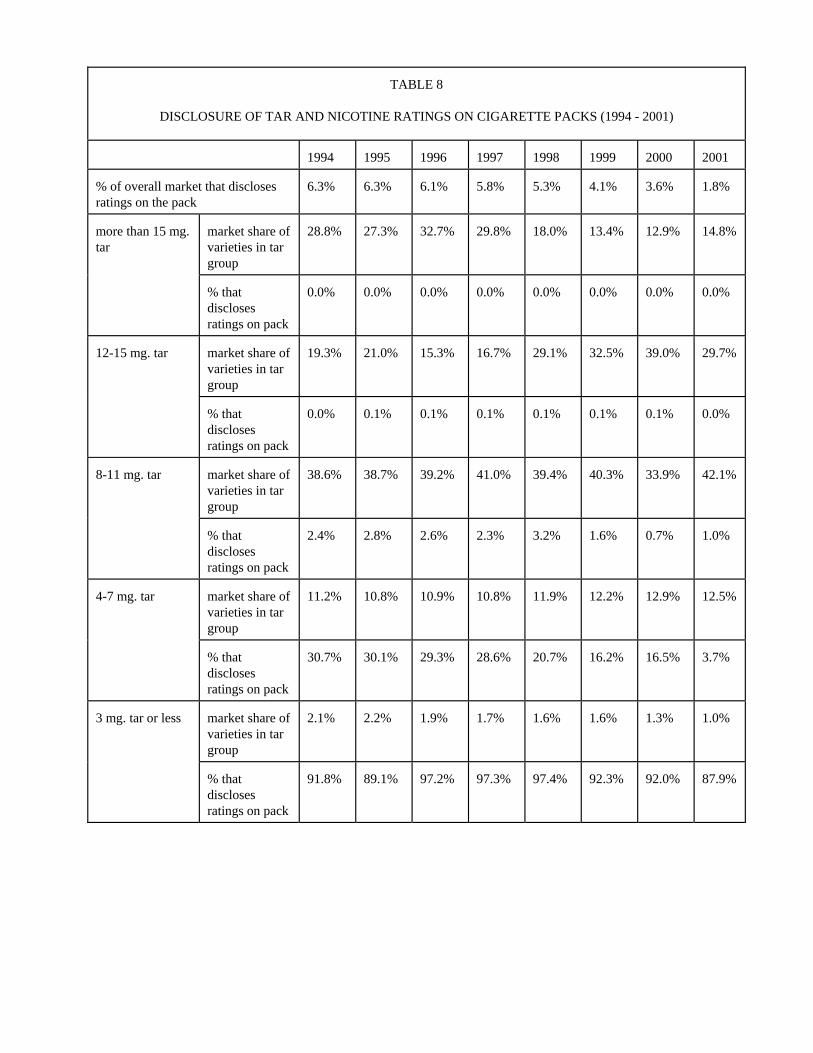
TABLE 8
DISCLOSURE OF TAR AND NICOTINE RATINGS ON CIGARETTE PACKS (1994 - 2001)
1994 1995 1996 1997 1998
1999
2000 2001
% of overall market that discloses ratings on the pack
6.3% 6.3% 6.1% 5.8% 5.3%
4.1%
3.6% 1.8%
more than 15 mg. tar
market share of varieties in tar group
28.8% 27.3% 32.7% 29.8% 18.0%
13.4%
12.9% 14.8%
% that discloses ratings on pack
0.0% 0.0% 0.0% 0.0% 0.0%
0.0%
0.0% 0.0%
12-15 mg. tar
market share of varieties in tar group
19.3% 21.0% 15.3% 16.7% 29.1%
32.5%
39.0% 29.7%
% that discloses ratings on pack
0.0% 0.1% 0.1% 0.1% 0.1%
0.1%
0.1% 0.0%
8-11 mg. tar
market share of varieties in tar group
38.6% 38.7% 39.2% 41.0% 39.4%
40.3%
33.9% 42.1%
% that discloses ratings on pack
2.4% 2.8% 2.6% 2.3% 3.2%
1.6%
0.7% 1.0%
4-7 mg. tar
market share of varieties in tar group
11.2% 10.8% 10.9% 10.8% 11.9%
12.2%
12.9% 12.5%
% that discloses ratings on pack
30.7% 30.1% 29.3% 28.6% 20.7%
16.2%
16.5% 3.7%
3 mg. tar or less
market share of varieties in tar group
2.1% 2.2% 1.9% 1.7% 1.6%
1.6%
1.3% 1.0%
% that discloses ratings on pack
91.8% 89.1% 97.2% 97.3% 97.4%
92.3%
92.0% 87.9%
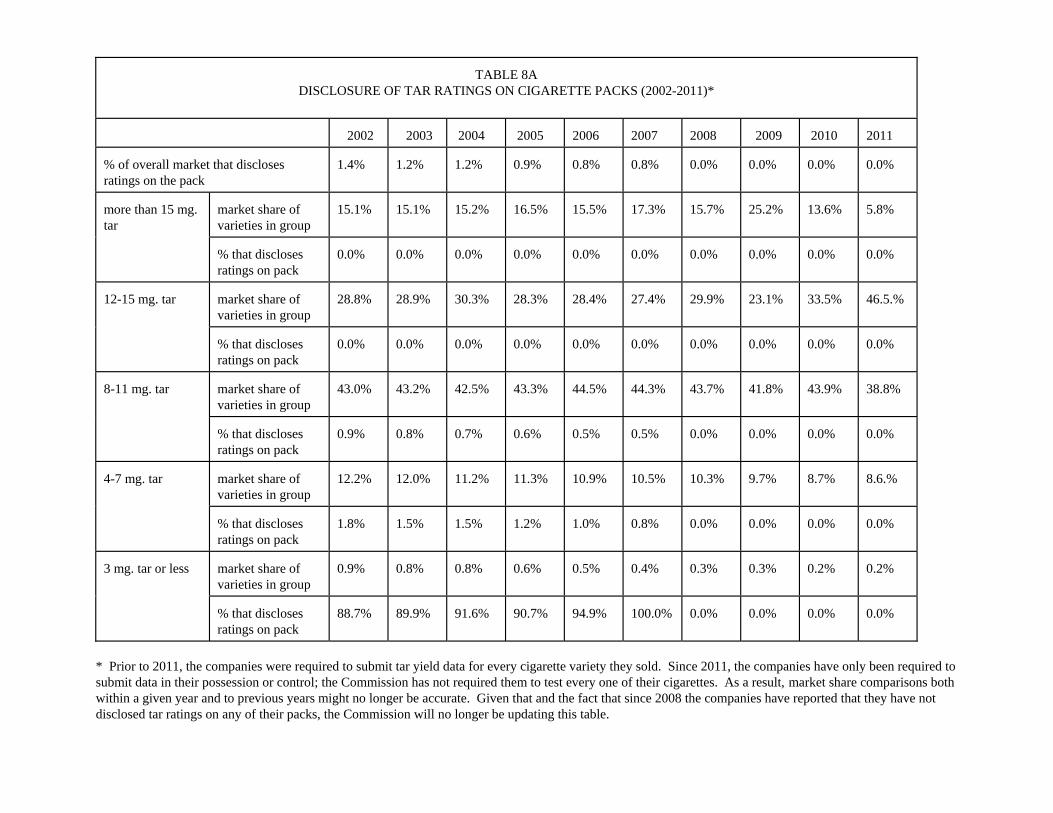
TABLE 8A
DISCLOSURE OF TAR RATINGS ON CIGARETTE PACKS (2002-2011)* 2002 2003 2004 2005 2006
2007 2008 2009 2010 2011
% of overall market that discloses ratings on the pack
1.4% 1.2% 1.2% 0.9% 0.8% 0.8% 0.0% 0.0% 0.0% 0.0%
more than 15 mg. tar
market share of varieties in group
15.1% 15.1% 15.2% 16.5% 15.5% 17.3% 15.7% 25.2% 13.6% 5.8%
% that discloses ratings on pack
0.0% 0.0% 0.0% 0.0% 0.0% 0.0% 0.0% 0.0% 0.0% 0.0%
12-15 mg. tar
market share of varieties in group
28.8% 28.9% 30.3% 28.3% 28.4% 27.4% 29.9% 23.1% 33.5% 46.5.%
% that discloses ratings on pack
0.0% 0.0% 0.0% 0.0% 0.0% 0.0% 0.0% 0.0% 0.0% 0.0%
8-11 mg. tar
market share of varieties in group
43.0% 43.2% 42.5% 43.3% 44.5% 44.3% 43.7% 41.8% 43.9% 38.8%
% that discloses ratings on pack
0.9% 0.8% 0.7% 0.6% 0.5% 0.5% 0.0% 0.0% 0.0% 0.0%
4-7 mg. tar
market share of varieties in group
12.2% 12.0% 11.2% 11.3% 10.9% 10.5% 10.3% 9.7% 8.7% 8.6.%
% that discloses ratings on pack
1.8% 1.5% 1.5% 1.2% 1.0% 0.8% 0.0% 0.0% 0.0% 0.0%
3 mg. tar or less
market share of varieties in group
0.9% 0.8% 0.8% 0.6% 0.5% 0.4% 0.3% 0.3% 0.2% 0.2%
% that discloses ratings on pack
88.7% 89.9% 91.6% 90.7% 94.9% 100.0% 0.0% 0.0% 0.0% 0.0%
* Prior to 2011, the companies were required to submit tar yield data for every cigarette variety they sold. Since 2011, the companies have only been required to submit data in their possession or control; the Commission has not required them to test every one of their cigarettes. As a result, market share comparisons both within a given year and to previous years might no longer be accurate. Given that and the fact that since 2008 the companies have reported that they have not disclosed tar ratings on any of their packs, the Commission will no longer be updating this table.
APPENDIX
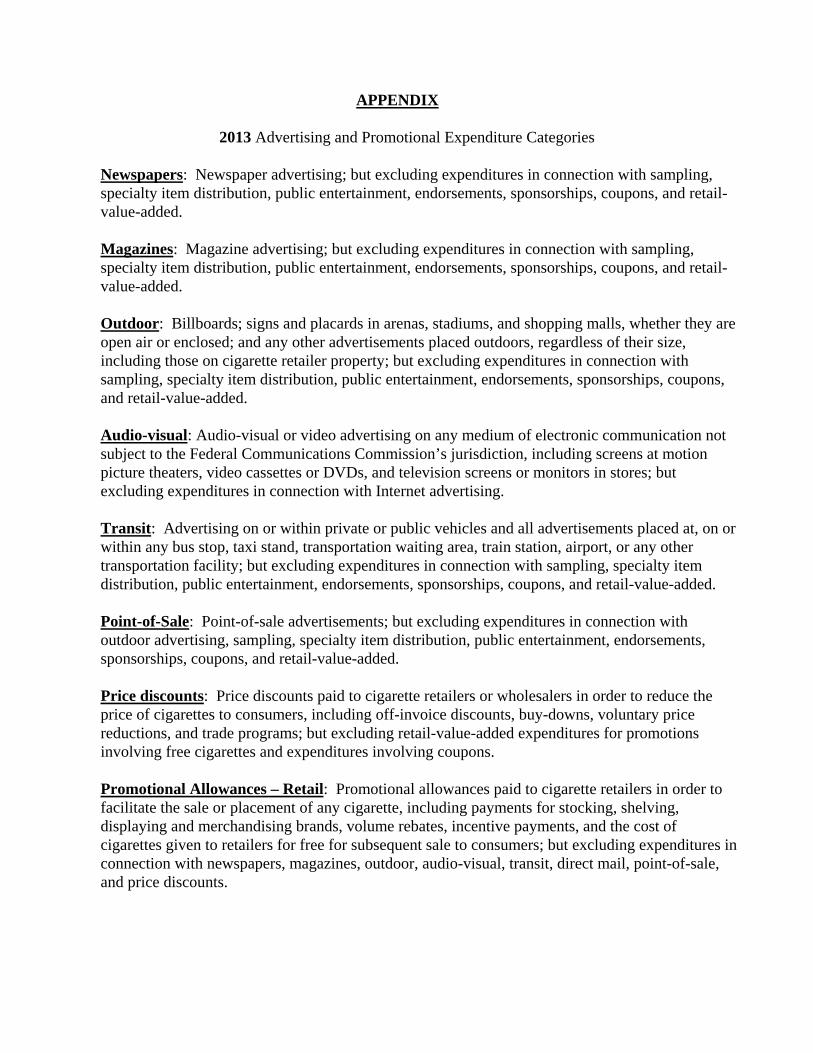
2013 Advertising and Promotional Expenditure Categories
Newspapers: Newspaper advertising; but excluding expenditures in connection with sampling, specialty item distribution, public entertainment, endorsements, sponsorships, coupons, and retail-value-added. Magazines: Magazine advertising; but excluding expenditures in connection with sampling, specialty item distribution, public entertainment, endorsements, sponsorships, coupons, and retail-value-added. Outdoor: Billboards; signs and placards in arenas, stadiums, and shopping malls, whether they are open air or enclosed; and any other advertisements placed outdoors, regardless of their size, including those on cigarette retailer property; but excluding expenditures in connection with sampling, specialty item distribution, public entertainment, endorsements, sponsorships, coupons, and retail-value-added. Audio-visual: Audio-visual or video advertising on any medium of electronic communication not subject to the Federal Communications Commission’s jurisdiction, including screens at motion picture theaters, video cassettes or DVDs, and television screens or monitors in stores; but excluding expenditures in connection with Internet advertising. Transit: Advertising on or within private or public vehicles and all advertisements placed at, on or within any bus stop, taxi stand, transportation waiting area, train station, airport, or any other transportation facility; but excluding expenditures in connection with sampling, specialty item distribution, public entertainment, endorsements, sponsorships, coupons, and retail-value-added. Point-of-Sale: Point-of-sale advertisements; but excluding expenditures in connection with outdoor advertising, sampling, specialty item distribution, public entertainment, endorsements, sponsorships, coupons, and retail-value-added. Price discounts: Price discounts paid to cigarette retailers or wholesalers in order to reduce the price of cigarettes to consumers, including off-invoice discounts, buy-downs, voluntary price reductions, and trade programs; but excluding retail-value-added expenditures for promotions involving free cigarettes and expenditures involving coupons. Promotional Allowances – Retail: Promotional allowances paid to cigarette retailers in order to facilitate the sale or placement of any cigarette, including payments for stocking, shelving, displaying and merchandising brands, volume rebates, incentive payments, and the cost of cigarettes given to retailers for free for subsequent sale to consumers; but excluding expenditures in connection with newspapers, magazines, outdoor, audio-visual, transit, direct mail, point-of-sale, and price discounts.
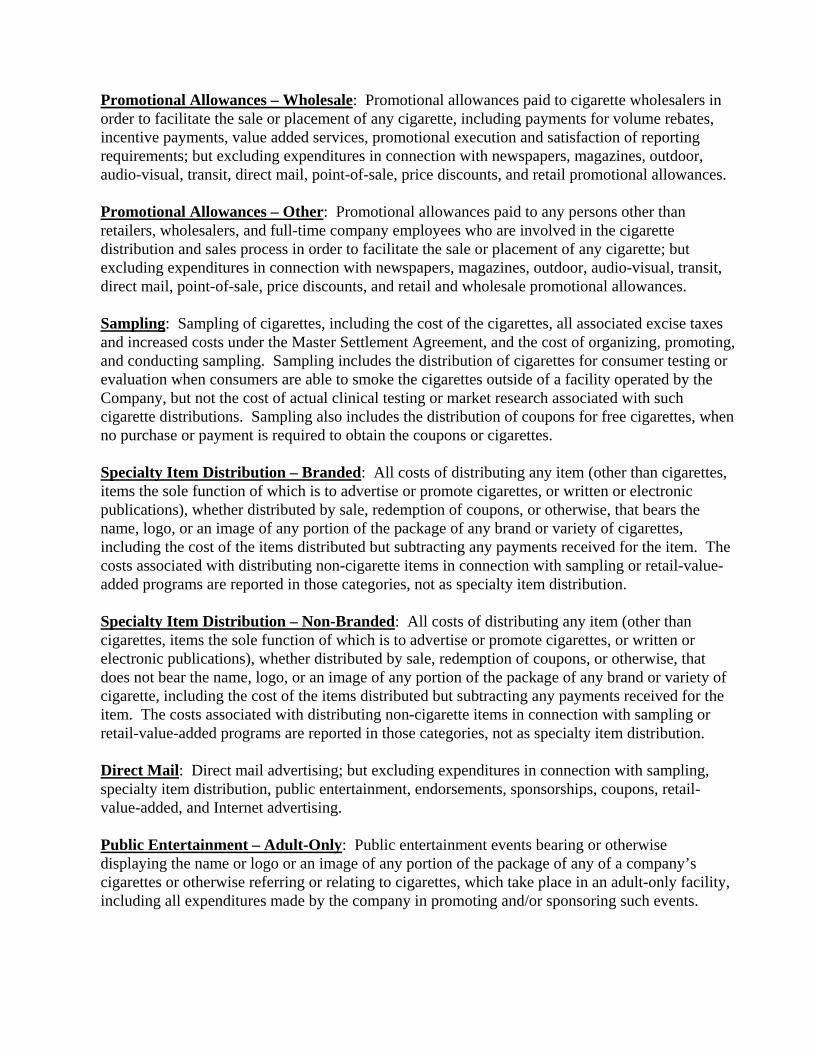
Promotional Allowances – Wholesale: Promotional allowances paid to cigarette wholesalers in order to facilitate the sale or placement of any cigarette, including payments for volume rebates, incentive payments, value added services, promotional execution and satisfaction of reporting requirements; but excluding expenditures in connection with newspapers, magazines, outdoor, audio-visual, transit, direct mail, point-of-sale, price discounts, and retail promotional allowances. Promotional Allowances – Other: Promotional allowances paid to any persons other than retailers, wholesalers, and full-time company employees who are involved in the cigarette distribution and sales process in order to facilitate the sale or placement of any cigarette; but excluding expenditures in connection with newspapers, magazines, outdoor, audio-visual, transit, direct mail, point-of-sale, price discounts, and retail and wholesale promotional allowances. Sampling: Sampling of cigarettes, including the cost of the cigarettes, all associated excise taxes and increased costs under the Master Settlement Agreement, and the cost of organizing, promoting, and conducting sampling. Sampling includes the distribution of cigarettes for consumer testing or evaluation when consumers are able to smoke the cigarettes outside of a facility operated by the Company, but not the cost of actual clinical testing or market research associated with such cigarette distributions. Sampling also includes the distribution of coupons for free cigarettes, when no purchase or payment is required to obtain the coupons or cigarettes. Specialty Item Distribution – Branded: All costs of distributing any item (other than cigarettes, items the sole function of which is to advertise or promote cigarettes, or written or electronic publications), whether distributed by sale, redemption of coupons, or otherwise, that bears the name, logo, or an image of any portion of the package of any brand or variety of cigarettes, including the cost of the items distributed but subtracting any payments received for the item. The costs associated with distributing non-cigarette items in connection with sampling or retail-value-added programs are reported in those categories, not as specialty item distribution. Specialty Item Distribution – Non-Branded: All costs of distributing any item (other than cigarettes, items the sole function of which is to advertise or promote cigarettes, or written or electronic publications), whether distributed by sale, redemption of coupons, or otherwise, that does not bear the name, logo, or an image of any portion of the package of any brand or variety of cigarette, including the cost of the items distributed but subtracting any payments received for the item. The costs associated with distributing non-cigarette items in connection with sampling or retail-value-added programs are reported in those categories, not as specialty item distribution. Direct Mail: Direct mail advertising; but excluding expenditures in connection with sampling, specialty item distribution, public entertainment, endorsements, sponsorships, coupons, retail-value-added, and Internet advertising. Public Entertainment – Adult-Only: Public entertainment events bearing or otherwise displaying the name or logo or an image of any portion of the package of any of a company’s cigarettes or otherwise referring or relating to cigarettes, which take place in an adult-only facility, including all expenditures made by the company in promoting and/or sponsoring such events.
Public Entertainment – General-Audience: Public entertainment events bearing or otherwise displaying the name or logo or an image of any portion of the package of any of a company’s cigarettes or otherwise referring or relating to cigarettes, which do not take place in an adult-only facility, including all expenditures made by the company in promoting and/or sponsoring such events. Retail-Value-Added – Bonus Cigarettes: Retail-value-added expenditures for promotions involving free cigarettes (e.g., buy two packs, get one free), whether or not the free cigarettes are physically bundled together with the purchased cigarettes, including all expenditures and costs associated with the value added to the purchase of cigarettes (e.g., excise taxes paid for the free cigarettes and increased costs under the Master Settlement Agreement). Retail-Value-Added – Non-Cigarette Bonus: Retail-value-added expenditures for promotions involving free non-cigarettes items (e.g., buy two packs, get a cigarette lighter), including all expenditures and costs associated with the value added to the purchase of cigarettes. Coupons: All costs associated with coupons for the reduction of the retail cost of cigarettes, whether redeemed at the point-of-sale or by mail, including all costs associated with advertising or promotion, design, printing, distribution, and redemption. However, when coupons are distributed for free cigarettes and no purchase or payment is required to obtain the coupons or the cigarettes, these activities are considered to be sampling and not couponing. Sponsorships: Sponsorships of sports teams or individual athletes, but excluding endorsements. Endorsements & Testimonials: Endorsements, testimonials, and product placement. Company Website: All expenditures associated with advertising on any company Internet website. Internet – Other: Internet advertising other than on the Company’s own Internet website, including on the World Wide Web, on commercial on-line services, and through electronic mail messages; but excluding costs associated with social media marketing. Telephone: Telephone advertising, including costs associated with the placement of telemarketing calls or the operation of incoming telephone lines that allow consumers to participate in any promotion or hear pre-recorded product messages; but excluding costs associated with having customer service representatives available for responding to consumer complaints or questions. Social Media Marketing: All expenditures for social media marketing on Web sites or other online services or communities, including but not limited to social networking sites, microblogging sites, content-sharing sites, and blogs. All Other: Advertising and promotional expenditures not covered by another category.