Embed Size (px)
Citation preview
CONGRESS OF THE UNITED STATESCONGRESSIONAL BUDGET OFFICE AUGUST 1990
Federal Taxation of Tobacco,Alcoholic Beverages, andMotor Fuels
A CBO STUDY
CBO Publication#519
CONGRESSIONAL
BUDGET OFFICE
Second and D Streets, S.W.
Washington, D.C. 20515
S U M M A R Y
June 1990
CBO STUDY ON FEDERAL TAXATION OF TOBACCO,ALCOHOLIC BEVERAGES, AND MOTOR FUELS
The federal government draws only a small portion of its revenues from excisetaxes on tobacco, alcoholic beverages, and motor fuels. Over the last 40 years,the share of these taxes in federal revenues has been declining. Some sentimenthas been expressed for reconsidering the role of these taxes, partly to reduce thebudget deficit but also because of the role that such excise taxes might play infederal health, safety, energy, and environmental programs.
The CBO study, Federal Taxation of Tobacco, Alcoholic Beverages, and Mo-tor Fuels, analyzes some illustrative tax increases. It focuses on how the in-creases would affect family incomes, and to a lesser degree on whether theywould serve other policy goals. The options in CBO's study are: doubling the cig-arette tax from 16 cents to 32 cents per pack; equalizing the tax on all alcoholicbeverages at $16.00 per proof-gallon ($0.25 per ounce of pure alcohol); and rais-ing the gasoline tax from 9 cents to 21 cents per gallon and the tax on highwaydiesel fuel from 15 cents to 27 cents per gallon. Because excise taxes are thoughtto place a disproportionate burden on lower-income families, the report also ana-lyzes measures that would reduce the burden for these families—through in-creases in the Food Stamp program and in the earned income tax credit.
The tax increases would burden lower-income families relatively more thanother families, when the increases are measured relative to family incomes.Taking account of the effects of the tax increases on the price level and, as a re-sult, on income taxes and transfer payments, would reduce but not eliminate therelatively greater burden on lower-income families. If the effects of the excisetax increases are measured relative to total annual family expenditures, whichsome people view as a better reflection of a family's economic circumstances thanis its income for a single year, the net tax increases for lower-income familieswould be similar to those for other families.
Questions regarding the analysis should be directed to Frank Sammartinoof CBO's Tax Analysis Division at (202) 226-2692. The Office of Intergovern-mental Relations is CBO's Congressional liaison office and can be reached at226-2600. For additional copies of the report, please call the CBO PublicationsOffice at 226-2809.
FEDERAL TAXATION OF TOBACCO,ALCOHOLIC BEVERAGES, AND
MOTOR FUELS
The Congress of the United StatesCongressional Budget Office
For sale by the Superintendent of Documents, U.S. Government Printing OfficeWashington, D.C. 20402

PREFACE
In 1989, federal excise taxes on tobacco, alcoholic beverages, and motorfuels raised $24.4 billion in revenue-about 2.5 percent of total federalrevenues. At the request of the Subcommittee on Human Resources ofthe House Committee on Ways and Means, this study examines cur-rent federal taxation of tobacco, alcoholic beverages, and motor fuels,and the likely effects of an illustrative set of increases in those taxes.In accordance with the mandate of the Congressional Budget Office(CBO) to provide objective and impartial analysis, the study containsno recommendations.
Frank Sammartino of CBO's Tax Analysis Division prepared thestudy under the direction of Rosemary Marcuss and Joseph Cordes.Len Burman, Maureen Griffin, and Eric Nicholson made importantcontributions to the report. Many people provided valuable commentson earlier drafts, including Robert Hartman, Richard Kasten, StephenLong, David Montgomery, Rosemarie Nielsen, Kathleen O'Connell,Linda Radey, Frederick Ribe, Steven Sheingold, Frances Sussman, andRoberton Williams. Richard Kasten and Frank Sammartino developedthe CBO tax simulation models used in the study. Eric Nicholson pre-pared the background tables contained in Appendix A.
Francis Pierce and Sherry Snyder edited the manuscript, NancyH. Brooks provided editorial assistance, Denise Thomas typed themany tables, and Kathryn Quattrone prepared the paper for publi-cation.
Robert D. ReischauerDirector
August 1990

CONTENTS
SUMMARY AND INTRODUCTION xiii
I THE ROLE OF FEDERALEXCISE TAXES 1
Are Excise Taxes Fair? 2Do Excise Taxes Interfere with
Consumer Choice? 4Federal Excise Taxes and
State Revenues 5
H AN OVERVIEW OF FEDERALTOBACCO, ALCOHOLIC BEVERAGE,AND MOTOR FUELS TAXATION 7
Trends in Federal Revenuesand Rates 7
Trends in Tobacco, Alcohol, andMotor Fuel Consumption 15
The Total Tax Burden on Tobacco,Alcoholic Beverages,and Motor Fuels 19
m WHO BUYS TOBACCO, ALCOHOLICBEVERAGES, AND MOTOR FUELS? 25
Average Family Expenditures 25Families with Tobacco, Alcoholic Beverage,
and Motor Fuel Expenditures 33
IV THE ECONOMIC COSTS OF SMOKING,DRINKING, AND DRIVING 39
Tobacco and Alcohol 40Motor Fuels 56
vi FEDERAL EXCISE TAXES August 1990
V THE DISTRIBUTIONAL EFFECTSOF INCREASES IN FEDERAL TAXESON TOBACCO, ALCOHOLICBEVERAGES, AND MOTOR FUELS 65
Excise Taxes, Prices, andConsumption 67
The Distribution of Excise TaxIncreases Among Families 75
Options That Would Offset the Regressivityof an Excise Tax Increase 80
VI OTHER EFFECTS OF EXCISETAX INCREASES 87
Effects on the Economy of an Increasein Excise Taxes on Motor Fuels 88
Regional Effects 91Tax Collection and Compliance 93
APPENDIXES
A Background Data on Excise TaxRevenues and Tax Rates 101
B Sources and Treatment of the Data 123
CONTENTS vu
TABLES
1. Projected Weighted-Average PovertyThresholds in 1990, by Size of Family 27
2. Average Family Income and Expenditures,by Adjusted Post-Tax Income Quintiles,Age of Family Head, and Region, 1990 28
3. Expenditures on Tobacco, AlcoholicBeverages, and Motor Fuels as Percentagesof Post-Tax Family Income and TotalExpenditures, by Adjusted Post-TaxIncome Quintiles, Age of Family Head,and Region, 1990 29
4. Expenditures on Distilled Spirits, Beer, andWine as a Percentage of Post-Tax FamilyIncome and of Total Expenditures, byAdjusted Post-Tax Income Quintiles, 1990 31
5. Share of Family Income and Expendituresby Adjusted Post-Tax Income Quintiles,Age of Family Head, and Region, 1990 33
6. Expenditures on Tobacco, AlcoholicBeverages, and Motor Fuels for FamiliesWith Expenditures, by Adjusted Post-TaxIncome Quintiles, Age of Family Head,and Region, 1990 34
7. Expenditures on Tobacco, AlcoholicBeverages, and Motor Fuels as a Percentageof Post-Tax Family Income and of TotalExpenditures for Families with Expenditures,by Adjusted Post-Tax Income Quintiles, 1990 36
viii FEDERAL EXCISE TAXES August 1990
8. Distribution of Expenditures on Tobacco,Alcoholic Beverages, and Motor Fuels, byAdjusted Post-Tax Income Quintiles, Ageof Family Head, and Region, 1990 37
9. Effects of Increasing Cigarette, AlcoholicBeverage, and Motor Fuel Taxes, byAdjusted Post-Tax Income Quintiles,Age of Family Head, and Region, 1990 78
10. Average Net Tax Increase and AverageBenefit Increase from Food Stamp andEITC Options, by Adjusted Post-TaxIncome Quintiles, 1990 84
11. Average Net Tax Increase for Familiesin the Lowest Income Quintile, by Ageof Head of Family, 1990 85
12. Average Net Tax Increase and AverageBenefit Increase from Food Stamp andEarned Income Tax Credit Options forFamilies in the Lowest Income Quintilewith Age of Family Head Under 60,1990 86
A-l. Total Federal Excise Tax Revenues,Fiscal Years 1950-1989 102
A-2. Federal Tobacco Tax Revenues,Fiscal Years 1950-1989 103
A-3. Federal Alcoholic Beverage Tax Revenues,Fiscal Years 1950-1989 104
A-4. Federal Motor Fuel Tax Revenues,Fiscal Years 1950-1989 105
CONTENTS
A-5. Federal Cigarette, Alcoholic Beverage,and Motor Fuel Excise Tax Rates asof December 31,1950-1989 106
A-6. Federal Cigarette and Gasoline Taxesas a Percentage of Cigarette and GasolinePrices, 1950-1989 108
A-7. Federal Excise Tax Revenue per Dollarof Expenditure on Distilled Spirits,Beer, and Wine, 1950-1988 109
A-8. Total Consumption of Cigarettes,Alcoholic Beverages, and Motor Fuels,1950-1988 110
A-9. Per Capita Consumption (Ages 16 andOver) of Cigarettes, Alcoholic Beverages,and Motor Fuels, 1950-1988 111
A-10. State Sales Tax Revenues, 1950-1988 112
A-l 1. State Sales Tax Revenues as a Percentageof Total State Tax Revenues, 1950-1988 113
A-12. State Sales Tax Revenues, by State, 1988(In billions of dollars) 114
A-13. State Sales Tax Revenues, by State, 1988(As a percentage of total tax revenues) 115
A-14. State Tax Rates for Cigarettes,Alcoholic Beverages, and Gasoline 116
A-15. Tax Revenues by Source as a Percentageof Total Tax Revenues in OECDCountries, 1987 118
x FEDERAL EXCISE TAXES August 1980
A-16. Percentage of Taxes in Retail CigarettePrices in OECD Countries, 1987 119
A-17. Percentage of Taxes in Retail Prices ofAlcoholic Beverages for Home Consumptionin OECD Countries, 1988 120
A-18. Percentage of Taxes in Retail GasolinePrices in OECD Countries, FourthQuarter 1988 121
A-19. Percentage of Taxes in Retail AutomotiveDiesel Fuel Prices in OECD Countries,Fourth Quarter 1988 122
FIGURES
S-l. Share of Total Tax Revenues in OECDCountries by Tax Source, 1987 xiv
S-2. Federal Excise Tax Revenues, FiscalYear 1989 xv
S-3. Federal Excise Tax Revenues as a Percentageof Total Federal Tax Revenues,Fiscal Years 1950-1989 xvi
S-4. Distributional Effects Among Families ofIncreasing Taxes on Cigarettes, AlcoholicBeverages, and Motor Fuels, 1990(By income group) xxiii
S-5. Distributional Effects Among Families ofIncreasing Taxes on Cigarettes, AlcoholicBeverages, and Motor Fuels, 1990(By head-of-family age group) xxiv
CONTENTS
1. State Sales Tax Revenues as a Percentageof Total State Tax Revenues, 1950-1988 6
2. Federal Excise Tax Revenues as a Percentageof Gross National Product, Fiscal Years1950-1989 8
3. Federal Excise Tax Rates as ofDecember 31,1950-1989 12
4. Federal Excise Taxes as a Percentageof Price, 1950-1989 13
5. Federal Excise Tax Revenues as aPercentage of Expenditures on DistilledSpirits, Beer, and Wine, 1950-1988 14
6. Total U.S. Consumption of Cigarettes,Alcoholic Beverages, and Motor Fuels,1950-1988 16
7. Annual per Capita Consumption ofCigarettes, Alcoholic Beverages, andMotor Fuels by the U.S. PopulationAge 16 and Over, 1950-1988 17
8. Share of Sales Taxes in Cigarette Pricesin OECD Countries, 1987 21
9. Share of Sales Taxes in Gasoline Prices inOECD Countries, Fourth Quarter 1988 22

SUMMARY AND INTRODUCTION
Excise taxes are taxes on the consumption of specific goods and ser-vices. Consumption taxes are not an important source of federal reve-nue, although they figure largely in the budgets of many states andlocalities. In 1989, excise taxes accounted for less than 3.5 percent offederal revenues.
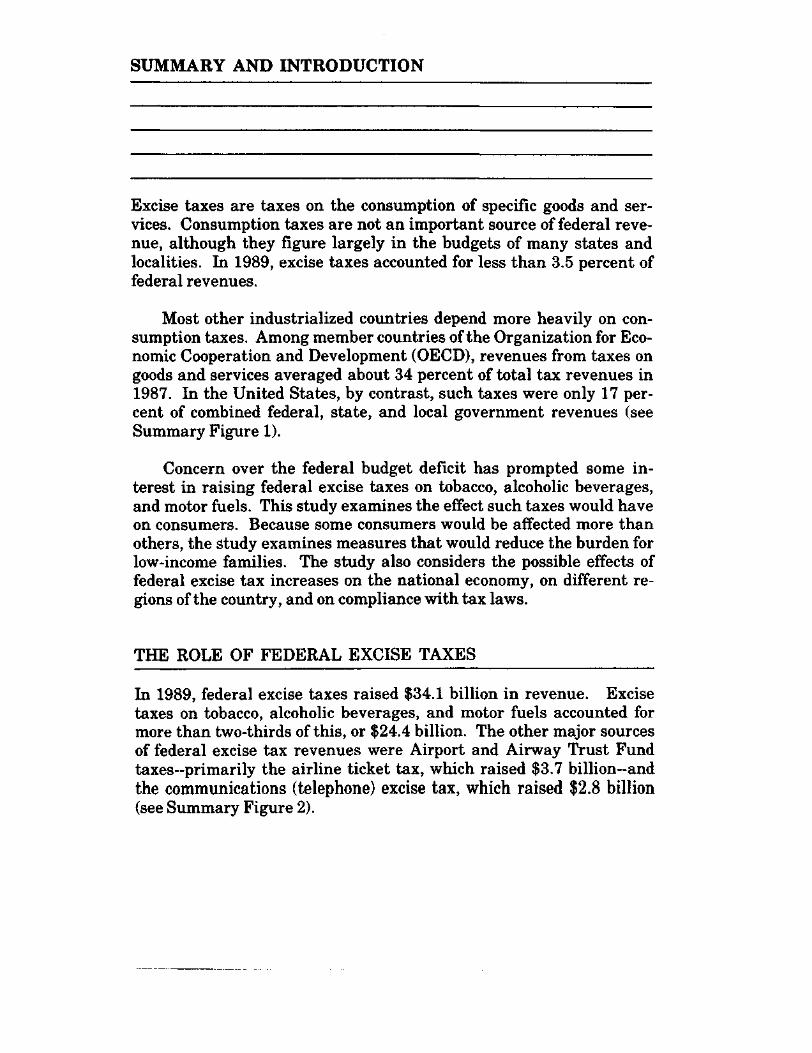
Most other industrialized countries depend more heavily on con-sumption taxes. Among member countries of the Organization for Eco-nomic Cooperation and Development (OECD), revenues from taxes ongoods and services averaged about 34 percent of total tax revenues in1987. In the United States, by contrast, such taxes were only 17 per-cent of combined federal, state, and local government revenues (seeSummary Figure 1).
Concern over the federal budget deficit has prompted some in-terest in raising federal excise taxes on tobacco, alcoholic beverages,and motor fuels. This study examines the effect such taxes would haveon consumers. Because some consumers would be affected more thanothers, the Study examines measures that would reduce the burden forlow-income families. The study also considers the possible effects offederal excise tax increases on the national economy, on different re-gions of the country, and on compliance with tax laws.
THE ROLE OF FEDERAL EXCISE TAXES
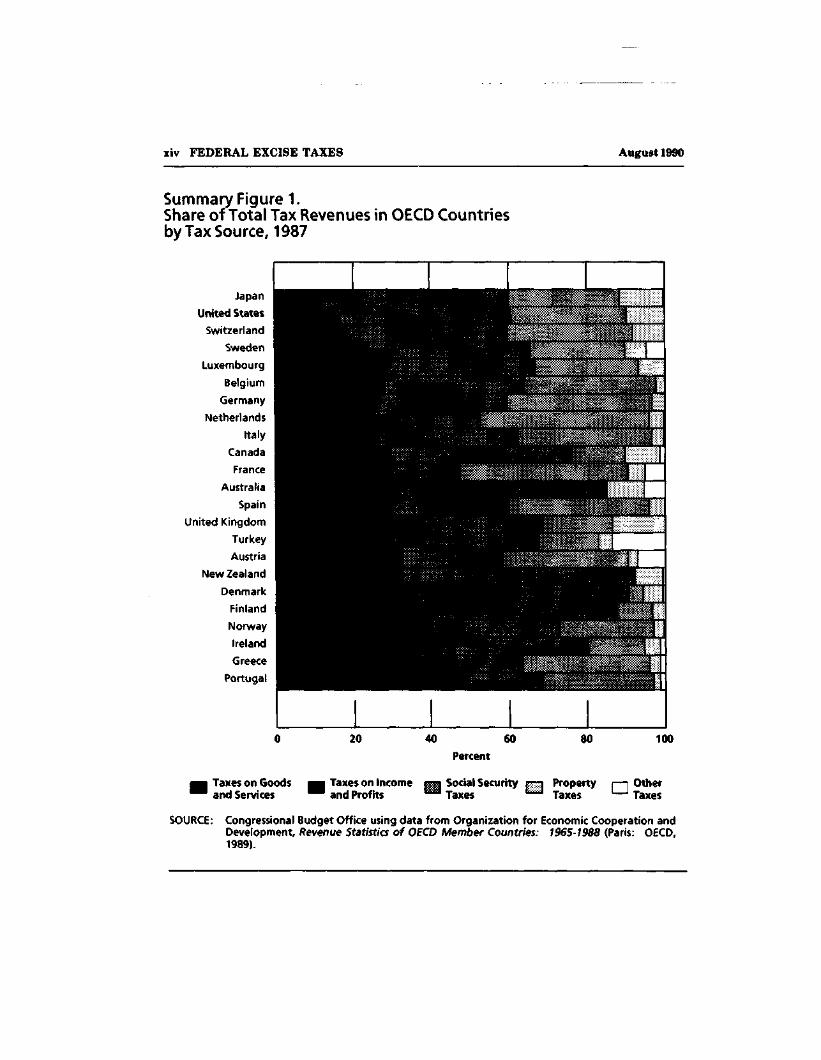
In 1989, federal excise taxes raised $34.1 billion in revenue. Excisetaxes on tobacco, alcoholic beverages, and motor fuels accounted formore than two-thirds of this, or $24.4 billion. The other major sourcesof federal excise tax revenues were Airport and Airway Trust Fundtaxes-primarily the airline ticket tax, which raised $3.7 billion~andthe communications (telephone) excise tax, which raised $2.8 billion(see Summary Figure 2).
xiv FEDERAL EXCISE TAXES August 1990
Summary Figure 1.Share of Total Tax Revenues in OECD Countriesby Tax Source, 1987
Japan
United States
Switzerland
Sweden
Luxembourg
Belgium
Germany
Netherlands
Italy
Canada
France
Australia
Spain
United Kingdom
Turkey
Austria
New Zealand
Denmark
Finland
Norway
Ireland
Greece
Portugal
100
Taxes on Goodsand Services
Taxes on Incomeand Profits
Percent
I Social SecurityTaxes
PropertyTaxes
I—| OtherL—' Taxes
SOURCE: Congressional Budget Office using data from Organization for Economic Cooperation andDevelopment, Revenue Statistics of OECD Member Countries: 1965-1988 (Paris: OECD,1989).
SUMMARY AND INTRODUCTION
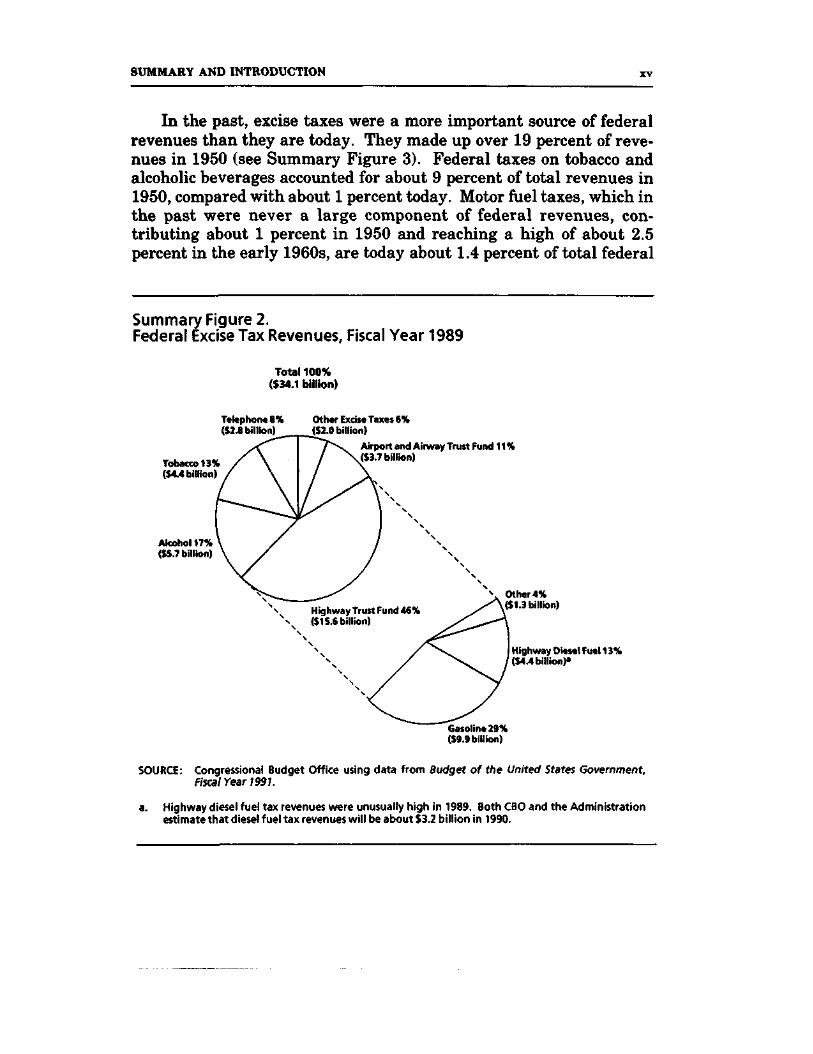
In the past, excise taxes were a more important source of federalrevenues than they are today. They made up over 19 percent of reve-nues in 1950 (see Summary Figure 3). Federal taxes on tobacco andalcoholic beverages accounted for about 9 percent of total revenues in1950, compared with about 1 percent today. Motor fuel taxes, which inthe past were never a large component of federal revenues, con-tributing about 1 percent in 1950 and reaching a high of about 2.5percent in the early 1960s, are today about 1.4 percent of total federal
Summary Figure 2.Federal Excise Tax Revenues, Fiscal Year 1989
Total 100%($34.1 billion)
Telephone 8% Other Excise Taxes 6%($2.8 billion) ($2.0 billion)
Tobacco 13%($44 billion)
Alcohol 17%($5.7 billion)
Airport and Airway Trust Fund 11 %($3.7 billion)
Highway Trust Fund 46%($15.6 billion)
Other 4%($1.3 billion)
Highway Diesel Fuel 13%($44 billion)'
Gasoline 29%($9.9 billion)
SOURCE: Congressional Budget Office using data from Budget of the United States Government,Fiscal Year 1991.
a. Highway diesel fuel tax revenues were unusually high in 1989. Both CBO and the Administrationestimate that diesel fuel tax revenues will be about $3.2 billion in 1990.
xvi FEDERAL EXCISE TAXES August 1990
revenues—more than the combined percentage of revenues from tobac-co and alcoholic beverage taxes. At the state and local level, however,taxes on these and other goods and services are still an importantsource of revenue.
Excise taxes have not been favored as a source of federal revenuefor several reasons:
o Excise taxes generally are a larger burden for lower-incomefamilies—relative to income—than for middle- and higher-income families.
Summary FigureB.Federal Excise Tax Revenues as a Percentage of Total FederalTax Revenues, Fiscal Years 1950-1989
Percent
1950 1960 1970 1980 1989
Tobacco Alcoholic Beverages Motor Fuels Other Excise Taxes
SOURCES: Congressional Budget Office using data from Budget of the United States Government,Fiscal Years 1952-1991; and Internal Revenue Service.
NOTE: Excise tax revenues in this figure do not include windfall profit tax revenues.
SUMMARY AND INTRODUCTION xvU
o Excise taxes have a varying impact on families with similarincomes. Because some families do not purchase the goodsthat are taxed, or purchase them in smaller quantities thanother families, those with roughly the same incomes pay dif-ferent amounts of excise taxes.
o Excise taxes interfere with the choices of consumers by rais-ing the prices of taxed goods relative to untaxed goods. Tothe extent that consumers respond to these relative pricechanges by reducing their purchases of the taxed goods, re-sources are misallocated and society is made worse off.
o Keeping federal excise taxes low has left that source of reve-nue to states and localities.
In recent years, there has been a greater willingness to considerincreasing some federal excise taxes, supported in part by the followingreasons:
o Excise taxes may not burden lower-income families as muchas they appear to. A family's expenditures may be a betterindicator than its annual income of the family's true eco-nomic circumstances. Measured as a percentage of totalfamily expenditures, excise taxes are more nearly the samefor low-, middle-, and high-income families.
o Collecting different amounts of excise taxes from familieswith the same income may not be unfair if such taxes are re-lated to benefits they receive from well-defined governmentservices.
o Tax-induced price increases for some goods may actually im-prove the allocation of resources if the consumption of thosegoods imposes additional costs on society that are not re-flected in prices. Further, if consumers are not fully aware ofthe harmful effects of certain types of consumption, such assmoking or drinking, they may benefit from price increasesthat discourage purchases of those goods.
xviii FEDERAL EXCISE TAXES August 1990
o State tax revenues from taxes on tobacco, alcoholic bev-erages, and motor fuels are a declining source of total staterevenues. Raising federal excise taxes on those items wouldnot significantly limit the ability of state and local govern-ments to raise revenues.
NOMINAL REVENUES AND REAL REVENUES
Although nominal federal revenues from tobacco and alcoholicbeverage taxes are almost three times as high as they were 40 yearsago, real revenues adjusted for inflation have fallen by more thanone-third since 1950. In contrast, real revenues from motor fuel taxeshave grown almost sixfold over the same period.
Because federal excise taxes on tobacco, alcoholic beverages, andmotor fuels are levied on a per unit basis (that is, as cents per pack orper gallon), real revenues will fall over time as the price level rises un-less statutory tax rates are increased or consumption grows rapidly.
Federal taxes on tobacco and alcoholic beverages have had fewincreases in the past 40 years. Taxes on cigarettes were doubled in1983, but had not previously been increased since 1951. The federaltax on distilled spirits was not increased between 1951 and 1985, whenit was raised by 19 percent. Taxes on beer and table wines have notchanged since 1951. The federal tax on gasoline was more thandoubled in 1983, after not being increased since the late 1950s.
WHO BUYS TOBACCO, ALCOHOLIC BEVERAGES,AND MOTOR FUELS?
Although higher-income families spend more on tobacco, alcoholic bev-erages and motor fuels than lower-income families, the latter spend alarger percentage of their income on all three items than do middle-and upper-income families.
Measured as a percentage of total expenditures, however, outlayson these goods tend to be more equal across family income classes. In
SUMMARY AND INTRODUCTION xix
particular, expenditures on alcoholic beverages tend to rise as a per-centage of total expenditures as family income increases, if adjust-ments are made for family size. Expenditures on tobacco are a smallerpercentage of total expenditures as family income increases, whilemotor fuel expenditures are about the same percentage of total ex-penditures among all income groups except the highest, for whom theyare a smaller share of the total family budget.
The older the head of the family, the smaller these expendituresbecome in relation to family income and total family expenditures.Families headed by someone under age 30, including single-personfamilies, spend a much larger share of their income and a larger shareof their total family budget on these goods than all other families.
Rural families spend a larger fraction of their income on motorfuels than other families, while families in the Northeast spend thesmallest part of their income on motor fuels. Families in the Westspend a smaller percentage of their income on tobacco than otherfamilies.
Not all families, of course, purchase tobacco, alcoholic beverages,and motor fuels. About 45 percent of families buy cigarettes or tobaccoproducts, 70 percent buy alcoholic beverages, and nearly 95 percentbuy motor fuels at some time during the year. Among those with thelowest incomes, fewer than half buy any tobacco products or alcoholicbeverages, while about 80 percent buy motor fuels at some time duringthe year. Among families headed by a person age 75 or over, only 20percent buy any cigarettes or tobacco, while fewer than half buy al-coholic beverages.
THE ECONOMIC COSTS OF SMOKING,DRINKING, AND DRIVING
Some of the costs of smoking, drinking, and driving are not paid byproducers or consumers of those products but by other members ofsociety. These costs include the presumptive effects of cigarette smokeon the health of nonsmokers, the lives and property lost in alcohol-
xx FEDERAL EXCISE TAXES August 1990
related accidents, and the environmental damage from automobileemissions.
If the market prices of tobacco, alcoholic beverages, and motorfuels do not fully reflect such "external costs," one way to adjust pricesis to levy excise taxes on those goods. To the extent that the taxes raiseprices and reduce demand, less of the taxed good or activity is pro-duced, which in turn reduces external costs. Restricting such goodsand activities can be beneficial to society if the external costs avoidedexceed the value of the reduction in output caused by the tax. In thisrespect, excise taxes on goods that generate external costs differ fromexcise taxes on other goods. There is no benefit to society from re-stricting the output of a good whose consumption is not associated withexternal costs. In taxing the latter, scarce resources are allocated lessefficiently, so the economy loses more than the government gains fromthe taxes.
There may be further benefits to restricting smoking and drinkingif consumers underestimate the potential harm to themselves fromsuch consumption, or if consumers are fully aware of the risks but areunable to reduce their consumption because of habit or addiction.
It is difficult to say whether raising current excise taxes on tobac-co, alcoholic beverages, and motor fuels would lower external costs byenough to result in net gains to society. First, measuring externalcosts is uncertain because one must estimate the health damagecaused by certain types of consumption and place a value on the addi-tional illnesses and premature deaths caused by such consumption.
Second, external costs vary depending on how, where, and bywhom a good is consumed. For example, a tax on gasoline levied in theinterests of controlling pollution will be borne not only by drivers indensely populated urban regions where pollution is a serious problem,but also by drivers in sparsely settled regions where the environmentcan easily absorb automobile emissions. A tax on alcoholic beverageslevied to reduce alcohol-related traffic accidents will tax not only thosewho drink and drive but also more conscientious drinkers.
SUMMARY AND INTRODUCTION xxi
Finally, an excise tax may not be the most efficient way to reduce agiven external cost. Direct control of automobile emissions may bemore effective than a gasoline tax in reducing pollution. Stricterenforcement of driving-while-intoxicated laws may do more to reducealcohol-related fatalities than raising taxes on alcoholic beverages.Nevertheless, higher excise taxes may be desirable as part of anintegrated policy to reduce the economic costs of smoking, drinking,and driving.
THE DISTRIBUTIONAL EFFECTS OFAN INCREASE IN TAXES
The Congressional Budget Office (CBO) has simulated the distribu-tional effects of three separate excise tax increases:
o Doubling the cigarette tax from 16 cents to 32 cents per pack;
o Equalizing the tax on all alcoholic beverages at $16.00 perproof-gallon ($0.25 per ounce of pure alcohol), raising the taxon a 750-milliliter bottle of 80-proof spirits from $1.98 to$2.54, raising the tax on a six-pack of beer from 16 cents toabout 81 cents, and raising the tax on a 750-milliliter bottleof table wine from 3 cents to about 76 cents;
o Raising the gasoline tax from 9 cents to 21 cents per gallon,and raising the tax on highway diesel fuel from 15 cents to 27cents per gallon.
If effective on October 1, 1990, the cigarette tax increase wouldraise an additional $2.8 billion, the combined alcoholic beverage taxincreases would raise an additional $7.2 billion, and the motor fuel taxincreases would raise an additional $12.1 billion in fiscal year 1991.
These options are representative of those that have been suggestedin recent debate. They are not necessarily the specific excise tax in-creases that would correct for the external costs of tobacco, alcoholicbeverage, and motor fuel consumption.
xxii FEDERAL EXCISE TAXES August 1990
If prices rose by the full amount of a tax increase without addi-tional markups, tax increases of these magnitudes could be expected toreduce consumption of cigarettes by 4 percent to 8 percent, consump-tion of beer by 5 percent to 13 percent, of wine by 17 percent to 25percent, and of distilled spirits by 4 percent to 7 percent. The numberof gallons of gasoline consumed would be reduced by about 2 percent.
Most of the tax increases would be paid by families who purchasetobacco, alcoholic beverages, and motor fuels. Some of the increaseswould eventually be offset by other changes in taxes and incomes.Higher excise taxes would lead to higher relative prices of the taxedgoods and, in turn, to a higher consumer price level or lower returns tocapital and labor, depending on the response of the Federal Reserve. Ifconsumer prices rose, as assumed here, individual income tax liabili-ties would fall and transfer payments such as Social Security benefitswould increase because of automatic indexing. These effects wouldreduce the burden of all three tax increases on lower-income families.
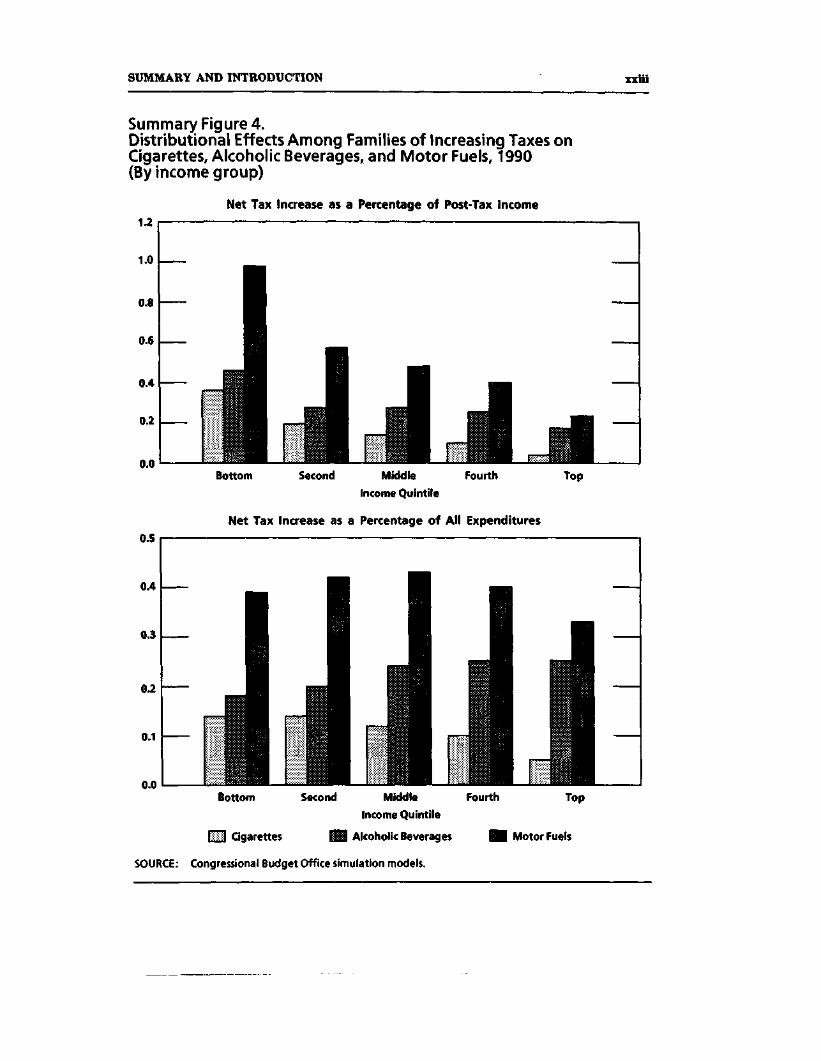
Even with these offsetting changes, the cigarette and motor fueltax increases would be regressive with respect to post-tax family in-come. Although the dollar amount of the net tax increase would besmallest for lower-income families, their net tax increase would be alarger portion of their after-tax income than for middle- and upper-income families (see Summary Figure 4). After offsetting changes inincome taxes and transfer payments had taken place, except for thelowest income families, the tax increase for alcoholic beverages wouldbe nearly proportional as a percentage of post-tax family income.
The tax increases would be less regressive relative to total familyexpenditures, which may be a better measure of a family's expectedeconomic circumstances over a longer period of time. The cigarette andmotor fuel tax increases would be about proportional to total expendi-tures-though both tax increases would be slightly smaller in propor-tion to the total expenditures of upper-income families than to those oflower- and middle-income families-while the alcoholic beverage taxincrease would be slightly progressive—that is, it would take a largerproportion of the total expenditures of higher-income families. Theprogressivity of the alcoholic beverage tax increase may be overstatedif expenditures on alcoholic beverages rise much faster with increasingincome than do the actual quantities consumed.
SUMMARY AND INTRODUCTION xxiii
Summary Figure 4.Distributional Effects Among Families of Increasing Taxes onCigarettes, Alcoholic Beverages, and Motor Fuels, 1990(By income group)
Net Tax Increase as a Percentage of Post-Tax Income
Bottom Second Middle Fourth
Income Quintile
Net Tax Increase as a Percentage of All Expenditures
Top
Bottom Second Middle FourthIncome Quintile
Cigarettes HJ Alcoholic Beverages H Motor Fuels
Top
SOURCE: Congressional Budget Office simulation models.
xxiv FEDERAL EXCISE TAXES August 1990
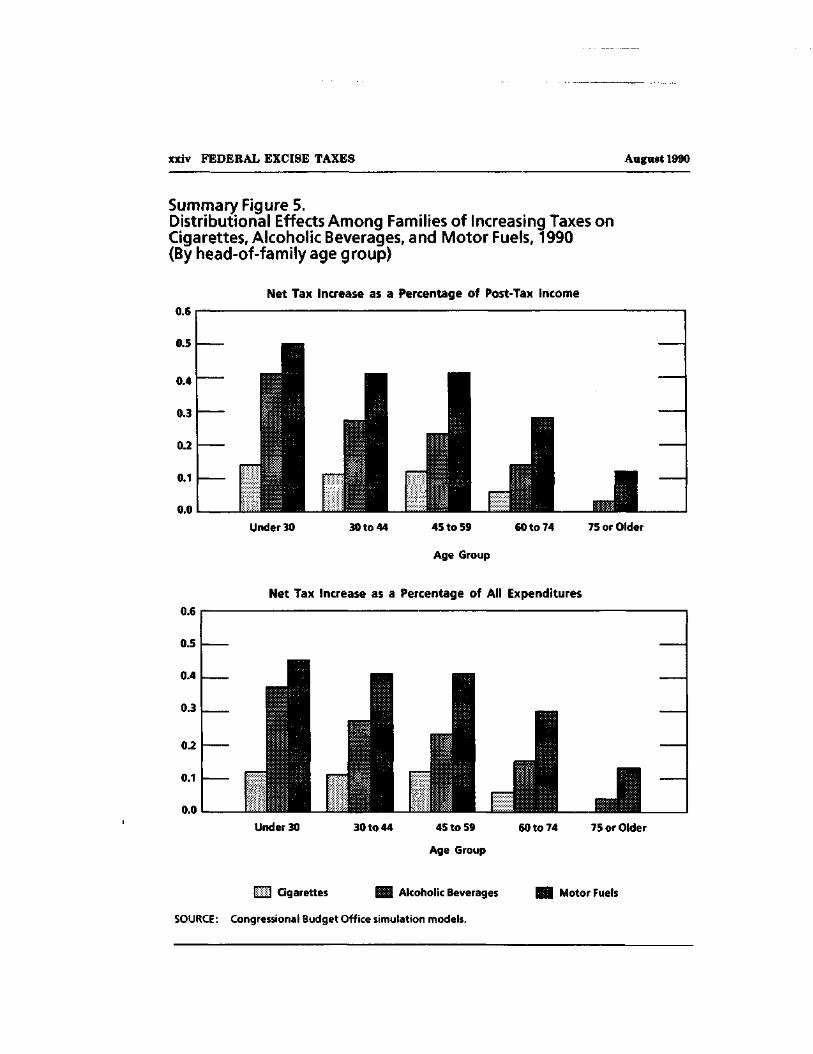
Summary Figure 5.Distributional Effects Among Families of Increasing Taxes onCigarettes, Alcoholic Beverages, and Motor Fuels, 1990(By head-of-family age group)
Net Tax Increase as a Percentage of Post-Tax Income
Under 30 30 to 44 45 to 59 60 to 74 75 or Older
Age Group
Net Tax Increase as a Percentage of All Expenditures
Under 30 30 to 44 45 to 59
Age Group
60 to 74 75 or Older
ill Cigarettes IH Alcoholic Beverages
SOURCE: Congressional Budget Off ice simulation models.
Motor Fuels
SUMMARY AND INTRODUCTION
Elderly families would pay less additional tax under all three op-tions than other families. When the net effects of offsetting changes inincome taxes and transfer payments are included, elderly familieswould pay little or no additional net tax after the cigarette tax in-crease, and would pay a relatively small additional net tax after in-creases in alcoholic beverage or motor fuel taxes (see Summary Fig-ure 5).
Policymakers might want to consider tax and transfer options thatwould compensate low-income families for the tax increase. CBO hasexamined three such options: an increase in food stamp payments; anincrease in the earned income tax credit (EITC); and a combination ofincreases in both food stamps and the EITC. Each option would spend15 percent of the net revenues raised by any of the tax increases. Theincrease in food stamps would provide the highest average benefit tolower-income families. The combined increase in food stamps and theEITC would reach the greatest number of lower-income families andstill would provide average benefit increases that exceeded the averagealcoholic beverage tax increase for those families, and that offset about90 percent of the average motor fuel tax increase and about 60 percentof the average cigarette tax increase.
OTHER EFFECTS OF EXCISE TAX INCREASES
Excise tax increases would affect the economy at large mostly byhelping to reduce the federal deficit.
Aside from their effects on the deficit, excise tax increases wouldraise the relative prices of the taxed goods, which could boost the over-all price level if the nominal money supply was increased to accommo-date the change. Such an increase in prices would be a one-time ad-justment to a new price level. An increase in the relative prices of thetaxed goods would in turn reduce demand for those goods. The impactwould be greater in regions where production of the goods is concen-trated. Demand and production in industries not subject to the highertaxes would respond to the change in relative prices, and investmentand employment would be boosted in industries producing goods for
xxvi FEDERAL EXCISE TAXES August 1990
which demand had increased, so that in the long run there would belittle or no effect on overall output.
An increase in the excise tax on motor fuels would have broader-reaching economic effects than the other tax increases in that motorfuels are used in production and distribution of other products. Theeffects would be muted to the extent that imported petroleum productswould bear the brunt of the reduction in demand.
Consumption of tobacco, alcohol, and motor fuels would decline inresponse to higher federal excise taxes on these goods. Since manystates also collect taxes on the same goods, a decline in consumptionwould reduce the amount of tax revenue collected for given tax rates.
Finally, an increase in excise tax rates would increase incentivesto evade those taxes. Increases in the taxes on tobacco and alcoholicbeverages on the order of those discussed in this study would beunlikely to have a major effect on compliance and tax collection. In thecase of motor fuels, where compliance has been a serious problem inthe past, recent changes in the laws governing collection procedureshave not been in effect long enough to make it possible to predict whatwould happen.
CHAPTER I
THE ROLE OF FEDERAL EXCISE TAXES
Excise taxes, which are taxes on the sale of a particular commodity orservice, are one type of consumption tax. Other types of consumptiontaxes include general sales taxes, which are taxes on the sale of allgoods and services (usually with some exclusions), value-added taxes,which are taxes on the difference between the value of a firm's salesand purchases, and expenditure taxes, which are taxes on people's totalconsumption expenditures. Excise taxes are the only form of consump-tion tax levied at the federal level.
Although taxes on consumption are an important source of reve-nue in many European countries, as well as in many states and locali-ties in the United States, they are a relatively minor source of federalrevenue. The federal government instead relies on a mix of approxi-mately 55 percent income taxes (individual and corporate) and 36percent social insurance payroll taxes (primarily the Social Securitypayroll tax) for the bulk of revenues. Excise taxes make up just over 3percent of total revenues, while estate and gift taxes, customs duties,earnings of the Federal Reserve, and miscellaneous receipts accountfor the remaining 5 percent.
Excise taxes are often criticized for being less equitable or fairthan other taxes. Excise taxes are also thought to interfere with con-sumer choice and thus to reduce economic efficiency. In addition, fed-eral excise taxes may compete with those of state and local govern-ments for revenues. In the past, federal excise taxes have usually beenintroduced or increased as a means of raising revenues during war-time. There has been a greater willingness to reconsider the role of atleast some excise taxes in the federal system in recent years, particu-larly taxes on tobacco, alcoholic beverages, and motor fuels. Part ofthis willingness stems from budget deficits, but part from the role thatexcise taxes can play in federal health, safety, environmental, andenergy policies.
2 FEDERAL EXCISE TAXES August 1990
ARE EXCISE TAXES FAIR?
Excise taxes are often perceived to be inferior to income taxes withrespect to equity or fairness among families, both because they aregenerally more of a burden relative to incomes for lower-income fami-lies, and because they are generally not the same burden for familieswith similar incomes.
Ability to Pay
Unlike a progressive income tax, excise taxes do not differentiateamong taxpayers according to their ability to pay the taxes out of cur-rent income. Although per capita consumption of alcoholic beverages,tobacco, and motor fuels increases as incomes increase, consumption asa percentage of income declines. Excise taxes thus tend to be regres-sive, taxing a larger percentage of the income of lower-income familiesthan of middle- and higher-income families. (A tax is progressive if theratio of taxes to income rises as incomes rise; it is regressive if the ratiofalls as incomes rise; and it is proportional if the ratio is the same at allincome levels.)
The regressivity of excise taxes is overstated if annual income isnot the best indicator of a household's ability to pay. Excise taxes de-pend on family expenditures, which probably are related to an expect-ed long-term level of income rather than to income in a single year.Families whose income has fallen temporarily are likely to maintaintheir previous level of expenditures in the expectation that their annu-al income will return to more normal levels. Young families may wellspend more than 100 percent of their current income because they ex-pect their income to rise over time. Older families may also spendmore than their current income once working members of the familyhave retired and the family has begun to draw on accumulated retire-ment savings. Excise taxes appear much less regressive when measur-ed against total family expenditures, which may better reflect longer-term or permanent income.
Whether lifetime income is a more appropriate measure of abilityto pay than annual income is a matter of debate. While a progressiveincome tax generates higher effective tax rates (tax liabilities as a per-
CHAPTER I THE ROLE OF FEDERAL EXCISE TAXES 3
centage of family income) when a family's income is high, and lowereffective tax rates when income falls, excise taxes work in the reversedirection. Excise taxes may be a fixed percentage of average familyincome over some longer period, but they are a larger percentage offamily income when annual family income is low, and a smaller per-centage of family income when annual family income is high. Thismay not pose a problem if families can easily borrow against the futurewhen their incomes are low and repay such loans when incomes arehigh. But such loans are not possible for many families, and so theirtaxes essentially must be paid out of current income.
Horizontal Equity
Selective excise taxes discriminate against different families with thesame income. Because not all families purchase the same amount ofgoods that are taxed, among families with generally equivalent in-comes some pay more than others. The attribute of horizontal equity,meaning roughly equivalent taxes for families in similar economic cir-cumstances, is an important feature of an equitable tax system.
The absence of discrimination among families with similar in-comes is not always the appropriate criterion for judging fairness, how-ever. Some government services are used by a well-defined portion ofthe population, and in some instances it may be appropriate to requirethose users to pay for their benefits. Excise taxes are one way of charg-ing for some publicly provided goods and services. For example, taxeson gasoline and highway diesel fuel are allocated to the Highway TrustFund to finance construction and maintenance of federal highways andbridges, and some capital expenditures for urban mass transit. Thefederal tax on airline tickets is allocated to the Airport and AirwayTrust Fund to finance capital expenditures for the airway system, andalso to finance some portion of Federal Aviation Administration opera-tions. Tobacco and alcoholic beverage excise taxes might be consideredindirect charges for benefits to the extent that they finance the in-creased use of publicly provided medical care and fire protection ser-vices caused by smokers, and the use of medical care and emergencyservices caused by some consumers of alcoholic beverages.
4 FEDERAL EXCISE TAXES August 1990
DO EXCISE TAXES INTERFERE WITH CONSUMER CHOICE?
In levying excise taxes, the government effectively raises the pricepaid by consumers relative to the price received by producers of thetaxed good. To the extent that this price disparity results in less out-put of those goods, excise taxes cause an inefficient allocation of scarceresources. Resources that would have been used to produce those goodsare used instead in some other, less desirable, way. Economists labelthis additional resource cost the excess burden of a tax. The more con-sumers change their consumption in response to an excise tax, thegreater is the misallocation of resources and the larger is the excessburden from the tax. An economically efficient tax would have no ex-cess burden, and the cost to taxpayers would be limited to the amountof revenues collected from the tax. Because the revenues would even-tually be spent for someone's good, and possibly but not necessarilybenefit the very same people who paid the tax, an economically effi-cient tax would represent only a transfer and not a loss of resources.
Excise taxes are not the only taxes that create an excess burden.By taxing earnings and the returns to saving, for example, an incometax tends to discourage both work and investment, although the size ofthe effects may not be large. While a tax with the smallest excess bur-den per dollar of revenue collected is generally preferable, the excessburden must be compared with the benefits from the additional reve-nues and with alternative methods of raising those revenues.
In some instances changing people's consumption is desirable be-cause the market does not allocate resources in the best way. The pro-duction of certain products may generate additional costs that are notpaid by the consumer but by society. Such indirect or "external" costscould include, for example, some of the medical costs associated withsmoking, some of the costs of alcoholism and alcohol-related accidents,and some of the costs of pollution and congestion associated with theuse of motor fuels. To the extent that these costs are not reflected inthe prices of those goods, consumption of the goods is too high from thestandpoint of economic efficiency. Using taxes to discourage such con-sumption is a way to reallocate resources more efficiently. The taxesserve to incorporate the external costs into the prices paid by con-sumers.
CHAPTER I THE ROLE OF FEDERAL EXCISE TAXES 5
Even if consumers bear all relevant costs of their actions, con-sumption of some products may still be too high. Consumers may over-estimate the value of the goods they consume, either by failing to ap-preciate their harmful effects or by failing to understand their poten-tially addictive nature. A direct way to address this problem is toprovide better and more widely distributed information about the ef-fects of consuming certain goods. But excise taxes can sometimes havea greater impact on consumption than more information. Using excisetaxes to induce people to do what is best for themselves is an uncom-fortable policy for a society that values consumer sovereignty highly.Yet, society employs much stronger inducements to discourage theconsumption of certain products, for example, in prohibiting the sale ofdrugs and narcotics, and restraining certain activities such asgambling.
FEDERAL EXCISE TAXES AND STATE REVENUES
To the extent that federal excise taxes reduce demand for the taxedgoods, the base for state and local taxes on those products is dimin-ished. In 1988, revenues from combined taxes on tobacco, alcoholicbeverages, and motor fuels were about 10 percent of total state taxrevenues. Combined tobacco and alcoholic beverage taxes were 3.0percent of state tax revenues, while motor fuel taxes were an addi-tional 6.5 percent.
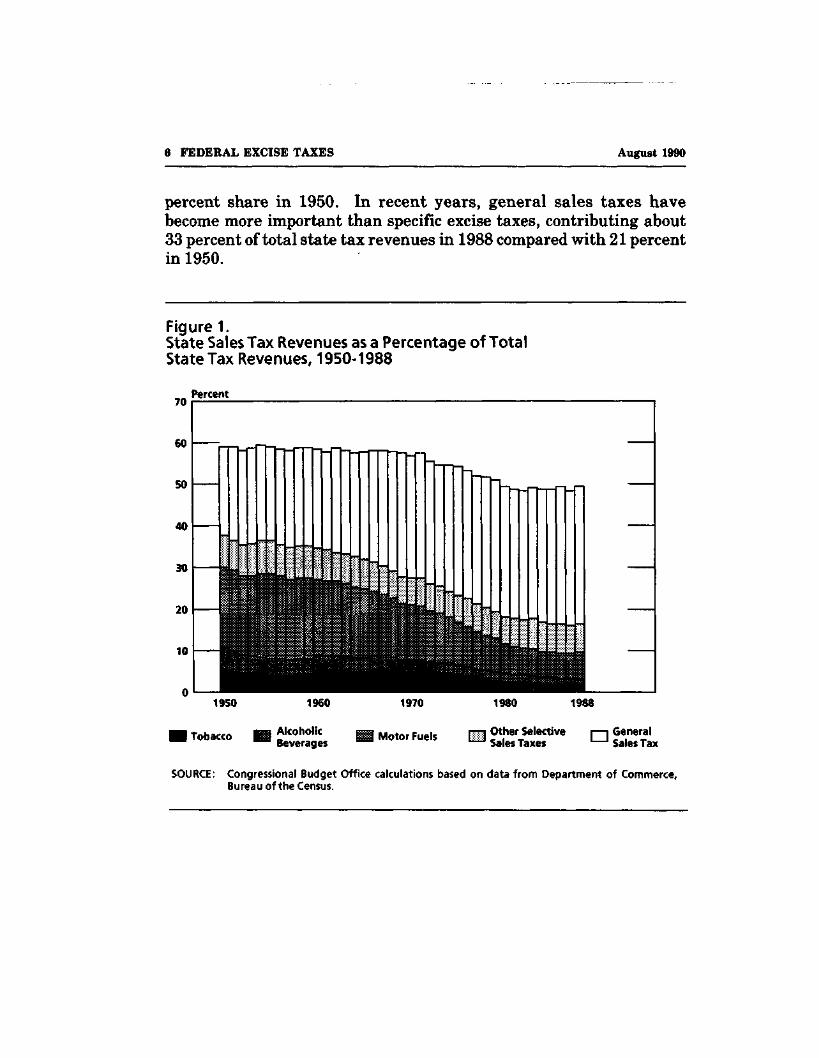
Though excise taxes are still an important source of revenues, theshare of state tax revenues from taxes on tobacco, alcoholic beverages,and motor fuels has declined sharply in the past 40 years. Comparedwith the current 10 percent share, specific taxes on tobacco, alcoholicbeverages, and motor fuels were about 30 percent of total state taxrevenues in 1950 (see Figure 1). Revenues from motor fuels taxesalone were about 20 percent of state tax revenues in the 1950s.
Part of this decline reflects a shift by the states away from salestaxes on goods and services. The share of state tax revenues from allsales taxes, however, has not declined nearly as much as the sharefrom excise taxes. In 1988, 49 percent of state tax revenues came fromeither general sales taxes or specific excise taxes, compared with a 59
6 FEDERAL EXCISE TAXES August 1990
percent share in 1950. In recent years, general sales taxes havebecome more important than specific excise taxes, contributing about33 percent of total state tax revenues in 1988 compared with 21 percentin 1950.
Figure 1.State Sales Tax Revenues as a Percentage of TotalState Tax Revenues, 1950-1988
Percent
AlcoholicBeverages
Other SelectiveSales Taxes
GeneralSales Tax
SOURCE: Congressional Budget Office calculations based on data from Department of Commerce,Bureau of the Census.
CHAPTER II
AN OVERVIEW OF FEDERAL
TOBACCO, ALCOHOLIC BEVERAGE,
AND MOTOR FUEL TAXATION
Revenues from tobacco and alcoholic beverage taxes have failed tokeep up with overall economic growth in the last 40 years. Over thisperiod, inflation has cut effective tax rates on tobacco and alcoholicbeverages to a fraction of their previous values. The federal tax rate oncigarettes has declined by 50 percent in constant dollars since 1950.Over the same period, real federal tax rates on beer and wine havedeclined by about 75 percent while the real tax rate on distilled spiritshas declined by nearly 70 percent. Although consumption of cigarettesand alcoholic beverages has grown over time, the increase has beeninsufficient to offset the decline in real tax rates. As a result, real reve-nues from these sources have fallen by more than a third. In contrast,measured in constant dollars, the federal tax rate on gasoline is aboutthe same as it was 40 years ago, while the real tax rate on highwaydiesel fuel is nearly two-thirds higher than it was at that time. Overthe same period, motor fuel usage has increased significantly, and as aresult, real revenues from motor fuel taxes have increased almost sixtimes since 1950.
In addition to federal excise taxes, all states and many local gov-ernments also levy taxes on tobacco, alcoholic beverages, and motorfuels. Despite the variety of taxes, consumption of all three items istaxed less heavily in the United States than in almost all other indus-trial countries.
TRENDS IN FEDERAL REVENUES AND RATES
Since 1950 the dollar amount of federal tobacco taxes has more thantripled, from $1.3 billion in 1950 to $4.4 billion in 1989. Over 98percent of tobacco tax revenues come from the excise tax on cigarettes.Federal revenues from alcoholic beverage taxes have grown from $2.2billion to $5.7 billion over the same period. In 1989, alcoholic beverage
33-148 0 - 90 - 2 QL 3
8 FEDERAL EXCISE TAXES August 1990
tax revenues comprised $1.7 billion from the excise tax on beer, $0.3billion from excise taxes on wines, and $3.7 billion from the excise taxon distilled spirits.
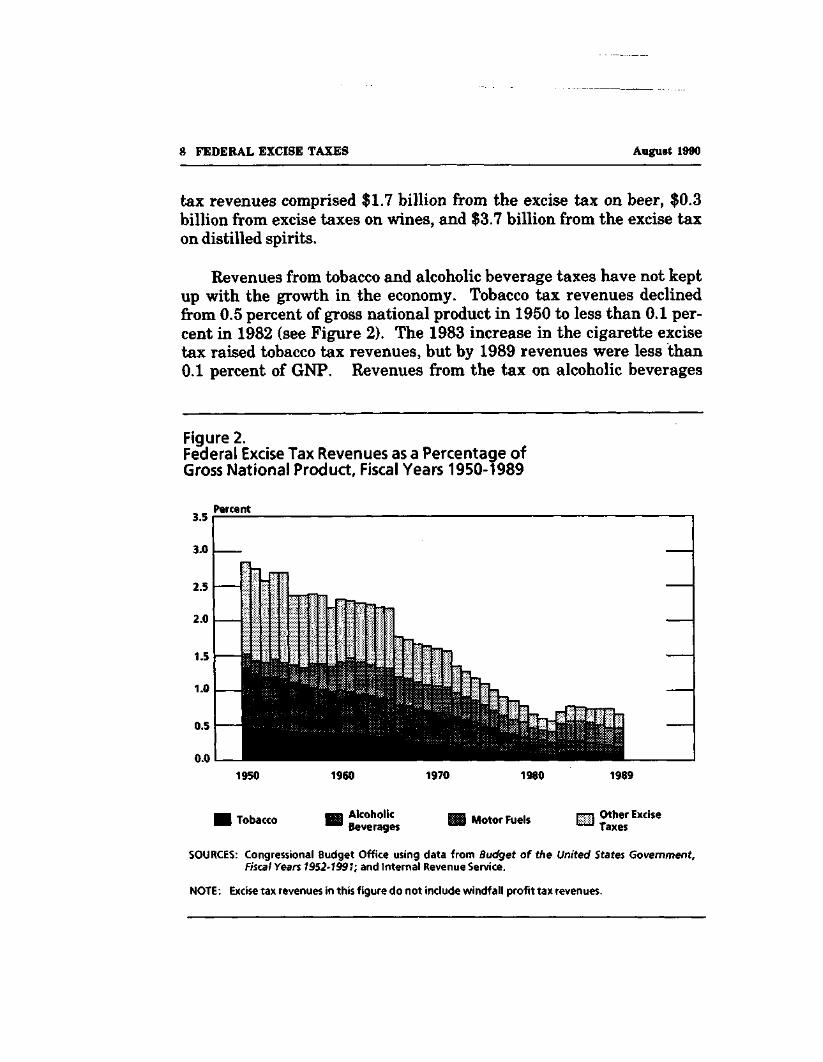
Revenues from tobacco and alcoholic beverage taxes have not keptup with the growth in the economy. Tobacco tax revenues declinedfrom 0.5 percent of gross national product in 1950 to less than 0.1 per-cent in 1982 (see Figure 2). The 1983 increase in the cigarette excisetax raised tobacco tax revenues, but by 1989 revenues were less than0.1 percent of GNP. Revenues from the tax on alcoholic beverages
Figure 2.Federal Excise Tax Revenues as a Percentage ofGross National Product, Fiscal Years 1950-1989
Percent
1950 1960 1970 1980 1989
Tobacco AlcoholicBeverages
Motor Fuels Other ExciseTaxes
SOURCES: Congressional Budget Office using data from Budget of the United States Government,Fiscal Years 1952-1991; and Internal Revenue Service.
NOTE: Excise tax revenues in this figure do not include windfall profit tax revenues.
CHAPTER II AN OVERVIEW OF FEDERAL EXCISE TAXES 9
have declined steadily as a percentage of GNP from 0.8 percent in 1950to 0.1 percent in 1989, despite an increase in the tax on distilled spiritsin 1985.
Federal motor fuel tax revenues have grown much more rapidlythan either tobacco or alcoholic beverage tax revenues. Motor fuel taxrevenues rose from $0.5 billion in 1950 to $4.9 billion by 1982.
Following an increase in the tax on gasoline and diesel fuel in1983, revenues reached $14.3 billion in 1989--$9.9 billion from the taxon gasoline and $4.4 billion from the tax on highway diesel fuel.l Aftergrowing from 0.2 percent to 0.5 percent of GNP between 1950 and1960, motor fuel tax revenues fell to under 0.2 percent of GNP by 1982.Motor fuel taxes rose to 0.3 percent of GNP after the 1983 tax increase,but have not kept pace with the growth in GNP in the most recentyears.
Nominal Tax Rates
Federal taxes on tobacco, alcoholic beverages and motor fuels arelevied on a per unit or specific basis (for example, as cents per gallon orper number of cigarettes), rather than on an ad valorem basis (as apercentage of expenditures). Although per unit taxes often are prefer-able for administrative reasons, as the price level rises over time theeffective tax rate falls. Real revenues decline unless consumptiongrows rapidly or tax rates are increased. While revenues from incomeand payroll taxes have generally matched or exceeded the growth inGNP, only excise revenues from motor fuel taxes have kept pace withthe growth in the economy.
There have been few increases in federal tax rates on tobacco,alcoholic beverages, and motor fuels in the past 40 years. The currenttax rate on cigarettes of $8.00 per 1,000 cigarettes, or $0.16 per pack of20, took effect in 1983. After the Congress raised the federal excise taxon cigarettes from $0.07 to $0.08 per pack in 1951, the rate remained
1. Highway diesel fuel tax revenues were unusually high in 1989. Both C8O and the Administrationexpect that highway diesel fuel tax revenues will return to a more normal level of about $3.2 billionin 1990.
10 FEDERAL EXCISE TAXES August 1990
unchanged for more than 30 years. The Tax Equity and Fiscal Respon-sibility Act of 1982 temporarily raised the tax to the current rate of$0.16 per pack beginning January 1, 1983. After numerous exten-sions, that change was made permanent in 1986.
Federal excise taxes on beer and table wines have not changedsince 1951, and taxes on champagne have not changed since 1955. Thecurrent rate on beer is $9.00 per 31-gallon barrel, or about $0.29 pergallon ($0.16 per six-pack of 12-ounce cans or bottles). The rate onwine varies by alcoholic content. The rate for wines of less than 14 per-cent alcohol (table wines) is $0.17 per gallon (about $0.03 on a 750-milliliter bottle). The rate for wines with between 14 percent and 21percent alcohol (dessert wines) is $0.67 per gallon ($0.13 per 750-milli-liter bottle), while the rate for champagne and other naturally carbo-nated wines is $3.40 per gallon (about $0.67 per 750-milliliter bottle).
The current rate on distilled spirits is $12.50 per proof-gallon(about $1.98 on a 750-milliliter bottle of 80-proof liquor).2 The rate ondistilled spirits was raised to $10.50 per proof-gallon in 1951 andremained at that level until 1985 when the Tax Reform Act of 1984raised the tax to the current rate.
The current tax on motor fuels is $0.09 per gallon of gasoline and$0.15 per gallon of highway diesel fuel. Revenues from the tax areearmarked for the Highway Trust Fund. An additional tax of 0.1 centper gallon is levied on both gasoline and highway diesel fuel, withrevenues earmarked for the Leaking Underground Storage Tank TrustFund. Two taxes are levied directly on domestic crude oil and onimported petroleum products. The proceeds from a tax of 9.7 cents perbarrel are deposited in the Hazardous Substance Superfund, and theproceeds from a tax of 5 cents per barrel are deposited in the Oil SpillLiability Trust Fund.
Federal taxes on motor fuels predate the creation of the HighwayTrust Fund. The Congress created the Trust Fund in 1956 to financethe construction and maintenance of the federal highway system and,
2. A proof-gallon is a gallon of 100 proof spirits (50 percent alcohol by volume). The tax on distilledspirits of lower or higher proof is $12.50 per gallon multiplied by the ratio of the proof to 100.
CHAPTER II AN OVERVIEW OF FEDERAL EXCISE TAXES 11
after raising the tax rate from $0.02 to $0.03 per gallon, it earmarkedrevenues from existing taxes on gasoline and highway diesel fuel to thefund. The tax rate was raised by an additional 1 cent per gallon begin-ning in October 1959. The Highway Revenue Act of 1982 increased thetax on gasoline from $0.04 to $0.09 per gallon, beginning in April 1983.The tax on highway diesel fuel was raised first to $0.09 per gallon in1983 and then to $0.15 per gallon in the following year, but with a one-time credit for diesel-powered vehicles with gross weight of 10,000pounds or less—intended as a repayment of the tax increase over thenormal useful life of the vehicle. The Superfund Revenue Act of 1986established the additional tax of 0.1 cent per gallon on gasoline andhighway diesel fuel for purposes of cleanup and related costs involvingleaking underground storage tanks.
Real Tax Rates
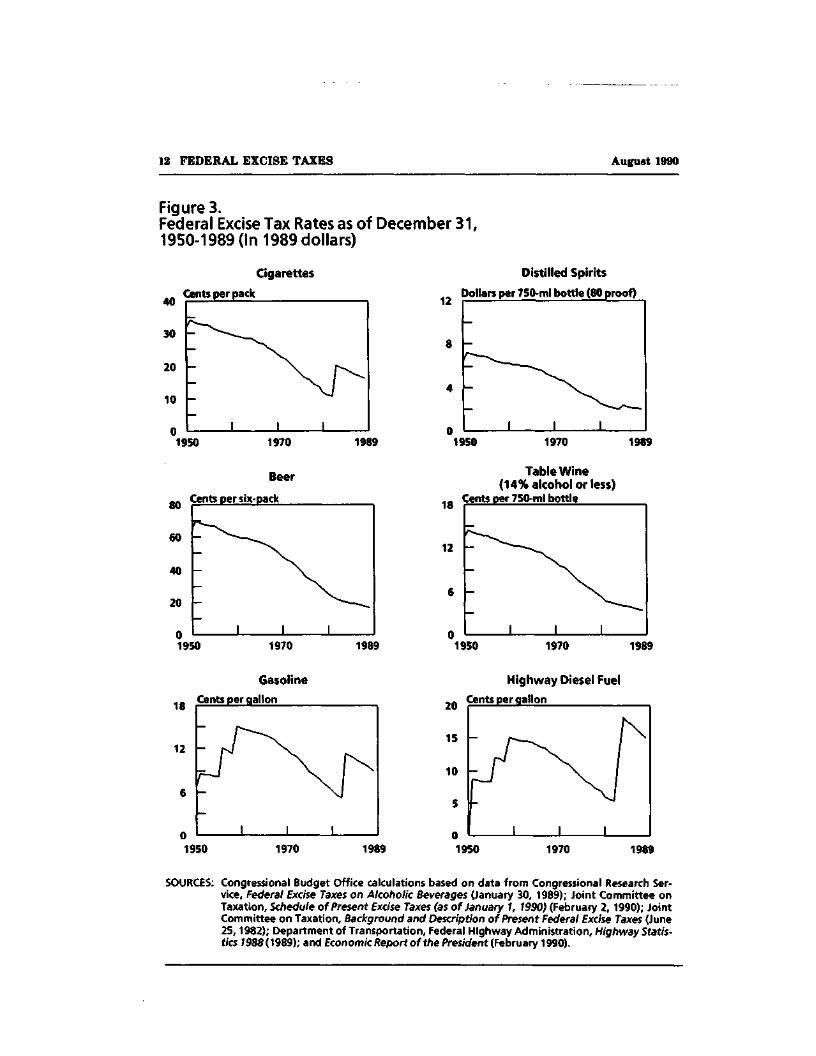
Because federal excise tax rates on cigarettes and alcoholic beverageshave had few increases since 1950, taxes rates measured in constantdollars have declined sharply in the past 40 years (see Figure 3). By1982 the real tax on cigarettes was about one-third of what it had beenin 1950. The increase in the tax on cigarettes in 1983 was sufficient toadjust for about 10 previous years of inflation. The current rate isabout the same in real terms as it was in 1977. Real rates on beer andwine are about one-fourth of the rate in 1950 and about one-half thereal rate in 1977. The 1985 increase in the tax on distilled spirits com-pensated for about four previous years of inflation. Even with the 1985increase, however, the real rate on distilled spirits is less than one-third of the rate in 1950 and only about 60 percent of the rate in 1977.
Real tax rates on gasoline are about the same as they were in 1951and about 60 percent as high as when they reached their peak in 1960.The current rate on gasoline is about equal to the real rate in 1975.The real tax rate on highway diesel fuel was about twice as high in1984 as it had been at its inception in 1951. Despite a decline in thelatter part of the decade, the current rate is higher than the real rate atany time before 1984.
12 FEDERAL EXCISE TAXES August 1990
Figure 3.Federal Excise Tax Rates as of December 31,1950-1989 (In 1989 dollars)
Cigarettes
40
30
20
10
Cents per pack
1950 1970
80
60
40
20
Beer
Cents per six-pack
01950 1970
1989
1989
12
Distilled Spirits
Dollars per 750-ml bottle (80 proof)
1950 1970 1989
18
12
Table Wine(14% alcohol or less)
Cents per 750-ml bottle
1950 1970 1989
18
12
Gasoline
Cents per gallon
1950 1970 1989
20
15
10
5
Highway Diesel Fuel
Cents per gallon
1950 1970 1989
SOURCES: Congressional Budget Office calculations based on data from Congressional Research Ser-vice, Federal Excise Taxes on Alcoholic Beverages (January 30, 1989); Joint Committee onTaxation, Schedule of Present Excise Taxes (as of January 1, 1990) (February 2, 1990); JointCommittee on Taxation, Background and Description of Present Federal Excise Taxes (June25,1982); Department of Transportation, Federal Highway Administration, Highway Statis-tics 7988(1989); and Economic Report of the President (February 1990).
CHAPTER AN OVERVIEW OF FEDERAL EXCISE TAXES 13
Federal Tax Rates in Relation to Product Prices
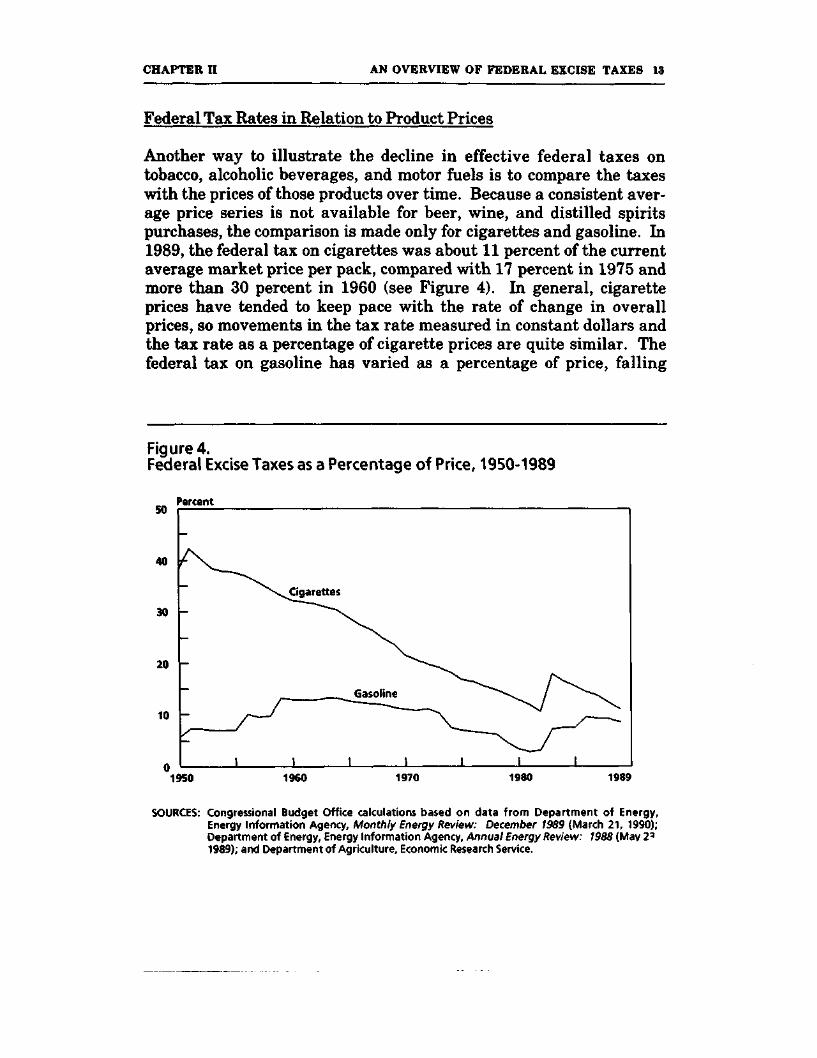
Another way to illustrate the decline in effective federal taxes ontobacco, alcoholic beverages, and motor fuels is to compare the taxeswith the prices of those products over time. Because a consistent aver-age price series is not available for beer, wine, and distilled spiritspurchases, the comparison is made only for cigarettes and gasoline. In1989, the federal tax on cigarettes was about 11 percent of the currentaverage market price per pack, compared with 17 percent in 1975 andmore than 30 percent in 1960 (see Figure 4). In general, cigaretteprices have tended to keep pace with the rate of change in overallprices, so movements in the tax rate measured in constant dollars andthe tax rate as a percentage of cigarette prices are quite similar. Thefederal tax on gasoline has varied as a percentage of price, falling
Figure 4.Federal Excise Taxes as a Percentage of Price, 1950-1989
Percent
1950 1960 1970 1980 1989
SOURCES: Congressional Budget Office calculations based on data from Department of Energy,Energy Information Agency, Monthly Energy Review: December 1989 (March 21, 1990);Department of Energy, Energy Information Agency, Annual Energy Review: 1988 (May 2'1989); and Department of Agriculture, Economic Research Service.
14 FEDERAL EXCISE TAXES August 1990
significantly as gasoline prices rose in the mid-1970s and again in the1979-1981 period. The 1989 rate of about 8.5 percent is still about twopercentage points below the rate in 1973, prior to the oil embargo of1973-1974.
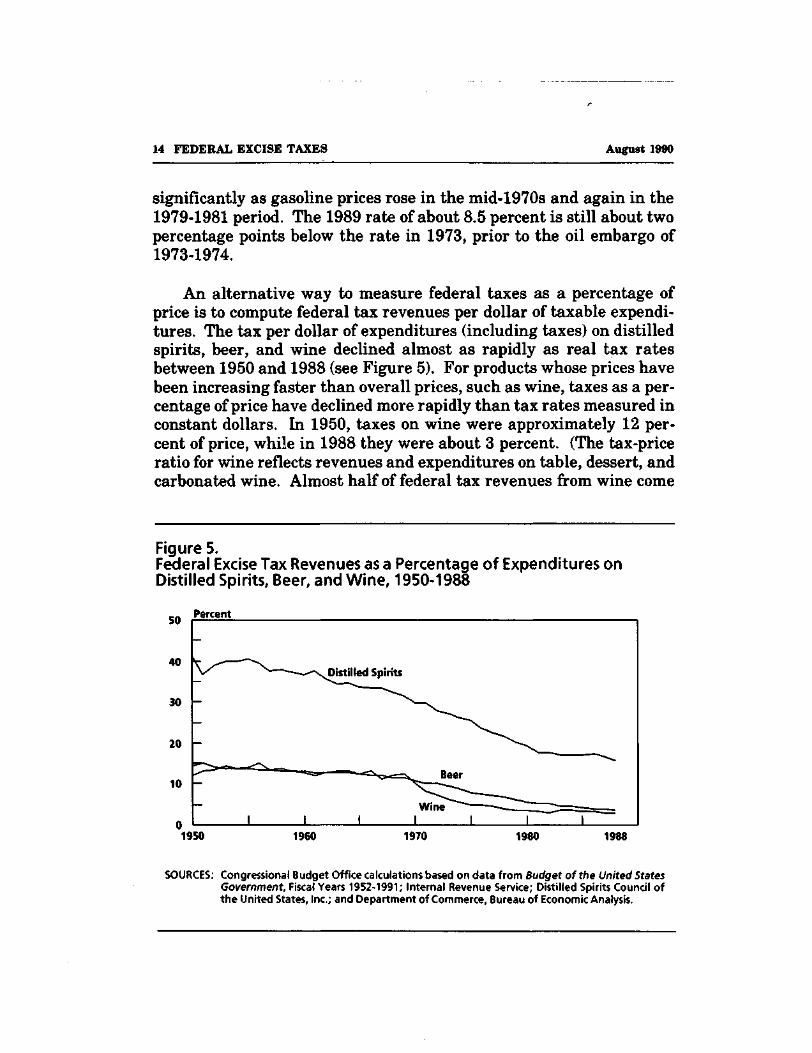
An alternative way to measure federal taxes as a percentage ofprice is to compute federal tax revenues per dollar of taxable expendi-tures. The tax per dollar of expenditures (including taxes) on distilledspirits, beer, and wine declined almost as rapidly as real tax ratesbetween 1950 and 1988 (see Figure 5). For products whose prices havebeen increasing faster than overall prices, such as wine, taxes as a per-centage of price have declined more rapidly than tax rates measured inconstant dollars. In 1950, taxes on wine were approximately 12 per-cent of price, while in 1988 they were about 3 percent. (The tax-priceratio for wine reflects revenues and expenditures on table, dessert, andcarbonated wine. Almost half of federal tax revenues from wine come
Figure 5.Federal Excise Tax Revenues as a Percentage of Expenditures onDistilled Spirits, Beer, and Wine, 1950-1988
50
40
30
20
10
Percent
Distilled Spirits
1950 1960 1970 1980 1988
SOURCES: Congressional Budget Office calculations based on data from Budget of the United StatesGovernment, Fiscal Years 1952-1991; Internal Revenue Service; Distilled Spirits Council ofthe United States, Inc.; and Department of Commerce, Bureau of Economic Analysis.
CHAPTER H AN OVERVIEW OF FEDERAL EXCISE TAXES 15
from the tax on champagne, which is taxed at a rate of about $0.67 per750-milliliter bottle, and has a much higher tax-price ratio than tablewine.) Federal taxes on beer were less than 4 percent of the price ofbeer in 1988, compared with close to 15 percent in 1950. Distilledspirits taxes were less than 16 percent of price in 1988, compared withmore than twice that rate in the 1950s.
TRENDS IN TOBACCO, ALCOHOL,AND MOTOR FUEL CONSUMPTION
Excise tax revenues depend on the level of consumption as well as onstatutory tax rates. After growing for most of the post-1950 period,total consumption of cigarettes and distilled spirits has fallen in themost recent years, while the growth in total beer consumption hasalmost stopped. Total consumption of gasoline grew rapidly from 1950to 1973. After falling following the 1973-1974 and 1978-1979 oil em-bargoes, and the recessions of the early 1980s, total consumption ofgasoline and other fuels has grown since 1982.
Tobacco
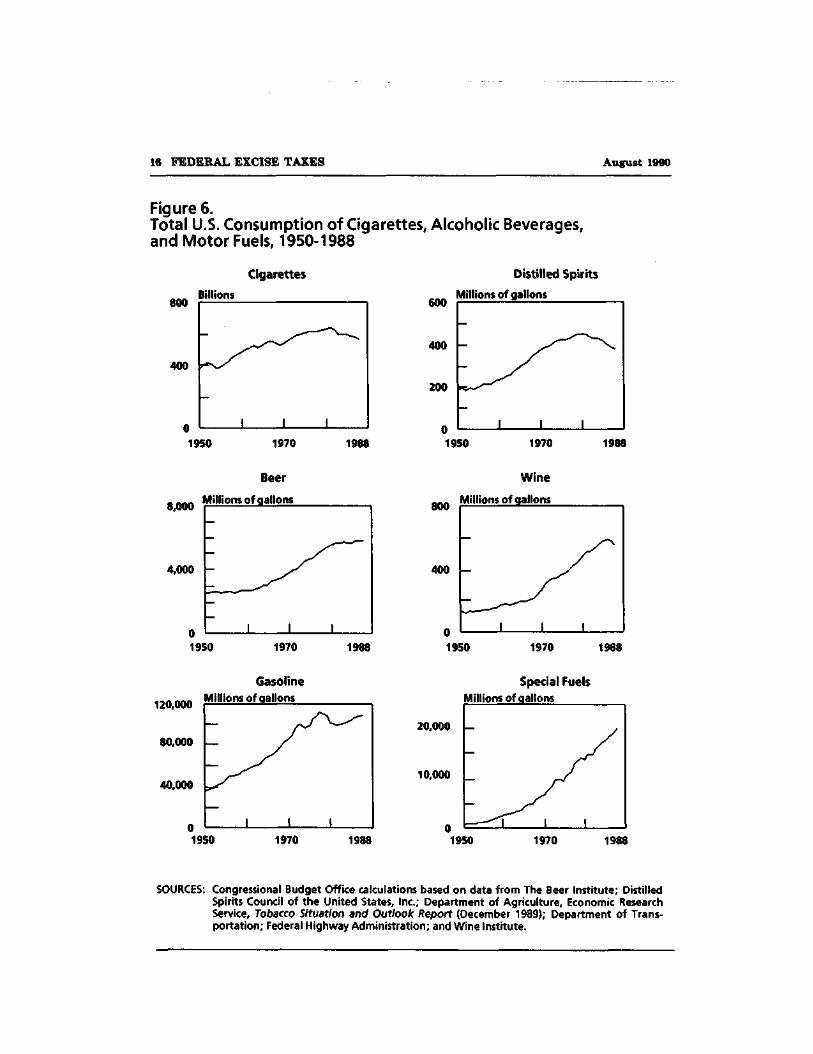
The relative decrease in federal revenues from tobacco taxes partlyreflects slow growth in total cigarette consumption and, since 1981, anactual decline in total consumption (see Figure 6). Total consumptionof cigarettes peaked in 1981 at about 640 billion cigarettes per year.By 1988, total consumption was down 12 percent from that peak to justover 563 billion cigarettes.
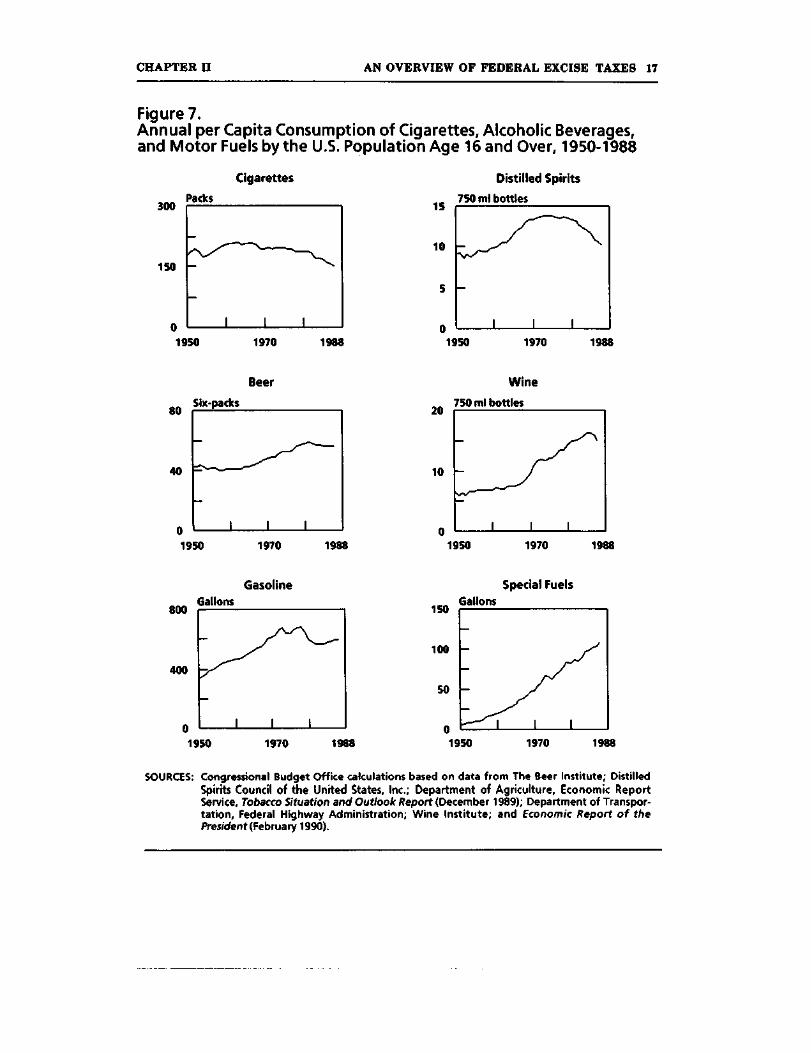
After rising during the early part of the post-1950 era, per capitaconsumption of cigarettes leveled off in the mid-1960s and then begana steady and increasingly rapid decline (see Figure 7). By 1963, percapita consumption by the U.S. resident population age 16 and overwas more than 210 packs (4,200 cigarettes) per year. The first majordownturn in per capita consumption came in 1964, coincident with therelease of the Surgeon General's first report on smoking. After risingfor a time after 1964, per capita consumption dipped again in 1968 and
16 FEDERAL EXCISE TAXES August 1990
Figure 6.Total U.S. Consumption of Cigarettes, Alcoholic Beverages,and Motor Fuels, 1950-1988
Cigarettes
800
400
Billions
1950 1970 1988
600
400
200
Distilled Spirits
Millions of gallons
1950 1970 1988
8,000
4,000
Beer
Millions of gallons
1950 1970 1988
800
400
Wine
Millions of gallons
1950 1970 1988
120,000
80,000
40,000
Gasoline
Millions of gallons
1950 1970 1988
Special Fuels
Millions of gallons
20,000
10.000
1950 1970 1988
SOURCES: Congressional Budget Office calculations based on data from The Beer Institute; DistilledSpirits Council of the United States, Inc.; Department of Agriculture, Economic ResearchService, Tobacco Situation and Outlook Report (December 1989); Department of Trans-portation; Federal Highway Administration; and Wine Institute.
CHAPTER II AN OVERVIEW OF FEDERAL EXCISE TAXES 17
Figure 7.Annual per Capita Consumption of Cigarettes, Alcoholic Beverages,and Motor Fuels by the U.S. Population Age 16 and Over, 1950-1988
Cigarettes
300
150
Packs
1950 1970 1988
15
10
Distilled Spirits
750 ml bottles
1950 1970 1988
Beer
80
40
Six-packs
1950 1970 1988
20
10
Wine
750 ml bottles
1950 1970 1988
Gasoline
800
400
Gallons
1950 1970 1988
Special Fuels
150
100
50
Gallons
1950 1970 1988
SOURCES: Congressional Budget Office calculations based on data from The Beer Institute; DistilledSpirits Council of the United States, Inc.; Department of Agriculture, Economic ReportService, Tobacco Situation and Outlook Report (December 1989); Department of Transpor-tation, Federal Highway Administration; Wine Institute; and Economic Report of thePresident (February 1990).
18 FEDERAL EXCISE TAXES August 1990
1969. Since 1974, per capita consumption has declined steadily, withan increase in the rate of decline beginning after 1981. Since 1981, percapita consumption of cigarettes has declined at a 2.5 percent annualrate. By 1988, per capita consumption had fallen nearly 30 percentfrom its peak in 1963 to about 151 packs per year, lower than at anytime in the past 40 years.
Alcoholic Beverages
Changes in the total consumption of alcoholic beverages reflect dif-ferent trends for beer, wine, and distilled spirits. Total consumption ofbeer and wine has continued to grow over the past 40 years, althoughthe growth in beer consumption has almost ceased in the most recentyears. Total consumption of distilled spirits peaked in 1980-1981 atabout 450 million gallons per year. By 1988, consumption of distilledspirits had fallen 16 percent to about 378 million gallons per year.
Per capita consumption of distilled spirits peaked in 1974 at aboutfourteen 750-milliliter bottles per person a year. Per capita consump-tion has declined fairly steadily since then, and by 1988 was down tojust over 10 bottles a year. Per capita consumption of beer has declinedsince 1981, when it peaked at over 58 six-packs (about 33 gallons) perperson a year. By 1988, per capita consumption was down to over 55six-packs (about 31 gallons) a year. Per capita consumption of winehas grown rapidly since the mid-1960s, reaching a high of about six-teen 750-milliter bottles a year. While per capita consumption of winehas fallen in the past two years, it is too early to tell if that trend willcontinue.
Motor Fuels
Total gasoline consumption grew steadily until 1973, the time of thefirst oil embargo. After rebounding in the 1975-1978 period, total con-sumption of gasoline fell again in 1979 following the second oil em-bargo. Consumption has grown steadily since 1980, however, and by1988 total consumption of gasoline was about 110 billion gallons peryear, higher than at any time except in 1978.
CHAPTER D AN OVERVIEW OF FEDERAL EXCISE TAXES 19
Per capita consumption of gasoline also reached a peak in 1978 atabout 686 gallons per person a year. By 1982, following the 1981-1982recessions, per capita consumption had fallen by almost 18 percentfrom the 1978 level. By 1988, per capita consumption of gasoline hadreached 589 gallons per year, higher than at any time since 1980 butlower than per capita consumption in any year from 1969 through1980.
THE TOTAL TAX BURDEN ON TOBACCO, ALCOHOLICBEVERAGES, AND MOTOR FUELS
The total tax burden on tobacco, alcoholic beverages, and motor fuelsincludes state and local taxes in addition to federal excise taxes. All 50states and the District of Columbia tax tobacco, alcoholic beverages,and motor fuels. In a number of states, city and county governmentslevy additional taxes. Despite this combination of federal, state, andlocal taxes, tobacco, alcoholic beverages, and motor fuels are taxed lessheavily in the United States than in most industrialized countries.
State and Local Taxes
In 1989, state excise tax rates on cigarettes ranged from 2 cents perpack in North Carolina to 40 cents per pack in Connecticut (see Ap-pendix Table A-14). The median rate for all 50 states and the Districtof Columbia was 20 cents a pack. In addition to state excise taxes, over400 local jurisdictions in 6 states also levy specific excise taxes oncigarettes. The bulk of local cigarette tax revenues are collected inNew York City and in Cook County (Chicago). In most states, ciga-rettes are also subject to general state and local sales taxes at ratesranging from 3 percent to 8 percent of the retail sales price. Forty-fivestates and the District of Columbia have general sales taxes, Alaska,Delaware, Montana, New Hampshire, and Oregon being the five statesthat do not. Cigarettes are not subject to sales tax in Colorado, Mary-land, New Jersey, Rhode Island, and Wyoming. Fifteen states raisedcigarette tax rates in 1989, by an average of 8 cents a pack. Four statesraised rates in 1988.
20 FEDERAL EXCISE TAXES August 1990
Thirty-two states and the District of Columbia levy taxes onlicensed sales of distilled spirits. In 1989, rates in these states rangedfrom $1.50 to $6.50 per proof-gallon (about $0.24 to $1.03 per 750 milli-liter bottle of 80-proof spirits-see Appendix Table A-14). In the re-maining 18 states, the sale of distilled spirits is controlled through astate monopoly on the distribution of distilled spirits at the wholesalelevel. In 12 of the 18 control states, distilled spirits are sold at the re-tail level for off-premise consumption only through state-controlled es-tablishments. State revenues from the sale of alcoholic beverages incontrol states come from retail markups in addition to state excise,sales, and other taxes.
All 50 states and the District of Columbia levy taxes on beer andwine. In 1989, rates on bottled and canned beer ranged from 3.33 centsper gallon in New Jersey to 89 cents per gallon in Hawaii (about $0.02to $0.50 per six-pack of 12-ounce cans or bottles-see Appendix TableA-14). The median rate for all states was 18 cents per gallon (about$0.10 per six-pack). Rates on table wine ranged from 1 cent per gallonin California to $2.25 per gallon in Florida. Most control states alsoassess a markup on the retail price of wines in addition to a specific ex-cise tax. In most license and control states, distilled spirits, beer, andwine are also subject to general sales taxes.
State tax rates on gasoline ranged from 4 cents per gallon inFlorida to 22 cents per gallon in Nebraska in 1989 (see Appendix TableA-14). The median rate for all 50 states and the District of Columbiawas 16 cents per gallon. In about a dozen states, gasoline was also sub-ject to general sales taxes.
Tax Rates in Other Industrialized Countries
The average combined tax on cigarettes in the United States was about40.1 cents a pack in 1987, or about 34.2 percent of the average retailprice of a pack of cigarettes. Most of the tax came from the combina-tion of federal and state excise taxes (about 35 cents or 29 percent ofthe average retail price). The total tax on cigarettes in the UnitedStates was the lowest among all member countries of the Organizationfor Economic Cooperation and Development (OECD). For the 14 other
CHAPTER H AN OVERVIEW OF FEDERAL EXCISE TAXES 21
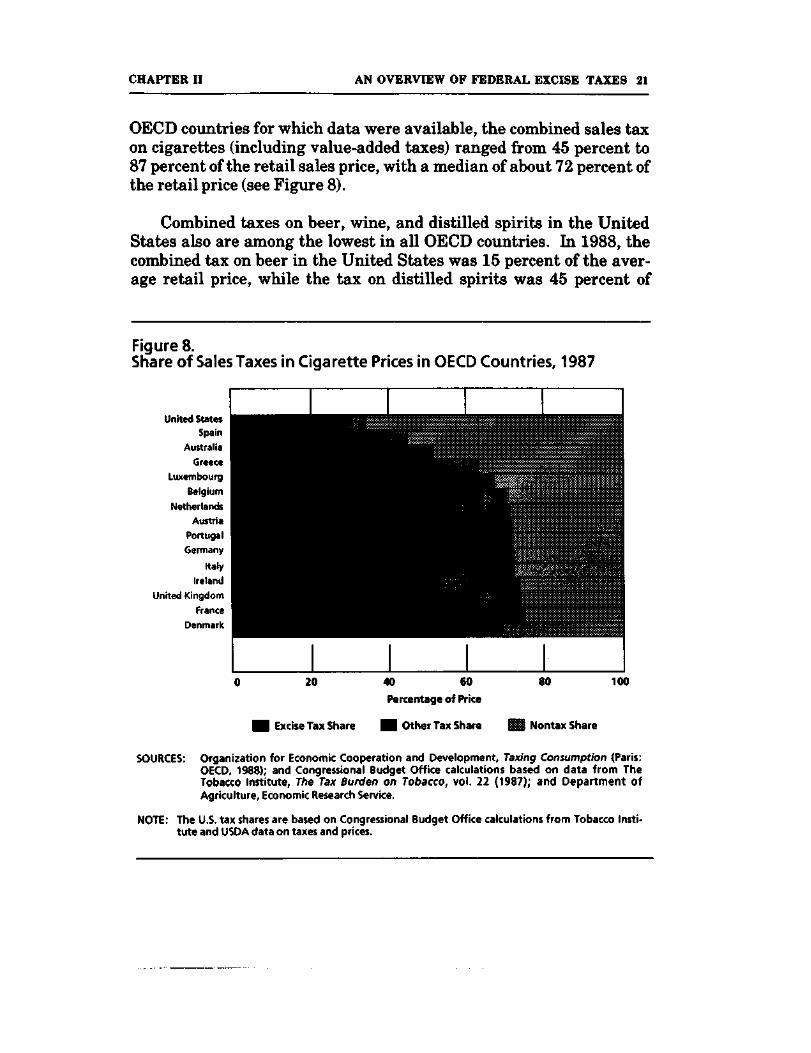
OECD countries for which data were available, the combined sales taxon cigarettes (including value-added taxes) ranged from 45 percent to87 percent of the retail sales price, with a median of about 72 percent ofthe retail price (see Figure 8).
Combined taxes on beer, wine, and distilled spirits in the UnitedStates also are among the lowest in all OECD countries. In 1988, thecombined tax on beer in the United States was 15 percent of the aver-age retail price, while the tax on distilled spirits was 45 percent of
Figures.Share of Sales Taxes in Cigarette Prices in OECD Countries, 1987
United StatesSpain
AustraliaGreece
LuxembourgBelgium
NetherlandsAustria
PortugalGermany
ItalyIreland
United KingdomFrance
Denmark
20
Excise Tax Share
40 60
Percentage of Price
80 100
Other Tax Share HI Nontax Share
SOURCES: Organization for Economic Cooperation and Development, Taxing Consumption (Paris:OECD, 1988); and Congressional Budget Office calculations based on data from TheTobacco Institute, The Tax Burden on Tobacco, vol. 22 (1987); and Department ofAgriculture, Economic Research Service.
NOTE: The U.S. tax shares are based on Congressional Budget Office calculations from Tobacco Insti-tute and USDA data on taxes and prices.
22 FEDERAL EXCISE TAXES August 1990
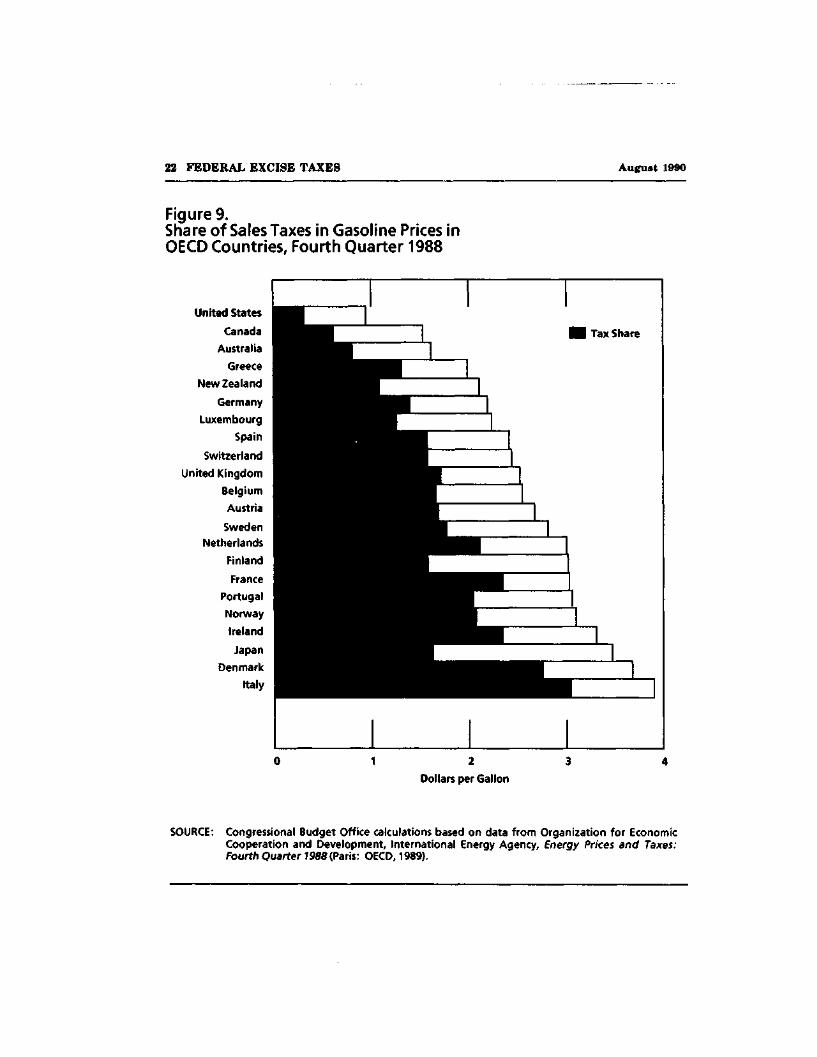
Figure9.Share of Sales Taxes in Gasoline Prices inOECD Countries, Fourth Quarter 1988
United States
Canada
Australia
Greece
New Zealand
Germany
Luxembourg
Spain
Switzerland
United Kingdom
Belgium
Austria
SwedenNetherlands
Finland
France
Portugal
Norway
Ireland
Japan
Denmark
Italy
Dollars per Gal Ion
SOURCE: Congressional Budget Office calculations based on data from Organization for EconomicCooperation and Development, International Energy Agency, Energy Prices and Taxes:Fourth Quarter 1988 (Paris: OECD, 1989).
CHAPTER H AN OVERVIEW OF FEDERAL EXCISE TAXES 23
the price. For the 21 OECD countries, including the United States, forwhich data were available, the average tax on beer ranged from 14percent to 64 percent of the retail price, with a median tax of 31 per-cent, while taxes for distilled spirits were 8 percent to 91 percent ofprice, with a median of 51 percent (see Appendix Table A-17).
Combined federal and state tax rates on gasoline were 32 percentof the average retail price of gasoline at the end of 1988, lower than inany of the other 21 OECD countries for which data were available, andless than half the median tax of 65 percent of the average retail price(see Figure 9 on page 22). In Canada, a country much like the UnitedStates, gasoline taxes were 41 percent of the average retail price ofgasoline.

CHAPTER III
WHO BUYS TOBACCO, ALCOHOLIC
BEVERAGES, AND MOTOR FUELS?
Purchases of tobacco, alcoholic beverages, and motor fuels vary amongfamilies. To the extent that excise taxes are reflected in higher pricesfor those goods, tax increases will affect families in proportion to theirspending.
Although average expenditures on tobacco, alcoholic beverages,and motor fuels are higher for families with higher incomes, lower-income families spend a higher percentage of their income on all threeitems than middle- and upper-income families. Expenditures on tobac-co, alcoholic beverages, and motor fuels are the smallest percentage ofincome for families with the highest incomes.
When compared as percentages of total expenditures, however,tobacco, alcoholic beverages, and motor fuels expenditures are all moreequal among family income classes. In particular, expenditures onalcoholic beverages tend to rise as a percentage of total expenditures asfamily income increases, if adjustments are made for family size. Ex-penditures on tobacco are a smaller percentage of total expenditures asfamily income increases, while motor fuel expenditures are about thesame percentage of total expenditures among all income groups exceptthe highest 20 percent.
AVERAGE FAMILY EXPENDITURES
For purposes of this study, the Congressional Budget Office has esti-mated the distribution of family expenditures on tobacco, alcoholicbeverages, and motor fuels in 1990. The results are reported by ad-justed post-tax family income, by age of the family head, and by regionof residence. CBO took the expenditure and income data from the1984-1985 Consumer Expenditure Survey (CES) Interview Survey, the1986 Current Population Survey (CPS), and the 1985 Statistics of
26 FEDERAL EXCISE TAXES August 1990
Income. Expenditure (but not income) data were adjusted to personalconsumption expenditures from the National Income and ProductAccounts (NIPA). The data were projected from 1985 to 1988 usingactual growth rates for different components of income and expendi-tures, and from 1988 to 1990 using the CBO August 1989 economicforecast. A complete discussion of the data and the simulation methodsis contained in Appendix B.
Adjusting for Family Size
Comparing expenditures among families with different incomes canpresent a misleading picture unless some adjustment is made fordifferent family sizes. For example, a single person with income of$40,000 has a much higher standard of living than a family of fourwith the same income. One alternative is to measure income on a percapita basis. This approach removes all differences based on familysize, including economies of scale from living together. Another alter-native is to adjust family income based on some equivalence scale.This study employs one such equivalence scale: the family size ad-justment used in determining the poverty thresholds (see Table 1).This scale assumes, for example, that a family of four needs abouttwice the income of a single person to maintain the same standard ofliving. The incomes of families of different sizes are made comparableby dividing each family's income by its poverty threshold. Under thisapproach, a four-person family with an income of about $40,000 in1990~or three times the poverty threshold for a family of four—is on apar with a three-person family with an income of about $31,000, whichis three times the poverty threshold for a three person-family. Singlepeople living alone are treated as one-person families.
Expenditures in Relation to Family Income
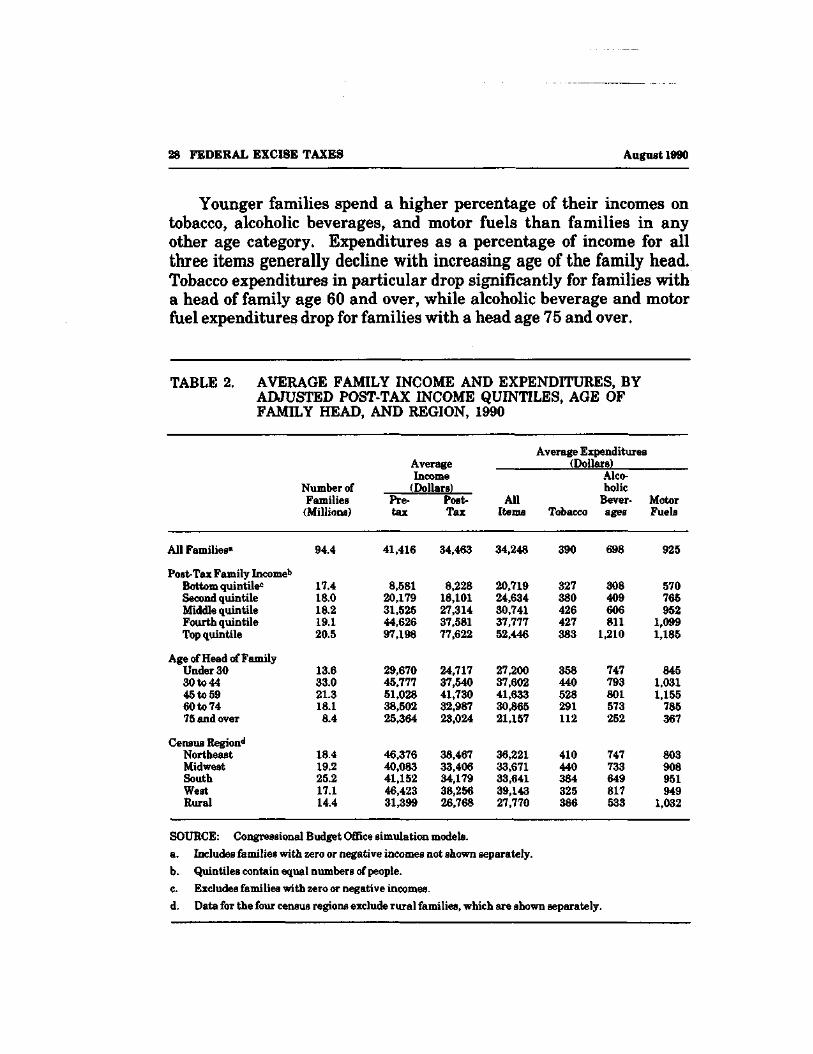
Average incomes and expenditures in 1990 are shown in Table 2 byadjusted post-tax family income, age of the family head, and region ofresidence. Because the CES does not report region of residence forrural families, those families are classified separately. Results for thefour census regions pertain only to nonrural families in those regions.
CHAPTER HI CONSUMPTION PATTERNS 27
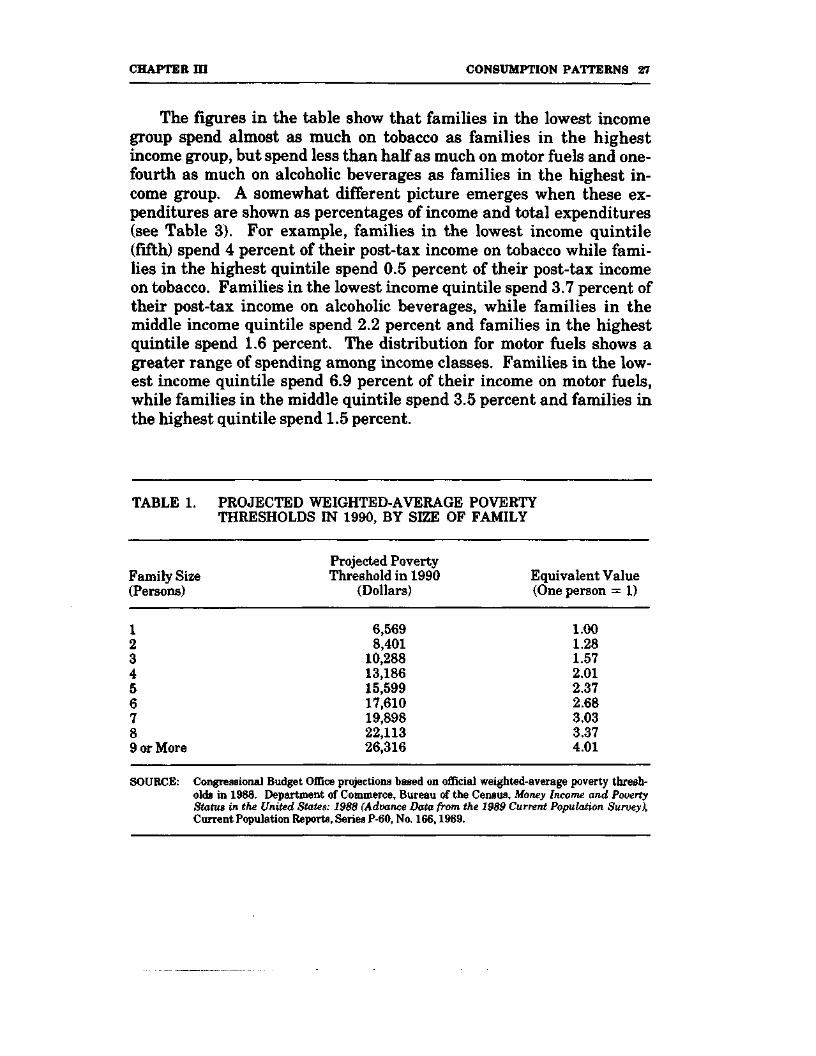
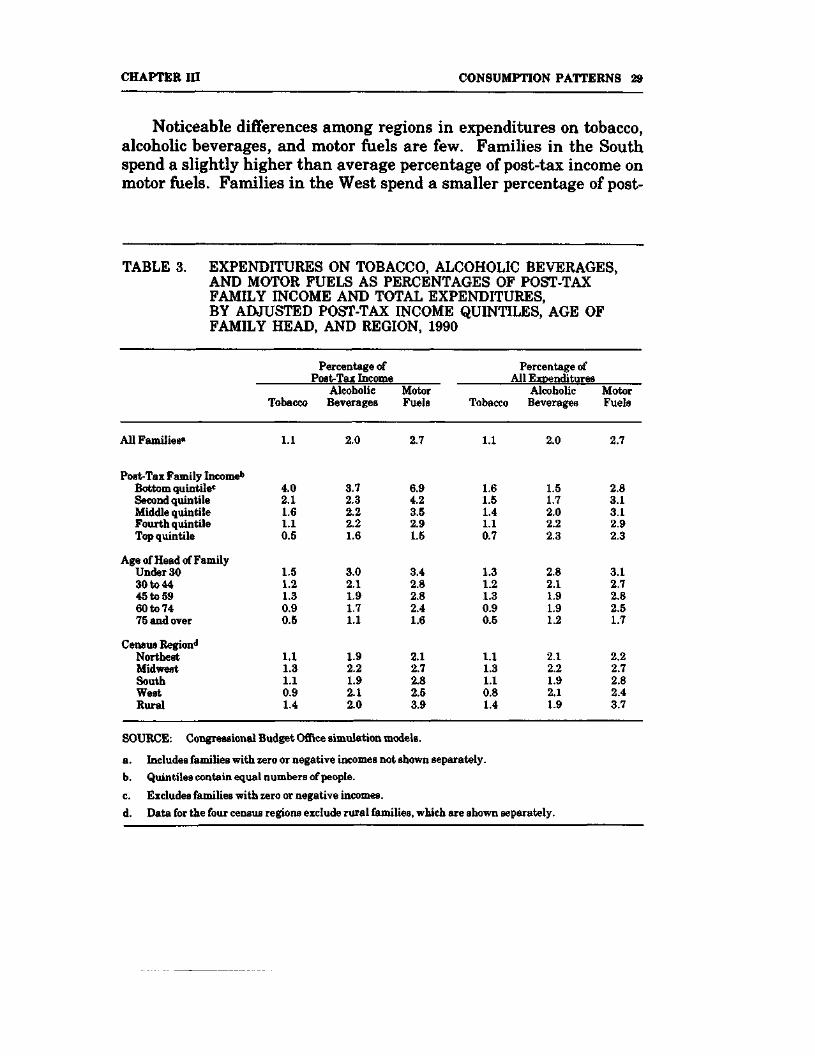
The figures in the table show that families in the lowest incomegroup spend almost as much on tobacco as families in the highestincome group, but spend less than half as much on motor fuels and one-fourth as much on alcoholic beverages as families in the highest in-come group. A somewhat different picture emerges when these ex-penditures are shown as percentages of income and total expenditures(see Table 3). For example, families in the lowest income quintile(fifth) spend 4 percent of their post-tax income on tobacco while fami-lies in the highest quintile spend 0.5 percent of their post-tax incomeon tobacco. Families in the lowest income quintile spend 3.7 percent oftheir post-tax income on alcoholic beverages, while families in themiddle income quintile spend 2.2 percent and families in the highestquintile spend 1.6 percent. The distribution for motor fuels shows agreater range of spending among income classes. Families in the low-est income quintile spend 6.9 percent of their income on motor fuels,while families in the middle quintile spend 3.5 percent and families inthe highest quintile spend 1.5 percent.
TABLE 1. PROJECTED WEIGHTED-AVERAGE POVERTYTHRESHOLDS IN 1990, BY SIZE OF FAMILY
Projected PovertyFamily Size Threshold in 1990 Equivalent Value(Persons) (Dollars) (One person = 1)
1 6,569 1.002 8,401 1.283 10,288 1.574 13,186 2.015 15,599 2.376 17,610 2.687 19,898 3.038 22,113 3.379 or More 26,316 4.01
SOURCE: Congressional Budget Office projections based on official weighted-average poverty thresh-olds in 1988. Department of Commerce, Bureau of the Census, Money Income and PovertyStatus in the United States: 1988 (Advance Data from the 1989 Current Population Survey),Current Population Reports, Series P-60, No. 166,1989.
28 FEDERAL EXCISE TAXES August 1990
Younger families spend a higher percentage of their incomes ontobacco, alcoholic beverages, and motor fuels than families in anyother age category. Expenditures as a percentage of income for allthree items generally decline with increasing age of the family head.Tobacco expenditures in particular drop significantly for families witha head of family age 60 and over, while alcoholic beverage and motorfuel expenditures drop for families with a head age 75 and over.
TABLE 2. AVERAGE FAMILY INCOME AND EXPENDITURES, BYADJUSTED POST-TAX INCOME QUINTILES, AGE OFFAMILY HEAD, AND REGION, 1990
Number ofFamilies(Millions)
AverageIncome
(Dollars)Pre- Post-tax Tax
Average Expenditures(Dollars)
Alco-holic
All Bever-Items Tobacco ages
MotorFuels
All Families' 94.4
Post-Tax Family Income1'Bottom quintilec 17.4Second quintile 18.0Middle quintile 18.2Fourth quintile 19.1Top quintile 20.5
41,416 34,463 34,248
8,58120,17931,52544,62697,198
8,22818,10127,31437,58177,622
20,71924,63430,74137,77752,446
390
327380426427383
698
308409606811
1,210
SOURCE: Congressional Budget Office simulation models.a. Includes families with zero or negative incomes not shown separately.b. Quintiles contain equal numbers of people.c. Excludes families with zero or negative incomes.d. Data for the four census regions exclude rural families, which are shown separately.
925
570765952
1,0991,185
Age of Head of FamilyUnder 3030 to 4445 to 5960 to 7475 and over
Census Region1*NortheastMidwestSouthWestRural
13.633.021.318.18.4
18.419.225.217.114.4
29,67045,77751,02838,50225,364
46,37640,08341,15246,42331,399
24,71737,54041,73032,98723,024
38,46733,40634,17938,25626,768
27,20037,60241,63330,86521,157
36,22133,67133,64139,14327,770
358440528291112
410440384325386
747793801573252
747733649817533
8451,0311,155
785367
803908951949
1,032
CHAPTER ffl CONSUMPTION PATTERNS 29
Noticeable differences among regions in expenditures on tobacco,alcoholic beverages, and motor fuels are few. Families in the Southspend a slightly higher than average percentage of post-tax income onmotor fuels. Families in the West spend a smaller percentage of post-
TABLE 3. EXPENDITURES ON TOBACCO, ALCOHOLIC BEVERAGES,AND MOTOR FUELS AS PERCENTAGES OF POST-TAXFAMILY INCOME AND TOTAL EXPENDITURES,BY ADJUSTED POST-TAX INCOME QUINTILES, AGE OFFAMILY HEAD, AND REGION, 1990
Percentage ofPost-Tax Income
Alcoholic MotorTobacco Beverages Fuels
Percentage ofAll Expenditures
TobaccoAlcoholicBeverages
MotorFuela
All Families8 1.1 2.0 2.7 1.1 2.0 2.7
Post-Tax Family Incomeb
Bottom quintilec 4.0 3.7 6.9 1.6 1.5 2.8Second quintile 2.1 2.3 4.2 1.5 1.7 3.1Middle quintile 1.6 2.2 3.5 1.4 2.0 3.1Fourth quintile 1.1 2.2 2.9 1.1 2.2 2.9Top quintile 0.5 1.6 1.5 0.7 2.3 2.3
Age of Head of FamilyUnder 30 1.5 3.0 3.4 1.3 2.8 3.130 to 44 1.2 2.1 2.8 1.2 2.1 2.745 to 59 1.3 1.9 2.8 1.3 1.9 2.860 to 74 0.9 1.7 2.4 0.9 1.9 2.575 and over 0.5 1.1 1.6 0.5 1.2 1.7
Census Regiond
NorthestMidwestSouthWestRural
1.11.31.10.91.4
1.92.21.92.12.0
2.12.72.82.53.9
1.11.31.10.81.4
2.12.21.92.11.9
2.22.72.82.43.7
SOURCE: Congressional Budget Office simulation models.
a. Includes families with zero or negative incomes not shown separately.b. Quintilea contain equal numbers of people.
c. Excludes families with zero or negative incomes.d. Data for the four census regions exclude rural families, which are shown separately.
30 FEDERAL EXCISE TAXES August 1990
tax income on tobacco than families in any other region. Families inthe Northeast spend a smaller percentage of their income on motorfuels than families in other regions, while rural families spend a muchlarger fraction of their income on motor fuels than other families, and aslightly higher percentage on tobacco.
Expenditures in Relation to Total Family Expenditures
It is also useful to compare expenditures on tobacco, alcoholic bever-ages, and motor fuels with total family expenditures on all items. An-nual income may fluctuate, while total family expenditures mayreflect a family's longer-run expectations. When this comparison ismade, expenditures on tobacco, alcoholic beverages, and motor fuelsshow less variation among income classes. The budget share of tobaccoranges downward from 1.6 percent for families with the lowest incomesto 0.7 for families with the highest incomes. The budget share foralcoholic beverages actually rises with adjusted family income: fami-lies in the lowest income quintile spend 1.5 percent of their budget onalcoholic beverages, while families in the middle income quintile spend2.0 percent and families in the highest quintile spend 2.3 percent. Thebudget share for motor fuels varies little among the first four incomequintiles, hovering at about 3.0 percent. For families in the highestquintile, however, the budget share is only 2.3 percent.
These results suggest that, to the extent that annual familyexpenditures rather than annual family income better reflect lifetimeincome, expenditures on tobacco are slightly regressive over the in-come classes (that is, they tend to be a slightly greater percentage oftotal expenditures at lower income levels), while expenditures on alco-holic beverages are progressive, and expenditures on motor fuels areabout proportional except for families in the highest income quintile.
The results for alcoholic beverages are the most striking. Part ofthe pattern results from the adjustment for family size. The adjust-ment moves smaller families higher up in the income distribution, and
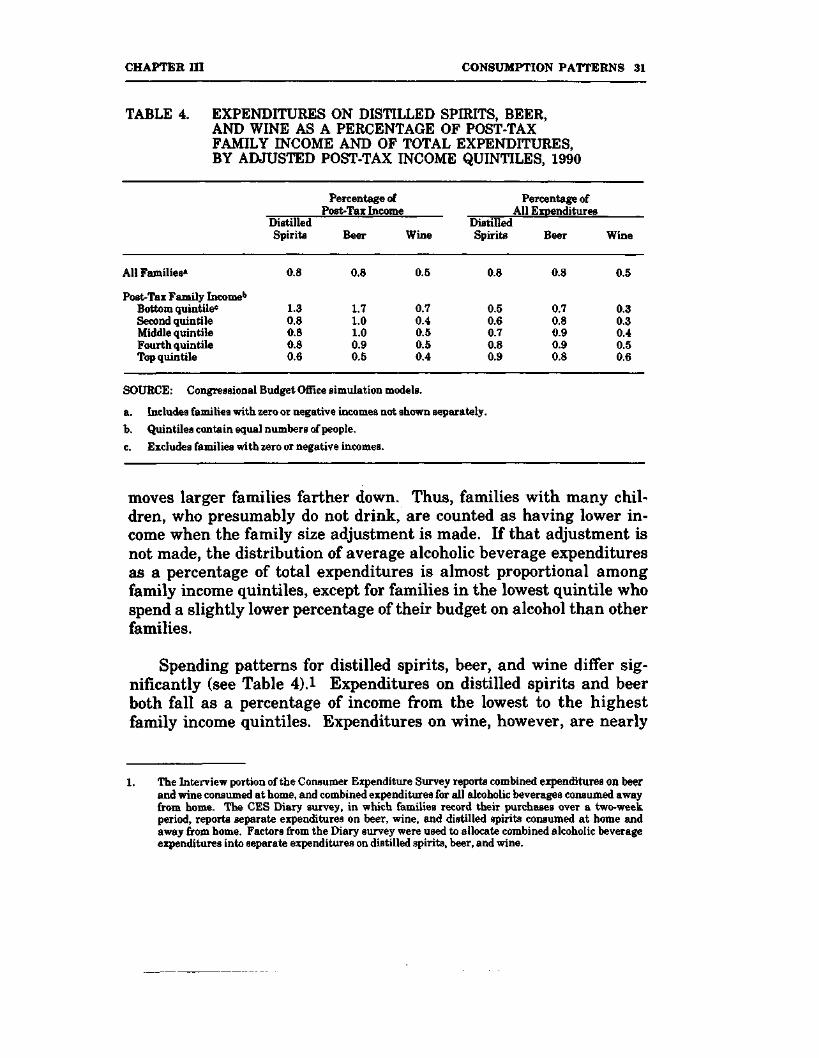
CHAPTER in CONSUMPTION PATTERNS 31
TABLE 4. EXPENDITURES ON DISTILLED SPIRITS, BEER,AND WINE AS A PERCENTAGE OF POST-TAXFAMILY INCOME AND OF TOTAL EXPENDITURES,BY ADJUSTED POST-TAX INCOME QUINTILES, 1990
Percentage ofPost-Tax Income
DistilledSpirits Beer Wine
Percentage ofAll Expenditures
DistilledSpirits Beer Wine
All Families" 0.8 0.8 0.5 0.8
SOURCE: Congressional Budget Office simulation models.
a. Includes families with zero or negative incomes not shown separately,b.c.
Quintiles contain equal numbers of people.Excludes families with zero or negative incomes.
0.8 0.5
Post-Tax Family Income1"Bottom quintilec
Second quintileMiddle quintileFourth quintileTop quintile
1.30.80.80.80.6
1.71.01.00.90.5
0.70.40.50.50.4
0.50.60.70.80.9
0.70.80.90.90.8
0.30.30.40.50.6
moves larger families farther down. Thus, families with many chil-dren, who presumably do not drink, are counted as having lower in-come when the family size adjustment is made. If that adjustment isnot made, the distribution of average alcoholic beverage expendituresas a percentage of total expenditures is almost proportional amongfamily income quintiles, except for families in the lowest quintile whospend a slightly lower percentage of their budget on alcohol than otherfamilies.
Spending patterns for distilled spirits, beer, and wine differ sig-nificantly (see Table 4).l Expenditures on distilled spirits and beerboth fall as a percentage of income from the lowest to the highestfamily income quintiles. Expenditures on wine, however, are nearly
1. The Interview portion of the Consumer Expenditure Survey reports combined expenditures on beerand wine consumed at home, and combined expenditures for all alcoholic beverages consumed awayfrom home. The CES Diary survey, in which families record their purchases over a two-weekperiod, reports separate expenditures on beer, wine, and distilled spirits consumed at home andaway from home. Factors from the Diary survey were used to allocate combined alcoholic beverageexpenditures into separate expenditures on distilled spirits, beer, and wine.
32 FEDERAL EXCISE TAXES August 1990
proportional to family income except in the lowest quintile. Expendi-tures on distilled spirits and wine rise as a percentage of total ex-penditures among adjusted family income quintiles. Expenditures onbeer are roughly proportional to total expenditures.
Expenditures on tobacco, alcoholic beverages, and motor fuels area smaller percentage of total expenditures the older the head of thefamily (see Table 3). Families with a head age 30 or under spend morethan the average percentage of their total budget on tobacco, alcoholicbeverages, and motor fuels. Families with a family head age 60 ormore spend less than the average percentage of their budget on allthree items.
Expenditure Shares
Expenditure shares for different groups can be compared with theirshare of income. For example, the lowest income group has 4.4 percentof total income, but its share of expenditures on alcoholic beverages is8.1 percent (see Table 5). The shares of expenditures on tobacco, alco-holic beverages, and motor fuels rise with rising income (except for theshare of tobacco expenditures for families in the highest income quin-tile). The share of all three types of expenditures equals or exceeds theshare of post-tax income for families in the four lower quintiles. Onlyin the highest income quintile is the share of expenditures on tobacco,alcoholic beverages, and motor fuels less than the share of income.Higher-income families buy more tobacco, alcoholic beverages, andmotor fuels on average than lower-income families, but buy less rela-tive to their income.
Families with a head age 44 or under have a larger share of tobac-co, alcoholic beverage, and motor fuels expenditures than their share ofpost-tax income. Families with heads age 60 and older have a smallershare of those expenditures than their share of post-tax income.
Families in the South devote a higher share of expenditures onmotor fuels than their share of income. Families in the West, althoughspending a significant amount on motor fuels, have a smaller share ofexpenditures than their share of income.
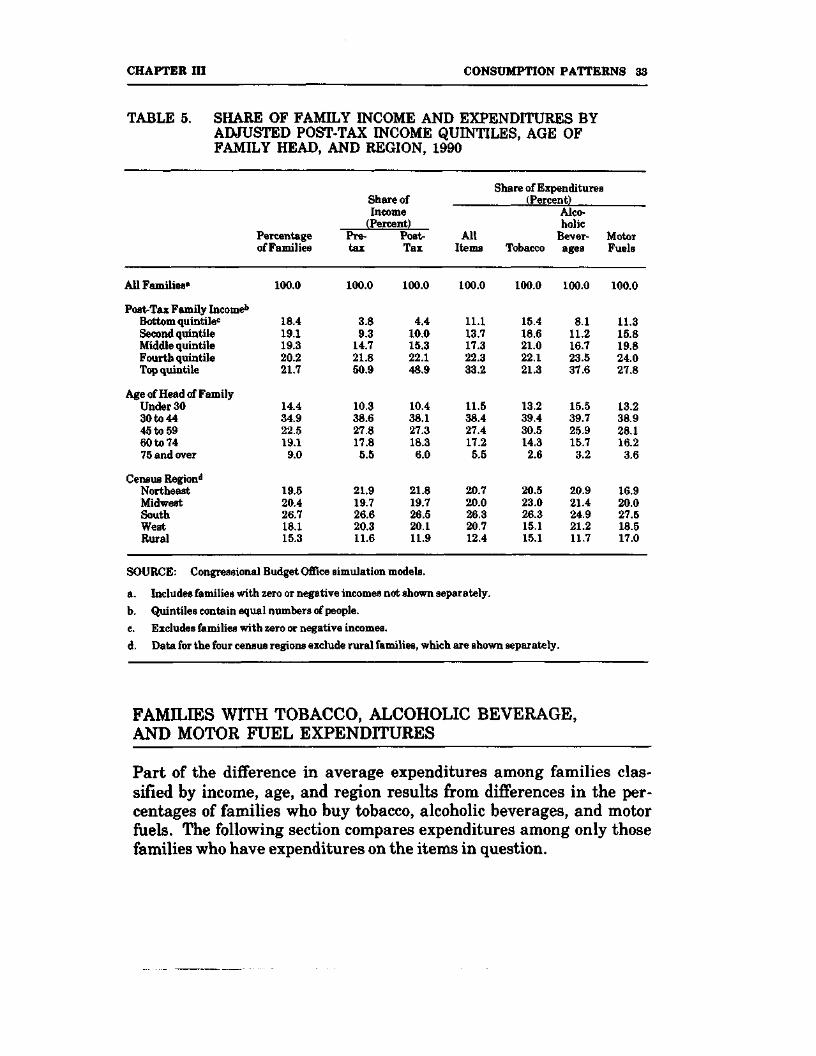
CHAPTER in CONSUMPTION PATTERNS 33
TABLE 5. SHARE OF FAMILY INCOME AND EXPENDITURES BYADJUSTED POST-TAX INCOME QUINTILES, AGE OFFAMILY HEAD, AND REGION, 1990
Percentageof Families
Share ofIncome
(Percent)Pre-tax
Post-Tax
Share of Expenditures(Percent)
Alco-holic
AH Bever- MotorItems Tobacco ages Fuels
All Families' 100.0 100.0 100.0 100.0
Post-Tax Family Income1*Bottom quintile« 18.4 3.8 4.4 11.1Second quintile 19.1 9.3 10.0 13.7Middle quintile 19.3 14.7 15.3 17.3Fourth quintile 20.2 21.8 22.1 22.3Top quintile 21.7 50.9 48.9 33.2
100.0 100.0 100.0
15.418.621.022.121.3
8.111.216.723.537.6
SOURCE: Congressional Budget Office simulation models.
a. Includes families with zero or negative incomes not shown separately.
b. Quintiles contain equal numbers of people.
c. Excludes families with zero or negative incomes.
d. Data for the four census regions exclude rural families, which are shown separately.
FAMILIES WITH TOBACCO, ALCOHOLIC BEVERAGE,AND MOTOR FUEL EXPENDITURES
11.315.819.824.027.8
Age of Head of FamilyUnder 3030 to 4445 to 5960to7475 and over
Census Region4
NortheastMidwestSouthWestRural
14.434.922.519.19.0
19.520.426.718.115.3
10.338.627.817.85.5
21.919.726.620.311.6
10.438.127.318.36.0
21.819.726.520.111.9
11.538.427.417.25.5
20.720.026.320.712.4
13.239.430.514.32.6
20.523.026.315.115.1
15.539.725.915.73.2
20.921.424.921.211.7
13.238.928.116.23.6
16.920.027.518.517.0
Part of the difference in average expenditures among families clas-sified by income, age, and region results from differences in the per-centages of families who buy tobacco, alcoholic beverages, and motorfuels. The following section compares expenditures among only thosefamilies who have expenditures on the items in question.
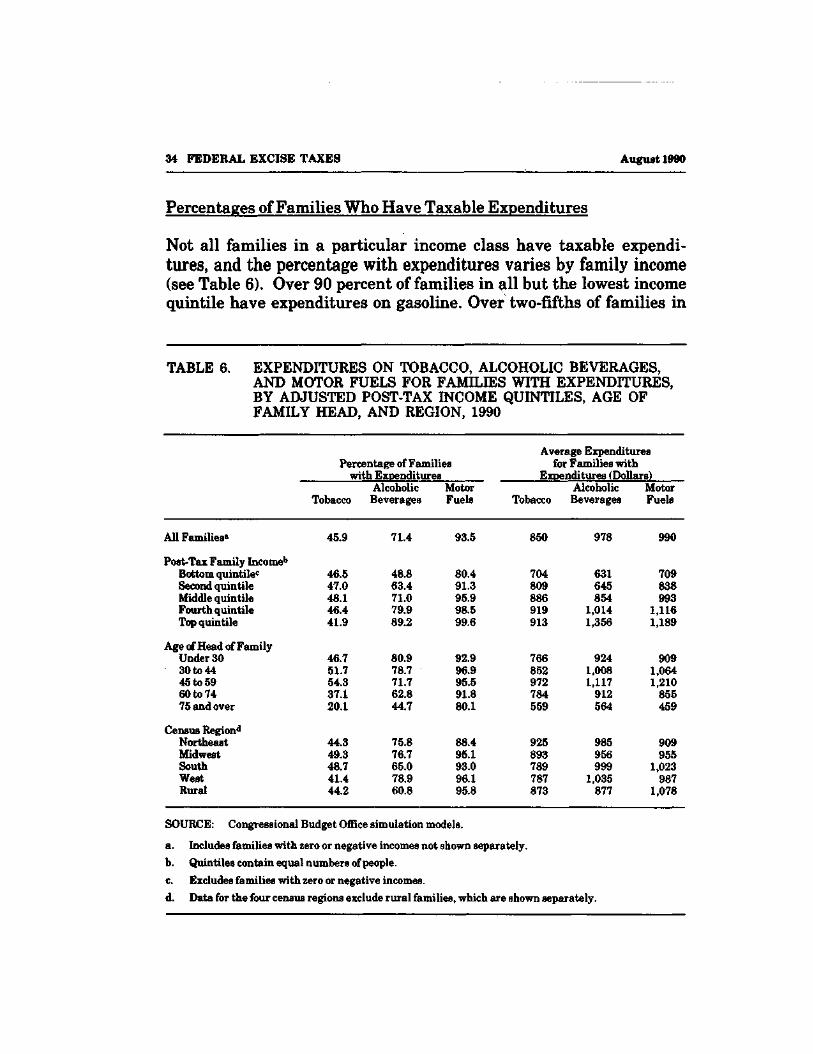
34 FEDERAL EXCISE TAXES August 1990
Percentages of Families Who Have Taxable Expenditures
Not all families in a particular income class have taxable expendi-tures, and the percentage with expenditures varies by family income(see Table 6). Over 90 percent of families in all but the lowest incomequintile have expenditures on gasoline. Over two-fifths of families in
TABLE 6. EXPENDITURES ON TOBACCO, ALCOHOLIC BEVERAGES,AND MOTOR FUELS FOR FAMILIES WITH EXPENDITURES,BY ADJUSTED POST-TAX INCOME QUINTILES, AGE OFFAMILY HEAD, AND REGION, 1990
Percentage of Familieswith Expenditures
Alcoholic MotorTobacco Beverages Fuels
Average Expendituresfor Families with
Expenditures (Dollars)Alcoholic Motor
Tobacco Beverages Fuels
All Families' 45.9 71.4 93.5 850 978 990
Post-Tax Family Income15
Bottom quintilec 46.5 48.8 80.4 704 631 709Second quintile 47.0 63.4 91.3 809 645 838Middle quintile 48.1 71.0 95.9 886 854 993Fourth quintile 46.4 79.9 98.5 919 1,014 1,116Top quintile 41.9 89.2 99.6 913 1,356 1,189
Age of Head of FamilyUnder 30 46.7 80.9 92.9 766 924 90930 to 44 51.7 78.7 96.9 852 1,008 1,06445 to 59 54.3 71.7 95.5 972 1,117 1,21060 to 74 37.1 62.8 91.8 784 912 85575 and over 20.1 44.7 80.1 559 564 459
Census Regiond
NortheastMidwestSouthWestRural
44.349.348.741.444.2
75.876.765.078.960.8
88.495.193.096.195.8
925893789787873
985956999
1,035877
909955
1,023987
1,078
SOURCE: Congressional Budget Office simulation models.
a. Includes families with zero or negative incomes not shown separately.
b. Quintiles contain equal numbers of people.
c. Excludes families with zero or negative incomes.
d. Data for the four census regions exclude rural families, which are shown separately.
CHAPTER ID CONSUMPTION PATTERNS 35
all income quintiles buy tobacco products. Although about 70 percentof all families purchase alcoholic beverages, the percentage rises withincomes from less than 50 percent in the lowest quintile to just under90 percent in the highest.
The percentage of families with expenditures on tobacco increaseswith the age of the head of the family up to age 60, and declines sharplythereafter. The percentage of families with alcoholic beverage ex-penditures declines with increasing age of the family head. The per-centage of families with gasoline expenditures is fairly constantthrough age 60. This might appear to suggest that the people who livelongest are those who refrain from smoking, drinking, and driving. Itis not possible from these data, however, to separate the effects of high-er survival rates from differences in behavior as people grow older,differences in behavior among those born at different times, or differ-ences in behavior among sexes (for example, single women account fora large fraction of older families).
Average expenditures on tobacco, alcoholic beverages, and motorfuels for families with expenditures show a somewhat different patternthan those averages for all families. Average expenditures on alco-holic beverages for families with expenditures vary less among incomegroups than the averages for all families, reflecting the increasing pro-portion of families in the higher income quintiles with expenditures.To a lesser degree, the same is true for motor fuels expenditures. Inother words, higher-income families as a group have higher averageexpenditures on alcoholic beverages and motor fuels because more ofthese families buy at least some of those products.
Because average alcoholic beverage expenditures differ lessamong income quintiles for families with expenditures, the distribu-tion of expenditures as a percentage of income is more regressive forfamilies with expenditures than for all families (see Table 7 and Table4). Alcoholic beverage expenditures represent nearly the same per-centage of total expenditures among income quintiles for families withalcoholic beverage expenditures (see Table 7).
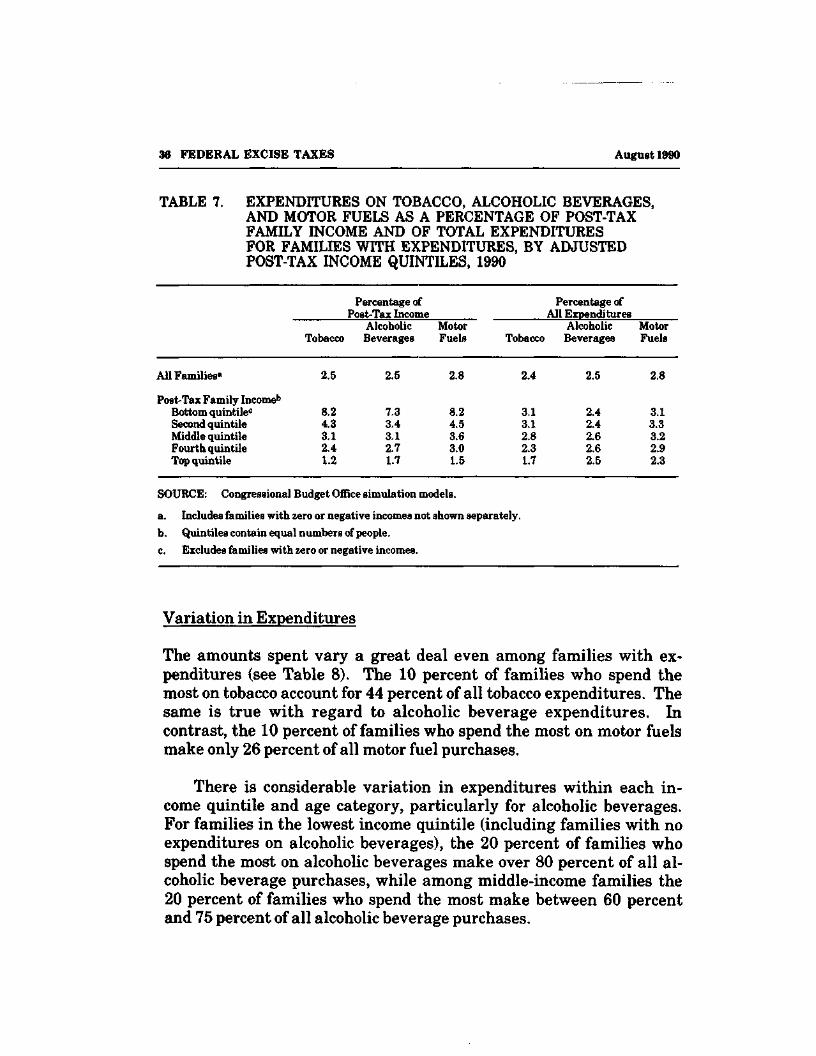
36 FEDERAL EXCISE TAXES August 1990
TABLE 7. EXPENDITURES ON TOBACCO, ALCOHOLIC BEVERAGES,AND MOTOR FUELS AS A PERCENTAGE OF POST-TAXFAMILY INCOME AND OF TOTAL EXPENDITURESFOR FAMILIES WITH EXPENDITURES, BY ADJUSTEDPOST-TAX INCOME QUINTILES, 1990
Percentage ofPost-Tax Income
TobaccoAlcoholicBeverages
MotorFuels
Percentage ofAll Expenditures
TobaccoAlcoholicBeverages
MotorFuels
All Families" 2.5 2.5 2.8 2.4
SOURCE: Congressional Budget Office simulation models.
a. Includes families with zero or negative incomes not shown separately.Quintiles contain equal numbers of people.Excludes families with zero or negative incomes.
2.5 2.8
Post-Tax Family Income1
Bottom quintilec
Second quintileMiddle quintileFourth quintileTop quintile
8.24.33.12.41.2
7.33.43.12.71.7
8.24.53.63.01.5
3.13.12.82.31.7
2.42.42.62.62.5
3.13.33.22.92.3
Variation in Expenditures
The amounts spent vary a great deal even among families with ex-penditures (see Table 8). The 10 percent of families who spend themost on tobacco account for 44 percent of all tobacco expenditures. Thesame is true with regard to alcoholic beverage expenditures. Incontrast, the 10 percent of families who spend the most on motor fuelsmake only 26 percent of all motor fuel purchases.
There is considerable variation in expenditures within each in-come quintile and age category, particularly for alcoholic beverages.For families in the lowest income quintile (including families with noexpenditures on alcoholic beverages), the 20 percent of families whospend the most on alcoholic beverages make over 80 percent of all al-coholic beverage purchases, while among middle-income families the20 percent of families who spend the most make between 60 percentand 75 percent of all alcoholic beverage purchases.
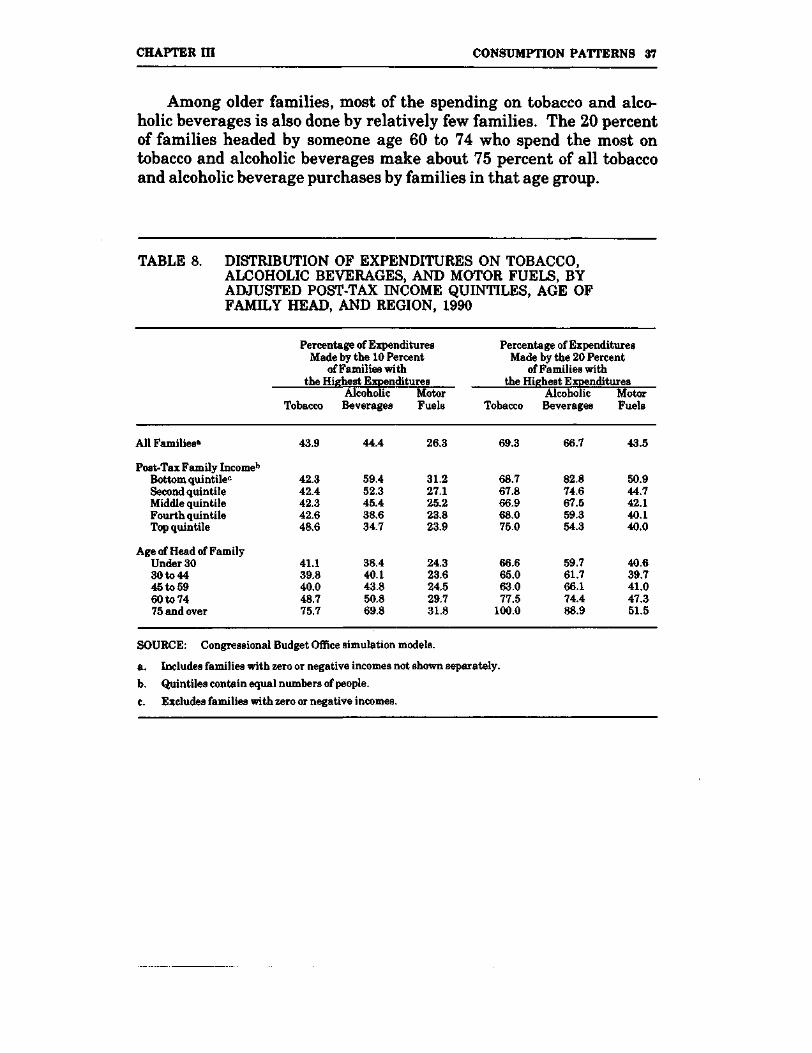
CHAPTER in CONSUMPTION PATTERNS 37
Among older families, most of the spending on tobacco and alco-holic beverages is also done by relatively few families. The 20 percentof families headed by someone age 60 to 74 who spend the most ontobacco and alcoholic beverages make about 75 percent of all tobaccoand alcoholic beverage purchases by families in that age group.
TABLE 8. DISTRIBUTION OF EXPENDITURES ON TOBACCO,ALCOHOLIC BEVERAGES, AND MOTOR FUELS, BYADJUSTED POST-TAX INCOME QUINTILES, AGE OFFAMILY HEAD, AND REGION, 1990
Percentage of ExpendituresMade by the 10 Percent
of Families withthe Highest Expenditures
Alcoholic MotorTobacco Beverages Fuels
Percentage of ExpendituresMade by the 20 Percent
of Families withthe Highest Expenditures
TobaccoAlcoholicBeverages
MotorFuels
All Families* 43.9 44.4 26.3 69.3 66.7 43.5
Post-Tax Family Incomeb
Bottom quintilec 42.3 59.4 31.2 68.7 82.8 50.9Second quintile 42.4 52.3 27.1 67.8 74.6 44.7Middle quintile 42.3 45.4 25.2 66.9 67.5 42.1Fourth quintile 42.6 38.6 23.8 68.0 59.3 40.1Top quintile 48.6 34.7 23.9 75.0 54.3 40.0
Age of Head of FamilyUnder 3030 to 4445 to 5960 to 7475 and over
41.139.840.048.775.7
38.440.143.850.869.8
24.323.624.529.731.8
66.665.063.077.5
100.0
59.761.766.174.488.9
40.639.741.047.351.5
SOURCE: Congressional Budget Office simulation models.
a. Includes families with zero or negative incomes not shown separately.
b. Quintiles contain equal numbers of people.
c. Excludes families with zero or negative incomes.

CHAPTER IV
THE ECONOMIC COSTS OF SMOKING,
DRINKING, AND DRIVING
The prices consumers pay for most products generally reflect the mar-ginal or incremental costs of resources used in producing and sellingthose goods. Producing and consuming some goods, however, gen-erates additional costs that are not reflected in their prices. These ad-ditional or external costs are not paid by producers or consumers ofthose goods but by other members of society. Possible examples of re-source costs that are generally not reflected in product prices are thepresumptive effects of cigarette smoke on the health of nonsmokers,the lives and property lost in alcohol-related accidents, and the en-vironmental damage from automobile exhaust emissions.
If market prices do not fully reflect such "external costs," one wayto adjust for them is to levy excise taxes on goods that generate thosecosts. To the extent that the taxes raise prices and reduce demand, lessof the taxed good or activity is produced, which reduces external costs.Restricting such goods and activities can be beneficial to society if theexternal costs avoided exceed the value of the reduction in outputcaused by the tax. In this respect, excise taxes on goods that generateexternal costs differ from excise taxes on other goods. There is nobenefit from restricting output of goods whose consumption is notassociated with external costs. In taxing the latter, scarce resourcesare allocated less efficiently, and the total losses to firms and con-sumers exceed the revenue raised from the taxes. This so-called excessburden is a real cost of collecting taxes, in addition to the administra-tive costs involved.
It is difficult to say whether raising current taxes on tobacco,alcoholic beverages, and motor fuels would lower external costs byenough to result in net gains to society. First, measuring externalcosts is uncertain because it involves evaluating imprecise estimates ofthe health damage caused by certain types of consumption, and
33-148 0 - 90 - 3 QL 3
40 FEDERAL EXCISE TAXES August 1990
assigning costs to the additional illnesses and premature deathscaused by such consumption.
Second, external costs vary depending on how, where, and bywhom a good is consumed. For example, a tax on gasoline levied in theinterests of controlling pollution will be borne not only by drivers indensely populated urban areas where pollution is a serious problem,but also by drivers in sparsely settled regions where the environmentcan easily absorb automobile emissions. A tax on alcoholic beverageslevied to reduce alcohol-related accidents will tax not only those whodrink and drive but also more conscientious drinkers.
Finally, an excise tax may not be the most efficient way to reduce agiven external cost. Direct control of automobile emissions may bemore effective than a gasoline tax in reducing pollution. Stricter en-forcement of driving-while-intoxicated laws may do more to reducealcohol-related fatalities than raising taxes on alcoholic beverages.Nevertheless, higher taxes may be desirable as part of an integratedpolicy to reduce the economic costs of smoking, drinking, and driving.
TOBACCO AND ALCOHOL
Smoking and drinking can create additional costs that are generallynot reflected in the prices of tobacco and alcoholic beverages. Smokersand drinkers themselves bear some of the economic costs of smokingand drinking in the form of higher medical bills, lost workdays that arenot covered by paid sick leave, and premature death. The rest of soci-ety bears other costs—for example, through higher health insurancecosts, and the damage done to nonsmokers and nondrinkers.
If the rest of society bears some or all of the economic costs of smok-ing and drinking, and if these external costs of smoking and drinkingexceed current taxes on tobacco and alcohol, then raising taxes, to theextent that this reduces consumption, would improve society's use ofresources.
CHAPTER IV THE ECONOMIC COSTS OF SMOKING, DRINKING, AND DRIVING 41
Health and Safety Risks
The 1989 Surgeon General's report on reducing the health conse-quences of smoking summarized current medical findings concerningthe link between smoking and disease. The report cited cigarettesmoking as a major cause or a contributing factor of cancer and cardio-vascular and respiratory disease, and a probable cause of unsuccessfulpregnancies and low-birth-weight babies. 1 Total deaths attributableto smoking were estimated to be 390,000 in 1985. A total of 337,000deaths were attributable to the 10 leading smoking-related diseases,representing 22 percent of all deaths among men and 11 percent ofdeaths among women.
The 1986 Surgeon General's report concluded that passive smok-ing is a cause of disease, including lung cancer, among healthy non-smokers.2
Smoking contributes to fire-related injury and property damage.According to the National Fire Protection Association, smoking-related fires in 1986-the leading single cause of civilian deaths fromfires-caused 1,506 civilian deaths, 3,559 civilian injuries, and $402million in property damage.3
An estimated 105,000 deaths in 1987 were the result of alcohol-related causes.4 Chronic alcohol consumption is associated not onlywith liver disease, the leading cause of alcohol-related deaths fromdiseases, but also with a variety of other diseases and illnesses such as
1. Department of Health and Human Services, Reducing the Health Consequences of Smoking: 25Years of Progress. A Report of the Surgeon General, DHHS Publication No. (CDC) 89-8411,(prepublication version, January 11,1989), pp. 98-99. Specifically, the report found that cigarettesmoking is the major cause of lung and laryngeal cancer, chronic bronchitis, and emphysema; amajor cause of oral and esophageal cancer, coronary heart disease, and cerebrovascular disease(stroke); and a contributing factor to bladder, pancreatic, and renal cancer.
2. Department of Health and Human Services, The Health Consequences of Involuntary Smoking. AReport of the Surgeon General, DHHS Publication No. (CDC) 87-8398 (1986).
3. John R. Hall, Jr., and Alison L. Norton, "The U.S. Smoking-Material Fire Problem Through 1986"(National Fire Protection Association, Fire Analysis Research Division, September 1988).
4. J.M. Shultz, D.P. Rice, and D.L. Parker, "Alcohol-Related Mortality and Years of Potential LifeLost-United States, 1987," reported in Morbidity and Mortality Weekly Report, 39(11):173-178(March 23,1990).
42 FEDERAL EXCISE TAXES August 1990
cancer, mental disorders, and cardiovascular and respiratory diseases.About half of all alcohol-related deaths in 1987 were attributable toalcohol-related diseases and illnesses. The rest resulted from accidentsassociated with alcohol use.
Alcohol abuse is a major factor in motor vehicle accidents. Accord-ing to the National Highway Traffic Safety Administration, 40 percentof all traffic fatalities in 1987 involved a legally intoxicated participant(accidents in which either a driver, pedestrian, or bicyclist had a bloodalcohol content in excess of 0.1 percent, the legal level of intoxicationin most jurisdictions). About 10 percent of all police-reported motorvehicle crashes were alcohol-related, with approximately 534,000people suffering injuries in nonfatal alcohol-related crashes.5
Drinkers who cause traffic accidents injure many besides them-selves. Of the 18,500 traffic fatalities in 1987 involving a legally in-toxicated participant, about 37 percent of those who died were passen-gers of vehicles, other drivers, and pedestrians who were not drunk.6
Measuring Economic Costs
A method commonly used to measure the economic costs of smokingand abusive alcohol consumption is to multiply the total costs of cer-tain diseases and accidents by the attributable risk of tobacco and al-cohol consumption. The attributable risk is the fraction of occurrencesof a particular disease or accident associated with smoking or drinking.The total costs associated with a particular disease or accident areusually divided into direct and indirect costs. Direct costs reflect theexpenses of medical treatment for smoking and alcohol-related ill-nesses, for property loss from accidents and fires, and for special pro-grams—such as highway safety programs or programs for victims of
5. Department of Transportation, National Highway Traffic Safety Administration, Fatal AccidentReporting System (1987) (December 1988) and Department of Transportation, National HighwayTraffic Safety Administration, "Drunk Driving Facts" (National Center for Statistics and Analysis,August 1988).
6. Department of Transportation, National Highway Traffic Safety Administration, "1987 FatalityFacts" (National Center for Statistics and Analysis, October 1988).
CHAPTER IV THE ECONOMIC COSTS OF SMOKING, DRINKING, AND DRIVING 43
fetal alcohol syndrome. Indirect costs measure the value of productionlost because of attributable illnesses and premature death.
Two recent studies provide roughly similar estimates of the eco-nomic costs of smoking. Considering only the economic costs of cancerand cardiovascular and respiratory diseases attributable to smoking,the Office of Technology Assessment (OTA) estimated total costs ofsmoking at between $38 billion and $95 billion in 1985, with a middleestimate of $65 billion, while Rice and others estimated total costs at$53.7 billion in 1984.7 Based on estimated total annual consumptionof cigarettes in the United States of about 30 billion packs in 1984 and1985, the OTA middle estimate and the estimate by Rice suggest totalcosts of between $1.79 and $2.17 per pack.
In both studies, indirect costs were larger than direct costs. Basedon the estimate of $65 billion in total costs, the OTA study estimateddirect health care costs of $22 billion in 1985, of which $4.2 billionrepresented costs to the federal government. Indirect costs from lostproduction were estimated to be $43 billion—66 percent of the total.The study by Rice estimated direct medical costs of $23.3 billion andindirect costs of $30.4 billion, 57 percent of total costs.
A 1984 study by the Research Triangle Institute (RTI) estimatedthat the economic costs of alcohol abuse were $89.5 billion in 1980.Projecting this result forward, the study estimated that the costs were$116.7 billion in 1983.8 Based on estimated consumption of approxi-mately 502 million gallons of pure alcohol in 1983, this estimate sug-
7. Office of Technology Assessment, "Smoking-Related Deaths and Financial Costs" (OTA StaffMemorandum, Health Program, U.S. Congress, 1985); Dorothy P. Rice, Thomas A Hodgson, PeterSinaheimer, Warren Browner, and Andrea N. Kopstein, "The Economic Costs of the Health Effectsof Smoking, 1984," Mllbank Quarterly 64(4):489-547 (1986). A recent report by the Department ofHealth and Human Services estimated total costs of smoking of $52.3 billion in 1985. SeeDepartment of Health and Human Services, Smoking and Health, A National Status Report, 2ndEdition, DHHS Publication No. (CDC) 87-8396 (Revised February 1990).
8. Henrick J. Harwood, Diane M. Napolitano, Patricia L. Kristiansen, and James J. Collins,"Economic Costs to Society of Alcohol and Drug Abuse and Mental Illness: 1980" (PHS ContractNo. ADM 283-830002), Research Triangle Institute, Research Triangle Park, N.C., 1984.
44 FEDERAL EXCISE TAXES August 1990
gests total economic costs of about $1.82 per ounce of alcohol con-sumed.9
Like the studies of costs of smoking described above, the RTI studyseparated the total cost into direct and indirect costs. Indirect costswere about 80 percent of total economic costs in 1983--$92.8 billion.The largest components of indirect costs were the value of lost produc-tion and employment because of illness, and the value of lost lives.Costs of reduced production alone equaled $65.6 billion. The RTI studyestimated that the direct costs of alcohol abuse in 1983 were $23.9billion.
Although these were careful studies, measures of the economiccost of smoking and drinking can vary a great deal. Estimated eco-nomic costs are likely to be too low because it is difficult to quantify allthe attributable risks. The studies by OTA and Rice considered onlythe specific disease-related costs of smoking. They did not includeother costs, such as those associated with fires started by smoking. Theattributable risks of abusive alcohol consumption may be understatedif many alcohol-related deaths are not recorded as such. The inabilityto quantify all attributable risks and the underreporting of measuredrisks results in an underestimate of economic costs.
Estimates of the economic costs of smoking and drinking may betoo high for other reasons. The studies measure gross rather than neteconomic costs. If morbidity and mortality from smoking and alcoholwere reduced, people would incur other illnesses and would die fromother causes, which would have their own costs. These costs could beas high as, or even higher than, the medical costs of treating smokersand heavy drinkers. The studies also assign all of the difference inmortality to the attributable risk of smoking and drinking. If smokersand drinkers differ from nonsmokers and nondrinkers in other health
9. According to industry sources, an estimated 5,666 million gallons of beer, 528 million gallons ofwine, and 431 million gallons of distilled spirits were consumed in 1983. The cost per ounce ofalcohol is based on an average alcoholic content of 4.5 percent for beer, 12.9 percent for wines, and41.4 percent for distilled spirits. The latter factors are from Sharon D. Brooks, Gerald D. Williams,Fredrick S. Stinson, and John Noble, Surveillance Report #13: Apparent Per Capita AlcoholConsumption: National, State, andRegional Trends, 1977-1987 (Rock.ville, Md.: National Instituteon Alcohol Abuse and Alcoholism, Division of Biometry and Epidemiology, Alcohol EpidemiologicData System, September 1989).
CHAPTER IV THE ECONOMIC COSTS OF SMOKING, DRINKING, AND DRIVING 45
care habits and genetic and economic characteristics that may con-tribute to illnesses, then the attributable risks assigned to smokingand drinking will be overstated and so will the economic costs of thoseactivities.
Finally, estimates will be imprecise because indirect costs, whichare a large portion of total economic costs, are very difficult to mea-sure. There is no agreement on the value to assign to the losses fromillness and premature death. The previously cited studies value thoselosses at the rate of forgone earnings, estimated for both workers andnonworkers. Another way of evaluating the loss is to estimate theamount that people are willing to pay to avoid illness or prematuredeath. Willingness to pay is a broader measure, encompassing thevalue people place on good health beyond just the loss of production,but it is more difficult to estimate than forgone earnings. Measure-ments of indirect costs also are imprecise because most indirect costswill be incurred in the future, so it is necessary to assume a discountrate for estimating the present value of these costs. A change in thediscount rate assigned to future indirect costs can significantly changethe estimate of total costs.
Internal and External Costs
An important question is the extent to which the economic costs arepaid by smokers and drinkers themselves (internal costs), or by therest of society (external costs). The distinction between internal andexternal costs matters because, if consumers pay for the economic costsof their consumption, they bear all the economic consequences of theirdecisions. From the standpoint of economic efficiency, observed tobac-co and alcoholic consumption is neither too high nor too low, and nomisallocation of resources takes place. From that standpoint, therewould be no case for raising or lowering excise taxes to change con-sumption.
Smokers or drinkers pay some portion of the health costs stem-ming from smoking and drinking through higher out-of-pocket medicalcosts or higher health insurance premiums. (Differential rates basedon health care habits are not typical of health insurance policies, par-
46 FEDERAL EXCISE TAXES August 1990
ticularly group insurance plans, although such rates are common inlife insurance policies.) The rest of society pays other health costs tothe extent that a group health insurance policy or Medicare or Medi-caid pays for medical care.
Lost wages from illness or premature death represent a loss ofresources, but whether they are an external or internal cost is a matterof some dispute. One view is that they are a cost borne mainly by theconsumer to the extent that wages are not replaced by paid sick leaveor disability payments. Society, in turn, loses the value of forgone taxpayments on those earnings. Ironically, this view suggests that someexternal costs may be negative if, for example, users of tobacco andalcoholic beverages die prematurely before they are able to collectSocial Security and pension retirement benefits. 10
A recent study by Manning and others divided the economic costsof smoking and abusive alcohol consumption into internal and externalcosts.ll The estimated external costs of smoking included the dis-counted values of medical care for smoking-related illnesses paid bygroup health plans or federal programs, covered sick leave for addi-tional workdays lost by smokers, and the lives of nonsmokers and theproperty lost from fires associated with cigarette smoking. These costswere offset by the discounted value of reduced pension and nursinghome payments that smokers fail to receive because of prematuredeath, but the costs were increased by the value of lost taxes. Theexternal costs of abusive alcohol consumption included the discountedvalues of the lives of nondrinkers lost and property damage fromalcohol-related traffic accidents and fires, alcohol-related costs for thecriminal justice system, and the cost of alcohol treatment programs, inaddition to medical, sick leave, and pension costs. (Abusive consump-tion of alcohol was defined in the Manning study as consumption in
10. See John B. Shoven, Jeffrey O. Sundberg, and John P. Bunker, "The Social Security Cost ofSmoking" (National Bureau of Economic Research, Working Paper No. 2234, Cambridge, Mass.,May 1987); and Virginia Baxter Wright, "Will Quitting Smoking Help Medicare Solve Its FinancialProblems?" Inquiry, 23:76-82 (Spring 1986).
11. Willard G. Manning, Emmett B. Keeler, Joseph P. Newhouse, Elizabeth M. Sloes, and JeffreyWasserman, "The Taxes of Sin. Do Smokers and Drinkers Pay Their Way?" Journal of theAmerican Medical Association, 261(11):1604-1609 (March 17,1989).
CHAPTER IV THE ECONOMIC COSTS OF SMOKING, DRINKING, AND DRIVING 47
excess of two drinks per day, estimated to be 40 percent of total con-sumption.)
The estimated external cost of smoking in 1986 dollars ($0.15 perpack) was considerably lower than the average pombined federal andstate tax ($0.37 per pack). The estimated external cost of drinking($1.19 per ounce of excess consumption or $0.48 per ounce of total al-cohol consumed) was much higher than the average combined tax($0.23 per ounce).
The estimated costs depend on assumptions concerning the medi-cal costs associated with smoking and drinking, the rate at whichfuture costs are discounted, and estimates of the dollar value of life,things about which even experts will disagree. Most of the direct ex-ternal costs of smoking were attributable to medical expenditures. Nettotal costs were less than gross costs because of offsets from reducedfuture pension and nursing home payments, reflecting the shorterlives of smokers.
Medical costs were a small portion of the direct external costs ofalcohol consumption. The majority of the costs were attributable to thelost lives of nondrinking passengers and bystanders in alcohol-relatedtraffic accidents, and other costs associated with traffic accidents suchas costs to the criminal justice system and property damage. Becauseheavy drinkers are more likely to retire and receive pension anddisability benefits early, and because these costs exceed the reducedpension payments from the shorter lives of heavy drinkers, total netexternal costs of alcohol consumption-unlike those of smoking—wereestimated to exceed direct costs.
These estimates suggest that raising taxes on drinking would in-crease economic efficiency, but that the external costs of smoking arealready covered by existing taxes. Particularly for smoking, however,these conclusions depend on which costs are considered to be real ex-ternal costs.
For example, though the study by Manning treated costs imposedby smokers and heavy drinkers on other family members as internalcosts, it recognized that a different classification would have raised
48 FEDERAL EXCISE TAXES August 1990
estimated total external costs. If the costs imposed by passive smokingon other family members (about $0.14 per pack), and the costs ofdeaths and injuries to family members from smoking-related fires(about $0.09 per pack), had been treated as external rather thaninternal, the external cost of smoking would have risen to about $0.38per pack, about equal to the combined federal and state taxes oncigarettes.
The study by Manning included effects of smoking that representtransfers of income between smokers and nonsmokers in its measure ofnet external costs. Such transfers do not reflect a misallocation ofsociety's resources that could be addressed by reducing the amount ofsmoking. For example, if smokers receive lower Social Security pay-ments, other citizens may appear to enjoy an external "benefit" to theextent that they pay lower Social Security taxes or are able to receivehigher benefits themselves. These benefits, however, are obtained atthe expense of smokers: what may appear to be an external "benefit"to nonsmokers is also an internal cost to smokers. Similarly, lowertaxes paid by smokers are not an external resource cost of smoking.Lower taxes paid by smokers are simply the way in which part of theinternal cost of lower production and earnings is transferred from thesmoker to the rest of the population. Removing indirect pension costsnet of reduced tax payments from the calculation of net external costswould have increased total estimated external costs by $0.13 per pack.
Abusive Consumption
While excise taxes on tobacco and alcoholic beverages are levied on allconsumption, it may not be true that all consumption of tobacco andalcohol generates external costs. The distinction between harmful andharmless use may be more important in the case of alcohol consump-tion. The health effects of smoking appear even at low consumptionlevels. Light smoking (1 to 9 cigarettes per day) is linked with in-creased risks of smoking-related diseases. By comparison, some evi-dence suggests that moderate consumption of some alcoholic beverages
CHAPTER IV THE ECONOMIC COSTS OF SMOKING, DRINKING, AND DRIVING 49
is not injurious to health, and may in fact be beneficial. 12 Althoughmoderate drinking does appear to increase the risk of traffic accidents,the risk rises substantially with increased consumption. 13
Because it is generally not possible to levy taxes only on alcoholconsumption that generates external costs, the gains from a reductionin external costs must be balanced against the losses to nonabusivedrinkers.14 These losses include not only the additional tax paymentsmade by nonabusive consumers, but also the loss in their welfare ifhigher taxes cause these consumers to drink less.
The sensitivity of abusive and nonabusive consumption to pricechanges is an important factor in determining the appropriate rate atwhich to tax. If abusive consumption is sensitive to prices (and ifchanges in taxes are reflected in prices), then higher taxes could beeffective in reducing external costs. If abusive consumption is notsensitive to prices, however, higher taxes would not effectively reduceexternal costs and would only penalize all drinkers. If abusive con-sumption is more sensitive to prices than nonabusive consumption,then higher taxes would reduce external costs and would not seriouslypenalize nonabusers by causing them to significantly reduce their con-sumption of alcohol (although the disposable incomes of all drinkerswould be reduced by the amount of the additional tax).
Ever since the apparent failure of the "great experiment" of Pro-hibition during the 1920s, many people have held that any govern-mental effort to discourage harmful drinking is bound to fail, and that
12. Though a matter of controversy, research suggests a positive relationship between moderatealcohol consumption and a lower risk of coronary artery disease. This issue is discussed inDepartment of Health and Human Services, Seventh Special Report to the U.S. Congress on Alcoholand Health (Public Health Service, National Institute on Alcohol Abuse and Alcoholism, preprintcopy, 1990).
13. Youths (ages 16 to 21) with a blood-alcohol concentration (BAC) between 0.01 and 0.05 cor-responding to one to two drinks over a several-hour period, face twice the risk of being in a fatalautomobile accident relative to nondrinking youths. Youths with a BAC of over 0.10, correspond-ing to six or more drinks over a several-hour period, face 100 times the risk of being in a fatalautomobile accident relative to nondrinking youths. See Charles E. Phelps, "Death and Taxes: AnOpportunity for Substitution," Journal of Health Economics, 7:1-24 (1988).
14. This issue is discussed in more detail in Thomas F. Pogue and Larry G. Sgontz, "Taxing to ControlSocial Costs: The Case of Alcohol," American Economic Review, 79(l):235-243 (March 1989).
50 FEDERAL EXCISE TAXES August 1990
such an effort will only hurt more conscientious drinkers. 15 Yet evi-dence suggests that abusive alcohol consumption is sensitive to price,and that heavy use declines more than infrequent use under a priceincrease. 16 Cirrhosis of the liver, which is positively related to heavyalcohol consumption, has been found to be negatively related to statealcohol tax rates. In a study of 30 states, those that raised liquor taxeshad either smaller increases or greater reductions in cirrhosis mortali-ty rates.17
Relating the appropriate mix of tax rates among different alcoholicbeverages to external costs is difficult. Although the medical conse-quences of pure ethyl alcohol consumption are the same for all bever-ages, current federal excise tax rates per ounce of pure alcohol vary bytype of beverage. The tax on distilled spirits is equal to about $0.20 perounce of pure alcohol, while the tax on beer is about $0.05 per ounce ofalcohol and the tax on table wine is about $0.01 per ounce of alcohol. A12-ounce can of beer, a 1.4-ounce shot of 80-proof distilled spirits, and a5-ounce glass of table wine all contain about 0.55 ounces of ethylalcohol.
Some external costs of drinking vary not only with the quantity ofalcohol consumed, but also with the type of beverage, the consumer,and the setting in which the beverage is consumed. Beer may in somerespects have higher external costs than wine or distilled spiritsbecause it is the alcoholic beverage of choice among teenagers andyoung adults, who are responsible for a disproportionate share oftraffic fatalities. In 1987 licensed drivers age 16 to 19—6.2 percent ofall licensed drivers—accounted for 12.7 percent of drivers involved infatal traffic accidents and 9.6 percent of legally intoxicated driversinvolved in fatal traffic accidents. Licensed drivers age 20 to 24-10.9
15. Recent attempts to restrict consumption of alcoholic beverages in the Soviet Union have hadlimited success. See "Russia's Anti-Drink Campaign," The Economist (December 23,1989), pp. 50-54.
16. Michael Grossman, "Health Benefits of Increases in Alcohol and Cigarette Taxes," NationalBureau of Economic Research, (Working Paper No. 3082, Cambridge, Mass., August 1989).
17. Philip J. Cook, "The Effect of Liquor Taxes on Drinking, Cirrhosis, and Auto Accidents," in Mark H.Moore and Dean R. Gerstein, eds., Alcohol and Public Policy: Beyond the Shadow of Prohibition(Washington, D.C.: National Academy Press, 1981); and Philip J. Cook and George Tauchen, "TheEffect of Liquor Taxes on Heavy Drinking," Bell Journal of Economics, 13(2), pp. 379-390 (Autumn1982).
CHAPTER IV THE ECONOMIC COSTS OF SMOKING, DRINKING, AND DRIVING 51
percent of all licensed drivers—accounted for 17.8 percent of drivers in-volved in fatal traffic accidents and 23.5 percent of legally intoxicateddrivers involved in fatal traffic accidents.18 Even here it is difficult todetermine an appropriate tax rate. A higher tax on beer-alcohol couldcause youths to consume more wine- or spirits-alcohol.
The external costs of drinking depend on how and by whom thebeverage is consumed. The concentration of alcohol in the body, andhence the degree of intoxication, varies according to the weight and sexof the consumer, whether or not alcohol is consumed with food, and theextent to which the alcohol is diluted in other liquids.
Information. Habit, and Addiction
Even if smokers and drinkers bear all the relevant costs of theiractions, consumption of cigarettes and alcoholic beverages could stillbe too high if users underestimate the potential harm to themselvesfrom consumption. If users are fully aware of the risks but are unableto reduce their consumption because of habit or addiction, there may befurther justification for government intervention. In such cases, theprinciple of consumer sovereignty might be questioned because two ofits tenets—full information and rational choice—no longer apply.
There is evidence that smokers and drinkers do not correctly per-ceive the health risks associated with smoking and drinking. Substan-tial percentages of current smokers do not know or do not believe thatsmoking is causally related to several diseases, including lung cancer(9 percent), heart disease (18 percent), chronic bronchitis (20 percent),emphysema (17 percent), or cancer of the mouth and throat (15 per-cent).^ In addition, although light smoking (1 to 9 cigarettes per day)is linked with increased risk of smoking-related diseases, 20 percent ofsmokers, 13 percent of former smokers, and 11 percent of those whohave never smoked were found to believe that only heavy smoking has
18. Department of Transportation, Federal Highway Administration, Highway Statistics, 1987; andDepartment of Transportation, National Highway Traffic Safety Administration, Fatal AccidentReporting System, 1987.
19. Charlotte A. Schoenborn and Gayle M. Boyd, "Smoking and Other Tobacco Use: United States,1987" (National Center for Health Statistics, Vital Health Statistics, 10(169), September 1989).
52 FEDERAL EXCISE TAXES August 1990
adverse health effects.20 Some evidence suggests that young adultsgreatly underestimate the risks of drinking and driving.21
Even if smokers and drinkers correctly perceive the internal costsof alcohol and tobacco consumption, they may be unable to reduce theirconsumption. The addictive nature of alcohol for some portion of thepopulation is widely accepted. Nicotine in tobacco has been identifiedas the agent that causes cigarette consumption to be addictive.22
Seventy percent of all current smokers in 1985-1986 reported a leastone serious attempt to quit at some time during their lives.23 Teen-agers in particular may not appreciate the addictive nature of alcoholor nicotine, and by the time they become aware they may be unable toreduce their consumption.
If smokers and drinkers do not correctly perceive the relative risksof their behavior, or if they understand the risks but are unable to limittheir consumption, there may be benefits to society in taxing addictiveconsumption apart from internalizing external costs. These benefitscould be substantial in the case of cigarettes, since the value of liveslost by smokers is substantial—much higher than any of the measuredexternal costs. For example, results from the study by Manning sug-gest that the total cost of lost lives of smokers runs as high as $5.00 perpack, while the cost of lost lives of heavy drinkers is over $1.00 perounce of alcohol consumed.
Alternatives to Taxation
Raising excise taxes on alcohol and tobacco is not the only way toreduce the economic costs of smoking and alcohol abuse. Other effec-tive policies might include stricter enforcement of laws against driving
20. Department of Health and Human Services, Office on Smoking and Health, Tobacco Use in 1986:Methods and Basic Tabulations from Adult Use of Tobacco Survey (1989).
21. Charles E. Phelps, "Risk and Perceived Risk of Drunk Driving Among Young Drivers, Journal ofPolicy Analysis and Management, 6(4):708-713 (Summer 1987).
22. Department of Health and Human Services, The Health Consequences of Smoking: NicotineAddiction, DHHS Publication No. (CDC) 88-8406 (1988).
23. Department of Health and Human Services, Reducing the Health Consequences of Smoking.
CHAPTER IV THE ECONOMIC COSTS OF SMOKING, DRINKING, AND DRIVING 53
while intoxicated, control of the distribution and advertising of alcoholand tobacco products, and educational and advertising campaigns.
Limiting Smoking. Current federal efforts to limit consumption oftobacco focus primarily on providing information on the adverse healtheffects of tobacco use, requiring health warnings on cigarette productsand advertisements, banning tobacco advertisements in the broadcastmedia, and restricting tobacco use on government worksites and ondomestic flights of U.S. airlines.
Federal law requiring health warnings on cigarette packages andadvertisements began in 1966, shortly after the publication in 1964 ofthe first Surgeon General's report on smoking and health. Federalrestrictions on cigarette advertising began in July 1967, when the Fed-eral Communications Commission began to apply the Fairness Doc-trine, requiring broadcasters of smoking advertisements to allot timefor antismoking messages. In 1971, under the Public Health CigaretteSmoking Act of 1969, the Fairness Doctrine was replaced by the cur-rent ban on cigarette advertising on television and radio.
Cigarette advertising and promotion are still extensive. Accord-ing to the 1989 Surgeon General's report on reducing the health conse-quences of smoking, $2.4 billion was spent on the advertisement andpromotion of cigarettes in 1986. Cigarette advertisements ranked firstamong advertisements in billboards, second in magazines, and third innewspapers. While some advertising and promotion may be targetedonly at the brand selections of current smokers, it may also increaseboth the prevalence of smoking and the per capita consumption ofcigarettes. A number of bills to reduce advertising and promotion oftobacco products were introduced in the 100th and 101st Congresses.24
Per capita consumption of cigarettes by people age 16 and over hasdeclined dramatically since the release of the first Surgeon General'sreport in 1964: from an average of 210 packs per year in 1963 to 150packs per year in 1988. The change is even more dramatic given thatcigarette consumption trends were rising before 1964. It is estimated
24. Bruce K. Mulock, "Cigarettes and Other Tobacco Products: Should Congress Ban All Advertisingand Promotion?" Congressional Research Service, Issue Brief No. 86105 (updated January 27,1989).
54 FEDERAL EXCISE TAXES August 1990
that, had it not been for the antismoking campaign over the last 25years, per capita consumption today would be 79 percent to 89 percenthigher.25
The effects of specific federal policies designed to reduce cigaretteconsumption, and in particular the effects of federal restrictions oncigarette advertising and promotion, are not as clear. While theapplication of the Fairness Doctrine probably reduced consumption,replacing the doctrine with the existing ban on broadcast advertise-ments may have led to increased consumption. According to the 1989Surgeon General's report on reducing the health consequences ofsmoking, per capita consumption increased by 2.0 percent during thethree years preceding the Fairness Doctrine, fell 6.9 percent during thethree years the doctrine was in force, and increased by 4.1 percentduring the three years after it was discontinued.
Whether further restrictions on cigarette advertising would re-duce smoking is also uncertain. If current cigarette advertising re-cruits new smokers and encourages others to smoke more, a total banon cigarette advertising might reduce consumption. If the advertisingis only a struggle for shares of the current market, a total ban mightreduce advertising costs and result in lower prices of cigarettes. Lowerprices might in turn lead to higher per capita consumption and to awider prevalence of smoking, particularly among price-sensitive teen-agers.
No federal law sets a minimum age for purchasing tobacco, al-though 44 states and the District of Columbia restricted sales of tobac-co to minors. The minimum age for legal purchases varies from 15years to 19 years, with 18 years the most common. The 1989 SurgeonGeneral's report concludes that current restrictions are not, in prac-tice, very effective.
Limiting Alcohol Abuse. Much of recent federal policy directed atabusive alcohol consumption focuses on drinking and driving, and onalcohol consumption among teenagers. To establish a standard drink -
25. Kenneth E. Warner, "Effects of the Antismoking Campaign: An Update," American Journal ofPublic Health, 79(2):144-151 (February 1989).
CHAPTER IV THE ECONOMIC COSTS OF SMOKING, DRINKING, AND DRIVING 55
ing age among all states, the Federal Uniform Drinking Age Act of1984 provided that the Congress would withhold federal highwayfunds from states with minimum legal drinking ages (MLDA) below 21years. Currently, all 50 states and the District of Columbia use 21years as the MLDA.
Most research indicates that the MLDA is inversely related totraffic fatalities involving alcohol.26 When 29 states lowered theMLDA between 1970 and 1975, involvement of young drivers in fatalmotor vehicle accidents increased, and conversely, when states raisedthe MLDA in the late 1970s and early 1980s, involvement of youngdrivers in fatal motor vehicle accidents fell.27 The National HighwayTraffic Safety Administration estimates that minimum drinking agelaws have reduced traffic fatalities involving drivers in affected agegroups by 13 percent—saving 1,071 lives in 1987 and a cumulative totalof 8,142 lives between 1975 and 1987.28
As required by the Alcohol Beverage Label Act of 1988, all cansand bottles of domestic and imported beer, wine, and distilled spiritsmust now carry a health warning label. The current label includes acaution against consuming alcoholic beverages and driving a car oroperating machinery. It is too early to tell whether this will havemuch effect.
In 1989, based on recommendations from a workshop on drunkdriving, the Surgeon General proposed a number of options designed toreduce the costs of drinking and driving. These options include auto-matic confiscation of drivers' licenses for driving while intoxicated, a
26. General Accounting Office, Drinking Age Laws: An Evaluation Synthesis of Their Impact onHighway Safety, GAO/PEMO-87-10 (March 1987).
27. Henry Saffer and Michael Grossman, "Beer Taxes, the Legal Drinking Age, and Youth MotorVehicle Fatalities," The Journal of Legal Studies, 16(2):351-374 (June 1987); William DuMouchel,Allan F. Williams, and Paul Zador, "Raising the Alcohol Purchase Age: Its Effects on Fatal MotorVehicle Crashes in Twenty-six States," The Journal of Legal Studies, 16(l):249-266 (January 1987);Philip J. Cook and George Tauchen, "The Effect of Minimum Drinking Age Legislation on YouthfulAuto Fatalities, 1970-1977," The Journal of Legal Studies, 13(1):169-190 (January 1984); Allan F.Williams, Paul L. Zador, Sandra 8. Harris, and Ronald S. Karpf, "The Effect of Raising the LegalMinimum Drinking Age on Involvement in Fatal Crashes," The Journal of Legal Studies,12(1):169-179 (January 1983).
28. Department of Transportation, National Highway Traffic and Safety Administration, "1987Fatality Facts" (National Center for Statistics and Analysis, October 1988).
56 FEDERAL EXCISE TAXES August 1990
reduction in the legal blood alcohol concentration limit for drivers from0.10 percent to 0.04 percent by the year 2000, restriction of certainadvertising of alcoholic beverages, and expanded use of sobriety check-points.29
MOTOR FUELS
Drivers of motor vehicles, like smokers and drinkers, impose costs onothers that are not included in the private cost of driving. These costsinclude wear and tear on highways, congestion costs imposed on othermotorists, and emissions of air pollutants that are injurious to propertyand health. Reductions in gasoline consumption resulting from agasoline tax would reduce some, but not all, of these external costs. Onclose examination, it appears that an increase in the federal gasolinetax would contribute little to more efficient use of highways in terms ofeither reduced wear and tear or less congestion. Higher federal gaso-line taxes could be a cost-effective means of reducing air pollution, atleast in heavily polluted areas, but that result could be achieved moredirectly by other emission-related taxes, or increases in state gasolinetaxes. Gasoline consumption also contributes to dependence on oilimports that may keep world oil prices high and entail reliance on oilsupplies from insecure sources. By reducing gasoline consumption,higher gasoline taxes would reduce the need to rely on imported oil.
How Are Motor Fuel Taxes Used?
Receipts from the federal gasoline and diesel fuel tax are nowdeposited, along with other earmarked excise taxes, into the HighwayTrust Fund (HTF). The HTF is essentially an accounting mechanismthat records revenues from the taxes earmarked for the fund, spendingfrom the fund on designated highway and mass transit programs, andinterest that accrues on the fund's cash balances. The HTF maintainsseparate highway and mass transit accounts. In addition to federalexcise taxes on gasoline and diesel fuels, three other HTF taxes are
29. Department of Health and Human Services, Proceedings of the Surgeon General's Workshop onDrunk Driving (Public Health Service, Office of the Surgeon General, Washington D.C.: December14-16,1988).
CHAPTER IV THE ECONOMIC COSTS OF SMOKING, DRINKING, AND DRIVING 57
currently assessed on highway use. These taxes include a 12 percentsales tax on heavy trucks and trailers, a heavy-vehicle use tax (varyingby weight) on vehicles weighing in excess of 55,000 pounds, and a taxon heavy tires for highway vehicles. In 1989, the HTF collected $15.6billion in total revenues--$14.3 billion from taxes on motor fuels and$2.2 billion from taxes on trucks and trailers, heavy vehicles, and tires,less about $0.8 billion in refunds..
Since 1980, HTF highway account receipts and spending havebeen roughly in balance. During the 1970s an unexpended balanceaccumulated and has hovered around $10 billion for the last decade,primarily attributable to the natural lag between commitments andoutlays for federal highway programs. During the 1980s, outlays haveexceeded tax revenues credited to the fund and have been roughlyequal to total fund receipts, which include interest in addition to taxrevenues.
Because of the long lead times that can exist in highway programs,funds may be committed from the Highway Trust Fund long beforethey are actually spent. The Byrd amendment allows unpaid commit-ments against the fund to exceed the cash balance by as much as twoyears of future receipts (including interest). As a result, unpaid com-mitments at the beginning of fiscal year 1990 totaled about $32 billion,compared with the unexpended balance of $10.6 billion. The Congres-sional Budget Office expects receipts in 1991 and 1992 to exceed theunfunded authorizations at the end of the current year by about $8 bil-lion. This amount indicates the approximate level of additional spend-ing that could be sustained by the highway account without violatingthe Byrd amendment.
This balance ignores spending on highway programs out of generalfund revenues. While the HTF currently finances most federal high-way spending, the government's general fund has provided over $3billion for highway spending since 1957. If these expenditures hadbeen paid from HTF taxes, the unexpended balance in the HTF wouldnow be under $1 billion.
Combined spending on highways by all levels of government ex-ceeds revenue collected directly from users. In 1988, federal, state, and
58 FEDERAL EXCISE TAXES August 1990
local government collections from motor fuel taxes, vehicle taxes, andtolls ($41.6 billion) were only 61 percent of total highway disburse-ments ($68.6 billion).30 Highway collections from motor fuel taxes,vehicle taxes, and tolls were 60 percent of total receipts in 1988-downfrom a high of 73 percent in 1964 and up from a low of 55 percent in1982.31 According to FHWA, the share of state highway collectionsfrom user-related taxes and tolls declined from 95 percent of total re-ceipts in 1965 to 86 percent in 1988. Although combined highwayspending exceeds combined highway taxes, it may be appropriate thatnonusers bear some burden of government highway programs if theybenefit indirectly from these programs.
Controversy is likely to arise over whether any increase in motorfuel taxes should go into the HTF and be used to fund increases infederal spending on highways and related projects or go into the gen-eral fund. One position is that all motor fuel tax receipts belong to theHTF, and that the government has a compact with those who pay thetaxes to use them exclusively for highways. Others hold that taxes onfuels should be designed to provide incentives for their efficient use,and that levels of spending on highways should be determined inde-pendently of receipts. A motor fuel tax increase designed to provide in-centives to reduce external costs of driving could yield revenues muchgreater than the amount that could be spent profitably on highwayprojects as compared with other programs.
What Would Be the Benefits of Higher Motor Fuel Taxes?
Higher motor fuel taxes would directly cause reductions in gasolineconsumption. These reductions could come about through reduceddriving, through actions that would improve the fuel efficiency ofvehicles that are now in use, and through long-run changes in the fuelefficiency of new vehicles.
30. Department of Transportation, Federal Highway Administration, Highway Statistics, 1988, Publi-cation No. FHWA-PL-89-003, HPM-40 (October 1989), p. 38.
31. Department of Transportation, Federal Highway Administration, The Status of the Nation'sHighways and Bridges: Conditions and Performance, Report of the Secretary of Transportation tothe U.S. Congress, Committee on Public Works and Transportation, Committee Print 101-2 (June1989), p. 35.
CHAPTER IV THE ECONOMIC COSTS OF SMOKING, DRINKING, AND DRIVING 59
In the short term, reductions in fuel use would come about almostexclusively as a result of reductions in discretionary driving. Discre-tionary driving does not appear to include work-related transportation,as was apparent during the oil supply disruptions in the 1970s. Otherreductions in fuel use, as through improvements in average vehicleefficiency or changes in people's decisions about where they live or howthey get to work, would not be affected by relatively small changes inthe cost of gasoline. (Greater vehicle efficiency might mean smallercars, lighter cars, changes in engine design, or some combination of allthree.)
Fuel costs are an increasingly small component of the total cost ofvehicle ownership, and hence play an increasingly small role in con-sumers' choice of new vehicles. Though the higher gasoline prices ofthe 1970s prompted consumers to pay more attention to fuel efficiencywhen purchasing motor vehicles, improvements in fuel efficiency havebeen strongly influenced by the corporate average fuel economy(CAFE) standards established by the Energy Policy and ConservationAct of 1975. These standards are generally regarded as mandatinggreater improvements in fuel efficiency than would be chosen by con-sumers on the basis of current prices, and, to the extent that the cur-rent standards affect consumer choice, a small change in fuel costs isnot likely to prompt consumers to push average efficiencies of new carsbeyond the regulated standards.
Over the longer term, however, greater reductions in fuel con-sumption would be possible if consumers opted increasingly for moreefficient gasoline-powered vehicles or if vehicles powered by other fuelsbecame economically viable.
Some commonly cited ways in which drivers impose costs on therest of society are wear and tear on highways, congestion, the emissionof air pollution, and increased dependence on imported oil. These costsare related to consumption of motor fuels, but the relationship is notdirect. As a result, changes in the consumption of motor fuels will bemore effective in reducing some external costs of driving and less effec-tive in reducing others.
60 FEDERAL EXCISE TAXES August 1990
Motor Fuel Taxes and the Efficient Use of Highways
Drivers of automobiles and light trucks probably pay more in gasolineand related highway taxes than the cost of the wear and tear theycause on highways. Heavy trucks, on the other hand, pay less in high-way taxes than the wear and tear they impose. A recent study foundthat highway wear increases disproportionately with vehicle weight.32As weight per axle increases, the costs of highway wear increase morequickly than the revenues per mile traveled (although revenues in-crease because of increased fuel consumption per mile). Consequently,collections from fuel taxes exceed the costs of highway use imposed bylighter vehicles, while collections fall short of the costs of heaviervehicles. Higher motor fuel taxes in themselves would not correct thedisproportionate burden of the tax, nor, more important, would theygive heavy truckers an incentive to take actions that reduce pavementdamage (such as reducing axle-loadings). This relationship has ledsome to suggest that a tax on trucks based on weight and distancetraveled would be more equitable.
Even for automobiles, the correlation between taxes paid and costsof highway use is weak. Older cars that get fewer miles per gallon ofgasoline pay a higher tax per mile traveled than do newer, more fuel-efficient vehicles. Other inequities stem from reduced tax rates onethanol/methanol, gasohol, and other special fuels, as well as tax ex-emptions for state and local governments, nonprofit educational insti-tutions, and local and school buses. Although these differences mayserve to promote important policies, they weaken the effectiveness ofthe gasoline tax as a charge for using the highways.
Congestion is another external cost imposed by motorists. Con-gestion is specific to particular locations and times of day. Urban road-ways are congested during rush hours. Other locations may be con-gested because of bottlenecks or, often, temporary problems. To beeffective, a fee would have to be specific to the time and place of con-gestion (as in rush-hour tolls on bridges). Increased federal motor fueltaxes are thus unlikely to have a role to play in making the use of roads
32. Department of Transportation, Federal Highway Adminiatration, The Feasibility of a NationalWeight Distance Tax, Report of the Secretary of Transportation to the U.S. Congress (December1988).
CHAPTER IV THE ECONOMIC COSTS OF SMOKING, DRINKING, AND DRIVING 61
and highways more efficient. Increasing taxes within particular statesand localities that have severe problems of overuse might reduce theuse of local roads, with beneficial effects. Nationwide, on the whole,highways are used to only 20 percent of their capacity. The uniformreductions in driving that might be caused by an increase in federaltaxes on motor fuels would lead to further underuse of a highway sys-tem that, on average, already has ample capacity.
Motor Fuel Taxes and Air Pollution
Automobiles and trucks contribute to air pollution by emitting sulfurdioxide, nitrous oxides, and carbon monoxide. Motor vehicles are alsoa major source of volatile organic compounds (VOCs) that produceozone when combined with nitrous oxides in the presence of sunlight.Ozone is a component of smog that causes serious respiratory problemssuch as breathing difficulty, asthma, and reduced resistance to infec-tion. Ozone is also associated with damage to crops and trees and or-ganic materials, such as fabrics, rubber, dyes, and paints.
Higher motor fuel taxes would lower these emissions by reducingdriving. It is difficult, however, to estimate the size of the health andother benefits that would be obtained per gallon of reduced motor fuelconsumption. One study suggests that the damages from motor vehicleemissions are on the order of 3.5 cents to 11 cents per gallon con-sumed. 33 These estimates are average values; the benefits from re-ducing emissions in highly polluted areas could be much higher. Fur-ther, the study evaluated only the traditional cost of illness—the cost ofmedical treatment plus lost earnings. Other approaches that take intoaccount benefits other than costs of illness could yield estimates ofhealth effects that are three to four times higher.34
33. Mark W. French, "Efficiency and Equity of a Gasoline Tax Increase," Finance and EconomicsDiscussion Series, #33, Federal Reserve Board, Washington, D.C. (July 1988). Estimate based onEnvironmental Protection Agency, Costs and Benefits of Reducing Lead in Gasoline, Chapter 6:"Benefits of Reducing Pollutants Other Than Lead," EPA-230-05-85-006 (February 1985); andEnvironmental Protection Agency, Compilation of Air Pollutant Emission Factors, vol. 2: MobileSources, 4th ed., AP-42 (September 1985).
34. Maureen L. Cropper and Wallace Gates, "Environmental Economics: A Survey" (Resources for theFuture, Discussion Paper QE90-12, Washington, D.C.).
62 FEDERAL EXCISE TAXES August 1990
The range of uncertainty surrounding estimates of the environ-mental benefits of less air pollution—in health and other benefits—canbe illustrated by the example of ozone levels. Estimates from a recentstudy of the benefits that would be obtained from bringing all areasnationwide up to the federal ozone standard range from $51 million to$4.7 billion—two different orders of magnitude.35 The wide range ofestimates reflect both variation in epidemiological and clinical esti-mates of the health benefits of lower ozone levels, and variation in thevalues placed on those benefits.
What Could a Motor Fuel Tax IncreaseContribute to Air Pollution Control?
Emissions of pollutants per unit of gasoline consumed are forecast todecline over the next 20 years, reflecting changes in fleet composition,in fuel efficiency, and in efficiency on the road. Further reductions infuel use from an increased tax on motor fuels would probably makesome small contribution to further emissions reductions. It is not pos-sible, however, to estimate reductions of emissions just on the basis ofchanges in motor fuel use alone.
Most pollution related to vehicles has local characteristics, al-though with national consequences. Factors relevant to local air pollu-tion problems (from sulfur dioxide, nitrous oxides, carbon monoxide,and volatile organic compounds) include the age composition of theautomobile fleet, fuel standards (including vapor pressure), and high-way congestion. Direct vehicle emissions are also affected by tempera-ture and elevation. Moreover, the degree to which a given level ofemissions contributes to pollution depends on local conditions such asdays of sunshine and the number of trees.
Taxes levied more directly on emissions might provide better in-centives for reducing emissions. Such taxes could be levied on newcars, based on their estimated emissions, and on old vehicles in con-
35. Allen J. Krupnick, "Economics and the Ambient Ozone Standard," Resources (Summer 1988),Resources for the Future, Washington, D.C., pp. 9-12.
CHAPTER IV THE ECONOMIC COSTS OF SMOKING, DRINKING, AND DRIVING 63
junction with an inspection program that measured emissions andrecorded annual mileage.36 Such an emissions tax could also varyaccording to the jurisdiction in which a vehicle was located, adjustingthe incentive to the severity of local problems.
As a practical matter, however, higher motor fuel taxes should becompared with the pollution control measures that have actually beenproposed. These include inspection and maintenance programs fornonattainment areas, stage IE vapor recovery—a type of control used toreduce emissions when filling a vehicle's gasoline tank~and methanol-powered vehicles. Given the costs and limitations of these measures,higher gasoline and diesel fuel taxes may be a reasonably cost-effectivemeans of achieving some modest improvement in air quality.
Motor Fuel Taxes. Oil Imports, and Energy Security
Any reduction in the demand for petroleum-based motor fuels as a con-sequence of higher fuel costs would translate into reduced petroleumimports. For this reason, taxes on gasoline and diesel fuel have beenmentioned as one of several policies that would provide greater protec-tion from an interruption in vital imports of oil and from the damagingeconomic effects of any consequent increase in world oil prices.37
At present, U.S. energy security policy is to build and maintain aStrategic Petroleum Reserve, to support the oil-sharing agreements ofthe International Energy Agency, to foster the development of moresecure supplies of petroleum and other strategic goods (both at homeand abroad), and to support conservation measures. This policy in-cludes assistance to the U.S. petroleum industry to help sustain cur-rent production and to retain the infrastructure that would help theindustry to rebound if oil prices were to rise sharply in the future.
36. For an analysis of this option, see Congressional Budget Office, Reducing the Deficit: Spending andRevenue Options (February 1990).
37. See, for example, Mark W. French, "Efficiency and Equity of a Gasoline Tax Increase"; Knut A.Mork, "Taxation as a Protection Against the Effects of Price Fluctuations: The Case of Oil," TheEnergy Journal, Special Tax Issue: 73-87 (1985); and Harry G. Broadman and William W. Hogan,"Oil Tariff Policy in an Uncertain Market" (John F. Kennedy School of Government DiscussionPaper, E-86-11, Harvard University, 1986).
64 FEDERAL EXCISE TAXES August 1990
Higher motor fuel taxes might add to U.S. energy security by re-ducing both the magnitude and the likelihood of potential disruptionsof oil supply. First, higher fuel excise taxes would directly reduce im-ports of foreign oil. Second, the reduced U.S. demand for foreign oilwould lower world oil prices. As long as other oil-consuming countriesdid not significantly increase their consumption as a result of the oilprice decline, oil production in insecure regions of the world might fall.
A tax increase of 12 cents per gallon would have a beneficial butfairly small effect on oil imports, and a small effect on world oil prices.CBO has estimated that increases of 12 cents per gallon in gasolineand diesel excise taxes effective in 1986 would have reduced oil importdependence by about 100,000 barrels per day in 1987--1 percent to 2percent of projected imports in that year. The Department of Energyconcluded that increasing fuel excise taxes would have a very smallmoderating effect on world oil prices and oil price volatility. A 10-cent-per-gallon increase in motor fuel taxes effective January 1, 1988, wasestimated to reduce oil imports by 100,000 to 180,000 barrels per dayand to lower the world oil price by $0.21 to $0.37 per barrel in 1990.38
These energy security benefits, however, are uncertain and may besmall. In today's global oil market, the United States will be more se-cure only if its major trading partners are more secure as well.Whether the United States would ultimately benefit from a motor fueltax increase would also depend on which oil-exporting countries pro-duced less as result of lower U.S. demand. So long as the OPEC oil-producing countries act to restrict oil production and support oil prices,the large Persian Gulf producers will continue to be the marginalsource of the world's oil supply.
38. Congressional Budget Office, Budgetary and Economic Effects of Oil Taxes (September 1987);Department of Energy, Energy Security (March 1987).
CHAPTER V
THE DISTRIBUTIONAL EFFECTS OF
INCREASES IN FEDERAL TAXES ON
TOBACCO, ALCOHOLIC BEVERAGES,
AND MOTOR FUELS
The Congressional Budget Office has simulated the distribution of fed-eral excise tax increases among families for the following three op-tions:
o Doubling the cigarette tax from 16 cents to 32 cents per pack;
o Equalizing the tax on all alcoholic beverages at $16.00 perproof-gallon ($0.25 per ounce of pure alcohol) by increasingthe tax on a 750-milliliter bottle of 80-proof liquor from $1.98to $2.54, increasing the tax on a 750-milliliter bottle of winefrom 3 cents to about 76 cents, and increasing the tax on asix-pack of beer from 16 cents to about 81 cents; and
o Raising the gasoline tax from 9 cents to 21 cents per gallonand the diesel fuel tax from 15 cents to 27 cents per gallon.
If effective on October 1, 1990, the cigarette tax increase would raisean additional $2.8 billion, the combined alcoholic beverage tax in-creases would raise an additional $7.2 billion, and the motor fuels taxincrease would raise an additional $12.1 billion in fiscal year 1991.1
These options were examined because they typify those that havebeen suggested in recent debate. They are not necessarily the specificexcise tax increases appropriate to correct the external costs of tobacco,alcoholic beverage, and motor fuel consumption.
If prices rose by the full amount of the tax increases without addi-tional markups, doubling the current federal excise tax on cigaretteswould increase the price of cigarettes by about 11 percent. Equalizingthe tax on all alcoholic beverages at $16.00 per proof-gallon ($0.25 per
1. Congressional Budget Office, Reducing the Deficit: Spending and Revenue Options (February 1990).
66 FEDERAL EXCISE TAXES August 1990
ounce of alcohol) would increase the price of beer by about 18 percent,the price of table wine by about 25 percent, and the price of distilledspirits by about 7 percent. Raising the tax on gasoline by $0.12 pergallon would raise the price of gasoline by about 11 percent.
Estimates vary as to how sensitive consumption is to changes inprice, but price changes of these magnitudes could be expected to re-duce consumption of cigarettes by 4 percent to 8 percent, and to reduceconsumption of beer by 5 percent to 13 percent, of wine by 17 percent to25 percent, and of distilled spirits by 4 percent to 7 percent. The num-ber of gallons of gasoline consumed could be expected to fall by about 2percent in the short term.
All three tax increases would be regressive with respect to post-taxfamily income-that is, they would be larger relative to the incomes oflower-income families than of higher-income families. Elderly fami-lies would pay less additional tax under all three options than otherfamilies.
Some of the tax increase would be offset by changes in other taxesand changes in income. Higher excise taxes would initially raise therelative price of tobacco, alcoholic beverages, and motor fuels. Thisincrease in relative prices would be reflected in higher overallconsumer prices and lower real incomes of families, or in an unchangedoverall price level and lower nominal returns to labor and capital,depending upon whether or not the nominal money supply was in-creased enough to accommodate the change in prices. If prices rose, asassumed here, individual income taxes would fall and transfer pay-ments such as Social Security benefits would increase because of in-dexing. The net tax increases after the effects of indexing would be lessregressive for all three taxes.
Measured against total family expenditures, which may be a bet-ter indicator of a family's expected economic circumstances over alonger period of time, the tax increases would be less regressive. Thecigarette and motor fuel tax increases would be about proportional tototal expenditures, although the motor fuel increase would be a slight-ly lower percentage of total expenditures for upper-income families,while the alcoholic beverage tax increase would be slightly progres-
CHAPTER V DISTRIBUTIONAL EFFECTS 67
sive--that is, an increasing percentage of total expenditures as familyincome increases.
Concerns about the regressivity of an excise tax increase mightlead policymakers to consider options that would compensate low-income families for the tax increase. CBO has examined three suchchanges: an increase in food stamp payments, an increase in theearned income tax credit (EITC), and a combination of increases in foodstamps and the EITC. Each option would spend 15 percent of the netrevenues from an increase in cigarette, alcoholic beverage, or motorfuel taxes. The increase in food stamps would provide the highestaverage benefit to families in the lowest income quintile of the threeoptions. The combined increase in food stamps and the EITC wouldreach the greatest number of families in the lowest income quintileand would provide average benefit increases that would more than off-set the average alcoholic beverage tax increase for low-income fami-lies, and that would offset about 90 percent of the average motor fueltax increase and about 60 percent of the average cigarette tax increasefor those families.
EXCISE TAXES, PRICES, AND CONSUMPTION
The effect of federal excise tax increases on the consumption of tobacco,alcoholic beverages, and motor fuels depends on the extent to whichthe increased taxes are reflected in the prices of those items relative tothe prices of other goods, and on how consumers respond to changes inprice.
Although excise tax revenues are collected from producers, manu-facturers, or importers, the economic burden of an excise tax ulti-mately passes on to families. The distribution of the burden dependson how consumers adjust their purchases to changes in prices. Moststudies of excise taxes commonly assume that these burdens are dis-tributed among families in proportion to their purchases of the taxedgoods.
How consumer demand responds to price changes is measured bythe price elasticity of demand, which is the ratio of the percentage
68 FEDERAL EXCISE TAXES August 1990
change in the quantity demanded to the percentage change in theprice. Thus, a price elasticity of demand of-0.5 implies that a 10 per-cent increase in price will result in a 5 percent decrease in the quantitydemanded.
Taxes and Prices
Higher excise taxes on tobacco, alcoholic beverages, and motor fuelswill initially prompt producers of those goods to raise the prices theycharge consumers. If consumers do not respond to the price changes,there will be little or no change in the consumption of cigarettes, alco-holic beverages, and motor fuels, and the relative prices of these goodswill rise by the full amount of the higher excise taxes.
If consumers of these goods are responsive to price changes, how-ever, higher prices will reduce demand for the taxed goods and increasedemands for other goods. The shift in demand will also lower the de-mand for labor and capital employed in the production of cigarettes,alcoholic beverages, and motor fuels while increasing the demand forthese factors elsewhere in the economy. How the longer-run adjust-ments affect the relative prices of tobacco, alcohol, and motor fuels de-pends on the ease with which resources employed in the production ofthe taxed goods can be shifted to other uses.
If resources released from the production of the taxed goods cannotbe easily shifted to other uses, the relative prices of taxed and untaxedgoods will not rise by the full amount of the tax, and part of theadjustment to the tax will be reflected in lower relative prices of laborand capital. In that case, the burden of the tax will be distributed notonly in proportion to purchases of taxed and untaxed goods but also inproportion to the income received from various sources. Most econo-mists generally assume that, at least over time, the resources releasedfrom the production of the taxed goods would be readily employableelsewhere in the economy. If this is the case, an excise tax would raisethe relative prices of the taxed goods by the full amount of the tax,while also reducing the amount of such goods consumed and produced.
CHAPTER V DISTRIBUTIONAL EFFECTS 69
In the short run, a tax increase could cause retail prices to rise bymore than the amount of the increase if producers, wholesalers, or re-tailers added additional markups to the tax. In the long run, however,competitive pressures Should prevent such markups from continuing.
A number of studies have looked at the effect of excise tax in-creases on retail cigarette prices. Because there has been only onechange in the federal tax on cigarettes in the past 40 years, much ofthis research concerns the effects of changes in state excise tax rates oncigarette prices over time. Most studies found that when state excisetax rates were raised, cigarette prices increased by slightly more thanthe amount of the tax increase. This result was attributed variously toa possible change in cigarette quality, to sellers using the occasion of atax increase to adjust their prices for past inflation, or to price mark-ups.2
The possibility that cigarette producers use the opportunity of atax increase to raise prices by more than the amount of the tax increaseis consistent with the experience just before and after the 1983 in-crease in the federal excise tax on cigarettes, when cigarette prices roseby 37 percent in excess of a dollar-for-dollar passthrough of the tax in-crease.3 Between 1981 and 1985, retail cigarette prices rose by 54 per-cent (30 percent in real terms), although the federal excise tax in-crease, combined with small increases in state taxes that occurred overthe period, was only 16 percent of the 1981 average retail price.
Prices of alcoholic beverages are likely to rise by at least the fullamount of a tax increase. Prices could rise by more than the amount ofa tax if producers, wholesalers, or retailers added additional markups
2. See Yoram Barzel, "An Alternative Approach to the Analysis of Taxation," Journal of PoliticalEconomy, 84(6):1177-1197 (December 1976); Terry R. Johnson, "Additional Evidence on the Effectof Alternative Taxes on Cigarette Prices," Journal of Political Economy, 86{2):325-328 (April 1978);Daniel A. Sumner, "Measurement of Monopoly Behavior: An Application to the CigaretteIndustry," Journal of Political Economy, 89(5):1010-1019 (October 1981); and Daniel Sullivan,'Testing Hypotheses About Firm Behavior in the Cigarette Industry," Journal of PoliticalEconomy, 93(3):586-598 (1985). Some research has found that cigarette prices rise by less thandollar-for-dollar with increases in state excise taxes. This could be the result of interstate com-petition. See Michael T. Sumner and Robert Ward, "Tax Changes and Cigarette Prices," Journal ofPolitical Economy, 89(6): 1261-1265 (1981).
3. For a detailed and perceptive analysis of the 1983 tax increase, see Jeffrey E. Harris, "The 1983Increase in the Federal Cigarette Excise Tax," in Lawrence H. Summers, ed., Tax Policy and theEconomy, vol. 1 (Cambridge, Mass.: National Bureau of Economic Research, 1987).
70 FEDERAL EXCISE TAXES August 1990
to the tax increase. While some estimates of markups on alcoholicbeverages are as high as 100 percent, significant price markups areunlikely to be maintained over a long period because of competitivepressures within the industry. Estimates of the effects of tax increaseson alcoholic beverage prices are few.4
Motor fuel prices would be likely to rise by the full amount of a taxincrease, at least in the short run. As consumers responded to the priceincrease by reducing their demand for gasoline and diesel fuel, produc-ers might be forced to reduce their prices, and thus absorb some of thetax, if they wished to maintain production at pretax levels. Producerscould maintain prices by accepting a slight decline in productionlevels. Whichever happened would depend largely on the response ofthe OPEC oil-producing countries. Most studies of the effect of anincrease in motor fuel taxes assume that world oil prices would fall byless than $0.01 per gallon in response to a $0.10 per gallon increase inU.S. taxes on gasoline, and that most of the tax increase would be re-flected in higher gasoline prices. 5
Prices and Consumption
Although people generally assume that consumer demand for tobacco,alcoholic beverages, and motor fuels (at least in the short term) doesnot change a great deal in response to changes in prices, substantialevidence indicates that price increases cause some reduction in con-sumer demand for all three products.
4. Philip Cook used an estimated markup of 20 percent in his study of the effects of liquor taxes. SeePhilip J. Cook, "The Effect of Liquor Taxes on Drinking, Cirrhosis, and Auto Accidents," in Mark H.Moore and Dean R. Gerstein, eds., Alcohol and Public Policy: Beyond the Shadow of Prohibition(Washington, D.C.: National Academy Press, 1981).
5. See Mark W. French, "Economic Analysis of Gasoline Tax Increases," in House Committee onPublic Works and Transportation, Proposals to Increase the Federal Gasoline and Diesel Taxes forDeficit Reduction Purposes, 100:1 (July 1, 1987); Department of Energy, Energy InformationAgency, Cost and Benefit Analysis of a Motor Fuels Tax, SR/EAFD/87-02 (March 1987); Departmentof Energy, Energy Security (March 1987); Bernard A. Gelb and Salvatore Lazzari, "Gasoline ExciseTax: Economic Impacts of an Increase" (Congressional Research Service Issue Brief 87078, March13, 1989); and Congressional Budget Office, Budgetary and Economic Effects of Oil Taxes (April1986).
CHAPTER V DISTRIBUTIONAL EFFECTS 71
Tobacco. Most estimates of the demand for tobacco are based onaggregate data that measure changes in total cigarette consumptionover time, or differences in consumption among states at a particularpoint in time, in relation to cigarette prices, incomes, demographiccharacteristics of the population, and other factors such as cigaretteadvertising or public knowledge concerning t)ie health consequences ofsmoking. These studies have found that the demand for cigarettes isgenerally inelastic, but the range of estimated elasticities is large.6Estimates from most studies suggest a price elasticity of between -0.4and -0.7, or a decline of between 4 percent and 7 percent in cigaretteconsumption in response to a 10 percent increase in price.
Other studies using data from surveys of consumers have foundthat young smokers respond far more to changes in price than oldersmokers. Among those age 12 to 17, a 10 percent increase in price wasestimated to result in a 14 percent reduction in cigarette purchases.Among smokers age 20 to 74, a 10 percent increase in price was esti-mated to produce only a 4.2 percent decrease in purchases.7
Most of the estimated response to higher prices among youngsmokers was the result of a decline in smoking participation ratherthan a reduction in the average number of cigarettes smoked. Amongteenagers, participation elasticities are almost five times as large asquantity elasticities. The elasticity of smoking participation was -1.20for those 12 to 17, compared with an elasticity of -0.25 with respect tothe quantity of cigarettes consumed by the average smoker. Thus,among smokers age 12 to 17, a 10 percent increase in the price ofcigarettes would be estimated to reduce the number of smokers by 12
6. See Eric J. Toder, "Issues in the Taxation of Cigarettes," in The Cigarette Excise Tax, SmokingBehavior and Policy Conference Series, Harvard University Institute for the Study of SmokingBehavior and Policy (April 17,1985); Jeffrey E. Harris, "The 1983 Increase in the Federal CigaretteExcise Tax," in Lawrence H. Summers, ed.. Tax Policy and the Economy, vol. 1 (Cambridge, Mass.:National Bureau of Economic Research, 1987); and Department of Health and Human Services,Reducing the Health Consequences of Smoking: 25 Years of Progress, A Report of the SurgeonGeneral, DHHS Publication No. (CDC) 89-8411 (prepublication version, January 11,1989), pp. 98-99.
7. See Eugene M. Lewit, Douglas Coate, and Michael Grosaman, 'The Effects of Government Regula-tion on Teenage Smoking," Journal of Law and Economics, 24(3) (December 1981); Eugene M.Lewit and Douglas Coate, "The Potential for Using Excise Taxes to Reduce Smoking," Journal ofHealth Economics, 1(2) (August 1982); and Michael Grossman, "Health Benefits of Increases inAlcohol and Cigarette Taxes" (Working Paper No. 3082, National Bureau of Economic Research,Cambridge, Mass., August 1989).
33-148 0 - 90 - 4 QL 3
72 FEDERAL EXCISE TAXES August 1990
percent, and the average number of cigarettes smoked by teenagerswho continue to smoke by 2.5 percent. Effects on teenage smokingparticipation are an important factor in determining total smoking,since about 85 percent of smokers begin before the age of 20.
Even among adults, more of the response to an increase in ciga-rette prices is a reduction in the number of smokers rather than in theaverage number of cigarettes smoked. For smokers 20 to 74 years old,the estimated participation elasticity was -0.26, compared with aquantity elasticity of-0.10. This result is consistent with models of ad-dictive behavior that predict an all-or-nothing response by smokers tochanges in the price of cigarettes.
If prices were to rise by the full amount of a $0.16 per pack taxincrease, the average price of a pack of cigarettes in 1990 would rise byabout 11 percent, assuming full passthrough of the tax increase withno additional markup, and an average price of $1.50 per pack. Thisrise could be expected to reduce overall smoking by 4 percent to 8 per-cent, with much larger changes among teenagers.
Alcoholic Beverages. Existing studies suggest that among alcoholicbeverages, beer consumption responds less to price changes than con-sumption of distilled spirits and possibly of wine. Estimates of theprice elasticity of demand for beer range between -0.3 and -0.7, whileestimates for distilled spirits are generally between -0.6 and -1.0. Onlya few studies have estimated price elasticities for wine, and these sug-gest that the elasticity for wine could be larger (in absolute value) thanfor either beer or distilled spirits, possibly -1.0 or more.8
An important question is whether abusive consumption of alco-holic beverages responds to price changes even if average alcoholicbeverage consumption falls when prices rise. One hypothesis is thatabusive consumption moves in tandem with average consumption, and
8. Stanley I. Ornstein and David Levy, "Price and Income Elasticities of Demand for AlcoholicBeverages," in Marc Galanter, ed., Recent Developments in Alcoholism, vol. 1 (New York: PlenumPublishing, 1983); Stanley I. Ornstein and Dominique M. Hanssens, "Alcohol Control Laws and theConsumption of Distilled Spirits and Beer," Journal of Consumer Research, 12 (September 1985);Jon P. Nelson, "Effects of Regulation on Alcoholic Beverage Consumption: Regression Diagnosticsand Influential Data" (unpublished paper, Pennsylvania State University, Institute for PolicyResearch and Evaluation, January 1988).
CHAPTER V DISTRIBUTIONAL EFFECTS 73
that all consumption is reduced when prices increase. An alternativetheory is that abusive consumption is attributable to those who areunable to control the amount they drink no matter what the price ofbeverages. Any reduction in alcoholic beverage consumption in re-sponse to a price increase would then be attributable only to nonabu-sive drinkers.
Research indicates that abusive consumption is sensitive to price.Cirrhosis of the liver, which is positively related to abusive alcoholconsumption, was found to be negatively related to state alcohol taxrates. In a study of 30 states, those that raised liquor taxes had eithersmaller increases or greater reductions in cirrhosis mortality ratesthan states in which the tax remained unchanged. A $1.00 per proof-gallon increase in a state liquor tax was estimated to reduce the state'scirrhosis mortality rate by 1.9 percent in the short run.9
Research also shows that alcohol-related motor vehicle fatalities,another aspect of abusive consumption, are sensitive to higher taxes onalcoholic beverages.10 Finally, there is some evidence that heavydrinking among teenagers is more responsive to the price of beer thanmore moderate drinking. An increase in the tax on beer was found toreduce the percentages of teenagers who drank beer frequently (four toseven times per week) and fairly frequently (one to three times perweek) by proportionately more than the percentage of those who drankinfrequently.11
An equalized tax of $16.00 per proof-gallon ($0.25 per ounce ofalcohol) would raise the price of beer by 18 percent, the price of tablewine by 25 percent, and the price of distilled spirits by 7 percent, as-suming full passthrough of the tax with no additional markup, basedon estimated 1990 prices of $3.64 per a typical six-pack of beer, $2.89
9. Cook, "The Effect of Liquor Taxes on Drinking, Cirrhosis, and Auto Fatalities;" and Philip J. Cookand George Tauchen, "The Effect of Liquor Taxes on Heavy Drinking," Bell Journal of Economics,13(2) (Autumn 1982).
10. See Cook, "The Effect of Liquor Taxes on Drinking, Cirrhosis, and Auto Fatalities;" and HenrySaffer and Michael Grossman, "Beer Taxes, the Legal Drinking Age, and Youth Motor VehicleFatalities," Journal of Legal Studies, 16(2): 351-374 (June 1987).
11. Douglas Coate and Michael Grossman, "Effects of Alcohol Beverage Prices and Legal DrinkingAges on Youth Alcohol Use," Journal of Law and Economics, 31(1) (April 1988).
74 FEDERAL EXCISE TAXES August 1990
per 750-ml bottle of table wine, and $8.05 per 750-ml bottle of 80-proofdistilled spirits. 12
These increases could be expected to reduce beer consumption by 5percent to 13 percent and distilled spirits consumption by 4 percent to 7percent. The effect on wine consumption is uncertain, but the reduc-tion could be 17 percent to 25 percent.
One issue is whether a disproportionate tax increase on one type ofbeverage will lead to substituting consumption of beer, wine, or dis-tilled spirits rather than reducing overall alcohol consumption. Mostresearch has found little evidence that the consumption of one type ofbeverage is responsive to changes in the prices of other beverages. Arecent study found that increases in taxes on beer and distilled spiritsare likely to reduce total consumption of alcohol, but that wine taxeswould not have a significant effect on total alcohol consumption. Thatis, although a tax increase on beer could increase consumption of wineand distilled spirits, the increase would not be large enough to offsetthe reduction in beer consumption. Likewise, a tax increase on dis-tilled spirits could increase consumption of beer and wine, but notenough to offset the reduction in spirits consumption. This result isconsistent with limited substitution between beer and distilled spiritsconsumption. 13
Motor Fuels. There is more unanimity regarding estimates of the priceelasticity of demand for motor fuels than in the case of either cigarettesor alcoholic beverages. Generally, most studies have estimated ashort-term elasticity of about -0.2 and a long-term elasticity of between-0.7 and -1.0.14 In the short term, the entire response to higher prices
12. Prices reflect estimates by the Distilled Spirits Council of the United States (DISCUS) of the 1989price of a six-pack of Budweiaer, a 750-ml bottle of Gallo Chablis Blanc, and a 750-ml bottle ofSmirnoff 80-proof vodka. Prices were inflated to 1990 using CBO's projected change in overall con-sumer prices.
13. See Henry Saffer, "Alcohol Consumption and Tax Differentials Between Beer, Wine and Spirits"(Working Paper No. 3200, National Bureau of Economic Research, Cambridge, Mass., December1989).
14. See Douglas R. Bohi, Analyzing Demand Behavior (Baltimore, Md.: The Johns Hopkins UniversityPress, 1981); Douglas R. Bohi and Mary Beth Zimmerman, "An Update on Econometric Studies ofEnergy Demand Behavior," Annual Review of Energy, vol. 9 (Palo Alto: Annual Reviews, Inc.,1984); and Carol A. Dahl, "Gasoline Demand Survey," The Energy Journal, 7(1): 67-82 (January1986).
CHAPTER V DISTRIBUTIONAL EFFECTS 75
is by reducing miles driven. In the long term, the response is split be-tween a reduction in average miles driven and an increase in the aver-age fuel economy of automobiles.
A tax increase of $0.12 per gallon would raise 1990 gasoline pricesby about 11 percent, assuming full passthrough of the tax increase andan average price of $1.10 per gallon. This rise could be expected toreduce gasoline consumption by a little over 2 percent in the short run.
In the current environment, a tax increase is unlikely to lead tomajor changes in the fuel efficiency of vehicles. About half of thevehicle stock on the road today was built between 1980 and 1985, whennominal gasoline prices were higher than in 1989. Even with a taxincrease of $0.12 per gallon, gasoline prices in 1990 would still be lowerin nominal terms than in 1981 and 1982. Moreover, improvements infuel efficiency have been strongly influenced by the corporate averagefuel economy (CAFE) standards established by the Energy Policy Con-servation Act of 1975. These standards are generally regarded as man-dating greater improvements in fuel efficiency than would be chosenby consumers on the basis of current prices. Thus, the tax would notcreate additional incentives for producing vehicles with greater fuelefficiency.
THE DISTRIBUTION OF EXCISE TAXINCREASES AMONG FAMILIES
In simulating the distribution of federal excise tax increases amongfamilies for 1990, CBO used data from the Consumer ExpenditureSurvey (CES), the Current Population Survey (GPS), and the Statisticsof Income (SOD. (The data and simulation methods are described inAppendix B.) The CES reports family expenditures on cigarettes andother tobacco products, alcoholic beverages, and gasoline and highwaydiesel fuel rather than the quantities consumed. For purposes of thesimulations, the distribution of quantities consumed was assumed tobe proportional to the distribution of expenditures. This method im-plies that prices of the taxed commodities are constant among incomeclasses, which is probably reasonable for motor fuels, cigarettes, andbeer, but suspect for distilled spirits and especially for wine. Forsimulations in which excise taxes are allocated according to taxableexpenditures, this method will be likely to overstate the tax on alco-
76 FEDERAL EXCISE TAXES August 1990
holic beverages paid by upper-income families, making the tax appearless regressive than it actually may be.
The distribution of taxable expenditures does not give a completepicture of the distribution of excise tax increases. First, not all taxableexpenditures are made by consumers. A certain amount of taxableexpenditures are used as intermediate goods or are purchased for useby business. The purchase of other final goods reflects the tax on thatportion of taxable expenditures. For the simulations, CBO assumedthat business made 20 percent of alcoholic beverage purchases and 40percent of motor fuel purchases, and allocated that portion of the taxincrease in proportion to expenditures on all items. 15
Second, some of the tax increase is offset by changes in income andchanges in other taxes. Excise tax increases will lead either to higherprices or to lower returns to capital and labor (lower factor incomes),depending on whether or not the nominal money supply increases inresponse to an increase in relative prices. Most revenue estimates forCongressional legislation make the standard assumption that nominalgross national product is fixed, and the tax increase leads to a reduc-tion in factor incomes. The reduction in nominal factor incomes leads,in turn, to a decline in both income and payroll taxes. The revenueyield is usually assumed to be only 75 percent of the gross tax increase.
This study assumes that prices rise but that real GNP and nominalfactor incomes remain fixed. With an increase in the price level and nochange in nominal incomes, individual income taxes fall under anindexed tax system. Further, as indexed transfer payments, such asSocial Security benefits and Supplemental Security Income (SSI)payments, rise, only factor incomes are affected. These changes willoffset some of the increase in excise taxes. The net increases in excisetaxes are measured before and after the offsetting effects of indexing.
15. The business share of alcoholic beverage expenditures is based on a 1985 estimate by the DistilledSpirits Council of the United States, Inc. The business share of motor fuel expenditures is aweighted average of an estimated 25 percent business share for gasoline and a 90 percent businessshare for diesel fuel (estimates based on Federal Highway Administration projections of fuelconsumption by sector).
CHAPTER V DISTRIBUTIONAL EFFECTS 77
The distributional effects of the tax increases were simulated byallocating the estimated total revenues among families, thus assumingthat the price elasticities of demand are constant among income andage categories. (A price elasticity of-0.40 was used for cigarettes, -0.30for beer, -0.70 for wine, -0.70 for distilled spirits, and -0.20 for motorfuels.) The simulations assume that the increase in each tax is fullypassed through to consumers without additional markups, and allowfor changes in taxes and incomes, primarily Social Security benefitsand SSI payments, that result from the higher price level. The tax in-crease was assumed to be in effect for the entire year.
Tax Increases in Relation to Family Income
The average tax increases, and the tax increases as percentages ofafter-tax income for the three separate excise tax options before andafter offsetting changes in taxes and transfer payments, are shown inTable 9. All three tax increases are regressive with respect to post-taxfamily income. The regressivity of all three tax increases is reducedwhen the effects of indexing are taken into account, with the net al-coholic beverage tax increase becoming mostly proportional to incomeexcept for families in the lowest income quintile. The tax increases areall fairly small relative to family incomes. With the effects of indexingincluded, the three tax increases are all 0.4 percent or less of post-taxfamily income on average. For families in the lowest income quintile,the cigarette and the alcoholic beverage net tax increases are between$30 and $40, or 0.4 percent to 0.5 percent of post-tax income. The taxincrease on motor fuels for families in the lowest quintile is about $80,or 1.0 percent of income. Elderly families are hurt less than otherfamilies, especially after their benefit levels are adjusted for the effectsof higher prices. The effect of the tax increases among regions varieslittle, except that rural families pay slightly more than other families--relative to their incomes-with a motor fuel tax increase.
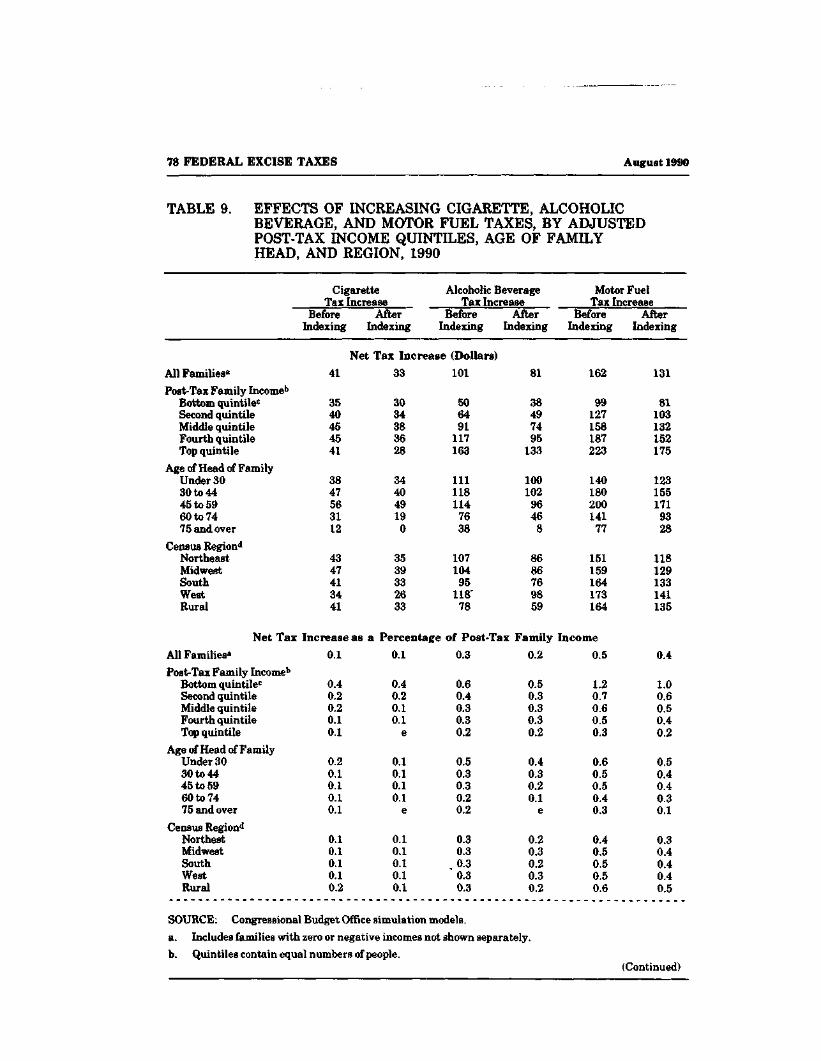
78 FEDERAL EXCISE TAXES August 1990
TABLE 9. EFFECTS OF INCREASING CIGARETTE, ALCOHOLICBEVERAGE, AND MOTOR FUEL TAXES, BY ADJUSTEDPOST-TAX INCOME QUINTILES, AGE OF FAMILYHEAD, AND REGION, 1990
CigaretteTax Increase
Alcoholic BeverageTax Increase
Motor FuelTax Increase
Before After Before AfterIndexing Indexing Indexing Indexing
BeforeIndexing
AfterIndexing
Net Tax Increase (Dollars)All Families*Post-Tax Family Income1"
Bottom quintile'Second quintileMiddle quintileFourth quintileTop quintile
Age of Head of FamilyUnder 3030 to 4445 to 5960 to 7475 and over
Census Regiond
NortheastMidwestSouthWestRural
Net TaxAll Families"Post-Tax Family Incomeb
Bottom quintile0
Second quintileMiddle quintileFourth quintileTop quintile
Age of Head of FamilyUnder 3030 to 4445 to 5960 to 7475 and over
Census Region*1
NorthestMidwestSouthWestRural
41
3540454541
3847563112
4347413441
Increase as a0.1
0.40.20.20.10.1
0.20.10.10.10.1
0.10.10.10.10.2
33
3034383628
344049190
3539332633
Percentage0.1
0.40.20.10.1
e
0.10.10.10.1
e
0.10.10.10.10.1
101
506491
117163
111118114
7638
10710495
118'78
of Post-Tax0.3
0.60.40.30.30.2
0.50.30.30.20.2
0.30.30.30.30.3
81
38497495
133
10010296468
8686769859
Family0.2
0.50.30.30.30.2
0.40.30.20.1
e
0.20.30.20.30.2
162
99127158187223
14018020014177
151159164173164
Income0.5
1.20.70.60.50.3
0.60.50.50.40.3
0.40.50.50.50.6
131
81103132152175
1231551719328
118129133141135
0.4
1.00.60.50.40.2
0.50.40.40.30.1
0.30.40.40.40.5
SOURCE: Congressional Budget Office simulation models.a. Includes families with zero or negative incomes not shown separately.b. Quintiles contain equal numbers of people.
(Continued)
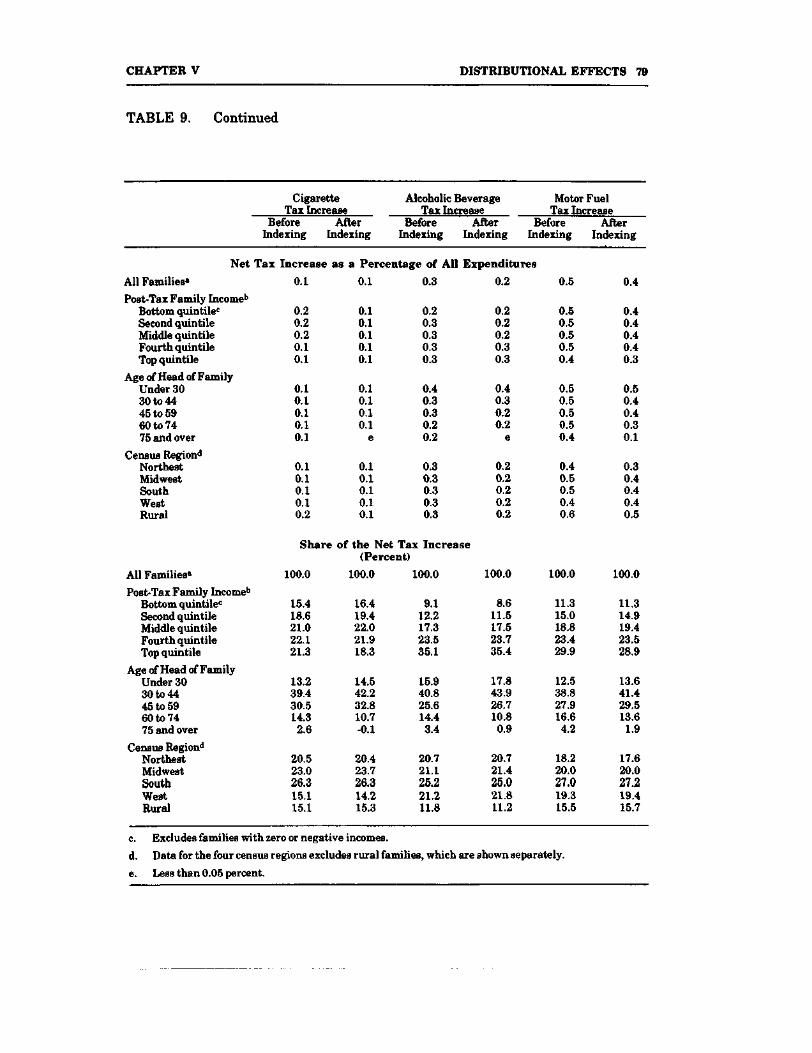
CHAPTER V DISTRIBUTIONAL EFFECTS 79
TABLE 9. Continued
CigaretteTax Increase
Before AfterIndexing Indexing
Alcoholic BeverageTax Increase
Motor FuelTax Increase
Before After Before AfterIndexing Indexing Indexing Indexing
Net Tax Increase as a Percentage of All Expenditures
All Families8
Post-Tax Family Income1"Bottom quintile0
Second quintileMiddle quintileFourth quintileTop quintile
Age of Head of FamilyUnder 3030 to 4445 to 5960 to 7475 and over
Census Region"1
NorthestMidwestSouthWestRural
All Families8
Post-Tax Family Income1"Bottom quintile0
Second quintileMiddle quintileFourth quintileTop quintile
Age of Head of FamilyUnder 3030 to 4445 to 5960 to 7475 and over
Census Region"1
NorthestMidwestSouthWestRural
0.1
0.20.20.20.10.1
0.10.10.10.10.1
0.10.10.10.10.2
Share
100.0
15.418.621.022.121.3
13.239.430.514.32.6
20.523.026.315.115.1
0.1
0.10.10.10.10.1
0.10.10.10.1
e
0.10.10.10.10.1
0.3
0.20.30.30.30.3
0.40.30.30.20.2
0.30.30.30.30.3
0.2
0.20.20.20.30.3
0.40.30.20.2
e
0.20.20.20.20.2
0.5
0.50.50.50.50.4
0.50.50.50.50.4
0.40.50.50.40.6
0.4
0.40.40.40.40.3
0.50.40.40.30.1
0.30.40.40.40.5
of the Net Tax Increase(Percent)
100.0
16.419.422.021.918.3
14.542.232.810.7-0.1
20.423.726.314.215.3
100.0
9.112.217.323.535.1
15.940.825.614.43.4
20.721.125.221.211.8
100.0
8.611.517.523.735.4
17.843.926.710.80.9
20.721.425.021.811.2
100.0
11.315.018.823.429.9
12.538.827.916.64.2
18.220.027.019.315.5
100.0
11.314.919.423.528.9
13.641.429.513.61.9
17.620.027.219.415.7
c. Excludes families with zero or negative incomes.
d. Data for the four census regions excludes rural families, which are shown separately.
e. Less than 0.05 percent.
80 FEDERAL EXCISE TAXES August 1990
Tax Increases in Relation to Total Family Expenditures
The tax increases are much less regressive relative to expendituresthan they are to annual income (see Table 9). Indeed, after takingaccount of offsetting changes in taxes and transfers, measured againstexpenditures, the net tax increases for cigarettes and motor fuels aremostly proportional to total expenditures, while the tax increase foralcoholic beverages is slightly progressive. The progressivity of the al-coholic beverage tax increases may be overstated if expenditures on al-coholic beverages rise much faster with increasing income than doactual quantities consumed.
Shares of the Tax Increases
Reflecting the general pattern of expenditures on tobacco, alcoholicbeverages, and motor fuels, families in the highest quintile pay thelargest share of the increase in alcoholic beverage and motor fuel taxes(see Table 9). Families in the middle and fourth quintile pay the high-est share of the cigarette tax increase. Families headed by persons age60 to 74 pay about 11 percent of the net cigarette or alcoholic beveragetax increases, and about 14 percent of the net motor fuel tax increase.
OPTIONS THAT WOULD OFFSET THE REGRESSIVITYOF AN EXCISE TAX INCREASE
The potential regressivity of an increase in federal excise taxes shouldbe considered in the context of the entire federal tax system. An in-crease in a regressive tax may have little effect if that tax is small rela-tive to total tax payments. Federal excise taxes on tobacco, alcoholicbeverages, and motor fuels are a small portion of total federal taxes--less than 3.5 percent in 1989. For lower-income families, however,excise taxes can be a relatively large share of their total federal taxpayments. Many of these families have income that is below the taxthreshold for income taxes, while some, particularly elderly families,receive no income from earnings and hence do not pay payroll taxes.CBO has estimated that for families in the lowest income quintile,
CHAPTER V DISTRIBUTIONAL EFFECTS 81
federal excise taxes will be about 25 percent of their total federal taxliabilities in 1990.
Concerns about the regressivity of an excise tax increase maycause policymakers to consider tax and transfer options that wouldcompensate low-income families for the tax increase. CBO has ex-amined three such changes: an increase in food stamp payments, anincrease in the earned income tax credit (EITC), and a combination ofincreases in both food stamps and the EITC. Each option would spend15 percent of the net revenues from the excise tax increases. Any of theoptions could be redesigned to provide either more or less assistance tolow-income families. Only simple changes in existing programs wereconsidered, to avoid any new administrative costs. Options not con-sidered here, such as new tax credits or gasoline stamps, could be moreeffective in reaching those low-income families that would be payingthe increased excise taxes, but might be costly to administer.
An Increase in the Earned Income Tax Credit (EITC)
The EITC is available to working families with children. Under cur-rent law, the credit is calculated as 14 percent of earnings up to a maxi-mum amount. The credit is reduced by 10 percent of adjusted grossincome (AGI) in excess of a minimum amount. For 1990, the earningsmaximum for the credit is $6,810, yielding a maximum EITC of $953.The minimum AGI above which the credit is reduced is $10,730 so thecredit is completely phased out when AGI reaches $20,264. Becausethe EITC is refundable, it can be used to provide assistance to familieswhose incomes are too low to owe federal individual income taxes. Adisadvantage of the credit as an offset to an excise tax increase is thatchildless couples and single individuals are not eligible, and that fami-lies have to file income tax returns to get the EITC.
Separate increases in the EITC were simulated to offset 15 percentof the net tax increase from raising cigarette, alcoholic beverage, ormotor fuel taxes. An approximate 10 percent increase in the EITC wassimulated to offset the added net cigarette tax, about a 20 percent in-crease was simulated to offset the combined alcoholic beverage net tax
82 FEDERAL EXCISE TAXES August 1990
increases, and about a 30 percent increase was simulated to offset thenet increase in the motor fuel tax.
An Increase in Food Stamp Benefits
Food stamps are federal benefits available to households that meeteligibility limits for monthly income and assets, as long as certainhousehold members fulfill requirements to register for work and foremployment and training programs. Recipients of cash benefits fromthe Aid to Families With Dependent Children (AFDC) program or theSupplement Security Income (SSI) program are generally eligible forfood stamps.
Food stamp benefits are a function of household size, monthly in-come after deductions, and the maximum monthly benefit. The maxi-mum monthly benefit is tied to the Department of Agriculture'sThrifty Food Plan, which measures the cost of purchasing a nutrition-ally adequate low-cost diet. Food stamp benefits are reduced by 30cents for every dollar of monthly income after deductions. For fiscalyear 1990, average monthly benefits are projected to be about $59 perperson.
With some exceptions, food stamps can be used only to purchasefood items for home preparation and consumption. They cannot beused to purchase tobacco and alcohol. Food stamps generally are re-ceived by families whose income is low enough to place them outsidethe federal tax system. However, because food stamp eligibility isdetermined on a monthly basis, some families with relatively highannual income can receive food stamps if their income is low in one ormore months and if they do not have many countable assets in thosemonths. A disadvantage of food stamps as an offset to an excise taxincrease is the relatively low participation rates in the program. CBOhas estimated that only about one-half to two-thirds of eligible peopleparticipated in the program in August 1984.16 Many of those who did
16. Congressional Budget Office, "The Food Stamp Program: Eligibility and Participation" (StaffWorking Paper, November 1988).
CHAPTER V DISTRIBUTIONAL EFFECTS 83
not participate, however, were eligible for very low benefits becausethey had relatively high monthly incomes after deductions.
Separate increases in food stamps were simulated to offset 15 per-cent of each of the three net tax increases. An increase of about 5 per-cent in food stamps was simulated to offset the net cigarette tax in-crease, an increase of about 10 percent was simulated to offset the netalcoholic beverage tax increase, and a food stamp increase of about 15percent was used to offset the net motor fuel tax increase.
An Increase in Food Stamp Benefits and in the EITC
One can receive both food stamps and the EITC. If the refundableportion of the EITC is received as a single lump-sum payment, it iscounted as an asset in the month it is received for purposes of de-termining food stamp eligibility, but advance EITC payments are nolonger counted as monthly income by the food stamp program.
An increase in food stamps, the EITC, or a combination of the twowould provide the largest assistance to families in the lowest incomequintile (see Table 10). The increase in food stamps would more thanoffset the average net alcoholic beverage and motor fuel excise tax in-creases and offset about 75 percent of the average net cigarette taxincrease for families in the lowest income quintile. The increase in theEITC would likewise offset most of the average net increase in alco-holic beverage taxes, but less than one-half of the net increase in thecigarette tax, for families in the lowest income quintile.
Under any of these options, but particularly for increases in theEITC, some of the benefit of the credits would go to high-income fami-lies. For the EITC this is because low-income people would be entitledto the credits even if they lived with high-income relatives. The EITCprovides a large percentage of its benefits to nonelderly families. As anoffset to excise tax increases, this greater share may not be a problembecause low-income elderly families receive much of their income fromindexed transfer payments.
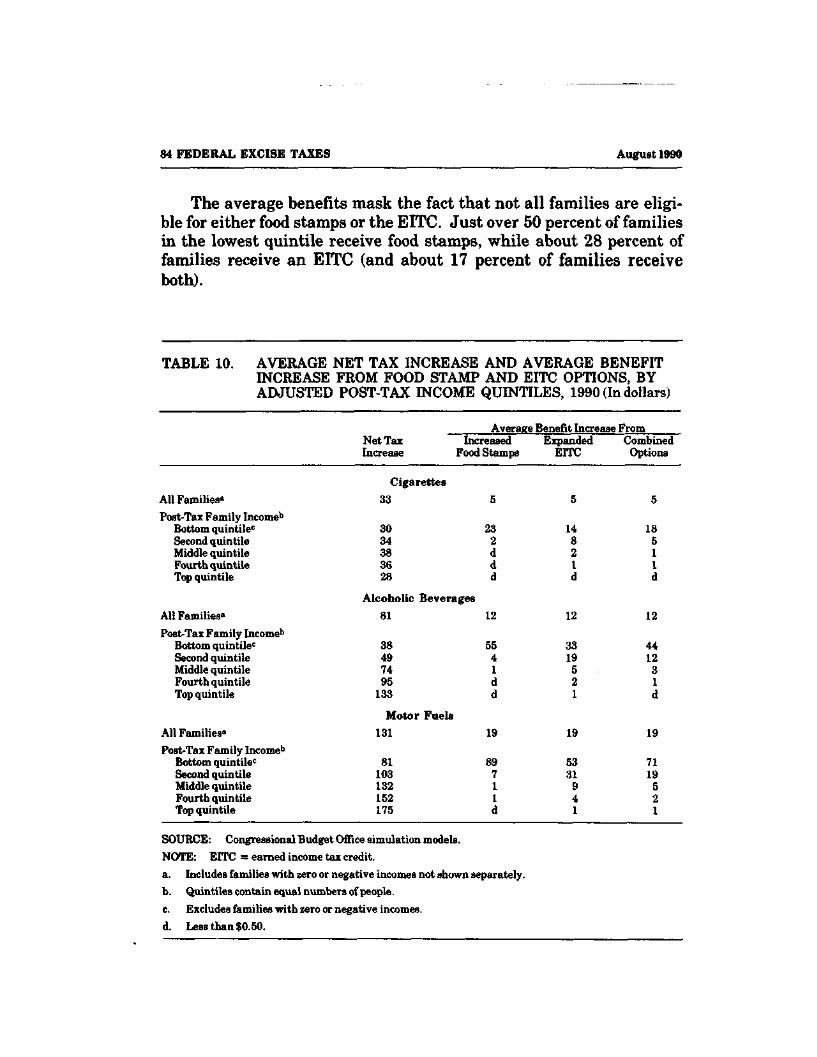
84 FEDERAL EXCISE TAXES August 1990
The average benefits mask the fact that not all families are eligi-ble for either food stamps or the EITC. Just over 50 percent of familiesin the lowest quintile receive food stamps, while about 28 percent offamilies receive an EITC (and about 17 percent of families receiveboth).
TABLE 10. AVERAGE NET TAX INCREASE AND AVERAGE BENEFITINCREASE FROM FOOD STAMP AND EITC OPTIONS, BYADJUSTED POST-TAX INCOME QUDSTTILES, 1990 (In dollars)
Average Benefit Increase FromNet Tax Increased Expanded CombinedIncrease Food Stamps EITC Options
CigarettesA l l Families* 3 3 5 5 5Post-Tax Family Incomeb
Bottom quintile0 30 23 14 18Second quintile 3 4 2 8 5Middle quintile 38 d 2 1Fourth quintile 36 d 1 1Top quintile 28 d d d
Alcoholic BeveragesAll Families*Post-Tax Family Income1"
Bottom quintilec
Second quintileMiddle quintileFourth quintileTop quintile
All Families*Post-Tax Family Income15
Bottom quintile0
Second quintileMiddle quintileFourth quintileTop quintile
81
38497495
133
Motor Fuels131
81103132152175
12
5541dd
19
89711d
12
3319521
19
5331941
12
441231d
19
7119521
SOURCE: Congressional Budget Office simulation models.NOTE: EITC = earned income tax credit.a. Includes families with zero or negative incomes not shown separately.b. Quintiles contain equal numbers of people.c. Excludes families with zero or negative incomes.d. Less than $0.50.
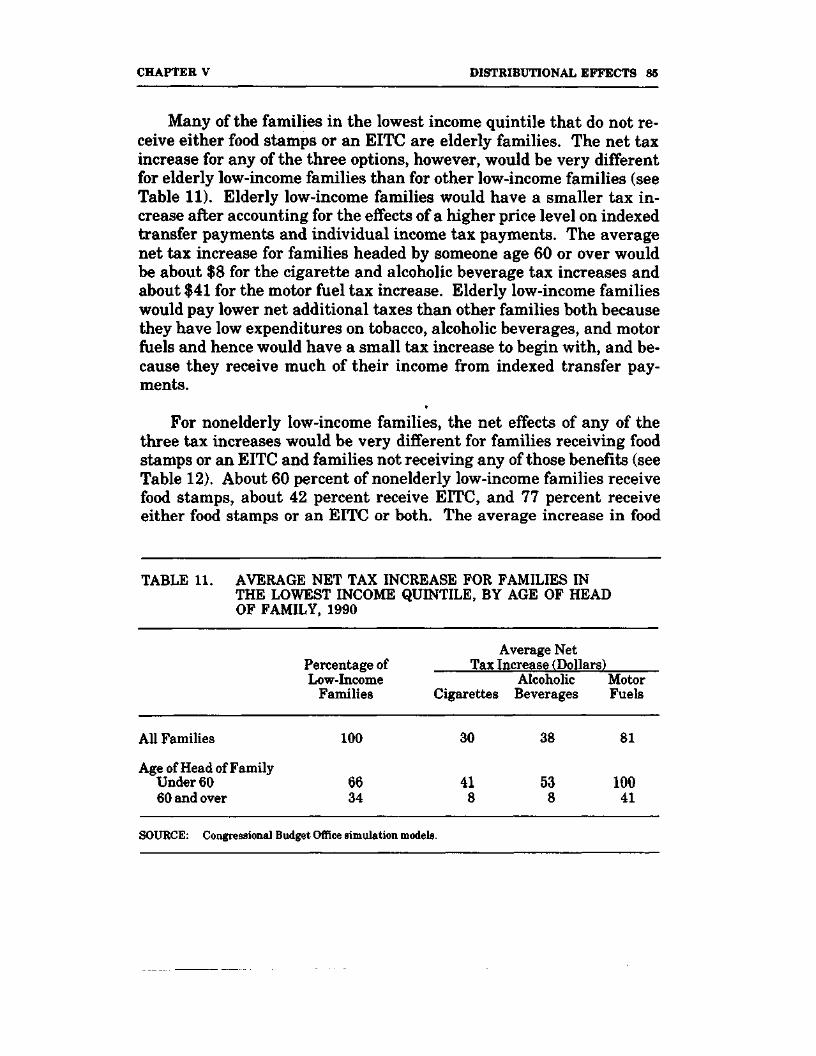
CHAPTER V DISTRIBUTIONAL EFFECTS 85
Many of the families in the lowest income quintile that do not re-ceive either food stamps or an EITC are elderly families. The net taxincrease for any of the three options, however, would be very differentfor elderly low-income families than for other low-income families (seeTable 11). Elderly low-income families would have a smaller tax in-crease after accounting for the effects of a higher price level on indexedtransfer payments and individual income tax payments. The averagenet tax increase for families headed by someone age 60 or over wouldbe about $8 for the cigarette and alcoholic beverage tax increases andabout $41 for the motor fuel tax increase. Elderly low-income familieswould pay lower net additional taxes than other families both becausethey have low expenditures on tobacco, alcoholic beverages, and motorfuels and hence would have a small tax increase to begin with, and be-cause they receive much of their income from indexed transfer pay-ments.
For nonelderly low-income families, the net effects of any of thethree tax increases would be very different for families receiving foodstamps or an EITC and families not receiving any of those benefits (seeTable 12). About 60 percent of nonelderly low-income families receivefood stamps, about 42 percent receive EITC, and 77 percent receiveeither food stamps or an EITC or both. The average increase in food
TABLE 11. AVERAGE NET TAX INCREASE FOR FAMILIES INTHE LOWEST INCOME QUINTILE, BY AGE OF HEADOF FAMILY, 1990
Average NetPercentage of Tax Increase (Dollars)Low-Income Alcoholic Motor
Families Cigarettes Beverages Fuels
All Families 100 30 38 81
Age of Head of FamilyUnder 60 66 41 53 10060 and over 34 8 8 41
SOURCE: Congressional Budget Office simulation models.
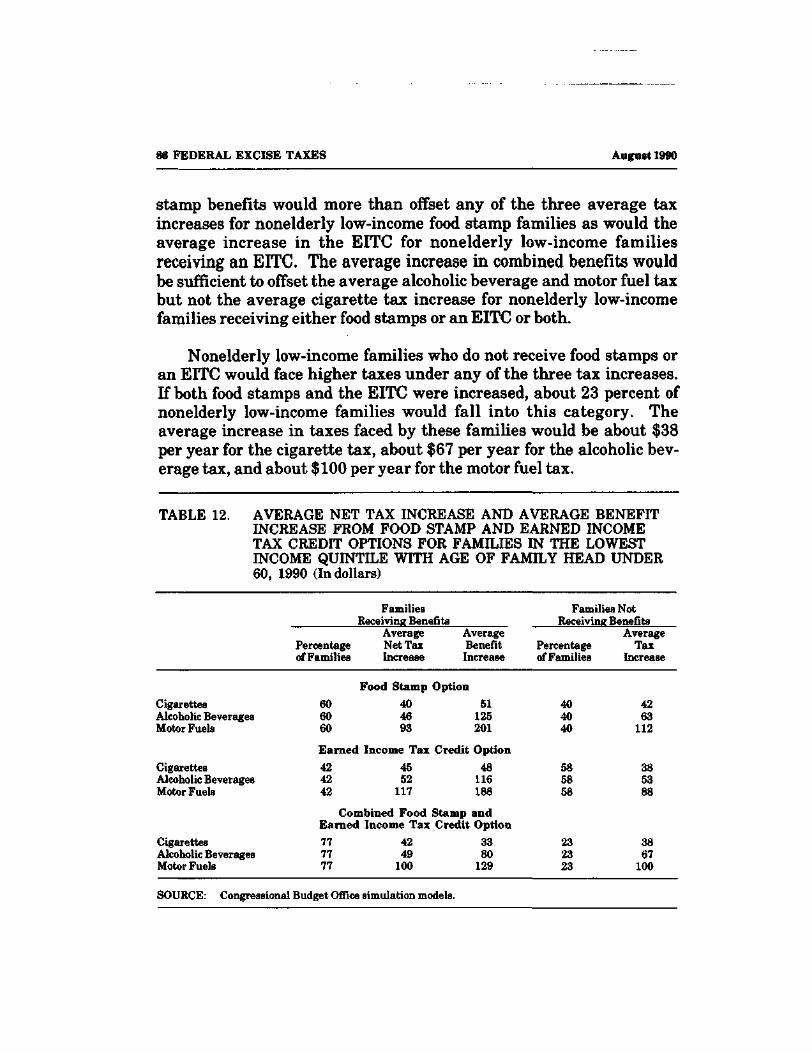
86 FEDERAL EXCISE TAXES August 1990
stamp benefits would more than offset any of the three average taxincreases for nonelderly low-income food stamp families as would theaverage increase in the EITC for nonelderly low-income familiesreceiving an EITC. The average increase in combined benefits wouldbe sufficient to offset the average alcoholic beverage and motor fuel taxbut not the average cigarette tax increase for nonelderly low-incomefamilies receiving either food stamps or an EITC or both.
Nonelderly low-income families who do not receive food stamps oran EITC would face higher taxes under any of the three tax increases.If both food stamps and the EITC were increased, about 23 percent ofnonelderly low-income families would fall into this category. Theaverage increase in taxes faced by these families would be about $38per year for the cigarette tax, about $67 per year for the alcoholic bev-erage tax, and about $100 per year for the motor fuel tax.
TABLE 12. AVERAGE NET TAX INCREASE AND AVERAGE BENEFITINCREASE FROM FOOD STAMP AND EARNED INCOMETAX CREDIT OPTIONS FOR FAMILIES IN THE LOWESTINCOME QUINTILE WITH AGE OF FAMILY HEAD UNDER60, 1990 (In dollars)
FamiliesReceiving Benefits
CigarettesAlcoholic BeveragesMotor Fuels
Percentageof Families
606060
AverageNet TaxIncrease
Food Stamp404693
AverageBenefitIncrease
Option51
125201
Families NotReceiving Benefits
Percentageof Families
404040
AverageTax
Increase
4263
112
Earned Income Tax Credit OptionCigarettes 42 45 48 58 38Alcoholic Beverages 42 52 116 58 53Motor Fuels 42 117 188 58 88
Combined Food Stamp andEarned Income Tax Credit Option
Cigarettes 77 42 33 23 38Alcoholic Beverages 77 49 80 23 67Motor Fuels 77 100 129 23 100
SOURCE: Congressional Budget Office simulation models.
CHAPTER VI
OTHER EFFECTS OF EXCISE TAX INCREASES
Increases in the excise taxes on tobacco products, alcoholic beverages,and motor fuels would affect the economy at large principally byreducing the federal deficit. In the context of recent discussions of defi-cit reduction options, the tax increases discussed in Chapter V aremodest from an economywide perspective. These options would raiserevenues by about $3 billion annually in the case of tobacco products,about $7 billion annually in the case of alcoholic beverages, and about$12 billion annually in the case of motor fuels. The economic effects ofdeficit reduction summarized below would be common to each of thesetax increases. In each case, the economic effects would be more signifi-cant the greater the deficit reduction.
An increase in the excise tax on motor fuels would have broader-reaching economic effects than an increase in taxes on tobacco productsor alcoholic beverages generating the same amount of revenue, be-cause motor fuels are intermediate inputs in production and distribu-tion while tobacco products and alcoholic beverages are not. The ef-fects of the motor fuel tax increase would be muted, however since netimports account for a large portion—approximately 40 percent in 1989--of U.S. petroleum products and are likely to bear the brunt of thereduction in demand resulting from any excise tax increase. In thetobacco product and alcoholic beverage markets, imports play asmaller role. In 1989, taxes on imports generated less than 1 percent oftotal tobacco tax revenues, and about 14 percent of alcoholic beveragetax revenues.
Aside from its effects on the deficit, an excise tax increase wouldraise the relative prices of the taxed goods, which could boost the over-all level of consumer prices if the nominal money supply increased toaccommodate the change. Any increase in the price level would be aone-time adjustment. An increase in the relative prices of the taxedgoods would reduce demand for those goods. The impact would be
88 FEDERAL EXCISE TAXES August 1990
greater in regions where production of the goods is concentrated.Demand and production in industries not subject to the higher taxeswould respond to the change in relative prices, and investment andemployment would be boosted in industries producing goods for whichdemand had increased, so that, in the long run, there would be little orno effect on overall output.
Finally, an increase in excise tax rates would increase incentivesfor noncompliance. Tax increases on tobacco and alcoholic beverageson the order of those discussed in Chapter V would be unlikely to re-duce compliance significantly. The consequences of a motor fuels taxincrease are less certain. Procedures for collecting payment of themotor fuels excise tax were tightened in 1987 in response to concernsabout widespread evasion. The efficacy of these efforts is unclear.
EFFECTS ON THE ECONOMY OF AN INCREASEIN EXCISE TAXES ON MOTOR FUELS
Increasing the excise tax on gasoline from 9 cents to 21 cents per gal-lon, and the excise tax on diesel fuels from 15 cents to 27 cents per gal-lon, would raise about $12 billion annually in additional taxes. A taxincrease of this magnitude would have discernible, though modest,effects on national income, the general price level, and the balance oftrade.
Like virtually any other reduction in the federal budget deficit, itwould temporarily slow the growth of the gross national product. Itwould also increase consumer prices, unlike some other reductions inthe deficit. Higher taxes on sales of motor fuels to households wouldlower private disposable income, while higher taxes on fuels used bybusinesses would increase costs. These increased costs would be ulti-mately shifted forward to consumers through higher prices, therebyreducing disposable income. At first, however, businesses would bearsome share of the increased costs in the form of lower profits. Eithereffect would weaken private demand, and hence reduce GNP. To theextent that the positive effects of reduced motor fuel consumption on,for example, pollution levels, would not be captured in the national
CHAPTER VI OTHER EFFECTS OF EXCISE TAX INCREASES 88
income statistics, these GNP effects would overstate the costs of thehigher tax rates.
These temporary effects would be relatively modest in the case of a12 cent per gallon increase in motor fuels taxes. Several recent studiesof the effects of increasing the tax on gasoline found that, relative to abase case of no tax increase, a 10 cent per gallon increase in motor fueltaxes would reduce real output by between 0.2 percent and 0.3 per-cent—estimates that CBO judges to be on the high side—while causing aone-time increase in the consumer price index of approximately 0.3percent to 0.4 percent.!
The initial effect of higher taxes on motor fuels would be to in-crease the relative prices of motor fuels, and of goods using motor fuelsas intermediate inputs. In the near term, this increase in relativeprices would probably be reflected in a higher overall price level. Theeffect on output of the one-time increase would depend on the responseof the Federal Reserve. If the nominal money supply was not increasedenough to compensate for the increase in prices, the real money supplywould be reduced. This reduction in turn would boost interest rates,adding to the contractionary effects of higher prices in reducing spend-able incomes and profits. However, such additional declines in realoutput would not occur if the Federal Reserve increased the nominalmoney supply enough to offset the initial rise in the general price level.
The contractionary effects of higher motor fuel taxes would even-tually, however, be offset by the effects of a smaller federal deficit oninterest rates, investment, and the balance of trade via reduction inthe trade deficit. Reducing the federal deficit would be likely to resultin a reduction in interest rates, and this reduction in rates wouldstimulate increases in spending on housing, consumer durables, and
1. For analyses of the effects of motor fuel tax increases, see Mark W. French, "Economic Analysis ofGasoline Tax Increases," in House Committee on Public Works and Transportation, Proposals toIncrease the Federal Gasoline and Diesel Taxes for Deficit Reduction Purposes, 100:1 (July 1,1987);Department of Energy, Energy Information Agency, Cost and Benefit Analysis of a Motor Fuels Tax,SR/EAFD/87-02, Washington, D.C. (March 1987); Department of Energy, Energy Security.Appendix E: Analysis of the Effects of a Gasoline Tax, DOE/S-0057 (March 1987); and JoyceYanchar, "Closing the Deficit: An Income Tax Surcharge Versus Energy Taxes," Data ResourcesU.S. Review, pp. 17-23 (November 1987).
90 FEDERAL EXCISE TAXES August 1990
perhaps business investment, which would eventually offset at leastsome of the initial contractionary effects of the tax increase.
The contractionary effects of higher motor fuels taxes would alsobe offset eventually by an increase in net exports--the difference be-tween sales of American goods abroad and American purchases offoreign goods. A country with a trade deficit can be described as "over-spending its income" in the sense that its total expenditure on, or ab-sorption of, goods and services (including imports) exceeds its domes-tic production (including exports). Higher motor fuels taxes notmatched by corresponding increases in government spending wouldreduce domestic spending, thereby lowering absorption, reducing im-ports, and freeing domestic resources to go into production of exports.
The increase in net exports would be helped along by a depreci-ation of the dollar that would result if U.S. interest rates were reduced.With lower interest rates, inflows of foreign capital would decline,lowering the demand for dollars and thereby lowering the rate atwhich dollars can be exchanged for other currencies. As a result, im-ports would become more expensive in this country, U.S. exports wouldbecome cheaper, and net exports would increase.
Higher taxes on motor fuels would also directly reduce oil imports.Higher taxes would lower consumption of motor fuels, but—becausethis would not affect the wellhead price of oil—domestic production andreserves would not be harmed. With domestic supply of oil unchanged,the effect of lower domestic demand for oil would be to reduce oil im-ports. CBO has estimated that raising motor fuel taxes by 12 cents pergallon in 1986 would have lowered the country's net oil import require-ments by between 1 percent and 2 percent in 1987.2
Over time, lower U.S. demand for imported oil would put somedownward pressure on world oil prices. The effect would be small,given a small estimated drop in U.S. demand for oil. Domestic well-head prices are likely to track world oil prices, which might lowerdomestic supply, though the effect would be small in light of the smallchange in world oil prices.
2. Congressional Budget Office, The Budgetary and Economic Effects of Oil Taxes (April 1986).
CHAPTER VI OTHER EFFECTS OF EXCISE TAX INCREASES 91
Over the long term, firms and households would adjust theirspending patterns to reflect the increase in the relative prices of motorfuels and goods using motor fuels as inputs. In addition to decreasingthe demand for these goods, these adjustments would lead to increaseddemand for goods whose relative prices fell. The ultimate result wouldbe a reallocation of factors of production from motor-fuel-producingand motor-fuel-using sectors of the economy to other sectors.
REGIONAL EFFECTS
Regions differ in how much they depend on automobile and trucktransport, while the use of tobacco products and alcoholic beveragesalso varies among regions. As has been noted above, because of higherthan average consumption of motor fuels, households and businesses inrural regions would bear a somewhat disproportionate share of theburden of higher motor fuel taxes.
Different regions would also be affected differently by reductionsin the demand for tobacco, alcoholic beverages, and motor fuels.Regions whose economic base depends heavily on oil refining would beaffected by the motor fuel tax increase. Because any reduction in thedemand for motor fuels resulting from higher prices would eventuallytranslate almost entirely into reduced petroleum imports, domesticrefiners and marketers, not producers, would be those principally af-fected. In 1988, almost 40 percent of total U.S. refinery production ofmotor gasoline came from the Texas and Louisiana Gulf coast region. 3Domestic producers could be affected if a reduction in U.S. demandstemming from a tax increase lowered world oil prices, but this effectwould probably be very small.
Production of tobacco products and alcoholic beverages is also con-centrated in a few states. Although 21 states have establishmentsauthorized to manufacture tobacco products, North Carolina andKentucky accounted for 70 percent of taxable cigarette output in 1989.Distilled spirits production is spread over about two dozen states,
3. Department of Energy, Energy Information Administration, Petroleum Supply Annual, 1988, vol.1, DOE/EIA-034(K88)/1 (May 1989).
92 FEDERAL EXCISE TAXES August 1990
although California and Kentucky were responsible for over 40 percentof domestic taxable output in 1989. California produces about 80 per-cent of the domestic wine consumed in this country, with most of theremaining production in New York. Beer production is more diffuse.Five states were responsible for over 50 percent of the total taxableoutput in 1989, but none of these five (California, Colorado, New York,Texas, and Wisconsin) produced as much as 13 percent of the total.4
Reducing the consumption of tobacco, alcoholic beverages, andmotor fuels would affect state government finances. Virtually allstates tax tobacco and motor fuels on a per unit basis (in cents per packor per gallon). A reduction in consumption of tobacco and motor fuelsresulting from the federal excise tax increase would, therefore, lead toa proportional reduction in state tax revenues from these sources.
The effect on state alcoholic beverage tax revenues would be lessclear. A number of states tax alcoholic beverages on an ad valorembasis (as a percentage of final sales price inclusive of excise taxes). Inthese cases, the change in state revenues would be proportional to thechange in total expenditures rather than to the change in unit con-sumption. Because higher federal taxes would raise prices but reduceconsumption, total expenditures on alcoholic beverages could either in-crease or decrease following an increase in federal tax rates. Becausethe percentage changes in the quantities of beer and distilled spiritspurchased in response to a price change are estimated to be smallerthan the percentage changes in the prices of the goods (that is, theelasticity of demand is estimated to be less than one), alcoholic bev-erage revenues in ad valorem states would be likely to increase with anincrease in the federal excise tax rate on these goods.
Some states tax tobacco products, alcoholic beverages, and motorfuels under ad valorem general sales taxes as well as under selectiveexcise taxes. Because the estimated elasticities of demand for ciga-rettes and motor fuels (in the short run) are also estimated to be lessthan one, general sales tax revenues from these three sources would be
4. Department of the Treasury, Bureau of Alcohol, Tobacco and Firearms, unpublished data, May1990.
CHAPTER VI OTHER EFFECTS OF EXCISE TAX INCREASES 93
likely to increase with an increase in federal excise tax rates on thesegoods.
The magnitude of the effects of higher federal excise taxes on over-all state and local finances would depend on the shares of state taxrevenues provided by taxes on tobacco, alcoholic beverages, and motorfuels. These shares are relatively small on average, for tobacco andalcoholic beverages. In 1988, tobacco taxes were 1.8 percent of statetax revenues, while alcoholic beverage taxes were 1.2 percent. Somestates rely more heavily on these taxes than others. New Hampshirereceived more than 5 percent of its total revenues from taxes ontobacco, while Florida received 4 percent of its revenues from taxes onalcoholic beverages. Motor fuel taxes are a larger percentage of statetax revenues~6.5 percent in 1988. The share of state tax revenuesprovided by motor fuel taxes varies considerably, however. In 1988,the share ranged from a low of under 3 percent in Alaska, Hawaii, andNew York (1.3 percent in the District of Columbia) to a high of over 14percent in Montana and New Hampshire.
TAX COLLECTION AND COMPLIANCE
Higher tax rates increase the incentive for noncompliance. At currentrates, compliance is generally considered problematic only for gasolineand diesel tax collections. Changes in collection procedures put inplace by the Tax Reform Act of 1986 (TRA) address the perceivedabuses of previous collection procedures. Current compliance with fed-eral excise taxes on alcoholic beverages and tobacco products is gen-erally considered to be acceptable. The major compliance problems arethose of state governments, arising from bootlegging across state linesand from the exemption from state taxes for purchases on Indian reser-vations and military bases.
Gasoline
The federal excise tax on gasoline is levied on the sale or removal ofgasoline from the refinery or terminal. For imported gasoline, the taxis imposed on removal from customs custody. After removal, the gaso-
94 FEDERAL EXCISE TAXES August 1990
line is delivered to a wholesale distributor who delivers the gasolineeither directly to the user or to a retailer, who then sells the gasoline tothe final user. Several users of gasoline are tax-exempt, includingstate and local governments, nonprofit educational organizations, andcommercial ships and aircraft. Sales for export are also tax-exempt.5
Up to the point of taxation, gasoline may be transferred tax-freeamong registered producers. The Internal Revenue Service (IRS) ap-proves and registers producers, who include importers, refiners, termi-nal operators, throughputters, and traders.6 The IRS may require anapplicant to secure a bond before approving a registration application.Once registered, a producer may purchase and sell gasoline tax-free toany other registered producer as long as the gasoline is not removedfrom a terminal. About 2,300 registered producers exist. The IRS in-vestigates each six months after the initial approval of registrationand again at regular intervals of at least every two years.
These registration and auditing procedures were established un-der TRA. Widespread noncompliance and organized crime involve-ment were alleged to have occurred under the previous collection pro-cess. Estimates of forgone revenues varied widely. In 1986, the Trea-sury Department estimated forgone federal revenue at $100 million to$200 million annually, while Roderick G. W. Chu, the New York StateCommissioner of Taxation and Finance, estimated it at $1 billion.?Estimates of noncompliance are further complicated by discrepanciesbetween the gasoline gallonage reported by the IRS and that reportedby the Federal Highway Administration.
5. Effective October 1,1988, tax-exempt users are permitted to purchase gasoline tax exempt from awholesale distributor and the wholesale distributor may claim a refund. Under prior law, a tax-exempt user, purchasing gasoline at a price that included the gasoline excise tax, could claim acredit or refund against his or her income tax liability. If a refund exceeded $1,000 in any of the firstthree calendar quarters, a refund claim could be filed in that quarter.
6. Throughputters receive transfers of gasoline from refiners, importers, terminal operators, otherthroughputters, or traders, and then store the gasoline in a terminal; they own the gasoline or holdthe inventory position to the gasoline at the time of removal or sale from a terminal. Traders buyand sell gasoline in a pipeline or terminal. Traders do not normally take physical possession orstore the product.
7. Statements by O. Donaldson Chapoton, Deputy Assistant Secretary, Department of the Treasury,and Roderick G. W. Chu, Commissioner, New York State Department of Taxation and Finance,before the Subcommittee on Oversight of the Committee on Ways and Means, U.S. House of Repre-sentatives Hearing on Compliance with Federal Gasoline Excise Tax Provisions, Washington, D.C.,July 15,1986.
CHAPTER VI OTHER EFFECTS OF EXCISE TAX INCREASES 95
Noncompliance typically takes one of four forms: bootlegging,"daisy chain operations," dilution, or exaggerated gas loss. Bootleg-ging is importing foreign oil without paying the tax, or retainingdomestic gasoline for domestic use while classifying it as tax-exemptoil for export. A daisy chain operation is a multilayer paper transactionscheme to camouflage the sale of gasoline by a registered entity to anunregistered distributor using shell companies with fraudulent regis-tration numbers or no assets. Dilution is the mixing of cheap nontax-able fluid in gasoline to increase its volume. The final method of eva-sion is exaggerated gas loss. Since a small percentage of gasoline evap-orates, standard operating procedures permit vapor loss to be writtenoff as an inventory loss. By overstating the vapor loss, handlers evadepart of the tax liability.
The tax collection point was moved upward in the chain of dis-tribution by TRA, from the wholesale level to removal from therefinery or terminal, in an effort to improve compliance. When TRAwas enacted, the Joint Committee on Taxation estimated that taxinggasoline on its removal from the terminal would raise $300 million inthe first year and $200 million in subsequent years. TRA alsostrengthened IRS registration and auditing procedures. It is still tooearly to assess the effects of these changes on compliance.
Diesel Fuel
The federal excise tax on diesel fuel is imposed on the sale or use of thefuel by the producer, whichever occurs first. Generally the tax is re-stricted to on-highway use, with exemptions. The registration andcollection process for the diesel tax is similar to that for gasoline.
The point of collection for diesel fuel has also been moved upwardin the chain of distribution, for compliance reasons. Collection wasmoved from the retail level to the wholesale level by the OmnibusBudget Reconciliation Act of 1987. The Treasury Department esti-mated that this would reduce the number of diesel registrants from60,000 to 8,000. Preliminary IRS estimates put diesel registrants infiscal year 1989 at 15,000. However, it is not yet possible to estimatethe effect of these changes on compliance.
96 FEDERAL EXCISE TAXES August 1990
Diesel fuel taxes are collected later in the distribution chain thangasoline taxes, in part because of the large percentage of diesel fuelexempt from tax. Diesel fuel for off-highway use and for export is tax-exempt. In addition, a large class of tax-exempt users exists, includingstate and local governments, nonprofit schools, farms, and some rail-road, bus, and airline companies.
Highway diesel fuel accounted for about 55 percent of the esti-mated total consumption of 750 million gallons of diesel fuel in theUnited States in 1985.8 Because diesel fuel and home heating fuel arealike (both are classified as No. 2 distillate), opportunities exist for taxevasion. The use of untaxed fuel for highway driving presents a majorcompliance problem.
Alcohol and Tobacco
The taxes on alcoholic beverages are generally imposed on the pro-ducer or importer of the beverage when the beverage is removed fromthe warehouse or from customs custody for sale or consumption. Cer-tain tax-free transfers among producers and bonded warehouses arepermitted before removal. These transfers have not led to serious non-compliance problems.
The tax on tobacco products is imposed on removal from the factoryor on release from customs custody. Exemption from the tax is avail-able only for experimental use, consumption by employees of a manu-facturer, and production for export. Under other circumstances, themanufacturer or importer of tobacco products is liable for the tax.
The Treasury Department's Bureau of Alcohol, Tobacco, and Fire-arms (BATF) has long been responsible for the regulation and super-vision of alcohol and tobacco manufacturers. In 1987, it became re-sponsible for collecting the federal excise taxes as well. The CustomsService collects federal excise taxes on imports.
8. Department of Transportation, Federal Highway Administration, Federal and State Taxation ofHighway Diesel Fuel: Administration and Compliance (August 1988), p. 5.
CHAPTER VI OTHER EFFECTS OF EXCISE TAX INCREASES 97
BATF reports on approximately 2,100 alcoholic beverage andtobacco producing plants, all of which must have a BATF permit. Ap-proximately 25 percent of the alcohol registrants generated 95 percentof the revenue collected from the federal excise tax on alcoholic bev-erages in fiscal year 1989. Production is even more concentrated in thetobacco industry. While there are about 130 tobacco producers, thebulk of excise revenues are collected from four or five major plants.9The concentration of production enables BATF to target its complianceefforts and closely monitor revenue flows. The BATF compliance in-spection program includes on-site visits, the frequency of which de-pends on the size of the plant and the perceived likelihood of evasion.Although no estimates of revenue loss attributable to noncomplianceare available, noncompliance with these taxes is apparently not apressing problem.
Noncompliance with tobacco and alcoholic beverage excise taxes,however, has been a problem for state governments because of the vari-ation in state tax rates. The enactment of the 1978 Cigarettes Con-traband Act, which prohibits the transportation, receipt, shipment,possession, distribution, or purchase of more than 60,000 cigarettes notbearing the tax indicia of the state in which the cigarettes are found,has reduced state revenue losses from bootlegging operations.
9. Department of the Treasury, Bureau of Alcohol, Tobacco, and Firearms, "EstablishmentsAuthorized to Operate Under the Supervision of the Bureau of Alcohol, Tobacco, and Firearms as ofSeptember, 1989" (1990).

APPENDIXES

APPENDIX A
BACKGROUND DATA ON EXCISE TAX
REVENUES AND TAX RATES
The following tables provide background data for the figures in thetext. The first seven tables are about federal revenues and excise taxrates. Tables A-l through A-4 show various measures of total federalexcise tax revenues and revenues from tobacco, alcoholic beverage, andmotor fuel taxes for 1950 through 1989. Tables A-5 through A-7 showfederal excise tax rates on cigarettes, alcoholic beverages, and motorfuels in nominal and real terms, and as a percentage of prices, for 1950through 1989.
The next two tables (A-8 and A-9) show total and per capita con-sumption of cigarettes, distilled spirits, beer, and wine, and gasolineand special fuels for 1950 through 1988.
The next five tables are about state excise tax revenues and taxrates. Tables A-10 and A-ll show total state excise tax revenues, andrevenues from tobacco, alcoholic beverage, and motor fuel taxes for1950 through 1988. Tables A-12 and A-13 show the same data for 1988by state. Table A-14 shows state excise tax rates on cigarettes, al-coholic beverages, and motor fuels for 1989.
The final five tables (A-15 through A-19) show total tax revenuesby source and the tax burden on cigarettes, alcoholic beverages, andmotor fuels for member countries of the Organization for EconomicCooperation and Development.
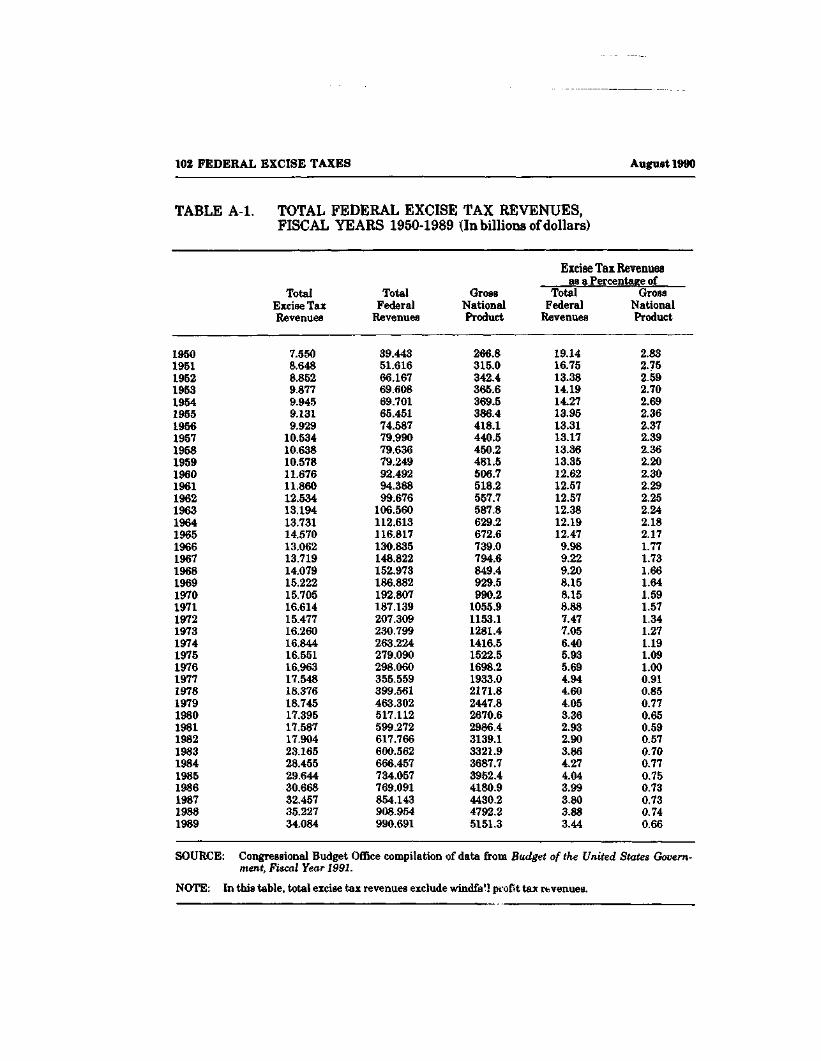
102 FEDERAL EXCISE TAXES August 1990
TABLE A-l. TOTAL FEDERAL EXCISE TAX REVENUES,FISCAL YEARS 1950-1989 (In billions of dollars)
Excise Tax Revenuesas a Percentage of
1950195119521953195419551956195719581959196019611962196319641965196619671968196919701971197219731974197519761977197819791980198119821983198419851986198719881989
TotalExcise TaxRevenues
7.5508.6488.8529.8779.9459.1319.929
10.53410.63810.57811.67611.86012,53413.19413.73114.57013.06213.71914.07915.22215.70516.61415.47716.26016.84416.55116.96317.54818.37618.74517.39517.58717.90423.16528.45529.64430.66832.45735.22734.084
TotalFederal
Revenues
39.44351.61666.16769.60869.70165.45174.58779.99079.63679.24992.49294.38899.676
106.560112.613116.817130.835148.822152.973186.882192.807187.139207.309230.799263.224279.090298.060355.559399.561463.302517.112599.272617.766600.562666.457734.057769.091854.143908.954990.691
GrossNationalProduct
266.8315.0342.4365.6369.5386.4418.1440.5450.2481.5506.7518.2557.7587.8629.2672.6739.0794.6849.4929.5990.2
1055.91153.11281.41416.51522.51698.21933.02171.82447.82670.62986.43139.13321.93687.73952.44180.94430.24792.25151.3
TotalFederal
Revenues
19.1416.7513.3814.1914.2713.9513.3113.1713.3613.3512.6212.5712.5712.3812.1912.479.989.229.208.158.158.887.477.056.405.935.694.944.604.053.362.932.903.864.274.043.993.803.883.44
GrossNationalProduct
2.832.752.592.702.692.362.372.392.362.202.302.292.252.242.182.171.771.731.661.641.591.571.341.271.191.091.000.910.850.770.650.590.570.700.770.750.730.730.740.66
SOURCE: Congressional Budget Office compilation of data from Budget of the United States Govern-ment, Fiscal Year 1991.
NOTE: In this table, total excise tax revenues exclude windfa'l profit tax revenues.
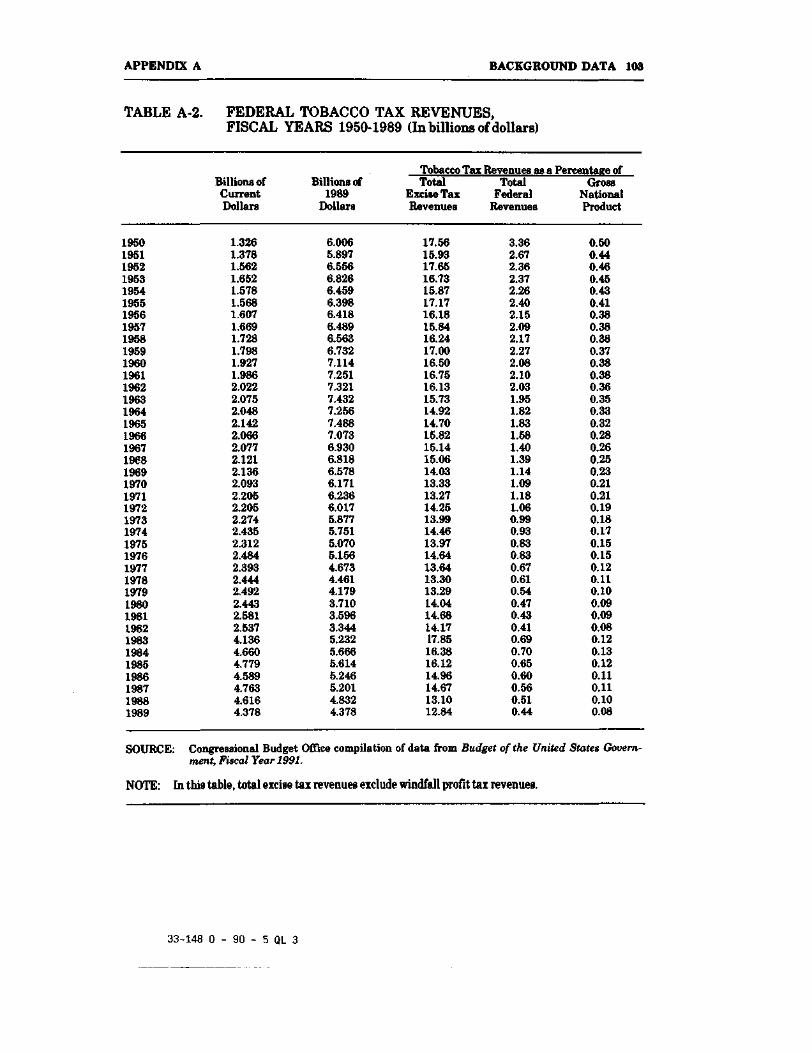
APPENDIX A BACKGROUND DATA 103
TABLE A-2. FEDERAL TOBACCO TAX REVENUES,FISCAL YEARS 1950-1989 (In billions of dollars)
Tobacco Tax Revenues as a Percentage of
1950195119521953195419551956195719581959196019611962196319641965196619671968196919701971197219731974197519761977197819791980198119821983198419851986198719881989
Billions ofCurrentDollars
1.3261.3781.5621.6521.5781.5681.6071.6691.7281.7981.9271.9862.0222.0752.0482.1422.0662.0772.1212.1362.0932.2052.2052.2742.4352.3122.4842.3932.4442.4922.4432.5812.5374.1364.6604.7794.5894.7634.6164.378
Billions of1989
Dollars
6.0065.8976.5566.8266.4596.3986.4186.4896.5636.7327.1147.2517.3217.4327.2567.4887.0736.9306.8186.5786.1716.2366.0175.8775.7515.0705.1564.6734.4614.1793.7103.5963.3445.2325.6665.6145.2465.2014.8324.378
TotalExcise TaxRevenues
17.5615.9317.6516.7315.8717.1716.1815.8416.2417.0016.5016.7516.1315.7314.9214.7015.8215.1415.0614.0313.3313.2714.2513.9914.4613.9714.6413.6413.3013.2914.0414.6814.1717.8516.3816.1214.9614.6713.1012.84
TotalFederal
Revenues
3.362.672.362.372.262.402.152.092.172.272.082.102.031.951.821.831.581.401.391.141.091.181.060.990.930.830.830.670.610.540.470.430.410.690.700.650.600.560.510.44
GrossNationalProduct
0.500.440.460.450.430.410.380.380.380.370.380.380.360.350.330.320.280.260.250.230.210.210.190.180.170.150.150.120.110.100.090.090.080.120.130.120.110.110.100.08
SOURCE: Congressional Budget Office compilation of data from Budget of the United States Govern-ment, Fiscal Year 1991.
NOTE: In this table, total excise tax revenues exclude windfall profit tax revenues.
33-148 0 - 90 - 5 QL 3
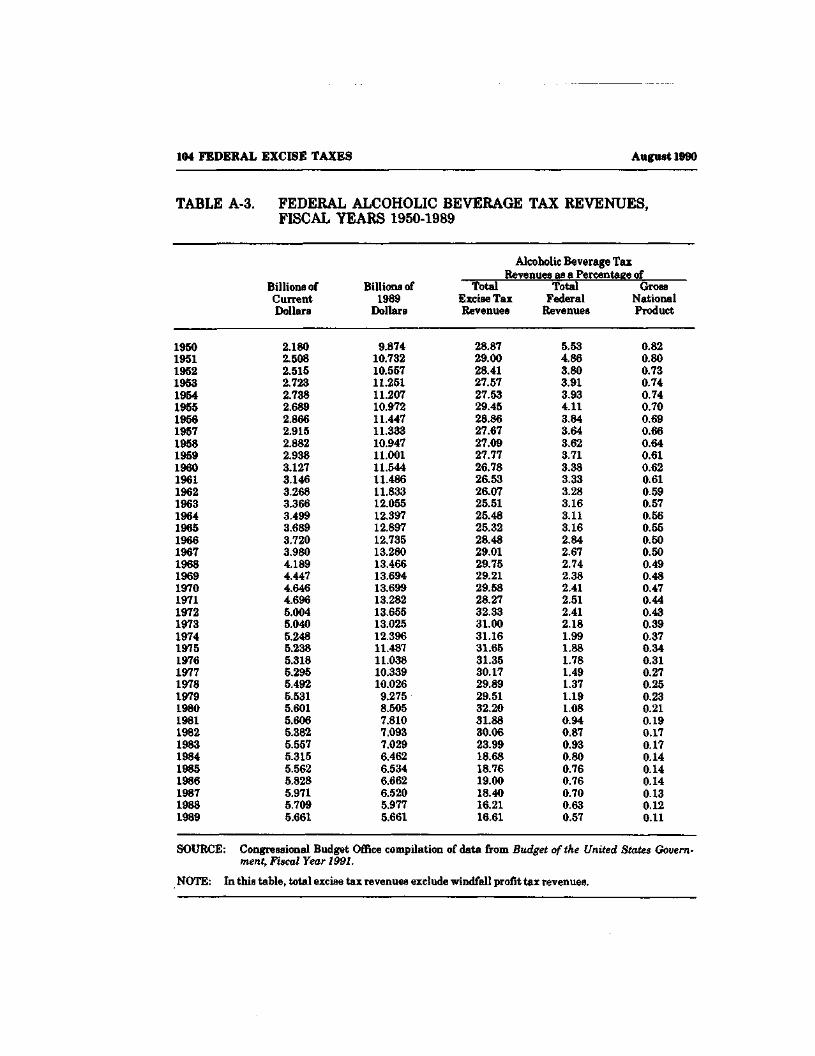
104 FEDERAL EXCISE TAXES August 1990
TABLE A-3. FEDERAL ALCOHOLIC BEVERAGE TAX REVENUES,FISCAL YEARS 1950-1989
Alcoholic Beverage TaxRevenues as a Percentage of
1950195119521953195419551956195719581959196019611962196319641965196619671968196919701971197219731974197519761977197819791980198119821983198419851986198719881989
Billions ofCurrentDollars
2.1802.5082.5152.7232.7382.6892.8662.9152.8822.9383.1273.1463.2683.3663.4993.6893.7203.9804.1894.4474.6464.6965.0045.0405.2485.2385.3185.2955.4925.5315.6015.6065.3825.5575.3155.5625.8285.9715.7095.661
Billions of1989
Dollars
9.87410.73210.55711.25111.20710.97211.44711.33310.94711.00111.54411.48611.83312.05512.39712.89712.73513.28013.46613.69413.69913.28213.65513.02512.39611.48711.03810.33910.0269.2758.5057.8107.0937.0296.4626.5346.6626.5205.9775.661
TotalExcise TaxRevenues
28.8729.0028.4127.5727.5329.4528.8627.6727.0927.7726.7826.5326.0725.5125.4825.3228.4829.0129.7529.2129.5828.2732.3331.0031.1631.6531.3530.1729.8929.5132.2031.8830.0623.9918.6818.7619.0018.4016.2116.61
TotalFederal
Revenues
5.534.863.803.913.934.113.843.643.623.713.383.333.283.163.113.162.842.672.742.382.412.512.412.181.991.881.781.491.371.191.080.940.870.930.800.760.760.700.630.57
GrossNationalProduct
0.820.800.730.740.740.700.690.660.640.610.620.610.590.570.560.550.500.500.490.480.470.440.430.390.370.340.310.270.250.230.210.190.170.170.140.140.140.130.120.11
SOURCE: Congressional Budget OfiEice compilation of data from Budget of the United States Govern-ment, Fiscal Year 1991.
NOTE: In this table, total excise tax revenues exclude windfall profit tax revenues.
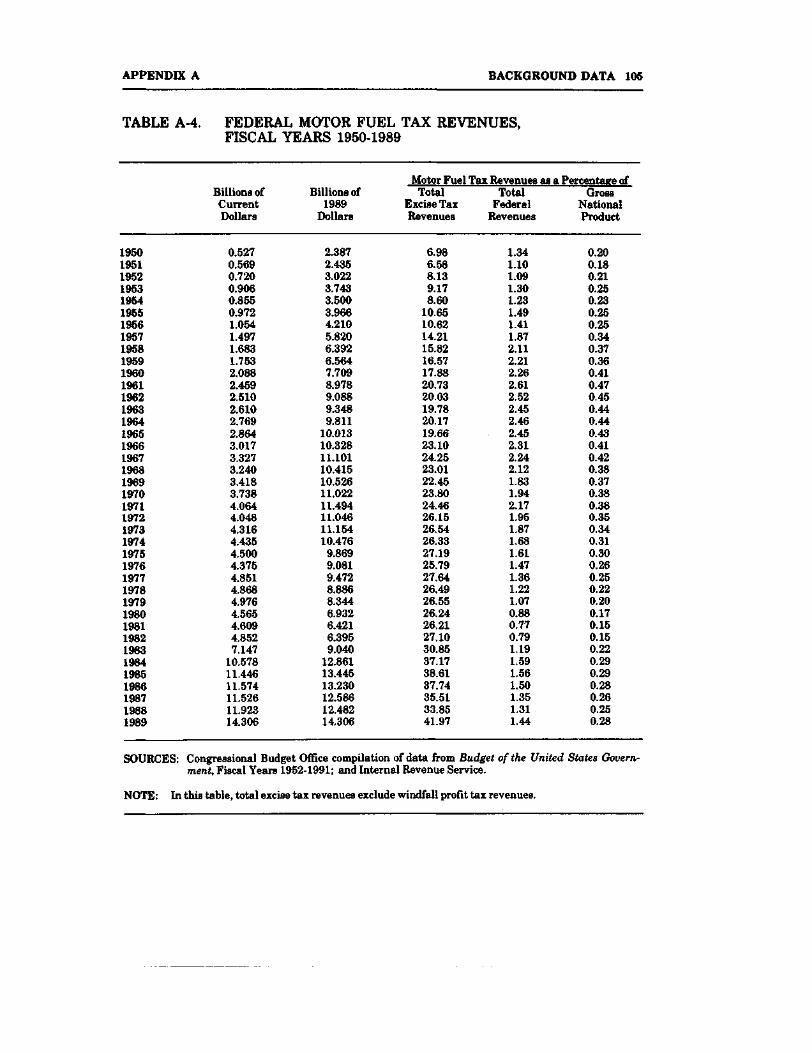
APPENDIX A BACKGROUND DATA 105
TABLE A-4. FEDERAL MOTOR FUEL TAX REVENUES,FISCAL YEARS 1950-1989
Motor Fuel Tax Revenues as a Percentage of
1950195119521953195419551956195719581959196019611962196319641965196619671968196919701971197219731974197519761977197819791980198119821983198419851986198719881989
Billions ofCurrentDollars
0.5270.5690.7200.9060.8550.9721.0541.4971.6831.7532.0882.4592.5102.6102.7692.8643.0173.3273.2403.4183.7384.0644.0484.3164.4354.5004.3754.8514.8684.9764.5654.6094.8527.147
10.57811.44611.57411.52611.92314.306
Billions of1989
Dollars
2.3872.4353.0223.7433.5003.9664.2105.8206.3926.5647.7098.9789.0889.3489.811
10.01310.32811.10110.41510.52611.02211.49411.04611.15410.4769.8699.0819.4728.8868.3446.9326.4216.3959.040
12.86113.44513.23012.58612.48214.306
TotalExcise TaxRevenues
6.986.588.139.178.60
10.6510.6214.2115.8216.5717.8820.7320.0319.7820.1719.6623.1024.2523.0122.4523.8024.4626.1526.5426.3327.1925.7927,6426.4926.5526.2426.2127.1030.8537.1738.6137.7435.5133.8541.97
TotalFederal
Revenues
1.341.101.091.301.231.491.411.872.112.212.262.612.522.452.462.452.312.242.121.831.942.171.951.871.681.611.471.361.221.070.880.770.791.191.591.561.501.351.311.44
GrossNationalProduct
0.200.180.210.250.230.250.250.340.370.360.410.470.450.440.440.430.410.420.380.370.380.380.350.340.310.300.260.250.220.200.170.150.150.220.290.290.280.260.250.28
SOURCES: Congressional Budget Office compilation of data from Budget of the United States Govern-ment, Fiscal Years 1952-1991; and Internal Revenue Service.
NOTE: In this table, total excise tax revenues exclude windfall profit tax revenues.
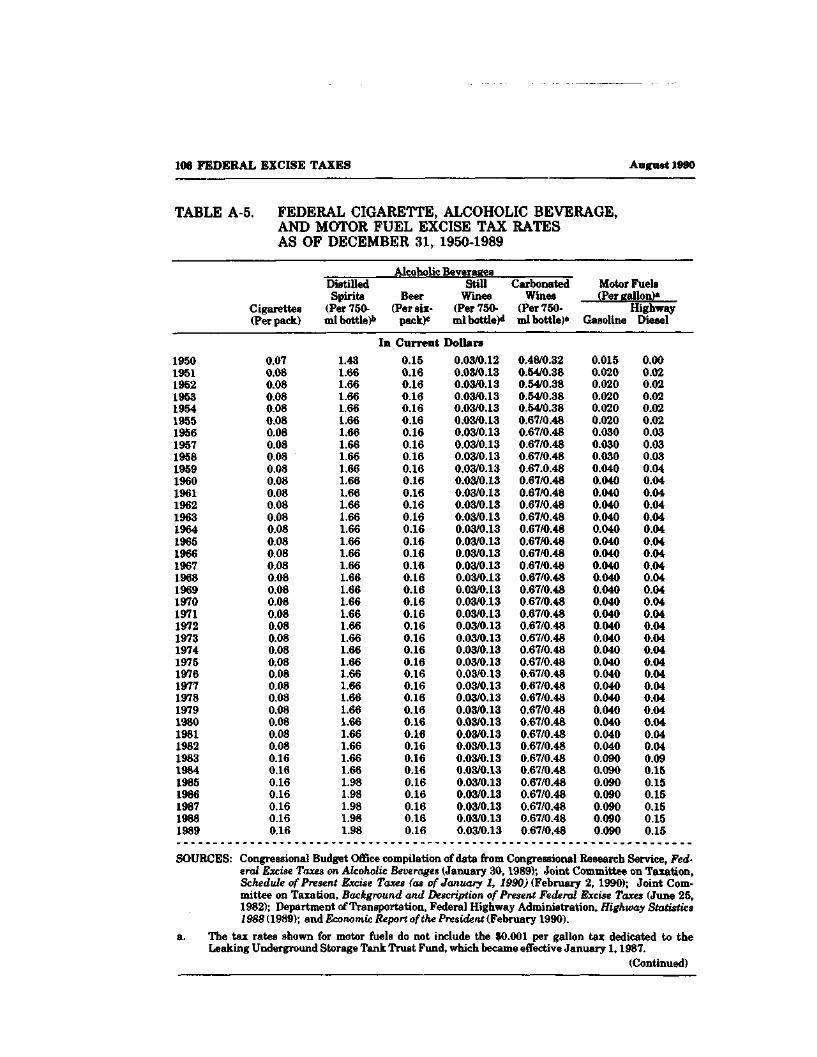
106 FEDERAL EXCISE TAXES August 1990
TABLE A-5. FEDERAL CIGARETTE, ALCOHOLIC BEVERAGE,AND MOTOR FUEL EXCISE TAX RATESAS OF DECEMBER 31, 1950-1989
Alcoholic Beverages
Cigarettes(Per pack)
DistilledSpirits
(Per 750-mlbottle)b
Beer(Per six-
pack)'
In Current
1950195119521953195419551956195719581959196019611962196319641965196619671968196919701971197219731974197519761977197819791980198119821983198419851986198719881989
0.070.080.080.080.080.080.080.080.080.080.080.080.080.080.080.080.080.080.080.080.080.080.080.080.080.080.080.080.080.080.080.080.080.160.160.160.160.160.160.16
1.431.661.661.661.661.661.661.661.661.661.661.661.661.661.661.661.661.661.661.661.661.661.661.661.661.661.661.661.661.661.661.661.661.661.661.981.981.981.981.98
0.150.160.160.160.160.160.160.160.160.160.160.160.160.160.160.160.160.160.160.160.160.160.160.160.160.160.160.160.160.160.160.160.160.160.160.160.160.160.160.16
StillWines
(Per 750-mlbottle)d
Dollars
0.03/0.120.03/0.130.03/0.130.03/0.130.03/0.130.03/0.130.03/0.130.03/0.130.03/0.130.03/0.130.03/0.130.03/0.130.03/0.130.03/0.130.03/0.130.03/0.130.03/0.130.03/0.130.03/0.130.03/0.130.03/0.130.03/0.130.03/0.130.03/0.130.03/0.130.03/0.130.03/0.130.03/0.130.03/0.130.03/0.130.03/0.130.03/0.130.03/0.130.03/0.130.03/0.130.03/0.130.03/0.130.03/0.130.03/0.130.03/0.13
CarbonatedWines
(Per 750-ml bottle)"
0.48/0.320.54/0.380.54/0.380.54/0.380.54/0.380.67/0.480.67/0.480.67/0.480.67/0.480.67.0.480.67/0.480.67/0.480.67/0.480.67/0.480.67/0.480.67/0.480.67/0.480.67/0.480.67/0.480.67/0.480.67/0.480.67/0.480.67/0.480.67/0.480.67/0.480.67/0.480.67/0.480.67/0.480.67/0.480.67/0.480.67/0.480.67/0.480.67/0.480.67/0.480.67/0.480.67/0.480.67/0.480.67/0.480.67/0.480.67/0.48
Motor Fuels(Per gallon)'
HighwayGasoline Diesel
0.0150.0200.0200.0200.0200.0200.0300.0300.0300.0400.0400.0400.0400.0400.0400.0400.0400.0400.0400.0400.0400.0400.0400.0400.0400.0400.0400.0400.0400.0400.0400.0400.0400.0900.0900.0900.0900.0900.0900.090
0.000.020.020.020.020.020.030.030.030.040.040.040.040.040.040.040.040.040.040.040.040.040.040.040.040.040.040.040.040.040.040.040.040.090.150.150.150.150.150.15
SOURCES: Congressional Budget Office compilation of data from Congressional Research Service, Fed-eral Excise Taxes on Alcoholic Beverages (January 30,1989); Joint Committee on Taxation,Schedule of Present Excise Taxes (as of January 1, 1990) (February 2, 1990); Joint Com-mittee on Taxation, Background and Description of Present Federal Excise Taxes (June 25,1982); Department of Transportation, Federal Highway Administration, Highway Statistics1988 (1989); and Economic Report of the President (February 1990).
a. The tax rates shown for motor fuels do not include the $0.001 per gallon tax dedicated to theLeaking Underground Storage Tank Trust Fund, which became effective January 1,1987.
(Continued)
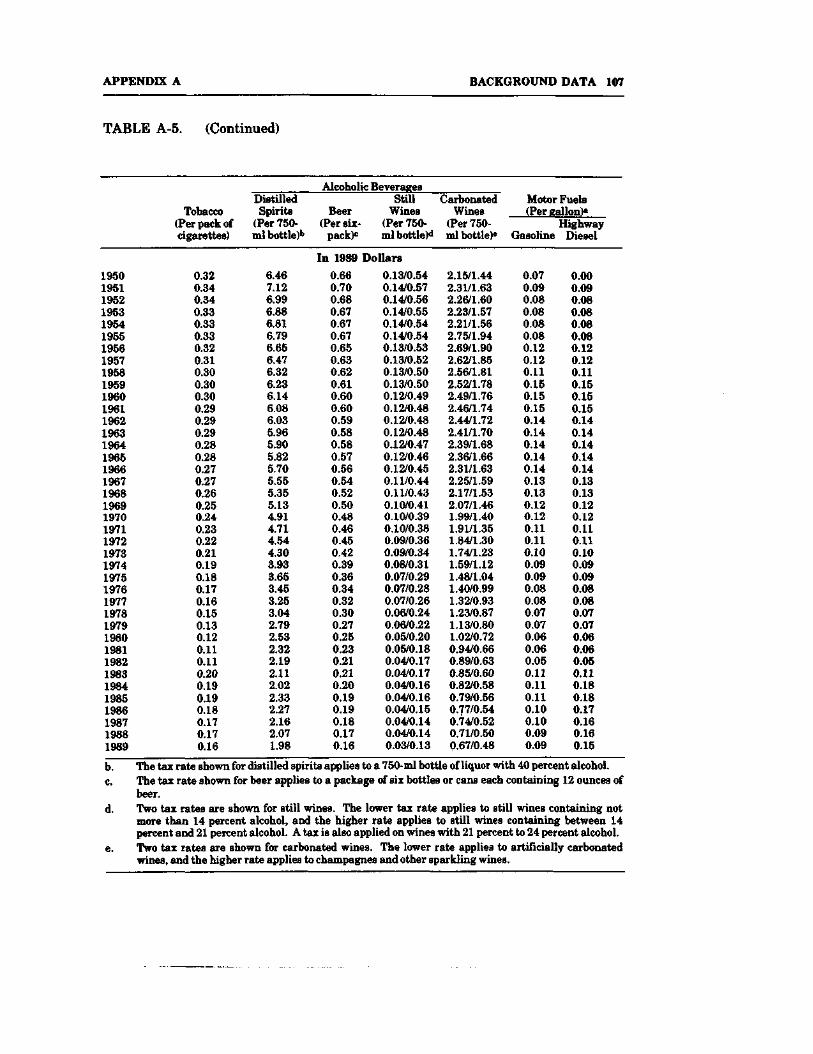
APPENDIX A BACKGROUND DATA 107
TABLE A-5. (Continued)
Alcoholic Beverages
Tobacco(Per pack ofcigarettes)
Distilled Still CarbonatedSpirits Beer Wines Wines
(Per 750- (Per six- (Per 750- (Per 750-mlbottle)b pack)" ml bottle)* ml bottle)8
Motor Fuels(Per gallon)*
HighwayGasoline Diesel
In 1989 Dollars1950195119521953195419551956195719581959196019611962196319641965196619671968196919701971197219731974197519761977197819791980198119821983198419851986198719881989
0.320.340.340.330.330.330.320.310.300.300.300.290.290.290.280.280.270.270.260.250.240.230.220.210.190.180.170.160.150.130.120.110.110.200.190.190.180.170.170.16
6.467.126.996.886.816.796.656.476.326.236.146.086.035.965.905.825.705.555.355.134.914.714.544.303.933.653.453.253.042.792.532.322.192.112.022.332.272.162.071.98
0.660.700.680.670.670.670.650.630.620.610.600.600.590.580.580.570.560.540.520.500.480.460.450.420.390.360.340.320.300.270.250.230.210.210.200.190.190.180.170.16
0.13/0.540.14/0.570.14/0.560.14/0.550.14/0.540.14/0.540.13/0.530.13/0.520.13/0.500.13/0.500.12/0.490.12/0.480.12/0.480.12/0.480.12/0.470.12/0.460.12/0.450.11/0.440.11/0.430.10/0.410.10/0.390.10/0.380.09/0.360.09/0.340.08/0.310.07/0.290.07/0.280.07/0.260.06/0.240.06/0.220.05/0.200.05/0.180.04/0.170.04/0.170.04/0.160.04/0.160.04/0.150.04/0.140.04/0.140.03/0.13
2.15/1.442.31/1.632.26/1.602.23/1.572.21/1.562.75/1.942.69/1.902.62/1.852.56/1.812.52/1.782.49/1.762.46/1.742.44/1.722.41/1.702.39/1.682.36/1.662.31/1.632.25/1.592.17/1.532.07/1.461.99/1.401.91/1.351.84/1.301.74/1.231.59/1.121.48/1.041.40/0.991.32/0.931.23/0.871.13/0.801.02/0.720.94/0.660.89/0.630.85/0.600.82/0.580.79/0.560.77/0.540.74/0.520.71/0.500.67/0.48
0.070.090.080.080.080.080.120.120.110.150.150.150.140.140.140.140.140.130.130.120.120.110.110.100.090.090.080.080.070.070.060.060.050.110.110.110.100.100.090.09
0.000.090.080.080.080.080.120.120.110.150.150.150.140.140.140.140.140.130.130.120.120.110.110.100.090.090.080.080.070.070.060.060.050.110.180.180.170.160.160.15
b. The tax rate shown for distilled spirits applies to a 750-ml bottle of liquor with 40 percent alcohol.c. The tax rate shown for beer applies to a package of six bottles or cans each containing 12 ounces of
beer.d. Two tax rates are shown for still wines. The lower tax rate applies to still wines containing not
more than 14 percent alcohol, and the higher rate applies to still wines containing between 14percent and 21 percent alcohol. A tax is also applied on wines with 21 percent to 24 percent alcohol.
e. Two tax rates are shown for carbonated wines. The lower rate applies to artificially carbonatedwines, and the higher rate applies to champagnes and other sparkling wines.
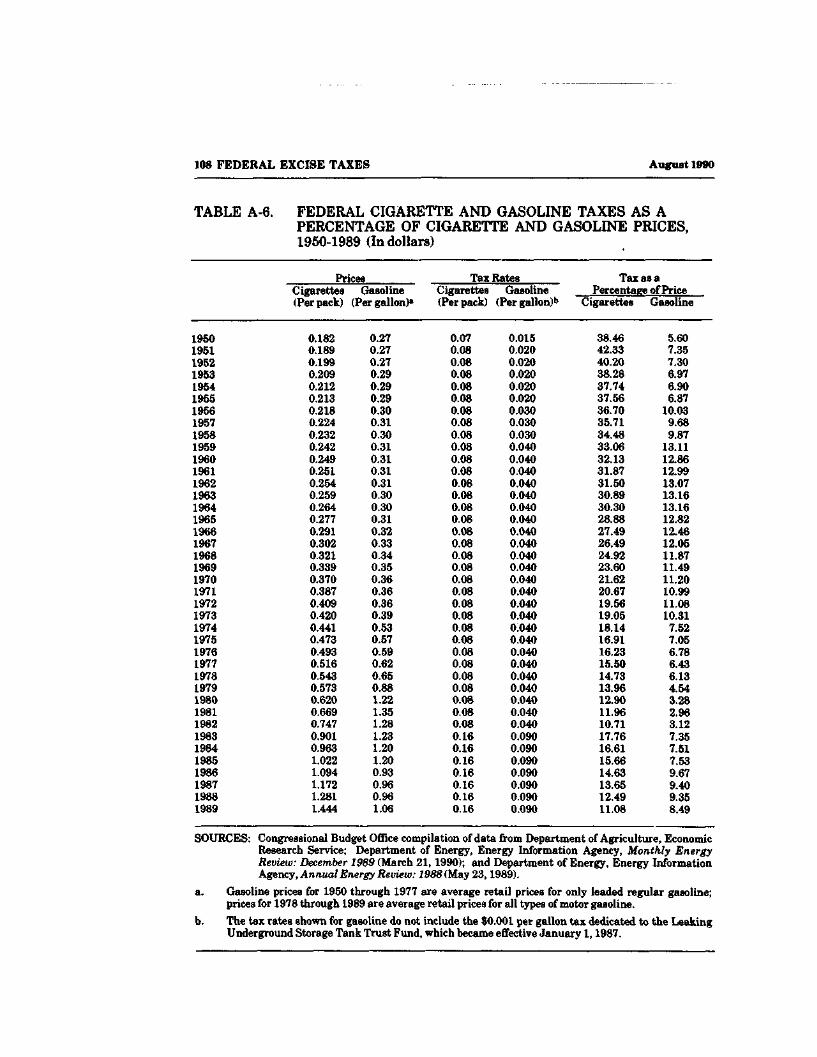
108 FEDERAL EXCISE TAXES August 1990
TABLE A-6. FEDERAL CIGARETTE AND GASOLINE TAXES AS APERCENTAGE OF CIGARETTE AND GASOLINE PRICES,1950-1989 (In dollars)
Prices Tax Rates Tax as aCigarettes Gasoline(Per pack) (Per gallon)*
1950195119521953195419551956195719581959196019611962196319641965196619671968196919701971197219731974197519761977197819791980198119821983198419851986198719881989
0.1820.1890.1990.2090.2120.2130.2180.2240.2320.2420.2490.2510.2540.2590.2640.2770.2910.3020.3210.3390.3700.3870.4090.4200.4410.4730.4930.5160.5430.5730.6200.6690.7470.9010.9631.0221.0941.1721.2811.444
0.270.270.270.290.290.290.300.310.300.310.310.310.310.300.300.310.320.330.340.350.360.360.360.390.530.570.590.620.650.881.221.351.281.231.201.200.930.960.961.06
Cigarettes(Per pack)
0.070.080.080.080.080.080.080.080.080.080.080.080.080.080.080.080.080.080.080.080.080.080.080.080.080.080.080.080.080.080.080.080.080.160.160.160.160.160.160.16
Gasoline(Pergallon)b
0.0150.0200.0200.0200.0200.0200.0300.0300.0300.0400.0400.0400.0400.0400.0400.0400.0400.0400.0400.0400.0400.0400.0400.0400.0400.0400.0400.0400.0400.0400.0400.0400.0400.0900.0900.0900.0900.0900.0900.090
Percentage of PriceCigarettes
38.4642.3340.2038.2837.7437.5636.7035.7134.4833.0632.1331.8731.5030.8930.3028.8827.4926.4924.9223.6021.6220.6719.5619.0518.1416.9116.2315.5014.7313.9612.9011.9610.7117.7616.6115.6614.6313.6512.4911.08
Gasoline
5.607.357.306.976.906.87
10.039.689.87
13.1112.8612.9913.0713.1613.1612.8212.4612.0511.8711.4911.2010.9911.0810.317.527.056.786.436.134.543.282.963.127.357.517.539.679.409.358.49
SOURCES: Congressional Budget Office compilation of data from Department of Agriculture, EconomicResearch Service; Department of Energy, Energy Information Agency, Monthly EnergyReview: December 1989 (March 21,1990); and Department of Energy, Energy InformationAgency, Annual Energy Review: 1988 (May 23,1989).
a. Gasoline prices for 1950 through 1977 are average retail prices for only leaded regular gasoline;prices for 1978 through 1989 are average retail prices for all types of motor gasoline.
b. The tax rates shown for gasoline do not include the $0.001 per gallon tax dedicated to the LeakingUnderground Storage Tank Trust Fund, which became effective January 1,1987.
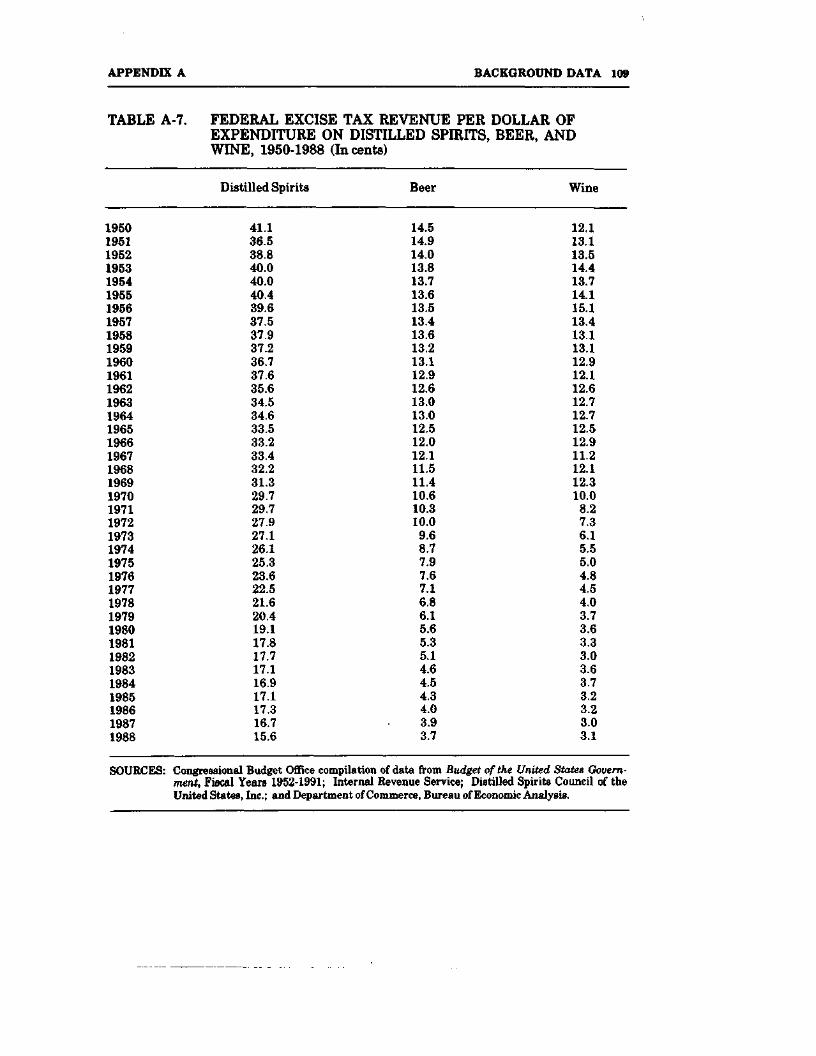
APPENDIX A BACKGROUND DATA 109
TABLE A-7. FEDERAL EXCISE TAX REVENUE PER DOLLAR OFEXPENDITURE ON DISTILLED SPIRITS, BEER, ANDWINE, 1950-1988 (In cents)
195019511952195319541955195619571958195919601961196219631964196519661967196819691970197119721973197419751976197719781979198019811982198319841985198619871988
Distilled Spirits
41.136.538.840.040.040.439.637.537.937.236.737.635.634.534.633.533.233.432.231.329.729.727.927.126.125.323.622.521.620.419.117.817.717.116.917.117.316.715.6
Beer
14.514.914.013.813.713.613.513.413.613.213.112.912.613.013.012.512.012.111.511.410.610.310.09.68.77.97.67.16.86.15.65.35.14.64.54.34.03.93.7
Wine
12.113.113.514.413.714.115.113.413.113.112.912.112.612.712.712.512.911.212.112.310.08.27.36.15.55.04.84.54.03.73.63.33.03.63.73.23.23.03.1
SOURCES: Congressional Budget Office compilation of data from Budget of the United States Govern-ment, Fiscal Years 1952-1991; Internal Revenue Service; Distilled Spirits Council of theUnited States, Inc.; and Department of Commerce, Bureau of Economic Analysis.
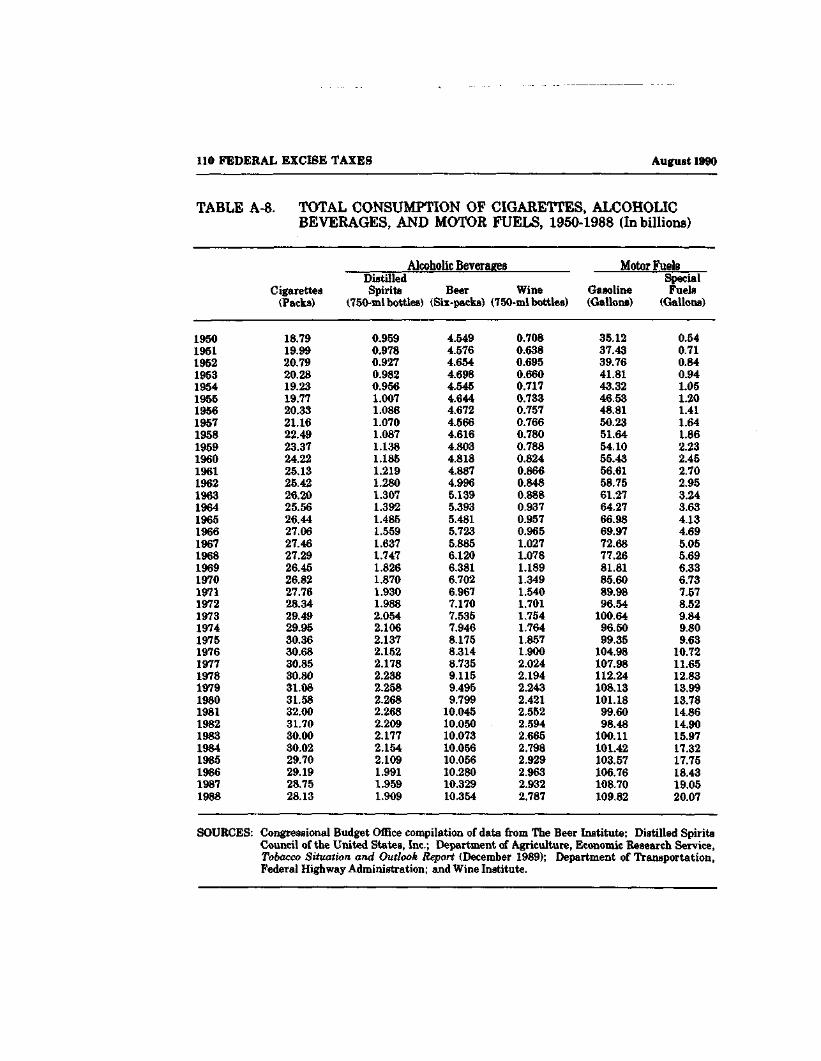
110 FEDERAL EXCISE TAXES August 1990
TABLE A-8. TOTAL CONSUMPTION OF CIGARETTES, ALCOHOLICBEVERAGES, AND MOTOR FUELS, 1950-1988 (In billions)
Alcoholic Beverages
195019511952195319541955195619571958195919601961196219631964196519661967196819691970197119721973197419751976197719781979198019811982198319841985198619871988
Cigarettes(Packs)
18.7919.9920.7920.2819.2319.7720.3321.1622.4923.3724.2225.1325.4226.2025.5626.4427.0627.4627.2926.4526.8227.7628.3429.4929.9530.3630.6830.8530.8031.0831.5832.0031.7030.0030.0229.7029.1928.7528.13
DistilledSpirits Beer Wine
(750-ml bottles) (Six-packs) (750-ml bottles)
0.9590.9780.9270.9820.9561.0071.0861.0701.0871.1381.1851.2191.2801.3071.3921.4851.5591.6371.7471.8261.8701.9301.9882.0542.1062.1372.1522.1782.2382.2582.2682.2682.2092.1772.1542.1091.9911.9591.909
4.5494.5764.6544.6984.5454.6444.6724.5664.6164.8034.8184.8874.9965.1395.3935.4815.7235.8856.1206.3816.7026.9677.1707.5357.9468.1758.3148.7359.1159.4959.79910.04510.05010.07310.05610.05610.28010.32910.354
0.7080.6380.6950.6600.7170.7330.7570.7660.7800.7880.8240.8660.8480.8880.9370.9570.9651.0271.0781.1891.3491.5401.7011.7541.7641.8571.9002.0242.1942.2432.4212.5522.5942.6652.7982.9292.9632.9322.787
Motor Fuels
Gasoline(Gallons)
35.1237.4339.7641.8143.3246.5348.8150.2351.6454.1055.4356.6158.7561.2764.2766.9869.9772.6877.2681.8185.6089.9896.54100.6496.5099.35104.98107.98112.24108.13101.1899.6098.48100.11101.42103.57106.76108.70109.82
SpecialFuels
(Gallons)
0.540.710.840.941.051.201.411.641.862.232.452.702.953.243.634.134.695.055.696.336.737.578.529.849.809.6310.7211.6512.8313.9913.7814.8614.9015.9717.3217.7518.4319.0520.07
SOURCES: Congressional Budget Office compilation of data from The Beer Institute; Distilled SpiritsCouncil of the United States, Inc.; Department of Agriculture, Economic Research Service,Tobacco Situation and Outlook Report (December 1989); Department of Transportation,Federal Highway Administration; and Wine Institute.
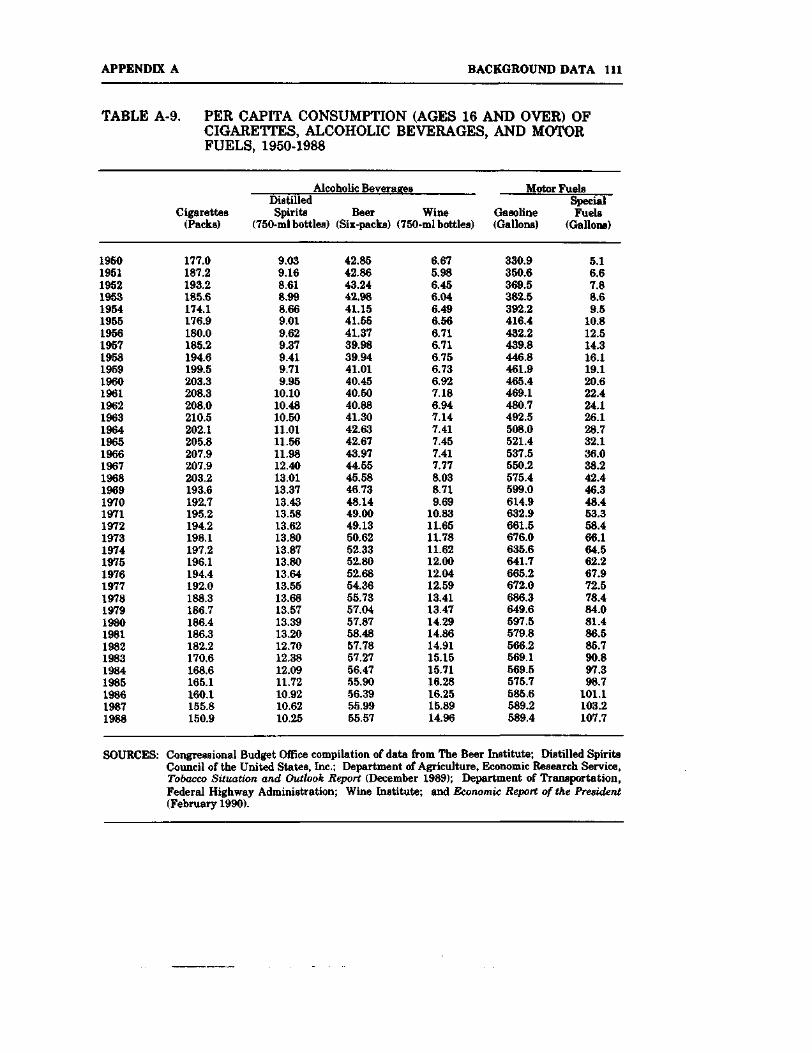
APPENDIX A BACKGROUND DATA 111
TABLE A-9. PER CAPITA CONSUMPTION (AGES 16 AND OVER) OFCIGARETTES, ALCOHOLIC BEVERAGES, AND MOTORFUELS, 1950-1988
Alcoholic Beverages
195019511952195319541955195619571958195919601961196219631964196519661967196819691970197119721973197419751976197719781979198019811982198319841985198619871988
Cigarettes(Packs)
177.0187.2193.2185.6174.1176.9180.0185.2194.6199.5203.3208.3208.0210.5202.1205.8207.9207.9203.2193.6192.7195.2194.2198.1197.2196.1194.4192.0188.3186.7186.4186.3182.2170.6168.6165.1160.1155.8150.9
DistilledSpirits Beer Wine
(750-ml bottles) (Six-packs) (750-ml bottles)
9.039.168.618.998.669.019.629.379.419.719.95
10.1010.4810.5011.0111.5611.9812.4013.0113.3713.4313.5813.6213.8013.8713.8013.6413.5513.6813.5713.3913.2012.7012.3812.0911.7210.9210.6210.25
42.8542.8643.2442.9841.1541.5541.3739.9839.9441.0140.4540.5040.8841.3042.6342.6743.9744.5545.5846.7348.1449.0049.1350.6252.3352.8052.6854.3655.7357.0457.8758.4857.7857.2756.4755.9056.3955.9955.57
6.675.986.456.046.496.566.716.716.756.736.927.186.947.147.417.457.417.778.038.719.69
10.8311.6511.7811.6212.0012.0412.5913.4113.4714.2914.8614.9115.1515.7116.2816.2515.8914.96
Motor Fuels
Gasoline(Gallons)
330.9350.6369.5382.5392.2416.4432.2439.8446.8461.9465.4469.1480.7492.5508.0521.4537.5550.2575.4599.0614.9632.9661.5676.0635.6641.7665.2672.0686.3649.6597.5579.8566.2569.1569.5575.7585.6589.2589.4
SpecialFuels
(Gallons)
5.16.67.88.69.5
10.812.514.316.119.120.622.424.126.128.732.136.038.242.446.348.453.358.466.164.562.267.972.578.484.081.486.585.790.897.398.7
101.1103.2107.7
SOURCES: Congressional Budget Office compilation of data from The Beer Institute; Distilled SpiritsCouncil of the United States, Inc.; Department of Agriculture, Economic Research Service,Tobacco Situation and Outlook Report (December 1989); Department of Transportation,Federal Highway Administration; Wine Institute; and Economic Report of the President(February 1990).
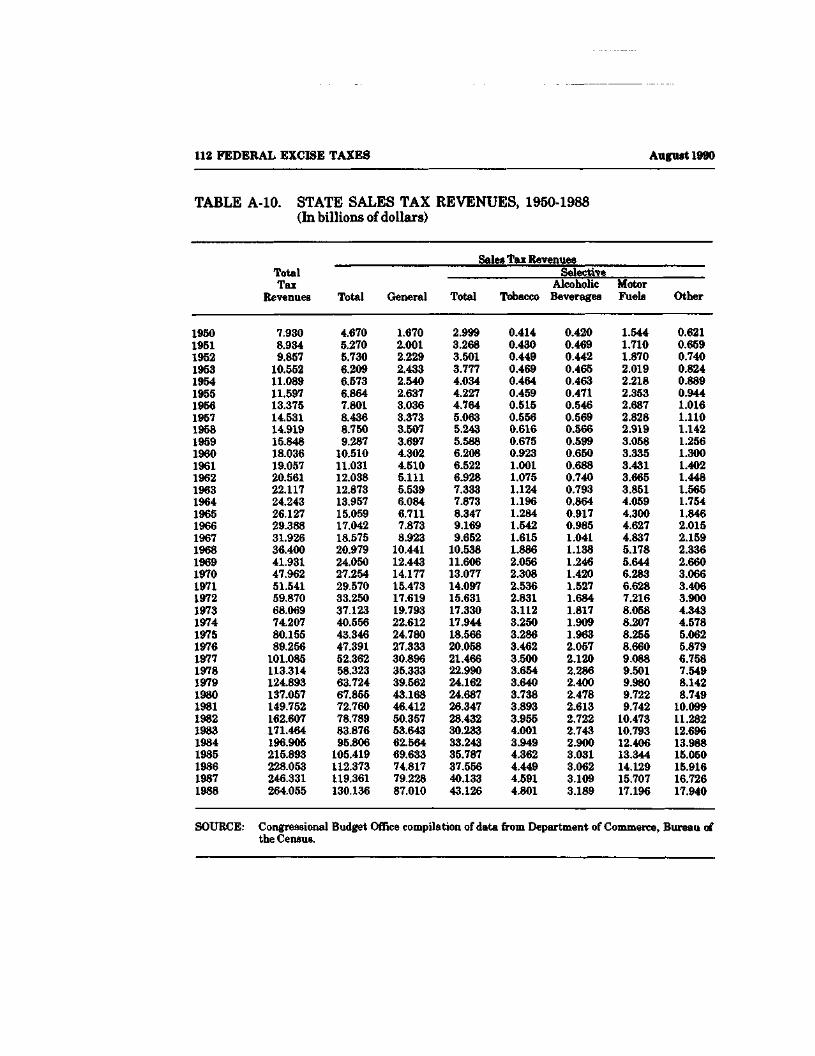
112 FEDERAL EXCISE TAXES August 1990
TABLE A-10. STATE SALES TAX REVENUES, 1950-1988(In billions of dollars)
Sales Tax Revenues
195019511952195319541955195619571958195919601961196219631964196519661967196819691970197119721973197419751976197719781979198019811982198319841985198619871988
TotalTax
Revenues
7.9308.9349.85710.55211.08911.59713.37514.53114.91915.84818.03619.05720.56122.11724.24326.12729.38831.92636.40041.93147.96251.54159.87068.06974.20780.15589.256101.085113.314124.893137.057149.752162.607171.464196.905215.893228.053246.331264.055
Total
4.6705.2705.7306.2096.5736.8647.8018.4368.7509.28710.51011.03112.03812.87313.95715.05917.04218.57520.97924.05027.25429.57033.25037.12340.55643.34647.39152.36258.32363.72467.85572.76078.78983.87695.806105.419112.373119.361130.136
General
1.6702.0012.2292.4332.5402.6373.0363.3733.5073.6974.3024.5105.1115.5396.0846.7117.8738.92310.44112.44314.17715.47317.61919.79322.61224.78027.33330.89635.33339.56243.16846.41250.35753.64362.56469.63374.81779.22887.010
Total
2.9993.2683.5013.7774.0344.2274.7645.0635.2435.5886.2086.5226.9287.3337.8738.3479.1699.65210.53811.60613.07714.09715.63117.33017.94418.56620.05821.46622.99024.16224.68726.34728.43230.23333.24335.78737.55640.13343.126
SelectiveAlcoholic
Tobacco Beverages
0.4140.4300.4490.4690.4640.4590.5150.5560.6160.6750.9231.0011.0751.1241.1961.2841.5421.6151.8862.0562.3082.5362.8313.1123.2503.2863.4623.5003.6543.6403.7383.8933.9554.0013.9494.3624.4494.5914.801
0.4200.4690.4420.4650.4630.4710.5460.5690.5660.5990.6500.6880.7400.7930.8640.9170.9851.0411.1381.2461.4201.5271.6841.8171.9091.9632.0572.1202.2862.4002.4782.6132.7222.7432.9003.0313.0623.1093.189
MotorFuels
1.5441.7101.8702.0192.2182.3532.6872.8282.9193.0583.3353.4313.6653.8514.0594.3004.6274.8375.1785.6446.2836.6287.2168.0588.2078.2558.6609.0889.5019.9809.7229.74210.47310.79312.40613.34414.12915.70717.196
Other
0.6210.6590.7400.8240.8890.9441.0161.1101.1421.2561.3001.4021.4481.5651.7541.8462.0152.1592.3362.6603.0663.4063.9004.3434.5785.0625.8796.7587.5498.1428.74910.09911.28212.69613.98815.05015.91616.72617.940
SOURCE: Congressional Budget Office compilation of data from Department of Commerce, Bureau ofthe Census.
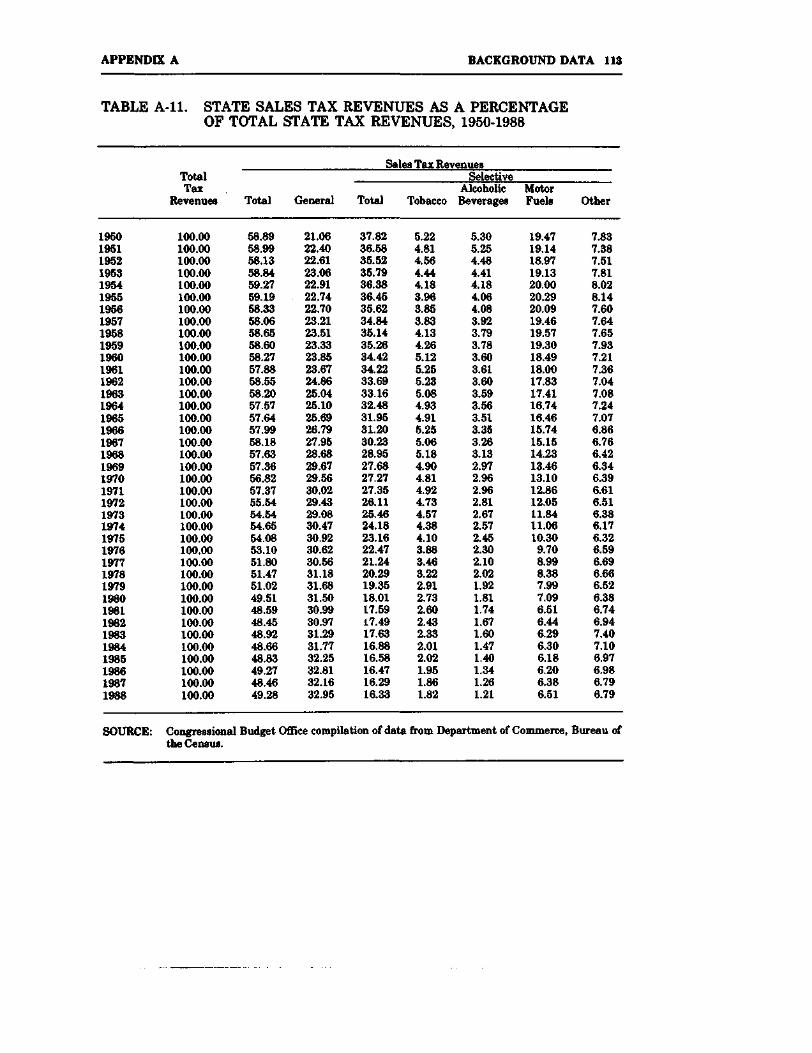
APPENDIX A BACKGROUND DATA 113
TABLE A-ll. STATE SALES TAX REVENUES AS A PERCENTAGEOF TOTAL STATE TAX REVENUES, 1950-1988
Sales Tax Revenues
195019511952195319541955195619571958195919601961196219631964196519661967196819691970197119721973197419751976197719781979198019811982198319841985198619871988
TotalTax
Revenues
100.00100.00100.00100.00100.00100.00100.00100.00100.00100.00100.00100.00100.00100.00100.00100.00100.00100.00100.00100.00100.00100.00100.00100.00100.00100.00100.00100.00100.00100.00100.00100.00100.00100.00100.00100.00100.00100.00100.00
Total
58.8958.9958.1358.8459.2759.1958.3358.0658.6558.6058.2757.8858.5558.2057.5757.6457.9958.1857.6357.3656.8257.3755.5454.5454.6554.0853.1051.8051.4751.0249.5148.5948.4548.9248.6648.8349.2748.4649.28
General
21.0622.4022.6123.0622.9122.7422.7023.2123.5123.3323.8523.6724.8625.0425.1025.6926.7927.9528.6829.6729.5630.0229.4329.0830.4730.9230.6230.5631.1831.6831.5030.9930.9731.2931.7732.2532.8132.1632.95
Total
37.8236.5835.5235.7936.3836.4535.6234.8435.1435.2634.4234.2233.6933.1632.4831.9531.2030.2328.9527.6827.2727.3526.1125.4624.1823.1622.4721.2420.2919.3518.0117.5917.4917.6316.8816.5816.4716.2916.33
Tobacco
5.224.814.564.444.183.963.853.834.134.265.125.255.235.084.934.915.255.065.184.904.814.924.734.574.384.103.883.463.222.912.732.602.432.332.012.021.951.861.82
SelectiveAlcoholicBeverages
5.305.254.484.414.184.064.083.923.793.783.603.613.603.593.563.513.353.263.132.972.962.962.812.672.572.452.302.102.021.921.811.741.671.601.471.401.341.261.21
MotorFuels
19.4719.1418.9719.1320.0020.2920.0919.4619.5719.3018.4918.0017.8317.4116.7416.4615.7415.1514.2313.4613.1012.8612.0511.8411.0610.309.708.998.387.997.096.516.446.296.306.186.206.386.51
Other
7.837.387.517.818.028.147.607.647.657.937.217.367.047.087.247.076.866.766.426.346.396.616.516.386.176.326.596.696.666.526.386.746.947.407.106.976.986.796.79
SOURCE: Congressional Budget Office compilation of data from Department of Commerce, Bureau ofthe Census.
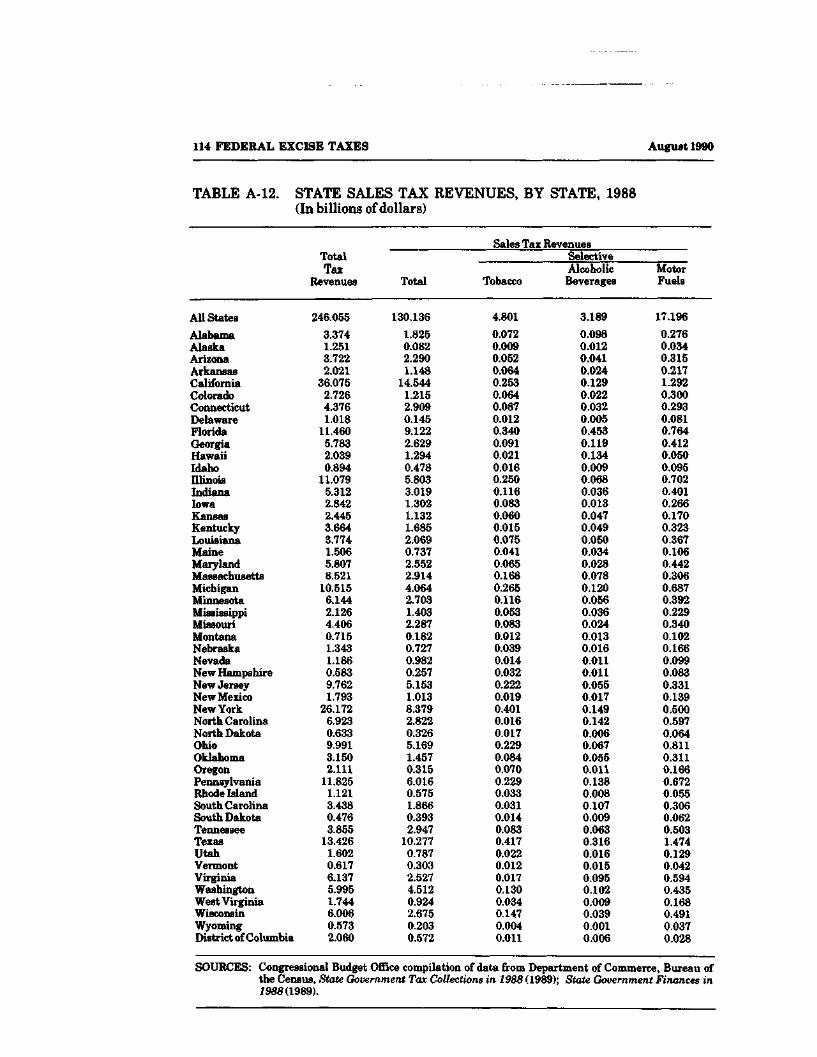
114 FEDERAL EXCISE TAXES August 1990
TABLE A-12. STATE SALES TAX REVENUES, BY STATE, 1988(In billions of dollars)
Sales Tax Revenues
All States
AlabamaAlaskaArizonaArkansasCaliforniaColoradoConnecticutDelawareFloridaGeorgiaHawaiiIdahoIllinoisIndianaIowaKansasKentuckyLouisianaMaineMarylandMassachusettsMichiganMinnesotaMississippiMissouriMontanaNebraskaNevadaNew HampshireNew JerseyNew MexicoNew YorkNorth CarolinaNorth DakotaOhioOklahomaOregonPennsylvaniaRhode IslandSouth CarolinaSouth DakotaTennesseeTexasUtahVermontVirginiaWashingtonWest VirginiaWisconsinWyomingDistrict of Columbia
TotalTax
Revenues
246.055
3.3741.2513.7222.021
36.0752.7264.3761.018
11.4605.7832.0390.894
11.0795.3122.8422.4453.6643.7741.5065.8078.521
10.5156.1442.1264.4060.7151.3431.1860.5839.7621.793
26.1726.9230.6339.9913.1502.111
11.8251.1213.4380.4763.855
13.4261.6020.6176.1375.9951.7446.0060.5732.060
Total
130.136
1.8250.0822.2901.148
14.5441.2152.9090.1459.1222.6291.2940.4785.8033.0191.3021.1321.6852.0690.7372.5522.9144.0642.7031.4032.2870.1820.7270.9820.2575.1531.0138.3792.8220.3265.1691.4570.3156.0160.5751.8660.3932.947
10.2770.7870.3032.5274.5120.9242.6750.2030.572
Tobacco
4.8010.0720.0090.0520.0640.2530.0640.0870.0120.3400.0910.0210.0160.2500.1160.0830.0600.0150.0750.0410.0650.1680.2650.1160.0530.0830.0120.0390.0140.0320.2220.0190.4010.0160.0170.2290.0840.0700.2290.0330.0310.0140.0830.4170.0220.0120.0170.1300.0340.1470.0040.011
SelectiveAlcoholicBeverages
3.1890.0980.0120.0410.0240.1290.0220.0320.0050.4530.1190.1340.0090.0680.0360.0130.0470.0490.0500.0340.0280.0780.1200.0560.0360.0240.0130.0160.0110.0110.0550.0170.1490.1420.0060.0670.0550.0110.1380.0080.1070.0090.0630.3160.0160.0150.0950.1020.0090.0390.0010.006
MotorFuels
17.196
0.2760.0340.3150.2171.2920.3000.2930.0810.7640.4120.0500.0950.7020.4010.2660.1700.3230.3670.1060.4420.3060.6870.3920.2290.3400.1020.1660.0990.0830.3310.1390.5000.5970.0640.8110.3110.1660.6720.0550.3060.0620.5031.4740.1290.0420.5940.4350.1680.4910.0370.028
SOURCES: Congressional Budget Office compilation of data from Department of Commerce, Bureau ofthe Census, State Government Tax Collections in 1988 (1989); State Government Finances in1988(1989).
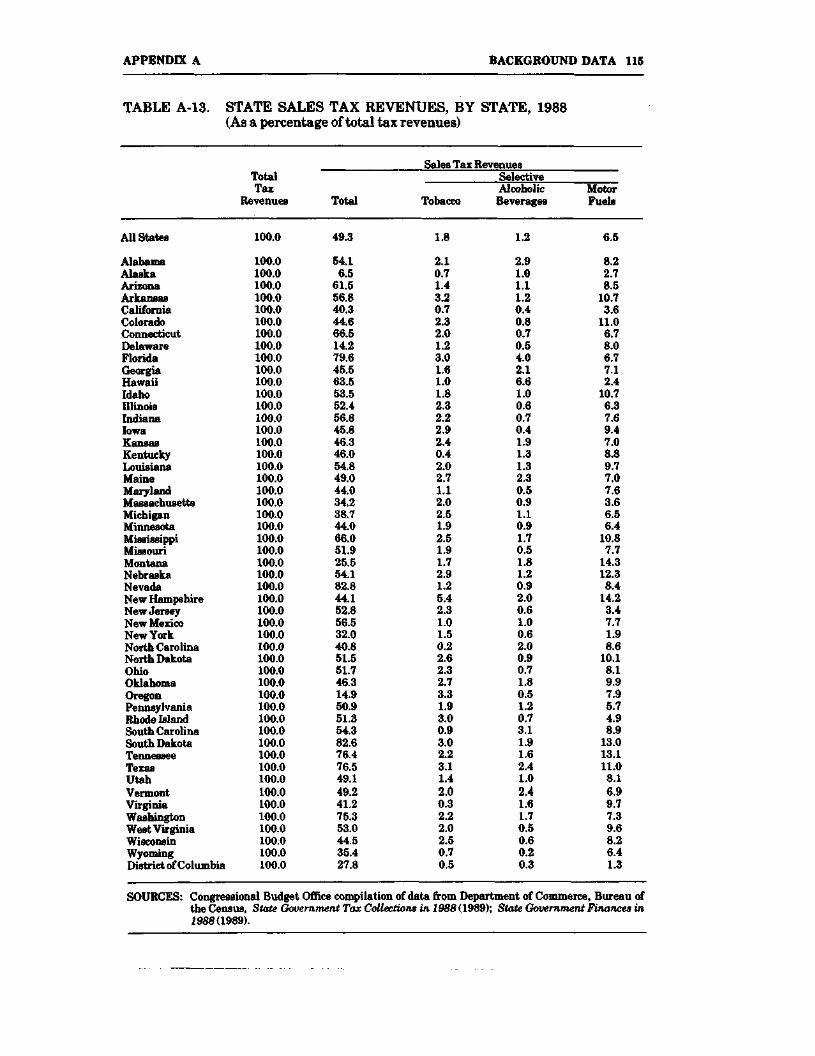
APPENDIX A BACKGROUND DATA 115
TABLE A-13. STATE SALES TAX REVENUES, BY STATE, 1988(As a percentage of total tax revenues)
Sales Tax Revenues
All States
AlabamaAlaskaArizonaArkansasCaliforniaColoradoConnecticutDelawareFloridaGeorgiaHawaiiIdahoIllinoisIndianaIowaKansasKentuckyLouisianaMaineMarylandMassachusettsMichiganMinnesotaMississippiMissouriMontanaNebraskaNevadaNew HampshireNew JerseyNew MexicoNew YorkNorth CarolinaNorth DakotaOhioOklahomaOregonPennsylvaniaRhode IslandSouth CarolinaSouth DakotaTennesseeTexasUtahVermontVirginiaWashingtonWest VirginiaWisconsinWyomingDistrict of Columbia
TotalTax
Revenues
100.0
100.0100.0100.0100.0100.0100.0100.0100.0100.0100.0100.0100.0100.0100.0100.0100.0100.0100.0100.0100.0100.0100.0100.0100.0100.0100.0100.0100.0100.0100.0100.0100.0100.0100.0100.0100.0100.0100.0100.0100.0100.0100.0100.0100.0100.0100.0100.0100.0100.0100.0100.0
Total
49.3
54.16.5
61.556.840.344.666.514.279.645.563.553.552.456.845.846.346.054.849.044.034.238.744.066.051.925.554.182.844.152.856.532.040.851.551.746.314.950.951.354.382.676.476.549.149.241.275.353.044.535.427.8
Tobacco
1.8
2.10.71.43.20.72.32.01.23.01.61.01.82.32.22.92.40.42.02.71.12.02.51.92.51.91.72.91.25.42.31.01.50.22.62.32.73.31.93.00.93.02.23.11.42.00.32.22.02.50.70.5
SelectiveAlcoholicBeverages
1.2
2.91.01.11.20.40.80.70.54.02.16.61.00.60.70.41.91.31.32.30.50.91.10.91.70.51.81.20.92.00.61.00.62.00.90.71.80.51.20.73.11.91.62.41.02.41.61.70.50.60.20.3
MotorFuels
6.5
8.22.78.5
10.73.6
11.06.78.06.77.12.4
10.76.37.69.47.08.89.77.07.63.66.56.4
10.87.7
14.312.38.4
14.23.47.71.98.6
10.18.19.97.95.74.98.9
13.013.111.08.16.99.77.39.68.26.41.3
SOURCES: Congressional Budget Office compilation of data from Department of Commerce, Bureau ofthe Census, State Government Tax Collections in 1988 (1989); State Government Finances in1988(1989).
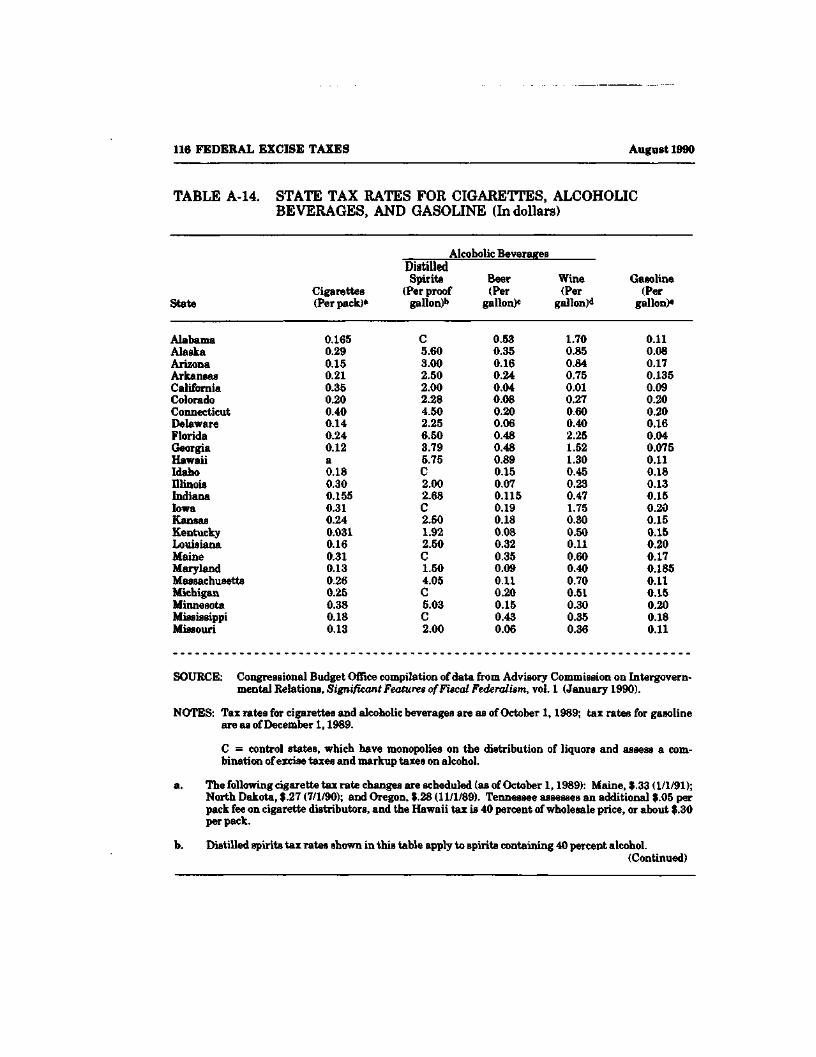
116 FEDERAL EXCISE TAXES August 1990
TABLE A-14. STATE TAX RATES FOR CIGARETTES, ALCOHOLICBEVERAGES, AND GASOLINE (In dollars)
Alcoholic Beverages
State
AlabamaAlaskaArizonaArkansasCaliforniaColoradoConnecticutDelawareFloridaGeorgiaHawaiiIdahoIllinoisIndianaIowaKansasKentuckyLouisianaMaineMarylandMassachusettsMichiganMinnesotaMississippiMissouri
Cigarettes(Perpack)«
0.1650.290.150.210.350.200.400.140.240.12a0.180.300.1550.310.240.0310.160.310.130.260.250.380.180.13
DistilledSpirits
(Per proofgallon)b
C5.603.002.502.002.284.502.256.503.795.75C2.002.68C2.501.922.50C1.504.05C5.03C2.00
Beer(Per
gallon)'
0.530.350.160.240.040.080.200.060.480.480.890.150.070.1150.190.180.080.320.350.090.110.200.150.430.06
Wine(Per
gallon)11
1.700.850.840.750.010.270.600.402.251.521.300.450.230.471.750.300.500.110.600.400.700.510.300.350.36
Gasoline(Per
gallon)6
0.110.080.170.1350.090.200.200.160.040.0750.110.180.130.150.200.150.150.200.170.1850.110.150.200.180.11
SOURCE: Congressional Budget Office compilation of data from Advisory Commission on Intergovern-mental Relations, Significant Features of Fiscal Federalism, vol. 1 (January 1990).
NOTES: Tax rates for cigarettes and alcoholic beverages are as of October 1,1989; tax rates for gasolineare as of December 1,1989.
C = control states, which have monopolies on the distribution of liquors and assess a com-bination of excise taxes and markup taxes on alcohol.
a. The following cigarette tax rate changes are scheduled (as of October 1,1989): Maine, $.33 (1/1/91);North Dakota, $.27 (7/1/90); and Oregon, $.28 (11/1/89). Tennessee assesses an additional $.05 perpack fee on cigarette distributors, and the Hawaii tax is 40 percent of wholesale price, or about $.30per pack.
b. Distilled spirits tax rates shown in this table apply to spirits containing 40 percent alcohol.(Continued)
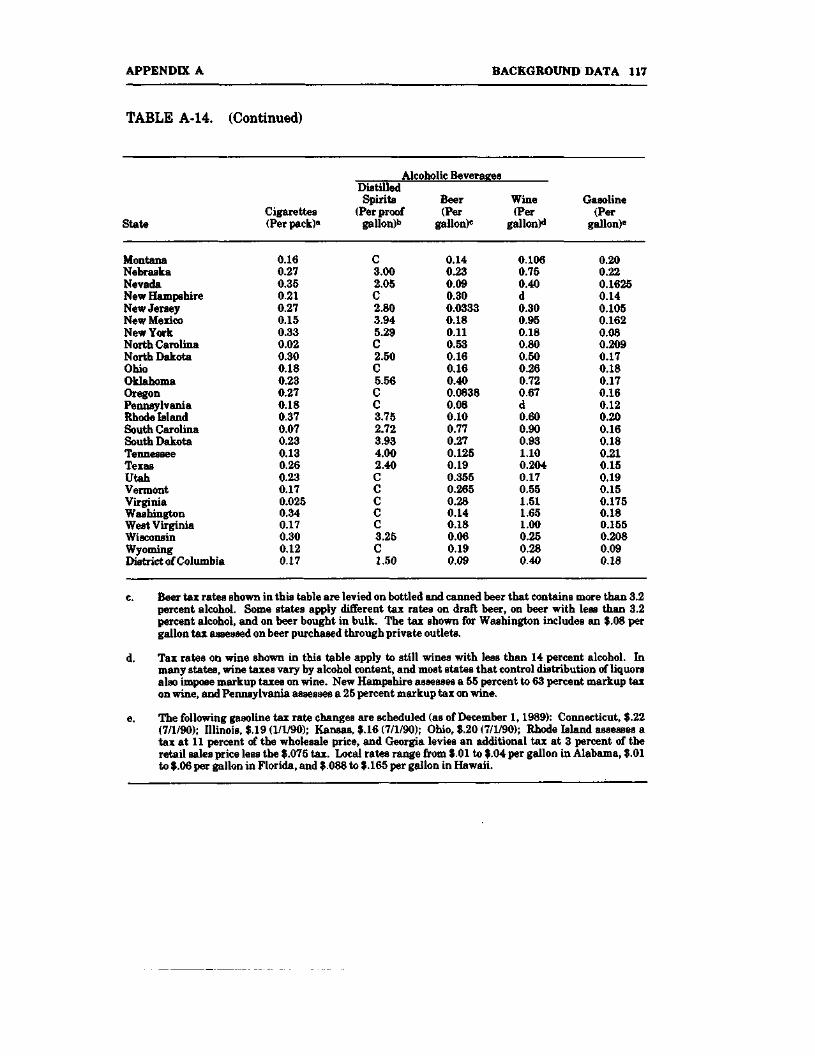
APPENDIX A BACKGROUND DATA 117
TABLE A-14. (Continued)
Alcoholic Beverages
State
MontanaNebraskaNevadaNew HampshireNew JerseyNew MexicoNew YorkNorth CarolinaNorth DakotaOhioOklahomaOregonPennsylvaniaRhode IslandSouth CarolinaSouth DakotaTennesseeTexasUtahVermontVirginiaWashingtonWest VirginiaWisconsinWyomingDistrict of Columbia
Cigarettes(Per pack)*
0.160.270.350.210.270.150.330.020.300.180.230.270.180.370.070.230.130.260.230.170.0250.340.170.300.120.17
DistilledSpirits
(Per proofgallon)b
C3.002.05C2.803.945.29C2.50C5.56CC3.752.723.934.002.40CCCCC3.25C1.50
Beer(Per
gallon)0
0.140.230.090.300.03330.180.110.530.160.160.400.08380.080.100.770.270.1250.190.3550.2650.280.140.180.060.190.09
Wine(Per
gallon)d
0.1060.750.40d0.300.950.180.800.500.260.720.67d0.600.900.931.100.2040.170.551.511.651.000.250.280.40
Gasoline(Per
gallon)8
0.200.220.16250.140.1050.1620.080.2090.170.180.170.160.120.200.160.180.210.150.190.150.1750.180.1550.2080.090.18
c. Beer tax rates shown in this table are levied on bottled and canned beer that contains more than 3.2percent alcohol. Some states apply different tax rates on draft beer, on beer with less than 3.2percent alcohol, and on beer bought in bulk. The tax shown for Washington includes an $.08 pergallon tax assessed on beer purchased through private outlets.
d. Tax rates on wine shown in this table apply to still wines with less than 14 percent alcohol. Inmany states, wine taxes vary by alcohol content, and most states that control distribution of liquorsalso impose markup taxes on wine. New Hampshire assesses a 55 percent to 63 percent markup taxon wine, and Pennsylvania assesses a 25 percent markup tax on wine.
e. The following gasoline tax rate changes are scheduled (as of December 1,1989): Connecticut, $.22(7/1/90); Illinois, $.19 (1/1/90); Kansas, $.16 (7/1/90); Ohio, $.20 (7/1/90); Rhode Island assesses atax at 11 percent of the wholesale price, and Georgia levies an additional tax at 3 percent of theretail sales price less the $.075 tax. Local rates range from $.01 to $.04 per gallon in Alabama, $.01to $.06 per gallon in Florida, and $.088 to $.165 per gallon in Hawaii.
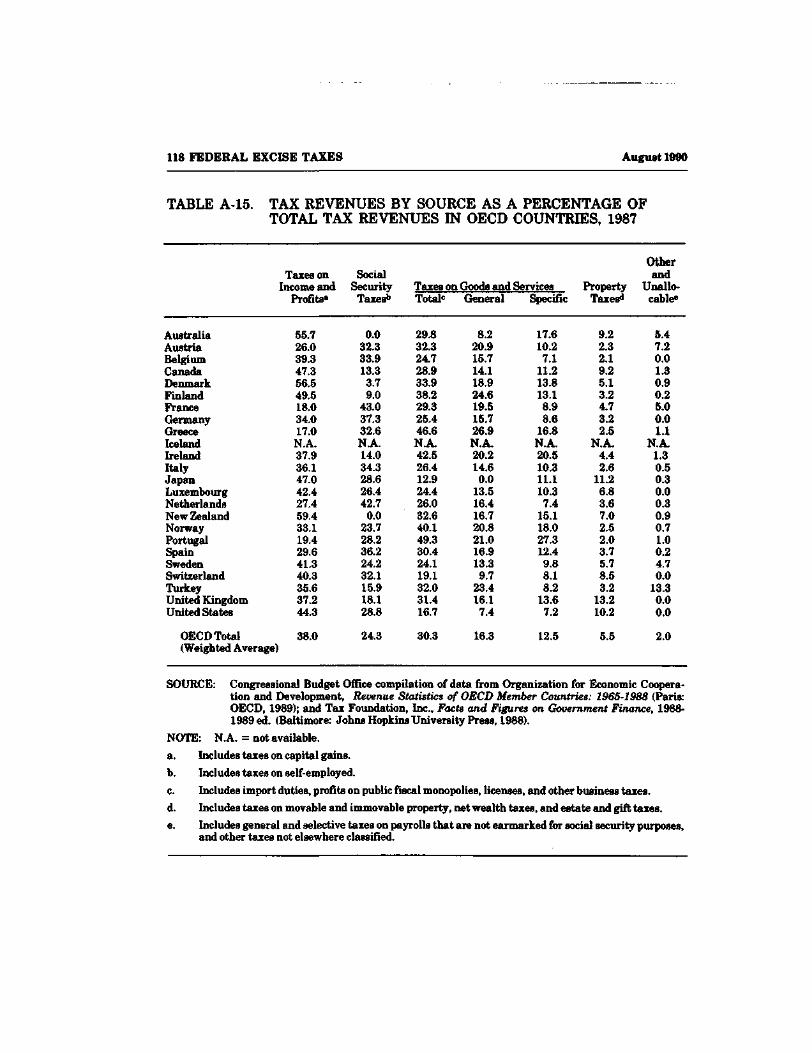
118 FEDERAL EXCISE TAXES August 1990
TABLE A-15. TAX REVENUES BY SOURCE AS A PERCENTAGE OFTOTAL TAX REVENUES IN OECD COUNTRIES, 1987
OtherTaxes on Social and
Income and Security Taxes on Goods and Services Property Unallo-Profits* Taxes'1 Total0 General Specific Taxes'1 cable6
AustraliaAustriaBelgiumCanadaDenmarkFinlandFranceGermanyGreeceIcelandIrelandItalyJapanLuxembourgNetherlandsNew ZealandNorwayPortugalSpainSwedenSwitzerlandTurkeyUnited KingdomUnited States
55.726.039.347.356.549.518.034.017.0N.A.37.936.147.042.427.459.433.119.429.641.340.335.637.244.3
0.032.333.913.33.79.0
43.037.332.6N.A.14.034.328.626.442.7
0.023.728.236.224.232.115.918.128.8
29.832.324.728.933.938.229.325.446.6N.A.42.526.412.924.426.032.640.149.330.424.119.132.031.416.7
8.220.915.714.118.924.619.515.726.9N.A.20.214.60.0
13.516.416.720.821.016.913.39.7
23.416.17.4
17.610.27.1
11.213.813.18.98.6
16.8N.A.20.510.311.110.37.4
15.118.027.312.49.88.18.2
13.67.2
9.22.32.19.25.13.24.73.22.5
N.A.4.42.6
11.26.83.67.02.52.03.75.78.53.2
13.210.2
5.47.20.01.30.90.25.00.01.1
N.A.1.30.50.30.00.30.90.71.00.24.70.0
13.30.00.0
OECD Total 38.0 24.3 30.3 16.3 12.5 5.5 2.0(Weighted Average)
SOURCE: Congressional Budget Office compilation of data from Organization for Economic Coopera-tion and Development, Revenue Statistics of OECD Member Countries: 1965-1988 (Paris:OECD, 1989); and Tax Foundation, Inc., Facts and Figures on Government Finance, 1988-1989 ed. (Baltimore: Johns Hopkins University Press, 1988).
NOTE: N.A. = not available.
a. Includes taxes on capital gains.
b. Includes taxes on self-employed.
c. Includes import duties, profits on public fiscal monopolies, licenses, and other business taxes.
d. Includes taxes on movable and immovable property, net wealth taxes, and estate and gift taxes.
e. Includes general and selective taxes on payrolls that are not earmarked for social security purposes,and other taxes not elsewhere classified.
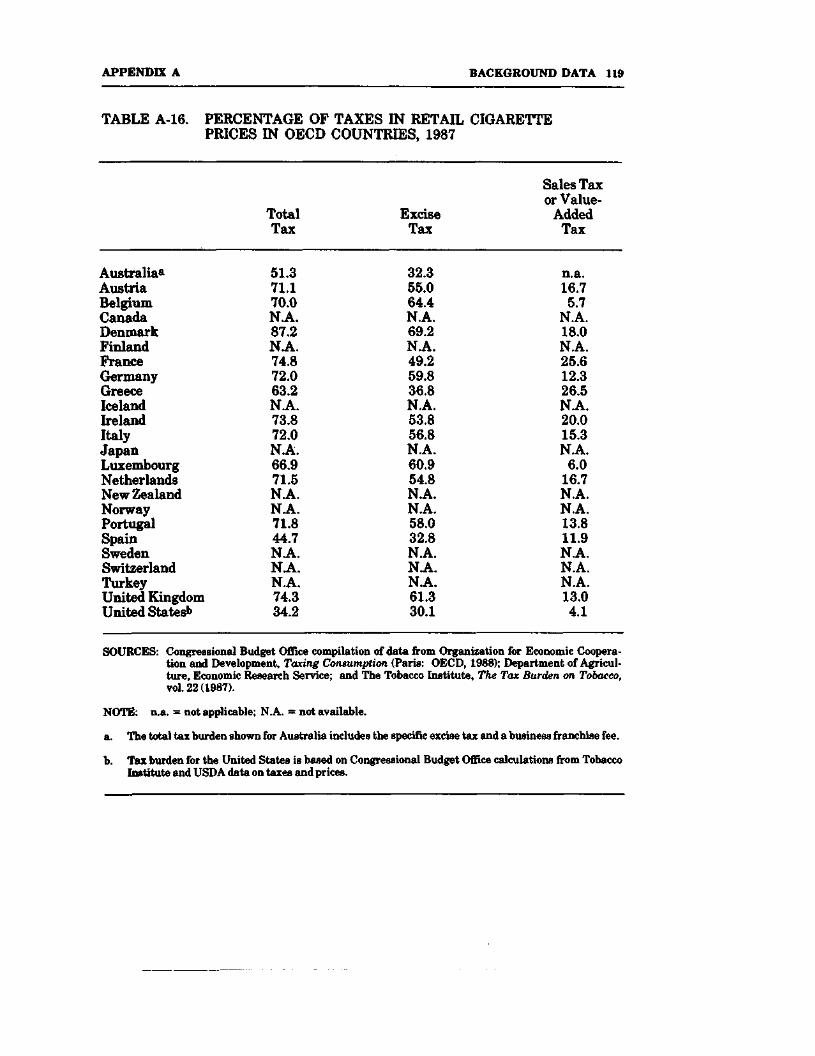
APPENDIX A BACKGROUND DATA 119
TABLE A-16. PERCENTAGE OF TAXES IN RETAIL CIGARETTEPRICES IN OECD COUNTRIES, 1987
Australia4
AustriaBelgiumCanadaDenmarkFinlandFranceGermanyGreeceIcelandIrelandItalyJapanLuxembourgNetherlandsNew ZealandNorwayPortugalSpainSwedenSwitzerlandTurkeyUnited KingdomUnited States^
TotalTax
51.371.170.0N.A.87.2N.A.74.872.063.2N.A.73.872.0N.A.66.971.5N.A.N.A.71.844.7N.A.N.A.N.A.74.334.2
ExciseTax
32.355.064.4N.A.69.2N.A.49.259.836.8N.A.53.856.8N.A.60.954.8N.A.N.A.58.032.8N.A.N.A.N.A.61.330.1
Sales Taxor Value-
AddedTax
n.a.16.75.7
N.A.18.0N.A.25.612.326.5N.A.20.015.3N.A.
6.016.7N.A.N.A.13.811.9N.A.N.A.N.A.13.04.1
SOURCES: Congressional Budget Office compilation of data from Organization for Economic Coopera-tion and Development, Taxing Consumption (Paris: OECD, 1988); Department of Agricul-ture, Economic Research Service; and The Tobacco Institute, The Tax Burden on Tobacco,vol. 22 (1987).
NOTE: n.a. = not applicable; N.A. = not available.
a. The total tax burden shown for Australia includes the specific excise tax and a business franchise fee.
b. Tax burden for the United States is based on Congressional Budget Office calculations from TobaccoInstitute and USDA data on taxes and prices.
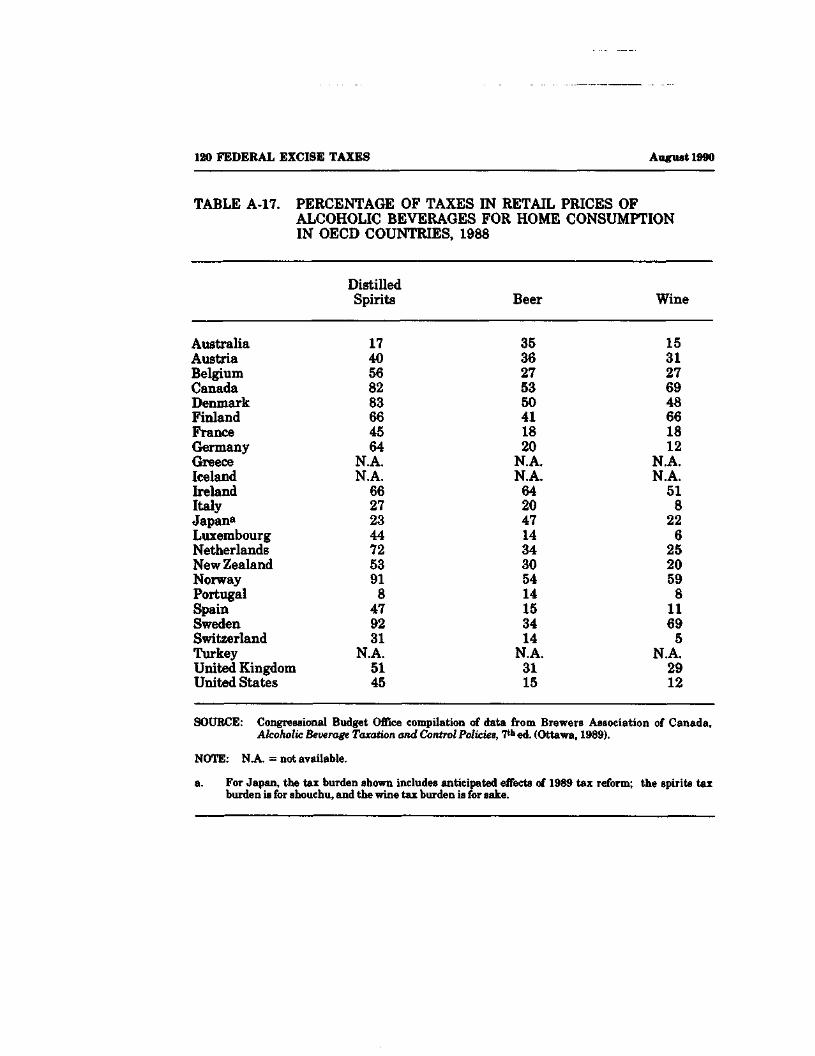
120 FEDERAL EXCISE TAXES August 1990
TABLE A-17. PERCENTAGE OF TAXES IN RETAIL PRICES OFALCOHOLIC BEVERAGES FOR HOME CONSUMPTIONIN OECD COUNTRIES, 1988
AustraliaAustriaBelgiumCanadaDenmarkFinlandFranceGermanyGreeceIcelandIrelandItalyJapana
LuxembourgNetherlandsNew ZealandNorwayPortugalSpainSwedenSwitzerlandTurkeyUnited KingdomUnited States
DistilledSpirits
1740568283664564
N.A.N.A.
662723447253918
479231
N.A.5145
Beer
3536275350411820
N.A.N.A.6420471434305414153414
N.A.3115
Wine
1531276948661812
N.A.N.A.
518
226
2520598
11695
N.A.2912
SOURCE: Congressional Budget Office compilation of data from Brewers Association of Canada,Akoholic Beverage Taxation and Control Policies, 7th ed. (Ottawa, 1989).
NOTE: N.A. = not available.
a. For Japan, the tax burden shown includes anticipated effects of 1989 tax reform; the spirits taxburden is for shouchu, and the wine tax burden is for sake.
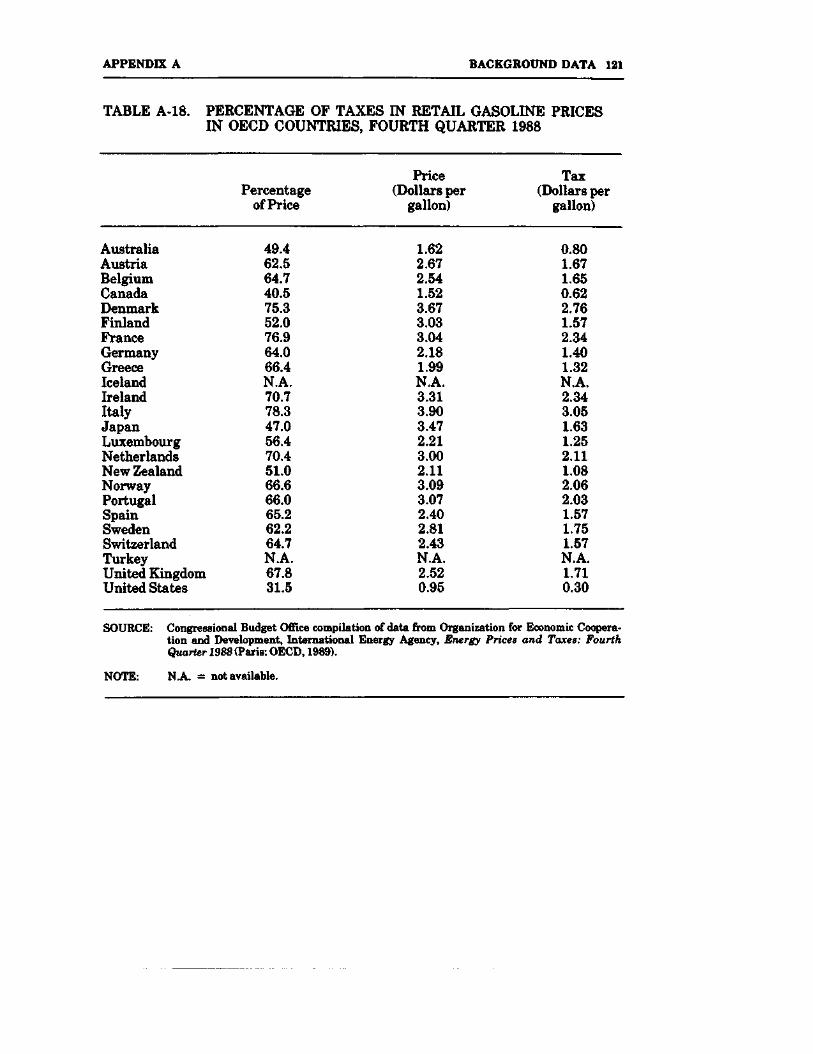
APPENDIX A BACKGROUND DATA 121
TABLE A-18. PERCENTAGE OF TAXES IN RETAIL GASOLINE PRICESIN OECD COUNTRIES, FOURTH QUARTER 1988
AustraliaAustriaBelgiumCanadaDenmarkFinlandFranceGermanyGreeceIcelandIrelandItalyJapanLuxembourgNetherlandsNew ZealandNorwayPortugalSpainSwedenSwitzerlandTurkeyUnited KingdomUnited States
Percentageof Price
49.462.564.740.575.352.076.964.066.4N.A.70.778.347.056.470.451.066.666.065.262.264.7N.A.67.831.5
Price(Dollars per
gallon)
1.622.672.541.523.673.033.042.181.99N.A.3.313.903.472.213.002.113.093.072.402.812.43N.A.2.520.95
Tax(Dollars per
gallon)
0.801.671.650.622.761.572.341.401.32N.A.2.343.051.631.252.111.082.062.031.571.751.57N.A.1.710.30
SOURCE: Congressional Budget Office compilation of data from Organization for Economic Coopera-tion and Development, International Energy Agency, Energy Prices and Taxes: FourthQuarter 1988 (Paris: OECD, 1989).
NOTE: N.A. = not available.
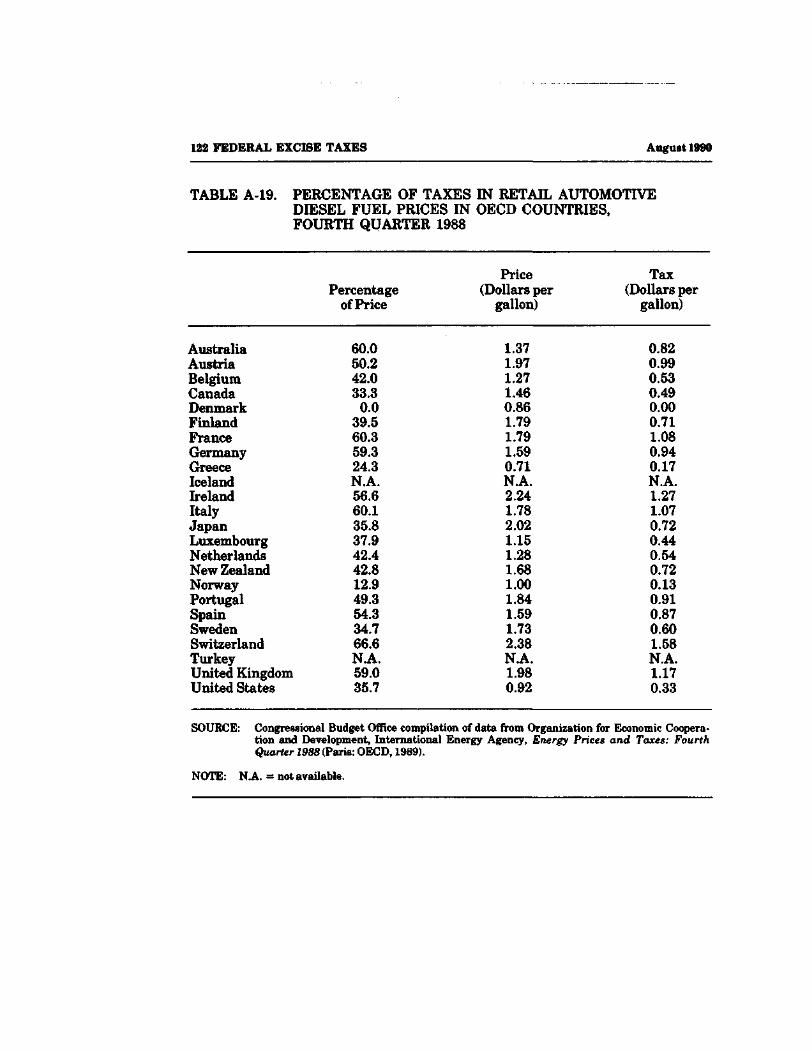
122 FEDERAL EXCISE TAXES August 1990
TABLE A-19. PERCENTAGE OF TAXES IN RETAIL AUTOMOTIVEDIESEL FUEL PRICES IN OECD COUNTRIES,FOURTH QUARTER 1988
AustraliaAustriaBelgiumCanadaDenmarkFinlandFranceGermanyGreeceIcelandIrelandItalyJapanLuxembourgNetherlandsNew ZealandNorwayPortugalSpainSwedenSwitzerlandTurkeyUnited KingdomUnited States
Percentageof Price
60.050.242.033.30.0
39.560.359.324.3N.A.56.660.135.837.942.442.812.949.354.334.766.6N.A.59.035.7
Price(Dollars per
gallon)
1.371.971.271.460.861.791.791.590.71N.A.2.241.782.021.151.281.681.001.841.591.732.38N.A.1.980.92
Tax(Dollars per
gallon)
0.820.990.530.490.000.711.080.940.17N.A.1.271.070.720.440.540.720.130.910.870.601.58N.A.1.170.33
SOURCE: Congressional Budget Office compilation of data from Organization for Economic Coopera-tion and Development, International Energy Agency, Energy Prices and Taxes: FourthQuarter 1988 (Paris: OECD, 1989).
NOTE: N.A. = not available.
APPENDIX B
SOURCES AND TREATMENT
OF THE DATA
The projected distribution of family incomes and expenditures for 1990is based on data from three sources. The primary source was theMarch 1986 Current Population Survey (CPS). The GPS is a monthlysurvey of approximately 60,000 families conducted by the Bureau ofthe Census. Each March, the survey collects detailed information oncharacteristics of the family and family income in the previouscalendar year. The reported data on income from taxable sources fromthe CPS files were adjusted by the Congressional Budget Office forconsistency with reported income from the Internal Revenue Service'sStatistics of Income (SOI) 1985 Individual Tax Model File. The SOI isan extensive annual sample (over 100,000 records in 1985) of actualindividual income tax returns, selected from all tax returns filed inthat year. The sample is designed for making national-level estimates.
Data on consumer expenditures were taken from the combined1984 and 1985 Consumer Expenditure Survey (CES) Interview Sur-veys. The CES Interview Survey is a quarterly panel survey conductedby the Bureau of Labor Statistics. Families in the CES InterviewSurvey are asked about their expenditures over the past three months,and remain in the survey for four consecutive quarters. Information onfamily income in the past 12 months is collected in the first and fourthinterview. Data for four consecutive interviews were used to constructannual expenditure data for each family.
Matching Expenditure Records to the CPS
CES expenditure records were statistically matched to records fromthe CPS.l CPS household records were subdivided into family units
1. The procedures used in the statistical match were based on methods developed by ICF Incorporated,Fairfax, Va. See ICF Incorporated, "The CPS-SOI-CES Statistically Matched Data Files: TechnicalDocumentation," submitted to the Congressional Budget Office (1988).
124 FEDERAL EXCISE TAXES August 1990
comparable to units in the CES. In the CES, family units consist ofrelated persons in the same household, and unrelated persons whoshare responsibilities for major expenditures. In the CPS, householdmembers are classified as belonging to either a primary or a secondaryfamily, or as unrelated individuals. For purposes of matching, all CPShousehold members were allocated to either a primary or secondaryfamily. Unrelated household members were included as part of theprimary family.
Records were matched on the basis of income, family size, age offamily head, and region of residence. Each CPS unit was assumed tohave the same ratio of expenditures to income as the CES unit to whichit was matched. The CPS records were assigned to one of approxi-mately 1,000 different matching groups and a corresponding CESrecord was selected from that matching group. The probability that agiven CES record was matched with a CPS record in the matchinggroup was proportional to the CES household's weight within thematching group.
Adjustments to the Data
Three major problems with the CPS needed to be corrected beforesimulating taxes and estimating the distribution of post-tax incomes.First, the CPS does not collect sufficient information for simulatingindividual income taxes, lacking, in particular, data on deductions andcapital gains realizations. Second, high incomes on the CPS aretop-coded to maintain confidentiality for families included in thesample. Third, less income from interest and dividends and moreincome from self-employment is reported on the CPS than on the SOI.
The adjustments for nonreported items and top-coding were rela-tively straightforward. CPS families were split into tax-filing unitscomparable to those on the SOI. Missing data on deductions andcapital gains were assigned to the CPS by imputation. For imputingindividual retirement account contributions, employee business ex-penses, and itemized deductions, the SOI was used to determine theprobability that a tax unit with particular attributes had that deduc-
APPENDIX B SOURCES AND TREATMENT OF THE DATA 125
tion and the ratio of the deduction to income. A similar procedure wasused to impute capital gains realizations to the CPS.
To correct for top-coding, the SOI was used to construct a distribu-tion of incomes at the top-coded level and higher for each type ofincome. Any income on the CPS that was at the maximum reportedamount was replaced with an amount randomly selected from theappropriate SOI high-income distribution.
A more complex procedure was necessary to adjust underreportedincomes on the CPS to match incomes on the SOI. In some cases thisrequired increasing reported negative as well as positive incomeamounts. Because low-income families are not required to file taxreturns, there are many more CPS tax units than SOI units. To makea valid comparison between the two data sets, CPS units that weresimulated to owe taxes were compared to SOI units with positive taxes.Each source of income on the CPS was compared to its counterpart onthe SOI, and adjustments were made until the level and distribution ofincome on the two files was approximately the same. Amounts ofinterest and dividends were increased for families reporting incomefrom those sources, and new recipients were created. After interest in-come was adjusted upward to match taxable interest on the SOI, anadditional amount of tax-exempt interest was imputed to the CPSusing the 1983 Survey of Consumer Finances. Rental incomes andincomes from partnerships and sole proprietorships were adjusteddownward; in some cases gains were converted into losses and in othercases self-employment losses were added to records that reported noself-employment income. As a final step, the weights and incomes oftaxpaying families in the top 1 percent of the income distribution wererevised so that the number of such families and their average incomewas identical on the two files.
Expenditures reported on the CES generally understate personalconsumption expenditures reported in the National Income andProduct Accounts (NIPA). Personal consumption expenditures in theNIPA represent the market value of all goods and services purchasedby the household sector in the United States. The proportion ofpersonal consumption expenditures reported in the CES varies by thetype of expenditure. Expenditure data by type were adjusted to match
126 FEDERAL EXCISE TAXES August 1990
comparable NIPA totals. If the data were not adjusted for under-reporting, taxes on those items for which there was incomplete re-porting would appear to be a much smaller percentage of income andtotal expenditures than taxes on those items for which there was morecomplete reporting. The adjustment procedure maintained the dis-tribution of each type of expenditure across families reported in theCES survey data. Family incomes were not adjusted to NIPA totals inorder to preserve income totals reported on tax return data. As aresult, comparisons of total incomes and total expenditures will notmatch estimates based on aggregate data.
Aging the Data
The 1985 matched file was aged to 1988 using actual growth rates inpopulation, income, and expenditures, and was projected to 1990 usingprojected growth rates based on the Congressional Budget Office fore-cast of August 1989.
Population aging factors were based on Social Security Adminis-tration forecasts of the number of persons by age, sex, and maritalstatus for future years. These forecasts were used to construct separategrowth rates for units based on age and marital status.
Adjustments were also made to reflect the projected growth in therate of employment. Weights for nonearners and one-earner coupleswere lowered and weights for couples with two earners and other unitswith earnings were raised.
Once population weights had been adjusted, incomes from eachsource were inflated by CBO's projected aggregate growth rate for in-come from that source. Deductions were raised to be consistent withthe projected growth in income. Expenditures of different types wereinflated by CBO's forecast for different components of consumer spend-ing.
APPENDIX B SOURCES AND TREATMENT OF THE DATA 127
Simulating Federal Excise. Income, and Payroll taxes
Individual income taxes were simulated using constructed CPS taxfiling units after reported CPS incomes had been adjusted to controltotals from SOI data. For high-income taxpayers, individual incometaxes were simulated using SOI data and then imputed to CPS taxfiling units by income classes.
Social Security payroll taxes were simulated using earnings andself-employment income from the adjusted CPS.
Excise taxes were simulated using adjusted expenditure datataken from the CES. For each of the tax increase options, the totalchange in taxes was estimated, consistent with estimates by the JointCommittee on Taxation reported in the February 1990 CBO annualreport.2 Total tax increases were distributed among families in pro-portion to their expenditures on the taxed goods.
Excise taxes on tobacco, alcoholic beverages, and motor fuels allare levied per unit rather than as a percent of expenditures. Allocatingexcise tax increases among families in proportion to their expenditureson the taxed items is correct if all families pay the same price for thetaxed goods. If the average price paid increases with increasing in-come, distributing tax increases by total expenditures will overstatetaxes for higher-income families and understate taxes for lower-income families. This will tend to understate the regressivity of an ex-cise tax increase.
This method is probably most problematic for alcoholic beveragetax increases, particularly increases in taxes on wine and distilledspirits. While there is no information on average prices paid for wineand distilled spirits by income class, limited data on average con-sumption suggest that the quantities of both wine and distilled spiritsconsumed rise with income, although not as rapidly as total expendi-tures. Results from one marketing survey regarding purchases ofspecific alcoholic beverages in 1988 indicated that the reported aver-
2. Congressional Budget Office, Reducing the Deficit: Spending and Revenue Options (February1990).
128 FEDERAL EXCISE TAXES August 1990
age number of glasses of wine and glasses of distilled spirits consumedin the past seven days was about twice as high for people earning$60,000 and over than for people earning less than $10,000.3
Simulation Results
The simulated distribution of 1990 incomes and expenditures and thedistribution of possible excise tax increases are shown in this study forfamilies grouped by adjusted post-tax income, age of family head, andregion. Post-tax family income equals the sum of wages, salaries, self-employment income, personal rents, interest, and dividends, plus gov-ernment cash transfer payments, cash pension benefits, and realizedcapital gains, minus federal income and payroll taxes. People wereassigned to quintiles based on adjusted post-tax family income—post-tax family income divided by the 1990 poverty threshold for theappropriate family size. An equal number of people (not families) wereassigned to each quintile. Families were assigned to one of the fourmajor census regions according to the region of residence as reported inthe CES. Because the CES does not report region of residence for ruralfamilies, rural families were classified separately.
Because the methodology and data used in this study differ some-what from those used by CBO in other distributional studies, the re-sults are also somewhat different. The major difference is that, in thisstudy, some unrelated individuals are counted as parts of larger unitswhile in other studies all unrelated individuals were treated as sepa-rate units. Because the average family unit contains more people,average family incomes are higher in this study. Other differences in-clude a different base year (1985) for the data and a different economicforecast (August 1989) for projection assumptions.
3. Congressional Budget Office calculations based on data from Simmons Study of Media and Markets(New York: Simmons Market Research Bureau, Inc., 1988).