Embed Size (px)
DESCRIPTION
FEDERAL STUDENT AID AND COMMUNITY COLLEGE STUDENTS. Sandy Baum George Washington University Graduate School of Education and The Urban Institute North Carolina Association of Community College Presidents July 2014. What’s good for community college students and what’s good public policy?. - PowerPoint PPT Presentation
Citation preview
FEDERAL STUDENT AID AND COMMUNITY COLLEGE STUDENTS
Sandy Baum
George Washington University Graduate School of Education and The Urban Institute
North Carolina Association of Community College Presidents
July 2014

What’s good for community college students and what’s good public policy?
• Public policy (equity and efficiency)o Diminishing financial barriers for students with very limited
resourceso Using public funds to change behaviors and outcomes in socially
desirable ways.
• Community colleges:o Disadvantaged students making cost effective choiceso Students on the margin of enrollmento Need to improve success rates

Trends in College Pricing 2013 For detailed data, see: trends.collegeboard.org.
NET PRICES, ROLE OF LIVING COSTSPublished In-State Tuition & Fees, Net Tuition &Fees, and
Room& Board in 2013 Dollars, Full-Time Undergraduate Students at Public
Institutions, 2003-04 to 2013-14
SOURCE: The College Board, Trends in College Pricing 2013, Figure 10.
2013-14: U.S. $3,264; NC: $2,242

Trends in College Pricing 2013 For detailed data, see: trends.collegeboard.org.
Distribution of Pell Grant Funds and Federal Subsidized & Unsubsidized Loan Funds by Sector,
2003-04 to 2012-13
SOURCE: The College Board, Trends in Student Aid 2013, Figure 8B. CC: 24% of full-time, 39% of all UGs

Sources of Undergraduate Grant Aid by Sector, 2012-13
Private Four-Year
Public Four-Year
Public Two-Year
0% 10% 20% 30% 40% 50% 60% 70% 80% 90% 100%
9%
33%
59%
6%
10%
16%
6%
19%
9%
69%
26%
8%
10%
11%
8%
Pell per student Other federal per student State per student Institutional per student Other grants per student

Pell Grants• Simplification
--IRS data
--Look-up table
• Supporting completion
--Availability of year-round aid
--Funding per credit hour / “Flex Pell”
• Providing guidance

Student Loans
• Is there a crisis?
• About 42% of all students (53% of full-time students) borrow each year.
• About 18% of community college students (24% of full-time students) borrow each year.
• 39% of community college completers in 2011-12 had borrowed (62% all sectors, 87% for-profit).

Total Amount Borrowed by 2009 by Students Beginning Postsecondary Education in 2003-04,
by Degree Attainment
Did Not Borrow
$1 to $10,000
$10,001 to $20,000
$20,001 to $30,000
$30,001 to $50,000
$50,001 or more
TOTAL 43% 25% 16% 8% 5% 2%Bachelor's Degree (31%) 36% 12% 22% 14% 10% 5%Associate Degree (9%) 42% 24% 18% 9% 7% 1%
Certificate (9%) 39% 45% 12% 2% 1% 0%
No Degree, Still Enrolled (15%) 39% 27% 18% 9% 5% 2%
No Degree, Left Without Return (35%) 52% 30% 11% 4% 2% 0%
Source: Beginning Postsecondary Students Longitudinal Study 2009, Data Lab
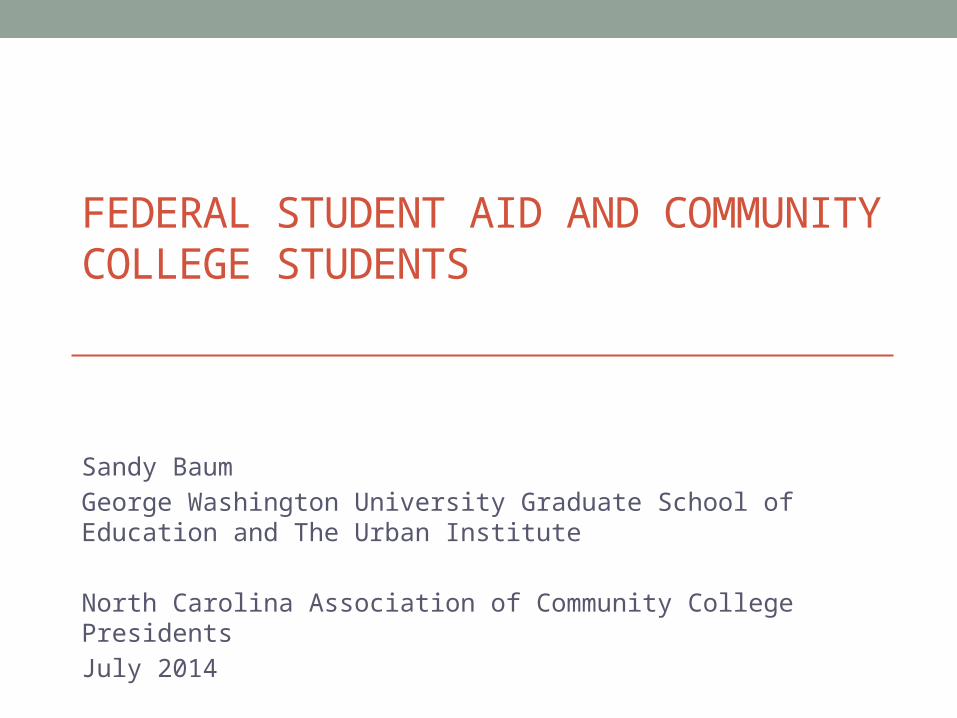
Total Education Debt of 2011-12 Associate Degree Completers
$0 $1-
$4,999$5,000-$9,999
$10,000-$14,999
$15,000-$19,999
$20,000-$24,999 $25,000 +
Public Two-Year
AA, AS, general education or transfer 63% 9% 9% 7% 4% 3% 5%
AAS, occupational or technical program 53% 8% 14% 8% 7% 3% 8%
For-Profit
AA, AS, general education or transfer 12% 3% 10% 9% 11% 15% 40%
AAS, occupational or technical program 12% 5% 9% 10% 10% 15% 40%
Source: National Postsecondary Student Aid Study, Data Lab

Trends in College Pricing 2013 For detailed data, see: trends.collegeboard.org.
Distribution of Total Enrollments, 2009-10, Borrowers Entering Repayment in FY 2011, and
FY 2011 Two-Year Cohort Default Rate, by Sector
SOURCE: The College Board, Trends in Student Aid 2013, Figure 12C.
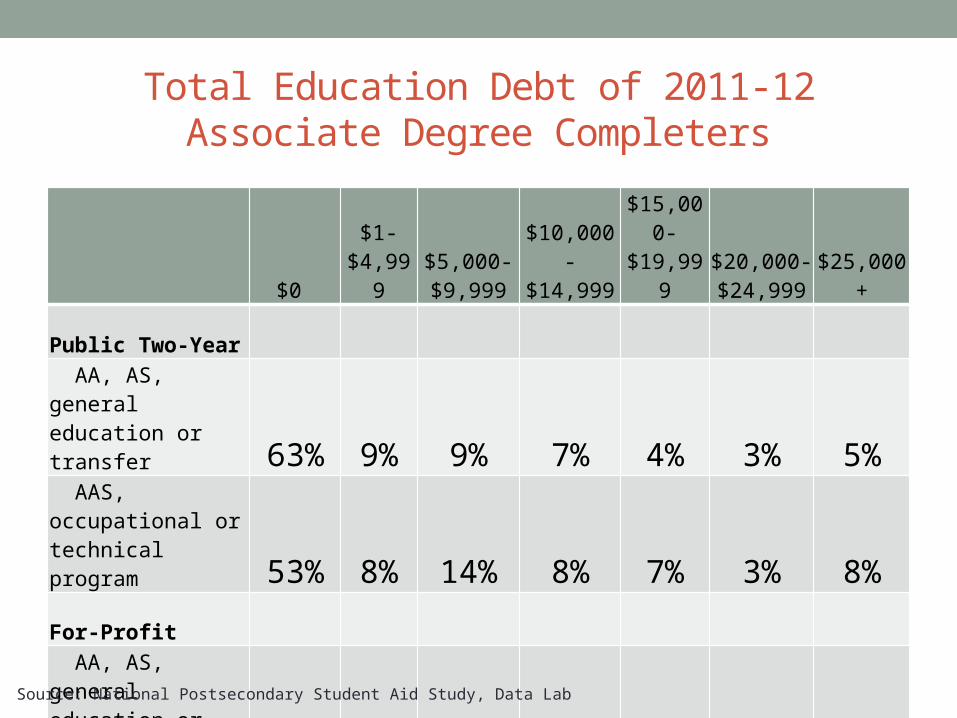
Two-Year Cohort Default Rates by Sector
Public Two-Year Publc Four-Year Private Nonprofit Four-Year
For-profit 2-3 year for-profit 4 year OVERALL0%
2%
4%
6%
8%
10%
12%
14%
16%
18%
8%
3%
2%
11%
8%
5%
13%
6%5%
12%
14%
9%
2006 2007 2008 2009 2010
Three-Year Cohort (2009) Default Rate18% 8% 7% 23% 23% 13%

Loans
• Income-based repayment as the default option
• Part-time students
• Distribution of subsidies
• In-school subsidy
• Restricting eligibility

Public Policy• Free community college?o Recent high school graduates (two-thirds of first-year students age
21 or older)o Limited to tuition in excess of federal and state grantso Potential enrollment impact
• Simplification
• Targeting of subsidies (in-school subsidy)
• Progress / completion incentives