Embed Size (px)
Citation preview

Report to the Chairman, Committee on Rules, House of Representatives
United States Government Accountability Office
GAO
October 2005
HIGHER EDUCATION
Federal Science, Technology, Engineering, and Mathematics Programs and Related Trends
GAO-06-114

What GAO Found
United States Government Accountability Office
Why GAO Did This Study
HighlightsAccountability Integrity Reliability
www.gao.gov/cgi-bin/getrpt?GAO-06-114. To view the full product, including the scope and methodology, click on the link above. For more information, contact Cornelia M. Ashby at (202) 512-7215 or [email protected].
Highlights of GAO-06-114, a report to the Chairman, Committee on Rules, House of Representatives
October 2005
HIGHER EDUCATION
Federal Science, Technology, Engineering, and Mathematics Programs and Related Trends
Officials from 13 federal civilian agencies reported spending about $2.8 billion in fiscal year 2004 for 207 education programs designed to increase the numbers of students and graduates or improve educational programs in STEM fields, but agencies reported little about their effectiveness. The National Institutes of Health and the National Science Foundation had most of the programs and spent most of the funds. Officials also reported that evaluations were completed or under way for about half of the programs. Federal STEM Education Programs and Funding by Agency, Fiscal Year 2004
All oth
ers
HRSAEPA
Educatio
n
NASANSF
NIH
Dollars in millions
Source: GAO survey responses from 13 federal agencies.
998 997
231 221121 63
154
(51) (4
8)(5
)(4
) (21)
(3)
(75)
0200400600800
1,0001,200
National Institutes of Health (NIH)National Science Foundation (NSF)National Aeronautics and Space Administration (NASA)Environmental Protection Agency (EPA)Health Resources and Services Administration (HRSA)
While the total numbers of students, graduates, and employees in STEM fields increased, changes in the numbers and percentages of women, minorities, and international students varied during the periods reviewed. From academic year 1995-1996 to 2003-2004, the percentage of students in STEM fields increased from 21 to 23 percent. Changes in the percentages of domestic minority students varied by group. From academic year 1994-1995 to 2002-2003, the number of graduates in STEM fields increased 8 percent, but this was less than the 30 percent increase in graduates in non-STEM fields. International graduates continued to earn about one-third or more of the advanced degrees in three STEM fields. Between calendar years 1994 and 2003, employment in STEM fields increased 23 percent compared to 17 percent in non-STEM fields, and there was no statistically significant change in the percentage of women employees. Educators and others cited several factors that affected students’ decisions about pursuing STEM degrees and occupations, and made suggestions to encourage more participation. They said teacher quality at the kindergarten to 12th grades, the mathematics and science courses completed in high school, and a mentor, especially for women and minorities, influenced domestic students’ decisions. Also, these sources said that opportunities outside the United States and the visa process affected international students’ decisions. To encourage more participation in STEM fields, educators and others made several suggestions. But before adopting any of them, it is important to know the extent to which existing STEM education programs are appropriately targeted and making the best use of available federal resources.
The United States has long been known as a world leader in scientific and technological innovation. To help maintain this advantage, the federal government has spent billions of dollars on education programs in the science, technology, engineering, and mathematics (STEM) fields for many years. However, concerns have been raised about the nation’s ability to maintain its global technological competitive advantage in the future. This report presents information on (1) the number of federal programs funded in fiscal year 2004 that were designed to increase the number of students and graduates pursuing STEM degrees and occupations or improve educational programs in STEM fields, and what agencies report about their effectiveness; (2) how the numbers, percentages, and characteristics of students, graduates, and employees in STEM fields have changed over the years; and (3) factors cited by educators and others as affecting students’ decisions about pursing STEM degrees and occupations, and suggestions that have been made to encourage more participation. GAO received written and/or technical comments from several agencies. While one agency, the National Science Foundation, raised several questions about the findings, the others generally agreed with the findings and conclusion and several agencies commended GAO for this work.

Page i GAO-06-114 Federal STEM Education Programs
Letter 1
Results in Brief 3 Background 5 More than 200 Federal Education Programs Are Designed to
Increase the Numbers of Students and Graduates or Improve Educational Programs in STEM Fields, but Most Have Not Been Evaluated 10
Numbers of Students, Graduates, and Employees in STEM Fields Generally Increased, but Percentage Changes Varied 18
University Officials and Others Cited Several Factors That Influence Decisions about Participation in STEM Fields and Suggested Ways to Encourage Greater Participation 32
Concluding Observations 41 Agency Comments and Our Evaluation 42
Appendix I Objectives, Scope, and Methodology 46
Appendix II List of 207 Federal STEM Education Programs 57
Appendix III Federal STEM Education Programs Funded at $10
Million or More 64
Appendix IV Data on Students and Graduates in STEM Fields 74
Appendix V Confidence Intervals for Estimates of Students at
the Bachelor’s, Master’s, and Doctoral Levels 79
Appendix VI Confidence Intervals for Estimates of STEM
Employment by Gender, Race or Ethnicity, and
Wages and Salaries 88
Contents

Page ii GAO-06-114 Federal STEM Education Programs
Appendix VII Comments from the Department of Commerce 91
Appendix VIII Comments from the Department of Health and
Human Services 95
Appendix IX Comments from the National Science Foundation 97
Appendix X Comments from the National Science and
Technology Council 100
Appendix XI GAO Contact and Staff Acknowledgments 101
Bibliography 102
Tables
Table 1: Sources of Data, Data Obtained, Time Span of Data, and Years Analyzed 2
Table 2: List of STEM Fields Based on NCES’s NPSAS and IPEDS Data and BLS’s CPS Data 6
Table 3: Percentage of the U.S. Population for Selected Racial or Ethnic Groups in the Civilian Labor Force, Calendar Years 1994 and 2003 8
Table 4: Number of STEM Education Programs Reported by Federal Civilian Agencies 11
Table 5: Funding Levels for Federal STEM Education Programs in Fiscal Year 2004 13
Table 6: Program Goals and Numbers of STEM Programs with One or Multiple Goals 14
Table 7: Numbers of STEM Programs with One or Multiple Types of Assistance and Beneficiaries 14

Page iii GAO-06-114 Federal STEM Education Programs
Table 8: Numbers of STEM Programs Targeted to One Group and Multiple Groups 15
Table 9: Estimated Changes in the Numbers and Percentages of Students in the STEM and Non-STEM Fields across All Education Levels, Academic Years 1995-1996 and 2003-2004 20
Table 10: Estimated Percentage Changes in the Numbers and Percentages of Domestic Minority Students in STEM fields for All Education Levels for Academic Years 1995-1996 and 2003-2004 21
Table 11: Estimated Changes in Numbers of International Students in STEM fields by Education Levels from the 1995-1996 Academic Year to the 2003-2004 Academic Year 22
Table 12: Numbers of Graduates and Percentage Changes in STEM and Non-STEM Fields across All Degree Levels from the 1994-1995 Academic Year to the 2002-2003 Academic Year 23
Table 13: Numbers and Percentage Changes in Men and Women Graduates with STEM Degrees by Education Level and Field for Academic Years 1994-1995 and 2002-2003 25
Table 14: Numbers and Percentage Changes in Domestic Minority Graduates in STEM Fields by Education Levels and Race or Ethnicity for Academic Years 1994-1995 and 2002-2003 26
Table 15: Changes in Numbers and Percentages of International Graduates in STEM fields at the Master’s and Doctoral Degree Levels, 1994-1995 and 2002-2003 Academic Years 27
Table 16: Estimated Numbers and Percentages of Employees in STEM Fields by Gender in Calendar Years 1994 and 2003 (numbers in thousands) 29
Table 17: Estimated Percentages of STEM Employees by Selected Racial or Ethnic Group for Calendar Years 1994 and 2003 30
Table 18: Sources of Data, Data Obtained, Time Span of Data, and Years Analyzed 48
Table 19: Classification codes and Occupations, 2002-2003 51 Table 20: Classification codes and occupations, 1994-2001 52 Table 21: Federal STEM Education Programs Funded in FY 2004 57 Table 22: Federal STEM Education Programs Funded at $10 Million
or More during Fiscal Year 2004 or Fiscal Year 2005 64 Table 23: Estimated Numbers of Students in STEM Fields by
Education Level for Academic Years 1995-1996 and 2003-2004 74
Table 24: Estimated Percentages of Students by Gender and STEM Field for Academic Years 1995-1996 and 2003-2004 75

Page iv GAO-06-114 Federal STEM Education Programs
Table 25: Estimated Number of Women Students and Percentage Change by Education Level and STEM Field for Academic Years 1995-1996 and 2003-2004 77
Table 26: Comparisons in the Percentage of STEM Graduates by Field and Gender for Academic Years 1994-1995 and 2002-2003 78
Table 27: Estimated Changes in the Numbers and Percentages of Students in the STEM and Non-STEM Fields across All Education Levels, Academic Years 1995-1996 and 2003-2004 (95 percent confidence intervals) 79
Table 28: Numbers of Students by Education Level in all STEM Fields for Academic Years 1995-1996 and 2003-2004 (95 percent confidence intervals) 80
Table 29: Estimated Numbers and Percentage Changes in Women Students in STEM Fields, Academic Years 1995-1996 and 2003-2004 (95 percent confidence intervals) 81
Table 30: Estimated Percentage Changes in Bachelor’s, Master’s, and Doctoral Students in STEM Fields, Academic Years 1995-1996 and 2003-2004 (95 percent confidence intervals) 83
Table 31: Estimates of STEM Students by Gender and Field for Academic Years 1995-1996 and 2003-2004 (95 percent confidence intervals) 84
Table 32: Estimates of Students for Selected Racial or Ethnic Groups in STEM Fields for All Education Levels and Fields for the Academic Years 1995-1996 and 2002-2003 (95 percent fonfidence intervals) 86
Table 33: Estimates of International Students in STEM Fields by Education Levels for Academic Years 1995-1996 and 2003-2004 (95 percent confidence intervals) 87
Table 34: Estimated Total Number of Employees by STEM Field between Calendar Years 1994 and 2003 88
Table 35: Estimated Numbers of Employees in STEM Fields by Gender for Calendar Years 1994 and 2003 89
Table 36: Estimated Changes in STEM Employment by Gender for Calendar Years 1994 and 2003 89
Table 37: Estimated Percentages of STEM Employees for Selected Racial or Ethnic Groups for Calendar Years 1994 and 2003 90
Table 38: Estimated Changes in Median Annual Wages and Salaries in the STEM Fields for Calendar Years 1994 and 2003 90

Page v GAO-06-114 Federal STEM Education Programs
Figures
Figure 1: Amounts Funded by Agencies for STEM-Related Federal Education Programs in Fiscal Year 2004 12
Figure 2: Key Changes in Students, Graduates, and Employees in STEM Fields 19
Figure 3: Percentage Changes in Bachelor’s, Master’s, and Doctoral Graduates in STEM Fields from Academic Year 1994-1995 to Academic Year 2002-2003 24
Figure 4: Estimated Numbers of Employees in STEM Fields from Calendar Years 1994 through 2003 28
Figure 5: Estimated Median Annual Wages and Salaries in STEM Fields for Calendar Years 1994 through 2003 32

Page vi GAO-06-114 Federal STEM Education Programs
Abbreviations
BEST Building Engineering and Science Talent BLS Bureau of Labor Statistics CGS Council of Graduate Schools CLF civilian labor force COS Committee on Science CPS Current Population Survey DHS Department of Homeland Security EPA Environmental Protection Agency HHS Health and Human Services HRSA Health Resources and Services Administration IPEDS Integrated Postsecondary Education Data System NASA National Aeronautics and Space Administration NCES National Center for Education Statistics NCLBA No Child Left Behind Act NIH National Institutes of Health NPSAS National Postsecondary Student Aid Study NSF National Science Foundation NSTC National Science and Technology Council SAO Security Advisory Opinion SEVIS Student and Exchange Visitor Information System STEM science, technology, engineering, and mathematics
This is a work of the U.S. government and is not subject to copyright protection in the United States. It may be reproduced and distributed in its entirety without further permission from GAO. However, because this work may contain copyrighted images or other material, permission from the copyright holder may be necessary if you wish to reproduce this material separately.

Page 1 GAO-06-114 Federal STEM Education Programs
October 12, 2005
The Honorable David Dreier Chairman, Committee on Rules House of Representatives
Dear Mr. Chairman:
The United States has long been known as a world leader in scientific and technological innovation. To help maintain this advantage, the federal government has spent billions of dollars on education programs in the science, technology, engineering, and mathematics (STEM) fields for many years. Some of these programs were designed to increase the numbers of women and minorities pursuing degrees in STEM fields. In addition, for many years, thousands of international students came to the United States to study and work in STEM fields. However, concerns have been raised about the nation’s ability to maintain its global technological competitive advantage in the future. In spite of the billions of dollars spent to encourage students and graduates to pursue studies in STEM fields or improve STEM educational programs, the percentage of United States students earning bachelor’s degrees in STEM fields has been relatively constant—about a third of bachelor’s degrees—since 1977. Furthermore, after the events of September 11, 2001, the United States established several new systems and processes to help enhance border security. In some cases, implementation of these new systems and processes, which established requirements for several federal agencies, higher education institutions, and potential students, made it more difficult for international students to enter this country to study and work.
In the last few years, many reports and news articles have been published, and several bills have been introduced in Congress that address issues related to STEM education and occupations. This report presents information on (1) the number of federal civilian education programs funded in fiscal year 2004 that were designed to increase the numbers of students and graduates pursuing STEM degrees and occupations or improve educational programs in STEM fields and what agencies report about their effectiveness; (2) how the numbers, percentages, and characteristics of students, graduates, and employees in STEM fields have changed over the years; and (3) factors cited by educators and others as influencing people’s decisions about pursuing STEM degrees and occupations, and suggestions that have been made to encourage greater
United States Government Accountability Office
Washington, DC 20548

Page 2 GAO-06-114 Federal STEM Education Programs
participation in STEM fields. To determine the number of programs designed to increase the numbers of students and graduates pursuing STEM degrees and occupations, we identified 15 federal departments and agencies as having STEM programs, and we developed and conducted a survey asking each department or agency to provide information on its education programs, including information about their effectiveness.1 We received responses from 14 of them, the Department of Defense did not participate, and we determined that at least 13 agencies had STEM education programs during fiscal year 2004 that met our criteria.
To describe how the numbers of students, graduates, and employees in STEM fields have changed, we analyzed and reported data from the Department of Education’s (Education) National Center for Education Statistics (NCES) and the Department of Labor’s (Labor) Bureau of Labor Statistics (BLS). Specifically, as shown in table 1, we used the National Postsecondary Student Aid Study (NPSAS) and the Integrated Postsecondary Education Data System (IPEDS) from NCES and the Current Population Survey (CPS) data from BLS. We assessed the data for reliability and reasonableness and found them to be sufficiently reliable for the purposes of this report.
Table 1: Sources of Data, Data Obtained, Time Span of Data, and Years Analyzed
Department Agency Database Data obtained Time span of data Years analyzed
Education NCES NPSAS College student enrollment 9 years Academic years 1995-1996 and 2003-2004
Education NCES IPEDS Graduation/degrees 9 years Academic years 1994-1995 and 2002-2003
Labor BLS CPS Employment 10 years Calendar years 1994 through 2003
Sources: NCES’s National Postsecondary Student Aid Study (NPSAS) and Integrated Postsecondary Education Data System (IPEDS) and BLS’s Current Population Survey (CPS) data.
Note: Enrollment and employment information are based on sample data and are subject to sampling error. The 95-percent confidence intervals for student enrollment estimates are contained in appendix V of this report. Percentage estimates for STEM employment have 95-percent confidence intervals of within +/- 6 percentage points and other employment estimates (such as wages and salaries) have confidence intervals of within +/- 10 percent of the estimate, unless otherwise noted. See appendixes I, V, and VI for additional information.
1For the purposes of this report, we will use the term “agency” when referring to any of the 13 federal departments and agencies that responded to our survey.

Page 3 GAO-06-114 Federal STEM Education Programs
To obtain perspectives on the factors that influence people’s decisions about pursuing STEM degrees and occupations, and to obtain suggestions for encouraging greater participation in STEM fields, we interviewed educators and administrators in eight colleges and universities (the University of California Los Angeles and the University of Southern California in California; Clark Atlanta University, Georgia Institute of Technology, and Spelman College in Georgia; the University of Illinois; Purdue University in Indiana; and Pennsylvania State University). We selected these colleges and universities to include a mix of public and private institutions, provide geographic diversity, and include a few minority-serving institutions, including one (Spelman College) that serves only women students. In addition, most of the institutions had large total numbers of students, including international students, enrolled in STEM fields. We also asked officials from the eight universities to identify current students to whom we could send an e-mail survey. We received responses from 31 students from five of these institutions. In addition, we interviewed federal agency officials and representatives from associations and education organizations, and analyzed reports on various topics related to STEM education and occupations. Appendix I contains a more detailed discussion of our scope and methodology. We conducted our work between October 2004 and October 2005 in accordance with generally accepted government auditing standards.
Officials from 13 federal civilian agencies reported having 207 education programs funded in fiscal year 2004 that were designed to increase the numbers of students and graduates pursuing STEM degrees and occupations or improve educational programs in STEM fields, but they reported little about the effectiveness of these programs. The 13 agencies reported spending about $2.8 billion in fiscal year 2004 for these programs. According to the survey responses, the National Institutes of Health (NIH) and the National Science Foundation (NSF) sponsored 99 of the 207 programs and spent about $2 billion of the approximate $2.8 billion. The program costs ranged from $4,000 for a national scholars program sponsored by the Department of Agriculture (USDA) to about $547 million for an NIH program that is designed to develop and enhance research training opportunities for individuals in biomedical, behavioral, and clinical research by supporting training programs at institutions of higher learning. Officials reported that most of the 207 programs had multiple goals, and many were targeted to multiple groups. For example, 2 programs were identified as having one goal of attracting and preparing students at any education level to pursue coursework in STEM areas, while 112 programs had this as one of multiple goals. Agency officials also
Results in Brief

Page 4 GAO-06-114 Federal STEM Education Programs
reported that evaluations were completed or under way for about half of the programs, and most of the completed evaluations reported that the programs had been effective and achieved established goals. However, some programs that have not been evaluated have operated for many years.
While the total numbers of students, graduates, and employees have increased in STEM fields, changes in the numbers and percentages of women, minorities and international students varied during the periods reviewed. From the 1995-1996 academic year to the 2003-2004 academic year, the number of students increased in STEM fields by 21 percent—more than the 11 percent increase in non-STEM fields. Also, students enrolled in STEM fields increased from 21 percent to 23 percent of all students. Changes in the numbers and percentages of domestic minority students varied by group. For example, the number of African American students increased 69 percent and the number of Hispanic students increased 33 percent. The total number of graduates in STEM fields increased by 8 percent from the 1994-1995 academic year to the 2002-2003 academic year, while graduates in non-STEM fields increased 30 percent. Further, the numbers of graduates decreased in at least four of eight STEM fields at each education level. The total number of domestic minority graduates in STEM fields increased, and international graduates continued to earn about one-third or more of the master’s and doctoral degrees in three fields. Moreover, from 1994 to 2003, employment increased by 23 percent in STEM fields as compared with 17 percent in non-STEM fields. African American employees continued to be less than 10 percent of all STEM employees, and there was no statistically significant change in the percentage of women employees.
Educators and others cited several factors as influencing students’ decisions about pursuing STEM degrees and occupations, and they suggested many ways to encourage more participation in STEM fields. Studies, education experts, university officials, and others cited teacher quality at the kindergarten through 12th grade levels and students’ high school preparation in mathematics and science courses as major factors that influence domestic students’ decisions about pursuing STEM degrees and occupations. In addition, university officials, students, and studies identified mentoring as a key factor for women and minorities. Also, according to university officials, education experts, and reports, international students’ decisions about pursuing STEM degrees and occupations in the United States are influenced by yet other factors, including more stringent visa requirements and increased educational opportunities outside the United States. We have reported that several

Page 5 GAO-06-114 Federal STEM Education Programs
aspects of the visa process have been improved, but further steps could be taken. In order to promote participation in the STEM fields, officials at most of the eight universities visited and current students offered suggestions that focused on four areas: teacher quality, mathematics and science preparation and courses, outreach to underrepresented groups, and the federal role in STEM education. The students who responded to our e-mail survey generally agreed with most of the suggestions and expressed their desires for better mathematics and science preparation for college. However, before adopting such suggestions, it is important to know the extent to which existing STEM education programs are appropriately targeted and making the best use of available federal resources.
We received written comments on a draft of this report from the Department of Commerce, the Department of Health and Human Services, and the National Science and Technology Council. These agencies generally agreed with our findings and conclusions. We also received written comments from the National Science Foundation which questioned our findings related to program evaluations, interagency collaboration, and the methodology we used to support our findings on the factors that influenced decisions about pursing STEM fields. Also, the National Science Foundation provided information to clarify examples cited in the report, stated that the data categories were not clear, and commented on the graduate level enrollment data we used. We revised the report to acknowledge that the National Science Foundation uses a variety of mechanisms to evaluate its programs and we added a bibliography that identifies the reports and research used during the course of this review to address the comment about our methodology related to the factors that influenced decisions about pursuing STEM fields. We also revised the report to clarify the examples and the data categories and to explain the reasons for selecting the enrollment data we used. However, we did not make changes to address the comment related to interagency collaboration for the reason explained in the agency comments section of this report. The written comments are reprinted in appendixes VII, VIII, IX, and X. In addition, we received technical comments from the Departments of Commerce, Health and Human Services, Homeland Security, Labor, and Transportation, and the Environmental Protection Agency and National Aeronautics and Space Administration, which we incorporated when appropriate.
STEM includes many fields of study and occupations. Based on the National Science Foundations’ categorization of STEM fields, we
Background

Page 6 GAO-06-114 Federal STEM Education Programs
developed STEM fields of study from NCES’s National Postsecondary Student Aid Study (NPSAS) and Integrated Postsecondary Education Data System (IPEDS), and identified occupations from BLS’s Current Population Survey (CPS). Using these data sources, we developed nine STEM fields for students, eight STEM fields for graduates, and four broad STEM fields for occupations. Table 2 lists these STEM fields and occupations and examples of subfields. Additional information on STEM occupations is provided in appendix I.
Table 2: List of STEM Fields Based on NCES’s NPSAS and IPEDS Data and BLS’s CPS Data
Enrollment–NCES’ NPSAS data Degrees–NCES’ IPEDS data Occupations–BLS’ CPS data
Agricultural sciences
Biological sciences
Biological/agricultural sciences • Botany
• Zoology • Dairy • Forestry
• Poultry • Wildlife management
Earth, atmospheric, and ocean sciences • Geology • Geophysics and seismology
Physical sciences Physical sciences • Chemistry
• Physics
Psychology Psychology • Clinical • Social
Social sciences Social sciences • Political science
• Sociology
Science • Agricultural and food scientists
• Astronomers and physicists • Atmospheric and space scientists • Biological scientists
• Chemists and materials scientists • Environmental scientists and geoscientists • Nurses
• Psychologists • Sociologists • Urban and regional planners
Technology Technology • Solar • Automotive engineering
Technology • Clinical laboratory technologists and technicians • Diagnostic-related technologists and technicians
• Medical, dental, and ophthalmic laboratory technicians
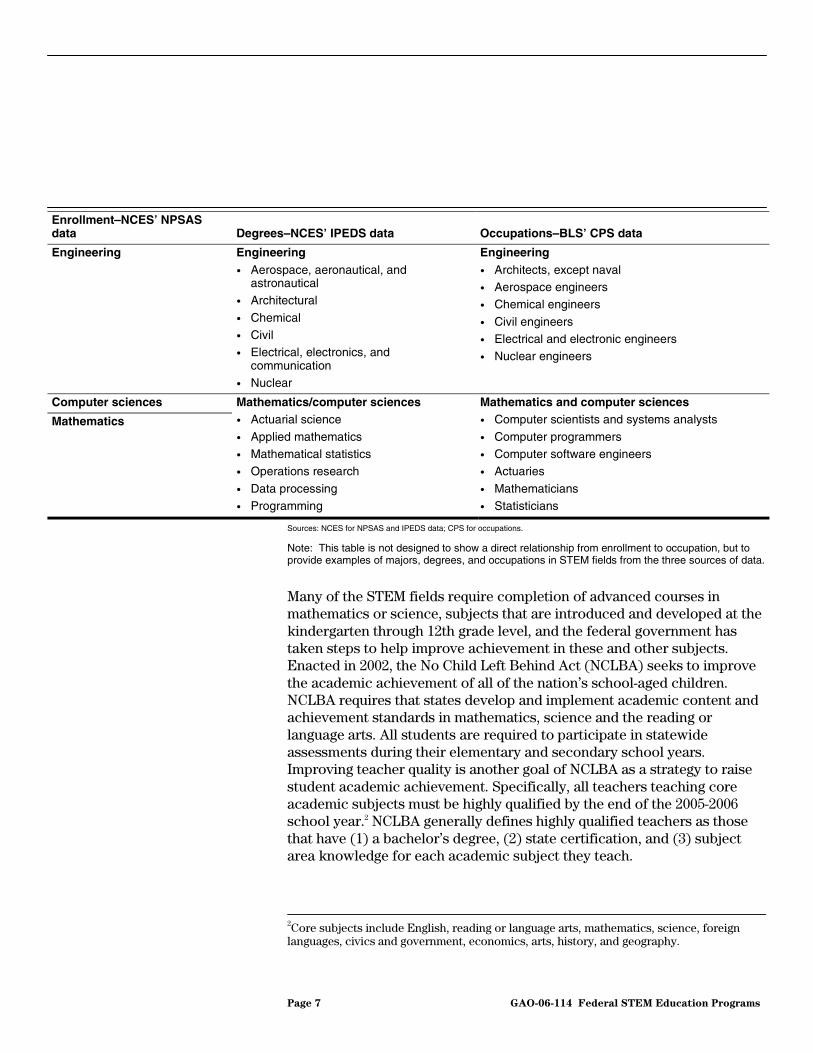
Page 7 GAO-06-114 Federal STEM Education Programs
Enrollment–NCES’ NPSAS data Degrees–NCES’ IPEDS data Occupations–BLS’ CPS data
Engineering Engineering
• Aerospace, aeronautical, and astronautical
• Architectural
• Chemical • Civil • Electrical, electronics, and
communication • Nuclear
Engineering • Architects, except naval • Aerospace engineers • Chemical engineers
• Civil engineers • Electrical and electronic engineers • Nuclear engineers
Computer sciences
Mathematics
Mathematics/computer sciences • Actuarial science
• Applied mathematics • Mathematical statistics • Operations research
• Data processing • Programming
Mathematics and computer sciences • Computer scientists and systems analysts
• Computer programmers • Computer software engineers • Actuaries
• Mathematicians • Statisticians
Sources: NCES for NPSAS and IPEDS data; CPS for occupations.
Note: This table is not designed to show a direct relationship from enrollment to occupation, but to provide examples of majors, degrees, and occupations in STEM fields from the three sources of data.
Many of the STEM fields require completion of advanced courses in mathematics or science, subjects that are introduced and developed at the kindergarten through 12th grade level, and the federal government has taken steps to help improve achievement in these and other subjects. Enacted in 2002, the No Child Left Behind Act (NCLBA) seeks to improve the academic achievement of all of the nation’s school-aged children. NCLBA requires that states develop and implement academic content and achievement standards in mathematics, science and the reading or language arts. All students are required to participate in statewide assessments during their elementary and secondary school years. Improving teacher quality is another goal of NCLBA as a strategy to raise student academic achievement. Specifically, all teachers teaching core academic subjects must be highly qualified by the end of the 2005-2006 school year.2 NCLBA generally defines highly qualified teachers as those that have (1) a bachelor’s degree, (2) state certification, and (3) subject area knowledge for each academic subject they teach.
2Core subjects include English, reading or language arts, mathematics, science, foreign languages, civics and government, economics, arts, history, and geography.
Page 8 GAO-06-114 Federal STEM Education Programs
The federal government also plays a role in coordinating federal science and technology issues. The National Science and Technology Council (NSTC) was established in 1993 and is the principal means for the Administration to coordinate science and technology among the diverse parts of the federal research and development areas. One objective of NSTC is to establish clear national goals for federal science and technology investments in areas ranging from information technologies and health research to improving transportation systems and strengthening fundamental research. NSTC is responsible for preparing research and development strategies that are coordinated across federal agencies in order to accomplish these multiple national goals.
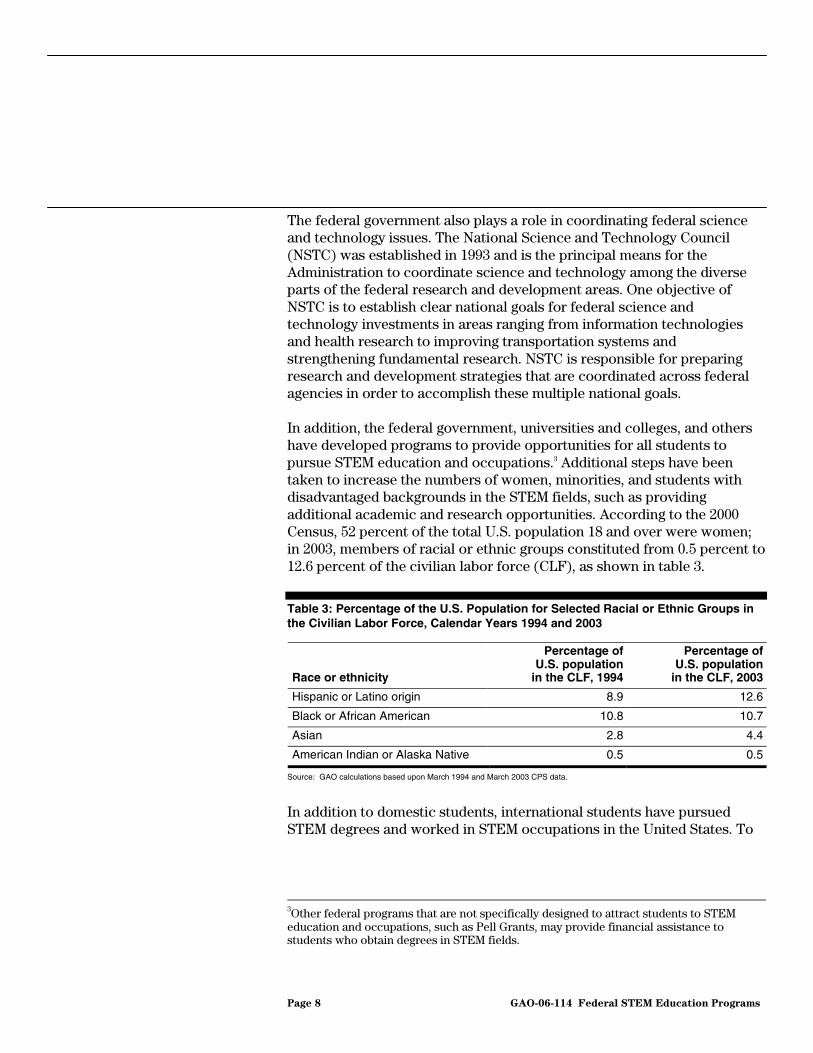
In addition, the federal government, universities and colleges, and others have developed programs to provide opportunities for all students to pursue STEM education and occupations.3 Additional steps have been taken to increase the numbers of women, minorities, and students with disadvantaged backgrounds in the STEM fields, such as providing additional academic and research opportunities. According to the 2000 Census, 52 percent of the total U.S. population 18 and over were women; in 2003, members of racial or ethnic groups constituted from 0.5 percent to 12.6 percent of the civilian labor force (CLF), as shown in table 3.
Table 3: Percentage of the U.S. Population for Selected Racial or Ethnic Groups in the Civilian Labor Force, Calendar Years 1994 and 2003
Race or ethnicity
Percentage of U.S. population
in the CLF, 1994
Percentage ofU.S. population
in the CLF, 2003
Hispanic or Latino origin 8.9 12.6
Black or African American 10.8 10.7
Asian 2.8 4.4
American Indian or Alaska Native 0.5 0.5
Source: GAO calculations based upon March 1994 and March 2003 CPS data.
In addition to domestic students, international students have pursued STEM degrees and worked in STEM occupations in the United States. To
3Other federal programs that are not specifically designed to attract students to STEM education and occupations, such as Pell Grants, may provide financial assistance to students who obtain degrees in STEM fields.

Page 9 GAO-06-114 Federal STEM Education Programs
do so, international students and scholars must obtain visas.4 International students who wish to study in the United States must first apply to a Student and Exchange Visitor Information System (SEVIS) certified school. In order to enroll students from other nations, U.S. colleges and universities must be certified by the Student and Exchange Visitor Program within the Department of Homeland Security’s Immigration and Customs Enforcement organization. As of February 2004, nearly 9,000 technical schools and colleges and universities had been certified. SEVIS, is an Internet-based system that maintains data on international students and exchange visitors before and during their stay in the United States. Upon admitting a student, the school enters the student’s name and other information into the SEVIS database. At this time the student may apply for a student visa. In some cases, a Security Advisory Opinion (SAO) from the Department of State (State) may be needed to determine whether or not to issue a visa to the student. SAOs are required for a number of reasons, including concerns that a visa applicant may engage in the illegal transfer of sensitive technology. An SAO based on technology transfer concerns is known as Visas Mantis and, according to State officials, is the most common type of SAO applied to science applicants.5 In April 2004, the Congressional Research Service reported that State maintains a technology alert list that includes 16 sensitive areas of study. The list was produced in an effort to help the United States prevent the illegal transfer of controlled technology and includes chemical and biotechnology engineering, missile technology, nuclear technology, robotics, and advanced computer technology.6
Many foreign workers enter the United States annually through the H-1B visa program, which assists U.S. employers in temporarily filling specialty
4There are several types of visas that authorize people to study and work in the United States. F, or student, visas, are for study at 2- and 4-year colleges and universities and other academic institutions; the exchange visitor, or J, visas are for people who will be participating in a cultural exchange program; and M visas are for nonacademic study at institutions, such as vocational and technical schools. In addition, H-1B visas allow non-citizens to work in the United States.
5GAO, Border Security: Streamlined Visas Mantis Program Has Lowered Burden on
Foreign Science Students and Scholars, but Further Refinements Needed, GAO-05-198 (Washington, D.C.: Feb. 18, 2005).
6Congressional Research Service, Science, Engineering, and Mathematics Education:
Status and Issues, 98-871 STM, April 27, 2004, Washington, D.C.

Page 10 GAO-06-114 Federal STEM Education Programs
occupations.7 Employed workers may stay in the United States on an H-1B visa for up to 6 years. The current cap on the number of H-1B visas that can be granted is 65,000. The law exempts certain workers, however, from this cap, including those who are employed or have accepted employment in specified positions. Moreover, up to 20,000 exemptions are allowed for those holding a master’s degree or higher.
Officials from 13 federal civilian agencies reported having 207 education programs funded in fiscal year 2004 that were specifically established to increase the numbers of students and graduates pursuing STEM degrees and occupations, or improve educational programs in STEM fields, but they reported little about the effectiveness of these programs.8 These 13 federal agencies reported spending about $2.8 billion for their STEM education programs. Taken together, NIH and NSF sponsored nearly half of the programs and spent about 71 percent of the funds. In addition, agencies reported that most of the programs had multiple goals, and many were targeted to multiple groups. Although evaluations have been done or were under way for about half of the programs, little is known about the extent to which most STEM programs are achieving their desired results. Coordination among the federal STEM education programs has been limited. However, in 2003, the National Science and Technology Council formed a subcommittee to address STEM education and workforce policy issues across federal agencies.
7A specialty occupation is defined as one that requires the application of a body of highly specialized knowledge, and the attainment of at least a bachelor’s degree (or its equivalent), and the possession of a license or other credential to practice the occupation if required.
8 GAO asked agencies to include STEM and related education programs with one or more of the following as a primary objective: (1) attract and prepare students at any education level to pursue coursework in STEM areas, (2) attract students to pursue degrees (2-year degrees through post doctoral) in STEM fields, (3) provide growth and research opportunities for college and graduate students in STEM fields, such as working with researchers and/or conducting research to further their education, (4) attract graduates to pursue careers in STEM fields, (5) improve teacher (pre-service, in-service, and postsecondary) education in STEM areas, and (6) improve or expand the capacity of institutions to promote or foster STEM fields.
More than 200 Federal Education Programs Are Designed to Increase the Numbers of Students and Graduates or Improve Educational Programs in STEM Fields, but Most Have Not Been Evaluated

Page 11 GAO-06-114 Federal STEM Education Programs
Officials from 13 federal civilian agencies provided information on 207 STEM education programs funded in fiscal year 2004. The numbers of programs ranged from 51 to 1 per agency with two agencies, NIH and NSF, sponsoring nearly half of the programs—99 of 207. Table 4 provides a summary of the numbers of programs by agency, and appendix II contains a list of the 207 STEM education programs and funding levels for fiscal year 2004 by agency.
Table 4: Number of STEM Education Programs Reported by Federal Civilian Agencies
Federal agency Number of STEM
education programs
Department of Health and Human Services/ National Institutes of Health 51
National Science Foundation 48
Department of Energy 26
Environmental Protection Agency 21
Department of Agriculture 16
Department of Commerce 13
Department of the Interior 13
National Aeronautics and Space Administration 5
Department of Education 4
Department of Transportation 4
Department of Health and Human Services/Health Resources and Services Administration 3
Department of Health and Human Services/Indian Health Service 2
Department of Homeland Security 1
Total 207
Source: GAO survey responses from 13 federal agencies.
Federal civilian agencies reported that approximately $2.8 billion was spent on STEM education programs in fiscal year 2004.9 The funding levels for STEM education programs among the agencies ranged from about $998 million to about $4.7 million. NIH and NSF accounted for about 71 percent of the total—about $2 billion of the approximate $2.8 billion. NIH spent
9The program funding levels, as provided by agency officials, contain both actual and estimated amounts for fiscal year 2004.
Federal Civilian Agencies Reported Sponsoring over 200 STEM Education Programs and Spending Billions in Fiscal Year 2004

Page 12 GAO-06-114 Federal STEM Education Programs
about $998 million in fiscal year 2004, about 3.6 percent of its $28 billion appropriation, and NSF spent about $997 million, which represented 18 percent of its appropriation. Four other agencies, some with a few programs, spent about 23 percent of the total: $636 million. For example, the National Aeronautics and Space Administration (NASA) spent about $231 million on 5 programs and the Department of Education (Education) spent about $221 million on 4 programs during fiscal year 2004. Figure 1 shows the 6 federal civilian agencies that used the most funds for STEM education programs and the funds used by the remaining 7 agencies.
Figure 1: Amounts Funded by Agencies for STEM-Related Federal Education Programs in Fiscal Year 2004
The funding reported for individual STEM education programs varied significantly, and many of the programs have been funded for more than 10 years. The funding ranged from $4,000 for an USDA-sponsored program that offered scholarships to U.S. citizens seeking bachelor’s degrees at Hispanic-serving institutions, to about $547 million for a NIH grant program that is designed to develop and enhance research training opportunities for individuals in biomedical, behavioral, and clinical research by supporting training programs at institutions of higher education. As shown in table 5, most programs were funded at $5 million or less and 13 programs were funded at more than $50 million in fiscal year 2004. About half of the STEM education programs were first funded after 1998. The oldest program began in 1936, and 72 programs are over 10
0
200
400
600
800
1,000
1,200
All Oth
ers
Health
Res
ources
and
Enviro
men
tal P
rote
ctio
n
Educatio
n
Natio
nal Aer
onautic
s and
Natio
nal Scie
nce
Natio
nal In
stitu
tes
Dollars in millions
Source: GAO survey responses from 13 federal agencies.
998 997
231 221
12163
154
of H
ealth
Foundat
ion
Agen
cy
Spac
e Adm
inist
ratio
n
Ser
vices
Adm
inist
ratio
n

Page 13 GAO-06-114 Federal STEM Education Programs
years old.10 Appendix III describes the STEM education programs that received funding of $10 million or more during fiscal year 2004 or 2005.11
Table 5: Funding Levels for Federal STEM Education Programs in Fiscal Year 2004
Program funding levels Numbers of STEM
education programs Percentage of total STEM
education programs
Less than $1 million 93 45
$1 million to $5 million 51 25
$5.1 million to $10 million 19 9
$10.1 million to $50 million 31 15
More than $50 million 13 6
Total 207 100
Source: GAO survey responses from 13 federal agencies.
Agencies reported that most of the STEM education programs had multiple goals. Survey respondents reported that 80 percent (165 of 207) of the education programs had multiple goals, with about half of these identifying four or more goals for individual programs.12 Moreover, according to the survey responders, few programs had a single goal. For example, 2 programs were identified as having one goal of attracting and preparing students at any education level to pursue coursework in the STEM areas, while 112 programs identified this as one of multiple goals. Table 6 shows the program goals and numbers of STEM programs aligned with them.
10Six survey respondents did not include the date the program was initially funded.
11Fiscal year 2005 funding levels were not available for all of the 207 STEM education programs.
12Three survey respondents did not identify the program goals.
Federal Agencies Reported Most STEM Programs Had Multiple Goals and Were Targeted to Multiple Groups

Page 14 GAO-06-114 Federal STEM Education Programs
Table 6: Program Goals and Numbers of STEM Programs with One or Multiple Goals
Program goal Programs withonly this goal
Programs with multiple goals
including this goal
Total programs with this goal
and other goal(s)
Attract and prepare students at any education level to pursue coursework in STEM areas 2 112 114
Attract students to pursue degrees (2-year through Ph.D.) and postdoctoral appointments 6 131 137
Provide growth and research opportunities for college and graduate students in STEM fields 3 100 103
Attract graduates to pursue careers in STEM fields 17 114 131
Improve teacher education in STEM areas 8 65 73
Improve or expand the capacity of institutions to promote or foster STEM fields 3 87 90
Source: GAO survey responses from 13 federal agencies.
The STEM education programs provided financial assistance to students, educators, and institutions. According to the survey responses, 131 programs provided financial support for students or scholars, and 84 programs provided assistance for teacher and faculty development.13 Many of the programs provided financial assistance to multiple beneficiaries, as shown in table 7.
Table 7: Numbers of STEM Programs with One or Multiple Types of Assistance and Beneficiaries
Type of assistance
Programs that provide only this
type of assistance
Programs that provide this type and other
types of assistance
Total programs that provide this
type of assistance
Financial support for students or scholars 54 77 131
Institutional support to improve educational quality 6 70 76
Support for teacher and faculty development 12 72 84
Institutional physical infrastructure support 1 26 27
Source: GAO survey responses from 13 federal agencies.
Most of the programs were not targeted to a specific group but aimed to serve a wide range of students, educators, and institutions. Of the 207 programs, 54 were targeted to 1 group and 151 had multiple target
13One survey respondent did not identify the type of assistance supported by the program.

Page 15 GAO-06-114 Federal STEM Education Programs
groups.14 In addition, many programs were targeted to the same group. For example, while 12 programs were aimed solely at graduate students, 88 other programs had graduate students as one of multiple target groups. Fewer programs were targeted to elementary and secondary teachers and kindergarten through 12th grade students than to other target groups. Table 8 summarizes the numbers of STEM programs targeted to one group and multiple groups.
Table 8: Numbers of STEM Programs Targeted to One Group and Multiple Groups
Targeted group Targeted to
only this groupTargeted to this
and other groups Total programs
targeted to this group
Kindergarten through grade 12 students
Elementary school students 0 28 28
Middle or junior high school students 1 33 34
High school students 3 50 53
Undergraduate students
2-year college students 1 57 58
4-year college students 4 92 96
Graduate students and postdoctoral scholars
Graduate students 12 88 100
Postdoctoral scholars 12 58 70
Teachers, college faculty and instructional staff
Elementary school teachers 0 39 39
Secondary school teachers 3 47 50
College faculty or instructional staff 4 75 79
Institutions 5 77 82
Source: GAO survey responses from13 federal agencies.
Some programs limited participation to certain groups. According to survey respondents, U.S. citizenship was required to be eligible for 53 programs, and an additional 75 programs were open only to U.S. citizens or permanent residents.15 About one-fourth of the programs had no
14Two survey respondents did not identify the group targeted by the program.
15Lawful permanent residents, also commonly referred to as immigrants, are legally accorded the privilege of residing permanently in the United States. They may be issued immigrant visas by the Department of State overseas or adjusted to permanent resident status by the Department of Homeland Security in the United States.

Page 16 GAO-06-114 Federal STEM Education Programs
citizenship requirement, and 24 programs allowed noncitizens or permanent residents to participate in some cases. According to a NSF official, students receiving scholarships or fellowships through NSF programs must be U.S. citizens or permanent residents. In commenting on a draft of this report, NSF reported that these restrictions are considered to be an effective strategy to support its goal of creating a diverse, competitive, and globally-engaged U.S. workforce of scientists, engineers, technologists, and well-prepared citizens. Officials at two universities said that some research programs are not open to non-citizens. Such restrictions may reflect concerns about access to sensitive areas. In addition to these restrictions, some programs are designed to increase minority representation in STEM fields. For example, NSF sponsors a program called Opportunities for Enhancing Diversity in the Geosciences to increase participation by African Americans, Hispanic Americans, Native Americans (American Indians and Alaskan Natives), Native Pacific Islanders (Polynesians or Micronesians), and persons with disabilities.
Evaluations had been completed or were under way for about half of the STEM education programs. Agency officials responded that evaluations were completed for 55 of the 207 programs and that for 49 programs, evaluations were under way at the time we conducted our survey. Agency officials provided us documentation for evaluations of 43 programs, and most of the completed evaluations reviewed reported that the programs met their objectives or goals. For example, a March 2004 report on the outcomes and impacts of NSF’s Minority Postdoctoral Research Fellowships program concluded that there was strong qualitative and quantitative evidence that this program is meeting its broad goal of preparing scientists from those ethnic groups that are significantly underrepresented in tenured U.S. science and engineering professorships and for positions of leadership in industry and government.
However, evaluations had not been done for 103 programs, some of which have been operating for many years. Of these, it may have been too soon to expect evaluations for about 32 programs that were initially funded in fiscal year 2002 or later. However, of the remaining 71 programs, 17 have been operating for over 15 years and have not been evaluated. In commenting on a draft of this report NSF noted that all of its programs undergo evaluation and that it uses a variety of mechanisms for program evaluation. We reported in 2003 that several agencies used various
Agency Officials Reported That Evaluations Were Completed or Under Way for About Half of the Federal Programs
Page 17 GAO-06-114 Federal STEM Education Programs
strategies to develop and improve evaluations.16 Evaluations play an important role in improving program operations and ensuring an efficient use of federal resources. Although some of the STEM education programs are small in terms of their funding levels, evaluations can be designed to consider the size of the program and the costs associated with measuring outcomes and collecting data.
Coordination of federal STEM education programs has been limited. In January 2003 the National Science and Technology Council (NSTC), Committee on Science (COS), established a subcommittee on education and workforce development. The purpose of the subcommittee is to advise and assist COS and NSTC on policies, procedures, and programs relating to STEM education and workforce development. According to its charter, the subcommittee will address education and workforce policy issues and research and development efforts that focus on STEM education issues at all levels, as well as current and projected STEM workforce needs, trends, and issues. The members include representatives from 20 agencies and offices—the 13 agencies that responded to our survey as well as the Departments of Defense, State, and Justice, and the Office of Science and Technology Policy, the Office of Management and Budget, the Domestic Policy Council, and the National Economic Council. The subcommittee has working groups on (1) human capacity in STEM areas, (2) minority programs, (3) effective practices for assessing federal efforts, and (4) issues affecting graduate and postdoctoral researchers. The Human Capacity in STEM working group is focused on three strategic initiatives: defining and assessing national STEM needs, including programs and research projects; identifying and analyzing the available data regarding the STEM workforce; and creating and implementing a comprehensive national response that enhances STEM workforce development.
NSTC reported that as of June 2005 the subcommittee had a number of accomplishments and projects under way that related to attracting students to STEM fields. For example, it has (1) surveyed federal agency education programs designed to increase the participation of women and underrepresented minorities in STEM studies; (2) inventoried federal fellowship programs for graduate students and postdoctoral fellows; and (3) coordinated the Excellence in Science, Technology, Engineering, and
16GAO, Program Evaluation: An Evaluation Culture and Collaborative Partnerships Help
Build Agency Capacity, GAO-03-454 (Washington, D.C.: May 2, 2003).
A Subcommittee Was Established in 2003 to Help Coordinate STEM Education Programs among Federal Agencies
Page 18 GAO-06-114 Federal STEM Education Programs
Mathematics Education Week activities, which provide an opportunity for the nation’s schools to focus on improving mathematics and science education. In addition, the subcommittee is developing a Web site for federal educational resources in STEM fields and a set of principles that agencies would use in setting levels of support for graduate and postdoctoral fellowships and traineeships.
While the total numbers of students, graduates, and employees have increased in STEM fields, percentage changes for women, minorities, and international students varied during the periods reviewed. The increase in the percentage of students in STEM fields was greater than the increase in non-STEM fields, but the change in percentage of graduates in STEM fields was less than the percentage change in non-STEM fields. Moreover, employment increased more in STEM fields than in non-STEM fields. Further, changes in the percentages of minority students varied by race or ethnic group, international graduates continued to earn about a third or more of the advanced degrees in three STEM fields, and there was no statistically significant change in the percentage of women employees. Figure 2 summarizes key changes in the students, graduates, and employees in STEM fields.
Numbers of Students, Graduates, and Employees in STEM Fields Generally Increased, but Percentage Changes Varied

Page 19 GAO-06-114 Federal STEM Education Programs
Figure 2: Key Changes in Students, Graduates, and Employees in STEM Fields
Total enrollments of students in STEM fields have increased, and the percentage change was greater for STEM fields than non-STEM fields, but the percentage of students in STEM fields remained about the same. From the 1995-1996 academic year to the 2003-2004 academic year, total enrollments in STEM fields increased 21 percent—more than the 11 percent enrollment increase in non-STEM fields. The number of students enrolled in STEM fields represented 23 percent of all students enrolled during the 2003-2004 academic year, a modest increase from the 21 percent these students constituted in the 1995-1996 academic year. Table 9 summarizes the changes in overall enrollment across all education levels from the 1995-1996 academic year to the 2003-2004 academic year.
Numbers of Students in STEM Fields Grew, but This Increase Varied by Education Level and Student Characteristics
Source: GAO analysis of CPS, IPEDS, and NPSAS data; graphics in part by Art Explosion.
Students Graduates Employees
1995-1996 to 2003-2004
Percentage increase was greater in STEM than non-STEM
Increase mostly at bachelor’sand master’s level
Increase in percentage of women
Increase in minority students but percentage changes variedby race/ethnicity
Increase in international students at bachelor’s level
1994-1995 to 2002-2003
Decrease at doctoral level in most fields
Increase in percentagesof women in most fields
No change in percentages of minorities at master’s or doctoral levels
International graduatescontinued to earn about one-third or more of master’s and Ph.D.s in three fields
1994 - 2003
Increase was greater in STEMthan non-STEM
No significant change in percentage of women
African Americans continued to be less than 10 percent of the total
Median annual wages and salaries increased in all fields
UNIVERSITY
Total increase in STEM wasless than non-STEM

Page 20 GAO-06-114 Federal STEM Education Programs
Table 9: Estimated Changes in the Numbers and Percentages of Students in the STEM and Non-STEM Fields across All Education Levels, Academic Years 1995-1996 and 2003-2004
Academic year
1995-1996 Academic year
2003-2004
Enrollment measures
STEMNon-
STEM STEMNon-
STEM
Students enrolled (in thousands)
4,132 15,243
4,997 16,883
Percentage of total enrollment
21 79
23 77
Source: GAO calculations based upon NPSAS data.
Note: The totals for STEM and non-STEM enrollment include students in bachelor’s, master’s, and doctoral programs as well as students enrolled in certificate, associate’s, other undergraduate, first-professional degree, and post-bachelor’s or post-master’s certificate programs. The percentage changes between the 1995-1996 and 2003-2004 academic years for STEM and non-STEM students are statistically significant. See appendix V for confidence intervals associated with these estimates.
The increase in the numbers of students in STEM fields is mostly a result of increases at the bachelor’s and master’s levels. Of the total increase of about 865,000 students in STEM fields, about 740,000 was due to the increase in the numbers of students at the bachelor’s and master’s levels. See table 23 in appendix IV for additional information on the estimated numbers of students in STEM fields in academic years 1995-1996 and 2003-2004.
The percentage of students in STEM fields who are women increased from the 1995-1996 academic year to the 2003-2004 academic year, and in the 2003-2004 academic year women students constituted at least 50 percent of the students in 3 STEM fields—biological sciences, psychology, and social sciences. However, in the 2003-2004 academic year, men students continued to outnumber women students in STEM fields, and men constituted an estimated 54 percent of the STEM students overall. In addition, men constituted at least 76 percent of the students enrolled in computer sciences, engineering, and technology.17 See tables 24 and 25 in appendix IV for additional information on changes in the numbers and
17In 2004, we reported on women’s participation in federally funded science programs. Among other issues, this report discussed priorities pertaining to compliance with provisions of Title IX of the Education Amendments of 1972. For additional information, see GAO, Gender Issues: Women’s Participation in the Sciences Has Increased, but
Agencies Need to Do More to Ensure Compliance with Title IX, GAO-04-639, (Washington, D.C.: July 22, 2004).

Page 21 GAO-06-114 Federal STEM Education Programs
percentages of women students in the STEM fields for academic years 1995-1996 and 2003-2004.
While the numbers of domestic minority students in STEM fields also increased, changes in the percentages of minority students varied by racial or ethnic group. For example, Hispanic students increased 33 percent, from the 1995-1996 academic year to the 2003-2004 academic year. In comparison, the number of African American students increased about 69 percent. African American students increased from 9 to 12 percent of all students in STEM fields while Asian/Pacific Islander students continued to constitute about 7 percent. Table 10 shows the numbers and percentages of minority students in STEM fields for the 1995-1996 academic year and the 2003-2004 academic year.
Table 10: Estimated Percentage Changes in the Numbers and Percentages of Domestic Minority Students in STEM fields for All Education Levels for Academic Years 1995-1996 and 2003-2004
Race or ethnicity
Numbers of students, 1995-
1996 (in thousands)
Numbers of students, 2003-
2004 (in thousands)
Percentage change in the numbers of
students between academic years 1995-
1996 and 2003-2004
Minority group as a percentage of
students in STEM fields, academic
year 1995-1996
Minority group as a percentage of
students in STEM fields, academic
year 2003-2004
Black or African American 360 608 +69 9 12
Asian/Pacific Islander 289 345 +19 7 7
Hispanic or Latino origin 366 489 +33 9 10
American Indian 18 38 +107 0 1
Other/Multiple minorities 29 166 +475 1 3
Source: GAO calculations based upon NPSAS data.
Note: All percentage changes are statistically significant. See appendix V for confidence intervals associated with these estimates.
From the 1995-1996 academic year to the 2003-2004 academic year, the number of international students in STEM fields increased by about 57 percent solely because of an increase at the bachelor’s level. The numbers of international students in STEM fields at the master’s and doctoral levels declined, with the largest decline occurring at the doctoral level. Table 11 shows the numbers and percentage changes in international students from the 1995-1996 academic year to the 2003-2004 academic year.

Page 22 GAO-06-114 Federal STEM Education Programs
Table 11: Estimated Changes in Numbers of International Students in STEM fields by Education Levels from the 1995-1996 Academic Year to the 2003-2004 Academic Year
Education level Number of international
students, 1995-1996Number of international
students, 2003-2004 Percentage change
Bachelor’s 31,858 139,875 +339
Master’s 40,025 22,384 -44
Doctoral 36,461 7,582 -79
Total 108,344 169,841 +57
Source: GAO calculations based upon NPSAS data.
Note: Changes in enrollment between the 1995-1996 and 2003-2004 academic years are significant at the 95 percent confidence level for international students and for all education levels. See appendix V for confidence intervals associated with these estimates.
According to the Institute of International Education, from the 2002-2003 academic year to the 2003-2004 academic year, the number of international students declined for the first time in over 30 years, and that was the second such decline since the 1954-1955 academic year, when the institute began collecting and reporting data on international students.18 Moreover, in November 2004, the Council of Graduate Schools (CGS) reported a 6 percent decline in first-time international graduate student enrollment from 2003 to 2004. Following a decade of steady growth, CGS also reported that the number of first-time international students studying in the United States decreased between 6 percent and 10 percent for 3 consecutive years.
The number of graduates with degrees in STEM fields increased by 8 percent from the 1994-1995 academic year to the 2002-2003 academic year. However, during this same period the number of graduates with degrees in non-STEM fields increased by 30 percent. From academic year 1994-1995 to academic year 2002-2003, the percentage of graduates with STEM degrees decreased from 32 percent to 28 percent of total graduates. Table 12 provides data on the changes in the numbers and percentages of graduates in STEM and non-STEM fields.
18Institute of International Education, Open Doors: Report on International Educational
Exchange, 2004, New York.
Total Numbers of Graduates with STEM Degrees Increased, but Numbers Decreased in Some Fields, and Percentages of Minority Graduates at the Master’s and Doctoral Levels Did Not Change

Page 23 GAO-06-114 Federal STEM Education Programs
Table 12: Numbers of Graduates and Percentage Changes in STEM and Non-STEM Fields across All Degree Levels from the 1994-1995 Academic Year to the 2002-2003 Academic Year
STEM fields Non-STEM fields
Graduation measures
1994-1995 2002-2003Percentage
change
1994-1995 2002-2003Percentage
change
Graduates (in thousands) 519 560 +8 1,112 1,444 +30
Percentage of total graduates 32 28 -4 68 72 +4
Source: GAO calculations based upon IPEDS data.
Decreases in the numbers of graduates occurred in some STEM fields at each education level, but particularly at the doctoral level. The numbers of graduates with bachelor’s degrees decreased in four of eight STEM fields, the numbers with master’s degrees decreased in five of eight fields, and the numbers with doctoral degrees decreased in six of eight STEM fields. At the doctoral level, these declines ranged from 14 percent in mathematics/computer sciences to 74 percent in technology. Figure 3 shows the percentage change in graduates with degrees in STEM fields from the 1994-1995 academic year to the 2002-2003 academic year.

Page 24 GAO-06-114 Federal STEM Education Programs
Figure 3: Percentage Changes in Bachelor’s, Master’s, and Doctoral Graduates in STEM Fields from Academic Year 1994-1995 to Academic Year 2002-2003
From the 1994-1995 academic year to the 2002-2003 academic year, the total number of women graduates increased in four of the eight fields, and the percentages of women earning degrees in STEM fields increased in six of the eight fields at all three educational levels. Conversely, the total number of men graduates decreased, and the percentages of men graduates declined in six of the eight fields at all three levels from the 1994-1995 academic year to the 2002-2003 academic year. However, men continued to constitute over 50 percent of the graduates in five of eight fields at all three education levels. Table 13 summarizes the numbers of graduates by gender, level, and field. Table 26 in appendix IV provides additional data on the percentages of men and women graduates by STEM field and education level.
-70
-50
-30
-10
10
30
50
70
90
Tech
nolo
gy
Soci
al s
cien
ces
Psyc
holo
gy
Phys
ical
sci
ence
s
Mat
hem
atic
s/co
mpu
ter
Engi
neer
ing
Eart
h, a
tmos
pher
ic,
Bio
logi
cal/a
gric
ultu
ral
Percent change
Source: GAO calculations based upon IPEDS data.
sci
ence
s
and
ocea
n sc
ienc
es
sci
ence
s
-53
-41
-18-8 -6
-14
-29
-11-18
72
48
-14
0
-14
14
-15
1112
25
16
-74
-44-35
Bachelor’s
Master’s
Ph.D.s

Page 25 GAO-06-114 Federal STEM Education Programs
Table 13: Numbers and Percentage Changes in Men and Women Graduates with STEM Degrees by Education Level and Field for Academic Years 1994-1995 and 2002-2003
Number of men graduates
Number of women graduates
Education level STEM field 1994-1995 2002-2003
Percentage change in
men graduates 1994-1995 2002-2003
Percentage change in
women graduates
Biological/agricultural sciences 36,108 23,266 -36 35,648 35,546 0
Earth, atmospheric, and ocean sciences 2,954 2,243 -24 1,524 1,626 +7
Engineering 52,562 48,214 -8 10,960 11,709 +7
Mathematics and computer sciences 25,258 46,381 +84 13,651 20,436 +50
Physical sciences 9,607 8,739 -9 5,292 6,222 +18
Psychology 19,664 18,616 -5 53,010 64,470 +22
Social sciences 56,643 63,465 +12 56,624 77,701 +37
Bachelor’s level
Technology 14,349 9,174 -36 1,602 1,257 -22
Biological/agricultural sciences 4,768 2,413 -49 4,340 2,934 -32
Earth, atmospheric, and ocean sciences 1,032 805 -22 451 552 +22
Engineering 24,031 20,258 -16 4,643 5,271 +14
Mathematics and computer sciences 10,398 14,531 +40 4,474 7,517 +68
Physical sciences 2,958 2,350 -21 1,283 1,299 +1
Psychology 4,013 3,645 -9 10,319 12,433 +20
Social sciences 11,952 11,057 -7 11,398 13,674 +20
Master’s level
Technology 927 467 -50 222 173 -22
Biological/agricultural sciences 3,616 1,526 -58 2,160 1,161 -46
Earth, atmospheric, and ocean sciences 488 315 -35 134 125 -7
Engineering 5,401 4,159 -23 728 839 +15
Mathematics and computer sciences 1,690 1,378 -18 434 439 +1
Physical sciences 2,939 2,396 -18 922 892 -3
Psychology 1,529 1,380 -10 2,511 3,086 +23
Social sciences 2,347 2,111 -10 1,463 1,729 +18
Doctoral level
Technology 24 7 -71 3 0 -100
Source: GAO calculations based upon IPEDS data.

Page 26 GAO-06-114 Federal STEM Education Programs
The total numbers of domestic minority graduates in STEM fields increased, although the percentage of minority graduates with STEM degrees at the master’s or doctoral level did not change from the 1994-1995 academic year to the 2002-2003 academic year. For example, while the number of Native American graduates increased 37 percent, Native American graduates remained less than 1 percent of all STEM graduates at the master’s and doctoral levels. Table 14 shows the percentages and numbers of domestic minority graduates for the 1994-1995 academic year and the 2002-2003 academic year.
Table 14: Numbers and Percentage Changes in Domestic Minority Graduates in STEM Fields by Education Levels and Race or Ethnicity for Academic Years 1994-1995 and 2002-2003
Race or ethnicity Degree Level
Number of graduates in STEM fields,
1994-1995
Number of graduates in STEM fields,
2002-2003
Percentage change in graduates
Percentage of total graduates in STEM fields,
1994-1995
Percentage of total graduates in STEM fields,
2002-2003
Total 33,121 44,475 +34 6 8
Bachelor’s 28,236 37,195 +32 5 7
Master’s 4,358 6,588 +51 1 1
Black or African American
Doctoral 527 692 +31 0 0
Total 25,781 37,056 +44 5 7
Bachelor’s 22,268 32,255 +45 4 6
Master’s 3,015 4,121 +37 1 1
Hispanic or Latino origin
Doctoral 498 680 +37 0 0
Total 37,393 46,941 +26 7 8
Bachelor’s 29,389 39,030 +33 6 7
Master’s 6,064 6,814 +12 1 1
Asian/Pacific Islanders
Doctoral 1,940 1,097 -43 0 0
Total 2,488 3,409 +37 0 1
Bachelor’s 2,115 2,903 +37 0 1
Master’s 320 425 +33 0 0
Native Americans
Doctoral 53 81 +53 0 0
Source: GAO calculations based upon IPEDS data.
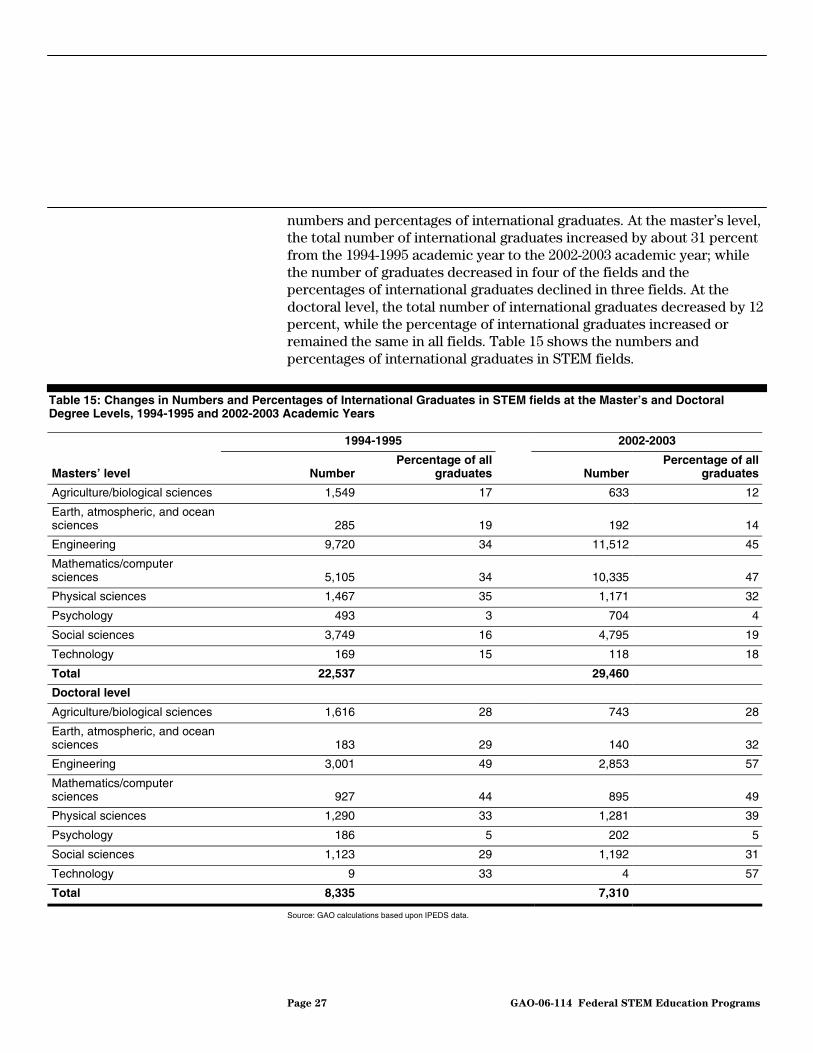
International students earned about one-third or more of the degrees at both the master’s and doctoral levels in several fields in the 1994-1995 and the 2002-2003 academic years. For example, in academic year 2002-2003, international students earned between 45 percent and 57 percent of all degrees in engineering and mathematics/computer sciences at the master’s and doctoral levels. However, at each level there were changes in the
Page 27 GAO-06-114 Federal STEM Education Programs
numbers and percentages of international graduates. At the master’s level, the total number of international graduates increased by about 31 percent from the 1994-1995 academic year to the 2002-2003 academic year; while the number of graduates decreased in four of the fields and the percentages of international graduates declined in three fields. At the doctoral level, the total number of international graduates decreased by 12 percent, while the percentage of international graduates increased or remained the same in all fields. Table 15 shows the numbers and percentages of international graduates in STEM fields.
Table 15: Changes in Numbers and Percentages of International Graduates in STEM fields at the Master’s and Doctoral Degree Levels, 1994-1995 and 2002-2003 Academic Years
1994-1995 2002-2003
Masters’ level
Number Percentage of all
graduates
Number Percentage of all
graduates
Agriculture/biological sciences 1,549 17 633 12
Earth, atmospheric, and ocean sciences
285 19
192 14
Engineering 9,720 34 11,512 45
Mathematics/computer sciences
5,105 34
10,335 47
Physical sciences 1,467 35 1,171 32
Psychology 493 3 704 4
Social sciences 3,749 16 4,795 19
Technology 169 15 118 18
Total 22,537 29,460
Doctoral level
Agriculture/biological sciences 1,616 28 743 28
Earth, atmospheric, and ocean sciences
183 29
140 32
Engineering 3,001 49 2,853 57
Mathematics/computer sciences
927 44
895 49
Physical sciences 1,290 33 1,281 39
Psychology 186 5 202 5
Social sciences 1,123 29 1,192 31
Technology 9 33 4 57
Total 8,335 7,310
Source: GAO calculations based upon IPEDS data.

Page 28 GAO-06-114 Federal STEM Education Programs
While the total number of STEM employees increased, this increase varied across STEM fields. Employment increased by 23 percent in STEM fields as compared to 17 percent in non-STEM fields from calendar year 1994 to calendar year 2003. Employment increased by 78 percent in the mathematics/computer sciences field and by 20 percent in the science field over this period. The changes in number of employees in the engineering and technology fields were not statistically significant. Employment estimates from 1994 to 2003 in the STEM fields are shown in figure 4.
Figure 4: Estimated Numbers of Employees in STEM Fields from Calendar Years 1994 through 2003
Note: Estimated number of employees have confidence intervals of within +/-9 percent of the estimate itself. See appendix VI for confidence intervals associated with these estimates.
From calendar years 1994 to 2003, the estimated number of women employees in STEM fields increased from about 2.7 million to about 3.5 million. Overall, there was not a statistically significant change in the percentage of women employees in the STEM fields. Table 16 shows the numbers and percentages of men and women employed in the STEM fields for calendar years 1994 and 2003.
STEM Employment Rose, but the Percentage of Women Remained About the Same and Minorities Continued to be Underrepresented
0
0.5
1.0
1.5
2.0
2.5
3.0
3.5
2003200220012000199919981997199619951994
Number of employees (in millions)
Source: GAO calculations based upon CPS data.
Calendar year
Science
Technology
Engineering
Mathematics/computer sciences

Page 29 GAO-06-114 Federal STEM Education Programs
Table 16: Estimated Numbers and Percentages of Employees in STEM Fields by Gender in Calendar Years 1994 and 2003 (numbers in thousands)
1994 2003
Men Women Men Women
STEM field Number Percent Number Percent Number Percent Number Percent
Science 792 32 1,711 68 829 28 2,179 72
Technology 955 68 445 32 1,050 71 425 29
Engineering 1,658 92 *141 8 1,572 90 *169 10
Mathematics/
computer sciences 1,056 71 432 29 1,952 74 695 26
Total 4,461 62 2,729 38 5,404 61 3,467 39
Source: GAO calculations based upon CPS data.
Note: Estimated employee numbers noted by an asterisk have a 95 percent confidence interval of within +/- 25 percent of the estimate itself. All other estimated employee numbers have a 95 percent confidence interval of within +/- 16 percent of the estimate. See appendix VI for confidence intervals associated with these estimates. Calculations of percentages and numbers may differ due to rounding.
In addition, the estimated number of minorities employed in the STEM fields as well as the percentage of total STEM employees they constituted increased, but African American and Hispanic employees remain underrepresented relative to their percentages in the civilian labor force.19 Between 1994 and 2003, the estimated number of African American employees increased by about 44 percent, the estimated numbers of Hispanic employees increased by 90 percent, as did the estimated numbers of other minorities employed in STEM fields.20 In calendar year 2003, African Americans comprised about 8.7 percent of STEM employees compared to about 10.7 percent of the CLF. Similarly, Hispanic employees comprised about 10 percent of STEM employees in calendar year 2003, compared to about 12.6 percent of the CLF. Table 17 shows the estimated percentages of STEM employees by selected racial or ethnic groups in 1994 and 2003.
19On the basis of March 2004 CPS estimates, the Pew Hispanic Research Center reported that over 10 million unauthorized immigrants resided in the United States and that people of Hispanic and Latino origin constituted a significant portion of these unauthorized immigrants.
20Other minorities include Asian/Pacific Islanders and American Indian or Alaska Native.

Page 30 GAO-06-114 Federal STEM Education Programs
Table 17: Estimated Percentages of STEM Employees by Selected Racial or Ethnic Group for Calendar Years 1994 and 2003
Race or ethnicity Percentage of total
STEM employees, 1994 Percentage of total
STEM employees, 2003
Black or African American 7.5 8.7
Hispanic or Latino origin 5.7 10.0
Other minoritiesa 4.5 6.9
Source: GAO calculations based upon CPS data.
Note: Estimated percentages have 95 percent confidence intervals of +/- 1 percentage point. Changes for African Americans between calendar years 1994 and 2003 were not statistically significant at the 95-percent confidence level. Differences for Hispanic or Latino origin and other minorities were statistically significant. See appendix VI for confidence intervals associated with these estimates.
aOther minorities include Asian/Pacific Islanders and American Indian or Alaska Native.
International employees have filled hundreds of thousands of positions, many in STEM fields, through the H-1B visa program. However, the numbers and types of occupations have changed over the years. We reported that while the limit for the H-1B program was 115,000 in 1999, the number of visas approved exceeded the limit by more than 20,000 because of problems with the system used to track the data.21 Available data show that in 1999, the majority of the approved occupations were in STEM fields. Specifically, an estimated 60 percent of the positions approved in fiscal year 1999 were related to information technology and 5 percent were for electrical/electronics engineering. By 2002, the limit for the H-1B program had increased to 195,000, but the number approved, 79,000, did not reach this limit. In 2003, we reported that the number of approved H-1B petitions in certain occupations had declined. For example, the number of approvals for systems analysis/programming positions declined by 106,671 from 2001 to 2002.22
Although the estimated total number of employees in STEM fields increased from 1994 to 2003, according to an NSF report, many with STEM degrees were not employed in these occupations. In 2004, NSF reported that about 67 percent of employees with degrees in science or engineering
21GAO, H-1B Foreign Workers: Better Controls Needed to Help Employers and Protect
Workers, GAO/HEHS-00-157 (Washington, D.C.: Sept. 7, 2000).
22GAO, H-1B Foreign Workers: Better Tracking Needed to Help Determine H-1B
Program’s Effects on U.S. Workforce, GAO-03-883 (Washington, D.C.: Sept. 10, 2003).
Page 31 GAO-06-114 Federal STEM Education Programs
were employed in fields somewhat or not at all related to their degree.23 Specifically, 70 percent of employees with bachelor’s degrees, 51 percent with master’s degrees, and 54 percent with doctoral degrees reported that their employment was somewhat or not at all related to their degree in science or engineering.
In addition to increases in the numbers of employees in STEM fields, inflation-adjusted median annual wages and salaries increased in all four STEM fields over the 10-year period (1994 to 2003). These increases ranged from 6 percent in science to 15 percent in engineering. Figure 5 shows trends in median annual wages and salaries for STEM fields.
23National Science Foundation, Science and Engineering Indicators, 2004, Volume 1, National Science Board, January 15, 2004.

Page 32 GAO-06-114 Federal STEM Education Programs
Figure 5: Estimated Median Annual Wages and Salaries in STEM Fields for Calendar Years 1994 through 2003
Note: Median annual wages and salaries have been adjusted for inflation. Estimated median annual wages and salaries have 95 percent confidence intervals of within +/- 2.3 percent. See appendix VI for confidence intervals associated with these estimates.
University officials, researchers, and students identified several factors that influenced students’ decisions about pursuing STEM degrees and occupations, and they suggested some ways to encourage more participation in STEM fields. Specifically, university officials said and researchers reported that the quality of teachers in kindergarten through 12th grades and the levels of mathematics and science courses completed during high school affected students’ success in and decisions about STEM fields. In addition, several sources noted that mentoring played a key role in the participation of women and minorities in STEM fields. Current students from five universities we visited generally agreed with these observations, and several said that having good mathematics and science instruction was important to their overall educational success. International students’ decisions about participating in STEM education
University Officials and Others Cited Several Factors That Influence Decisions about Participation in STEM Fields and Suggested Ways to Encourage Greater Participation
0
10
20
30
40
50
60
70
2003200220012000199919981997199619951994
Annual wages and salaries (in thousands of dollars)
Source: GAO calculations based upon CPS data.
Calendar year
Science
Technology
Engineering
Mathematics/computer sciences

Page 33 GAO-06-114 Federal STEM Education Programs
and occupations were affected by opportunities outside the United States and the visa process. To encourage more student participation in the STEM fields, university officials, researchers, and others have made several suggestions, and four were made repeatedly. These suggestions focused on teacher quality, high school students’ math and science preparation, outreach activities, and the federal role in STEM education.
University officials frequently cited teacher quality as a key factor that affected domestic students’ interest in and decisions about pursuing STEM degrees and occupations. Officials at all eight universities we visited expressed the view that a student’s experience from kindergarten through the 12th grades played a large role in influencing whether the student pursued a STEM degree. Officials at one university we visited said that students pursuing STEM degrees have associated their interests with teachers who taught them good skills in mathematics or excited them about science. On the other hand, officials at many of the universities we visited told us that some teachers were unqualified and unable to impart the subject matter, causing students to lose interest in mathematics and science. For example, officials at one university we visited said that some elementary and secondary teachers do not have sufficient training to effectively teach students in the STEM fields and that this has an adverse effect on what students learn in these fields and reduces the interest and enthusiasm students express in pursuing coursework in high school, degree programs in college, or careers in these areas.
Teacher quality issues, in general, have been cited in past reports by Education. In 2002, Education reported that in the 1999-2000 school year, 14 to 22 percent of middle-grade students taking English, mathematics, and science were in classes led by teachers without a major, minor, or certification in these subjects—commonly referred to as “out-of-field” teachers.24 Also, approximately 30 to 40 percent of the middle-grade students in biology/life science, physical science, or English as a second language/bilingual education classes had teachers lacking these credentials. At the high school level, 17 percent of students enrolled in physics and 36 percent of those enrolled in geology/earth/space science were in classes instructed by out-of-field teachers. The percentages of
24National Center for Education Statistics, Qualifications of the Public School Teacher
Workforce: Prevalence of Out-of-Field Teaching 1987-88 to 1999-2000, May 2002, revised August 2004,Washington, D.C.
Teacher Quality and Mathematics and Science Preparation Were Cited as Key Factors Affecting Domestic Students’ STEM Participation Decisions

Page 34 GAO-06-114 Federal STEM Education Programs
students taught by out-of-field teachers were significantly higher when the criteria used were teacher certification and a major in the subject taught. For example, 45 percent of the high school students enrolled in biology/life science and approximately 30 percent of those enrolled in mathematics, English, and social science classes had out-of-field teachers. During the 2002-2003 school year, Education reported that the number and distribution of teachers on waivers—which allowed prospective teachers in classrooms while they completed their formal training—was problematic. Also, states reported that the problem of underprepared teachers was worse on average in districts that serve large proportions of high-poverty children—the percentage of teachers on waivers was larger in high-poverty school districts than all other school districts in 39 states. Moreover, in 2004, Education reported that 48 of the 50 states granted waivers.25
In addition to teacher quality, students’ high school preparation in mathematics and science was cited by university officials and others as affecting students’ success in college-level courses and their decisions about pursuing STEM degrees and occupations. University officials at six of the eight universities we visited cited students’ ability to opt out of mathematics and science courses during high school as a factor that influenced whether they would participate and succeed in the STEM fields during undergraduate and graduate school. University officials said, for example, that because many students had not taken higher-level mathematics and science courses such as calculus and physics in high school, they were immediately behind other students who were better prepared. In July 2005, on the basis of findings from the 2004 National Assessment of Educational Progress, the National Center for Education Statistics reported that 17 percent of the 17-year-olds reported that they had taken calculus, and this represents the highest percentage in any previous assessment year.26 In a study that solicited the views of several hundred students who had left the STEM fields, researchers found that the effects of inadequate high school preparation contributed to college students’ decisions to leave the science fields.27 These researchers found
25U.S. Department of Education, The Secretary’s Third Annual Report on Teacher Quality, Office of Postsecondary Education, 2004, Washington, D.C.
26U.S. Department of Education, National Center for Education Statistics, Institute of Education Sciences, The Nation’s Report Card, NAEP 2004: Trends in Academic
Progress, July 2005, Washington, D.C.
27Seymour, Elaine, and Nancy M. Hewitt, Talking about Leaving: Why Undergraduates
Leave the Sciences, Westview Press, 1997, Boulder, Colorado.

Page 35 GAO-06-114 Federal STEM Education Programs
that approximately 40 percent of those college students who left the science fields reported some problems related to high school science preparation. The underpreparation was often linked to problems such as not understanding calculus; lack of laboratory experience or exposure to computers, and no introduction to theoretical material or to analytic modes of thought. Further, 12 current students we interviewed said they were not adequately prepared for college mathematics or science. For example, one student stated that her high school courses had been limited because she attended an all-girls school where the curriculum catered to students who were not interested in STEM, and so it had been difficult to obtain the courses that were of interest to her.
Several other factors were mentioned during our interviews with university officials, students, and others as influencing decisions about participation in STEM fields. These factors included relatively low pay in STEM fields, additional tuition costs to obtain STEM degrees, lack of commitment on the part of some students to meet the rigorous academic demands, and the inability of some professors in STEM fields to effectively impart their knowledge to students in the classrooms. For example, officials from five universities said that low pay in STEM fields relative to other fields such as law and business dissuaded students from pursuing STEM degrees in some areas. Also, in a study that solicited the views of college students who left the STEM fields as well as those who continued to pursue STEM degrees, researchers found that students experienced greater financial difficulties in obtaining their degrees because of the extra time needed to obtain degrees in certain STEM fields. Researchers also noted that poor teaching at the university level was the most common complaint among students who left as well as those who remained in STEM fields. Students reported that faculty do not like to teach, do not value teaching as a professional activity, and therefore lack any incentive to learn to teach effectively.28 Finally, 11 of the students we interviewed commented about the need for professors in STEM fields to alter their methods and to show more interest in teaching to retain students’ attention.
28Seymour and Hewitt.

Page 36 GAO-06-114 Federal STEM Education Programs
University officials and students said that mentoring is important for all students but plays a vital role in the academic experiences of women and minorities in the STEM fields. Officials at seven of the eight universities discussed the important role that mentors play, especially for women and minorities in STEM fields. For example, one professor said that mentors helped students by advising them on the best track to follow for obtaining their degrees and achieving professional goals. Also, four students we interviewed—three women and one man—expressed the importance of mentors. Specifically, while all four students identified mentoring as critical to academic success in the STEM fields, two students expressed their satisfaction since they had mentors, while the other two students said that it would have been helpful to have had someone who could have been a mentor or role model.
Studies have also reported that mentors play a significant role in the success of women and minorities in the STEM fields. In 2004, some of the women students and faculty with whom we talked reported a strong mentor was a crucial part in the academic training of some of the women participating in sciences, and some women had pursued advanced degrees because of the encouragement and support of mentors.29 In September 2000, a congressional commission reported that women were adversely affected throughout the STEM education pipeline and career path by a lack of role models and mentors.30 For example, the report found that girls rejection of mathematics and science may be partially driven by teachers, parents, and peers when they subtly, and not so subtly, steer girls away from the informal technical pastimes (such as working on cars, fixing bicycles, and changing hardware on computers) and science activities (such as science fairs and clubs) that too often were still thought of as the province of boys. In addition, the commission reported that a greater proportion of women switched out of STEM majors than men, relative to their representation in the STEM major population. Reasons cited for the higher attrition rate among women students included lack of role models, distaste for the competitive nature of science and engineering education, and inability to obtain adequate academic guidance or advice. Further, according to the report, women’s retention and graduation in STEM graduate programs were affected by their interaction with faculty,
29GAO-04-639.
30Report of the Congressional Commission on the Advancement of Women and Minorities in Science, Engineering and Technology Development, Land of Plenty: Diversity as
America’s Competitive Edge in Science, Engineering, and Technology, September 2000.
Mentoring Cited as a Key Factor Affecting Women’s and Minorities’ STEM Participation Decisions
Page 37 GAO-06-114 Federal STEM Education Programs
integration into the department (versus isolation), and other factors, including whether there were role models, mentors, and women faculty.
Officials at seven of the eight universities visited, along with education policy experts, told us that competition from other countries for top international students, and educational or work opportunities, affected international students’ decisions about studying in the United States. They told us that other countries, including Canada, Australia, New Zealand, and the United Kingdom, had seized the opportunity since September 11 to compete against the United States for international students who were among the best students in the world, especially in the STEM fields. Also, university officials told us that students from several countries, including China and India, were being recruited to attend universities and get jobs in their own countries. In addition, education organizations and associations have reported that global competition for the best science and engineering students and scholars is under way. One organization, NAFSA: Association of International Educators reported that the international student market has become highly competitive, and the United States is not competing as well as other countries.31
According to university officials, international students’ decisions about pursuing STEM degrees and occupations in the United States were also influenced by the perceived unwelcoming attitude of Americans and the visa process. Officials from three of the universities said that the perceived unwelcoming attitude of Americans had affected the recruitment of international students to the United States. Also, officials at six of the eight universities visited expressed their concern about the impact of the tightened visa procedures and/or increased security measures since September 11 on international graduate school enrollments. For example, officials at one university stated that because of the time needed to process visas, a few students had missed their class start dates. Officials from one university told us that they were being more proactive in helping new international students navigate the visa system, to the extent possible. While some university officials acknowledged that visa processing had significantly improved, since 2003 several education associations have
31NAFSA: Association of International Educators, In America’s Interest: Welcoming
International Students, Report of the Strategic Task Force on International Student Access, January 14, 2003, Washington, D.C.
International Students’ STEM Participation Decisions Were Affected by Opportunities Outside the United States and the Visa Process

Page 38 GAO-06-114 Federal STEM Education Programs
requested further changes in U.S. visa policies because of the lengthy procedures and time needed to obtain approval to enter the country.
We have reported on various aspects of the visa process, made several recommendations, and noted that some improvements have been made. In October 2002 we cited the need for a clear policy on how to balance national security concerns with the desire to facilitate legitimate travel when issuing visas and we made several recommendations to help improve the visa process.32 In 2003, we reported that the Departments of State, Homeland Security, and Justice could more effectively manage the visa function if they had clear and comprehensive policies and procedures and increased agency coordination and information sharing.33 In February 2004 and February 2005, we reported on the State Department’s efforts to improve the program for issuing visas to international science students and scholars. In 2004 we found that the time to adjudicate a visa depended largely on whether an applicant had to undergo a security check known as Visas Mantis, which is designed to protect against sensitive technology transfers. Based on a random sample of Visas Mantis cases for science students and scholars, it took State an average of 67 days to complete the process.34 In 2005, we reported a significant decline in Visas Mantis processing times and in the number of cases pending more than 60 days.35 We also reported that, in some cases, science students and scholars can obtain a visa within 24 hours.
We have also issued several reports on SEVIS operations. In June 2004 we noted that when SEVIS began operating, significant problems were reported.36 For example, colleges and universities and exchange programs had trouble gaining access to the system, and when access was obtained, these users’ sessions would “time out” before they could complete their tasks. In that report we also noted that SEVIS performance had improved,
32GAO, Border Security: Visa Process Should Be Strengthened as an Antiterrorism Tool, GAO-03-132NI (Washington, D.C.: Oct. 21, 2002).
33GAO, Border Security: New Policies and Increased Interagency Coordination Needed to
Improve Visa Process, GAO-03-1013T (Washington, D. C.: July 15, 2003).
34GAO, Border Security: Improvements Needed to Reduce Time Taken to Adjudicate Visas
for Science Students and Scholars, GAO-04-371 (Washington, D.C.: Feb. 25, 2004).
35GAO-05-198.
36GAO, Homeland Security: Performance of Information System to Monitor Foreign
Students and Exchange Visitors Has Improved, but Issues Remain, GAO-04-690 (Washington, D.C.: June 18, 2004).

Page 39 GAO-06-114 Federal STEM Education Programs
but that several key system performance requirements were not being measured. In March 2005, we reported that the Department of Homeland Security (DHS) had taken steps to address our recommendations and that educational organizations generally agreed that SEVIS performance had continued to improve.37 However, educational organizations continued to cite problems, which they believe created hardships for students and exchange visitors.
To increase the number of students entering STEM fields, officials from seven universities and others stated that teacher quality needs to improve. Officials of one university said that kindergarten through 12th grade classrooms need teachers who are knowledgeable in the mathematics and science content areas. As previously noted, Education has reported on the extent to which classes have been taught by teachers with little or no content knowledge in the STEM fields. The Congressional Commission on the Advancement of Women and Minorities reported that teacher effectiveness is the most important element in a good education.38 The commission also suggested that boosting teacher effectiveness can do more to improve education than any other single factor. States are taking action to meet NCLBA’s requirement of having all teachers of core academic subjects be highly qualified by the end of the 2005-2006 school year.
University officials and some students suggested that better preparation and mandatory courses in mathematics and science were needed for students during their kindergarten through 12th grade school years. Officials from five universities suggested that mandatory mathematics and science courses, especially in high school, may lead to increased student interest and preparation in the STEM fields. With a greater interest and depth of knowledge, students would be better prepared and more inclined to pursue STEM degrees in college. Further, nearly half of the students who replied to this question suggested that students needed additional mathematics and science training prior to college. However, adding
37GAO, Homeland Security: Performance of Foreign Student and Exchange Visitor
Information System Continues to Improve, but Issues Remain, GAO-05-440T (Washington, D.C.: March 17, 2005).
38Report of the Congressional Commission on the Advancement of Women and Minorities in Science, Engineering and Technology Development, Land of Plenty: Diversity as
America’s Competitive Edge in Science, Engineering, and Technology, September 2000.
Several Suggestions Were Made to Encourage More Participation in the STEM Fields

Page 40 GAO-06-114 Federal STEM Education Programs
mathematics and science classes has resource implications, since more teachers in these subjects would be needed. Also this change could require curriculum policy changes that would take time to implement.
More outreach, especially to women and minorities from kindergarten through the 12th grade, was suggested by university officials, students, and other organizations. Officials from six of the universities we visited suggested that increased outreach activities are needed to help create more interest in mathematics and science for younger students. For example, at one university we visited, officials told us that through inviting students to their campuses or visiting local schools, they have provided some students with opportunities to engage in science laboratories and hands-on activities that foster interest and excitement for students and can make these fields more relevant in their lives. Officials from another university told us that these experiences were especially important for women and minorities who might not have otherwise had these opportunities. The current students we interviewed also suggested more outreach activities. Specifically, two students said that outreach was needed to further stimulate students’ interest in the STEM fields. One organization, Building Engineering and Science Talent (BEST), suggested that research universities increase their presence in prekindergarten through 12th grade mathematics and science education in order to strengthen domestic students’ interests and abilities. BEST reported that one model producing results entailed universities adopting students from low-income school districts from 7th through 12th grades and providing them advanced instruction in algebra, chemistry, physics, and trigonometry. However, officials at one university told us that because of limited resources, their efforts were constrained and only a few students would benefit from this type of outreach.
Furthermore, university officials from the eight schools and other education organizations made suggestions regarding the role of the federal government. University officials suggested that the federal government could enhance its role in STEM education by providing more effective leadership through developing and implementing a national agenda for STEM education and increasing federal funding for academic research. Officials at six universities suggested that the federal government undertake a new initiative modeled after the National Defense Education Act of 1958, enacted in response to the former Soviet Union’s achievement in its space program, which provided new funding for mathematics and science education and training at all education levels. In June 2005, CGS called for a renewed commitment to graduate education by the federal government through actions such as providing funds to support students

Page 41 GAO-06-114 Federal STEM Education Programs
trained at the doctoral level in the sciences, technology, engineering, and mathematics; expanding U.S. citizen participation in doctoral study in selected fields through graduate support awarded competitively to universities across the country; requiring recruitment, outreach, and mentoring activities that promote greater participation and success, especially for underrepresented groups; and fostering interdisciplinary research preparation. In August 2003, the National Science Board recommended that the federal government direct substantial new support to students and institutions in order to improve success in science and engineering studies by domestic undergraduate students from all demographic groups. According to this report, such support could include scholarships and other forms of financial assistance to students, incentives to institutions to expand and improve the quality of their science and engineering programs in areas in which degree attainment is insufficient, financial support to community colleges to increase the success of students in transferring to 4-year science and engineering programs, and expanded funding for programs that best succeed in graduating underrepresented minorities and women in science and engineering. BEST also suggested that the federal government allocate additional resources to expand the mathematics and science education opportunities for underrepresented groups. However, little is known about how well federal resources have been used in the past. Changes that would require additional federal funds would likely have an impact on other federal programs, given the nation’s limited resources and growing fiscal imbalance, and changing the federal role could take several years.
While the total numbers of STEM graduates have increased, some fields have experienced declines, especially at the master’s and doctoral levels. Given the trends in the numbers and percentages of students pursuing STEM degrees, particularly advanced degrees, and recent developments that have influenced international students’ decisions about pursuing degrees in the United States, it is uncertain whether the number of STEM graduates will be sufficient to meet future academic and employment needs and help the country maintain its technological competitive advantage. Moreover, it is too early to tell if the declines in international graduate student enrollments will continue in the future. In terms of employment, despite some gains, the percentage of women in the STEM workforce has not changed significantly, minority employees remain underrepresented, and many with degrees in STEM fields are not employed in STEM occupations.
Concluding Observations

Page 42 GAO-06-114 Federal STEM Education Programs
To help improve the trends in the numbers of students, graduates, and employees in STEM fields, university officials and others made several suggestions, such as increasing the federal commitment to STEM education programs. However, before making changes, it is important to know the extent to which existing STEM education programs are appropriately targeted and making the best use of available federal resources. Additionally, in an era of limited financial resources and growing federal deficits, information about the effectiveness of these programs can help guide policy makers and program managers.
We received written comments on a draft of this report from Commerce, the Department of Health and Human Services (HHS), NSF, and NSTC. These comments are reprinted in appendixes VII, VIII, IX, and X, respectively. We also received technical comments from the Departments of Commerce, Health and Human Services, Homeland Security, Labor, and Transportation; and the Environmental Protection Agency and National Aeronautics and Space Administration, which we incorporated when appropriate.
In commenting on a draft of this report, Commerce, HHS, and NSTC commended GAO for this work. Commerce explicitly concurred with several findings and agreed with our overall conclusion. However, Commerce suggested that we revise the conclusion to point out that despite overall increases in STEM students, the numbers of graduates in certain fields have declined. We modified the concluding observations to make this point. HHS agreed with our conclusion that it is important to evaluate ongoing programs to determine the extent to which they are achieving their desired results. The comments from NSTC cited improvements made to help ensure that international students, exchange visitors, and scientists are able to apply for and receive visas in a timely manner. We did not make any changes to the report since we had cited another GAO product that discussed such improvements in the visa process.
NSF commented about several of our findings. NSF stated that our program evaluations finding may be misleading largely because the type of information GAO requested and accepted from agencies was limited to program level evaluations and did not include evaluations of individual underlying projects. NSF suggested that we include information on the range of approaches used to assure program effectiveness. Our finding is based on agency officials’ responses to a survey question that did not limit or stipulate the types of evaluations that could have been included.
Agency Comments and Our Evaluation

Page 43 GAO-06-114 Federal STEM Education Programs
Nonetheless, we modified the report to acknowledge that NSF uses various approaches to evaluate its programs.
NSF criticized the methodology we used to support our finding on the factors that influence decisions about pursuing STEM fields and suggested that we make it clearer in the body of the report that the findings are based on interviews with educators and administrators from 8 colleges and universities, and responses from 31 students. Also, NSF suggested that we improve the report by including corroborating information from reports and studies. Our finding was not limited to interviews at the 8 colleges and universities and responses from 31 current students but was also based on interviews with numerous representatives and policy experts from various organizations as well as findings from research and reports—which are cited in the body of the report. Using this approach, we were able to corroborate the testimonial evidence with data from reports and research as well as to determine whether information in the reports and research remained accurate by seeking the views of those currently teaching or studying in STEM fields. As NSF noted, this approach yielded reasonable observations. Additional information about our methodology is listed in appendix I, and we added a bibliography that identifies the reports and research used during the course of this review.
NSF also commented that the report mentions the NSTC efforts for interagency collaboration, but does not mention other collaboration efforts such as the Federal Interagency Committee on Education and the Federal Interagency Coordinating Council. NSF also pointed out that interagency collaboration occurs at the program level. We did not modify the report in response to this comment. In conducting our work, we determined that the NSTC effort was the primary mechanism for interagency collaboration focused on STEM programs. The coordinating groups cited by NSF are focused on different issues. The Federal Interagency Committee on Education was established to coordinate the federal programs, policies, and practices affecting education broadly, and the Federal Interagency Coordinating Council was established to minimize duplication of programs and activities relating to children with disabilities.
In addition, NSF provided information to clarify examples related to their programs that we cited in the report, stated that some data categories were not clear, and commented on the graduate level enrollment data we used in the report. NSF pointed out that while its program called Opportunities for Enhancing Diversity in the Geosciences is designed to increase participation by minorities, it does not limit eligibility to minorities. Also, NSF noted that while the draft report correctly indicated
Page 44 GAO-06-114 Federal STEM Education Programs
that students receiving scholarships or fellowships from NSF must be U.S. citizens or permanent residents, the reason given for limiting participation in these programs in the draft report was not accurate. According to NSF, these restrictions are considered to be an effective strategy to support its goal of creating a diverse, competitive and globally engaged U.S. workforce of scientists, engineers, technologists and well prepared citizens. We revised the report to reflect these changes. Further, NSF commented that the data categories were not clear, particularly the technology degrees and occupations, and that the data did not include associate degrees. We added information that lists all of the occupations included in the analysis, and we added footnotes to clarify which data included associate degrees and which ones did not. In addition, NSF commented that the graduate level enrollment data for international students based on NPSAS data are questionable in comparison with other available data and that this may be because the NPSAS data include a relatively small sample for graduate education. We considered using NPSAS and other data but decided to use the NPSAS data for two reasons: NPSAS data were more comprehensive and more current. Specifically, the NPSAS data were available through the 2003-2004 academic year and included numbers and characteristics of students enrolled for all degree fields—STEM and non-STEM—for all education levels, and citizenship information.
Copies of this report are being sent to the Secretaries of Agriculture, Commerce, Education, Energy, Health and Human Services, Interior, Homeland Security, Labor, and Transportation; the Administrators for the Environmental Protection Agency and the National Aeronautics and Space Administration; and the Directors of the National Science Foundation and the National Science and Technology Council; appropriate congressional committees; and interested parties. Copies will be made available to others upon request. The report is also available on GAO’s Web site at http://www.gao.gov.

Page 45 GAO-06-114 Federal STEM Education Programs
If you or your staff have any questions about this report, please contact me on (202) 512-7215 or [email protected]. Contact points for our Offices of Congressional Relations and Public Affairs may be found on the last page of this report. GAO staff who made major contributions to this report are listed in appendix VII.
Sincerely yours,
Cornelia M. Ashby, Director Education, Workforce, and Income Security Issues

Appendix I: Objectives, Scope, and
Methodology
Page 46 GAO-06-114 Federal STEM Education Programs
The objectives of our study were to determine (1) the number of federal civilian education programs funded in fiscal year 2004 that were specifically designed to increase the number of students and graduates pursuing science, technology, engineering, and mathematics (STEM) degrees and occupations, or improve educational programs in STEM fields, and what agencies report about their effectiveness; (2) how the numbers, percentages, and characteristics of students, graduates, and employees in STEM fields have changed over the years; and (3) factors cited by educators and others as influencing people’s decisions about pursuing STEM degrees and occupations, and suggestions to encourage greater participation in STEM fields.
In conducting our review, we used multiple methodologies. We (1) conducted a survey of federal departments and agencies that sponsored education programs specifically designed to increase the number of students and graduates pursuing STEM degrees and occupations or improve educational programs in STEM fields; (2) obtained and analyzed data, including the most recent data available, on students, graduates, and employees in STEM fields and occupations; (3) visited eight colleges and universities; (4) reviewed reports and studies; and (5) interviewed agency officials, representatives and policy experts from various organizations, and current students. We conducted our work between October 2004 and October 2005 in accordance with generally accepted government auditing standards.
To provide Congress with a better understanding of what programs federal agencies were supporting to increase the nation’s pool of scientists, technologists, engineers, and mathematicians, we designed a survey to determine (1) the number of federal education programs (prekindergarten through postdoctorate) designed to increase the quantity of students and graduates pursuing STEM degrees and occupations or improve the educational programs in STEM fields and (2) what agencies reported about the effectiveness of these programs. The survey asked the officials to describe the goals, target population, and funding levels for fiscal years 2003, 2004, and 2005 of such programs. In addition, the officials were asked when the programs began and if the programs had been or were being evaluated.
We identified the agencies likely to support STEM education programs by reviewing the Catalog of Federal Domestic Assistance and the Department of Education’s Eisenhower National Clearinghouse, Guidebook of Federal
Appendix I: Objectives, Scope, and Methodology
Objectives
Scope and Methodology
Survey

Appendix I: Objectives, Scope, and
Methodology
Page 47 GAO-06-114 Federal STEM Education Programs
Resources for K-12 Mathematics and Science, 2004-05. Using these resources, we identified 15 agencies with STEM education programs. The survey was conducted via e-mail using an ActiveX enabled MSWord attachment. A contact point was designated for each agency, and questionnaires were sent to that individual. One questionnaire was completed for each program the agency sponsored. Agency officials were asked to provide confirming documentation for their responses whenever possible.
The questionnaire was forwarded to agencies on February 15, 2005, and responses were received through early May 2005. We received 244 completed surveys and determined that 207 of them met the criteria for STEM programs. The following agencies participated in our survey: the Departments of Agriculture, Commerce, Education, Energy, Homeland Security, Interior, Labor, and Transportation. In addition, the Health Resources and Services Administration, Indian Health Service, and National Institutes of Health, all part of Health and Human Services, took part in the survey. Also participating were the U.S. Environmental Protection Agency; the National Aeronautics and Space Administration; and the National Science Foundation. Labor’s programs did not meet our criteria for 2004 and the Department of Defense (DOD) did not submit a survey. According to DOD officials, DOD needed 3 months to complete the survey and therefore could not provide responses within the time frames of our work. We obtained varied amounts of documentation from 13 civilian agencies for the 207 STEM education programs funded in 2004 and information about the effectiveness of some programs.
Because we administered the survey to all of the known federal agencies sponsoring STEM education programs, our results are not subject to sampling error. However, the practical difficulties of conducting any survey may introduce other types of errors, commonly referred to as nonsampling errors. For example, differences in how a particular question is interpreted, the sources of information available to respondents in answering a question, or the types of people who do not respond can introduce unwanted variability into the survey results. We included steps in the development of the survey, the collection of data, and the editing and analysis of data for the purpose of minimizing such nonsampling errors. To reduce nonsampling error, the questionnaire was reviewed by survey specialists and pretested in person with three officials from agencies familiar with STEM education programs to develop a questionnaire that was relevant, easy to comprehend, unambiguous, and unbiased. We made changes to the content and format of the questionnaire based on the specialists’ reviews and the results of the pretests. To further
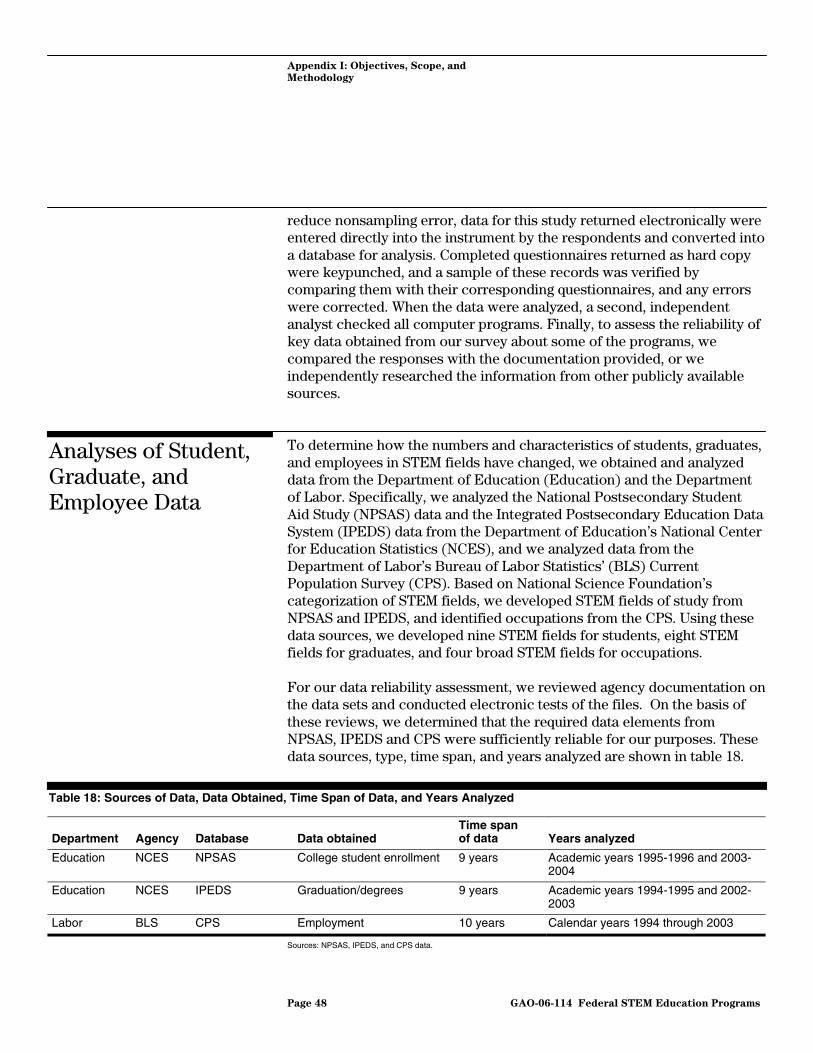
Appendix I: Objectives, Scope, and
Methodology
Page 48 GAO-06-114 Federal STEM Education Programs
reduce nonsampling error, data for this study returned electronically were entered directly into the instrument by the respondents and converted into a database for analysis. Completed questionnaires returned as hard copy were keypunched, and a sample of these records was verified by comparing them with their corresponding questionnaires, and any errors were corrected. When the data were analyzed, a second, independent analyst checked all computer programs. Finally, to assess the reliability of key data obtained from our survey about some of the programs, we compared the responses with the documentation provided, or we independently researched the information from other publicly available sources.
To determine how the numbers and characteristics of students, graduates, and employees in STEM fields have changed, we obtained and analyzed data from the Department of Education (Education) and the Department of Labor. Specifically, we analyzed the National Postsecondary Student Aid Study (NPSAS) data and the Integrated Postsecondary Education Data System (IPEDS) data from the Department of Education’s National Center for Education Statistics (NCES), and we analyzed data from the Department of Labor’s Bureau of Labor Statistics’ (BLS) Current Population Survey (CPS). Based on National Science Foundation’s categorization of STEM fields, we developed STEM fields of study from NPSAS and IPEDS, and identified occupations from the CPS. Using these data sources, we developed nine STEM fields for students, eight STEM fields for graduates, and four broad STEM fields for occupations.
For our data reliability assessment, we reviewed agency documentation on the data sets and conducted electronic tests of the files. On the basis of these reviews, we determined that the required data elements from NPSAS, IPEDS and CPS were sufficiently reliable for our purposes. These data sources, type, time span, and years analyzed are shown in table 18.
Table 18: Sources of Data, Data Obtained, Time Span of Data, and Years Analyzed
Department Agency Database Data obtained Time span of data Years analyzed
Education NCES NPSAS College student enrollment 9 years Academic years 1995-1996 and 2003-2004
Education NCES IPEDS Graduation/degrees 9 years Academic years 1994-1995 and 2002-2003
Labor BLS CPS Employment 10 years Calendar years 1994 through 2003
Sources: NPSAS, IPEDS, and CPS data.
Analyses of Student, Graduate, and Employee Data

Appendix I: Objectives, Scope, and
Methodology
Page 49 GAO-06-114 Federal STEM Education Programs
NPSAS is a comprehensive nationwide study designed to determine how students and their families pay for postsecondary education, and to describe some demographic and other characteristics of those enrolled. The study is based on a nationally representative sample of students in postsecondary education institutions, including undergraduate, graduate, and first-professional students. The NPSAS has been conducted every several years since the 1986-1987 academic year. For this report, we analyzed the results of the NPSAS survey for the 1995-1996 academic year and the 2003-2004 academic year to compare student enrollment and demographic characteristics between these two periods for the nine STEM fields and non-STEM fields.
Because the NPSAS sample is a probability sample of students, the sample is only one of a large number of samples that might have been drawn. Since each sample could have provided different estimates, confidence in the precision of the particular sample’s results is expressed as a 95-percent confidence interval (for example, plus or minus 4 percentage points). This is the interval that would contain the actual population value for 95 percent of the samples that could have been drawn. As a result, we are 95 percent confident that each of the confidence intervals in this report will include the true values in the study population. NPSAS estimates used in this report and the upper and lower bounds of the 95 percent confidence intervals for each estimate relied on in this report are presented in appendix V.
IPEDS is a single, comprehensive system designed to encompass all institutions and educational organizations whose primary purpose is to provide postsecondary education. IPEDS is built around a series of interrelated surveys to collect institution-level data in such areas as enrollments, program completions, faculty, staff, and finances. For this report, we analyzed the results of IPEDS data for the 1994-1995 academic year and the 2002-2003 academic year to compare the numbers and characteristics of graduates with degrees in eight STEM fields and non-STEM fields.
To analyze changes in employees in STEM and non-STEM fields, we obtained employment estimates from BLS’s Current Population Survey March supplement for 1995 through 2004 (calendar years 1994 through 2003). The CPS is a monthly survey of households conducted by the U.S. Census Bureau (Census) for BLS. The CPS provides a comprehensive body of information on the employment and unemployment experience of the nation’s population, classified by age, sex, race, and a variety of other characteristics. A more complete description of the survey, including

Appendix I: Objectives, Scope, and
Methodology
Page 50 GAO-06-114 Federal STEM Education Programs
sample design, estimation, and other methodology can be found in the CPS documentation prepared by Census and BLS.1
This March supplement (the Annual Demographic Supplement) is specifically designed to estimate family characteristics, including income from all sources and occupation and industry classification of the job held longest during the previous year. It is conducted during the month of March each year because it is believed that since March is the month before the deadline for filing federal income tax returns, respondents would be more likely to report income more accurately than at any other point during the year.2
We used the CPS data to produce estimates on (1) four STEM fields, (2) men and women, (3) two separate minority groups (Black or African American, and Hispanic or Latino origin), and (4) median annual wages and salaries. The measures of median annual wages and salaries could include bonuses, but do not include noncash benefits such as health insurance or pensions. CPS salary reported in March of each year was for the longest held position actually worked the year before and reported by the worker himself (or a knowledgeable member of the household). Tables 19 and 20 list the classification codes and occupations included in our analysis of CPS data over a 10-year period (1994-2003). In developing the STEM groups, we considered the occupational requirements and educational attainment of individuals in certain occupations. We also excluded doctors and other health care providers except registered nurses. During the period of review, some codes and occupation titles were changed; we worked with BLS officials to identify variations in codes and occupations and accounted for these changes where appropriate and possible.
1See Technical Paper 63RV:Current Population Survey—Design and Methodology, issued Mar. 2002. Electronic version available at http://www.censusgov/prod/2002pubs/tp63rv.pdf.
2See Technical Paper 63RV, page 11-4.

Appendix I: Objectives, Scope, and
Methodology
Page 51 GAO-06-114 Federal STEM Education Programs
Table 19: Classification codes and Occupations, 2002-2003
Science Technology Engineering Mathematics/Computer Science
1600 – Agricultural and food scientists
1540 – Drafters 1300 – Architects, except naval 1000 – Computer scientists and systems analysts
1610 – Biological scientists 1550 – Engineering technicians, except drafters
1310 – Surveyors, cartographers, and photogrammetrists
1010 – Computer programmers
1640 – Conservation scientists and foresters
1560 – Surveying and mapping technicians
1320 – Aerospace engineers 1020 – Computer software engineers
1650 – Medical scientists 1900 – Agricultural and food science technicians
1330 – Agricultural engineers 1040 – Computer support specialists
1700 – Astronomers and physicists
1910 – Biological technicians 1340 – Biomedical engineers 1060 – Database administrators
1710 – Atmospheric and space scientists
1920 – Chemical technicians 1350 – Chemical engineers 1100 – Network and computer systems administrators
1720 – Chemists and materials scientists
1930 – Geological and petroleum technicians
1360 – Civil engineers 1110 – Network systems and data communications analysts
1740 – Environmental scientists and geoscientists
1940 – Nuclear technicians 1400 – Computer hardware engineers
1200 – Actuaries
1760 – Physical scientists, all other
1960 – Other life, physical, and social science technicians
1410 – Electrical and electronic engineers
1210 – Mathematicians
1800 – Economists 3300 – Clinical laboratory technologists and technicians
1420 – Environmental engineers 1220 – Operations research analysts
1810 – Market and survey researchers
7010 – Computer, automated teller and office machine repairers
1430 – Industrial engineers, including health and safety
1230 – Statisticians
1820 – Psychologists 8760 – Medical, dental, and ophthalmic laboratory technicians
1440 – Marine engineers and naval architects
1240 – Miscellaneous mathematical science occupations
1830 – Sociologists 1450 – Materials engineers
1840 – Urban and regional planners
1460 – Mechanical engineers
1860 – Miscellaneous social scientists and related workers
1500 – Mining and geological engineers, including mining safety engineers
2010 – Social workers 1510 – Nuclear engineers
3130 – Registered nurses 1520 – Petroleum engineers
6010 – Agricultural inspectors
1530 – Engineers, all other
Source: GAO analysis of CPS occupation classifications.

Appendix I: Objectives, Scope, and
Methodology
Page 52 GAO-06-114 Federal STEM Education Programs
Table 20: Classification codes and occupations, 1994-2001
Science Technology Engineering Mathematics/Computer Science
069 – Physicists and astronomers
203 – Clinical laboratory technologists and technicians
043 – Architects 064 – Computer systems analysts and scientists
073 – Chemists, except biochemists
213 – Electrical and electronic technicians
044 – Aerospace engineers 065 – Operations and systems researchers and analysts
074 – Atmospheric and space scientists
214 – Industrial engineering technicians
045 – Metallurgical and materials engineers
066 – Actuaries
075 – Geologists and geodesists
215 – Mechanical engineering technicians
046 – Mining engineers 067 – Statisticians
076 – Physical scientists, n.e.c.
216 – Engineering technicians, n.e.c.
047 – Petroleum engineers 068 – Mathematical scientists, n.e.c.
077 – Agricultural and food scientists
217 – Drafting occupations 048 – Chemical engineers 229 – Computer programmers
078 – Biological and life scientists
218 – Surveying and mapping technicians
049 – Nuclear engineers
079 – Forestry and conservation scientists
223 – Biological technicians 053 – Civil engineers
083 – Medical scientists 224 – Chemical technicians 054 – Agricultural engineers
095 – Registered Nurses 225 – Science technicians, n.e.c. 055 – Electrical and electronic engineers
166 – Economists 235 – Technicians, n.e.c. 056 – Industrial engineers
167 – Psychologists 525 – Data processing equipment repairers
057 – Mechanical engineers
168 – Sociologists 058 – Marine and naval architects
169 – Social scientists, n.e.c. 059 – Engineers, n.e.c.
173 – Urban planners 063 – Surveyors and mapping scientists
174 – Social workers
489 – Inspectors, agricultural products
Source: GAO analysis of CPS occupation classifications.
Note: For occupations not elsewhere classified (n.e.c.).
Because the CPS is a probability sample based on random selections, the sample is only one of a large number of samples that might have been drawn. Since each sample could have provided different estimates, confidence in the precision of the particular sample’s results is expressed as a 95 percent confidence interval (e.g., plus or minus 4 percentage points). This is the interval that would contain the actual population value

Appendix I: Objectives, Scope, and
Methodology
Page 53 GAO-06-114 Federal STEM Education Programs
for 95 percent of the samples that could have been drawn. As a result, we are 95 percent confident that each of the confidence intervals in this report will include the true values in the study population. We use the CPS general variance methodology to estimate this sampling error and report it as confidence intervals. Percentage estimates we produce from the CPS data have 95 percent confidence intervals of plus or minus 6 percentage points or less. Estimates other than percentages have 95 percent confidence intervals of no more than plus or minus 10 percent of the estimate itself, unless otherwise noted. Consistent with the CPS documentation guidelines, we do not produce estimates based on the March supplement data for populations of less than 75,000.
GAO’s internal control procedures provide reasonable assurance that our data analyses are appropriate for the purposes we are using them. These procedures include, but are not limited to, having skilled staff perform the analyses, supervisory review by senior analysts, and indexing/referencing (confirming that the analyses are supported by the underlying audit documentation) activities.
We interviewed administrators and professors during site visits to eight colleges and universities—the University of California at Los Angeles and the University of Southern California in California; Clark Atlanta University, Georgia Institute of Technology, and Spelman College in Georgia; the University of Illinois; Purdue University in Indiana; and Pennsylvania State University. These colleges and universities were selected based on the following factors: large numbers of domestic and international students in STEM fields, a mix of public and private institutions, number of doctoral degrees conferred, and some geographic diversity. We also selected three minority-serving colleges and universities, one of which serves only women students. Clark Atlanta University and Spelman College were selected, in part, because of their partnerships with the College of Engineering at the Georgia Institute of Technology. During these visits we asked the university officials about factors that influenced whether people pursue a STEM education or occupations and suggestions for addressing those factors that may influence participation. For example, we asked university officials to identify (1) issues related to the education pipeline; (2) steps taken by their university to alleviate some of the conditions that may discourage student participation in STEM areas; and (3) the federal role, if any, in attracting and retaining domestic students in STEM fields. We also obtained documents on programs they sponsored to help support STEM students and graduates.
College and University Visits

Appendix I: Objectives, Scope, and
Methodology
Page 54 GAO-06-114 Federal STEM Education Programs
We reviewed several articles, reports, and books related to trends in STEM enrollment and factors that have an effect on people’s decisions to pursue STEM fields. For two studies, we evaluated the methodological soundness using common social science and statistical practices. We examined each study’s methodology, including its limitations, data sources, analyses, and conclusions.
• Talking about Leaving: Why Undergraduates Leave the Sciences, by Elaine Seymour and Nancy Hewitt.3 This study used interviews and focus groups/group interviews at selected universities to identify self-reported reasons for changing majors from science, mathematics, or engineering. The study had four primary objectives: (1) to identify sources of qualitative differences in educational experiences of science, mathematics, and engineering students at higher educational institutions of different types; (2) to identify differences in structure, culture, and pedagogy of science, mathematics, and engineering departments and the impact on student retention; (3) to compare and contrast causes of science, mathematics, and engineering students’ attrition by race/ethnicity and gender; and (4) to estimate the relative importance of factors found to contribute to science, mathematics, and engineering students’ attrition. The researchers selected seven universities to represent the types of colleges and universities that supply most of the nations’ scientists, mathematicians, and engineers. The types of institutions were selected to test whether there are differences in educational experiences, culture and pedagogy, race/ethnicity and gender attrition, and reasons for attrition by type of institution. Because the selection of students was not strictly random and because there is no documentation that the data were weighted to reflect the proportions of types of students selected, it is not possible to determine confidence intervals. Thus it is not possible to say which differences are statistically significant. The findings are now more than a decade old and thus might not reflect current pedagogy and other factors about the educational experience, students, or the socioeconomic environment. It is important to note that the quantitative results of this study are based on the views of one constituency or stakeholder—students. Views of faculty, school administrators, graduates, professional associations, and employers are not included.
3Seymour, Elaine, and Nancy M. Hewitt, Talking about Leaving: Why Undergraduates
Leave the Sciences, Westview Press, 1997, Boulder, Colorado.
Reviews of Reports and Studies

Appendix I: Objectives, Scope, and
Methodology
Page 55 GAO-06-114 Federal STEM Education Programs
• NCES’s Qualifications of the Public School Teacher Workforce:
Prevalence of Out-of-Field Teaching, 1987-1988 to 1999-2000 report. This study is an analysis based upon the Schools and Staffing Survey for 1999-2000. The report was issued in 2004 by the Institute of Education Sciences, U.S. Department of Education. NCES’s Schools and Staffing Survey (SASS) is a representative sample of U.S. schools, districts, principals, and teachers. The report focusing on teacher’s qualifications uses data from the district and teacher portion of SASS. The 1999-2000 SASS included a nationally representative sample of public schools and universe of all public charter schools with students in any of grades 1 through 12 and in operation in school year 1999-2000. The 1999-2000 SASS administration also included nationally representative samples of teachers in the selected public and public charter schools who taught students in grades kindergarten through 12 in school year 1999-2000. There were 51,811 public school teachers in the sample and 42,086 completed public school teacher interviews. In addition, there are 3,617 public charter school teachers in the sample with 2,847 completed interviews. The overall weighted teacher response rate was 76.7 percent for public school teachers and 71.8 percent for public charter school teachers. NCES has strong standards for carrying out educational surveys. The Office of Management and Budget vetted the questionnaire and sample design. The Census Bureau carried out survey quality control and data editing. One potential limitation is the amount of time it takes the Census Bureau to get the data from field collection to public release, but this is partly due to the thoroughness of the data quality steps followed. The SASS survey meets GAO standards for use as evidence in a report.
We interviewed officials from 13 federal agencies with STEM education programs to obtain information about the STEM programs and their views on related topics, including factors that influence students’ decisions about pursuing STEM degrees and occupations, and the extent of coordination among the federal agencies. We also interviewed officials from the National Science and Technology Council to discuss coordination efforts. In addition, we interviewed representatives and policy experts from various organizations. These organizations were the American Association for the Advancement of Science, the Commission on Professionals in Science and Technology, the Council of Graduate Schools, NAFSA: Association of International Educators, the National Academies, and the Council on Competitiveness.
We also conducted interviews via e-mail with 31 students. We asked officials from the eight universities visited to identify students to complete
Interviews

Appendix I: Objectives, Scope, and
Methodology
Page 56 GAO-06-114 Federal STEM Education Programs
our e-mail interviews, and students who completed the interviews attended five of the colleges we visited. Of the 31 students: 16 attended Purdue University, 6 attended the University of Southern California, 6 attended Spelman College, 2 attended the University of California Los Angeles, and 1 attended the Georgia Institute of Technology. In addition, 19 students were undergraduates and 12 were graduate students; 19 students identified themselves as women and 12 students identified themselves as men. Of the 19 undergraduate students, 9 said that they plan to pursue graduate work in a STEM field.

Appendix II: List of 207 Federal STEM
Education Programs
Page 57 GAO-06-114 Federal STEM Education Programs
Based on surveys submitted by officials representing the 13 civilian federal agencies, table 21 contains a list of the 207 science, technology, engineering, and mathematics (STEM) education programs funded in fiscal year 2004.
Table 21: Federal STEM Education Programs Funded in FY 2004
Program number Program name Fiscal year 04 funding
Department of Agriculture
1. 1890 Institution Teaching and Research Capacity Building Grants Program $11.4 million
2. Higher Education Challenge Grants Program $4.6 million
3. Hispanic-Serving Institutions Education Grants Program $4.6 million
4. Alaska Native-Serving and Native Hawaiian-Serving Institutions Education Grants Program
$3 million
5. Food and Agricultural Sciences National Needs Graduate and Postdoctoral Fellowships Grants Program
$2.9 million
6. Tribal Colleges Endowment Program $1.9 million
7. Tribal Colleges Education Equity Grants Program $1.7 million
8. Tribal Colleges Research Grant Program $1.1 million
9. Higher Education Multicultural Scholars Program $986,000
10. International Science and Education Competitive Grants Program $859,000
11. Secondary and Two-Year Postsecondary Agricultural Education Challenge Grants Program
$839,000
12. Agriculture in the Classroom $623,000
13. Career Intern Program $272,000
14. Veterinary Medical Doctoral Program $140,000
15. 1890 National Scholars Program $16,000
16. Hispanic Scholars Program $4,000
Department of Commerce
17. Educational Partnership Program with Minority Serving Institutions $7.4 million
18. National Marine Sanctuaries Education Program $4.4 million
19. National Sea Grant College Program $4 million
20. Chesapeake Bay Watershed Education and Training Program $2.5 million
21. Coral Reef Conservation Program $1.8 million
22. Exploration, Education and Outreach $1.3 million
23. National Estuarine Research Reserve Graduate Research Fellowship Program $1 million
24. Bay Watershed Education and Training Hawaii Program $500,000
25. Monterey Bay Watershed Education and Training Program $500,000
26. Dr. Nancy Foster Scholarship Program $494,000
Appendix II: List of 207 Federal STEM Education Programs

Appendix II: List of 207 Federal STEM
Education Programs
Page 58 GAO-06-114 Federal STEM Education Programs
Program number Program name Fiscal year 04 funding
27. EstuaryLive $115,000
28. Teacher at Sea Program $95,000
29. High School-High Tech $11,000
Department of Education
30. Mathematics and Science Partnerships Program $149 million
31. Upward Bound Math and Science Program $32.8 million
32. Graduate Assistance in Areas of National Need $30.6 million
33. Minority Science and Engineering Improvement Program $8.9 million
Department of Energy
34. Science Undergraduate Laboratory Internship $2.5 million
35. Computational Science Graduate Fellowship $2 million
36. Global Change Education Program $1.4 million
37. Laboratory Science Teacher Professional Development $1 million
38. National Science Bowl $702,000
39. Community College Institute of Science and Technology $605,000
40. Albert Einstein Distinguished Educator Fellowship $600,000
41. QuarkNet $575,000
42. Fusion Energy Sciences Fellowship Program $555,000
43. Pre-Service Teacher Fellowships $510,000
44. National Undergraduate Fellowship Program in Plasma Physics and Fusion Energy Sciences
$300,000
45. Fusion Energy Postdoctoral Research Program $243,000
46. Faculty and Student Teams $215,000
47. Advancing Precollege Science and Mathematics Education $209,000
48. Pan American Advanced Studies Institute $200,000
49. Trenton Community Partnership $200,000
50. Fusion/Plasma Education $125,000
51. National Middle School Science Bowl $100,000
52. Research Project on the Recruitment, Retention, and Promotion of Women in the Chemical Sciences
$100,000
53. Used Energy Related Laboratory Equipment $80,000
54. Plasma Physics Summer Institute for High School Physics Teachers $78,000
55. Pre-Service Teacher Program $45,000
56. Wonders of Physics Traveling Show $45,000
57. Hampton University Graduate Studies $40,000
58. Contemporary Physics Education Project $23,000

Appendix II: List of 207 Federal STEM
Education Programs
Page 59 GAO-06-114 Federal STEM Education Programs
Program number Program name Fiscal year 04 funding
59. Cooperative Education Program $17,000
Environmental Protection Agency
60. Science to Achieve Results Research Grants Program $93.3 million
61. Science to Achieve Results Graduate Fellowship Program $10 million
62. Post-Doctoral Fellows Environmental Research Growth Opportunities $7.4 million
63. Intern Program $3 million
64. Environmental Science and Engineering Fellows Program $2.5 million
65. Greater Research Opportunities Graduate Fellowship Program $1.5 million
66. Environmental Risk & Impact in Communities of Color and Economically Disadvantaged Communities
$824,000
67. Research Internship for Students in Ecology $698,000
68. National Network for Environmental Management Studies Fellowship Program $589,000
69. Cooperative Agreements for Training Cooperative Partnerships $352,000
70. University of Cincinnati/EPA Research Training Grant $300,000
71. P3 Award: National Student Design Competition for Sustainability $150,000
72. Environmental Protection Agency and the Hispanic Association of Colleges and Universities Cooperative Agreement
$121,000
73. Environmental Science Program $100,000
74. Environmental Career Organization’s Internship Program $89,000
75. EPA—Cincinnati Research Apprenticeship Program $75,000
76. Environmental Protection Internship Program Summer Training Initiative $72,000
77. Tribal Lands Environmental Science Scholarship Program $60,000
78. Internship Program for University of Arizona Engineering Students $50,000
79. Teacher Professional Development Workshop for Teachers Grade 6-12 $18,000
80. Saturday Academy, Apprenticeships in Science and Engineering Program $6,000
Department of Health and Human Services/Health Resources and Services Administration
81. Scholarships for Disadvantaged Students Program $45.5 million
82. Nursing Workforce Diversity $16 million
83. Faculty Loan Repayment Program $1.1 million
Department of Health and Human Services/Indian Health Service
84. Indian Health Professions Scholarship $8.1 million
85. Health Professions Scholarship Program for Indians $3.7 million
Department of Health and Human Services/National Institutes of Health
86. Ruth L. Kirschstein National Research Service Award Institutional Research Training Grants
$546.9 million
87. Ruth L. Kirschstein National Research Service Awards for Individual Postdoctoral Fellows
$72.6 million
88. Research Supplements to Promote Diversity in Health-Related Research $70 million
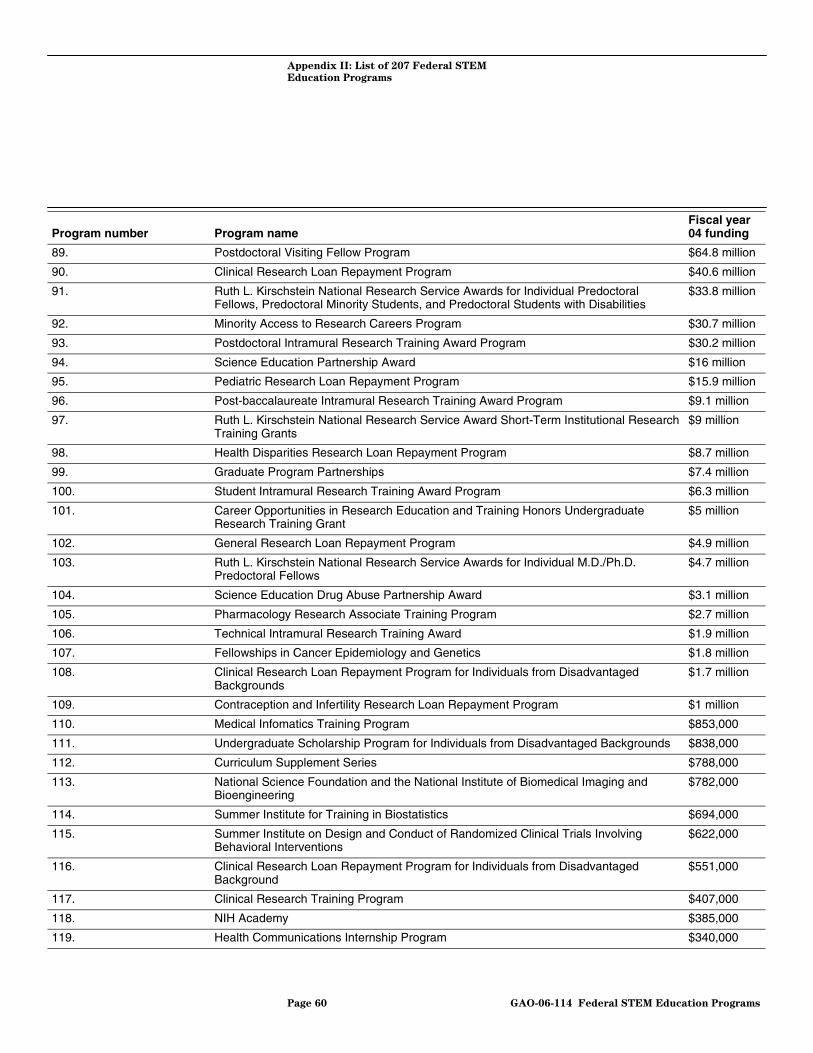
Appendix II: List of 207 Federal STEM
Education Programs
Page 60 GAO-06-114 Federal STEM Education Programs
Program number Program name Fiscal year 04 funding
89. Postdoctoral Visiting Fellow Program $64.8 million
90. Clinical Research Loan Repayment Program $40.6 million
91. Ruth L. Kirschstein National Research Service Awards for Individual Predoctoral Fellows, Predoctoral Minority Students, and Predoctoral Students with Disabilities
$33.8 million
92. Minority Access to Research Careers Program $30.7 million
93. Postdoctoral Intramural Research Training Award Program $30.2 million
94. Science Education Partnership Award $16 million
95. Pediatric Research Loan Repayment Program $15.9 million
96. Post-baccalaureate Intramural Research Training Award Program $9.1 million
97. Ruth L. Kirschstein National Research Service Award Short-Term Institutional Research Training Grants
$9 million
98. Health Disparities Research Loan Repayment Program $8.7 million
99. Graduate Program Partnerships $7.4 million
100. Student Intramural Research Training Award Program $6.3 million
101. Career Opportunities in Research Education and Training Honors Undergraduate Research Training Grant
$5 million
102. General Research Loan Repayment Program $4.9 million
103. Ruth L. Kirschstein National Research Service Awards for Individual M.D./Ph.D. Predoctoral Fellows
$4.7 million
104. Science Education Drug Abuse Partnership Award $3.1 million
105. Pharmacology Research Associate Training Program $2.7 million
106. Technical Intramural Research Training Award $1.9 million
107. Fellowships in Cancer Epidemiology and Genetics $1.8 million
108. Clinical Research Loan Repayment Program for Individuals from Disadvantaged Backgrounds
$1.7 million
109. Contraception and Infertility Research Loan Repayment Program $1 million
110. Medical Infomatics Training Program $853,000
111. Undergraduate Scholarship Program for Individuals from Disadvantaged Backgrounds $838,000
112. Curriculum Supplement Series $788,000
113. National Science Foundation and the National Institute of Biomedical Imaging and Bioengineering
$782,000
114. Summer Institute for Training in Biostatistics $694,000
115. Summer Institute on Design and Conduct of Randomized Clinical Trials Involving Behavioral Interventions
$622,000
116. Clinical Research Loan Repayment Program for Individuals from Disadvantaged Background
$551,000
117. Clinical Research Training Program $407,000
118. NIH Academy $385,000
119. Health Communications Internship Program $340,000

Appendix II: List of 207 Federal STEM
Education Programs
Page 61 GAO-06-114 Federal STEM Education Programs
Program number Program name Fiscal year 04 funding
120. NIH/National Institute of Standards and Technology Joint Postdoctoral Program $338,000
121. Summer Genetics Institute $323,000
122. AIDS Research Loan Repayment Program $271,000
123. Intramural NIAID Research Opportunities $271,000
124. Cancer Research Interns in Residence $250,000
125. Comparative Molecular Pathology Research Training Program $199,000
126. Office of Research on Women’s Health-funded Programs with the Office of Intramural Research
$179,000
127. Summer Institute for Social Work Research $144,000
128. Office of Research on Women’s Health-funded Programs with the Office of Intramural Training and Education
$119,000
129. CCR/JHU Master of Science in Biotechnology Concentration in Molecular Targets and Drug Discovery Technologies
$111,000
130. Introduction to Cancer Research Careers $96,000
131. Fellows Award for Research Excellence Program $61,000
132. Office of Research on Women’s Health-funded Programs Supplements to Promote Reentry into Biomedical and Behavioral Research Careers
$60,000
133. Translational Research in Clinical Oncology $28,000
134. National Institute of Environmental Health Sciences Office of Fellows’ Career Development
$20,000
135. Mobilizing for Action to Address the Unequal Burden of Cancer: NIH Research and Training Opportunities
$10,000
136. Sallie Rosen Kaplan Fellowship for Women in Cancer Research $5,000
Department of Homeland Security
137. Scholars and Fellows Program $4.7 million
Department of the Interior
138. Cooperative Research Units Program $15.3 million
139. Water Resources Research Act Program $6.4 million
140. U.S. Geological Survey Mendenhall Postdoctoral Research Fellowship Program $3.5 million
141. Student Educational Employment Program $1.8 million
142. EDMAP Component of the National Cooperative Geologic Mapping Program $490,000
143. Student Career Experience Program $177,000
144. Cooperative Development Energy Program $60,000
145. Diversity Employment Program $30,000
146. Cooperative Agreement with Langston University $15,000
147. Mathematics, Science, and Engineering Academy $15,000
148. Shorebird Sister Schools Program $15,000
149. Build a Bridge Contest $14,000
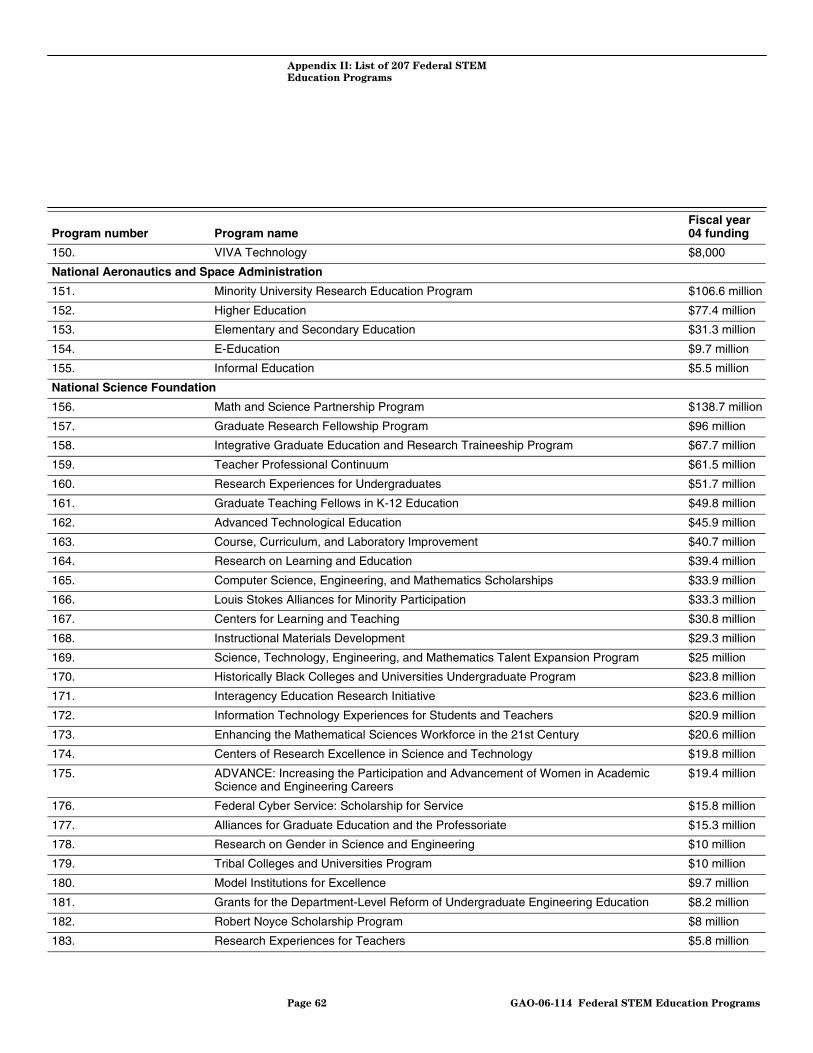
Appendix II: List of 207 Federal STEM
Education Programs
Page 62 GAO-06-114 Federal STEM Education Programs
Program number Program name Fiscal year 04 funding
150. VIVA Technology $8,000
National Aeronautics and Space Administration
151. Minority University Research Education Program $106.6 million
152. Higher Education $77.4 million
153. Elementary and Secondary Education $31.3 million
154. E-Education $9.7 million
155. Informal Education $5.5 million
National Science Foundation
156. Math and Science Partnership Program $138.7 million
157. Graduate Research Fellowship Program $96 million
158. Integrative Graduate Education and Research Traineeship Program $67.7 million
159. Teacher Professional Continuum $61.5 million
160. Research Experiences for Undergraduates $51.7 million
161. Graduate Teaching Fellows in K-12 Education $49.8 million
162. Advanced Technological Education $45.9 million
163. Course, Curriculum, and Laboratory Improvement $40.7 million
164. Research on Learning and Education $39.4 million
165. Computer Science, Engineering, and Mathematics Scholarships $33.9 million
166. Louis Stokes Alliances for Minority Participation $33.3 million
167. Centers for Learning and Teaching $30.8 million
168. Instructional Materials Development $29.3 million
169. Science, Technology, Engineering, and Mathematics Talent Expansion Program $25 million
170. Historically Black Colleges and Universities Undergraduate Program $23.8 million
171. Interagency Education Research Initiative $23.6 million
172. Information Technology Experiences for Students and Teachers $20.9 million
173. Enhancing the Mathematical Sciences Workforce in the 21st Century $20.6 million
174. Centers of Research Excellence in Science and Technology $19.8 million
175. ADVANCE: Increasing the Participation and Advancement of Women in Academic Science and Engineering Careers
$19.4 million
176. Federal Cyber Service: Scholarship for Service $15.8 million
177. Alliances for Graduate Education and the Professoriate $15.3 million
178. Research on Gender in Science and Engineering $10 million
179. Tribal Colleges and Universities Program $10 million
180. Model Institutions for Excellence $9.7 million
181. Grants for the Department-Level Reform of Undergraduate Engineering Education $8.2 million
182. Robert Noyce Scholarship Program $8 million
183. Research Experiences for Teachers $5.8 million

Appendix II: List of 207 Federal STEM
Education Programs
Page 63 GAO-06-114 Federal STEM Education Programs
Program number Program name Fiscal year 04 funding
184. Nanoscale Science and Engineering Education $4.8 million
185. Research in Disabilities Education $4.6 million
186. Opportunities for Enhancing Diversity in the Geosciences $4 million
187. Mathematical Sciences Postdoctoral Research Fellowships $3.7 million
188. Minority Postdoctoral Research Fellowships and Supporting Activities $3.2 million
189. Partnerships for Research and Education in Materials $3 million
190. Undergraduate Research Centers $3 million
191. Centers for Ocean Science Education Excellence $2.8 million
192. Undergraduate Mentoring in Environmental Biology $2.2 million
193. Director’s Award for Distinguished Teaching Scholars $1.8 million
194. Astronomy and Astrophysics Postdoctoral Fellowship Program $1.6 million
195. Geoscience Education $1.5 million
196. Internships in Public Science Education $1.2 million
197. Discovery Corps Fellowship Program $1.1 million
198. East Asia & Pacific Summer Institutes for U.S. Graduate Students $1 million
199. Pan-American Advanced Studies Institutes $800,000
200. Distinguished International Postdoctoral Research Fellowships $788,000
201. Postdoctoral Fellowships in Polar Regions Research $667,000
202. Arctic Research and Education $300,000
203. Developing Global Scientists and Engineers $172,000
Department of Transportation
204. University Transportation Centers Program $32.5 million
205. Dwight David Eisenhower Transportation Fellowship Program $2 million
206. Summer Transportation Institute $2 million
207. Summer Transportation Internship Program for Diverse Groups $925,000
Source: GAO survey responses from 13 federal agencies.

Appendix III: Federal STEM Education
Programs Funded at $10 Million or More
Page 64 GAO-06-114 Federal STEM Education Programs
The federal civilian agencies reported that the following science, technology, engineering, and mathematics (STEM) education programs were funded with at least $10 million in either fiscal year 2004 or 2005. However, programs that received $10 million or more in fiscal year 2004 but were unfunded for fiscal year 2005 were excluded from table 22. Agency officials also provided the program descriptions in table 22.
Table 22: Federal STEM Education Programs Funded at $10 Million or More during Fiscal Year 2004 or Fiscal Year 2005
Funding (in millions of dollars)a
Program Description First year 2004 2005
Department of Agriculture
1890 Institution Teaching and Research Capacity Building Grants Program
Is intended to strengthen teaching and research programs in the food and agricultural sciences by building the institutional capacities of the 1890 Land-Grant Institutions and Tuskegee University and West Virginia State University through cooperative linkages with federal and nonfederal entities. The program supports projects that strengthen teaching programs in the food and agricultural sciences in the targeted educational need areas of curriculum design and materials development, faculty preparation and enhancement of teaching, student experiential learning, and student recruitment and retention.
1990 $11.4 $12.5
Department of Education
Mathematics and Science Partnerships Program
Is intended to increase the academic achievement of students in mathematics and science by enhancing the content knowledge and teaching skills of classroom teachers. Partnerships are between high-need school districts and the science, technology, engineering, and mathematics faculties of institutions of higher education.
2002 $149 $180
Upward Bound Math and Science Program
Designed to prepare low-income, first-generation college students for postsecondary education programs that lead to careers in the fields of math and science.
1990 $32.8 $32.8
Graduate Assistance in Areas of National Need
Provides fellowships in academic areas of national need to assist graduate students with excellent academic records who demonstrate financial need and plan to pursue the highest degree available in their courses of study.
1988 $30.6 $30.4
Environmental Protection Agency
Science to Achieve Results Research Grants Program
Funds research grants in numerous environmental science and engineering disciplines. The program engages the nation’s best scientists and engineers in targeted research. The grant program is currently focused on the health effects of particulate matter, drinking water, water quality, global change, ecosystem assessment and restoration, human health risk assessment, endocrine disrupting chemicals, pollution prevention and new technologies, children’s health, and socio-economic research.
1995 $93.3 $80.1
Science to Achieve Results Graduate Fellowship Program
The purpose of this fellowship program is to encourage promising students to obtain advanced degrees and pursue careers in environmentally related fields.
1995 $10 $10
Appendix III: Federal STEM Education Programs Funded at $10 Million or More

Appendix III: Federal STEM Education
Programs Funded at $10 Million or More
Page 65 GAO-06-114 Federal STEM Education Programs
Funding (in millions of dollars)a
Program Description First year 2004 2005
Department of Health and Human Services/Health Resources and Services Administration
Scholarships for Disadvantaged Students Program
Funds are awarded to accredited schools of allopathic medicine, osteopathic medicine, dentistry, optometry, pharmacy, podiatric medicine, veterinary medicine, nursing, public health, chiropractic, or allied health, and schools offering graduate programs in behavioral and mental health practice. Priority is given to schools based on the proportion of graduating students going into primary care, the proportion of underrepresented minority students enrolled, and graduates working in medically underserved communities. Schools select qualified students and provide scholarships that cannot exceed tuition and reasonable educational and living expenses.
1991 $45.5 Not avail.
Nursing Workforce Diversity To increase nursing education opportunities for individuals who are from disadvantaged backgrounds (including racial and ethnic minorities underrepresented among registered nurses) by providing student stipends, pre-entry preparation, and retention activities.
1989 $16 $16
Department of Health and Human Services/National Institutes of Health
Ruth L. Kirschstein National Research Service Award Institutional Research Training Grants
Is designed to develop and enhance research training opportunities for individuals in biomedical, behavioral, and clinical research by supporting training programs at institutions of higher education. These institutional training grants allow the director of the program to select the trainees and to develop a curriculum of study and research experiences necessary to provide high-quality research training. The grant helps offset the cost of stipends and tuition for the appointed trainees. Graduate students, postdoctoral trainees, and short-term research training for health professional students can be supported by this grant.
1975 $546.9 Not avail.
Ruth L. Kirschstein National Research Service Awards for Individual Postdoctoral Fellows
To support the advanced training of individual students who have recently received doctoral degrees. This phase of research education and training is performed under the direct supervision of a sponsor who is an active investigator in the area of the proposed research. The training is designed to enhance the fellow’s understanding of the health-related sciences and extend his/her potential to become a productive scientist who can perform research in biomedical, behavioral, or clinical fields.
1975 $72.6 Not avail.
Research Supplements to Promote Diversity in Health-Related Research
To improve the diversity of the research workforce by recruiting and supporting students, postdoctoral fellows, and eligible investigators from groups that have been shown to be underrepresented, such as individuals from underrepresented racial and ethnic groups, individuals with disabilities, and individuals from disadvantaged backgrounds.
1989 $70 $70
Postdoctoral Visiting Fellow Program
To provide advanced practical biomedical research experience to individuals who are foreign nationals and are 1 to 5 years beyond obtaining their Ph.D. or professional doctorate (e.g., M.D., DDS, etc.).
1950 $64.8 $70.7
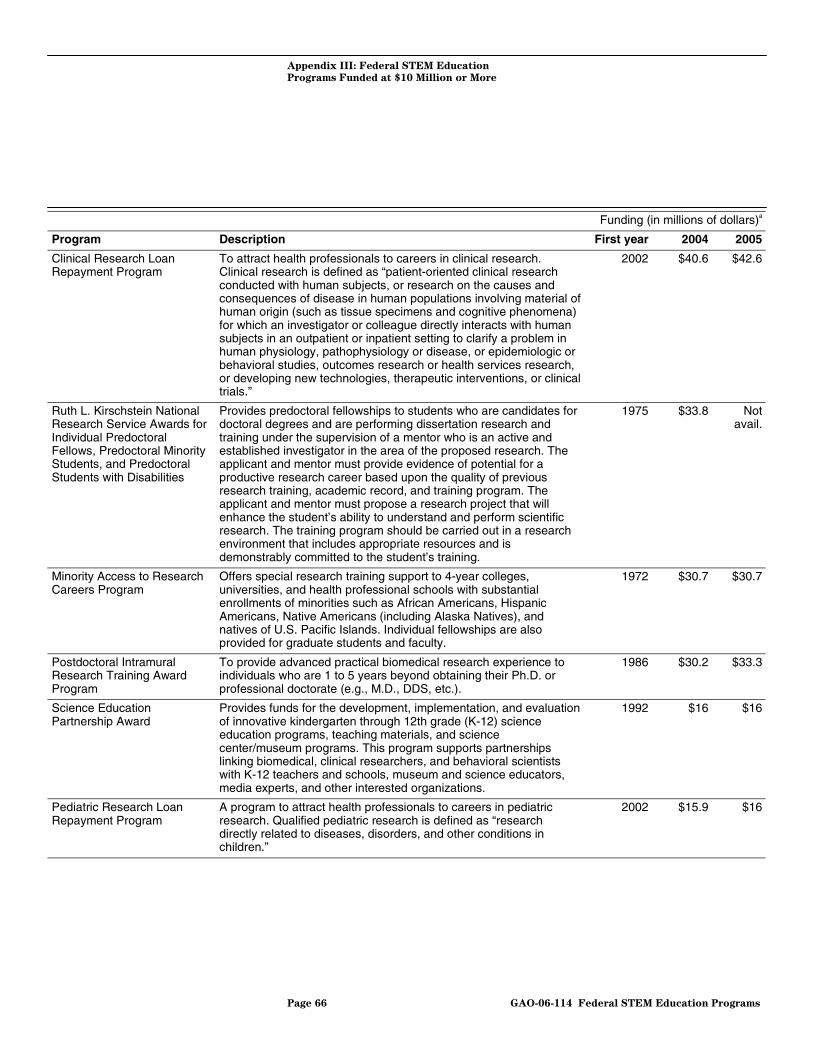
Appendix III: Federal STEM Education
Programs Funded at $10 Million or More
Page 66 GAO-06-114 Federal STEM Education Programs
Funding (in millions of dollars)a
Program Description First year 2004 2005
Clinical Research Loan Repayment Program
To attract health professionals to careers in clinical research. Clinical research is defined as “patient-oriented clinical research conducted with human subjects, or research on the causes and consequences of disease in human populations involving material of human origin (such as tissue specimens and cognitive phenomena) for which an investigator or colleague directly interacts with human subjects in an outpatient or inpatient setting to clarify a problem in human physiology, pathophysiology or disease, or epidemiologic or behavioral studies, outcomes research or health services research, or developing new technologies, therapeutic interventions, or clinical trials.”
2002 $40.6 $42.6
Ruth L. Kirschstein National Research Service Awards for Individual Predoctoral Fellows, Predoctoral Minority Students, and Predoctoral Students with Disabilities
Provides predoctoral fellowships to students who are candidates for doctoral degrees and are performing dissertation research and training under the supervision of a mentor who is an active and established investigator in the area of the proposed research. The applicant and mentor must provide evidence of potential for a productive research career based upon the quality of previous research training, academic record, and training program. The applicant and mentor must propose a research project that will enhance the student’s ability to understand and perform scientific research. The training program should be carried out in a research environment that includes appropriate resources and is demonstrably committed to the student’s training.
1975 $33.8 Not avail.
Minority Access to Research Careers Program
Offers special research training support to 4-year colleges, universities, and health professional schools with substantial enrollments of minorities such as African Americans, Hispanic Americans, Native Americans (including Alaska Natives), and natives of U.S. Pacific Islands. Individual fellowships are also provided for graduate students and faculty.
1972 $30.7 $30.7
Postdoctoral Intramural Research Training Award Program
To provide advanced practical biomedical research experience to individuals who are 1 to 5 years beyond obtaining their Ph.D. or professional doctorate (e.g., M.D., DDS, etc.).
1986 $30.2 $33.3
Science Education Partnership Award
Provides funds for the development, implementation, and evaluation of innovative kindergarten through 12th grade (K-12) science education programs, teaching materials, and science center/museum programs. This program supports partnerships linking biomedical, clinical researchers, and behavioral scientists with K-12 teachers and schools, museum and science educators, media experts, and other interested organizations.
1992 $16 $16
Pediatric Research Loan Repayment Program
A program to attract health professionals to careers in pediatric research. Qualified pediatric research is defined as “research directly related to diseases, disorders, and other conditions in children.”
2002 $15.9 $16

Appendix III: Federal STEM Education
Programs Funded at $10 Million or More
Page 67 GAO-06-114 Federal STEM Education Programs
Funding (in millions of dollars)a
Program Description First year 2004 2005
Post-baccalaureate Intramural Research Training Award Program
To provide (1) recent college graduates (graduated no more than 2 years prior to activation of traineeship), an introduction early in their careers to biomedical research fields; encourage their pursuit of professional careers in biomedical research; and allow additional time to pursue successful application to either graduate or medical school programs or (2) students who have been accepted into graduate, other doctoral, or medical degree programs, and who have written permission from their school to delay entrance for up to 1 year.
1996 $9.1 $12.3
Department of Homeland Security
University Programs Provides scholarships for undergraduate and fellowships for graduate students pursuing degrees in mission-relevant fields and postdoctoral fellowships for their contributions to Department of Homeland Security research projects. Students receive professional mentoring and complete a summer internship to connect academic interests with homeland security initiatives. Postdoctoral scholars are also mentored by DHS scientists.
2003 $4.7 $10.7
Department of the Interior
Cooperative Research Units Program
The program links graduate science training with the research needs of state and federal agencies, and provides students with one-on-one mentoring by federal research scientists working on both applied and basic research needs of interest to the program. Program cooperators and partners provide graduate training opportunities and support.
1936 $15.3 $15
Department of Labor
Community College/Community Based Job Training Grant Initiative
To build the capacity of community colleges to train in high-growth, high-demand industries and to actually train workers in those industries through partnerships that also include workforce investment boards and employers.
2005 $0 $250
National Aeronautics and Space Administration
Minority University Research Education Program
To expand and advance NASA’s scientific and technological base through collaborative efforts with Historically Black Colleges and Universities (HBCU) and other minority universities (OMU), including Hispanic-serving institutions and Tribal colleges and universities. This program also provides K-12 awards to build and support successful pathways for students to progress to the next level of mathematics and science, through a college preparatory curriculum, and enrollment in college. Higher-education awards are also given that seek to improve the rate at which underrepresented minorities are awarded degrees in STEM disciplines through increased research training and exposure to cutting-edge technologies that better prepare them to enter STEM graduate programs, the NASA workforce pipeline, and employment in NASA-related industries.
2002 $106.6 $73.6

Appendix III: Federal STEM Education
Programs Funded at $10 Million or More
Page 68 GAO-06-114 Federal STEM Education Programs
Funding (in millions of dollars)a
Program Description First year 2004 2005
Higher Education The Higher Education Program focuses on supporting institutions of higher education in strengthening their research capabilities and providing opportunities that attract and prepare increasing numbers of students for NASA-related careers. The research conducted by the institutions will contribute to the research needs of NASA’s Mission Directorates. The student projects serve as a major link in the student pipeline for addressing NASA’s human capital strategies and the President’s management agenda by helping to build, sustain, and effectively deploy the skilled, knowledgeable, diverse, and high-performing workforce needed to meet the current and emerging needs of government and its citizens.
2002 $77.4 $62.4
Elementary and Secondary Education
To increase the rigor of STEM experiences provided to K-12 students through workshops, summer internships, and classroom activities; provide high-quality professional development to teachers in STEM through NASA programs; develop technological avenues through the NASA Web site that will allow families to have common experiences with learning about space exploration; encourage inquiry teaching in K-12 classrooms; improve the content and focus of grade level/science team meetings in NASA Explorer Schools; and share the knowledge gained through the Educator Astronaut Program with teachers, students, and families.
2002 $31.3 $23.2
Informal Education The principal purpose of the informal education program is to support projects designed to increase public interest in, understanding of, and engagement in STEM activities. The goal of all informal education programs is an informed citizenry that has access to the ideas of science and engineering and understands its role in enhancing the quality of life and the health, prosperity, welfare, and security of the nation. Informal learning is self-directed, voluntary, and motivated mainly by intrinsic interests, curiosity, exploration, and social interaction.
2002 $5.5 $10.2
National Science Foundation
Math and Science Partnership (MSP)Program
The MSP is a major research and development effort that supports innovative partnerships to improve kindergarten through grade 12 student achievement in mathematics and science. MSP projects are expected to both raise the achievement levels of all students and significantly reduce achievement gaps in the mathematics and science performance of diverse student populations. Successful projects serve as models that can be widely replicated in educational practice to improve the mathematics and science achievement of all the nation’s students.
2002 $138.7 $79.4
Graduate Research Fellowship Program (GRFP)
The purpose of the GRFP is to ensure the vitality of the scientific and technological workforce in the United States and to reinforce its diversity. The program recognizes and supports outstanding graduate students in the relevant science and engineering disciplines who are pursuing research-based master’s and doctoral degrees. NSF fellows are expected to become knowledge experts who can contribute significantly to research, teaching, and innovations in science and engineering.
1952 $96 $96.6

Appendix III: Federal STEM Education
Programs Funded at $10 Million or More
Page 69 GAO-06-114 Federal STEM Education Programs
Funding (in millions of dollars)a
Program Description First year 2004 2005
Integrative Graduate Education and Research Traineeship Program
This program provides support to universities for student positions in interdisciplinary areas of science and engineering. Traineeships focus on multidisciplinary and intersectoral research opportunities and prepare future faculty in effective teaching methods, applications of advanced educational technologies, and student mentoring techniques.
1998 $67.7 $69
Teacher Professional Continuum
The program addresses critical issues and needs regarding the recruitment, preparation, induction, retention, and lifelong development of kindergarten through grade 12 STEM teachers. Its goals are to improve the quality and coherence of teacher learning experiences across the continuum through research that informs teaching practice and the development of innovative resources for the professional development of kindergarten through grade 12 STEM teachers.
2004 $61.5 $60.2
Research Experiences for Undergraduates
This program supports active participation by undergraduate students in research projects in any of the areas of research funded by the National Science Foundation. The program seeks to involve students in meaningful ways in all kinds of research—whether disciplinary, interdisciplinary, or educational in focus—linked to the efforts of individual investigators, research groups, centers, and national facilities. Particular emphasis is given to the recruitment of women, minorities, and persons with disabilities.
1987 $51.7 $51.1
Graduate Teaching Fellows in K-12 Education
This program supports fellowships and associated training that enable graduate students in NSF-supported STEM disciplines to acquire additional skills that will broadly prepare them for professional and scientific careers. Through interactions with teachers, graduate students can improve communication and teaching skills while enriching STEM instruction in kindergarten through grade 12 schools. This program also provides institutions of higher education with an opportunity to make a permanent change in their graduate programs by including partnerships with schools in a manner that will mutually benefit faculties and students.
1999 $49.8 $49.9
Advanced Technological Education (ATE)
With an emphasis on 2-year colleges, the ATE program focuses on the education of technicians for the high-technology fields that drive our nation’s economy. The program involves partnerships between academic institutions and employers to promote improvement in the education of science and engineering technicians at the undergraduate and secondary school levels. The ATE program supports curriculum development, professional development of college faculty and secondary school teachers, career pathways to 2-year colleges from secondary schools and from 2-year colleges to 4-year institutions, and other activities. The program also invites proposals focusing on applied research relating to technician education.
1994 $45.9 $45.1
Course, Curriculum, and Laboratory Improvement
This program emphasizes projects that build on prior work and contribute to the knowledge base of undergraduate STEM education research and practice. In addition, projects should contribute to building a community of scholars who work in related areas of undergraduate education.
1999 $40.7 $40.6

Appendix III: Federal STEM Education
Programs Funded at $10 Million or More
Page 70 GAO-06-114 Federal STEM Education Programs
Funding (in millions of dollars)a
Program Description First year 2004 2005
Research on Learning and Education
The program seeks to capitalize on important developments across a wide range of fields related to human learning and to STEM education. It supports research across a continuum that includes (1) the biological basis of human learning; (2) behavioral, cognitive, affective, and social aspects of STEM learning; (3) STEM learning in formal and informal educational settings; (4) STEM policy research; and (5) the diffusion of STEM innovations.
2000 $39.4 $38.2
Computer Science, Engineering, and Mathematics Scholarships
This program supports scholarships for academically talented, financially needy students, enabling them to enter the high-technology workforce following completion of an associate, baccalaureate, or graduate-level degree in computer science, computer technology, engineering, engineering technology, or mathematics. Academic institutions apply for awards to support scholarship activities and are responsible for selecting scholarship recipients, reporting demographic information about student scholars, and managing the project at the institution.
1999 $33.9 $75
Louis Stokes Alliances for Minority Participation
The program is aimed at increasing the quality and quantity of students successfully completing STEM baccalaureate degree programs and increasing the number of students interested in, academically qualified for, and matriculated into programs of graduate study. It also supports sustained and comprehensive approaches that facilitate achievement of the long-term goal of increasing the number of students who earn doctorates in STEM, particularly those from populations underrepresented in STEM fields.
1991 $33.3 $35
Centers for Learning and Teaching
The program focuses on the advanced preparation of STEM educators, as well as the establishment of meaningful partnerships among education stakeholders, especially Ph.D.-granting institutions, school systems, and informal education performers. Its goals are to renew and diversify the cadre of leaders in STEM education; to increase the number of kindergarten through undergraduate educators capable of delivering high-quality STEM instruction and assessment; and to conduct research into STEM education issues of national import, such as the nature of learning, teaching strategies, and reform policies and outcomes.
2000 $30.8 $28.4
Instructional Materials Development
This program contains three components. It supports (1) the creation and substantial revision of comprehensive curricula and supplemental materials that are research-based, enhance classroom instruction, and reflect standards for science, mathematics, and technology education developed by professional organizations; (2) the creation of tools for assessing student learning that are tied to nationally developed standards and reflect the most current thinking on how students learn mathematics and science; and (3) research for development of this program and projects.
1983 $29.3 $28.5

Appendix III: Federal STEM Education
Programs Funded at $10 Million or More
Page 71 GAO-06-114 Federal STEM Education Programs
Funding (in millions of dollars)a
Program Description First year 2004 2005
Science, Technology, Engineering, and Mathematics Talent Expansion Program
The program seeks to increase the number of students (U.S. citizens or permanent residents) receiving associate or baccalaureate degrees in established or emerging fields within STEM. Type 1 proposals that provide for full implementation efforts at academic institutions are solicited. Type 2 proposals that support educational research projects on associate or baccalaureate degree attainment in STEM are also solicited.
2002 $25 $25.3
Historically Black Colleges and Universities (HBCU) Undergraduate Program
This program provides awards to enhance the quality of STEM instructional and outreach programs at HBCUs as a means to broaden participation in the nation’s STEM workforce. Project strategies include curriculum enhancement, faculty professional development, undergraduate research, academic enrichment, infusion of technology to enhance STEM instruction, collaborations with research institutions and industry, and other activities that meet institutional needs.
1998 $23.8 $25.2
Interagency Education Research Initiative
This is a collaborative effort with the U.S. Department of Education. The goal is to support scientific research that investigates the effectiveness of educational interventions in reading, mathematics, and the sciences as they are implemented in varied school settings with diverse student populations.
1999 $23.6 $13.8
Information Technology Experiences for Students and Teachers
The program is designed to increase the opportunities for students and teachers to learn about, experience, and use information technologies within the context of STEM, including information technology courses. It is in direct response to the concern about shortages of technology workers in the United States. It has two components: (1) youth-based projects with strong emphasis on career and educational paths and (2) comprehensive projects for students and teachers.
2003 $20.9 $25
Enhancing the Mathematical Sciences Workforce in the 21st Century
The long-range goal of this program is to increase the number of U.S. citizens, nationals, and permanent residents who are well prepared in the mathematical sciences and who pursue careers in the mathematical sciences and in other NSF-supported disciplines.
2004 $20.6 $20.7
Centers of Research Excellence in Science and Technology
This program makes resources available to significantly enhance the research capabilities of minority-serving institutions through the establishment of centers that effectively integrate education and research. It promotes the development of new knowledge, enhancements of the research productivity of individual faculty, and an expanded diverse student presence in STEM disciplines.
1987 $19.8 $15.9
ADVANCE: Increasing the Participation and Advancement of Women in Academic Science and Engineering Careers
The program goal is to increase the representation and advancement of women in academic science and engineering careers, thereby contributing to the development of a more diverse science and engineering workforce. Members of underrepresented minority groups and individuals with disabilities are especially encouraged to apply.
2001 $19.4 $19.8

Appendix III: Federal STEM Education
Programs Funded at $10 Million or More
Page 72 GAO-06-114 Federal STEM Education Programs
Funding (in millions of dollars)a
Program Description First year 2004 2005
Federal Cyber Service: Scholarship for Service
This program seeks to increase the number of qualified students entering the fields of information assurance and computer security and to increase the capacity of the United States’ higher education enterprise to continue to produce professionals in these fields to meet the needs of our increasingly technological society. The program has two tracks: provides funds to colleges and universities to (1) award scholarships to students to pursue academic programs in the information assurance and computer security fields for the final 2 years of undergraduate study, or for 2 years of master’s-level study, or for the final 2 years of Ph.D.-level study, and (2) improve the quality and increase the production of information assurance and computer security professionals.
2001 $15.8 $14.1
Alliances for Graduate Education and the Professoriate
This program is intended to increase significantly the number of domestic students receiving doctoral degrees in STEM, with special emphasis on those population groups underrepresented in these fields. The program is interested in increasing the number of minorities who will enter the professoriate in these disciplines. Specific objectives are to develop (1) and implement innovative models for recruiting, mentoring, and retaining minority students in STEM doctoral programs, and (2) effective strategies for identifying and supporting underrepresented minorities who want to pursue academic careers.
1998 $15.3 $14.8
Research on Gender in Science and Engineering
The program seeks to broaden the participation of girls and women in all fields of STEM education by supporting research, dissemination of research, and extension services in education that will lead to a larger and more diverse domestic science and engineering workforce. Typical projects will contribute to the knowledge base addressing gender-related differences in learning and in the educational experiences that affect student interest, performance, and choice of careers, and how pedagogical approaches and teaching styles, curriculum, student services, and institutional culture contribute to causing or closing gender gaps that persist in certain fields.
1993 $10 $9.8
Tribal Colleges and Universities Program
This program provides awards to enhance the quality of STEM instructional and outreach programs, with special attention to the use of information technologies at Tribal colleges and universities, Alaskan Native-serving institutions, and Native Hawaiian-serving institutions. Support is available for the implementation of comprehensive institutional approaches to strengthen STEM teaching and learning in ways that improve access to, retention within, and graduation from STEM programs, particularly those that have a strong technological foundation. Through this program, assistance is provided to eligible institutions in their efforts to bridge the digital divide and prepare students for careers in information technology, science, mathematics, and engineering fields.
2001 $10 $9.8

Appendix III: Federal STEM Education
Programs Funded at $10 Million or More
Page 73 GAO-06-114 Federal STEM Education Programs
Funding (in millions of dollars)a
Program Description First year 2004 2005
Department of Transportation
University Transportation Centers Program (UTC)
The UTC program’s mission is to advance U.S. technology and expertise in the many disciplines comprising transportation through the mechanisms of education, research, and technology transfer at university-based centers of excellence. The UTC program’s goals include (1) developing a multidisciplinary program of coursework and experiential learning that reinforces the transportation theme of the center; (2) increasing the numbers of students, faculty, and staff who are attracted to and substantially involved in the undergraduate, graduate, and professional programs of the center; and (3) having students, faculty, and staff who reflect the growing diversity of the U.S. workforce and are substantially involved in the undergraduate, graduate, and professional programs of the center.
1998 $32.5 $32.5
Source: GAO survey responses from 13 federal agencies.
aThe dollar amounts for fiscal years 2004 and 2005 contain actual and estimated program funding levels.
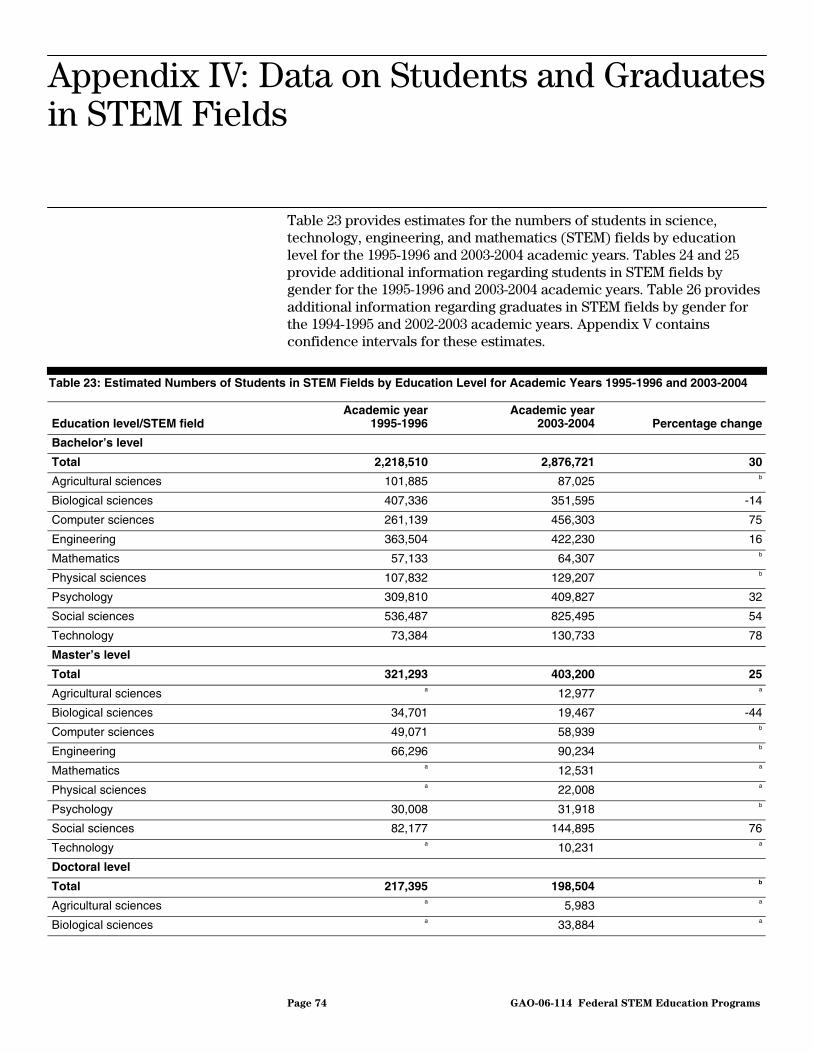
Appendix IV: Data on Students and Graduates
in STEM Fields
Page 74 GAO-06-114 Federal STEM Education Programs
Table 23 provides estimates for the numbers of students in science, technology, engineering, and mathematics (STEM) fields by education level for the 1995-1996 and 2003-2004 academic years. Tables 24 and 25 provide additional information regarding students in STEM fields by gender for the 1995-1996 and 2003-2004 academic years. Table 26 provides additional information regarding graduates in STEM fields by gender for the 1994-1995 and 2002-2003 academic years. Appendix V contains confidence intervals for these estimates.
Table 23: Estimated Numbers of Students in STEM Fields by Education Level for Academic Years 1995-1996 and 2003-2004
Education level/STEM field Academic year
1995-1996Academic year
2003-2004 Percentage change
Bachelor’s level
Total 2,218,510 2,876,721 30
Agricultural sciences 101,885 87,025 b
Biological sciences 407,336 351,595 -14
Computer sciences 261,139 456,303 75
Engineering 363,504 422,230 16
Mathematics 57,133 64,307 b
Physical sciences 107,832 129,207 b
Psychology 309,810 409,827 32
Social sciences 536,487 825,495 54
Technology 73,384 130,733 78
Master’s level
Total 321,293 403,200 25
Agricultural sciences a 12,977 a
Biological sciences 34,701 19,467 -44
Computer sciences 49,071 58,939 b
Engineering 66,296 90,234 b
Mathematics a 12,531 a
Physical sciences a 22,008 a
Psychology 30,008 31,918 b
Social sciences 82,177 144,895 76
Technology a 10,231 a
Doctoral level
Total 217,395 198,504 b
Agricultural sciences a 5,983 a
Biological sciences a 33,884 a
Appendix IV: Data on Students and Graduates in STEM Fields

Appendix IV: Data on Students and Graduates
in STEM Fields
Page 75 GAO-06-114 Federal STEM Education Programs
Education level/STEM field Academic year
1995-1996Academic year
2003-2004 Percentage change
Computer sciences a 9,196 a
Engineering 32,181 35,687 b
Mathematics a 9,412 a
Physical sciences 38,058 24,973 b
Psychology 30,291 33,994 b
Social sciences 54,092 42,464 b
Technology a 2,912 a
Source: GAO calculations based upon NPSAS data.
Note: Enrollment totals differ from those cited in table 9 because table 9 includes students enrolled in certificate, associate’s, other undergraduate, first-professional degree, and post-bachelor’s or post-master’s certificate programs.
aSample sizes are insufficient to accurately produce estimates.
bChanges between academic years 1995-1996 and 2003-2004 are not statistically significant at the 95-percent confidence level. See table 30 for significance of percentage changes.
Table 24: Estimated Percentages of Students by Gender and STEM Field for Academic Years 1995-1996 and 2003-2004
Male Female
Percent: 1995-1996 Percent: 2003-2004 Percent: 1995-1996 Percent: 2003-2004
Agricultural sciences
Total 58 55 42 45
Bachelor’s 56 54 44 46
Master’s a a a a
Doctorate a 61 a 39
Biological sciences
Total 46 42 54 58
Bachelor’s 45 42 55 58
Master’s a 26 a 74
Doctorate a 50 a 50
Computer sciences
Total 67 76 33 24
Bachelor’s 69 77 31 23
Master’s a 69 a 31
Doctorate a 72 a 28
Engineering
Total 83 83 17 17
Bachelor’s 83 83 17 17
Master’s a 81 a 19

Appendix IV: Data on Students and Graduates
in STEM Fields
Page 76 GAO-06-114 Federal STEM Education Programs
Male Female
Percent: 1995-1996 Percent: 2003-2004 Percent: 1995-1996 Percent: 2003-2004
Doctorate a 78 a 22
Mathematics
Total 62 55 38 45
Bachelor’s 57 54 43 46
Master’s a a a a
Doctorate a 68 a 32
Physical sciences
Total 62 56 38 44
Bachelor’s 56 53 44 47
Master’s a a a a
Doctorate a 68 a 32
Psychology
Total 26 26 74 74
Bachelor’s 26 26 74 74
Master’s a 21 a 79
Doctorate a 30 a 70
Social sciences
Total 54 41 46 59
Bachelor’s 52 42 48 58
Master’s 51 35 49 65
Doctorate 83 46 17 54
Technology
Total 89 81 11 19
Bachelor’s 88 81 12 19
Master’s a a a a
Doctorate a a a a
Source: GAO calculations based upon NPSAS data.
aSample sizes are insufficient to accurately produce estimates.

Appendix IV: Data on Students and Graduates
in STEM Fields
Page 77 GAO-06-114 Federal STEM Education Programs
Table 25: Estimated Number of Women Students and Percentage Change by Education Level and STEM Field for Academic Years 1995-1996 and 2003-2004
Number of women students
Education level/STEM field 1995-1996 2003-2004
Percentage change in women students
Bachelor’s level Agricultural sciences 44,444 39,702 b
Biological sciences 222,323 203,038 b
Computer sciences 82,013 104,824 b
Engineering 59,985 70,353 b
Mathematics 24,597 29,791 b
Physical sciences 47,421 60,203 b
Psychology 229,772 304,712 +33
Social sciences 258,023 475,544 +84
Technology 8,871 25,227 +184
Master’s level Agricultural sciences a a a
Biological sciences a 14,415 a
Computer sciences a 18,000 a
Engineering a 17,042 a
Mathematics a 5,562 a
Physical sciences a 8,497 a
Psychology 23,857 25,342 b
Social sciences 40,395 94,169 +133
Technology a 1,280 a
Doctoral level Agricultural sciences a 2,353 a
Biological sciences a 17,074 a
Computer sciences a 2,556 a
Engineering a 7,868 a
Mathematics a 3,042 a
Physical sciences a 8,105 a
Psychology a 23,843 a
Social sciences 9,440 22,931 +143
Technology a 692 a
Source: GAO calculations based upon NPSAS data.
a Sample sizes are insufficient to accurately produce estimates.
bChanges between academic years 1995-1996 and 2003-2004 are not statistically significant at the 95-percent confidence level. See table 29 for confidence intervals.

Appendix IV: Data on Students and Graduates
in STEM Fields
Page 78 GAO-06-114 Federal STEM Education Programs
Table 26: Comparisons in the Percentage of STEM Graduates by Field and Gender for Academic Years 1994-1995 and 2002-2003
STEM Degree/field
Percentage graduates, men,
1994-1995
Percentage graduates, men,
2002-2003
Percentage graduates, women,
1994-1995
Percentage graduates, women,
2002-2003
Bachelor’s degree
Biological/agricultural sciences 50 40 50 60
Earth, atmospheric, and ocean sciences 66 58 34 42
Engineering 83 80 17 20
Mathematics and computer sciences 65 69 35 31
Physical sciences 64 58 36 42
Psychology 27 22 73 78
Social sciences 50 45 50 55
Technology 90 88 10 12
Master’s degree
Biological/agricultural sciences 52 45 48 55
Earth, atmospheric, and ocean sciences 70 59 30 41
Engineering 84 79 16 21
Mathematics and computer sciences 70 66 30 34
Physical sciences 70 64 30 36
Psychology 28 23 72 77
Social sciences 51 45 49 55
Technology 81 73 19 27
Doctoral degree
Biological/agricultural sciences 63 57 37 43
Earth, atmospheric, and ocean sciences 78 72 22 28
Engineering 88 83 12 17
Mathematics and computer sciences 80 76 20 24
Physical sciences 76 73 24 27
Psychology 38 31 62 69
Social sciences 62 55 38 45
Technology 89 100 11 0
Source: GAO calculations based upon IPEDS data.

Appendix V: Confidence Intervals for
Estimates of Students at the Bachelor’s,
Master’s, and Doctoral Levels
Page 79 GAO-06-114 Federal STEM Education Programs
Because the National Postsecondary Student Aid Study (NPSAS) sample is a probability sample of students, the sample is only one of a large number of samples that might have been drawn. Since each sample could have provided different estimates, confidence in the precision of the particular sample’s results is expressed as a 95-percent confidence interval (for example, plus or minus 4 percentage points). This is the interval that would contain the actual population value for 95 percent of the samples that could have been drawn. As a result, we are 95 percent confident that each of the confidence intervals in this report will include the true values in the study population. The upper and lower bounds of the 95 percent confidence intervals for each estimate relied on in this report are presented in the following tables.
Table 27: Estimated Changes in the Numbers and Percentages of Students in the STEM and Non-STEM Fields across All Education Levels, Academic Years 1995-1996 and 2003-2004 (95 percent confidence intervals)
Lower and upper bounds of 95 percent confidence interval STEM field Non-STEM field
Lower bound: number of students: 1995-1996 3,941,589 14,885,171
Upper bound: number of students: 1995-1996 4,323,159 15,601,065
Lower bound: percentage of students: 1995-1996 20 78
Upper bound: percentage of students: 1995-1996 22 80
Lower bound: number of students: 2003-2004 4,911,850 16,740,049
Upper bound: number of students: 2003-2004 5,082,515 17,025,326
Lower bound: percentage of students: 2003-2004 22 77
Upper bound: percentage of students: 2003-2004 23 78
Lower bound: percentage change: 1995/96-2003/04 15 8
Upper bound: percentage change: 1995/96-2003/04 26.9 13.5
Source: GAO calculations based upon 1995-1996 and 2003-2004 NPSAS data.
Note: The totals for STEM and non-STEM enrollments include students in addition to the bachelor’s, master’s, and doctorate education levels. These totals also include students enrolled in certificate, associate’s, other undergraduate, first-professional degree, and post-bachelor’s or post-master’s certificate programs. The percentage changes between the 1995-1996 and 2003-2004 academic years for STEM and non-STEM students are statistically significant.
Appendix V: Confidence Intervals for Estimates of Students at the Bachelor’s, Master’s, and Doctoral Levels

Appendix V: Confidence Intervals for
Estimates of Students at the Bachelor’s,
Master’s, and Doctoral Levels
Page 80 GAO-06-114 Federal STEM Education Programs
Table 28: Numbers of Students by Education Level in all STEM Fields for Academic Years 1995-1996 and 2003-2004 (95 percent confidence intervals)
Total Bachelors Masters Doctorate
Lower bound: Number of Students: 1995-1996 2,633,867 2,114,316 271,208 171,824
Upper bound: Number of Students: 1995-1996 2,880,529 2,322,704 377,821 271,230
Lower bound: Number of Students: 2003-2004 3,411,004 2,819,206 366,141 185,230
Total
Upper bound: Number of Students: 2003-2004 3,545,844 2,934,236 442,938 212,471
Lower bound: Number of Students: 1995-1996 93,346 78,241 a a
Upper bound: Number of Students: 1995-1996 151,132 130,144 a a
Lower bound: Number of Students: 2003-2004 93,543 76,472 7,296 4,661
Agricultural Sciences
Upper bound: Number of Students: 2003-2004 119,613 98,590 21,202 7,553
Lower bound: Number of Students: 1995-1996 416,315 360,553 18,883 a
Upper bound: Number of Students: 1995-1996 524,615 454,119 57,066 a
Lower bound: Number of Students: 2003-2004 383,277 330,834 13,728 30,401
Biological Sciences
Upper bound: Number of Students: 2003-2004 427,502 372,355 26,694 37,367
Lower bound: Number of Students: 1995-1996 275,804 224,616 31,634 a
Upper bound: Number of Students: 1995-1996 363,084 297,662 71,242 a
Lower bound: Number of Students: 2003-2004 495,359 428,927 47,669 7,427
Computer Sciences
Upper bound: Number of Students: 2003-2004 554,747 483,679 70,210 11,243
Lower bound: Number of Students: 1995-1996 411,868 321,464 45,912 16,620
Upper bound: Number of Students: 1995-1996 516,391 405,544 90,768 54,155
Lower bound: Number of Students: 2003-2004 514,794 400,252 63,632 32,113
Engineering
Upper bound: Number of Students: 2003-2004 583,058 444,208 116,835 39,261
Lower bound: Number of Students: 1995-1996 68,083 42,910 a a
Upper bound: Number of Students: 1995-1996 119,165 74,456 a a
Lower bound: Number of Students: 2003-2004 75,705 55,314 7,869 7,687
Mathematics
Upper bound: Number of Students: 2003-2004 97,848 74,318 18,867 11,392
Lower bound: Number of Students: 1995-1996 139,416 87,966 a 21,279
Upper bound: Number of Students: 1995-1996 214,274 130,658 a 60,546
Lower bound: Number of Students: 2003-2004 160,895 116,479 14,944 22,043
Physical Sciences
Upper bound: Number of Students: 2003-2004 192,534 142,894 31,092 27,903
Lower bound: Number of Students: 1995-1996 327,359 271,188 17,600 16,929
Upper bound: Number of Students: 1995-1996 416,804 348,432 47,037 48,601
Lower bound: Number of Students: 2003-2004 449,858 385,660 24,218 27,846
Psychology
Upper bound: Number of Students: 2003-2004 502,696 433,995 41,116 40,142
Lower bound: Number of Students: 1995-1996 608,199 478,659 60,792 33,489
Upper bound: Number of Students: 1995-1996 742,107 594,315 103,562 79,414
Social Sciences
Lower bound: Number of Students: 2003-2004 974,279 791,462 125,457 38,291
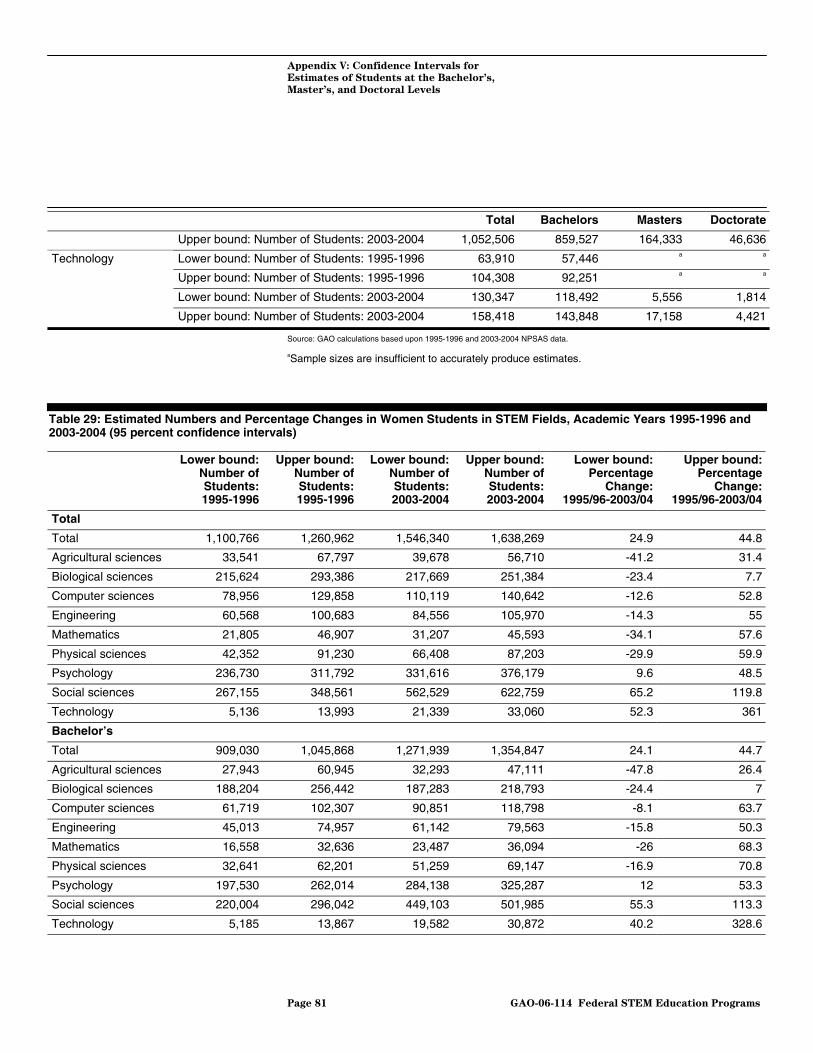
Appendix V: Confidence Intervals for
Estimates of Students at the Bachelor’s,
Master’s, and Doctoral Levels
Page 81 GAO-06-114 Federal STEM Education Programs
Total Bachelors Masters Doctorate
Upper bound: Number of Students: 2003-2004 1,052,506 859,527 164,333 46,636
Lower bound: Number of Students: 1995-1996 63,910 57,446 a a
Upper bound: Number of Students: 1995-1996 104,308 92,251 a a
Lower bound: Number of Students: 2003-2004 130,347 118,492 5,556 1,814
Technology
Upper bound: Number of Students: 2003-2004 158,418 143,848 17,158 4,421
Source: GAO calculations based upon 1995-1996 and 2003-2004 NPSAS data.
aSample sizes are insufficient to accurately produce estimates.
Table 29: Estimated Numbers and Percentage Changes in Women Students in STEM Fields, Academic Years 1995-1996 and 2003-2004 (95 percent confidence intervals)
Lower bound: Number of Students: 1995-1996
Upper bound: Number of Students: 1995-1996
Lower bound: Number of Students: 2003-2004
Upper bound: Number of Students: 2003-2004
Lower bound: Percentage
Change: 1995/96-2003/04
Upper bound: Percentage
Change: 1995/96-2003/04
Total
Total 1,100,766 1,260,962 1,546,340 1,638,269 24.9 44.8
Agricultural sciences 33,541 67,797 39,678 56,710 -41.2 31.4
Biological sciences 215,624 293,386 217,669 251,384 -23.4 7.7
Computer sciences 78,956 129,858 110,119 140,642 -12.6 52.8
Engineering 60,568 100,683 84,556 105,970 -14.3 55
Mathematics 21,805 46,907 31,207 45,593 -34.1 57.6
Physical sciences 42,352 91,230 66,408 87,203 -29.9 59.9
Psychology 236,730 311,792 331,616 376,179 9.6 48.5
Social sciences 267,155 348,561 562,529 622,759 65.2 119.8
Technology 5,136 13,993 21,339 33,060 52.3 361
Bachelor’s
Total 909,030 1,045,868 1,271,939 1,354,847 24.1 44.7
Agricultural sciences 27,943 60,945 32,293 47,111 -47.8 26.4
Biological sciences 188,204 256,442 187,283 218,793 -24.4 7
Computer sciences 61,719 102,307 90,851 118,798 -8.1 63.7
Engineering 45,013 74,957 61,142 79,563 -15.8 50.3
Mathematics 16,558 32,636 23,487 36,094 -26 68.3
Physical sciences 32,641 62,201 51,259 69,147 -16.9 70.8
Psychology 197,530 262,014 284,138 325,287 12 53.3
Social sciences 220,004 296,042 449,103 501,985 55.3 113.3
Technology 5,185 13,867 19,582 30,872 40.2 328.6

Appendix V: Confidence Intervals for
Estimates of Students at the Bachelor’s,
Master’s, and Doctoral Levels
Page 82 GAO-06-114 Federal STEM Education Programs
Lower bound: Number of Students: 1995-1996
Upper bound: Number of Students: 1995-1996
Lower bound: Number of Students: 2003-2004
Upper bound: Number of Students: 2003-2004
Lower bound: Percentage
Change: 1995/96-2003/04
Upper bound: Percentage
Change: 1995/96-2003/04
Master’s
Total 109,116 183,302 170,116 210,777 -5.6 66.1
Agricultural sciences a a a a a a
Biological sciences a a 11,330 16,806 a a
Computer sciences a a 11,907 24,093 a a
Engineering a a 10,989 24,604 a a
Mathematics a a 2,979 8,336 a a
Physical sciences a a 4,713 12,802 a a
Psychology 15,901 28,488 21,284 28,384 -58.1 70.5
Social sciences 26,605 54,185 79,619 108,720 45.8 220.5
Technology a a 235 3,485 a a
Doctorate
Total 38,103 79,875 81,553 95,377 -6.3 115.6
Agricultural Sciences a a 1,441 3,265 a a
Biological Sciences a a 14,455 19,692 a a
Computer Sciences a a 1,745 3,503 a a
Engineering a a 5,870 9,867 a a
Mathematics a a 1,999 4,085 a a
Physical Sciences a a 6,298 9,913 a a
Psychology a a 19,198 28,489 a a
Social Sciences 4,098 17,371 19,778 26,083 4.2 281.6
Technology a a 254 1,339 a a
Source: GAO calculations based upon NPSAS data.
aSample sizes are insufficient to accurately produce estimates.

Appendix V: Confidence Intervals for
Estimates of Students at the Bachelor’s,
Master’s, and Doctoral Levels
Page 83 GAO-06-114 Federal STEM Education Programs
Table 30: Estimated Percentage Changes in Bachelor’s, Master’s, and Doctoral Students in STEM Fields, Academic Years 1995-1996 and 2003-2004 (95 percent confidence intervals)
Lower and upper bounds of 95 percent confidence interval
STEM fields Percentage change in academic years 1995-1996 and 2003-2004 Total Bachelor’s Master’s Doctoral
Lower bound: percentage change -34.8 -38.7 a a
Upper bound: percentage change 11.9 9.5 a a
Agricultural sciences
Statistically significant no no a a
Lower bound: percentage change -24.4 -24.8 -79.6 a
Upper bound: percentage change -2.6 -2.5 -8.3 a
Biological sciences
Statistically significant yes yes yes a
Lower bound: percentage change 41.1 48.1 -34.8 a
Upper bound: percentage change 89.5 101.3 75 a
Computer sciences
Statistically significant yes yes no a
Lower bound: percentage change 3.5 1.4 -27.5 -55.4
Upper bound: percentage change 33.8 30.9 99.7 77.2
Engineering
Statistically significant yes yes no no
Lower bound: percentage change -33.5 -21.8 a a
Upper bound: percentage change 23 46.9 a a
Mathematics
Statistically significant no no a a
Lower bound: percentage change -21.7 -6.6 a -70.2
Upper bound percentage change 24.4 46.3 a 1.4
Physical sciences
Statistically significant no no a no
Lower bound: percentage change 11.7 14 -51.2 -48.8
Upper bound: percentage change 45.4 50.5 63.9 73.3
Psychology
Statistically significant yes yes no no
Lower bound: percentage change 34.6 36.1 24.7 -59.3
Upper bound: percentage change 66.5 71.6 127.9 16.3
Social sciences
Statistically significant yes yes yes no
Lower bound: percentage change 30 33.4 a a
Upper bound: percentage change 119.6 122.9 a a
Technology
Statistically significant yes yes a a
Lower bound: percentage change 20 23.1 1.8 -29.5
Upper bound: percentage change 32.3 36.3 49.2 12.1
Total
Statistically significant yes yes yes no
Source: GAO calculations based upon 1995-1996 and 2003-2004 NPSAS data.
aSample sizes are insufficient to accurately produce estimates.

Appendix V: Confidence Intervals for
Estimates of Students at the Bachelor’s,
Master’s, and Doctoral Levels
Page 84 GAO-06-114 Federal STEM Education Programs
Table 31: Estimates of STEM Students by Gender and Field for Academic Years 1995-1996 and 2003-2004 (95 percent confidence intervals)
Men: 1995-1996 academic year
Men: 2003-2004 academic year
Women: 1995-1996 academic
year
Women: 2003-2004 academic
year
STEM fields Lower bound
Upper bound
Lower bound
Upper bound
Statisticallysignificant
Lower bound
Upper bound
Lower bound
Upper bound
Statistically significant
Agricultural sciences
Bachelor’s 44 69 48 61 no 31 56 39 52 no
Master’s a a a a a a a a a a
Doctoral a a 49 72 a a a 28 51 a
Biological sciences
Bachelor’s 40 51 39 45 no 49 60 55 61 no
Master’s a a 14 46 a a a 54 89 a
Doctoral a a 44 55 a a a 45 56 a
Computer sciences
Bachelor’s 62 75 74 80 no 25 38 20 26 no
Master’s a a 61 78 a a a 22 39 a
Doctoral a a 62 81 a a a 19 38 a
Engineering
Bachelor’s 80 87 81 85 no 13 20 15 19 no
Master’s a a 73 88 a a a 12 27 a
Doctoral a a 73 83 a a a 17 27 a
Mathematics
Bachelor’s 44 70 46 61 no 30 56 39 54 no
Master’s a a a a a a a a a a
Doctoral a a 59 77 a a a 23 41 a
Physical sciences
Bachelor’s 46 66 48 59 no 34 54 41 52 no
Master’s a a a a a a a a a a
Doctoral a a 62 73 a a a 27 38 a
Psychology
Bachelor’s 20 32 23 28 no 68 80 72 77 no
Master’s a a 10 35 a a a 65 90 a
Doctoral a a 20 39 a a a 61 80 a
Social sciences
Bachelor’s 46 57 40 45 yes 43 54 55 60 yes
Master’s 38 64 28 42 no 36 62 58 72 no

Appendix V: Confidence Intervals for
Estimates of Students at the Bachelor’s,
Master’s, and Doctoral Levels
Page 85 GAO-06-114 Federal STEM Education Programs
Men: 1995-1996 academic year
Men: 2003-2004 academic year
Women: 1995-1996 academic
year
Women: 2003-2004 academic
year
STEM fields Lower bound
Upper bound
Lower bound
Upper bound
Statisticallysignificant
Lower bound
Upper bound
Lower bound
Upper bound
Statistically significant
Doctoral 70 91 41 51 yes 9 30 49 59 yes
Technology
Bachelor’s 81 93 77 85 no 7 19 15 23 no
Master’s a a a a a a a a a a
Doctoral a a a a a a a a a a
Total students
Total 55 60 53 55 yes 40 45 45 47 yes
Bachelor’s 54 58 53 55 no 42 46 45 47 no
Master’s 46 63 48 57 no 37 54 43 52 no
Doctoral 63 82 53 58 yes 18 37 42 47 yes
Source: GAO calculations based upon 1995-1996 and 2003-2004 NPSAS data.
aSample sizes are insufficient to accurately produce estimates.

Appendix V: Confidence Intervals for
Estimates of Students at the Bachelor’s,
Master’s, and Doctoral Levels
Page 86 GAO-06-114 Federal STEM Education Programs
Table 32: Estimates of Students for Selected Racial or Ethnic Groups in STEM Fields for All Education Levels and Fields for the Academic Years 1995-1996 and 2002-2003 (95 percent confidence intervals)
Race or ethnicity
Lower bound: number of students, academic
year, 1995-1996
Upper bound: number of students, academic
year, 1995-1996
Lower bound: number of students, academic
year, 2003-2004
Upper bound: number of students, academic
year, 2003-2004
African American 303,832 416,502 577,854 639,114
Hispanic 285,381 446,621 461,738 515,423
Asian/Pacific Islander 247,347 330,541 322,738 367,377
Native American 11,464 28,103 30,064 47,694
Other/multiple minorities 17,708 44,434 150,264 183,174
.

Appendix V: Confidence Intervals for
Estimates of Students at the Bachelor’s,
Master’s, and Doctoral Levels
Page 87 GAO-06-114 Federal STEM Education Programs
Lower bound: percentage
change Upper bound:
percentage change
Lower bound: percentage of
students, academic year 1995-1996
Upper bound: percentage of
students, academic year 1995-1996
Lower bound: percentage of
students, academic year 2003-2004
Upper bound: percentage of
students, academic year 2003-2004
41 97 7 10 12 13
3 64 7 11 9 10
1 38 6 8 6 7
8 206 0 1 1 1
219 732 0 1 3 4
Source: GAO Calculations based upon 1995-1996 and 2003-2004 NPSAS data.
Table 33: Estimates of International Students in STEM Fields by Education Levels for Academic Years 1995-1996 and 2003-2004 (95 percent confidence intervals)
Education level
Lower bound: number of students,
1995-1996
Upper bound: number of students,
1995-1996
Lower bound: number of students,
2003-2004
Upper bound: number
of students, 2003-2004
Lower bound: percentage
change
Upper bound: percentage
change
Total 80,812 142,192 154,466 186,322 12 102
Bachelor’s 20,254 47,684 125,950 154,911 155 523
Master’s 23,063 64,587 16,359 29,899 -76 -13
Doctoral 20,525 59,861 5,168 10,735 -90 -68
Source: GAO calculations based upon 1995-1996 and 2003-2004 NPSAS data.

Appendix VI: Confidence Intervals for
Estimates of STEM Employment by Gender,
Race or Ethnicity, and Wages and Salaries
Page 88 GAO-06-114 Federal STEM Education Programs
The current population survey (CPS) was used to obtain estimates about employees and wages and salaries in science, technology, engineering, and mathematics (STEM) fields. Because the current population survey (CPS) is a probability sample based on random selections, the sample is only one of a large number of samples that might have been drawn. Since each sample could have provided different estimates, confidence in the precision of the particular sample’s results is expressed as a 95 percent confidence interval (e.g., plus or minus 4 percentage points). This is the interval that would contain the actual population value for 95 percent of the samples that could have been drawn. As a result, we are 95 percent confident that each of the confidence intervals in this report will include the true values in the study population. We use the CPS general variance methodology to estimate this sampling error and report it as confidence intervals. Percentage estimates we produce from the CPS data have 95 percent confidence intervals of plus or minus 6 percentage points or less. Estimates other than percentages have 95 percent confidence intervals of no more than plus or minus 10 percent of the estimate itself, unless otherwise noted. Consistent with the CPS documentation guidelines, we do not produce estimates based on the March supplement data for populations of less than 75,000.
Table 34: Estimated Total Number of Employees by STEM Field between Calendar Years 1994 and 2003
STEM fields
Lower bound: calendar year
1994
Upper bound: calendar year
1994
Lower bound: calendar year
2003
Upper bound: calendar year
2003 Statistically
significant
Science 2,349,605 2,656,451 2,874,347 3,143,071 yes
Technology 1,285,321 1,515,671 1,379,375 1,568,189 no
Engineering 1,668,514 1,929,240 1,638,355 1,843,427 no
Mathematics/ computer sciences 1,369,047 1,606,395 2,520,858 2,773,146 yes
Source: GAO calculations based upon 1994 and 2003 CPS data.
Appendix VI: Confidence Intervals for Estimates of STEM Employment by Gender, Race or Ethnicity, and Wages and Salaries

Appendix VI: Confidence Intervals for
Estimates of STEM Employment by Gender,
Race or Ethnicity, and Wages and Salaries
Page 89 GAO-06-114 Federal STEM Education Programs
Table 35: Estimated Numbers of Employees in STEM Fields by Gender for Calendar Years 1994 and 2003
STEM fields
Lower bound:
calendar year
1994, women
Upper bound:
calendar year
1994, women
Lower bound:
calendar year
2003, women
Upper bound:
calendar year
2003, women
Statistically significant
Lower bound:
calendar year
1994, men
Upper bound:
calendar year
1994, men
Lower bound:
calendar year
2003, men
Upper bound:
calendar year
2003, men
Statistically significant
Science 1,594,527 1,827,685 2,031,124 2,327,390 yes 708,673 875,171 733,358 925,548 no
Technology 385,433 505,329 357,805 489,899 no 863,785 1,046,445 941,960 1,157,900 no
Engineering 107,109 174,669 126,947 210,407 no 1,538,198 1,777,778 1,440,510 1,703,920 no
Mathematics/ computer sciences 372,953 491,053 610,649 779,525 yes 959,765 1,151,681 1,805,505 2,098,325 yes
Source: GAO calculations based upon 1994 and 2003 CPS data.
Table 36: Estimated Changes in STEM Employment by Gender for Calendar Years 1994 and 2003
STEM fields Lower bound:
calendar year 1994 Upper bound:
calendar year 1994
Lower bound: calendar year
2003
Upper bound: calendar year
2003 Statistically
significant
Men Men
Science 28.87 34.40 24.84 30.30 yes
Technology 64.50 71.90 67.29 75.19 no
Engineering 90.28 94.05 87.93 92.69 no
Mathematics/ computer sciences 67.46 74.46 70.87 76.61 no
Women Women
Science 65.71 71.01 69.81 75.05 yes
Technology 28.26 35.35 24.97 32.55 no
Engineering 6.03 9.64 7.41 11.97 no
Mathematics/ computer sciences 25.69 32.39 23.51 29.01 no
Source: GAO calculations based upon 1994 and 2003 CPS data.

Appendix VI: Confidence Intervals for
Estimates of STEM Employment by Gender,
Race or Ethnicity, and Wages and Salaries
Page 90 GAO-06-114 Federal STEM Education Programs
Table 37: Estimated Percentages of STEM Employees for Selected Racial or Ethnic Groups for Calendar Years 1994 and 2003
Race or Ethnicity Lower bound:
calendar year 1994 Upper bound:
calendar year 1994Lower bound:
calendar year 2003Upper bound:
calendar year 2003 Statistically
significant
Black or African American 6.49 8.46 7.66 9.79 no
Hispanic or Latino origin 4.76 6.60 8.83 11.09 yes
Other minorities 3.64 5.28 5.89 7.81 yes
Source: GAO calculations based upon 1994 and 2003 CPS data.
Table 38: Estimated Changes in Median Annual Wages and Salaries in the STEM Fields for Calendar Years 1994 and 2003
STEM fields
Lower bound: calendar year
1994
Upper bound: calendar year
1994
Lower bound: calendar year
2003
Upper bound: calendar year
2003 Statistically
significant
Science $42,212 $45,241 $44,650 $47,008 yes
Technology $36,241 $39,769 $38,554 $41,286 yes
Engineering $59,059 $63,134 $67,634 $71,749 yes
Mathematics/computer sciences $51,922 $55,905 $58,801 $61,679 yes
Source: GAO calculations based upon 1994 and 2003 CPS data.

Appendix VII: Comments from the
Department of Commerce
Page 91 GAO-06-114 Federal STEM Education Programs
Appendix VII: Comments from the Department of Commerce

Appendix VII: Comments from the
Department of Commerce
Page 92 GAO-06-114 Federal STEM Education Programs

Appendix VII: Comments from the
Department of Commerce
Page 93 GAO-06-114 Federal STEM Education Programs

Appendix VII: Comments from the
Department of Commerce
Page 94 GAO-06-114 Federal STEM Education Programs
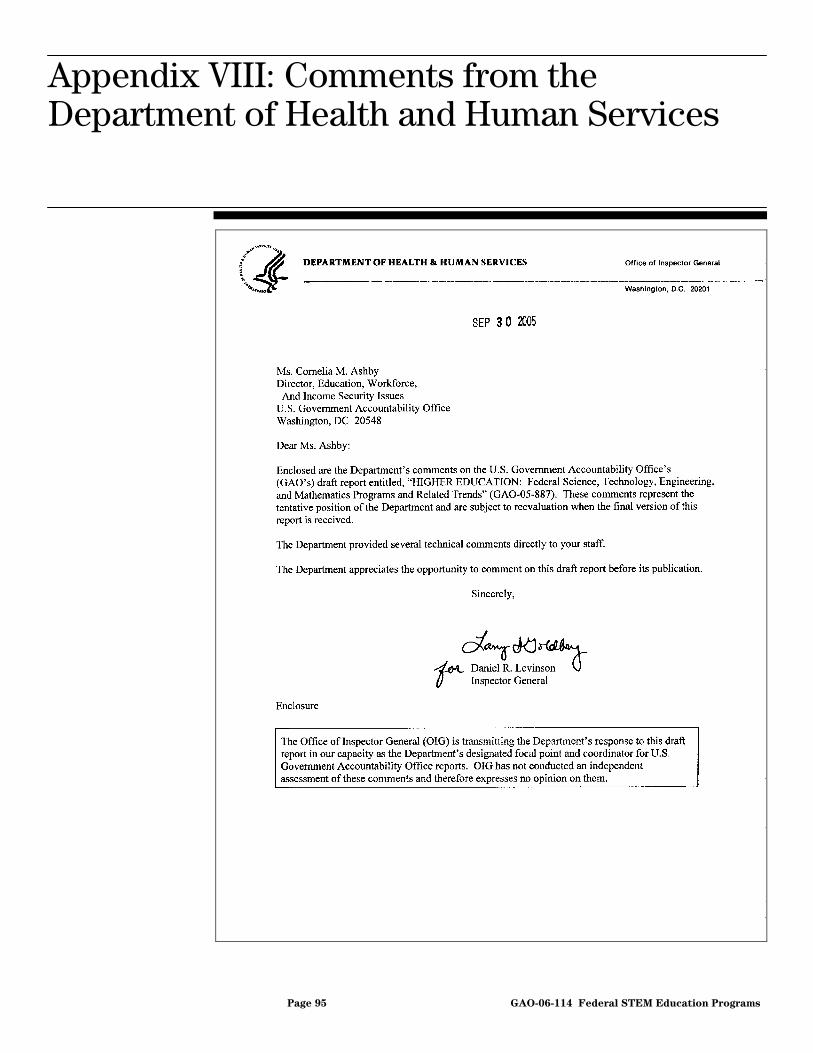
Appendix VIII: Comments from the Department of Health and Human Services
Page 95 GAO-06-114 Federal STEM Education Programs
Appendix VIII: Comments from the Department of Health and Human Services

Appendix VIII: Comments from the Department of Health and Human Services
Page 96 GAO-06-114 Federal STEM Education Programs

Appendix IX: Comments from the National
Science Foundation
Page 97 GAO-06-114 Federal STEM Education Programs
Appendix IX: Comments from the National Science Foundation

Appendix IX: Comments from the National
Science Foundation
Page 98 GAO-06-114 Federal STEM Education Programs

Appendix IX: Comments from the National
Science Foundation
Page 99 GAO-06-114 Federal STEM Education Programs

Appendix X: Comments from the National Science and Technology Council
Page 100 GAO-06-114 Federal STEM Education Programs
Appendix X: Comments from the National Science and Technology Council
Appendix XI: GAO Contact and Staff
Acknowledgments
Page 101 GAO-06-114 Federal STEM Education Programs
Cornelia M. Ashby (202) 512-7215
In addition to the contact named above, Carolyn M. Taylor, Assistant Director; Tim Hall, Analyst in Charge; Mark Ward; Dorian Herring; Patricia Bundy; Paula Bonin; Scott Heacock; Wilfred Holloway; Lise Levie; John Mingus; Mark Ramage; James Rebbe; and Monica Wolford made key contributions to this report.
Appendix XI: GAO Contact and Staff Acknowledgments
GAO Contact
Staff Acknowledgments

Bibliography
Page 102 GAO-06-114 Federal STEM Education Programs
Congressional Research Service, Foreign Students in the United States:
Policies and Legislation, RL31146, January 24, 2003, Washington, D.C.
Congressional Research Service, Immigration: Legislative Issues on
Nonimmigrant Professional Specialty (H-1B) Workers, RL30498, May 5, 2005, Washington, D.C.
Congressional Research Service, Monitoring Foreign Students in the
United States: The Student and Exchange Visitor Information System
(SEVIS), RL32188, October 20, 2004, Washington, D.C.
Congressional Research Service, Science, Engineering, and Mathematics
Education: Status and Issues, 98-871 STM, April 27, 2004, Washington, D.C.
Council on Competitiveness, Innovate America, December 2004, Washington, D.C.
Council of Graduate Schools, NDEA 21: A Renewed Commitment to
Graduate Education, June 2005, Washington, D.C.
Institute of International Education, Open Doors: Report on International
Educational Exchange, 2004, New York.
Jackson, Shirley Ann, The Quiet Crisis: Falling Short in Producing
American Scientific and Technical Talent, Building Engineering & Science Talent, September 2002, San Diego, California.
NAFSA: Association of International Educators, In America’s Interest:
Welcoming International Students, Report of the Strategic Task Force on International Student Access, January 14, 2003, Washington, D.C.
NAFSA: Association of International Educators, Toward an International
Education Policy for the United States: International Education in an
Age of Globalism and Terrorism, May 2003, Washington, D.C.
National Center for Education Statistics, Qualifications of the Public
School Teacher Workforce: Prevalence of Out-of-Field Teaching 1987-88
to 1999-2000, May 2002, revised August 2004, Washington, D.C.
National Science Foundation, The Science and Engineering Workforce
Realizing America’s Potential, National Science Board, August 14, 2003, Arlington, Virginia.
Bibliography

Bibliography
Page 103 GAO-06-114 Federal STEM Education Programs
National Science Foundation, Science and Engineering Indicators, 2004, Volume 1, National Science Board, January 15, 2004, Arlington, Virginia.
Report of the Congressional Commission on the Advancement of Women and Minorities in Science, Engineering and Technology Development, Land of Plenty: Diversity as America’s Competitive Edge in Science,
Engineering, and Technology, September 2000.
A Report to the Nation from the National Commission on Mathematics and Science Teaching for the 21st Century, Before It’s Too Late, September 27, 2000.
Seymour, Elaine, and Nancy M. Hewitt, Talking about Leaving: Why
Undergraduates Leave the Sciences, Westview Press, 1997, Boulder, Colorado.
The National Academies, Policy Implications of International Graduate
Students and Postdoctoral Scholars in the United States, 2005, Washington, D.C.
U.S. Department of Education, National Center for Education Statistics, Institute of Education Sciences, The Nation’s Report Card, NAEP 2004:
Trends in Academic Progress, July 2005, Washington, D.C.
U.S. Department of Education, The Secretary’s Third Annual Report on
Teacher Quality, Office of Postsecondary Education, 2004, Washington, D.C.
U.S. Department of Homeland Security, 2003 Yearbook of Immigration
Statistics, Office of Immigration Statistics, September 2004, Washington, D.C.
(130404)

The Government Accountability Office, the audit, evaluation and investigative arm of Congress, exists to support Congress in meeting its constitutional responsibilities and to help improve the performance and accountability of the federal government for the American people. GAO examines the use of public funds; evaluates federal programs and policies; and provides analyses, recommendations, and other assistance to help Congress make informed oversight, policy, and funding decisions. GAO’s commitment to good government is reflected in its core values of accountability, integrity, and reliability.
The fastest and easiest way to obtain copies of GAO documents at no cost is through GAO’s Web site (www.gao.gov). Each weekday, GAO posts newly released reports, testimony, and correspondence on its Web site. To have GAO e-mail you a list of newly posted products every afternoon, go to www.gao.gov and select “Subscribe to Updates.”
The first copy of each printed report is free. Additional copies are $2 each. A check or money order should be made out to the Superintendent of Documents. GAO also accepts VISA and Mastercard. Orders for 100 or more copies mailed to a single address are discounted 25 percent. Orders should be sent to:
U.S. Government Accountability Office 441 G Street NW, Room LM Washington, D.C. 20548
To order by Phone: Voice: (202) 512-6000 TDD: (202) 512-2537 Fax: (202) 512-6061
Contact:
Web site: www.gao.gov/fraudnet/fraudnet.htm E-mail: [email protected] Automated answering system: (800) 424-5454 or (202) 512-7470
Gloria Jarmon, Managing Director, [email protected] (202) 512-4400 U.S. Government Accountability Office, 441 G Street NW, Room 7125 Washington, D.C. 20548
Paul Anderson, Managing Director, [email protected] (202) 512-4800 U.S. Government Accountability Office, 441 G Street NW, Room 7149 Washington, D.C. 20548
GAO’s Mission
Obtaining Copies of GAO Reports and Testimony
Order by Mail or Phone
To Report Fraud, Waste, and Abuse in Federal Programs
Congressional Relations
Public Affairs
PRINTED ON RECYCLED PAPER