Embed Size (px)
Citation preview
®8tb Congress, 2d Session
FEDERAL RESERVEOF CHICAGO
Economic Indicators
MAY 1984
Prepared for the Joint Economic Committee by the
Council of Economic Advisers
UNITED STATES
GOVERNMENT PRINTING OFFICE
WASHINGTON : 1984
Digitized for FRASER http://fraser.stlouisfed.org/ Federal Reserve Bank of St. Louis
JOINT ECONOMIC COMMITTEE(Created pursuant to Sec. 5(a) of Public Law 304, 79th Cong."1
ROGER W. JEPSEN, Iowa, ChairmanLEE H. HAMILTON, Indiana,'ffo Chairman
SENATEWILLIAM V. ROTH, JR. (Delaware)JAMES ABDNOR (South Dakota)STEVEN D. SYMMS (Idaho)MACK MATTINGLY (Georgia)ALFONSE M, D'AMATQ (New York)LLOYD BENTSEN (Texas)WILLIAM PROXMIRE (Wisconsin)EDWARD M, KENNEDY (Massachusetts)PAUL S. SARBANES (Maryland)
HOUSE OF REPRESENTATIVESGILLIS W. LONG (Louisiana)PARREN J. MITCHELL (Maryland)AUGUSTUS F. HAWKINS (California)DAVID R. OBEY (Wisconsin)JAMES H. SCHEUER (New York)CHALMERS P. WYLIE (Ohio)MARJORIE S. HOLT (Maryland)DAN LUNGREN (California)OLYMPIA J. SNOWE (Maine)
DAN C. ROBERTS, Executive Director
COUNCIL OF ECONOMIC ADVISERS
MARTIN FELDSTEIN, ChairmanWILLIAM A. NISKANEN, Member
WILLIAM POOLE, Member
[PUBLIC LAW 120—81sT CONGRESS; CHAPTER 237—IST SESSION]
JOINT RESOLUTION [SJ. Res. 55]
To print the monthly publication entitled "Economic Indicators"
Resolved by the Senate and House of Representatives of the United States of America in Congress assembled, That theJoint Economic Committee be authorized to issue a monthly publication entitled "Economic Indicators," and thata sufficient quantity be printed to furnish one copy to each Member of Congress; the Secretary and the Sergeantat Arms of the Senate; the Clerk, Sergeant at Arms, and Doorkeeper of the House of Representatives; twocopies to the libraries of the Senate and House, and the Congressional Library; seven hundred copies to theJoint Economic Committee; and the required numbers of copies to the Superintendent of Documents fordistribution to depository libraries; and that the Superintendent of Documents be authorized to have copiesprinted for sale to the public.
Approved June 23, 1949.
Charts drawn by Art Production Branch, Office of the Secretary, Department of Commerce,
Economic Indicators, published monthly, is available at $4.25 a single copy($5.35 foreign), or by subscription at $25.00 per year ($31.25 for foreignmailing) from:
SUPERINTENDENT OF DOCUMENTSGOVERNMENT PRINTING OFFICE
WASHINGTON, D.C 20402
Digitized for FRASER http://fraser.stlouisfed.org/ Federal Reserve Bank of St. Louis
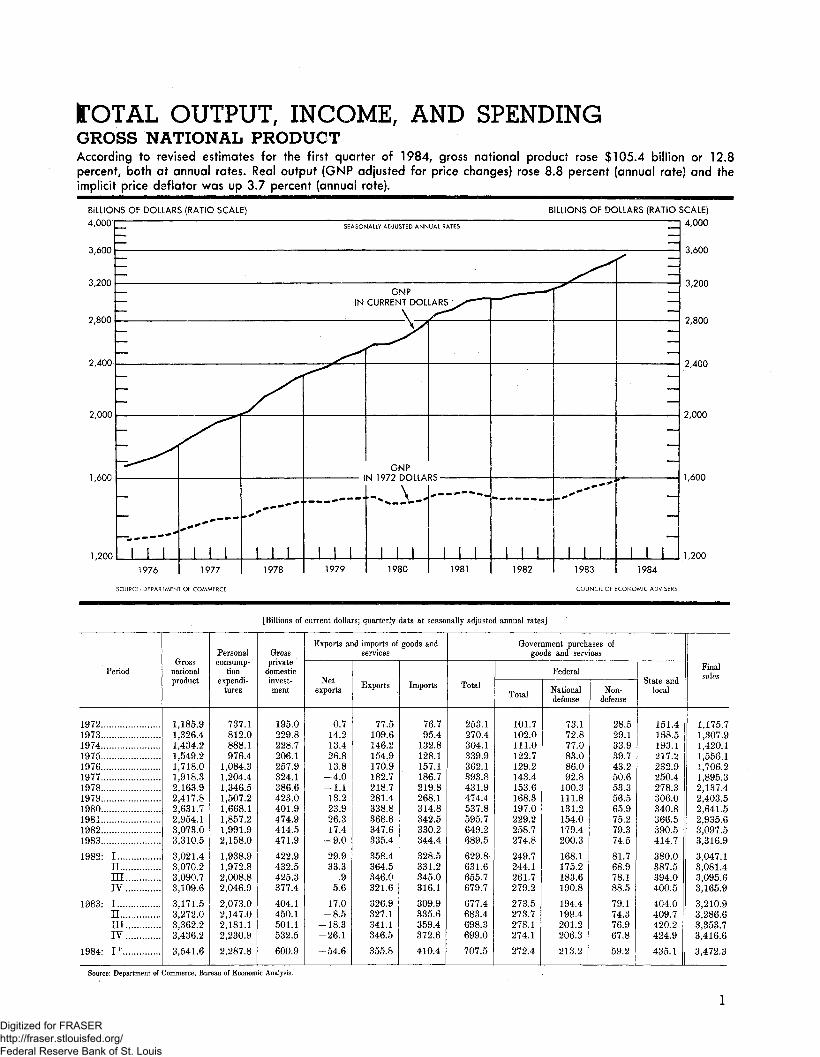
tQTAL OUTPUT, INCOME, ANDGROSS NATIONAL PRODUCTAccording to revised estimates for the first quarter of 1984, gross national product rose $105.4 billion or 12.8percent, both at annual rates. Real output (GNP adjusted for price changes) rose 8.8 percent (annual rate) and theimplicit price deflator was up 3.7 percent (annual rate).
BILLIONS OF DOLLARS (RATIO SCALE)
4,000
3,600
3,200
2,800
2,400
2,000
1,600
1,200
SEASONALLY ADJUSTED ANNUAL RATES
BILLIONS OF DOLLARS (RATIO SCALE)
4,000
GNPIN CURRENT DOLLARS
1976 1977 1978
GNPIN 1972 DOLLARS -
1979
\
1980 1981 1982
I I I
1983
3,600
3,200
2,800
2,400
2,000
1,600
1984
1,200
SOURCE: DEPARTMENT OF COMMERCE COUNCIL OF ECONOMIC ADVISERS
[Billions of current dollars; quarterly data at seasonally adjusted annual rates]
Period
19721973197419751976197719781979 ....1980198119821983 ..
1982- I.nmIV
1983- IninIV
1984- I r
Grossnationalproduct
1,185.91,326.41,434.21,549.21,718.01,918.32,163.92,417.82,631.72,954.13,073.03,310.5
3,021.43,070.23,090.73,109.6
3,171.53,272.03,362.23,436.2
3,541.6
Personalconsump-
tionexpendi-
tures
737.1812.0888.1976.4
1,084.31,204.41,346.51,507.21,668.11,857.21,991.92,158.0
1,938.91,972.82,008.82,046.9
2,073.02,147.02,181.12,230.9
2,287.8
Grossprivate
domesticinvest-ment
195.0229.8228.7206.1257.9324.1386.6423.0401.9474.9414.5471.9
422.9432.5425.3377.4
404.1450.1501.1532.5
600.9
Exports and imports of goods andservices
Netexports
0.714.213.426.813.8
-4.0— 1.113.223.926.317.4
-9.0
29.933.3
.95.6
17.085
-18.326 1
54.6
Exports
77.5109.6146.2154.9170.9182.7218.7281.4338.8368.8347.6335.4
358.4364.5346.0321.6
326.9327.1341.1346.5
355.8
Imports
76.795.4
132.8128.1157.1186.7219.8268.1314.8342.5330.2344.4
328.5331.2345.0316.1
309.9335.6359.4372.6
410.4
Government purchases ofgoods and services
Total
253.1270.4304.1339.9362.1393.8431.9474.4537.8595.7649.2689.5
629.8631.6655.7679.7
677.4683.4698.3699.0
707.5
Federal
Total
101.7102.0111.0122.7129.2143.4153.6168.3197.0229.2258.7274.8
249.7244.1261.7279.2
273.5273.7278.1274.1
272.4
Nationaldefense
73.172.877.083.086.092.8
100.3111.8131.2154.0179.4200.3
168.1175.2183.6190.8
194.4199.4201.2206.3
213.2
Non-defense
28.529.133.939.743.250.653.356.565.975,279.374.5
81.768.978.188.5
79.174.376.967.8
59.2
State andlocal
151.4168.5193.1217.2232.9250.4278.3306.0340.8366.5390.5414.7
380.0387.5394.0400.5
404.0409.7420.2424.9
435.1
Finalsales
1,175.71,307.91,420.11,556.11,706.21,895.32,137.42,403.52,641.52,935.63,097.53,316.9
3,047.13,081.43,095.63,165.9
3,210.93,286.63,353.73,416.6
3,472.3
Source: Department of Commerce, Bureau of Economic Analysis.
Digitized for FRASER http://fraser.stlouisfed.org/ Federal Reserve Bank of St. Louis
GROSS NATIONAL PRODUCT IN 1972 DOLLARS[Billions of 1972 dollars; quarterly data at seasonally adjusted annual rates]
Period
1972.................1973...,.1974....,,..,,19751976.....19771978.. .. ..1979......1980. . .1981.................19821983.. ,
1982; I .ninIV
1983: I . .n..........inIV
1984: I r......
Grossnationalproduct
1,185.91,254.3,246.3,231.6,298.2,369.7,438.6,479.4
1,475.01,513.81,485,41,535.3
1,485.81,489.31,485.71,480.7
1,490.11,525.11,553.41,572.5
1,606.0
Personalconsump-
tionexpendi-
tures
737.1767.9762.8779.4823.1864.3903.2927.6931.8956.8970.2
1,011.4
961.4968.8971.0979.6
986.71,010.61,016.01,032.2
1,049.6
Gross privatedomestic investment
Nonresi-dentialfixed
121.0138.1
' 135.7119.3125.6140.3158.3169.9165.8174.4166.1168.4
173.6167.1163.3160.5
159.9163.0170.1180.7
187.0
Residen-tial fixed
63.862.3
' 48.242.251.260,762.459.147.144.7.37,8
• 52.7
36.337.836.540.6
45.552.656.855.8
59.1
Changein
businessinvento-
ries
10.217.211.6
-6.77.8
13.316.07.3
-4.48,5
-9.42 1'
-10.2-3.4-1.3
-22.7 .
-15.4-5.4
3.88.7
30.1
Ixports of goodsand services
Netexports
0.715.527.832.225.422.0
. 24.037.250.343.028.911.8
35.233.424.023.0
20.512.311.42.8
-10.3
Exports
77.597.3
108.5103.5110.1112.9126.7146.2159.1159.7147.3138.7
151.8154.5146.4136.5
137.3136.2140.7140.6
143.1
Imports
76.781.880.771.484.790.9
102.7109.0108.8116.7118.4126.9
116.6121.1122.4113.5
116.8123.9129.2137.8
153.5
Government purr, liases ofgoods and services
Total
253.1253.3260.3265.2265.2269.2274.6•278.3284.3
291.8293,1
289.4285.8
' 292.2299.7
292.9292.1295.2292.3
290.7
Federal
Total
101.795,996,697.496.8
100.4100.3102.1106.4110.4116.6117.8
114.5110.3116.9124.4
118.4117.6118.9116.4
113.6
Nationaldefense
. 73.168.366.966.464.965.465,767.470.073.678.884.3
75.577.880.481.4
82.784.284.2
' 85.8
87.0
Non-defense
28.527.629.731.031.835.034.734.836.436,8
• 37.833.6
39.132.536.543.0
35.733.434.730.5
26.6
State Iand loca-i •
!
151.4157.4163.6167.8168.4168.8,174.3176.2177.9176.1175.2175.3
174.9175.4175,3175.2
174.5174.5176.3175.9
177.0
Finalsales
1,175.71,237.11,234.71,238.41,290.4
. 1,356.41,422.61,472.21,479.4,505.3,494.8
• ,537.4
,495.9,492.7,487.0
1,503.4
1,505.51,530.51,549.71,563.7
1,575.9
Source: Department of Commerce, Bureau of Economic Analysis.
IMPLICIT PRICE DEFLATORS FOR GROSS NATIONAL PRODUCT[1972 = 100; quarterly data are seasonally adjusted]
Period
19721973......19741975....19761977197819791980198119821983 .. . .
1982: I .n ..,ITTrv
1983: In .Mrv
1984- I r
Grossnationalproduct
100.00105.75115.08125.79132.34140.05150.42163.42178.42195.14206.88215.63
203.36206,15208.03210.00
212.83214.55216,44218.53
220.52
Personal consumptionexpenditures
Total
100.0105.7116.4125.3131.7139.3149.1162.5179.0194.1205.3213.4
201.7203.6206.9209.0
210.1212.5214.7216.1
218.0
Durablegoods
100.0101.7108.2117.3123.9129.2136.4145.0156.2167.3174.8178.7
172.9174.2176.1176.1
177.3177.5179.1180.7
181.1
Nondur-able
goods
100.0108.5123.4132.5137.2143.6153.4169,9188.1202.5209.0213.8
206.8207.6210.2211.2
210.6213.4215,5215.7
217.7
Services
100.0104.7113,0121.6129.6139.3150.0162.3178.8195.8211.6224.3
206.3209.4213.4217.2
219.8228.1
• 225.7'228.6
231.4
Gross privatedomestic investment
Nonresi-dentialfixed
100.0103.8115.4132.2138.6146.3157.2170.8186.2201.9209.7206.8
208.1211.1209.6209.9
207.7206.3206.3207.0
205.6
Residen-tial fixed
100.0109.1120.3131.0140.7158.0178.3200.5218.5233.5240.2246.8
240.8240.9240.9238.4
244.9243.9249.0248.7
249.2
Exports and imports ofgoods and
Exports
100.0112.7134.8149.6155.3161.9172.6192.5212.9230.8236.0241.8
236.1236.0236.3235.6
238.0240.2242.5246.4
248.6
Imports
100,0116.7164.6179.6185.6205.5214.1246.1289.4293.4278.9'271.3
281.8273.6281.8278.5
265.4•
278.1270.3
267.4
Government purchases of -goods andservices
Federal
Total
100.0106.3114.9126.0133.5142.8153.1164.8185.2207.7222.0233.3
218,0221.3223.8224.4
230.9•232.7233.8235.6
.
Nationaldefense
100.0106.8115.1124.9132.4141.9152.7166.0187.5209.3227.7237.7
222.7225.1228.3234.3
234.9236.7238.8240.3
244.9
Non-defense
100.0105.6114.2128.2135.7144.6153.8162.5180.8204.5210.0222.0
209.1212.3213.9205.7
221.7222.6221.7222.2
222.4
Stateand local
100.0107.0118.0129.4138.3148.4159.7173.7191.5208.1222.9236.6
217.3220.9224.7228.5
231.6234.8238.3241.5
245.8
Source: Department of Commerce, Bureau of Economic Analysis.
Digitized for FRASER http://fraser.stlouisfed.org/ Federal Reserve Bank of St. Louis
CHANGES IN GNP, PERSONAL CONSUMPTION EXPENDITURES, ANDRELATED PRICE MEASURES
[Percent change from previous period; quarterly data at seasonally adjusted annual rates]
Period
197219731974 . . .19751976197719781979198019811982 ,19831982- I
nTTTIV
1983: InmIV
1984- Ir
Gross national product
Currentdollars
10.111.88.18.0
10.911.712.811.78.8
12.24.07.7
-1.46.62.72.58.2
13.311.59.1
12.8
Constant(1972)dollars
5.75.8
6-1.2
5.45.55.02.8-.32.6
-1.93.4551.0
-1.01 32.69.77.65.08.8
Implicitprice
deflator
4.25.88.89.35.25.87.48.69.29.46.04.24.35.63.73.85.53.33.63.93.7
Chain priceindex
4.16.09.19.25.76.17.68.98.99.46.54.45.65.25.95.03.64.34.54.44.6
Fixed-weighted
price index(1972
weights)
4.06.09.49.15.86.37.89.59.89.56.44.35.34.75.94.73.44.34.74.24.8
Personal consumption expenditures
Currentdollars
9.610.29.49.9
11.01L111.811.910.711.37.38.37.57.27.57.85.2
15.16.59.4
10.6
Constant(1972)dollars
5.84.2
72.25.65.04.52.7.5
2.71.44.22.43.1
.93.62.9
10.02.26.56.9
Implicitprice
deflator
3.75.7
10.17.65.15.87.09.0
10.28.45.83.95.04.06.54.12.24.64.22.83.4
Chain priceindex
3.66.1
10.47.75.36.07.39.3
10.79.05.94.25.23.96.45.12.34.74.24.34.5
Fixed-weighted
price index(1972
weights)
3.56.1
10.47.85.36.27.49.7
11.19.25.74.14.83.56.75.11.64.94.44.24.5
NOTE.—Annual changes are from previous year and quarterly changes are from previous quarter. Source; Department of Commerce, Bureau of Economic Analysis.
NONFINANCIAL CORPORATE BUSINESS—OUTPUT, COSTS, ANDPROFITS
[Quarterly data at seasonally adjusted annual rates]
Period
1972197319741975197619771978...19791980198119821983
1982- I.. .n.....HI .IV....
1983: InIllIV
^984: Ip
Gross domesticproduct of nonfinancial
corporate business(billions of dollars)
Currentdollars
678.0759.4818.9890.0
1,001.31,128.41,276.21,416.81,540.71,739.91,776.71,921.7
1,764.91,780.21,786.81,775.0
1,817.61,892.41,957.82,019.0
2,075.8
1972dollars
678.0731.9708.2694.2745.5795.8846.3876.1859.5887.5857.7895.2
864.3860.5859.5846.4
856.0885.8909.4929.7
951.3
Current-dollar cost and profit per unit of output (dollars) l
Totalcost andprofit 2
.000
.038
.156
.282
.3431.4181.5081.6171.7931.9602.0722.147
2.0422.0692.0792.097
2.1232.1362.1532.172
2.182
Capitalconsump-
tionallowances
withcapital
consump-tion
adjustment
0.092.093.112.137.141.145.155.171.198.217.245.244
.236
.242
.247
.254
.252
.245
.241
.238
.236
Indirectbusinesstaxes 3
0.113.114.127.140.141.141.144.149.172.199.209.220
.204
.207
.209
.215
.218
.223
.221
.219
.217
Compen-sation ofemploy-
ees
0.659.692.786.837.878.928.998
1.0941.2181.3021.3971.418
1.3741.3941.4031.419
1.4281.4161.4121.416
1.425
Netinterest
0.028.031.042.044.040.040.044.050.065.074.076.066
.080
.079
.072
.073
.070
.066
.065
.065
.066
Corporate profits with inventoryvaluation and capital consumption
adjustments
Total
0.107.107.090.124.144.163.168.154.140.169.145.199
.148
.147
.148
.135
.156
.187
.214
.234
.239
Profitstax
liability
0.049.055.059.059.071.075.079.079.078.074.048.063
.053
.051
.049
.040
.049
.062
.070
.069
.074
Profitsaftertax4
0.058.053.030.065.073.088.089.075.062.095.097.136
.095
.096
.099
.095
.108
.125
.144
.165
.165
Outputper hour
of allemploy-
ees (1972dollars)
7.6647.8497.5557.7748.0028.1448.2168.2018.1268.3328.3728.649
8.3428.3328.4098.418
8.4848.6208.7088.781
8.824
Compen-sation per
hour ofall
employ-ees
(dollars)
5.0525.4295.9376.5077.0247.5588.1988.9699.894
10.85011.70012.260
11.46311.61611.79511.947
12.11412.20212.29312.433
12.570
1 Output is measured by gross domestic product of nonfinaneial corporate business in 1972 dol-lars.
2 This is equal to the deflator for gross domestic product of nonfinancial corporate business withthe decimal point shifted two places to the left.
3 Indirect business tax and nontax liability plus business transfer payments less subsidies.4 With inventory valuation and capital consumption adjustments.
Sources: Department of Commerce (Bureau of Economic Analysis) and Department of Labor(Bureau of Labor Statistics).
Digitized for FRASER http://fraser.stlouisfed.org/ Federal Reserve Bank of St. Louis
NATIONAL INCOME[Billions of dollars; quarterly data at seasonally adjusted annual rates]
Period
1972197319741975197619771978 ... .19791980198119821983
1982- InmIV .
1983: InmIV
1984: I r
Nationalincome
963.61,086.21,160.71,239.41,379.21,550.51,760.31,966.72,116.62,373.02,450.42,650.2
2,419.72,448.92,458.92,474.0
2,528.52,612.82,686.92,772.4
2,878.4
Compensa-tion of
employees 1
718.0801.3877.5931.4
1,036.31,152.11,301.11,458.11,599.61,769.21,865.71,990.2
1,834.21,859.91,879.51,889.0
1,923.71,968.72,011.82,056.6
2,113.4
Proprietors' income withinventory valuation and
capital consumptionadjustments
Farm
18.732.826.524.619.119.126.331.921.830.521.520.9
27.416.815.826.0
22.221.015.525.0
47.9
Nonfarm
58.161.062.265.475.084.892.2
100.295.689.787.4
107.6
83.788.187.890.2
98.4106.2111.2114.5
121.2
Bentalincome ofpersons
withcapital
consump-tion
adjustment
21.022.623.523.023.524.826.627.931.541.449.954.8
47.449.050.952.3
54.154.853.956.2
57.0
Corporate profits with inventory valuation and capital consumptionadjustments
Total
96.6108.394.9
110.5138.1167.3192.4194.8175.4192.3164.8229.1
162.0166.8168.5161.9
181.8218.2248.4268.2
277.5
Profits with inventory valuationadjustment and without capital
consumption adjustment
Total
94.0105.696.7
120.6151.6178.5205.1209.6191.7203.3165.9198.3
167.7170.3168.3157.2
168.0192.7210.8222.0
227.7
Profitsbefore tax
100.6125.6136.7132.1166.3194.7229.1252.7234.6227.0174.2207.5
173.2178.8177.3167.5
169.7203.3229.1228.2
240.6
Inventoryvaluation
adjustment
-6.6-20.0-40.0-11.6-14.7-16.2-24.0-43.1-42.9-23.6-8.4-9.2
5 5-S.5-9.0
-10.3
-1.7-10.6-18.3-6.3
-12.9
Capitalconsump-
tionadjustment
2.72.7
-1.8-10.1-13.5-11.3-12.7-14.8-16.3-11.0-1.130.8
5 6-3.5
.14.7
13.925.637.646.2
49.8
Netinterest
51.260.276.184.587.2
102.5121.7153.8192.6249.9261.1247.5
265.0268.3256.4254.7
248.3243.8246.1251.9
261.5
1 Includes employer contributions for social insurance. (See also p. 5.) Source: Department of Commerce, Bureau of Economic Analysis.
PERSONAL CONSUMPTION EXPENDITURES[Billions of dollars, except as noted; quarterly data at seasonally adjusted annual rates]
Period
1972197319741975 ,197619771978.19791980198119821983 . ..
1982: InmIV
1983- InmIV.;
1984: F.
Totalpersonalconsump-
tionexpendi-
tures
737.1812.0888.1976.4
1,084.31,204.41,346.51,507.21,668.11,857.21,991.92,158.0
1,938.91,972.82,008.82,046.9
2,073.02,147.02,181.12,230.9
2,287.8
Durable goods
Totaldurablegoods
111.1123.3121.5132.2156.8178.2200.2213.4214.7236.1244.5279.4
239.4242.9243.4252.1
258.5277.7§82.8298.6
314.9
Motorvehicles
andparts
52.457.150.455.872.684.895.796.690.7
101.6109.9133.4
106.4107.6109.4116.1
118.4133.9135.6145.6
155.9
Furni-ture andhouse-hold
equip-ment
41.747.150.653.559.165.772.881.886.393.393.5
102.2
91.793.993.594.9
97.3100.8102.9107.7
111.6
Other
1.6.919.220.522.925.227.731.735.137.741.241.143.9
41.341.440.541.0
42.943.144.345.4
47.4
Nondurable goods
Totalnondur-
ablegoods
300.6333.4373.4407.3441.7478.8528.2600.0668.8733.9761.0804.1
749.7754.7766.6773.0
777.1799.6814.8825.0
843.3
Food
154.9172.1193.7213.6230,6249.8275.9311.6345.1375.9396.9422.1
388.1394.7400.4404.5
411.7419.6426.4430.6
440.1
Clothingand
shoes
55.461.464.869.675.382.692.499.1
104.6115.3119.0125.6
118.4119.0119.2119.6
120.0126.4125.1130.7
134.1
Gasolineand oil
25.428.636.640.444.048.151.266.684.894.691.590.8
94.089.691.391.1
87.390.393.192.7
92.2
Other
64.971.278.283.791.998.2
108.8122.8134.3148.1153.5165.7
149.2151.5155.6157.9
158.1163.3170.2171.1
176.9
Services
325.3355.2393.2437.0485.7547.4618.0693.7784.5887.1966.4
1,074.5
949.7975.2998.9
1,021.8
1,037.41,069.71,083.51,107.3
1,129.6
Eetail sales of newpassenger cars
(millions of units)
Domes-tics
9.39.67.47.08.59.09.28.26.66.25.86.8
5.85.75.66.0
6.16.97.07.2
8.2
Imports
1.61.81.41.61.52.12.02.32.42.32.22.4
2.22.02.22.5
2.32.32.32.7
2.3
Source: Department of Commerce, Bureau of Economic Analysis.
Digitized for FRASER http://fraser.stlouisfed.org/ Federal Reserve Bank of St. Louis
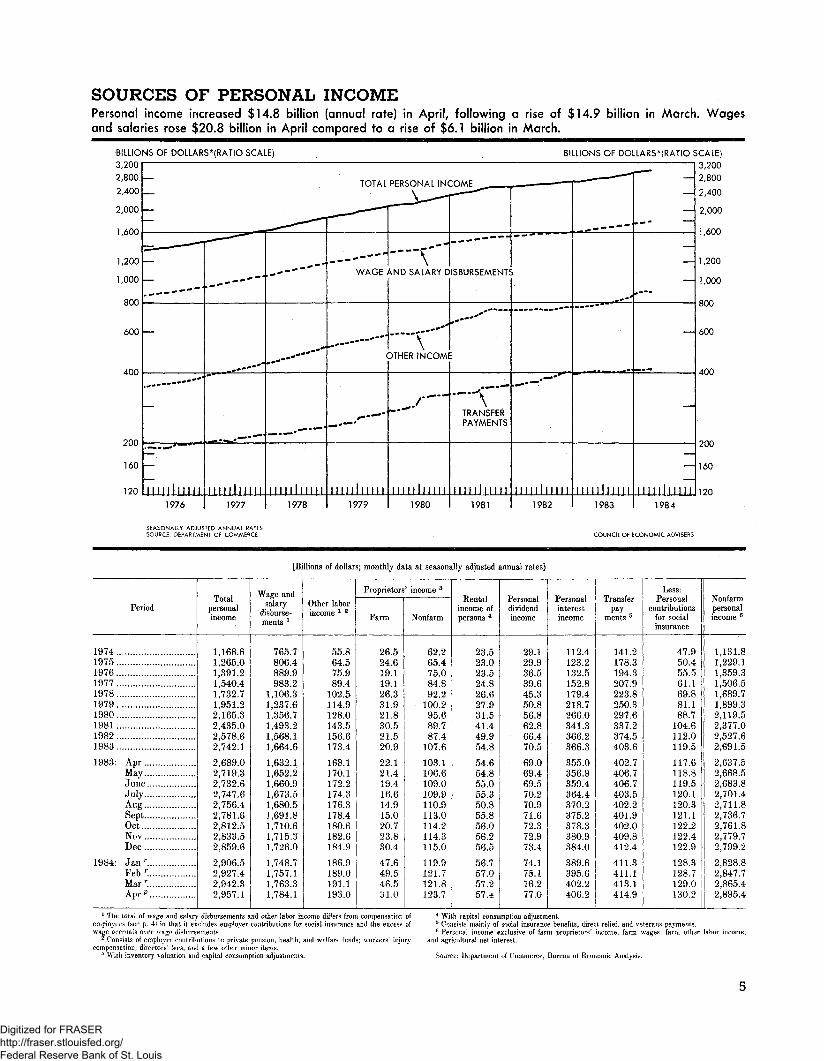
SOURCES OF PERSONAL INCOMEPersonal income increased $14.8 billion (annual rate) in April, following a rise of $14.9 billion in March. Wagesand salaries rose $20.8 billion in April compared to a rise of $6.1 billion in March.
TOTAL PERSONAL INCOME
BILLIONS OF DOLLARS*(RAT!O SCALE)3,2002,800
2,400
2,000
1,600
1,200
1,000
800
600
400
200
160
120
1976 1977
Minium1978
WAGE AND SALARY DISBURSEMENTS
OTHER INCOME
1979ILL
1980
TRANSFERPAYMENTS
nsnhmi1981
BILLIONS OF DOLLARS*(RAT!O SCALE)3,2002,800
2,400
2,000
1,600
1,200
1,000
800
600
400
200
160
1201982
iimlmii1983
I M I i l l l l i l
1984
• SEASONALLY ADJUSTED ANNUAL RATESSOURCE: DEPARTMENT OF COMMERCE COUNCIL OF ECONOMIC ADVISERS
[Billions of dollars; monthly data at seasonally adjusted annual rates]
Period
19741975...1976.....197719781979...,198019811982..1983
1983: AprMayJune...JulyAugSeptOctNovDec
1984: Janr
Feb r.Marr.Apr"
Totalpersonalincome
1,168.6If265.01,391.21,540.41,732.71,951.22,165.32,435,02,578.62,742.1
2,689.02,719.32,732.62,747.62,756.42,781.62,812.52,833.52,859.6
2,906.52,927.42,942.32,957.1
salary
ments 1
765.7806.4889.9983.2
1,106.31,237.61,356.71,493.2,568.1,664.6
,632.1,652.2,660.9,673.5,680.5,691.8
1,710.61,715.31,726.0
1,748.71,757.11,763.31,784.1
Other laborincome
55.864.575.989.4
102.5114.9128.0143.5156.6173.4
168.1170.1172.2174.3176.3178.4180.6182.6184.9
186.9189.0191.1193.0
Proprietors
Farm
26.524.619.119.126.331.921.830.521.520.9
22.121.419.416.614.915.020.723.830.4
47.649.546.531.0
' income 3
Nonfarm
62.265.475.084.892.2
100.295.689.787.4
107.6
103.1106.6109.0109.9110,9113.0114.2114.3115.0
119.9121.7121.8123.7
"Rentalincome ofpersons 4
23.523.023.524.826.627.931.541.449.954.8
54.654.855.055.350.855,856.056.256.5
56.757.057.257.4
Personaldividendincome
29.129.936.539.645.350.856.862.866.470.5
69.069.469.570.270.971.672.372.973.4
74.175.176.277.0
Personalinterestincome
112.4123.2132.5152.8179.4218.7266.0341.3366.2366.3
355.0356.9359.4364.4370.2375.2378.3380.9384.0
389.6395.6402.2406.2
Transferpay-
ments 5
141.2178.3194.3207.9223.8250.3297,6337.2374.5403.6
402.7406.7406.7403.5402.2401.9402.0409.8412.4
411.3411.1413.1414.9
Less:Personal
contributionsfor socialinsurance
47.950.455.561.169.881.188.7
104.6112.0119.5
117.6118.8119.5120.1120.3121.1122.2122.4122.9
128.3128.7129.0130.2
Nonfarmpersonalincome 6
1S131.81,229.11,359.31,506.51,689.71,899.32,119.52,377.02,527.62,691.5
2,637.52,668.52,683.82,701.42,711.82,736.72,761.82,779.72,799.2
2,828.82,847.72,865.42,895.4
1 The total of wage and salary disbursements and other labor income differs from compensation ofemployees (sec p. 4) in that it excludes employer contributions for social insurance and the excess ofwage accruals over wage disbursements,
* Consists of employer contributions to private pension, health, and welfare funds; workers' injurycompensation; directors' fees; and a few other minor items.
8 With inventory valuation and capital consumption adjustments.
4 With capital consumption adjustment.5 Consists mainly of social insurance benefits, direct relief, and veterans payments.6 Persona] income exclusive of farm proprietors' income, farm wages, farm other labor income,
and agricultural net interest.
Source: Department of Commerce, Bureau of Economic Analysis.
Digitized for FRASER http://fraser.stlouisfed.org/ Federal Reserve Bank of St. Louis
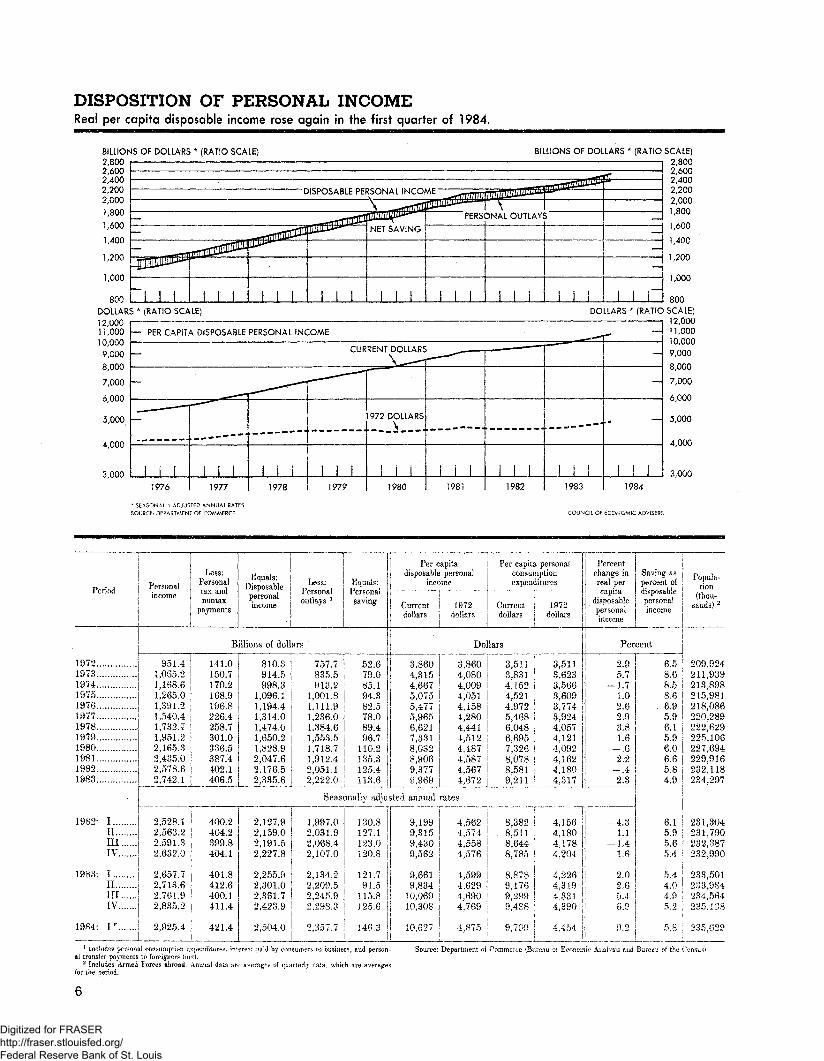
OF PERSONALReal per capita disposable income rose again in the first quarter of 1984.
BILLIONS OF DOLLARS * (RATIO SCALE)2,800
BILLIONS OF DOLLARS * (RATIO SCALE)2,8002,6002,4002,2002,0001,800
1,000
800DOLLARS * (RATIO SCALE)
12,00011,000 f— PER CAPITA DISPOSABLE PERSONAL INCOME10,000
1,000
3,000
1976
* SEASONALLY ADJUSTED ANNUAL RATES
SOURCE: DEPARTMENT OF COMMERCE
DOLIARS * (RATIO SCALE)12,000
-H 11,000.-J 10,000
9,000
8,000
7,000
6,000
5,000
4,000
j 3,0001984
COUNCIL OF ECONOMIC ADVISERS
Period
197219781974 .1975197619771978.... ,.197919801981..1982......1983
i
Less:
Personal ! Pcrson*1
income | lax fnd
nontaxpayments
F 1
Disposablepersonalincome
Less:Personaloutlays l
[Per capita
1 disposable .personalEqual?:Personal
saving
Billions of dollars
951 4 141 ft1 085 2 150 71 1886 17021 265 0 1 168 91 391 2 19« R1 5404
8103 7577 59 R914 5 ft.^P; R 7Q A
998 3 913 2 fl* 11 096 1 1 001 8 94 31 1 94 A 1 111 Q R9 K
9.9fi4 1 314O 1 93« n 78 A
1 732 7 i S«S 71 951 22 165 32,435.0257862,742.1
301 0336 5387.4402 1406.5
1 474 01 65021 828 92,047.62 176 52.335.6
1 384 61 553 5
89 4Qft 7
1*7187 110 9.1,912.42 051 1
135.319S 4.-
income
Current 1972dollars dollars
Per capita personal j Percentconsumption H change inexpenditures I I real per
r | j capitan A tor- ki i j disposableCurrent 1972 ~dollars dollars P.ersomu
income
Saving aspercent ofdisposablepersonalincome
Dollars | Percentr "
3 8604 3154 0075 0755 4775 96*>6 6217 3318 03"?8,906Q 577
2,222.0 113.6 |
Seasonally annualr
Iii........m ......IV.,
1983: III.m ......IV.......
1984: I r. ......
2,528,1 400.22,563.2 404.22.591.8 399.82,632.0
2 657 7
404.1
4.01 R
2,713.6 412.62,761.9 400,12,835.2 411.4
2,925.4 421.4
2,127.92,159.02,191.52,227.8
1,997.02,031.92,068,4
130.8127.1123.0
• 2,107.0 120,8
2 255 9 2 134 2 121 7 •2^301.0 ! 21209.5 91.52.361.7 2,245.9 115.82,423.9 | 2,298.3 125.6
2,504.01
9,1999,3159,4309,562
9 6619334
10,06910,308
10,6271 _,
3 8604 0804 0094 f)5i4 1584 9QO4 4414 5124 4874,5874 567
3 51 r 3 51 13 831
P !••tion
(thou-sands) 2
99 fi f> ! 900 99.4Q «9S R 7 R fi
4 1 52 34 591 -Q ftrtQ4 9725 4686 0486 695?' 3268,078
3 7743 "9944 0574 1214' 0924,162
1 71 02 62 93 81 6
62, -2
ft fiftl 4 ISO — J.
4,672 j 9,211
rates
4,5624,5744,5584,576
4 5994J294,6904,769
4,875
4,317 2.3
8.382 4,156 I -4.3. 8,511 4,180 | 1.1
8,644 • 4.1788,785
8 87ft9,1769,299
4,204
4 2264^19
-1.41.6
2 0
8 58 66 9596 15 9606.65 84.9
6.15.95.65.4
5 4
2,6 4.05.4 4.9
| 6.9 5 J •
, | 9.2 j 5.8
211 939213 898915 9«Q1218 086220 2899.22'699225 106227 694229,916232 118234,297
231,304231,790232,887232,990
233 501233,984234,564235,188
235,629
uiJ by j business, and person-1 iuc'iw!^ personal copsumptx-n ey^/iditun-fi. iral transfer paynserit? to foreigner? 1j:ct).
2 Includes Armed Forces abroad. Animal data ar» averages of quarterly Cata, which are averagesfor the period.
source: Department of Commerce 'Bureau oi Economic Analysis and Bureau of the Census)
Digitized for FRASER http://fraser.stlouisfed.org/ Federal Reserve Bank of St. Louis
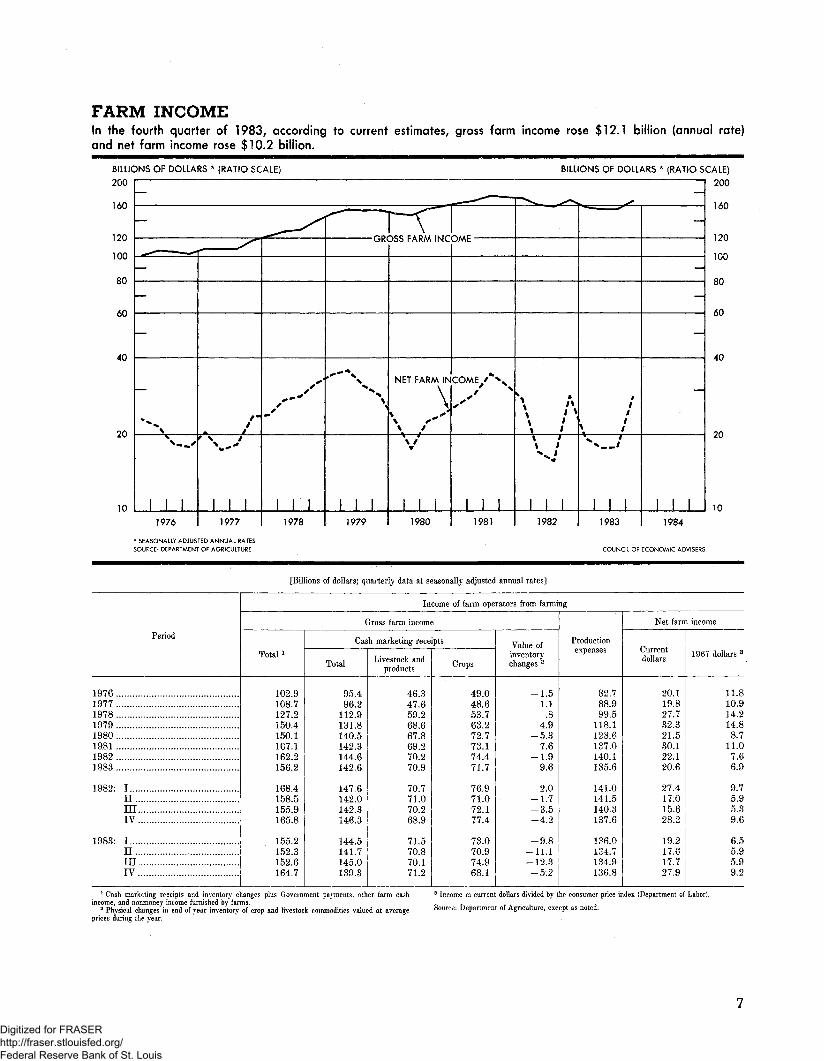
FARM INCOMEIn the fourth quarter of 1983, according to current estimates, gross farm income rose $12.1 billion (annual rate)and net farm income rose $10.2 billion.
BILLIONS OF DOLLARS * (RATIO SCALE)
200
160
120
100
80
60
40
20
10
BILLIONS OF DOLLARS * (RATIO SCALE)
200
1976 1977
I I I
1978
-GROSS FARM INCOME -
1979
NET FARM INCOME /
I i1980 1981
1%I 1II
1982
I I
1983 1984
* SEASONALLY ADJUSTED ANNUAL RATES
SOURCE: DEPARTMENT OF AGRICULTURE
160
120
100
80
60
40
20
10
COUNCIL OF ECONOMIC ADVISERS
[Billions of dollars; quarterly data at seasonally adjusted annual rates]
Period
1976197719781979 .1980198119821983
1982- Ininrv
1983: I. ,nin.IV
Income of farm operators from farming
Gross farm income
Total !
102.9108.7127.2150.4150.1167.1162.2156.2
168.4158.5155.9165.8
155.2152.3152.6164,7
Cash marketing receipts
Total
95.496.2
112.9131.8140.5142.3144.6142.6
147.6142.0142.3146.3
144.5141.7145.0139.3
Livestock andproducts
46.347.659.268.667.869.270.270.9
70.771.070.268.9
71.570.870.171.2
Crops
49.048.653.763.272.773.174.471.7
76.971.072.177.4
73.070.974.968.1
Value ofinventorychanges 2
— 1.51.1.8
4.9-5.3
7.6-1.9
96
2.0' -1.7
35-4.2
-9.8-11.1-12.3-5'.2
Productionexpenses
82.788.999.5
118.1128.6137,0140.1135.6
141.0141.5140.3137.6
136.0134.7134.9136.8
Net farm income
Currentdollars
20.119.827.732.321.530.122.120.6
27,417.015.628.2
19.217.617.727.9
1967 dollars 3
11.810.914.214.88.7
11.07.66.9
9.75.95.39.6
6.55.95.99.2
1 Cash marketing receipts and inventory changes plus Government payments, other farm cashincome, and nonmoney income furnished by farms.
2 Physical changes in end-of-year inventory of crop and livestock commodities valued at averageprices during the year.
3 Income in current dollars divided by the consumer price index (Department of Labor).
Source: Department of Agriculture, except as noted.
Digitized for FRASER http://fraser.stlouisfed.org/ Federal Reserve Bank of St. Louis
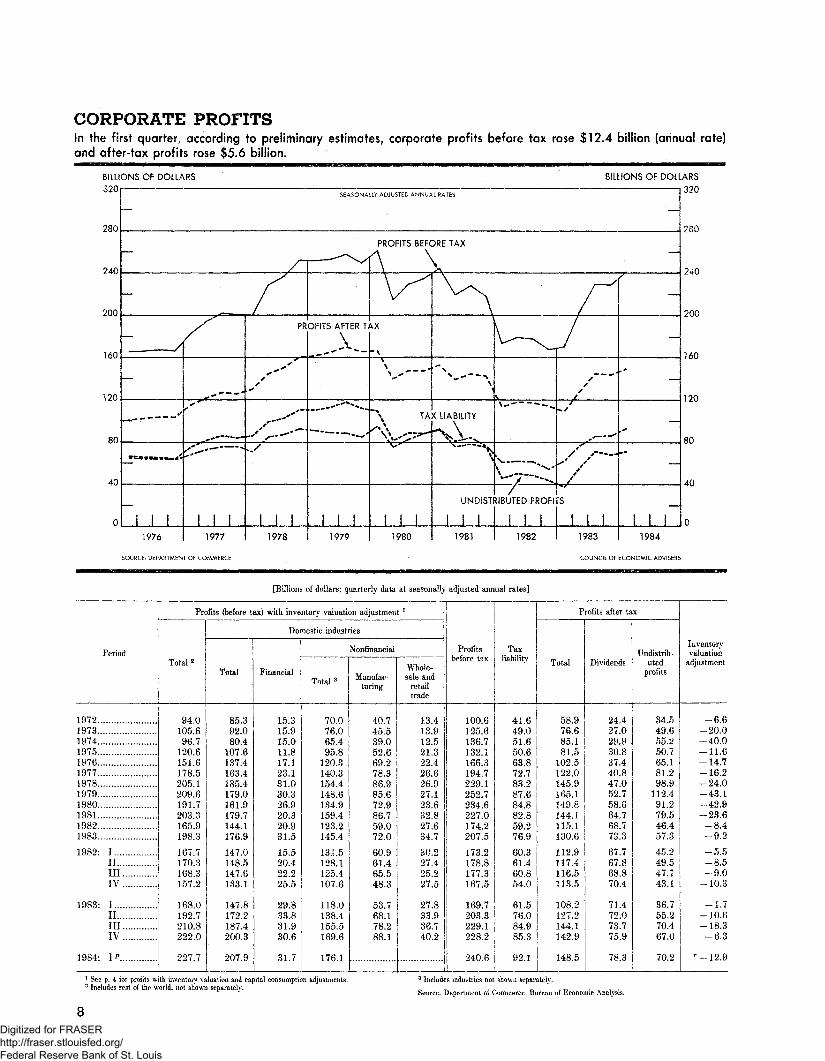
CORPORATE PROFITSIn the quarter, to rose $12.4 (annual rate)and after-tax profits rose $5.6 billion.
BILLIONS OF DOLLARS
320
280
240
200
160
120
80
40
SEASONALLY ADJUSTED 4NNUAL RATES
/~
- ^
~
— — -S
*&a**M*M*«{
1 1 1
1976
SOURCE: DEPARTMEN
f
**'<f
r+~~
^.*'***
1 1 1
1977
T OF COMMERCE
PR
"*'"'ss
-- -'*„/
i 1 11978
j — " M
OFITS AFTER T>
.--v-
«-«•****"'****' «»«»
! 1 11979
PROFITS BEFORE TAX
r\ \ :\7^
\X
-\A ' --V-
*\ TA
"%<HV»*"
1 ! 11980
v^ r• "'" •" "Tj
%V-* — •%
\
X LIABILITY
-sX^^
'
I 1 i
1981
^\
v *.% •x,-
--/---,/
5IBUTED PROFI
! I 11982
/,*""""" ""*
/
//
/
•*./
,_..*•*•
//--
rs
1 i 11983
COUNCIL OF
r __ ,
—
_
,**
—
1 11984
ECONOMIC ADVISERS
BILLIONS OF DOLLARS
280
240
200
160
120
80
40
[Billions of dollars; quarterly data at seasonally adjusted annual rates]
Period
19721973 ,.197419751976 .19771978 .1979198019811982...,1983
1982: I « ..IIIII '. .IV
1983- III. . .IllIV . .
1984: lp. . . .
Profits (before tax) with inventory valuation adjustment 1
Total 2
94.0105.696.7
120.6151.6178.5205.1209.6191.7203.3165.9198.3
167.7170.3168.3157.2
168.0192.7210.8222.0
227.7
Domestic industriesi
Total
85.392.080.4
107.6137.4163.4185.4179.0161.9179.7144.1176.9
147.0148.5147.6133.1
147.8172.2187.4200.3
207.9
Financial
15.315.915.011.817.123.131.030.326.920.320.931.5
15.520.422.225.5
29.833.831.930.6
31.7
Nonfinancial
Total 3
70.076.065.495.8
120.3140.3154.4148.6134.9159.4123.2145.4
131.5128.1125.4107.6
118=0138.4155.5169.6
176.1
Manufac-turing
40.745.539.052.669.278.386.985.672.986.759.072.0
60.961.465.548.3
53.768.178.288.1
Whole-sale and
retailtrade
13.413.912.521.322.426.626.927.123.632.8 I27.634.7
30.227.425.227.5
27.833.936.740.2
Profitsbefore tax
100.6125.6136.7132.1166.3194.7229.1252.7234.6227.0174.2207.5
173.2178.8177.3167.5
169.7203.3229.1228.2
240.6
Taxliability
41.649.051.650.663.872.783.287.684.882.859.276.9
60.361.460.854.0
61.576.084.985.3
92.1
Profits after tax
Total
58.976.685.181.5
102.5122.0145.9165.1149.8144.1115.1130.6
112.9117.4116.5113.5
108.2127.2144.1142.9
148.5
Dividends
24.427.029.930.837.440.847.052.758.664.768.773.3
67,767.868.870.4
71.472.073.775.9
78.3
Undistrib-uted
profits
34.549.655.250.765.181.298.9
112.491.279.546.457.3
45.249.547.743.1
36.755.270.467.0
70.2
Inventoryvaluation
adjustment
-6.6-20.0-40.0-11,6- 14.7-16.2-24.0-43.1-42.9-23.6-8.4-9.2
-5.5-8,5-9.0
-10.3
-1,7-10.6-18.3-6.3
r-12.9
1 See p. 4 for profits with inventory valuation and capital consumption adjustments.2 Includes rest of the world, not shown separately-
3 Includes industries not shown separately.
Source: Department of Commerce, Bureau of Economic Analysis.
Digitized for FRASER http://fraser.stlouisfed.org/ Federal Reserve Bank of St. Louis
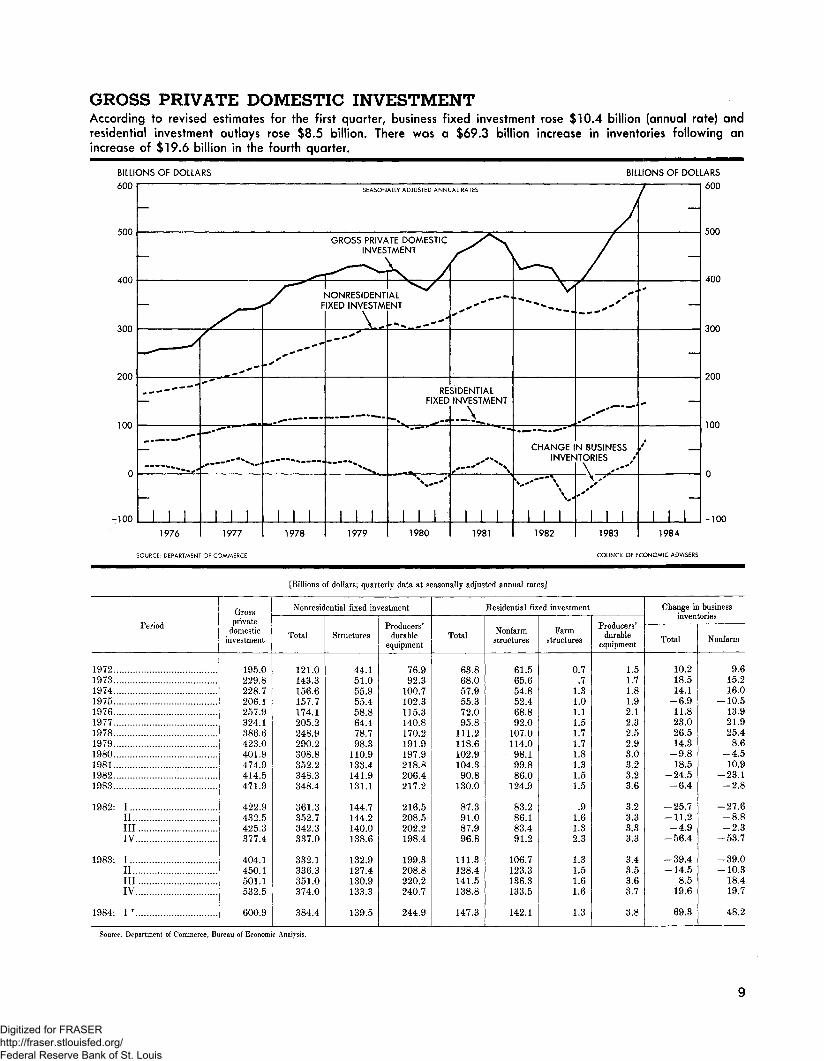
GROSS PRIVATE DOMESTIC INVESTMENTAccording to revised estimates for the first quarter, business fixed investment rose $10.4 billion (annual rate) andresidential investment outlays rose $8.5 billion. There was a $69.3 billion increase in inventories following anincrease of $19.6 billion in the fourth quarter.
BILLIONS OF DOLLARS600
500
400
300
200
100
-100
BILLIONS OF DOLLARS600SEASONALLY ADJUSTED ANNUAL RATES
AGROSS PRIVATE DOMESTIC
_ INVESTMENT
^^-^^ A
'
-1
••'
1 1 I
1976
f
•»****
I I I1977
/^ 1
.*'"~*~*
1 1 1
1978
slONRESIDENTIIXED INVESTMI
\J**
1 1 1
1979
ALENT
^
REFIXED
X--'
I I I1980
f \+**"~+
SIDENTIALINVESTMENT
L__\
,--"'N
i i i1981
^/V
CHANGE 1INVEh
'•""\.l l l
1982
/'
^
N BUSINESSITORIES /\++~s* —
1 1 11983
/
—
—
__
—
/ ___
1 1 1
1984
500
400
300
200
100
-100
SOURCE: DEPARTMENT OF COMMERCE COUNCIL OF ECONOMIC ADVISERS
[Billions of dollars; quarterly data at seasonally adjusted annual rates]
Period
197219731974197519761977197819791980198119821983
1982: IIIIIIIV
1983- IIIIllIV
1984- I r
Grossprivate
domesticinvestment
195.0229.8228.7206.1257.9324.1386.6423.0401.9474.9414.5471.9
422.9432.5425.3377.4
404.1450.1501.1532.5
600.9
Nonresidential fixed investment
Total
121.0143.3156.6157.7174.1205.2248.9290.2308.8352.2348.3348.4
361.3352.7342.3337.0
332.1336.3351.0374.0
384.4
Structures
44.151.055.955.458.864.478.798.3
110.9133.4141.9131.1
144.7144.2140.0138.6
132.9127.4130.9133.3
139.5
Producers'durable
equipment
76.992.3
100.7102.3115.3140.8170.2191.9197.9218.8206.4217.2
216.5208.5202.2198.4
199.3208.8220.2240.7
244.9
Residential fixed investment
Total
63.868.057.955.372.095.8
111.2118.6102.9104.390.8
130.0
87.391.087.996.8
111.3128.4141.5138.8
147.3
Nonfarmstructures
61.565.654.852.468.892.0
107.0114.098.199.886.0
124.9
83.286.183.491.2
106.7123.3136.3133.5
142.1
Farmstructures
0.7.7
1.31.01.11.51.71.71.81.31.51.5
.91.61.32.3
1.31.51.61.6
1.3
Producers'durable
equipment
1.51.71.81.92.12.32.52.93.03.23.23.6
3.23.33.33.3
3.43.53.63.7
3.8
Change in businessinventories
Total
10.218.514.1
-6.911.823.026.514.3
-9.818.5
-24.5-6.4
-25.7-11.2-4.9
-56.4
-39.4-14.5
8.519.6
69.3
Nonfarm
9.615.216.010.513.921.925.48.6
-4.510.9
-23.1-2.8
-27.68.8
-2.3-53.7
39.0-10.3
18.419.7
48.2
Source: Department of Commerce, Bureau of Economic Analysis.
Digitized for FRASER http://fraser.stlouisfed.org/ Federal Reserve Bank of St. Louis
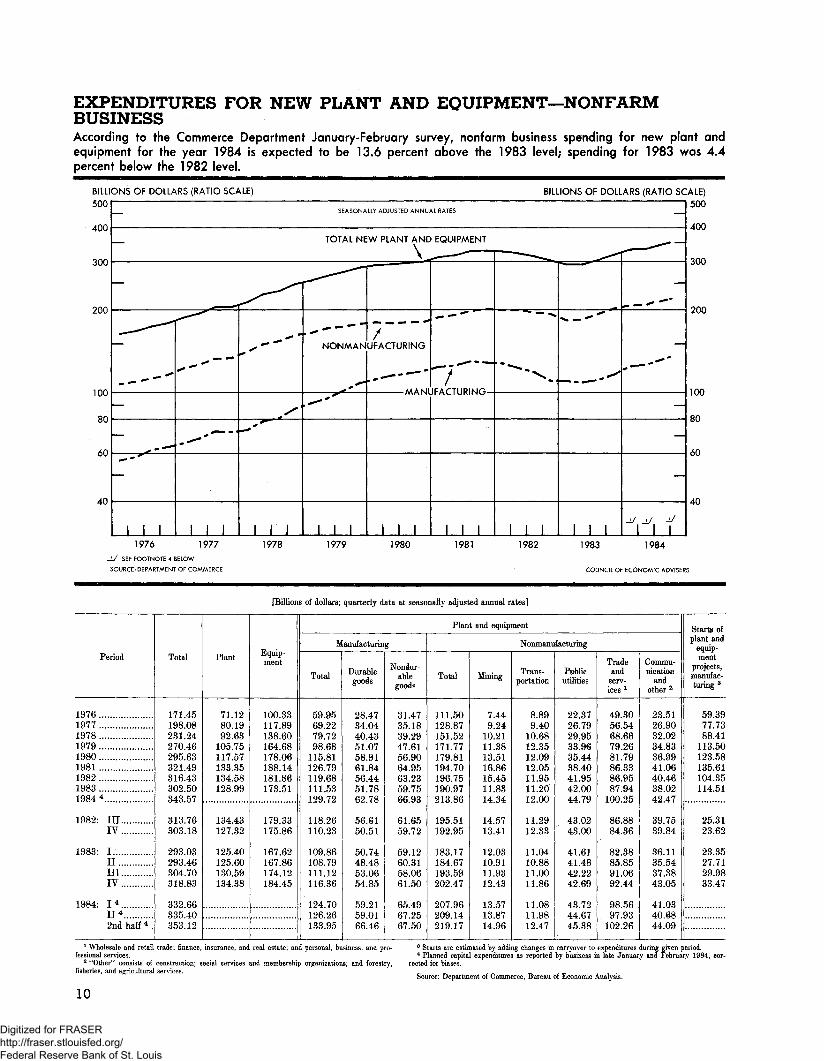
EXPENDITURES FOR NEW PLANT AND EQUIPMENT—NONFARMBUSINESSAccording to the Commerce Department January-February survey, nonfarm business spending for new plant andequipment for the year 1984 is expected to be 13.6 percent above the 1983 level; spending for 1983 was 4.4percent below the 1982 level.
BILLIONS OF DOLLARS (RATIO SCALE)
500
400
300
200
100
80
60
40
SEASONALLY ADJUSTED ANNUAL RATES
BILLIONS OF DOLLARS (RATIO SCALE)
500
TOTAL NEW PLANT AND EQUIPMENT
I I I
NONMANUFACTURING
1 I I
MANUFACTURING-
I I Vif
400
300
200
TOO
80
60
40
1976 1977
-i/ SEE FOOTNOTE 4 BELOW
SOURCE.-DEPARTMENT OF COMMERCE
1978 1979 1980 1981 1982 1983 1984
COUNCIL OF ECONOMIC ADVISERS
[Billions of dollars; quarterly data at seasonally adjusted annual rates]
Period
19761977197819791980 ....19811982 ....19831984 4...
1982: DI..IV... '..
1983: I.IImIV
1984: I 4
n 4
2nd half 4 .
Total
171.45198.06231.24270.46295.63321.49316.43302.50343 57
313.76303.18
293.03293.46304.70318.83
332.66335.40353.12
Plant
71.1280.1992.63
105.75117.57133.35134.58128.99
134.43127.32
125.40125.60130.59134.38
Equip-ment
100.33117.89138.60164.68178.06188.14181.86173.51
179.33175.86
167.62167.86174.12184.45
Plant and equipment
Manufacturing
Total
59.9569.2279.7298.68
115.81126.79119.68111.53129.72
118.26110.23
109.86108.79111.12116.36
124.70126.26133.95
Durablegoods
28.4734.0440.4351.0758.9161.8456.4451.7862.78
56.6150.51
50.7448.4853.0654.85
59.2159.0166.46
Nondur-able
goods
31.4735.1839.2947.6156.9064.9563.2359.7566.93
61.6559.72
59.1260.3158.0661.50
65.4967.2567.50
Nonmanufaeturing
Total
111.50128.87151.52171.77179.81194.70196.75190.97213.86
195.51192.95
183.17184.67193.59202.47
207.96209.14219.17
Mining
7.449.24
10.2111.3813.5116.8615.4511.8814.34
14.5713.41
12.0310.9111.9312.43
13.5713.8714.96
Trans-portation
8.899.40
10.6812.3512.0912.0511.9511.2012.00
11.2912.33
11.0410.8811.0011.86
11.0811.9812.47
Publicutilities
22.3726.7929.9533.9635.4438.4041.9542.0044.79
43.0243.00
41.6141.4842.2242.69
43.7244.6745.38
Tradeand
serv-ices 1
49.3056.5468.6679.2681.7986.3386.9587.94
100.25
86.8884.36
82.3885.8591.0692.44
98.5697.93
102.26
Commu-nication
andother 2
23.5126.9032.0234.8336.9941.0640.4638.0242.47
39.7539.84
36.1135.5437.3843.05
41.0340.6844.09
Start! ofplant and
equip-ment
projects,manufac-turing 3
59.3977.7388.41
113.50123.58135.61104.35114.51
25.3123.62
23.3527.7129.9833.47
1 Wholesale and retail trade; finance, insurance, and real estate; and personal, business, and pro-fessional services.
2 "Other" consists of construction; social services and membership organizations; and forestry,fisheries, and agricultural services.
10
8 Starts are estimated by adding changes in carryover to expenditures4 Planned capital expenditures as reported by business in late January
rected for biases.
Source: Department of Commerce, Bureau of Economic Analysis.
;iven period,'ebruary 1084, eoi
Digitized for FRASER http://fraser.stlouisfed.org/ Federal Reserve Bank of St. Louis
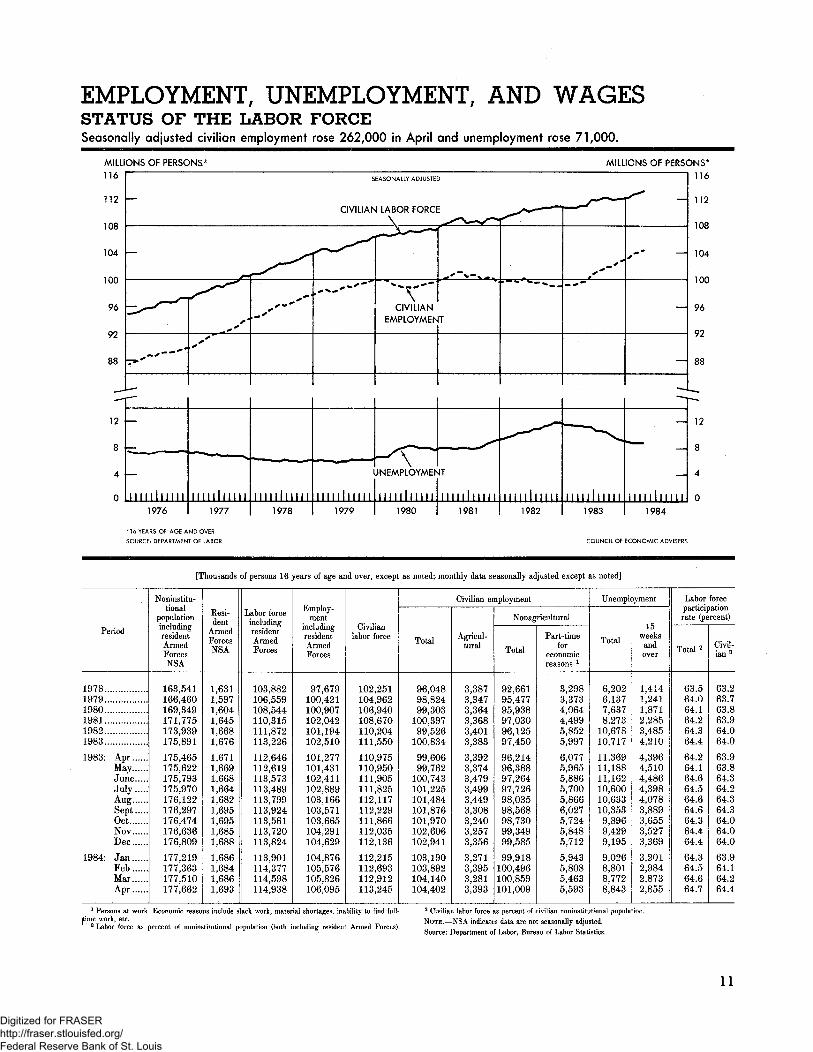
EMPLOYMENT, UNEMPLOYMENT, AND WAGESSTATUS OF THE LABOR FORCESeasonally adjusted civilian employment rose 262,000 in April and unemployment rose 71,000.
MILLIONS OF PERSONS*116
MILLIONS OF PERSONS*
*16 YEARS OF AGE AND OVER
SOURCE: DEPARTMENT OF LABOR
1984
COUNCIL OF ECONOMIC ADVISERS
[Thousands of persons 16 years of age and over, except as noted; monthly data seasonally adjusted except as noted]
Period
197819791980198119821983..
1983: AprMayJuneJulyAugSeptGetNovDee
1984: JanFebMarApr......
Noninstitu-tional
populationincludingresidentArmedForcesNSA
163,541166,460169,349171,775173,939175,891
175,465175,622175,793175,970176,122176,297176,474176,636176,809
177,219177,363177,510177,662
"DpeijLiesi-dent
Arrr«orlrmeuForcesNSA
1,6311,5971,6041,6451,6681,676
1,6711,6691,6681,6641,6821,6951,6951,6851,688
1,6861,6841,6861,693
T V, fjjaDor lorceincludingresidentArmedForces
103,882106,559108,544110,315111,872113,226
112,646112,619113,573113,489113,799113,924113,561113,720113,824
113,901114,377114,598114,938
Employ-ment
includingresidentArmedForces
97,679100,421100,907102,042101,194102,510
101,277101,431102,411102,889103,166103,571103,665104,291104,629
104,876105,576105,826106,095
Civilianlabor force
102,251104,962106,940108,670110,204111,550
110,975110,950111,905111,825112,117112,229111,866112,035112,136
112,215112,693112,912113,245
_Civilian employment
Total
96,04898,82499,303
100,39799,526
100,834
99,60699,762
100,743101,225101,484101,876101,970102,606102,941
103,190103,892104,140104,402
Agricul-tural
3,3873,3473,3643,3683,4013,383
3,3923,3743,4793,4993,4493,3083,2403,2573,356
3,2713,3953,2813,393
Nonagricultural
Total
92,66195,47795,93897,03096,12597,450
96,21496,38897,26497,72698,03598,56898,73099,34999,585
99,918100,496100,859101,009
Part-timefor
economicreasons *
3,2983,3734,0644,4995,8525,997
6,0775,9655,8865,7005,8666,0275,7245,8485,712
5,9435,8085,4635,593
Unemployment
Total
6,2026,1377,6378,273
10,67810,717
11,36911,18811,16210,60010,63310,3539,8969,4299,195
9,0268,8018,7728,843
15weeks
andover
1,4141,2411,8712,2853,4854,210
4,3964,5104,4864,3984,0783,8893,6553,5273,369
3,2012,9842,8732,855
Labor forceparticipationrate (percent)
Total 2
63.564.064.164.264.364.4
64.264.164.664.564.664.664.364.464.4
64.364.564.664.7
Civil-ian 3
63.263.763.863.964.064.0
63.963.864.364.264.364.364.064.064.0
63.964.164.264.4
1 Persons at work. Economic reasons include slack work, material shortages, inability to find full-time work, etc.
2 Labor force as percent of noninstitutional population (both including resident Armed Forces).
3 Civilian labor force as percent of civilian noninstitutional population.NOTE.—NSA indicates data are not seasonally adjusted.Source: Department of Labor, Bureau of Labor Statistics.
11
Digitized for FRASER http://fraser.stlouisfed.org/ Federal Reserve Bank of St. Louis
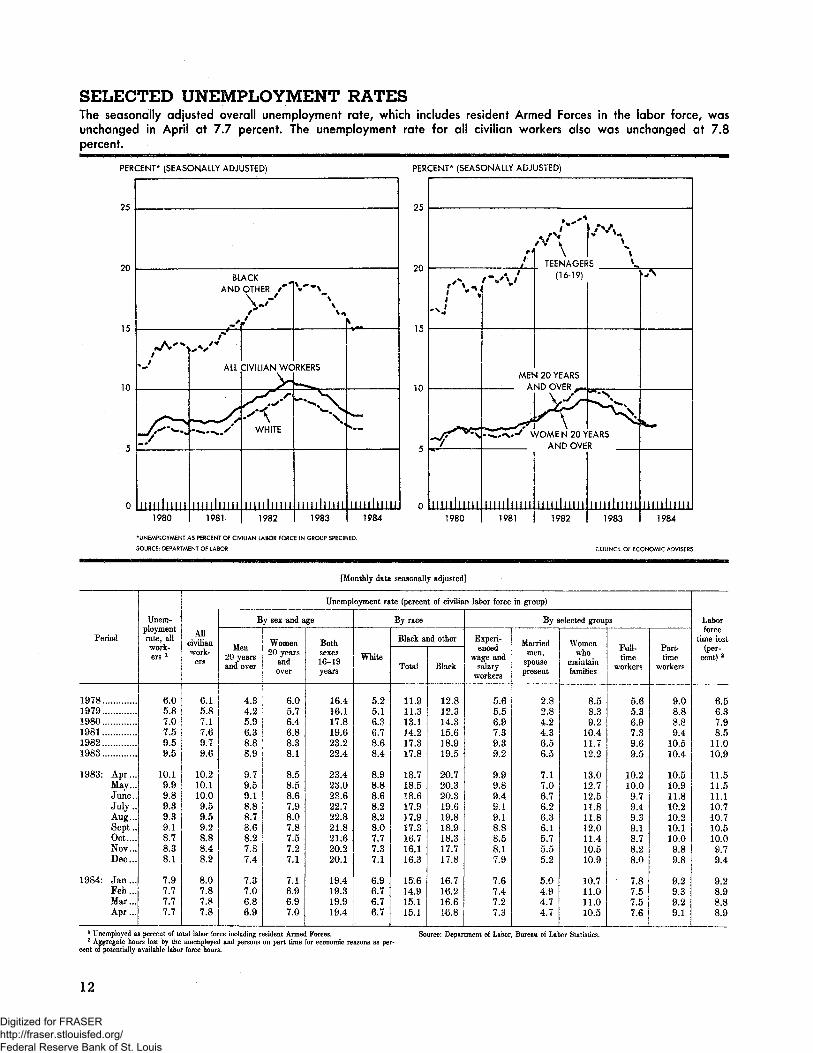
SELECTED UNEMPLOYMENT RATESThe seasonally adjusted overall unemployment rate, which includes resident Armed Forces in the labor force, wasunchanged in April at 7.7 percent. The unemployment rate for all civilian workers also was unchanged at 7.8percent.
PERCENT* (SEASONALLY ADJUSTED) PERCENT* (SEASONALLY ADJUSTED)
«;
o
0
BLACKAND OTHER /*
\ -'
./*"!
/^T*— *
i null nil1980
i*'
ALL
p -~/X
MMl l l l l l l1981
/
CIVILIAN WC
2^*
WHITE
illllliilll
1982
v ^*%
%-%
>RKERS1 — in,,
"%^Z\s
M f i i i i i i i i1983
s««
M M l i l i i l l
25
Of)
1 K
10
0
Arr>A,/•
^
f %^ntj
-N.1
^^^^V2^/
ninliitii1984 1980
\ 1 ^\ j |TEENAGERS \
(16-19)
MEN 20 YEARSAN^^VFi? _.
V^"" UA
IX^ WOMEN 20 YEARSAND OVER
IIHlllllM1981
Hiiiifiiii1982
M l f f l f D H1983
>*\
^^
lUii l l l l l !
1984
*UNEMPLOYMENT AS PERCENT OF CIVILIAN LABOR FORCE IN GROUP SPECIFIED.
SOURCE: DEPARTMENT OF LABOR COUNCIL OF ECONOMIC ADVISERS
[Monthly data, seasonally adjusted]
Period
197819791980 „...198119821988
1983: Apr...May...June..July ..Aug...Sept ..Oct....Nov...Dec...
1984: Jan...Feb ...Mar...Apr ...
Unem-ploymentrate, allwork-ers l
6.05.87.07.59.59.5
10.19.99.89.39.39.18.78.38.1
7.97.77.77,7
Unemployment rate (percent of civilian labor force in group)
Allcivilianwork-
ers
6.15.87.17.69.79.6
10.210.110.09.59.59.28.88.48.2
8.07.87.87.8
By sex and age
Men20 yearsand over
4.34.25.96.38.88.9
9.79.59.18.88.78.68.27.87.4
7.37.06.86.9
Women20 years
andover
6.05.76.46.88.38.1
8.58.58.67.98.07.87.57.27.1
7.16.96.97.0
Bothsexes16-19years
16.416.117.819.623.222.4
23.423.023,622.722.821.821.620.220.1
19.419.319.919.4
By race
White
5.25.16.38.78.68.4
8.9B.88.68.28.28.07.77.37.1
6.96.76.76.7
• •
Black and other
Total
11.911.313.114.217.317.8
18.718.518.617.917.917,316.716.116.3
15.614,915.115.1
Black
12.812.314.315.618.919.5
20.720.320.319.619.818.918.317.717.8
16.716.216.616.8
By selected groups
Experi-enced
wage andsalary
workers
5.65.56.97.39.39.2
9.99.89.49.19.18.88.58.17.9
7.67.47.27.3
Marriedmen,
spousepresent
2.82.84.24.36.56.5
7.17.06.76.26.36.15.75.55.2
5.04.94.74.7
Womenwho
maintainfamilies
8.58.39.2
10.411,712.2
13.012.712.511.811.812.011.410.510.9
10.711.011.010.5
Pull-time
workers
5.65.36.97.39.69.5
10.210.09.79.49.39.18,78.28.0
7.87.57.57.6
Part-time
workers
9.08.88.89.4
10.510.4
10.510.911.810.210.210.110.09.89.8
9.29.39.29.1
Laborforce
time lost(per-
cent) 2
6.56.37.98.5
11.010.9
11.511.511.110.710.710.510.09,79.4
9.28.98.88.9
1 Unemployed as percent of total labor force including resident Armed Forces.2 Aggregate hours lost by the unemployed and persons on part time for economic reasons as per-
cent of potentially available labor force hours.
Source: Department of Labor, Bureau of Labor Statistics.
12
Digitized for FRASER http://fraser.stlouisfed.org/ Federal Reserve Bank of St. Louis
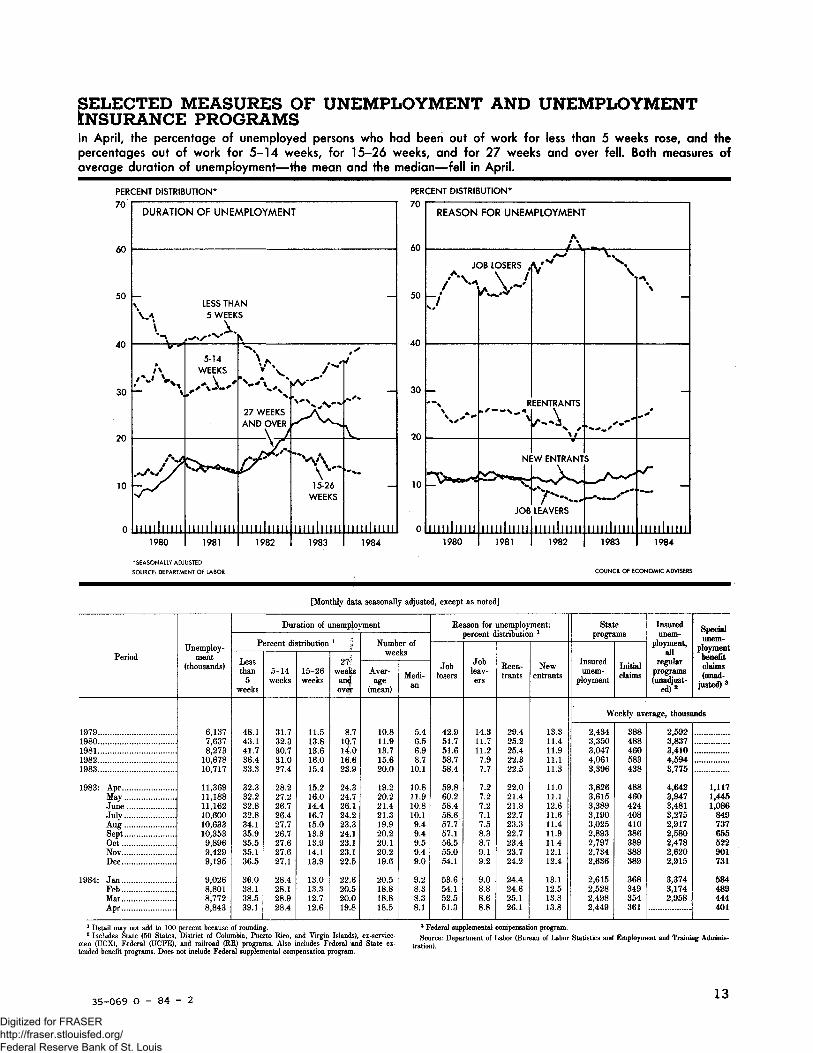
SELECTED MEASURES OF UNEMPLOYMENT AND UNEMPLOYMENTINSURANCE PROGRAMSIn April, the percentage of unemployed persons who had been out of work for less than 5 weeks rose, and thepercentages out of work for 5-14 weeks, for 15-26 weeks, and for 27 weeks and over fell. Both measures ofaverage duration of unemployment—the mean and the median—fell in April.
PERCENT DISTRIBUTION
70
PERCENT DISTRIBUTION*
70
60
20
10 -
— 50 —
40
— 30 —
20
_ 10 —
1980
'SEASONALLY ADJUSTED
SOURCE: DEPARTMENT OF LABOR
1984
REASON FOR UNEMPLOYMENT
A ..JC
_A]
-
•^Xc^
iimliiiii1980
DB LOSERS jV J
F
"" V
Nl
£>-
JOB
1981
J**
EENTRANTS
\f
:W ENTRANT
k_XJLEAVERS
Illllllllll
1982
N
S
^A^
iiiiilinii1983
\
*>*
^r
Illllllllll
1984
COUNCIL OF ECONOMIC ADVISERS
[Monthly data seasonally adjusted, except as noted]
Period
1979 . .1980198119821983
1983: Apr....MayT ^ 1JuneJulyAuirSeptOctNovDec
1984: JanFeb .MarApr
Unemploy-ment
(thousands)
6,1377,6378,273
10,67810,717
11,36911,18811,16210,60010,63310,3539,8969,4299,195
9,0268,8018,7728,843
Duration of unemployment
Percent distribution * 'j
Lessthan
5weeks
48.143.141.736.433.3
32.332.232.832.834.135.935.535.136.5
36.038.138.539.1
5-14weeks
31.732.330.731.027.4
28.227.226.726.427.726.727.627.627.1
28.428.128.928.4
15-26weeks
11.513.813.616.015.4
15.216.014.416.715.013.313.914.113.9
13.013.312.712.6
27?weeks
an<Jover
8.71Q-714.016.623.9
24.324.726.124.223.324.123.123.122.5
22.620.520.019.8
Number ofweeks
Aver-age
(mean)
10.811.913.715.620.0
19.220.221.421.319.920.220.120.219.6
20.518.818.818.5
Medi-an
5.46.56.98.7
10.1
10.811.910.810.19.49.49.59.49.0
9.28.38.38.1
Reason for unemployment:percent distribution *
Joblosers
42.951.751.658.758.4
59.860.258.458.657.757.156.555.054.1
53.654.152.551.3
Jobleav-ers
14.311.711.27.97.7
7.27.27.27.17.58.38.79.19.2
9.08.88.68.8
Reen-trants
29.425.225.422.322.5
22.021.421.822.723.322.723.423.724.2
24.424.625.126.1
Newentrants
13.311.411.911.111.3
11.011.112.611.611.411.911.412.112.4
13.112.513.813.8
Stateprograms
Insuredunem-
ployment
Initialclaims
Insuredunem-
ployment,all
regularprograms(unadjust-
ed)2
Specialunem-
ploymentbenefitclaims(unad-
justed)8
Weekly average, thousands
2,4343,3503,0474,0613,396
3,8263,6153,3893,1903,0252,8932,7972,7342,636
2,6152,5282,4982,449
388488460583438
488460424408410386389388389
368349354361
2,5923,8373,4104,5943,775
4,6423,9473,4813,2752,9172,5802,4782,6202,915
3,3743,1742,958
1,1171,4451,086
849737655522901731
584489444401
1 Detail may not add to 100 percent because of rounding.2 Includes State (50 States, District of Columbia, Puerto Rico, and Virgin Islands), ex-service-
men (UCX), Federal (UCFE), and railroad (BE) programs. Also includes Federal «and State ex-tended benefit programs. Does not include Federal supplemental compensation program.
3 Federal supplemental compensation program.Source: Department of Labor (Bureau of Labor Statistics and Employment and Training Adminis-
tration).
35-069 0 - 8 4 - 2 13
Digitized for FRASER http://fraser.stlouisfed.org/ Federal Reserve Bank of St. Louis
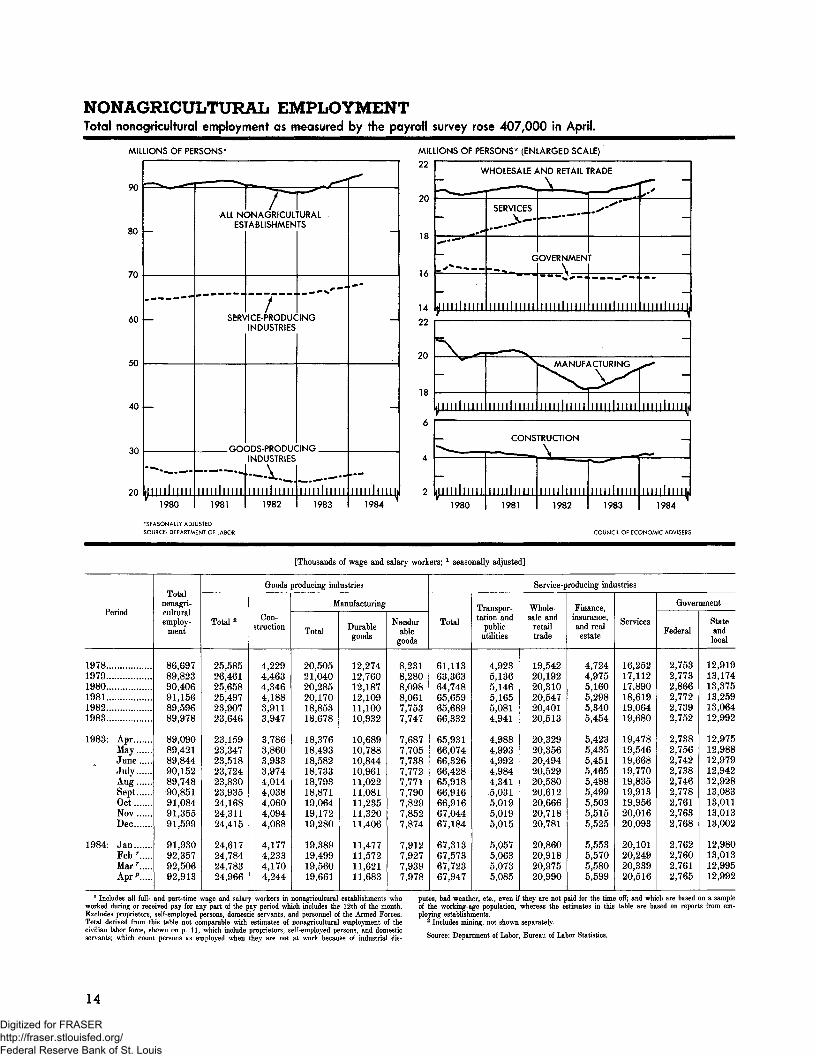
NONAGRICULTURAL EMPLOYMENTTotal nonagricultural employment as measured by the payroll survey rose 407,000 in April.
MILLIONS OF PERSONS*
90
80
70
60
50
40
30
20
-
-
-
L , , , l , ! l , ,M
1980
ALL N<ES
SERV
ao<
Illllllllll1981
n3NAGRICUL"'ABL1SHMEN
1CE-PRODUCINDUSTRIES
DDS-PRODUCINDUSTRIES
\"*-"*••*..Illllllllll
1982
rrURALTS
— «**"*"
:ING
:ING
Illllllllll1983
f**
-
-
-
i l l l l l l lMh1984 "
MILLIONS OF PEtSONS* (ENLARGED SCALE)
*SEASONALLY ADJUSTED
SOURCE: DEPARTMENT OF LABOR
1980 1981 1982 1983 1984
COUNCIL OF ECONOMIC ADVISERS
[Thousands of wage and salary workers; 1 seasonally adjusted]
•p • JJreriod
1978 .19791980198119821983
1983: AprMayJuneJulyAugSeptGetNovDec
1984: JanFeb r
Marr
Apr"
Totalnonagri-eulturalemploy-
ment
86,69789,82390,40691,15689,59689,978
89,09089,42189,84490,15289,74890,85191,08491,35591,599
91,93092,35792,50692,913
Goods-producing industries
Total 2
25,58526*,46125,65825*49723,90723*646
23,15923,34723,51823,72423,83023,93524,16824,31124,415
24,61724,78424,78324,966
Con-struction
4,2294,4634,34644883,9113^947
3,7863,8603,9333,9744,0144,0384,0604,0944,088
4,1774,2334,1704,244
Manufacturing
Total
20,50521,04020,2852047018,85318^678
18,37618,49318,58218,73318,79318,87119,06419,17219,280
19,38919,49919,56019,661
Durablegoods
12,27412J6012,1871240911,10010^932
10,68910,78810,84410,96111,02211,08111,23511,32011,406
11,47711,57211,62111,683
Nondur-able
goods
8,2318*2808,0988*,0617,7537*,747
7,6877,7057,7387,7727,7717,7907,8297,8527,874
7,9127,9277,9397,978
Service-producing industries
Total
61,1136336364,74865*,65965,68966332
65,93166,07466,32666,42865,91866,91666,91667,04467,184
67,31367,57367,72367,947
Transpor-tation and
publicutilities
4,92354365,14654655,0814*,941
4,9884,9934,9924,9844,3415,0315,0195,0195,015
5,0575,0635,0735,085
Whole-sale and
retailtrade
19,54220,19220,31020,*54720,40120*,513
20,32920,35620,49420,52920,58020,61220,66620,71820,781
20,86020,91820,97520,990
Finance,insurance,and realestate
4,7244,9755,1605,2985,3405,454
5,4235,4355,4515,4655,4885,4995,5035,5155,525
5,5535,5705,5805,599
Services
16,25217,11217,89018,61919,06419,680
19,47819,54619,66819,77019,83519,91319,95620,01620,093
20,10120,24920,33920,516
Government
Federal
2,7532,7732,8662,7722,7392,752
2,7382,7562,7422,7382,7462,7782,7612,7632,768
2,7622,7602,7612,765
Stateandlocal
12,91913,17413,37513,25913,06412,992
12,97512,98812,97912,94212,92813,08313,01113,01313,002
12,98013,01312,99512,992
1 Includes all full- and part-time wage and salary workers in nonagrieultural establishments whoworked during or received pay for any part of the pay period which includes the 12th of the month.Excludes proprietors, self-employed persons, domestic servants, and personnel of the Armed Forces.Total derived from this table not comparable with estimates of nonagrieultural employment of thecivilian labor force, shown on p. 11, which include proprietors, self-employed persons, and domesticservants; which count persons as employed when they are not at work because of industrial dis-
putes, bad weather, etc., even if they are not paid for the time off; and which are based on a sampleof the working-age population, whereas the estimates in this table are based on reports from em-ploying establishments,
2 Include! mining, not shown separately.
Source: Department of Labor, Bureau of Labor Statistics.
14
Digitized for FRASER http://fraser.stlouisfed.org/ Federal Reserve Bank of St. Louis
AVERAGE WEEKLY HOURS AND HOURLY EARNINGSPRIVATE NONAGRICULTURAL INDUSTRIES
[For production or nonsupervisory workers; monthly data seasonally adjusted, except as noted]
Period
197519761977197819791980198119821983
1983- AprMayJuneJuly .Auer .. ..SeptGetNovDec
1984- JanFeb...Mar r
Amp
Average weeklyhours
Totalprivate
nonagricul-tural l
36.136.136.035.835.735.335.234.835.0
34.935.135.135.035.035.235.335.235.3
35.535.435.235.6
Manufacturing
Total
39.540.140.340.440.239.739.838.940.1
40.140.040.140.240.340.840.640.640.5
41.041.040.641.2
Overtime
2.63.13.53.63.32.82.82.33.0
2.92.72.93.03.13.33.33.33.4
3.53.63.43.7
Average gross hourlyearnings
Totalprivate
nonagrieul-tural l
$4.534.865.255.696.166.667.257.678.01
7.957.978.008.037.988.088.138.138.16
8.238.238.258.30
Manufactur-ing
$4.835.225.686.176.707,277.998.508.84
8.788.798.828.858.848.878.949.009.01
9.059.099.129.14
Adjusted hourly earnings index — total privatenonagricultural 2
Ind1977 =
Currentdollars
86.792.9
100.0108.2116.8127.3138.9148.3155.1
154.0154.6154.8155.2155.0155.9156.8156.9157.6
158.3158.2158.8159.6
ex,— 100
1977dollars 3
97.699.0
100.0100.597.493.592.693.394.7
94.794.794.894.794.194.394.694.494.7
94.794.694.995.2
Percent change from a yearearlier 4 5
Currentdollars
8.47.27.68.27.99.09.16.84.6
5.24.84.64.33.63.94.13.93.7
3.63.23.53.6
1977 dollars
-0.71.41.0.5
3 1-4.0
1 0.8
1.5
1.21.42.12.11.21.21.41.0.4
0-.6__ i
J
AVERAGE WEEKLY EARNINGSPRIVATE NONAGRICULTURAL INDUSTRIES
[For production or nonsupervisory workers; monthly data seasonally adjusted, except as noted]
Period
1975197619771978197919801981 .19821983
1983: Apr .. .MayJuneJulyAusfSept..OctNov. ..Dec
1984: JanFebMarr...Aprp ..
Average gross weekly earnings
Total privatenonagricultural l
Current dollars
$163.53175.45189.00203.70219.91235.10255.20266.92280.35
277.46279.75280.80281.05279.30284.42286.99286.18288.05
292.17291.34290.40295.48
1977 dollars 3
$184.16186.85189.00189.31183.41172.74170.13167.87171.15
170.64171.42171.85171.48169.58172.06173.09172.19173.21
174.85174.14173.58176.30
Manufacturing Construction Wholesale andretail trade
Current dollars
$190,79209.32228.90249.27269.34288.62318.00330.65354.48
352.08351.60353.68355.77356.25361.90362.96365,40364.91
371.05372.69370.27376.57
$266.08283.73295.65318.69342,99367.78399.26426.45441.86
443.54441.19440.82440.89440.08448.50435.08435.17439.02
458.45457.25442.70456.32
$126.45133.79142.52153.64164.96176.46190.62198.10207.03
203.83205.76207.68207.67207.34207.97211.54210.88214.16
213.49212.82213.44216.06
Percent change froma year earlier,
total private nonagrieultural s
Current dollars
5.77.37.77.88.06.98.54.65.0
4.74.64.94.83.76.06.45,75.8
5.86.85.56.5
1977 dollars
3 11.51.2.2
Q J
-.is-1.5-1.3
2.0
.71.22.42.51.33.23.72.82.5
2.02.91.93.3
1 Also includes other private industry groups shown on p, 14. * Monthly changes based on indexes to two decimal places.2 Adjusted for interindustry employment shifts and for overtime in manufacturing. 5 Based on unadjusted data.3 Current dollar index (or earnings) divided by the consumer price index on a 1977
Revised index for urban wage earners and clerical workers used beginning 1978.Source: Department of Labor, Bureau of Labor Statistics.
15
Digitized for FRASER http://fraser.stlouisfed.org/ Federal Reserve Bank of St. Louis
PRODUCTIVITY AND RELATED DATA, BUSINESS SECTOR
Period
1970.19711972 . .. ... . .19731974 . .. ,
19751976 ,.197719781979
1980198119821983
1982- Inm ......IV
1983- IIIHIIV
1984: Ir........
19701971 . . ,19721973 ... . .1974......
19751976 .197719781979
1980.....198119821983
1982: I...n........mIV
1983- In........mrv.......
1984: F..
Output per hour ofall persons
Businesssector
Nonfarmbusinesssector
Output 1
Businesssector
Nonfarmbusiness
sector
Hours of allpersons 2
Businesssector
Nonfarmbusinesssector
Compensation perhour 3
Businesssector
Nonfarmbusinesssector
Keal compensationper hour 4
Businesssector
Nonfarmbusinesssector
Unit laborcost
Businesssector
Nonfarmbusinesssector
Implicit pricedeflator 5
Businesssector
Nonfarmbusinesssector
1977 = 100; quarterly data seasonally adjusted
86.289.292,494.792.5
94.597.6
100.0100.699.4
98.9101.3101.2103.9
101.1.100.7101.1101.9
102.4103.9104.2105.3
106.3
86.889.793.095.392.9
94.797.8
100.0100.699.1
98.4100.3100.2103.4
100.099.9
100.5100.7
101.6103.4104.0104.7
105.6
78.480.786.191.789.9
88.293.8
100.0105.5107.8
106.5109.8106.7111.1
107.2106.9106.6106.0
107.1110.4112.4114.5
117.8
78.080.385,891,789.8
87,893.7
100.0105.7108.0
106.5109.3106.3111.1
106.5106.7106.5105.4
106.7110.2112.5114.8
117.8
91.090.593.296.897.3
93.396.0
100.0• 104.9
108.5
107.6108.4105.4107.0
106.0106.2105.4104.0
104.6106.2107.9108.8
110.7
89.889.592.396.296.7
92/795.8
100.0105.0109.0
108.2109.0106.0107.4
106.5106.8106.0104.6
105.0106.6108.2109.6
111.6
58.262.066.171.378.0
85.592.9
100.0108.6118.7
131.2143.9155.1163.0
151.6154.0156.5158.6
160,8162.0163.5166.2
168.6
58.762.566.771.778.5
86.093.0
100.0108.6118.4
130.7143.5154.7163.4
151.3153.5156.1158.3
160.8162.6164.1165.9
168.3
90.892.895.797.395.9
96.398.9
100.0100.999.1
96.595.997.499.2
97.197.397.298.1
99.399.199.099.5
99.8
9L593.596.697.896.4
96.899.0
100.0100.998.9
96.195.697.199,4
96.997,097.097.9
99,499.499.3
.. 99.3
99.6
67.569.571.575.384.4
90.595.1
100.0108.0119.5
132.7142.1153.3156.9
149.9152.9154.7155.6
156.9156.0156.9157.9
158.6
67.669.771.775.384.5
90.895.1
100.0108.0119.5
132,8143.0154.4157.9
151.3153.6155.4157.1
158.3157.2157.8158.4
159.4
66.069.071.375.382.4
90.494.7
100.0107.5117.2
128.1140.1147.7153.2
145.5147.5148.5149.4
151.5152.5153.8155.2
156.3
66.369.371.374.081.6
90.094.6
100.0107.1116.5
128.1140.4148.6154.2
146.4148.3149.1150.5
152.4153.4154.7156.1
156.9
Percent change; quarterly data at seasonally adjusted annual
0.83.63.52.6
-2.4
2.23.32.4
.6-1.2
-.52.4
— .12.7
q
-L61.63.2
1.95.91.24.2
4.1
0.33.33.72.4
-2.5
2.03.22.2
.6-1.5
__ 71.9
j3.2
.1g
2.31.2
3.57.12.32.7
3.5
-0.83.06.66.6
-2.0
-2.06.46.65.52.3
-1.33.1
-2.84.2
-6.3-1.0-1.1-2.3
4.212.77.87.6
11.8
-1.02,96.96.8
-2.0
-2.26.76.75.72.2
-1.42.7
-2.84.5
-6.2.8
-.6-4.1
4.913.78.98.1
11,1
-1.6g
3.03.9.4
-4.13.04.14.93.5
-.8.7
-2.71.4
-6.0.6
-2.7-5.3
2.36.56.53.3
7.3
1 3-.43.14.3.5
-4.13.44.45.03.7
-.7.7
-2.71.3
-6.31.1
-2.8-5.2
1.36.26.45.2
7.3
7.36.66.58.09.4
9.68.67.78.69.4
10.59.77.75.1
9.46.46.75.6
5,23.53.66.9
5.9
7.06.66.77.69.4
9.68.17.58.69.0
10.49.87.85.6
10.05.97.15.6
6.64.43.84.3
6,0
1.32.23.11.6
-1.4
.52.61.2.9
-1.7
-2.6-.61.51.9
5.5.9
— 54.0
4.9-.8-.62.3
.9
1.02.23.31.3
-1.4
.42.21.0.9
-2.0
-2.8-.61.62.3
6.0.4
-.14.0
6.3.0
-.3-.1
1.0
6.4^2.92.95.3
12.1
7.35.15.18.0
10.7
11.17.17.92.4
9.88.15.02.3
3.32 22.32.5 -
1.7
6.63.12.85.0
12.2
7.54.85.28.0
10.7
11.17.77.92.3
9.96.24.74.4
3.0-2.6
1.51.6
2.4
4.54.43.45.59.5
9.84.75.67.59.0
9.29.45.43.7
3.45.52.72.6
5.52.83 33^7
3.0
4.84.53.03.8
10.2
10.35.15.77.18.8
10.09.65.83.8
3.75.42.23.7
5.32.73.33.7
2.1
1 Output refers to gross domestic product originating in the sector in 1972 dollars.8 Haurs of all persons engaged in the sector, including hours of proprietors and unpaid family
workers. Estimates based primarily on establishment data.3 Wages and salaries of employees plus employers' contributions for social insurance and private
benefit plans. Also includes an estimate of wages, salaries, and supplemental payments for the self-employed.
* Hourly compensation divided by the consumer price index for all urban consumers.
5 Current dollar gross domestic product divided by constant dollar gross domestic product.
NOTE.—Data relate to all persons engaged in the sector.Percent changes are from preceding period and are based on original data; they therefore may
differ slightly from percent changes based on indexes shown here.
Source: Department of Labor, Bureau of Labor Statistics.
16
Digitized for FRASER http://fraser.stlouisfed.org/ Federal Reserve Bank of St. Louis
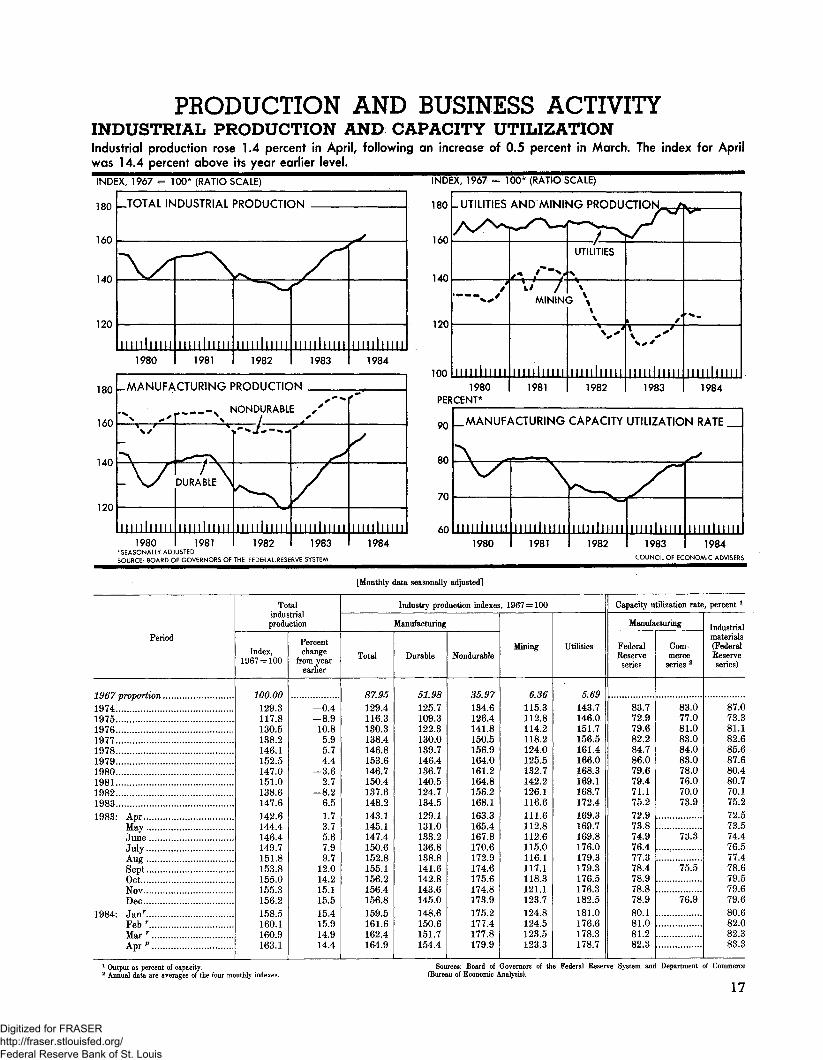
PRODUCTION AND BUSINESS ACTIVITYINDUSTRIAL PRODUCTION AND CAPACITY UTILIZATIONIndustrial production rose 1.4 percent in April, following an increase of 0.5 percent in March. The index for April
was 14.4 percent above its year earlier level.
INDEX, 1967 = TOO* (RATIO SCALE) INDEX, 1967 = 100* (RATIO SCALE)
180
160
140
120
-.TOTAL INDUSTRIAL PRODUCTION
II III)
1980
II III
1981 1982 1983 1984
180
160
140
120
-MANUFACTURING PRODUCTIC
p% -% NONDURABLI
w
-V/JIllllllllll
1980
DURABLE N
Illllllllll
1981
~^Illllllllll
1982
)N
^/
Illllllllll
1983
'
Illllllllll
1984
A-A
UTILITIES
180 -UTILITIES AND MINING PRODUCTIO
160
140
120
1001980
PERCENT*
MINING
1981 1982
I /
1983 1984
90
80
70
60
^MANUFACTURING CAPACITY UTILIZATION RATE_
•SEASONALLY ADJUSTEDSOURCE: BOARD OF GOVERNORS OF THE FEDERAL.RESERVE SYSTEM
1980 1981 1982 1983 1984COUNCIL OF ECONOMIC ADVISERS
[Monthly data seasonally adjusted]
Period
1967 "provoTtiofi1974 ..19751976197719781979198019811982 ..19831983' Apr
MayJuneJulyAufiT
SeptOctNovDec
1984" Janr
Feb r
Mar r
Apr p
Totalindustrialproduction
Index,1967 = 100
100.00
129.3117.8130.5138.2146.1152.5147.0151.0138.6147.6142.6144.4146.4149.7151.8153.8155.0155.3156.2158.5160.1160.9163.1
Percentchange
from yearearlier
-0.48.9
10.85.95.74.4
-3.62.7
-8.26.51.73.75.67.99.7
12.014.215.115.515.415.914.914.4
Industry production indexes, 1967 = 100
Manufacturing
Total
87.95129.4116.3130.3138.4146.8153.6146.7150.4137.6148.2143.1145.1147.4150.6152.8155.1156.2156.4156.8159.5161.6162.4164.9
Durable
51.98125.7109.3122.3130.0139.7146.4136.7140.5124.7134.5129.1131.0133.2136.8138.8141.6142.8143.6145.0148.6150.6151.7154.4
Nondurable
35.97134.6126.4141.8150.5156.9164.0161.2164.8156.2168.1163.3165.4167.8170.6172.9174.6175.6174.8173.9175.2177.4177.8179.9
Mining
6.36115.3112.8114.2118.2124.0125.5132.7142.2126.1116.6111.6112.8112.6115.0116.1117.1118.3121.1123.7124.8124.5123.5123.3
Utilities
5.69143.7146.0151.7156.5161.4166.0168.3169.1168.7172.4169.3169.7169.8176.0179.3179.3176.5176.3182.5181.0176.6178.3178.7
Capacity utilization rate, percent l
Manufacturing
FederalReserve
series
83.772.979.682.284.786.079.679.471.175.272.973.874.976.477.378.478.978.878.980.181.081.282.3
Com-merce
series 2
83.077.081.083.084.083.078.076.070.073.9
73.3
75.5
76.9
Industrialmaterials(FederalReserveseries)
87.073.381.182.685.687.680.480.770.175.272.573.574.476.577.478.679.579.679.680.682.082.383.3
1 Output as percent of capacity.2 Annual data are averages of the four monthly indexes.
Sources: Board of Governors of the Federal Reserve System and Department of Commerce(Bureau of Economic Analysis).
17
Digitized for FRASER http://fraser.stlouisfed.org/ Federal Reserve Bank of St. Louis
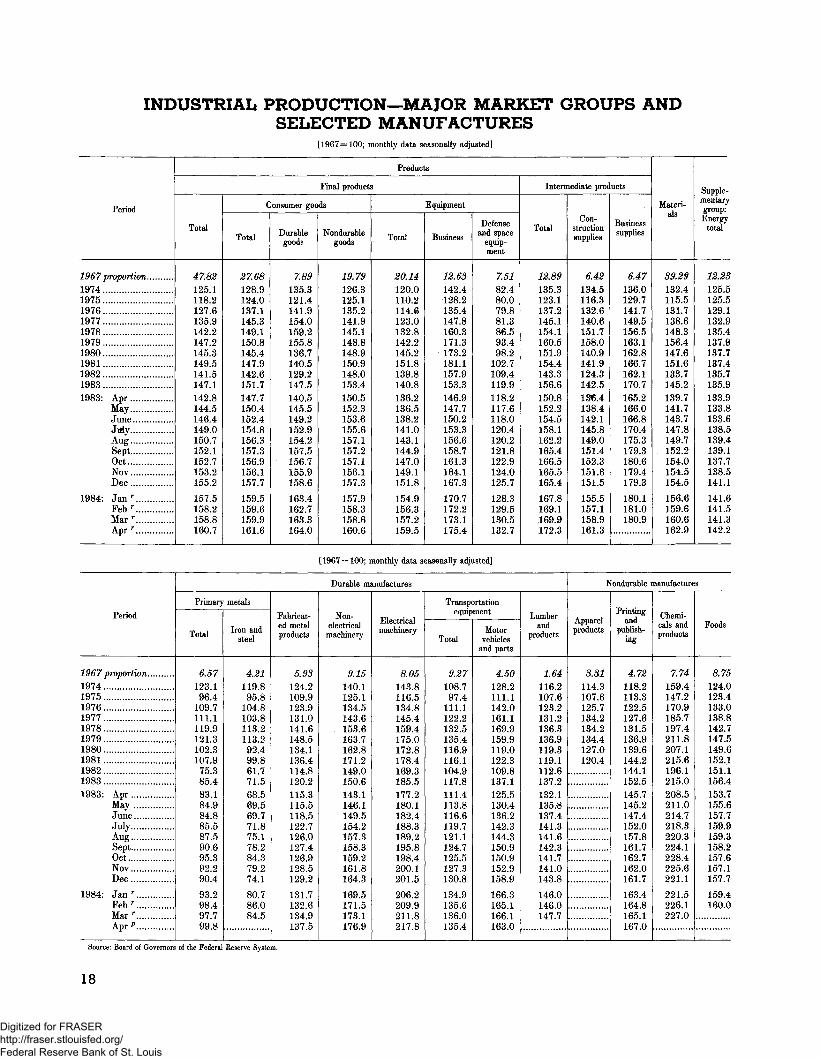
INDUSTRIAL PRODUCTION—MAJOR MARKET GROUPS ANDSELECTED MANUFACTURES
[1967 = 100; monthly data seasonally adjusted]
Period
1967 proportion1974 .1975197619771978197919801981... .1982.....19831983: Apr. ..
MayJuneJdyAugSeptOctNovDec
1984: Janr
Feb r
Mar r
Apr r .
Products
Final products
Total
47.82125.1118.2127.6135.9142.2147.2145.3149.5141.5147.1142.8144.5146.4149.0150.7152.1152.7153.2155.2
157.5158.2158.8160.7
Consumer goods
Total
27. 68128.9124.0137.1145.3149.1150.8145.4147.9142.6151.7147.7150.4152.4154.8156.3157.3156.9156.1157.7
159.5159.6159.9161.6
Durablegoods
7.89135.3121.4141.9154.0159.2155.8136.7140.5129.2147.5140.5145.5149.2152.9154.2157.5156.7155.9158.6
163.4162.7163.3164.0
Nondurablegoods
19.79126.3125.1135.2141.9145.1148.8148.9150.9148.0153.4150.5152.3153.6155.6157.1157.2157.1156.1157.3
157.9158.3158.6160.6
Equipment
Total
20.14120.0110.2114.6123.0132.8142.2145.2151.8139.8140.8136.2136.5138.2141.0143.1144.9147.0149.1151.8
154.9156.3157.2159.5
Business
12.63142.4128.2135.4147.8160.3171.3173.2181.1157.9153.3146.9147.7150.2153.3156.6158.7161.3164.1167.3
170.7172.2173.1175.4
Defenseand space
equip-ment
7.5182.480.079.881.386.593.498.2
102.7109.4119.9118.2117.6118.0120.4120.2121.8122.9124.0125.7
128.3129.5130.5132.7
Intermediate products
Total
12.89135.3123.1137.2145.1154.1160.5151.9154.4143.3156.6150.8152.2154.5158.1162.2165.4166.5165.5165.4
167.8169.1169.9172.3
Con-structionsupplies
6.42134.5116.3132.6140.6151.7158.0140.9141.9124.3142.5136.4138.4142.1145.8149.0151.4152.3151.6151.5
155.5157.1158.9161.3
Businesssupplies
6.47136.0129.7141.7149.5156.5163.1162.8166.7162.1170.7165.2166.0166.8170.4175.3179.3180.6179.4179.3
180.1181.0180.9
Materi-als
39.29132.4115.5131.7138.6148.3156.4147.6151.6133.7145.2139.7141.7143.7147.8149.7152.2154.0154.5154.5
156.6159.6160.6162.9
Supple-mentarygroup:Energy
total
12.23125.5125.5129.1132.9135.4137.9137.7137.4135.7135.9133.9133.8133.6138.5139.4139.1137.7138.5141.1
141.6141.5141.3142.2
[1967 = 100; monthly data seasonally adjusted]
Period
1967 proportion..19741975197619771978197919801981 ...19821983... .1983: Apr
MayT J
JuneJulyAufiT
SeptOctNovDec.. .
1984: Jan r
Febr
Mar r
Aprp
Durable manufactures
Primary metals
Total
6.57123.196.4
109.7111.1119.9121.3102.3107.975.385.483.184.984.885.587.590.695.392.290.4
93.298.497.799.8
Iron andsteel
4.21119.895.8
104.8103.8113.2113.292.499.861.771.568.569.569.771.875.178.284.379.274.1
80.786.084.5
Fabricat-ed metalproducts
5.93124.2109.9123.9131.0141.6148.5134.1136.4114.8120.2115.3115.5118.5122.7126.0127.4126.9128.5129.2
131.7132.6134.9137.5
Non-electrical
machinery
9.15140.1125.1134.5143.6153.6163.7162.8171.2149.0150.6143.1146.1149.5154.2157.3158.3159.2161.8164.3
169.5171.5173.1176.9
Electricalmachinery
8.05143.8116.5134.8145.4159.4175.0172.8178.4169.3185.5177.2180.1182.4188.3189.2195.8198.4200.1201.5
206.2209.9211.8217.8
Transportationequipment
Total
9.27108.797.4
111.1122.2132.5135.4116.9116.1104.9117.8111.4113.8116.6119.7121.1124.7125.5127.3130.8
134.9135.6136.0135.4
Motorvehicles
and parts
4.50128.2111.1142.0161.1169.9159.9119.0122.3109.8137.1125.5130.4136.2142.3144.3150.9150.9152.9158.9
166.3165.1166.1163.0
Lumberand
products
1.64116.2107.6123.2131.2136.3136.9119.3119.1112.6137.2132.1135.8137.4141.3141.6142.3141.7141.0143.8
146.0146.0147.7
Nondurable manufactures
Apparelproducts
3.31114.3107.6125.7134.2134.2134.4127.0120.4
Printingand
publish-ing
4.72118.2113.3122.5127.6131.5136.9139.6144.2144.1152.5145.7145.2147.4152.0157.8161.7162.7162.0161.7
163.4164.8165.1167 0
Chemi-cals andproducts
7.74159.4147.2170.9185.7197.4211.8207.1215.6196.1215.0208.5211.0214.7218.3220.3224.1228.4225.6221.1
221.5226.1227.0
Foods
8.75124.0123.4133.0138.8142.7147.5149.6152.1151.1156.4153.7155.6157.7159.9159.3158.2157.6157.1157.7
159.4160.0
Source: Board of Governors of the Federal Reserve System.
18
Digitized for FRASER http://fraser.stlouisfed.org/ Federal Reserve Bank of St. Louis
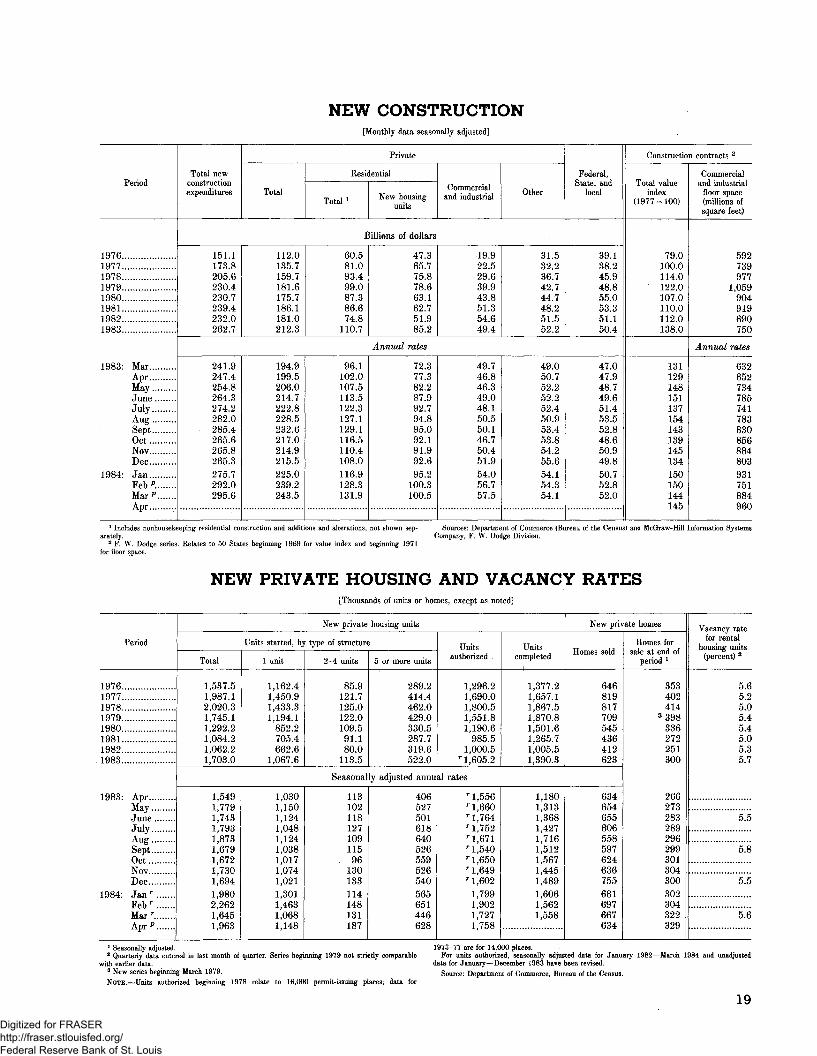
NEW CONSTRUCTION[Monthly data seasonally adjusted]
Period
19761977197819791980198119821983
1983: MarAprMayJuneJulyAllfTSeptOctNovBee
1984- JanFeb*Mar"Apr
Total newconstructionexpenditures
Private
Total
Residential
Total l New housingunits
Commercialand industrial Other
Federal,State, and
local
Billions of dollars
151.1173.8205.6230.4230.7239.4232.0262.7
112.0135.7159.7181.6175.7186.1181.0212.3
60.581.093.499.087.386.674.8
110.7
47.365.775.878.663.162.751.985.2
19.922.529.639.943.851.354.649.4
31.532.236.742.744.748.251.552.2
39.138.245.948.855.053.351.150.4
Annual rates
241.9247.4254.8264.3274.2282.0285.4265.6265.8265.3275.7292.0295.6
194.9199.5206.0214.7222.8228.5232.6217.0214.9215.5225.0239.2243.5
96.1102.0107.5113.5122.3127.1129.1116.5110.4108.0116.9128.3131.9
72.377.382.287.992.794.895.092.191.992.695.2
100.3100.5
49.746.846.349.048.150.550.146.750.451.954.056.757.5
49.050.752.252.252.450.953.453.854.255.654.154.354.1
47.047.948.749.651.453.552.848.650.949.850.752.852.0
Construction contracts 2
Total valueindex
(1977 = 100)
79.0100.0114.0122.0107.0110.0112.0138.0
131129148151137154143139145134150150144145
Commercialand industrial
floor space(millions ofsquare feet)
592739977
1,059904919690750
Annual rates
632652734785741783830856884803931751884960
1 Includes nonhousekeeping residential construction and additions and alterations, not shown sep-arately.
2 F. W. Dodge series. Eelates to 50 States beginning 1969 for value index and beginning 1971for floor space.
Sources: Department of Commerce (Bureau of the Census) and McGraw-Hill Information SystemsCompany, F. W. Dodge Division.
NEW PRIVATE HOUSING AND VACANCY RATES[Thousands of units or homes, except as noted]
Period
19761977197819791980198119821983
1983- Apr .MayJuneJulyAugSeptOctNovDec
1984: Jan T
Febr
Mar r.Apr"
New private housing units
Units started, by type of structure
Total
1,537.51,987.12,020.31,745.11,292.21,084.21,062.21,703.0
1 unit
1,162.41,450.91,433.31,194.1
852.2705.4662.6
1,067.6
2-4 units
85.9121.7125.0122.0109.591.180.0
113.5
5 or more units
289.2414.4462.0429.0330.5287.7319.6522.0
Unitsauthorized
1,296.21,690.01,800.51,551.81,190.6
985.51,000.5
r 1,605.2
Unitscompleted
1,377.21,657.11,867.51,870.81,501.61,265.71,005.51,390.3
New private homes
Homes sold
646819817709545436412623
Seasonally adjusted annual rates
1,5491,7791,7431,7931,8731,6791,6721,7301,6941,9802,2621,6451,963
1,0301,1501,1241,0481,1241,0381,0171,0741,0211,3011,4631,0681,148
11310211812710911596
130133114148131187
406527501618640526559526540565651446628
r 1,556r 1,660r 1,764r 1,752r 1,671r 1,540T 1,650r 1,649r 1,602
1,7991,9021,7271,758
1,1801,3131,3681,4271,7161,5121,5671,4451,4891,6061,5621,558
634654655606558597624636755681697667634
Homes forsafe at end of
period l
353402414
3 398336272251300
266273283289296299301304300302304322329
Vacancy ratefor rental
housing units(percent) 2
5.65.25.05.45.45.05.35.7
5.5
5.8
5.5
5.6
1 Seasonally adjusted.2 Quarterly data entered in last month of quarter. Series beginning 1979 not strictly comparable
with earlier data.3 New series beginning March 1979.NOTE.—Units authorized beginning 1978 relate to 16,000 permit-issuing places; data for
1973-77 are for 14,000 places.For units authorized, seasonally adjusted data for January 1982—March 1984 and unadjusted
data for January—December 1983 have been revised.Source: Department of Commerce, Bureau of the Census.
19
Digitized for FRASER http://fraser.stlouisfed.org/ Federal Reserve Bank of St. Louis
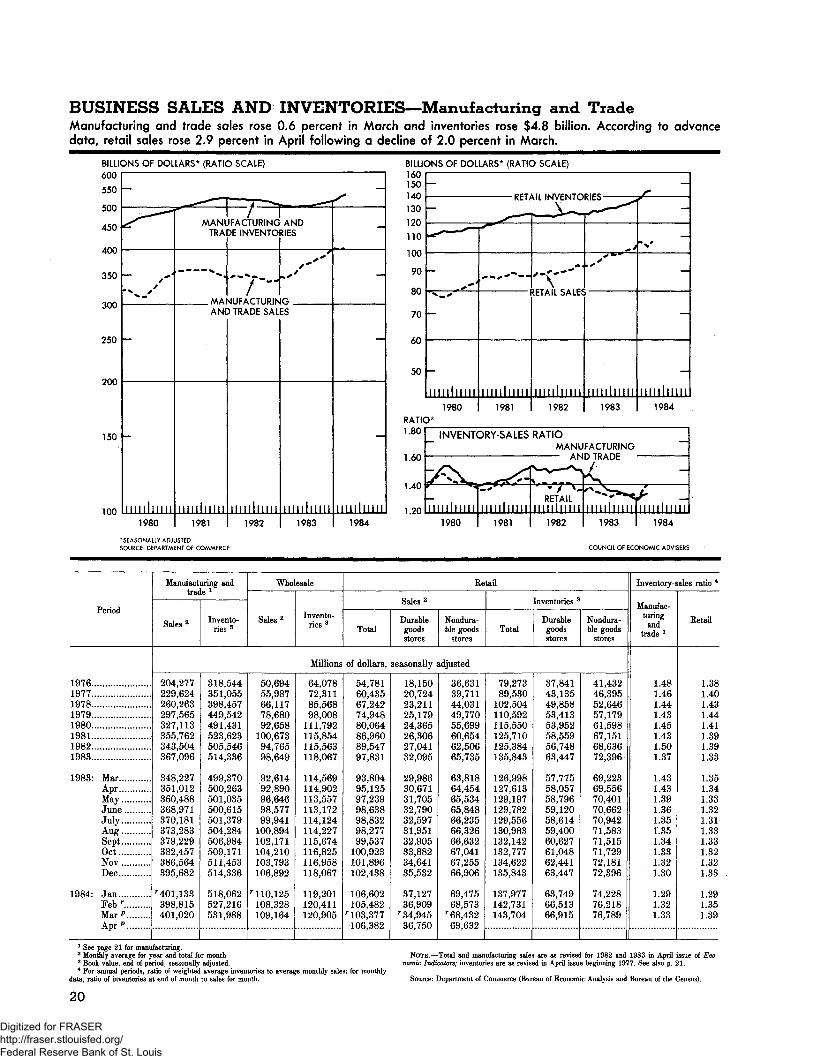
BUSINESS SALES AND INVENTORIES—Manufacturing and TradeManufacturing and trade sales rose 0.6 percent in March and inventories rose $4.8 billion. According to advancedata, retail sales rose 2.9 percent in April following a decline of 2.0 percent in March.
BULK600
550
500
450
400
350
300
250
200
150
100
DNS OF DOLLARS* (RATIO SCALE)
-
-x-^
- ^
illlllllHI1980
SEASONALLY AOJ1OURCE: DEPARTM
MANlTRA
MAIAN!
l l l l l l l l l l l1981
JSTEDNT OF COMMERC
JFACTURING>E INVENTO
"7-HJUFACTURIN) TRADE SAL
l l l l l l l l l l l1982
E
.^1
AND*IES
aES
l l l l l l l l l l l1983
X*
-
-
l l l l l l l l l l l
BULK160150140130
120
110
100
90
80
70
60
50
RATIC1.80
1.60
1.40
1 9ft
DNS OF DOLLARS* (RATIO SCALE)
DCT>
-• ^~
+ *'
-
lllllllllll
1980
y
^^ ""m^"**"
~**~- —
lllllllllll
1981
ML INVENTO
DETAIL SALE?
lllllllllll1982
INVENTORY-SALES RATIOMANU
^Tlt!lf1984 1980 | 1981
\^^^V- — i—*N / ^
RETAILlllllllllll
1982
DICC . . . f
* + '
lllllllllll
1983
FACTURINGD TRADE
-C
"*%'
—
miilimi1984
-
-
' ^y: _lllllllllll illlllllllll
1983 1 1984
COUNCIL OF ECONOMIC ADVISERS
Period
19761977197819791980198119821983
1983: MarAprMayJuneJulyAuirSeptOctNovDec
1984: JanFeb r . ..Marp
Apr p
Manufacturing andtrade1
Sales 2 Invento-ries 3
Wholesale
Sales2 Invento-ries 3
Retail
Sales 2
TotalDurablegoodsstores
Nondura-ble goods
stores
Inventories 3
TotalDurablegoodsstores
Nondura-ble goods
stores
Millions of dollars, seasonally adjusted
204,277229,624260,263297,565327,113355,762343,504367,096
348,227351,012360,488368,971370,181373,283379,229382,457386,564395,682
r401,133398,815401,020
318,544351,055398,457449,542491,431523,623505,546514,336
499,370500,263501,035500,615501,379504,284506,984509,171511,453514,336
518,062527,216531,988
50,69455,98766,11778,68092,658
100,67394,76598,640
92,61492,89096,64698,57799,941
100,894102,171104,210103,793106,892
r 110,125108,328109,164
64,07872,31185,56898,008
111,792115,854115,563118,067
114,569114,902113,557113,172114,124114,227115,674116,825116,958118,067
119,201120,411120,905
54,78160,43567,24274,94880,06486,96089,54797,831
93,80495,12597,23998,63898,83298,27799,537
100,923101,896102,438
106,602105,482
r 103,377106,382
18,15020,72423,21125,17924,36526,30627,04132,095
29,98630,67131,70532,79032,59731,95132,90533,88234,64135,532
37,12736,909
r 34,94536,750
36,63139,71144,03149,77055,69960,65462,50665,735
63,81864,45465,53465,84866,23566,32666,63267,04167,25566,906
69,47568,573
r 68,43269,632
79,27389,530
102,504110,592115,550125,710125,384135,843
126,998127,613129,197129,782129,556130,983132,142132,777134,622135,843
137,977142,731143,704
37,84143,13549,85853,41353,95258,55956,74863,447
57,77558,05758,79659,12058,61459,40060,62761,04862,44163,447
63,74966,51366,915
41,43246,39552,64657,17961,59867,15168,63672,396
69,22369,55670,40170,66270,94271,58371,51571,72972,18172,396
74,22876,21876,789
Inventory-sales ratio 4
Manufac-turing
andtrade l
1.481.461.441.431.451.431.501.37
1.431.431.391.361.351351.341.331.321.30
1.291.321.33
Retail
1.381.401.431.441.411.391.391.33
1.351.341.331.321.311.331.331.321.321.33
1.291.351.39
1 See page 21 for manufacturing.2 Monthly average for year and total for month.3 Book value, end of period, seasonally adjusted.4 For annual periods, ratio of weighted average inventories to average monthly sales; for monthly
data, ratio of inventories at end of month to sales for month.
20
NOTE.—Total and manufacturing sales are as revised for 1982 and 1983 in April issue of Eco-nomic Indicators; inventories are as revised in April issue beginning 1977. See also p. 21.
Source: Department of Commerce (Bureau of Economic Analysis and Bureau of the Census).
Digitized for FRASER http://fraser.stlouisfed.org/ Federal Reserve Bank of St. Louis
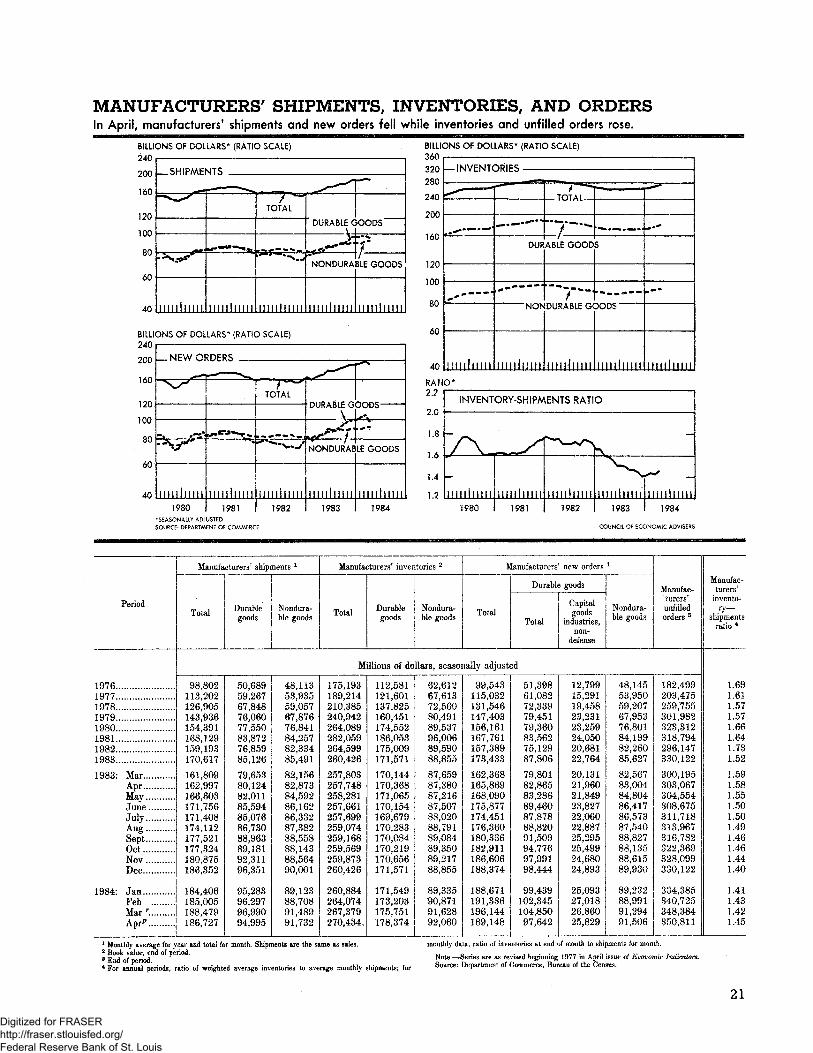
In April, manufacturers' shipments and new orders fell while inventories and unfilled orders rose.
BILLIONS OF DOLLARS* (RATIO SCALE)
240
40 iiiiiliiiii mnlmnliimlmii inniiiin
BILLIONS OF DOLLARS" (RATIO SCALE)
BILLIONS OF DOLLARS* (RATIO SCALE)
•«*u
200
160
120,
100
80
60
40
~^^
f~<t
-V
i i I ! 1 j ! ! ! ! i
1980
U«*-r
iiiiiliiiii1981
TOTAL
"****%»••/*
ilillhlill1982
DURABLE GOODS ' • "
J j;; :
NONDURAl
ii Hill 11 11
1983
LE GOODS
milllllll
40
RATIC2,2
2 Q
1.8
1.6
1.4
1.21984
320280
240
200
160
120
100
80
60
40
— INVENT*
^
^.— » — '
iiillllllli
DRIES
=*—— =
DUB
Nors
l l l j f i t i f f f
r-7^TOTAL
7^ABLE GOOD
7 HDURABLE G(
lilliflliM
••* •
'*•*««««.»««««
5
DODS "" "
MI lMlMl f
... •"**
«••*
.-•
ntiiliiiii
INVENTORY-SHIPMENTS RATIO
Z^imihrni
1980
— x
JUiihilii1981
^-x-^x
nmmm1982
LVW
limlimi' Ul i f lMUl1983 1984
'SEASONALLY ADJUSTED
SOURCE: DEPARTMENT OF COMMERCE COUNCIL OF ECONOMIC ADVISERS
Period
1976197719781979 , .1980198119821983
1983- MarAprMay: . yJuneJuly . .AugrSeptOctNovDec
1984" JanFebMar r.Aprp
Manufacturers' shipments 1
TotalDurablegoods
Nondura-ble goods
Manufacturers^ inventories 2
Total Durablegoods
Nondura-ble goods
Manufacturers' new orders 1
Total
Durable goods
Total
Capitalgoods
industries,non-
defense
Nondura-ble goods
Manufac-turers'unfilledorders 8
Millions of dollars, seasonally adjusted
98,802113,202126,905143,936154,391168,129159,193170,617
161,809162,997166,603171,756171,408174,112177,521177,324180,875186,352
184306185,005188,479186,727
50,68959,26767,84876,06077,55083,87276,85985,126
79,65380,12482,01185,59485,07686,73088,96389,18192,31196,351
95,28396,29796,99094,995
48,11353,93559,05767,87676,84184,25782,33485,491
82,15682,87384,59286,16286,33287,38288,55888,14388,56490,001
89,12388,70891,48991,732
175,193189,214210,385240,942264,089282,059264,599260,426
257,803257,748258,281257,661257,699259,074259,168259,569259,873260,426
260,884264,074267,379270,434,
112,581121,601137,825160,451174,552186,053175,009171,571
170,144170,368171,065170,154169,679170,283170,084170,219170,656171,571
171,549173,203175,751178,374
62,61267,61372,56080,49189,53796,00689,59088,855
87,65987,38087,21687,50788,02088,79189,084-89,35089,21788,855
89,33590,87191,62892,060
99,543115,032131,546147.403156,161167,761157,389173,433
162,368165,869168,090175,877174,451176,360180,336182,911186,606188,374
188,671191,336196,144189,148
51,39861,08272,33979,45179,36083,56275,12987,806
79,80182,86583,28689,46087,87888,82091,50994,77697,99.198,444
99,439102,345104,85097,642
12,79915,29119,45823,23123,25924,05020,68122,764
20,13121,96021,84923,82722,06022,88725,29525,49924,68024,893
25,09327,01826,86025,829
48,14553,95059,20767,95376.80184,19982,26085,627
82,56783,00484,80486,41786,57387,54088,82788,13588,61589,930
89,28288,99191,29491,506
182,499203,475259,755301,982323,312318,794296,147330,122
300,195303,067304,554308,675311,718313,967316,782322,369328,099330,122
334,385340,725348,384350,811
Manufac-turers'
invento-ry-.
shipmentsratio 4
1.691.611.571.571.661.641.731.52
1.591.581.551.501.501.491.461.461.441.40
1.411.431.421.45
1 Monthly average for year and total for month. Shipments are the same as sales.2 Book value, end of period.3 End of period.4 For annual periods, ratio of weighted average inventories to average monthly shipments; lor
monthly data, ratio of inventories at end of month to shipments for month.
Note.—Series are as revised beginning 1977 in April issue of Economic Indicators.Source: Department of Commerce, Bureau of the Census.
21
Digitized for FRASER http://fraser.stlouisfed.org/ Federal Reserve Bank of St. Louis
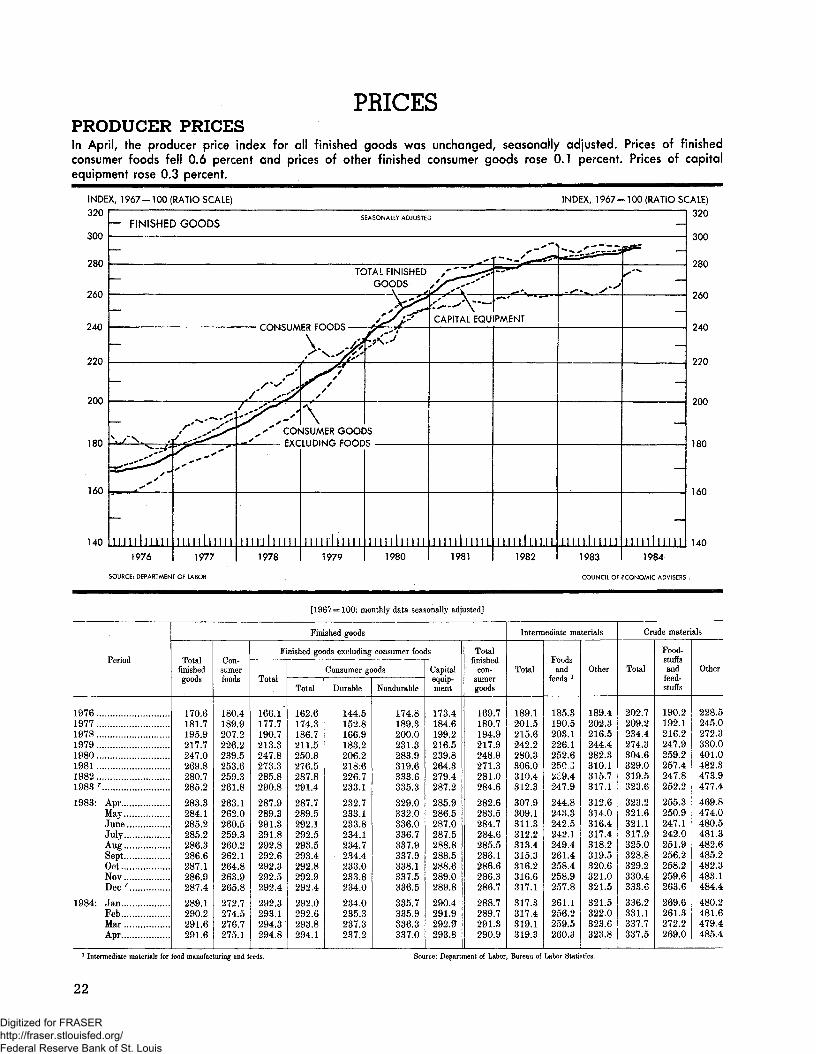
PRICESPRODUCER PRICESIn April, the producer price index for all finished goods was unchanged, seasonally adjusted. Prices of finishedconsumer foods fell 0.6 percent and prices of other finished consumer goods rose 0.1 percent. Prices of capitalequipment rose 0.3 percent.
INDE320
300
280
260
240
220
200
180
160
140
X, 1967=100 (RATIO SCALE) INDEX, 1967=100 (RATIO SC
- FINISHED GOODS SEASONAL* ANUS™
_
TOTAL FINISHED"~~ GOODS
f-piKlcl IAAFD FfV^n^ *^f^ /*
^^^
M II 1 1 1 1 II 1
1976
SOURCE: DEPARTMEN
r'^S*
s^'~'
l l i l i l l iMi1977
r OF LABOR
^'"'cot-r ' £XC
HMl l i lM I
1978
_^^r
S
\sISUMER GOOCLUDING FOOD
l i M i l i l i i l
1979
£&
)Ss
M l i i l i l l l l
1980
//^^
CAPITAL EQU
Illliilllli
1981
— •***"'*
PMENT
IHlhlill
1982
- *. * ' ~"~-"i
Ilillllllli
1983
COUNCIL OF
&*z „
^ _
—
_
—
—
—
i i i i ih i i i i1984
ECONOMIC ADVISERS
:ALE)320
300
280
260
240
220
200
180
160
140
[1967 = 100; monthly data seasonally adjusted]
Period
197619771978 ..19791980198119821983 r
1983: AprMay, y
JuneJuly. yAufiT
SeptGet ,NovDec r.. .......
1984: JanFebMarAor
Finished goods
Totalfinishedgoods
170.6181.7195.9217.7247.0269.8280.7285.2
283.3284.1285.2285.2286.3286.6287.1286.9287.4
289.1290.2291.6291.6
Con-sumerfoods
180.4189.9207.2226.2239.5253.6259.3261.8
263.1262.0260.5259.3260.2262.1264.8263.9265.8
272.7274.5276.7275.1
Finished goods excluding consumer foods
Total
166.1177.7190.7213.3247.8273.3285.8290.8
287.9289.3291.3291.8292.8292.6292.3292.5292.4
292.3293.1294.3294.8
Consumer goods
Total
162.6174.3186.7211.5250.8276.5287.8291.4
287.7289.5292.1292.5293.5293.4292.8292.9292,4
292.0292.6293.8294.1
Durable
144.5152.8166.9183.2206.2218.6226.7233.1
232.7233.1233.8234.1234.7234.4233.0233.8234.0
234.0235.3237.3237.2
Nondurable
174.8189.3200.0231.3283.9319.6333.6335.3
329.0332.0336.0336.7337.9337.9338.1337.5336.5
335.7335.9336.3337.0
Capitalequip-ment
173.4184.6199.2216.5239.8264.3279.4287.2
285.9286.5287.0287.5288.8288.5288.6289.0289.8
290.4291.9292.ST293.8
Totalfinished
con-sumergoods
169.7180.7194.9217.9248.9271.3281.0284.6
282.6283.5284.7284.6285.5286.1286.6286.3286.7
288.7289.7291.3290.9
Intermediate materials
Total
189.1201.5215.6242.2280.3306.0310.4312.3
307.9309.1311.3312.2313.4315.3316.2316.6317.1
317.3317.4319.1319.3
Foodsand
feeds l
185.3190.5203.1226.1252.625032^9.4247.9
244.8243.3242.5242.1249.4261.4258.4258.9257.8
261.1256.2259.5260.3
Other
189.4202.3216,5244.4282.3310.1315.7317.1
312.6314.0316.4317.4318.2319.5320.6321.0321.5
321.5322.0323.6323.8
Crude materials
Total
202.7209.2234.4274.3304.6329.0319.5323.6
323.2321.6321.1317.9325.0328.8329.2330.4333.6
336.2331.1337.7337.5
Food-stuffsand
feed-stuffs
190.2192.1216.2247.9259.2257.4247.8252.2
255.3250.9247.1242.0251.9256.2258.2259.6263.6
269.6261.3272.2269.0
Other
228.5245.0272.3330.0401.0482.3473.9477.4
469.8474.0480.5481.3482.6485.2482.3483.1484.4
480.2481.6479.4485.4
1 Intermediate materials for food manufacturing and feeds. Source: Department of Labor, Bureau of Labor Statistics.
22
Digitized for FRASER http://fraser.stlouisfed.org/ Federal Reserve Bank of St. Louis
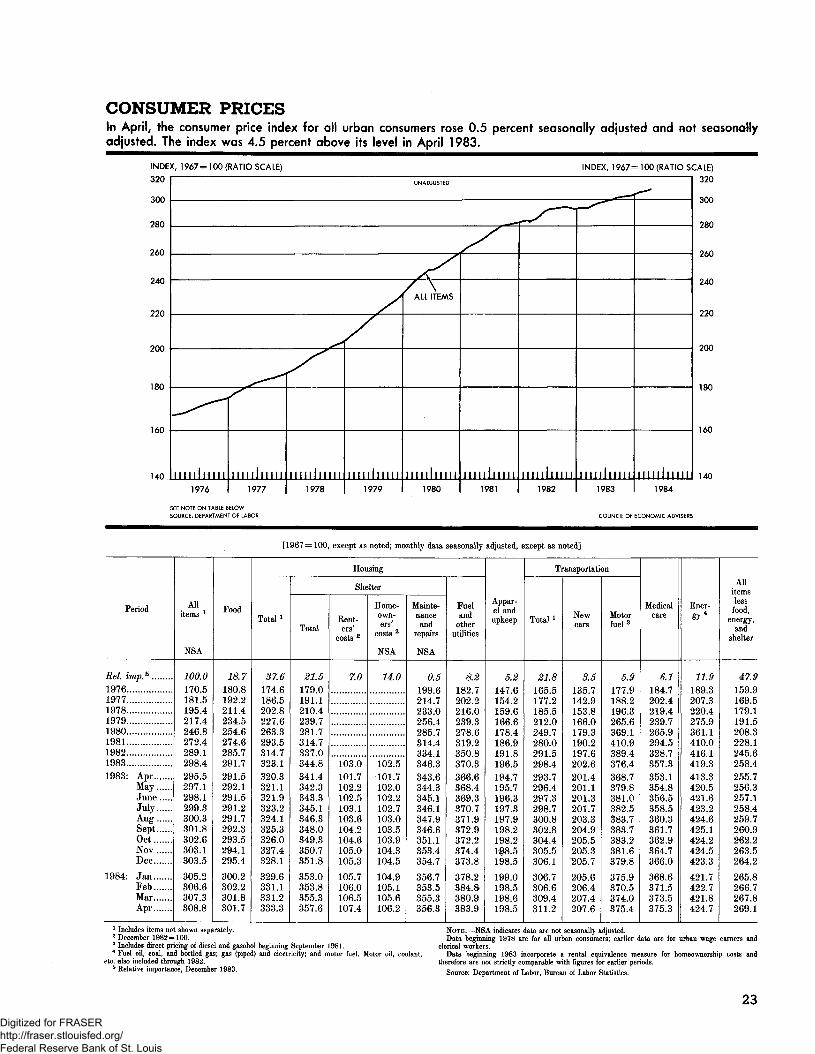
CONSUMER PRICESIn April, the consumer price index for all urban consumers rose 0.5 percent seasonally adjusted and not seasonallyadjusted. The index was 4.5 percent above its level in April 1983.
INDL
320
300
280
260
240
220
9flft
180
160
140
K, 1967= 100 (RATIO SCALE) INDEX, 1967= 100 (RATIO S
UNADJUSTED
^——1
^A
^^^^
1 1 1 1 1 1 1 1 1 1 11976
SEE NOTE ON TABLE BSOURCE: DEPARTMEN
A
1977
ELOW
F OF LABOR
S
Illllllllll
1978
/
Illllllllll
1979
ALL ITEMS
Illllllllll
1980
./
1981
r n
Illllllllll1982
- "
Illllllllll
1983
COUNCIL OF
f*
Illllllllll
1984
ECONOMIC ADVISERS
CALE)320
300
280
260
240
220
200
180
160
140
[1967 = 100, except as noted; monthly data seasonally adjusted, except as noted]
Period
Eel. imp.5
1976197719781979..19801981198219831983: Apr
MayJuneJulyAugSeptGetNovDec
1984: JanFebMarApr
Allitems 1
NSA
100.0170.5181.51954217.42468272.4289 12984295.5297.1298.1299.3300.3301.8302.6303.1303.5
305.2306.6307.3308.8
Food
18.7180.8192.2211 4234.52546274.6285 7291 7291.5292.1291.5291.2291.7292.3293.5294.1295.4
300.2302.2301.8301.7
Housing
Total *
37.6174.61865202 82276263 32935314 7323 1320.3321.1321.9323.2324.1325.3326.0327.4328.1
329.6331.1331.2333.3
Shelter
Total
21.5179.0191 12104239 7281 7314 7337 0344 8341.4342.3343.3345.1346.3348.0349.3350.7351.8
353.0353.8355.3357.6
Eent-ers'
costs 2
7.0
103 0101.7102.2102.5103.1103.6104.2104.6105.0105.3
105.7106.0106.5107.4
Home-own-ers'
costs 2
NSA
14.0
102 5101.7102.0102.2102.7103.0103.5103.9104.3104.5
104.9105.1105.6106.2
Mainte-nanceand
repairs
NSA
0.5199 6214 7233 02564285 7314 4334 1346 3343.6344.3345.1346.1347.9346.6351.1353.4354.7
356.7353.5355.3356.3
Fueland
otherutilities
8.2182 7202 2216 0239 3278 6319 2350 8370 3366.6368.4369.3370.7371.9372.9372.2374.4373.8
378.2384.S380.9383.9
Appar-
upkeep
5.2147 6154 2159 6166 6178 4186 9191 8196 5194.7195.7196.3197.3197.9198.2198.2188.5198.5
199.0198.5198.6198.5
Transportation
Total *
21.8165 5177 2185 5212 0249 72800291 5298 4293.7296.4297.3298.7300.8302.8304.4305.5306.1
306.7306.6309.4311.2
Newcars
3.5135 7142 9153 81660179 3190 2197 6202 6201.4201.1201.3201.7203.3204.9205.5205.3:205.7
205.6206.4207.4207.6
Motorfuel3
5.9177 9188 2196 3265 6369 14109389 4376 4368.7379.8381.0382.5883.7383.7383.2381.6379.8
375.9370.5374.0375.4
Medicalcare
6.1184 72024219 4239 7265 9294 5328 7357 3353.1354.8356.5358.5360.3361.7362.9364.7366.0
368.6371.5373.5375.3
Ener-gy4
11.91893207 32204275 9361 14100416 1419 3413.3420.5421.6423.2424.6425.1424.2424.5423.3
421.7422.7421.8424.7
Allitemsless
foodenergy,
andshelter
47.9159.9169 5179 1191 5208 3228 1245 6258 4255.7256.3257.1258.4259.7260.9262.2263.5264.2
265.8266.7267.8269.1
1 Includes items not shown separately.2 December 1982=100.3 Includes direct pricing of diesel and gasohol beginning September 1981.4 Fuel oil, coal, and bottled gas; gas (piped) and electricity; and motor fuel. Motor oil, coolant,
etc. also included through 1982.5 Relative importance, December 1983.
NOTE.—NSA indicates data are not seasonally adjusted.Data beginning 1978 are for all urban consumers; earlier data are for urban wage earners and
clerical workers.Data beginning 1983 incorporate a rental equivalence measure for homeownership costs and
therefore are not strictly comparable with figures for earlier periods.Source: Department of Labor, Bureau of Labor Statistics.
23
Digitized for FRASER http://fraser.stlouisfed.org/ Federal Reserve Bank of St. Louis
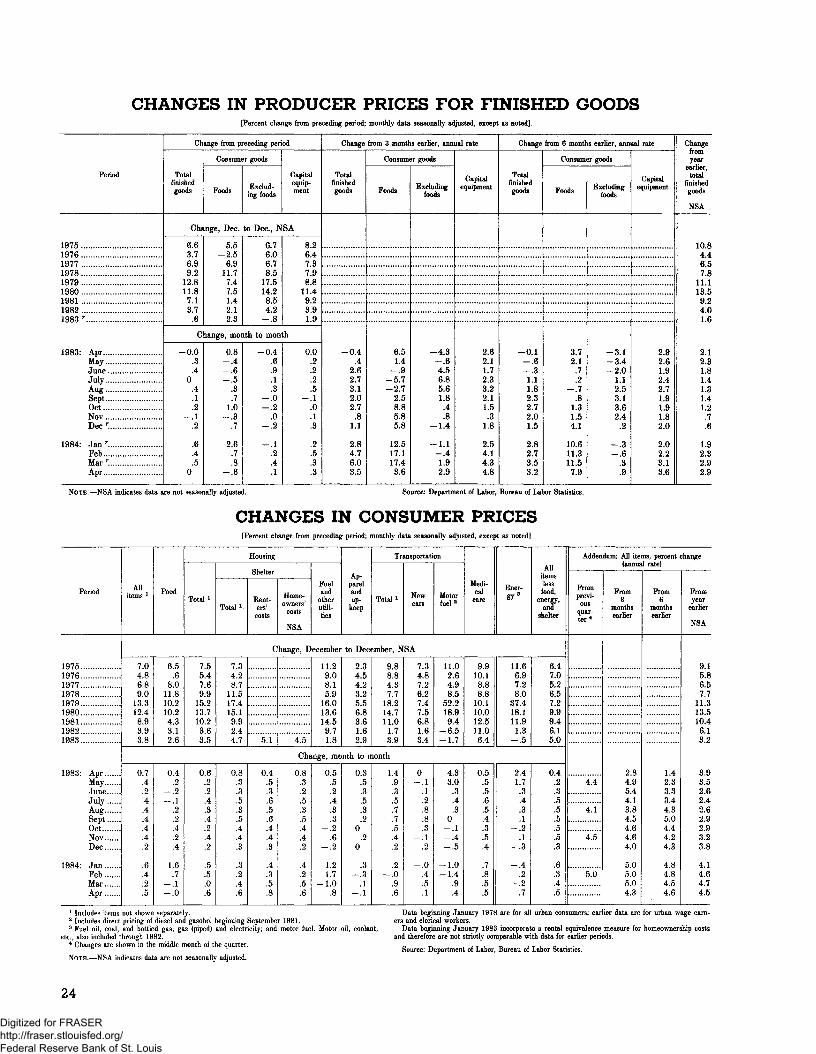
CHANGES IN PRODUCER PRICES FOR FINISHED GOODS[Percent change from preceding period; monthly data seasonally adjusted, except as noted]
Period
197519761977197819791980198119821983 r
1983: AprMavf& yJuneJulyAllfiT
SeptOctNovDec r
1984- Jan r.FebMar r.Apr
Change from preceding period
Totalfinishedgoods
Consumer goods
Foods Exclud-ing foods
Capitalequip-ment
Change, Dec. to Dec., NSA
6.63.76.99.2
12.811.87.13.7.6
5.52.56.9
11.77.47.51.42.12.3
6.76.06.78.5
17.514.28.54.2.8
8.26.47.37.98.8
11.49.23.91.9
Change, month to month
-0.0.3.4
0.4.1.2
-.1.2
.6
.4
.50
0.8— .4-.6
!s.7
1.0-.3
.7
2.6.7.8
-.6
-0.4.6.9.1.3
-.0-.2
.0_.2
.1
.2
.4
.1
0.0.2.2.2.5
-.1.0.1.3
.2
.5
.3
.3
Change from 3 months earlier, annual rate
Totalfinishedgoods
-0.4.4
2.62.73.12.02.7.8
1.1
2.84.76.03.5
Consumer goods
Foods
6.51.4
-.95.7
-2.72.58.85.85.8
12.517.117.43.6
Excludingfoods
-4.36
4.56.85.61.8.4
-.8— 1.4
-1.1-.41.92.9
Capitalequipment
2.62.11.72.33.22.11.5.3
1.8
2.54.14.34.8
Change from 6 months earlier, annual rate
Totalfinishedgoods
-0.1-.6-.31.11.82.32.72.01.5
2.82.73.53.2
Consumer goods
Foods
3.72.1.7.2
_.7.8
1.31.54.1
10.611.311.57.9
Excludingfoods
-3.134
-2.01.12.53.13.62.4
.2
g
-!e.3.9
Capitalequipment
2.92.61.92.42.71.91.91.82.0
2.02.23.13.6
Changefromyear
earlier,total
finishedgoods
NSA
10.84.46.57.8
11.113.59.24.01.6
2.12.31.81.41.31.41.2.7.6
1.92.32.92.9
NOTE.—NSA indicates data are not seasonally adjusted. Source: Department of Labor, Bureau of Labor Statistics.
CHANGES IN CONSUMER PRICES[Percent change from preceding period; monthly data seasonally adjusted, except as noted]
Period
197519761977197819791980198119821983
1983: AprMayJuneJulyAugSeptOctNovDec
1984: JanPebMarApr
Allitems 1 Food
Housing
Total »
Shelter
Total1Rent-ers'costs
Home-owners'
costs
NSA
Fueland
otherutili-ties
Ap-parelandup-
keep
Transportation
Total1 Newcars
Motorfuel2
Medi-cal
careEner-gy3
Allitemslessfood,
energy,
shelter
Change, December to December, NSA
7.04.86 89.0
13 312.4893.93.8
6.5.6
8011.810 210.24 33.12.6
7.55.47 69.9
15 213 7102363.5
7.34.28 7
11.517415.1992.44.7 5.1 4.5
11.29.08.15.9
16.013.614.59.71.8
2.34.54.23.25.56.83.61.62.9
9.88.84.37.7
18.214.711.0
1.73.9
7.34.87.26.27.47.56.81.63.4
11.02.64.98.5
52.218.99.46.5
-1.7
9.910.18.88.8
10.110.012.511.06.4
11.66.97.28.0
37.418.111.91.3
6.47.05.26.57.29.99.46.15.0
Change, month to month
0.7.4.2.4.4.4.4.4.2
.6
.4
.2
.5
0.4.2
-.2i
.2
.2
.4
.2
.4
1.6.7
-.1o
0.6.2.2.4.3.4.2.4.2
.5
.5
.0
.6
0.8.3.3.5.3.5.4.4.3
.3
.2
.4
.6
0.4.5.3.6.5.6.4.4.3
.4
.3
.5
.8
0.8.3.2.5.3.5.4.4.2
.4
.2
.5
.6
0.5.5.2.4.3.3
-.2.6
-.2
1.21.7
-1.0.8
0.3.5.3.5.3.2
0.2
0
.3-.3
.1-.1
1.4.9.3.5.7
• .7.5.4.2
.2_.o
.9
.6
0— .1
.1
.2
.8
.8
.3-.1
.2
-.0.4.5.1
4.33.0.3.4.3
0-.1— .4-.5
-1.0-1.4
.9
.4
0.5.5.5.6.5.4.3.5.4
.7
.8
.5
.5
2.41.7.3.4.3.1o
.1
.3
— .4.2
-.2.7
0.4.2.3.5.5.5.5.5.3
.6
.3
.4
.5
Addendum: All items, percent change(annual rate)
Fromprevi-ous
quar-ter4
4.4
4.1
4.5
5.0
From3
monthsearlier
2.84.95.44.13.84.54.64.64.0
5.05.05.04.3
From6
monthsearlier
1.42.33.33.44.35.04.44.24.3
4.84.84.54.6
Fromyear
earlier
NSA
9.15.86.57.7
11.313.510.46.13.2
3.93.52.62.42.62.92.93.23.8
4.14.64.74.5
1 Includes items not shown separately.2 Includes direct pricing of diesel and gasohol beginning September 1981.3 Fuel oil, coal, and bottled gas; gas (piped) and electricity; and motor fuel. Motor oil, coolant,
etc., also included through 1982.4 Changes are shown in the middle month of the quarter.
NOTE.—NSA indicates data are not seasonally adjusted.
Data beginning January 1978 are for all urban consumers; earlier data are for urban wage earn-ers and clerical workers.
Data beginning January 1983 incorporate a rental equivalence measure for homeownership costsand therefore are not strictly comparable with data for earlier periods.
Source: Department of Labor, Bureau of Labor Statistics.
24
Digitized for FRASER http://fraser.stlouisfed.org/ Federal Reserve Bank of St. Louis
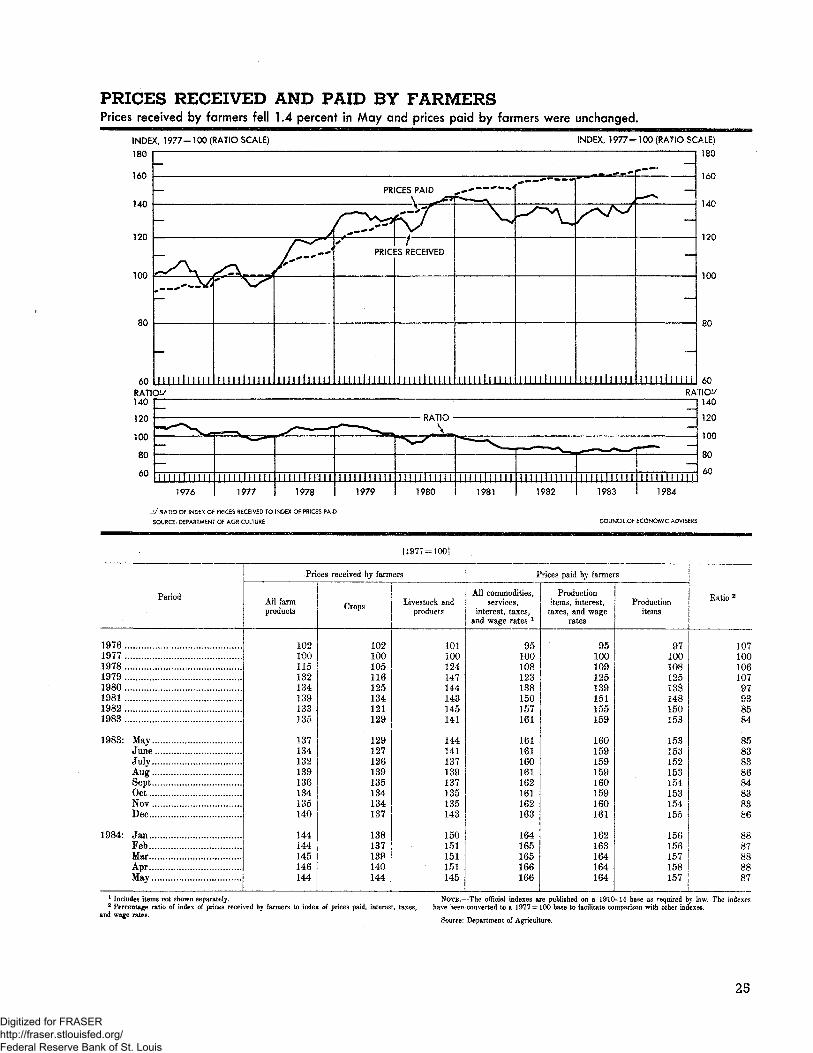
BYPrices received by farmers fell 1.4 percent in May and prices paid by farmers were unchanged.
INDEX, 1977= 100 (RATIO SCALE) INDEX, 1977= TOO (RATIO SCALE)
180
160
140
120
100
80
60
—
— PRICES PAID\ *»l
y
>\ s*......
mi i l i i i i i
* NX'
I ! II I ! 1 1 1 1 1
/^
O fv^PRIC
I l l l l i l l i l l
r:S RECEIVED
1 i ! ! ! ! ! i i ! !
£*•«» — **«*-
V
ILLULlLLU
**
~~v.
1 1 1 1 ill I I I !
/^T^
LJj i 1 1 1 1 i I !
,•»*"•*'*
^^x ~~
— •
__
—
i t inhnn
IBU
160
140
120
100
'80
60RATIO^140
J/RATIO OF INDEX OF PRICES RECEIVED TO INDEX OF PRICES PAID.
SOURCE: DEPARTMENT OF AGRICULTURE
1984
COUNCIL OF ECONOMIC ADVISERS
[1977 = 100]
Period
197619771978 ,1979 ... . . .1980 .,...1981 ...19821983 ...
1983: MavJuneJulyAusSeptOctNovDec
1984: JanFebMarAprMav
Prices received by farmers
All farmproducts
102100115132134189133135
137134132139136134135140
144144145146144
Crops
102100105116125134121129
129127126139135134134137
138137139140144
Livestockproducts
101100124147144143145141
144141137139137135135143
150151151151145
Prices paid by fanners
All commodities,services,
interest, taxes,and wage rates *
95100108123138150157161
161161160161162161162163
164165165166166
ProductionItems, interest,
taxes, and wagerates
95100109125139151155159
160159159159160159160161
162163164164164
Productionitems
97100108125138148150153
153153152153154153154155
156156157158157
j
2
10710010610797938584
8583838684838386
8887888887
1 Includes items not shown separately.2 Percentage ratio of index of prices* received by farmers to index of prices paid, interest, taxes,
and wage rates.
NOTE,—The official indexes are published on a 1910-14 base as required by law. The indexeshave been converted to a 1977 = 100 base to facilitate comparison with other indexes.
Source: Department of Agriculture.
25
Digitized for FRASER http://fraser.stlouisfed.org/ Federal Reserve Bank of St. Louis
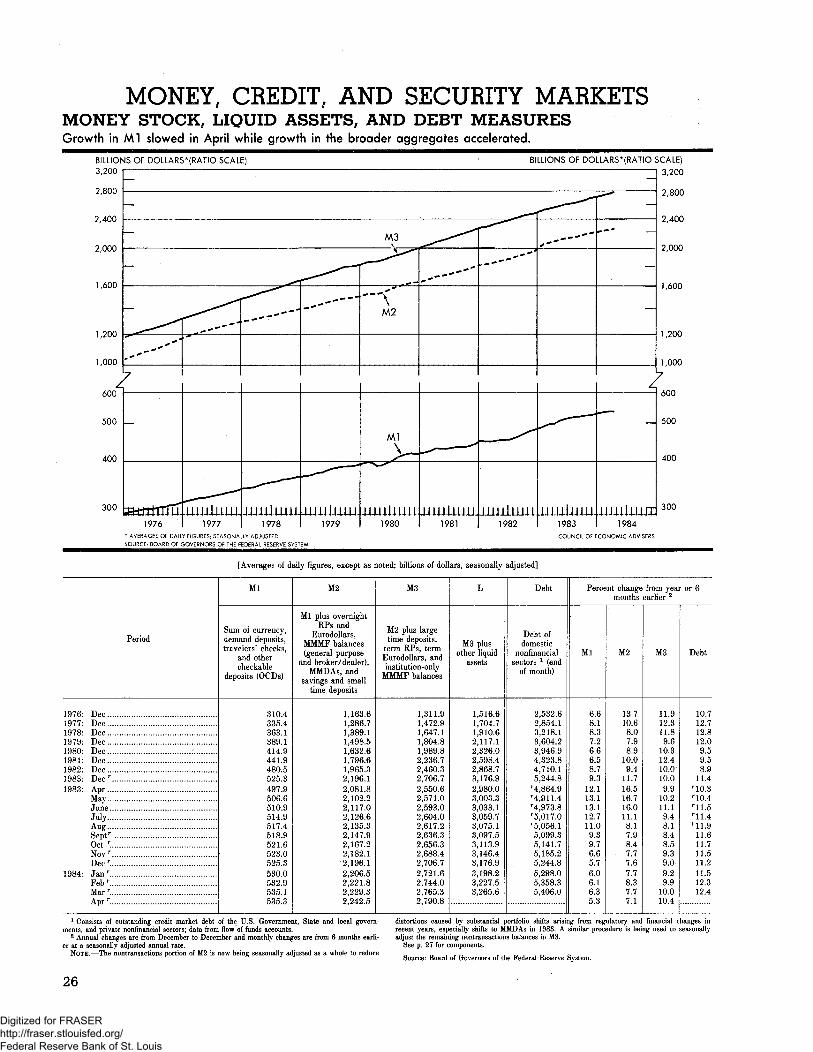
MONEY, CREDIT, AND SECURITY MARKETSMONEY STOCK, LIQUID ASSETS, AND DEBT MEASURESGrowth in Ml slowed in April while growth in the broader aggregates accelerated.
BILLIONS OF DOLLARS*(RATIO SCALE)3,200
2,800
BILLIONS OF DOLLARS*(RATIO SCALE)3,200
2,800
2,400
2,000
300 300
1976* AVERAGES OF DAILY FIGURES; SEASONALLY ADJUSTED
SOURCE: BOARD OF GOVERNORS OF THE FEDERAL RESERVE SYSTEM
1983 1984COUNCIL OF ECONOMIC ADVISERS
[Averages of daily figures, except as noted; billions of dollars, seasonally adjusted]
Period
1976: Dee1977- Dee1978: Dee1979- Dee1980: Dee .'1981- Dee1982: Dee1983- Dec r . ,1983: Apr
MayT ^JuneJuly.AugSeptr
Get r.Nov r
Decr.1984- Janr
Febr.Mar r
Apr r
Ml
Sum of currency,demand deposits,travelers' checks,
and othercheckable
deposits (OCDs)
310.4335.4363.1389.1414.9441.9480.5525.3497.9506.6510.9514.9517.4518.9521.6523.0525.3530.0532.9535.1535.3
M2
Ml plus overnightRPs and
Eurodollars,MMMF balances(general purpose
and broker/dealer),MMDAs, and
savings and smalltime deposits
1,163.61,286.71,389,11,498.51,632.61,796.61,965.32,196.12,081.82,102.22,117.02,126.62,135.32,147.92,167.22,182.12,196.12,206.52,221.82,229.32,242.5
M3
M2 plus largetime deposits,
term RPs, termEurodollars, andinstitution-only
MMMF balances
1,311.91,472.91,647.11,804.81,989.82,236.72,460.32,706.72,550.62,571.02,593.02,604.02,617.22,636.32,656.32,688.42,706.72,721.62,744.02,765.32,790.8
L
M3 plusother liquid
assets
1,516.61,704.71,910.62,117.12,326.02,598.42,868.73,176.92,980.03,003.33,033.13,059.73,075.13,097.53,113.93,146.43,176.93,198.23,227.53,265.6
Debt
Debt ofdomestic
nonfinancialsectors 1 (end
of month)
2,532.62,854.13,218.13,604.23,946.94,323.84,710.15,244.8
r4,864.9r4,911.4r4,973.8r5,017.0r5,056.15,099.35,141.75,185.25,244.85,298.05,358.35,406.0
Percent change from year or 6months earlier 2
Ml
6.68.18.37.26.66.58.79.3
12.113.113.112.711.09.39.76.65.76.06.16.35.3
M2
13.710.68.07.98.9
10.09.4
11.716.516.716.011.18.17.98.4
• 7.77.67.78.37.77.1
M3
11.912.311.89.6
•10.312.410.010.09.9
10.211.19.48.18.48.59.39.09.29.9
10.010.4
Debt
10.712.712.812.09.59.58.9
11.4r!0.3r!0.4r!1.5r!1.4r!1.911.611.711.511.211.512.312.4
1 Consists of outstanding credit market debt of the U.S. Government, State and local govern-ments, and private nonfinancial sectors; data from flow of funds accounts.
2 Annual changes are from December to December and monthly changes are from 6 months earli-er at a seasonally adjusted annual rate.
NOTE.—The nontransactions portion of M2 is now being seasonally adjusted as a whole to reduce
distortions caused by substantial portfolio shifts arising from regulatory and financial changes inrecent years, especially shifts to MMDAs in 1983. A similar procedure is being used to seasonallyadjust the remaining nontransactions balances in M3.
See p. 27 for components.
Source: Board of Governors of the Federal Reserve System.
26
Digitized for FRASER http://fraser.stlouisfed.org/ Federal Reserve Bank of St. Louis
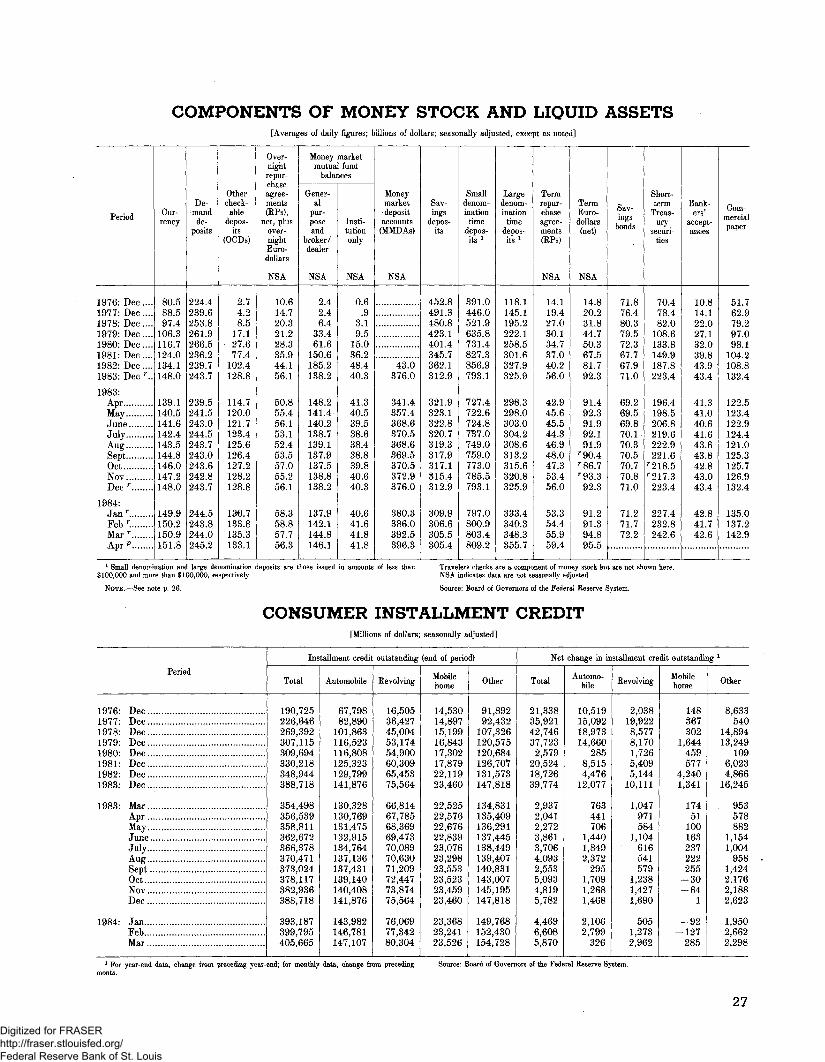
COMPONENTS OF MONEY STOCK AND LIQUID ASSETS[Averages of daily figures; billions of dollars, seasonally adjusted, except as noted]
Period
1976: Dec ....1977: Dec....1978: Dec....1979: Dec ....1980: Dec ....1981: Dec ....1982: Dec ....1983: Dec r..
1983:AprMayJune ..JulyAiis"SeptOctNOYDec r
1984:Janr
Feb r
Mar r
Apr*3
Cur-rency
80.588.597.4
106.3116.7124.0134.1148.0
139.1140.5141.6142.4143.5144.8146.0147.2148.0
149.9150.2150.9151.8
De-mandde-
posits
224.4239.6253.8261.9266.5236.2239.7243.7
239.5241.5243.0244.5243.7243.0243.6242.8243.7
244.5243.8244.0245.2
Othercheck-
abledepos-
its(OCDs)
2.74.28.5
17.127.677.4
102.4128.8
114.7120.0121.7123.4125.6126.4127.2128.2128.8
130.7133.8135.3133.1
Over-nightrepur-chaseagree-ments(RPs),
net, plusover-nightEuro-dollars
NSA
10.614.720.32L228.335.944.156.1
50.855.456.153.152.453.557.055.256.1
58.358.857.756.3
Money marketmutual fund
balances
Gener-al
pur-poseand
broker/dealer
NSA
2.42.46.4
33.461.6
150.6185.2138.2
148.2141.4140.2138.7139.1137.9137.5138.8138.2
137.9142.1144.8146.1
Insti-tutiononly
NSA
0.6.9
3.19.5
15.036.248.440.3
41.340.539.538.638.438.839.840.640.3
40.641.641.841.8
Moneymarketdeposit
accounts(MMDAs)
NSA
43.0376.0
341.4357.4368.6370.5368.6369.5370.5372.9376.0
380.3386.0392.5396.3
Sav-ings
depos-its
452.8491.3480.8423.1401.4345.7362.1312.9
321.9323.1322.8320.7319.3317.9317.1815.4312.9
309.9306.6305.5305.4
Smalldenom-ination
timedepos-its *
391.0446.0521.9635.8731.4827.3856.9793.1
727.4722.6724.8737.0749.0759.0773.0785.5793.1
797.0800.9803.4809.2
Largedenom-ination
timedepos-its 1
118.1145.1195.2222.1258.5301.6327.9325.9
298.3298.0303.0304.2308.6313.2315.6320.8325.9
333.4340.3348.3355.7
Termrepur-chaseagree-ments(RPs)
NSA
14.119.427.030.134.737.040.256.0
42.945.645.544.346.948.047.353.456.0
53.354.455.959.4
TermEuro-dollars(net)
NSA
14.820.231.844.750.367.581.792.3
91.492.391.992.191.9
r90.4r86.7r93.392.3
91.291.394.895.5
Sav-ings
bends
71.876.480.379.572.367.767.971.0
69.269.569.870.170.370.570.770.871.0
71.271.772.2
Short-term
Treas-ury
securi-ties
70.478.482.0
108.6133.8149.9187.8223.4
196.4198.5206.8219.6222.9221.6
r218.5r217.3223.4
227.4232.8242.6
Bank-ers'
accept-ances
10.814.122.027.132.039.843.943.4
41.341.040.641.643.643.842.843.043.4
42.841.742.6
Com-mercialpaper
51.762.979.297.098.1
104.2108.8132.4
122.5123.4122.9124.4121.0125.3125.7126.9132.4
135.0137.2142.9
1 Small denomination and large denomination deposits are those issued in amounts of less than$100,000 and more than $100,000, respectively.
NOTE.—See note p. 26.
Travelers checks are a component of money stock but are not shown here.NSA indicates data are not seasonally adjusted.
Source: Board of Governors of the Federal Reserve System.
CONSUMER INSTALLMENT CREDIT[Millions of dollars; seasonally adjusted]
Period
1976- Dec1977- Dec1978- Dec1979- Dec1980' Dec1981* Dec1982- Dec1983' Dec
1983: MarAprMayJuneJulyAus1• "eSeptOctNovDec
1984- JanFeb.Mar
Installment credit outstanding (end of period)
Total
190,725226,646269,392307,115309,694330,218348,944388,718
354,498356,539358,811362,672366,378370,471373,024378,117382,936388,718
393,187399,795405,665
Automobile
67,79882,890
101,863116,523116,808125,323129,799141,876
130,328130,769131,475132,915134,764137,136137,431139,140140,408141,876
143,982146,781147,107
Eevolving
16,50536,42745,00453,17454,90060,30965,45375,564
66,81467,78568,36969,47370,08970,63071,20972,44773,87475,564
76,06977,34280,304
Mobilehome
14,53014,89715,19916,84317,30217,87922,11923,460
22,52522,57622,67622,83923,07623,29823,55323,52323,45923,460
23,36823,24123,526
Other
91,89292,432
107,326120,575120,684126,70t131,573147,818
134,831135,409136,291137,445138,449139,407140,831143,007145,195147,818
149,768152,430154,728
Net change in installment credit outstanding l
Total
21,33835,92142,74637,7232,579
20,52418,72639,774
2,9372,0412,2723,8613,7064,0932,5535,0934,8195,782
4,4696,6085,870
Automo-bile
10,51915,09218,97314,660
2858,5154,476
12,077
763441706
1,4401,8492,372
2951,7091,2681,468
2,1062,799
326
Eevolving
2,03819,9228,5778,1701,7265,4095,144
10,111
1,047971584
1,104616541579
1,2381,4271,690
5051,2732,962
Mobilehome
148367302
1,644459577
4,2401,341
17451
10016323722225530
-641
-92-127
285
Other
8,633540
14,89413,249
1096,0234,866
16,245
953578882
1,1541,004
9581,4242,1762,1882,623
1,9502,6622,298
1 For year-end data, change from preceding year-end; for monthly data, change from precedingmonth.
Source: Board of Governors of the Federal Reserve System.
27
Digitized for FRASER http://fraser.stlouisfed.org/ Federal Reserve Bank of St. Louis
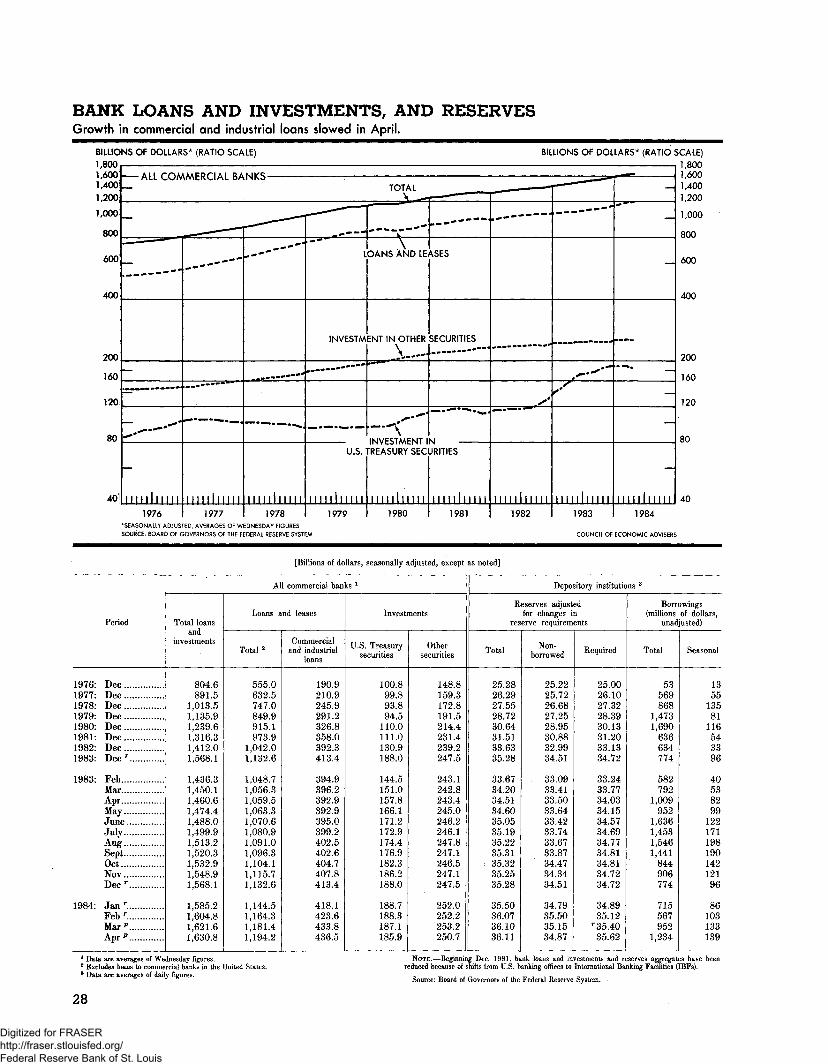
BANK LOANS AND INVESTMENTS, AND RESERVESGrowth in commercial and industrial loans slowed in April.
BILLIONS OF DOLLARS* (RATIO SCALE)1,800
ALL COMMERCIAL BANKS -
600
400
200
160
120
80
40!
1976
nmlmn1977
nn1978
LOANS AND LEASES
INVESTMENT IN OTHER SECURITIES
""**
INVESTMENT INU.S. TREASURY SECURITIES
1979
MINI
1980
I l l l l l l l l l l
1981
BILLIONS OF DOLLARS* (RATIO SCALE)1,8001,6001,4001,200
1,000
800
600
I l l l l l l l l l l
1982 1983
M I N I M I
400
200
160
120
80
40
1984*SEASONALLY ADJUSTED, AVERAGES OF WEDNESDAY FIGURES
SOURCE: BOARD OF GOVERNORS OF THE FEDERAL RESERVE SYSTEM COUNCIL OF ECONOMIC ADVISERS
[Billions of dollars, seasonally adjusted, except as noted]
Period
1976: Dec1977: Dec1978- Dec1979: Dec1980- Dec1981: Dec.1982- Dec1983: Dec r
1983: FebMarAwMayJuneJulyAuir...,SeptOct.NovDec r
1984: Jan r.Febr
Marp..Apr*
All commercial banks l
Total loansand
investments
804.6891.5
1,013.51,135.91,239.61,316.31,412.01,568.1
1,436.31,450.11,460.61,474.41,488.01,499.91,513.21,520.31,532.91,548.91,568.1
1,585.21,604.81,621.61,630.8
Loans and leases
Total 2
555.0632.5747.0849.9915.1973.9
1,042.01,132.6
1,048.71,056.31,059.51,063.31,070.61,080.91,091.01,096.31,104.11,115.71,132.6
1,144.51,164.31,181.41,194.2
Commercialand industrial
loans
190.9210.9245.9291.2326.8358.0392.3413.4
394.9396.2392.9392.9395.0399.2402.5402.6404.7407.8413.4
418.1423.6433.8436.5
Investments
U.S. Treasurysecurities
100.899.893.894.5
110.0111.0130.9188.0
144.5151.0157.8166.1171.2172.9174.4176.9182.3186.2188.0
188.7188.3187.1185.9
Othersecurities
148.8159.3172.8191.5214.4231.4239.2247.5
243.1242.8243.4245.0246.2246.1247.8247.1246.5247.1247.5
252.0252.2253.2250.7
Depository institutions 3
Reserves adjustedfor changes in
reserve requirements
Total
25.2826.2927.5528.7230.6431.5133.6335.28
33.6734.2034.5134.6035.0535.1935.2235.31
i 35.3235.2535.28
35.5036.0736.1036.11
Non-borrowed
25.2225.7226.6827.2528.9530.8832.9934.51
33.0933.4133.5033.6433.4233.7433.6733.8734.4734.3434.51
34.7935.5035.1534.87
Required
25.0026.1027.3228.3930.1331.2033.1334.72
33.2433.7734.0334.1534.5734.6934.7734.8134.8134.7234.72
34.8935.12
r 35.4035.62
Borrowings(millions of dollars,
unadjusted)
Total
53569868
1,4731,690
636634774^
582792
1,009952
1,6361,4531,5461,441
844906774
715567952
1,234
Seasonal
1355
13581
116543396
40538299
12217119819014212196
86103133139
1 Data are averages of Wednesday figures.2 Excludes loans to commercial banks in the United States.3 Data are averages of daily figures.
28
NOTE.—Beginning Dec. 1981, bank loans and investments and reserves aggregates have beenreduced because of shifts from U.S. banking offices to International Banking Facilities (IBFs).
Source: Board of Governors of the Federal Reserve System.
Digitized for FRASER http://fraser.stlouisfed.org/ Federal Reserve Bank of St. Louis
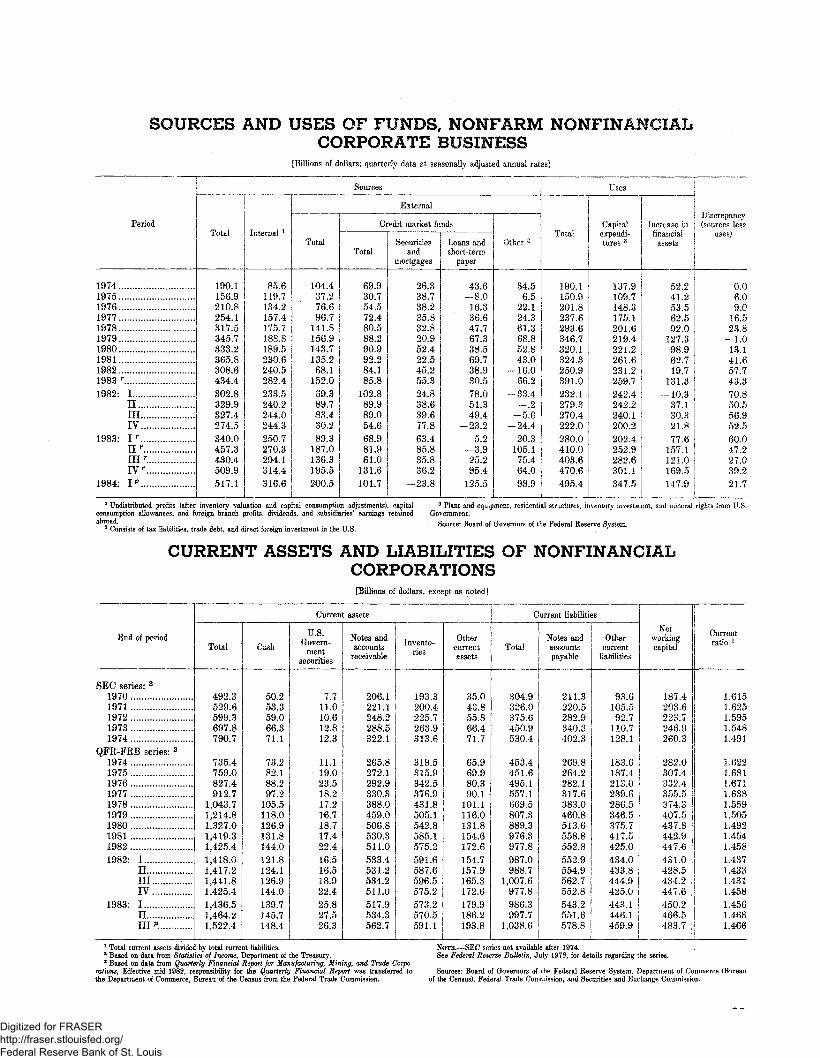
SOURCES AND USES OF FUNDS, NONFARM NONFINANCIALCORPORATE BUSINESS
[Billions of dollars; quarterly at annual rates]
Period
19741975197619771978197919801981 . . . .19821983 r
1982: I.... ,nmjy
1983- I r ...n r
in r..IV r
1984- I p
Sources
Total
190.1156.9210.8254.1317.5345.7333.2365.8308.6434.4302.8329.9327.4274,5340.0457.3430.4509.9517.1
*
85.6119.7134.2157.4175.7188.8189.5230.6240.5282.4233.5240.2244.0244.3250.7 '270.3294.1314.4316.6
External
Total
104.4: 37.2 '
76.696,7
' 141.8156.9143.7135.268.1
152.069.389.783.430.289.3
187.0136.3195.5
Ci
Total
69.930.754.572.480.588.290.992.284.185.8
102.889.989.054.6
68.981.961.0
131.6
101.7
edit
Securitiesand
mortgages
26.338.7
• 38.235.832.820,952.422.545.255.324.838.639.677,863.485.835.836.2
-23.8
Loans andshort-term
paper
43.6-8.016.336.647.767.338.569.738.930.578.051.349.4
-23.25.2
-3.925.295.4
125.5
2
34.56.5
22.124.361.368.852.843.0
-16.066.2
-33.4-.2
-5.6-24.4
20.3105.175.464.098.9
Total
190.1150.9201.8237.6293,6346.7320.1324.3250.9391.0232.1279:3270.4222.0280.0410.0403.6470.6495.4
Uses
Capitalexpendi-tures s
137.9109.7148.3175.1201.6219.4221.2261.6231.2259.7242.4242.2240.1200.2202.4252.9282.6301.1347.5
infinancialassets
52.241.2
- 53.562,592.0
127.398.962.719.7
131.8-10.3
37.130.321.877.6
157.1121.0169.5147.9
Discrepancy
0.06.09.0
16.523.8
-1.013.141.657.743.370.850.556.952.560.047.227.039.221.7
1 Undistributed profits (after inventory valuation and capital consumption adjustments), capitalconsumption allowances, and foreign branch profits, dividends, and subsidiaries*' earnings retainedabroad.
2 Consists of tax liabilities, trade debt, foreign investment in the U.S.
3 Plant and equipment, residential structures, inventory investment, and mineral rights from U.S.Government.
Source: Board of Governors of the Federal Reserve System.
CURRENT ASSETS AND LIABILITIES OF NONFINANCIALCORPORATIONS
[Billions of dollars., as noted]
End of period
SEC series: 2
19701971197219731974
QFE-FRB series: 3
1974197519761977197819791980198119821982: I
n.in..IV
1983: Inm p,..,...,...
Current assets
Total
492.3529.6599.3697.8790.7
735.4759.0827.4912.7
1,043.71,214.81,327.01,419.31,425.41,418.01,417.21,441.81,425.41,436.51,464.21,522.4
Cash
50.253.359.066.371.1
73.282.188.297.2
105.5118.0126.9131.8144.0121.8124.1126.9144.0139.7145.7148.4
U.S.Govern-
mentsecurities
7.711.010.612.812.3
11.119.023.518.217.216.718.717.422.416.516.518.922.425.827.526.3
Notes andaccounts
receivable
206.1221.1248.2288.5322.1
265.8272.1292.9330.3388.0459.0506.8530.3511.0533.4531.2534.2511.0517.9534.3562.7
Invento-ries
r
193.3200.4225.7263.9313.6
319.5315.9342.5376.9431.8505.1542.8585.1575.2591.6587.6596.5575.2
• =573.2570.5591.1
Other•currentassets
35.043.855.866.471.7
65.969.980.390.1
101.1116.0131.8154.6172.6154.7157.9165.3172.6179.9186.2193.8
Current liabilities
Total
304.9326.0375.6450.9530.4
453.4451.6495.1557.1669.5807.3889.3976.3977.8987.0988.7
1,007.6977.8986.3997.7
1,038.6
Notes andaccountspayable
211.3220.5282.9340.3402.3
269.8264.2282.1317.6383.0460.8513.6558.8552.8552.9554.9562.7552.8543.2551.6578.8
Ottercurrent
liabilities
93.6105.592.7
110.7128.1
183.6187.4213.0239.6286.5346.5375,7417.5425.0434.0.433.8444.9'425.0443.1446.1459.9
Networkingcapital
187.4203.6223.7246.9260.3
282.0307.4332.4355.5374.3407.5437.8442.9447.43431.0428.5434.2447.6450.2466.5483.7
Currentratio l
1.6151.625.1.595
1 1.5481.491
j
1.6221.6811.6711.6381,5591.5051.4921.4541.4581.4371.4331.4311.4581.4561.4681.466
1 Total current assets divided by total current liabilities.2 Based on data from Statistics of Income, Department of the Treasury.3 Based on data from Quarterly Financial Report for Manufacturing, Mining, and Trade Corpo-
rations, Effective mid-1982, responsibility for the Quarterly Financial Report was transferred tothe Department of Commerce, Bureau of the Census from the Federal Trade Commission.
NOTE.—SEC series not available alter 1974.See Federal Reserve Bulletin, July 1978, for details regarding the series.
Sources: Board of Governors of the Federal Reserve System, Department of Commerce (Bureauof the Census), Federal Trade Commission, and Securities and Exchange Commission.
Digitized for FRASER http://fraser.stlouisfed.org/ Federal Reserve Bank of St. Louis
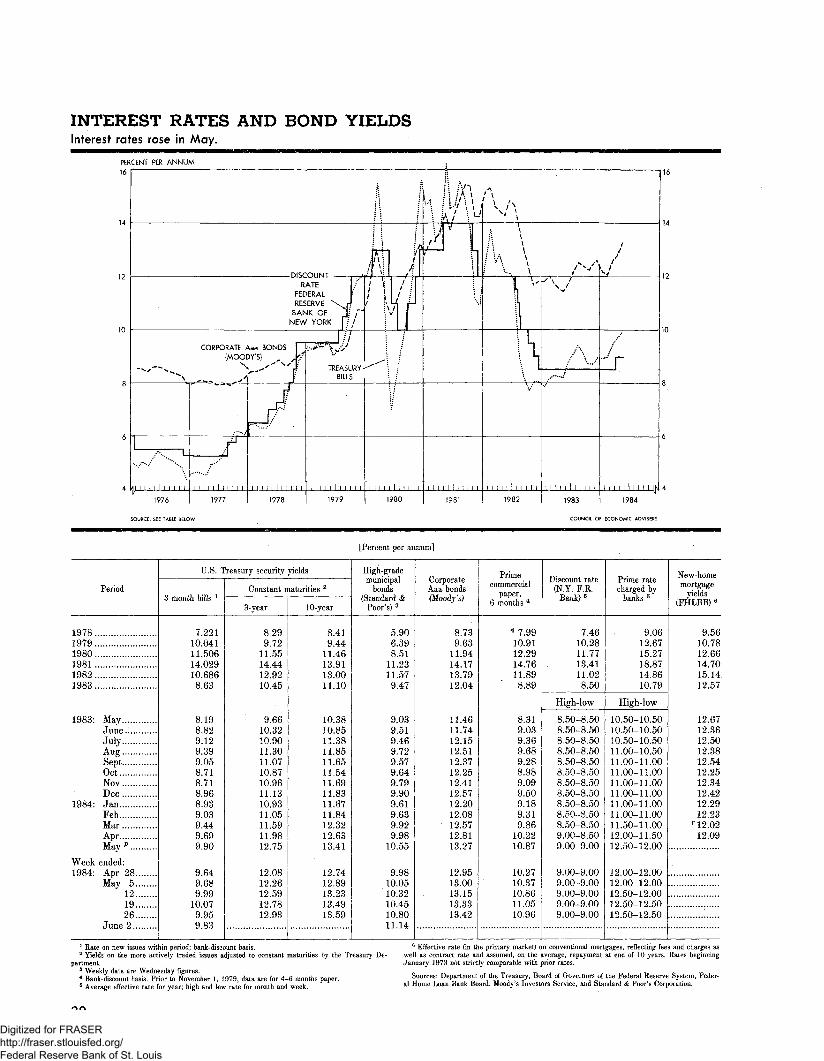
INTEREST RATES AND BOND YIELDSInterest rates rose in May.
PERCENT PER ANNUM
1976
SOURCE: SEE TABLE BELOW
1983 1984
COUNCIL OF ECONOMIC ADVISERS
[Percent per annum]
Period
197819791980198119821983
1983: May ........June .1 . ... ...JulyAufTSeptOctNovDec
1984: JanFebMarAprMay"
Week ended:1984: Apr 28
May 5121926
June 2
U.S. Treasury security yields
3-month bills J
7.22110.04111.50614.02910.6868.63
8.198.829.129.399.058.718.718.968.939.039.449.699.90
9.649.689.99
10.079.959.83
Constant maturities 2
3-year
8,299.72
11.5514.4412.9210.45
9.6610.3210.9011.3011.0710.8710.9611.1310.9311.0511.5911.9812.75
12.0812.2612.5912.7812.93
10-year
8.419.44
11.4613.9113.0011.10
10.3810.8511.3811.8511.6511.5411.6911.8311.6711.8412.3212.6313.41
12.7412.8913.2313.4913.59
High-grademunicipal
honds(Standard &
Poor's) 3
5.906.398.51
11.2311.579.47
9.039.519.469.729.579.649.799.909.619.639.929.98
10.55
9.9810,0510.3210.4510.8011.14
CorporateAaa bonds(Moody 's)
8.739.63
11.9414.1713.7912.04
11.4611.7412.1512.5112.3712.2512.4112.5712.2012.0812.5712.8113.27
12.9513.0013.1513.3313.42
Primecommercial
paper,8 months 4
4 7.9910.9112.2914.7611.898,89
8.319.039.369.689.288.989.099.509.189.319.86
10.2210.87
10.2710.3710.8611.0510,96
Discount rate(N.Y. F.R.
Bank)5
7.4610.2811.7713.4111.028.50
High-low
8.50-8.508.50-8.508.50-8.508.50-8.508.50-8.508,50-8.508.50-8.508.50-8.508.50-8.508.50-8.508.50-8.509.00-8.509.00-9.00
9.00-9.009.00-9.009 00 9 009.00-9 009 00 9 00
Prime ratecharged by
banks 5
9.0612.6715.2718.8714=8610.79
High-low
10.50-10.5010.50-10.5010.50-10.5011.00-10.5011.00-11.0011.00-11.0011.00-11.0011.00-11.0011.00-11.0011.00-11.0011.50-11.0012.00-11.5012.50-12.00
12.00-12.0012.00-12.0012.50-12.0012 50-12 5012.50-12.50
New-homemortgage
yields(FHLBB) 6
9.5610.7812.6614.7015.1412.57
12.6712.3612.5012.3812.5412.2512.3412.4212.2912.23
r 12.0212.09
1 Rate on new issues within period; bank-discount basis.2 Yields on the more actively traded issues adjusted to constant maturities by the Treasury De-
partment.3 Weekly data are Wednesday figures.4 Bank-discount basis. Prior to November 1, 1979, data are for 4-6 months paper.5 Average effective rate for year; high and low rate for month and week.
6 Effective rate (in the primary market) on conventional mortgages, reflecting fees and charges aswell as contract rate and assumed, on the average, repayment at end of 10 years. Bates beginningJanuary 1973 not strictly comparable with prior rates.
Sources: Department of the Treasury, Board of Governors of the Federal Reserve System, Feder-al Home Loan Bank Board, Moody's Investors Service, and Standard & Poor's Corporation.
Digitized for FRASER http://fraser.stlouisfed.org/ Federal Reserve Bank of St. Louis
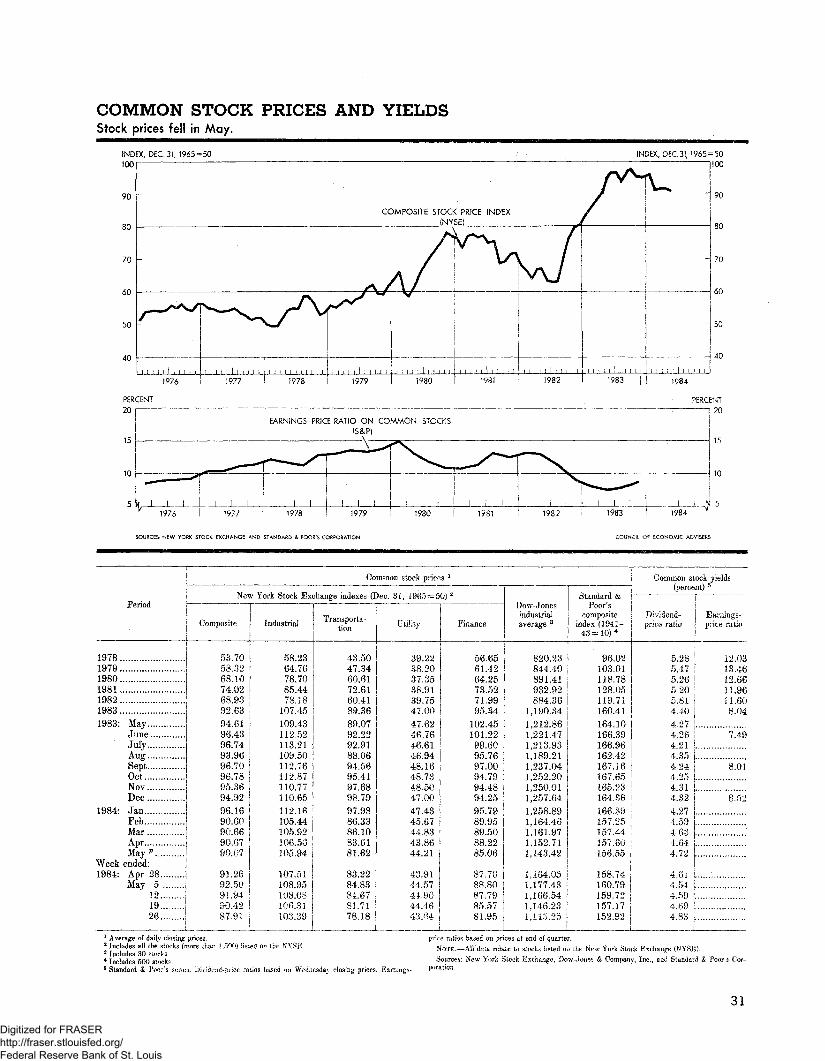
COMMON STOCK PRICES AND YIELDSStock prices fell in May.
INDEX, DEC 31, 1965=50100
INDEX, DEC. 31,1965=50100
- 90
60
50 -
40
1976
Un
1 ! . 1 i ! 1
rm
W
I 1 1 1 1 1 I S 1 i I
1982i i i 1 . 1 i . i . i j i
1983
PERCENT20 I
EARNINGS- PRICE RATIO ON COMMON STOCKS(S&P)
-V
1976
SOURCES; NEW YORK STOCK EXCHANGE AND STANDARD & POOR'S CORPORATION
1983 1984
COUNCIL OF ECONOMIC ADVISERS
Period
1978..1979 , ,1980 ...198119821983 . .1983: May
JuneJulyA.USSeptOctNov......Dec..............
1984: Jan ,.Feb.MarApr....May p. ..........
Week ended:1984: Apr 28.........
May 5.........12 .........i«7 ...
26..,.....,
Common stock prints l
New York Stock Exchange indexes (Dee. 31, 1985 = 50) 2
Composite
53.7058,3268.1074.0268.9392.6394.6196.4396.7493.9696.7096.7895.3694.9296.1690.6090.6690.6790.07
91.2692.5091.9490.4287.91
Industrial
58.2364.7678.7085.4478.18
107.45109.43112.52113.21109.50112.76112.87110.77110.65112.16105.44105.92106.56105.94
107.51108.95'
106.31103.39
Transporta-tion
43.5047.3460.6172.6160.4189.3689.0792.2292.9188.0694.5695.4197.6898,7997.9886.3386.1083.6181.62
83.2284.8384,6781.7178.18
Utility
39.2238.2037.3538.9139.7547.0047.6246.7646.6146.9448,1648.7348.5047.0047.4345.6744.. 8343.8644.21
43.9144.5744,9044.4643.64
Finance
56.6561.4264.2573.5271.9995.34
102.45101.22
.95.7697.0094.7994.4894.2595.7989.9589.5088.2285.06
87,7088.8087.7985.5781.95
Dow-Jonesindustrialaverage 3
820.23844.40891.41932.92884.36
1,190.341,212.861,221.471,213.931,189.211,237.041,252.201,250.011,257.641,258.891,164.461,161.971,152.711,143.42
1,164.051,177.431,166.541.146.231.113.25
Standard & IPoor's
composite Diindex (1941- pri
43 = 10)4
96.02103.01118.78128.05119.71 !160.41 j164.10 I166.39166.96162.42167.16167.65165.23164,36166.39157.25157.44157.60156.55
158.74160.79 i159.72 j157.17 j152.92
Common stock yields(percent) 5
vidend- Earnings-ce ratio I price ratio
i
5.28 12.035.47 13.465.26 12.665,20 11.965.81 11.604.40 8.04427 ,4.26 7.494.214.35 ...................4.24 1 8.014 25 i431 | , . .,4.32 8.52427 j4.59 L4- 63 14 64472 .
4 6i I '4.544 .MI •4. f»9 '4 88
i1 Average of daily closing prices. price on prices at end of quarter.2 Includes all the (more mm 1,500) listed OR tee NOTE.— All" data to stocks listed 01 the New York SUM* Bxchanr« (NTS!',}.
304 Includes 500 stock*5 Standard & Poor's series. Di ratios based on Wednesday closing prices. Earnings-
Sources: New York Stock Exchange, Dow-Jones & Company, Inc.. and Jbiaimarporaaon.
& Poors ('or-
31
Digitized for FRASER http://fraser.stlouisfed.org/ Federal Reserve Bank of St. Louis
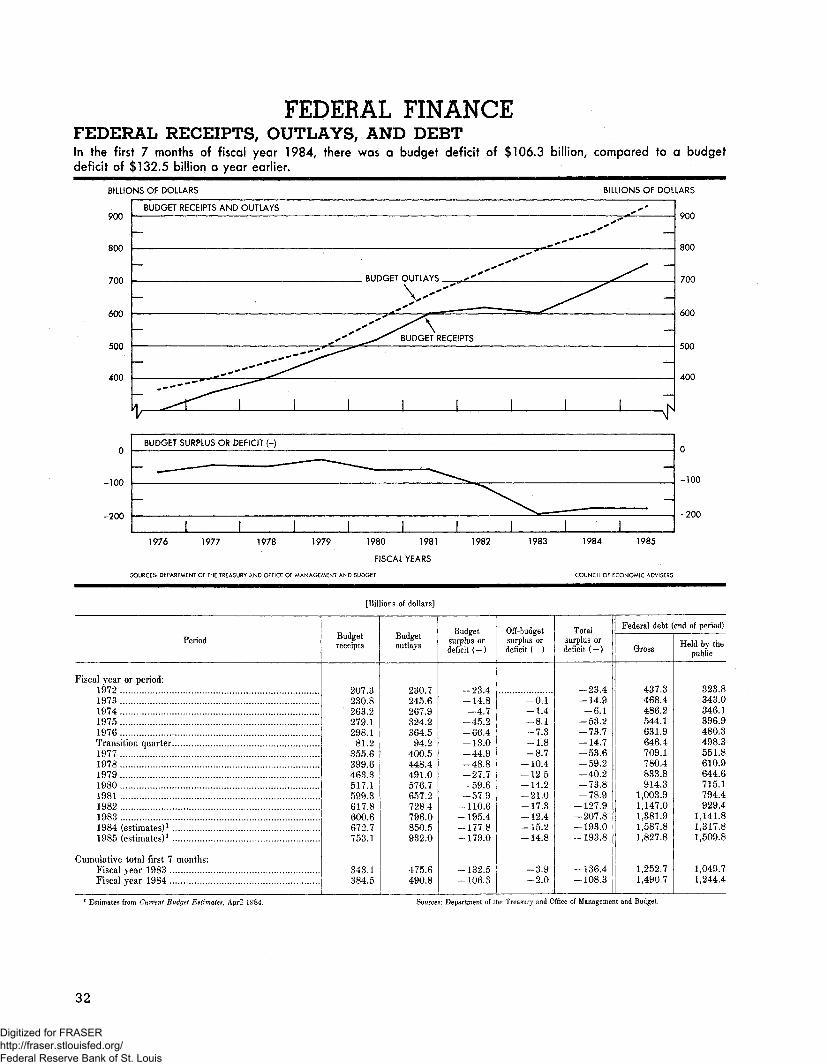
FEDERAL RECEIPTS, OUTLAYS, AND DEBTIn the first 7 months of fiscal year 1984, there was a budget deficit of $106.3 billion, compared to a budgetdeficit of $132.5 billion a year earlier.
BILLIONS OF DOLLARS
900
BILLIONS OF DOLLARS
900
600
500
400
500
400
inn
-200
BUDGET SURPLUS OR DEFICIT (-)
__ __~— — ^_
• "~~"" - " ^^^ ' •
^\i I l I I i I I I
0
-TOO
OAA
1976 1977 1978 1979 1980 1981
FISCAL YEARS
SOURCES: DEPARTMENT OF THE TREASURY AND OFFICE OF MANAGEMENT AND BUDGET
1982 1983 1984 1985
COUNCIL OF ECONOMIC ADVISERS
[Billions of dollars]
Period
Fiscal year or period:19721973 .. .197419751976 ,.Transition Quarter1977 ..19781979...19801981198219831984 (estimates)1
1985 (estimates)1 . . .
Cumulative total first 7 months:Fiscal year 1983 .. ...Fiscal year 1984
Budgetreceipts
207.3230.8
" 263.2279.1298.1
81.2355.6399.6463.3517.1599.3617.8600.6672.7753.1
343.1384.5
Budgetoutlays
230.7245.6267.9324.2364.5
94.2400.5448.4491.0576.7657.2728,4796.0850.5932.0
475.6490.8
Budgetsurplus ordeficit (— )
-23.4-14.8-4.745.2
-66.413.0
-44.9-48.8-27.7
59.6-57,91106
- 195.4-177,8-179.0
-106J
Off-budgetsurplus ordeficit (-)
0.1-1.4
8.1-7.3-1.8-8.7
-10.412.5
— 14.2-21.0-17.3-12.4-15.2-14.8
-3.9-2.0
Totalsurplus ordeficit (— .)
-23.4-14.9-6.1
-53.2-73.7-14.7-53.6
59.2-40.2
73.8-78.9
-127.9-207.8-193.0-193.8
-136.4-108.3
Federal debt (end of period)
Gross
437.3468.4486.2544.1631.9646.4709.1780.4833.8914.3
1,003.91,147.01,381.91,587.81,827.8
1,252.71,490.7
Held by thepublic
323.8343.0346.1396.9480.3498.3551.8610.9644.6715.1794.4929.4
1,141.81,317.81,509.8
1,049.71,244.4
1 Estimates from Current Budget Estimates, April 1984. Sources: Department of the Treasury and Office of Management and Budget.
32
Digitized for FRASER http://fraser.stlouisfed.org/ Federal Reserve Bank of St. Louis
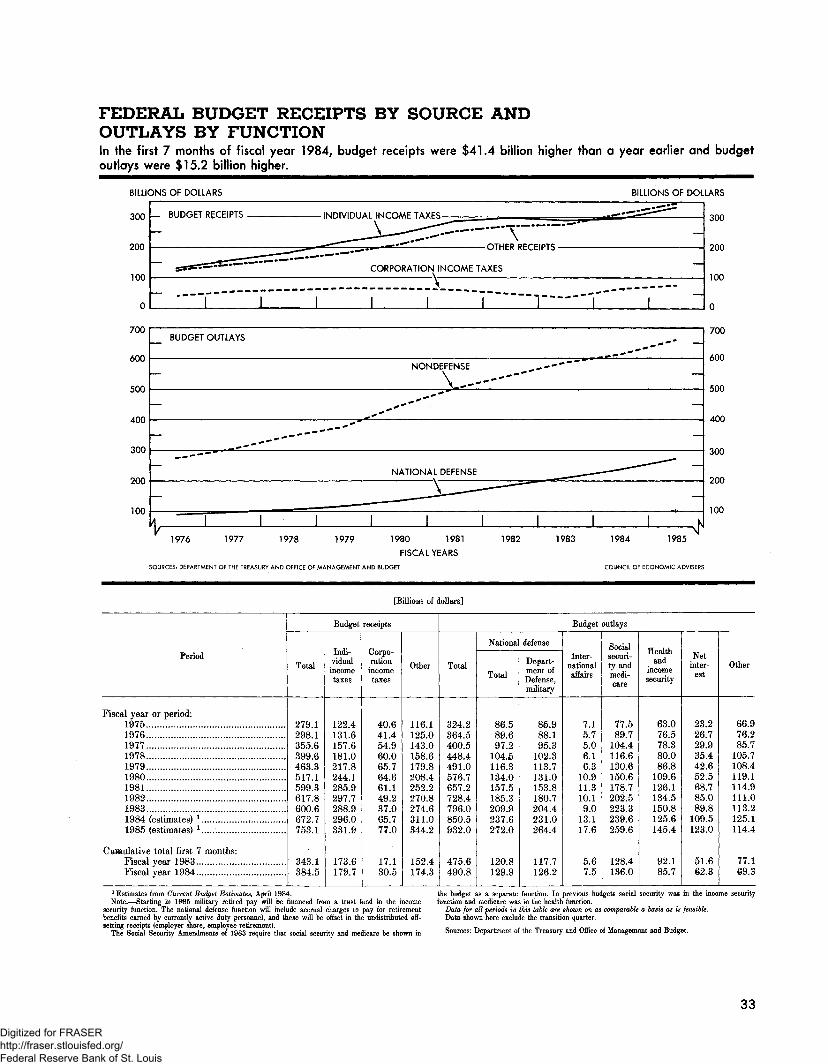
FEDERAL BUDGET RECEIPTS BY SOURCE ANDOUTLAYS BY FUNCTIONIn the first 7 months of fiscal year 1984, budget receipts were $41.4 billion higher than a year earlier and budgetoutlays were $15.2 billion higher.
BILLIONS OF DOLLARS BILLIONS OF DOLLARS
300
9fift
inn
0
Rl IDfiFT RFrFIPTS iKinivim i A i iKirnAAP TA YPQ ^^^•'^^^^
, . l— -— —•»•*** , , , ryri-iFD pcr-pip-rc
— .ggs&XZS^Z^"-- — CORPORATION INCOME TAXES ~~
\
1 I i 1 1
300
onn
100
0
700
600
500
400
300
200
100
BUDGET OUTLAYS
NONDEFENSE
700
600
500
400
300
200
100
1976 1977 1978 1979 1980 1981
FISCAL YEARS
SOURCES: DEPARTMENT OF THE TREASURY AND OFFICE OF MANAGEMENT AND BUDGET
1982 1983 1984 1985
COUNCIL OF ECONOMIC ADVISERS
[BillioBS of dollars]
Period
Fiscal year or period:1975197619771978197919801981198219831984 (estimates) *..1985 (estimates) 1
Cuaiulative total first 7 months:Fiscal year 1&83Fiscal year 1984
Budget receipts
Total
279.1298.1355.6399.6463.3517.1599.3617.8600.6672.7753.1
343.1384.5
Indi-vidualincometaxes
122.4131.6157.6181.0217.8244.1285.9297.7288.9296.0331.9
173.6179.7
Corpo-rationincometaxes
40.641.454.960.065.764.661.149.237.065.777.0
17.130.5
Other
116.1125.0143.0158.6179.8208.4252.2270.8274.6311.0344.2
152.4174.3
Budget outlays
Total
324.2364.5400.5448.4491.0576.7657.2728.4796.0850.5932.0
475.6490.8
National defense
Total
86.589.697.2
104J116.3134.0157.5185.3209.9237.6272.0
120.8129.9
Depart-ment ofDefense,military
85.988.195.3
102.3113.7131.0153.8180.7204.4231.0264.4
117.7126.2
Inter-nationalaffairs
7.15.75.06.16.3
10.911.310.19.0
13.117.6
5.67.5
Socialsecuri-ty andmedi-care
77.589.7
104.4116.6130.6150.6178.7202.5223.3239.6259.6
128.4136.0
Healthand
incomesecurity
63.076.578.380.086.8
109.6126.1134.5150.8125.6145.4
92.185.7
Netinter-
est
23.226.729.935.442.652.568.785.089.8
109.5123.0
51.6§2.3
Other
66.976.285.7
105.7108.4119.1114.9111.0113.2125.1114.4
77.169.3
1 Estimates from Current Budget Estimates, April 1984.Note.—Starting in 1965 military retired pay will be financed from a trust fund in the income
security function. The national defense function will include accrual charges to pay for retirementbenefits earned by currently active duty personnel, and these will be offset in the undistributed off-setting receipts (employer share, employee retirement).
The Social Security Amendments of 1983 require that social security and medicare be shown in
the budget as a separate function. In previous budgets social security was in the income securityfunction and medicare was in the health function.
Data for all periods in this table are shown on as comparable a basis as is feasible.Data shown here exclude the transition quarter.
Sources: Department of the Treasury and Office of Management and Budget.
33
Digitized for FRASER http://fraser.stlouisfed.org/ Federal Reserve Bank of St. Louis
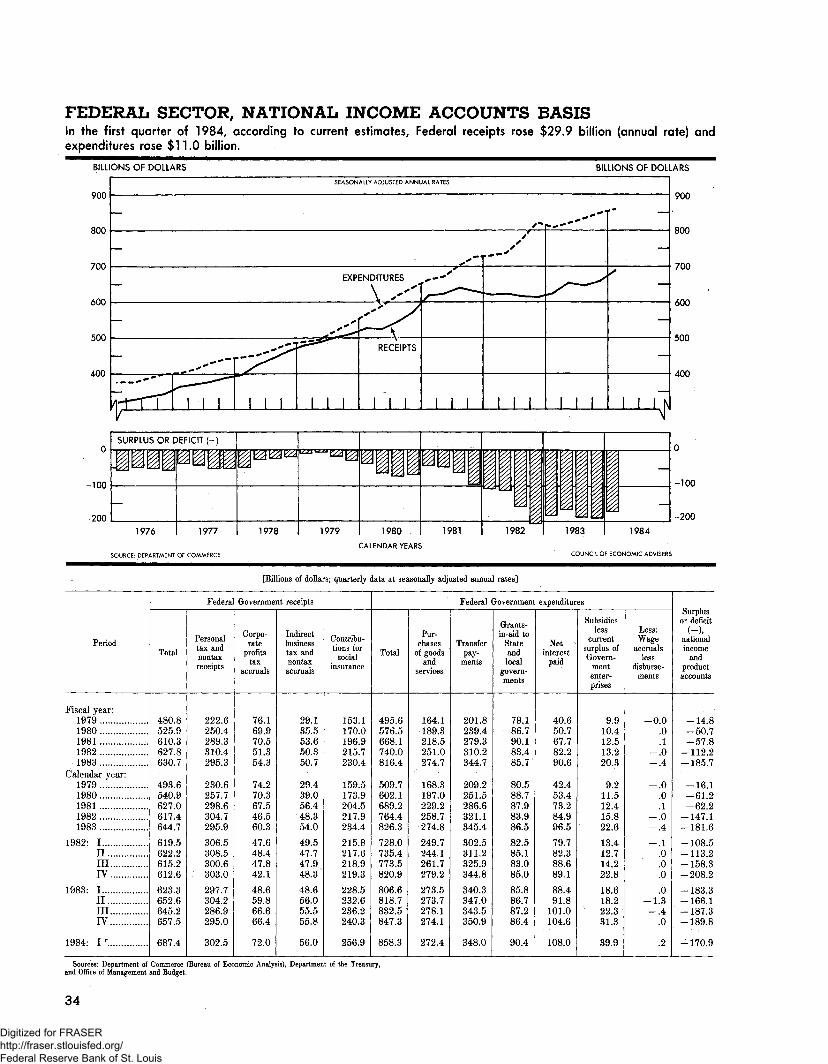
FEDERAL SECTOR, NATIONAL INCOME ACCOUNTS BASISIn the first quarter of 1984, according to current estimates, Federal receipts rose $29.9 billion (annual rate) andexpenditures rose $11.0 billion.
BILLIONS OF DOLLARS
900
800
700
600
500
400
-100
-200
BILLIONS OF DOLLARS
900
800
700
600
500
400
1976
SOURCE; DEPARTMENT OF COMMERCE
-100
-200
1977 1978 1979 1980 I 1981
CALENDAR YEARS
1984
COUNCIL OF ECONOMIC ADVISERS
[Billions of dollars; quarterly data at seasonally adjusted annual rates]
Period
Fiscal year:19791980 .19811982 .1983 a
Calendar year:19791980 . .19811982 .1983
1982: I.........'.nmIV . . . . . .
1983: In.m.....IV
1984- I r...
Federal Government receipts
Total
480.8525.9610.3627.8630.7
493.6540.9627.0617.4644.7
619.5622.2615.2612.6
623.3652.6645.2657.5
687.4
Personaltax andnontaxreceipts
222.6250.4289.3310.4295.3
230.6257.7298.6304.7295.9
306.5308.5300.6303.0
297.7304.2286.9295.0
302.5
Corpo-rate
profitstax
accruals
76.169.970.551.354.3
74,270.367.546.560.3
47.648.447.842.1
48.659.866.666.4
72.0
Indirectbusinesstax andnontax
accruals
29.135.553.650.350.7
29.439.056.448.354.0
49.547.747.948.3
48.656.055.555.8
56.0
Contribu-tions for
socialinsurance
153.1170.0196.9215.7230.4
159.5173.9204.5217.9234.4
215.8217.6218.9219.3
228.5232.6236.2240.3
256.9
Federal Government expenditures
Total
495.6576.5668.1740.0816.4
509.7602.1689.2764.4826.3
728.0735.4773.5820.9
806.6818.7832.5847.3
858.3
Pur-chases
of goodsand
services
164.1189.3218.5251.0274.7
168.3197.0229.2258.7274.8
249.7244.1261.7279.2
273.5273.7278.1274.1
272.4
TransferPay-
ments
201.8239.4279.3310.2344.7
209.2251.5286.6321.1345.4
302.5311.2325.9344.8
340.3347.0343.5350.9
348.0
Grants-in-aid to
Stateandlocal
govern-ments
79.186.790.183.485.7
80.588.787.983.986.5
82.585.183.085.0
85.886.787.286.4
90.4
Netinterest
paid
40.650.767.782.290.6
42.453.473.284.996.5
79.782.388.689.1
88.491.8
101.0104.6
108.0
Subsidiesless
currentsurplus ofGovern-
mententer-prises
9.910.412.513.220.3
9.211.512.415.822.6
13.412.714.222.8
18.618.222.331.3
39.9
Less:Wage
accrualsless
disburse-ments
00.0.1
-.0-.4
-.0.0.1
-.0-.4
— .1.0.0.0
.0-1.3
— .4.0
.2
Surplusor deficit
(-),nationalincome
andproductaccounts
148-50.7
57 8-112.2-185.7
-16.1-61.2-62.2
-147.1181 6
-108.5-113.2-158.3-208.2
-183.3-166.1-187.3-189.8
-170.9
Sources: Department of Commerce (Bureau of Economic Analysis), Department of the Treasury,and Office of Management and Budget.
34
Digitized for FRASER http://fraser.stlouisfed.org/ Federal Reserve Bank of St. Louis
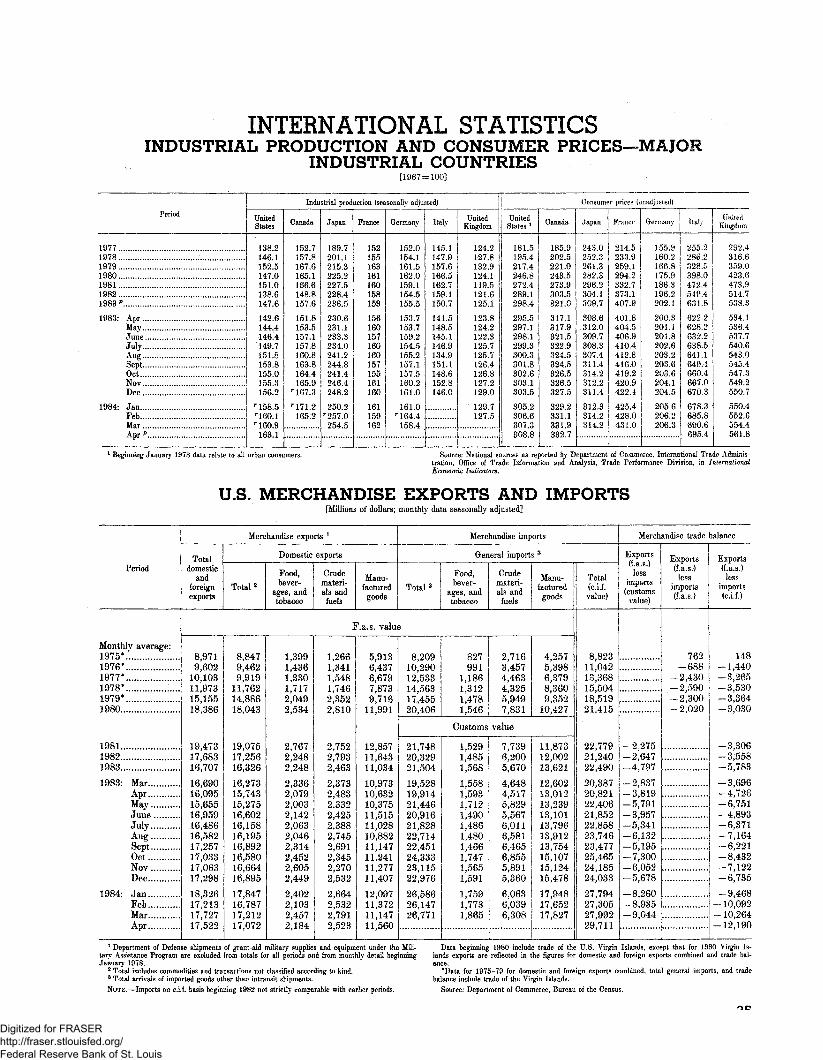
INTERNATIONAL STATISTICSINDUSTRIAL PRODUCTION AND CONSUMER PRICES—MAJOR
INDUSTRIAL COUNTRIES[1967 = 100]
Period
197719781979 , ... .1980198119821983 p , .
1983: AprMay" y *JuneJulyAug. .......SentOctNovDec
1984: JanFebMar....Apr p
Industrial production (seasonally adjusted)
UnitedStates
138.2146.1152.5147.0151.0138.61 47.6
142.6144.4146.4149.7151.8153.8155.0155,3156.2
r 158.5r!60.1r 160.9
163 1
Canada
152.7157.8167,6165.1166.6148.8157.6
151.8153.5157.1157.8160.8163.8164.4165.9
r 167.3r 171.2165J
Japan
189.7201.1215.3225.2227.5228.4236.5
230.6231.1233.3234.0241.2244.8241.4246.4248.2
250.2r 257.0254.5
France
152155163161160158159
156160157160160157155161160
161159162
Germany
152.0154.1161.5162.0159.1154.5155.5
153.7153.7159.2154.5155.2157.1157.5
161.0
161.0r 164.4158.4
Italy
145.1147.9157.6166.5162.7159.1150.7
141.5148.5145.1146.9134.9151.1148.6152.8146.0
UnitedKingdom
124.21-27.8132.9124.1119.5121.6
' 125.1
123.8124.2122.3125.7125.7-
• 126.4126.8
• 127,2 '129.0
129.7127.5
. 1 .r
Consumer price.? i'ii:--.;cjusted)
UnitedStates *
181.5195.4
• 217.4246.8272.4289.1298.4
'
297.1298.1299.3300.3301.8302.6303.1303.5
305.2306.6307.3308.8
Canada
185.9202.5221,0243.5273.9303.5
• 821.0
317.1317.9321.5322.9324.5324.5326.5326.5327.5
329.2331.1831.9332.7
Japan
.252.3261.3282.3296.2304.1309.7
308.6312.0309.7308.3307.4311.4314.2312.2311.4
312.3314.2314.2
Prance
214.5233.9259.1294.2332,7373.1407.9
401.8404.5406,9410.4412.8416.0419.2420.9422.4
425.4428.0
-431.0
i
Germany
155.9
166.8175.9186,3196,2202.1
200,3'201.1201.8202.6203.2
203.6204.1204.5
205.6206.2206.3
Italr
255.2286.2328,5398.04-72.4549.4631.8
622.2628.2832.2638.5641.1640,4660.4667.0670,3
678.3685.8
695.4
UnitedKingdom '.
292.4316,6359.0423.6473.9514.7538.3
534.1536.4587.7540.6543.0545.4547,8549.2550.7
550.4552.6554,4561.8
1 Beginning January 1978 data relate to all urban consumers. Source: National as reported by Department of Commerce, International Trade Adminis-tration, Office of Trade Information and Analysis, Trade Performance Division, in InternationalEconomic Indicators,
U.S. MERCHANDISE EXPORTS AND IMPORTS[Millions of dollars; monthly data seasonally adjusted]
Period
Monthly average:1975*1976*1977*1978*1979*1980
198119821983
1983- MarAprMayJuneJulyAm?SeptGet ..NovDec.
1984- JanFebMarApr
Merchandise exports l
Totaldomestic
andforeignexports
Domestic exports
Total2
Food,bever-
ages, andtobacco
Crudemateri-als and
fuels
Manu-facturedgoods
Merchandise imports
General imports s
Total 2Food,bever-
ages, andtobacco
Grademateri-als and
fuels
Manu-facturedgoods
F.a.s. value
8,9719,602
10,10311,97315,15518,386
19,47317,68316,707
16,69016,09515,65516,95916,48616,58217,25717,03317,06317,298
18,32617,21317,72717,522
8,8479,4629,919
11,76214,88618,043
19,07517,25616,326
16,27315,74315,27516,60216,15816,19516,89216,58016,66416,895
17,84716,78717,21217,072
1,3991,4361,3301,7172,0492,534
2,7672,2482,248
2,3362,0792,0032,1422,0632,0462,3142,4522,6052,449
2,4022,1032,4572,184
1,2661,3411,5481,7462,3522,810
2,7522,7932,463
2,3732?4832,3322,4252,3882,7452,6912,3452,2702,532
2,6642,5322,7912,523
5,9136,4376,6797,8739,716
11,991
12,85711,64311,034
10,97310,63210,37511,51511,02810,88211,14711,24111,27711,407
12,09711,37211,14711,560
8,20910,29012,53314,56317,45520,406
21,74820,32921,504
19,55819,91421,44620,91621,82822,71422,45124,33323,11522,976
26,58626,14726,771
827991
1,1861,3121,4781,546
Customs
1,5291,4851,568
1,5581,593
' 1,7121,4901,4861,4801,4661,7471,5651,591
1,7591,7731,865
2,7163,4574,4634,3255,9497,831
value
7,7396,2005,670
4,6484,5175,8295,5676,0116,5816,4656,8555,8915,860
6,0636,0396,308
4,2575,3986,3798,3609,352
• 10,427
11,87312,00213,621
12,60213,01213,23913,10113,79613,91213,75415,10715,12415,478
17,94817,65217,827
™-"T """
Total(c.i.f.value)
8,82311,04213,36815,504.18,51921,415 ,
22,77921,24022,490
20,38720,82122?40621,85222,85823,74623,47725,46524,18524,033
27,79427,30527,99229,711
Merchandise trade balancei_
Exports<f.a.s.)
lessimports(customs
value)
-2,275-2,647-4,797
-2,837-3,819-5,791-3,957-5,341-6,132-5,195-7,300-6,052-5,678
-8,260-8,935-9,044
Exports(la.s.)less
imports(f.a.s.)
762-688
-2,430-2,590-2,300-2,020
Exports(f.a.8.)-
lessimports(c.i.f.)
148— 1,440-3,265-3,530-3,364-3,030
-3,306-3,558-5,783
-3,696-4,726-6,751-4,893-6,371-7,164-6,221-8,432-7,122-6,735
-9,468- 10,092
10264-12,190
1 Department of Defense shipments of grant-aid military supplies and equipment under the Mili-tary Assistance Program are excluded from totals for all periods and from monthly detail beginningJanuary 1978.
2 Total includes commodities and transactions not classified according to kind.3 Total arrivals of imported goods other than intransit shipments.NOTE.—Imports on c.i.f. basis beginning 1982 not strictly comparable with earlier periods.
Data beginning 1980 include trade of the U.S. Virgin Islands, except that for 1380 Virgin Is-lands exports are reflected in the figures for domestic and foreign exports combined and trade bal-ance.
'Data for 1975-79 for domestic and foreign exports combined, total general imports, and tradebalance include trade of the Virgin Islands.
Source: Department of Commerce, Bureau of the Census.
Digitized for FRASER http://fraser.stlouisfed.org/ Federal Reserve Bank of St. Louis
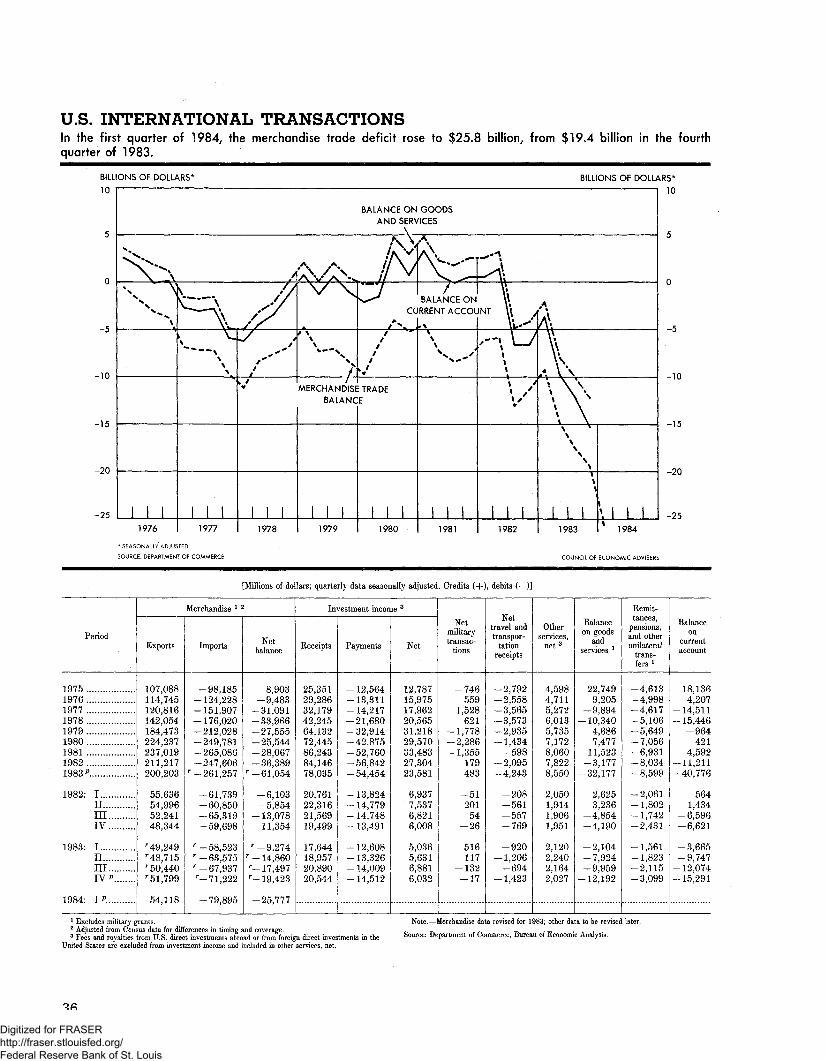
U.S. INTERNATIONAL TRANSACTIONSIn the first quarter of 1984, the merchandise trade deficit rose to $25.8 billion/ from $19,4 billion in the fourthquarter of 1983.
BILLIONS OF DOLLARS
10BILLIONS OF DOLLARS*
-15
-20
-25 -251976
* SEASONALLY ADJUSTED
SOURCE: DEPARTMENT OF COMMERCE
1984
COUNCIL OF ECONOMIC ADVISERS
[Millions of dollars; quarterly data seasonally adjusted. Credits (+), debits (—)]
Period
1975197619771978 . . .19791980198119821983 p
1982- InmIV
1983: I.....nniIV P
1984: I p.
Merchandise l 2
Exports
107,088114,745120,816142,054184,473224,237237,019211,217200,203
55,63654,99652,24148,344
r 49,249r48,715r 50,440r51,799
54,118
Imports
-98,185-124,228-151,907
176 020-212,028-249,781-265,086-247,606
r- 261, 257
-61,73960 850
-65,319-59,698
r- 58,523r- 63,575r- 67,937r-71,222
79 895
Netbalance
8,903-9,48331 091
-33,96627 555
-25,54428 067
-36,389r 6i 054
6 103-5,85413 078
-11,354
r -9,274r 14 QQQr- 17,497r- 19,423
25 777
Investment income 3
Eeceipts
25,35129,28632,17942,24564,13272,44586,24384,14678,035
20,76122,31621,56919,499
17,64418,95720,89020,544
Payments
12564-13,311
14 217-21^680
32 914-42,875
52 760-56,842
54 454
-13,824-14,779-14,748-13,491
-12,608-13,326- 14,009-14,512
Net
12,78715,97517,96220,56531,21829,57033,48327,30423,581
6,9377,5376,8216,008
5,0365,6316,8816,032
Netmilitarytransac-
tions
-746559
1,528621
-1,7782 286
-1,355179483
-5120154
-26
516117
-132-17
Nettravel andtranspor-
tationreceipts
-2,792-2,558-3,565-3,573-2,935-1,434
-598-2,095-4,243
-208-561-557-769
-920-1,206
-694-1,423
Otherservices,
net3
4,5984,7115,2726,0135,7357,1728,0607,8228,550
2,0501,9141,9061,951
2,1202,2402,1642,027
Balanceon goods
andservices l
22,7499,205
-9,894-10,340
4,6867,477
11,523-3,177
-32,177
2,6253,236
-4,854-4,190
-2,104-7,924-9,959
-12,192
Remit-tances,
pensions,and otherunilateral
trans-fers 1
-4,613-4,998-4,617-5,106-5,649-7,056-6,931-8,034-8,599
-2,061-1,802-1,742-2,431
-1,561-1,823-2,115-3,099
Balanceon
currentaccount
18,1364,207
-14,511- 15,446
-964421
4,592-11,211-40,776
5641,434
-6,596-6,621
-3,665-9,747
-12,074-15,291
1 Excludes military grants.2 Adjusted from Census data for differences in timing and coverage.3 Fees and royalties from U.S. direct investments abroad or from foreign direct investments in the
United States are excluded from investment income and included in other services, net.
Note.—Merchandise data revised for 1983; other data to be revised later.
Source: Department of Commerce, Bureau of Economic Analysis.
Digitized for FRASER http://fraser.stlouisfed.org/ Federal Reserve Bank of St. Louis
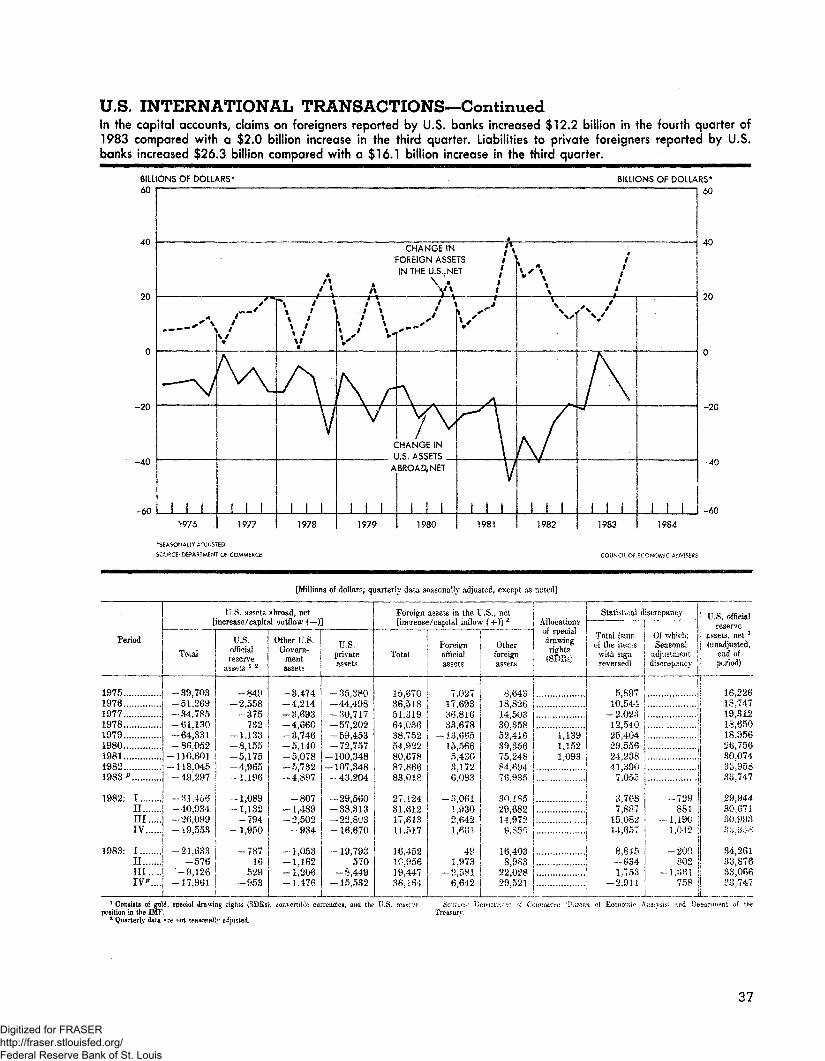
U.S. INTERNATIONAL TRANSACTIONS—ContinuedIn the capital accounts, claims on foreigners reported by U.S. banks increased $12.2 billion in the fourth quarter of1983 compared with a $2.0 billion increase in the third quarter. Liabilities to private foreigners reported by U.S.banks increased $26.3 billion compared with a $16.1 billion increase in the third quarter.
BILLIONS OF DOLLARS60
BILLIONS OF DOLLARS*
60
-60
-40
j -60T976 1984
*S£ASONAUY ADJUSTED
SOURCE- DEPARTMENT OF COMMERCE COUNCR OF fiCONCWJC ADVISERS
[Millions of dollars; quarterly data, seasonally adjusted, except as noted]
Period
197519761977197819791980198119821983 p
1982; InmIV
1983: IIImIV*....
U.S. assets abroad, net[increase /capital outflow (—)]
Total
-39,703-51.269-34,785-61,130-64,331-86.052
-110,601-118.045-49,297
-31,456-40,934-26,099- 19,553
-21,633-576
'-9,126-17.961
U.S.officialreserve
assets * 2
-849-2,558
-375700«^*
-1.133-8,155-5,175-4,965
1 196
-1,089-1,132
-704-1,950
-78716
529-953
Other U.S.Govern-
mentassets
-3,4744 214
-3,693-4,660-3,746-5,140
5078-5*732
-4,897
-807-1,489-2,502
-934
- 1,053— 1.162-1?206-1.476
U.S.privateassets
-35,380-44,498-30,717
57 202-59,453
•72 757-100,348-107,348-43,204
-29,560-38,313-22,803-16,670
~ 19,793570
-8,449-15,532
Foreign assets in the U.S., net[increase/capital inflow (-f-)j 2
For«i#nTotal official
assets
15,67036,51851.31964,03638,75254,92280.67887,86683.018
27.12431,61217,61311.017
16,4521.0,95619.44736,164
7,02717.693a«,81633,678J 3 6«515,5665,4303,1726,083
-3,0611,930.2,6421.661
401.973
-2,5816,642
Otherforeignassets
8,64318,82614,50330,35852,41689,36675,24884.69470,935
30 ^529,(>8214,972a 855
16,4038,983
22,02829,521
Allocationsof specialdrawingrights
CSI>Ils;
1,1391,1521,093
Statistical d
Total (sumof the items
with signreversed)
| n
5,89710,544
-2,02312,54025,40429,55624,23841,390
7.055
3,7687,887
15,08214,657
8.84.5--6341,753
-2,911
iscrepancy
Of which:Seasonal
adjustmentdiscrepancy
*" """"
. .
-729881
-1,1901 ,042
-200802
-1.361758
L_ I
U.S. officialreserve
assets, net l
(unadjusted,end ofperiod)
16,2261.8,74719,31218,65018,95626,75630,074355,95633,747
29,944S0.67I?>(im?>3 ;>>#.:-:
34,26133,87633,06633,747
1 Consists of gold, special <lrawmg rights (SDEs), ifunvorti! U: currencies, and the C.S. res'position in the IMF.
2 Quarterly data are not seasonally adjusted.Treasurv.
3?
Digitized for FRASER http://fraser.stlouisfed.org/ Federal Reserve Bank of St. Louis
ContentsTOTAL OUTPUT, INCOME, AND SPENDING page
Gross National Product ,. 1Gross National Product in 1972 Dollars 2Implicit Price Deflators for Gross National Product 2Changes in GNP, Personal Consumption Expenditures, and Related Price Measures.. 3Nonfinancial Corporate Business—Output, Costs, and Profits 3National Income . 4Personal Consumption Expenditures , 4Sources of Personal Income , 5Disposition of Personal Income 6Farm Income,..*... 7Corporate Profits 8Gross Private Domestic Investment 9Expenditures for New Plant and Equipment—Nonfarm Business 10
EMPLOYMENT, UNEMPLOYMENT, AND WAGESStatus of the Labor Force 11Selected Unemployment Rates........ , 12Selected Measures of Unemployment and Unemployment Insurance Programs 13Nonagricultural Employment ... 14Average Weekly Hours and Hourly Earnings—Private Nonagricultural Industries 15Average Weekly Earnings—Private Nonagricultural Industries 15Productivity and Related Data, Business Sector.... 16
PRODUCTION AND BUSINESS ACTIVITYIndustrial Production and Capacity Utilization 17Industrial Production—Major Market Groups and Selected Manufactures 18New Construction... ,., , 19New Private Housing and Vacancy Rates 19Business Sales and Inventories—Manufacturing and Trade 20Manufacturers' Shipments, Inventories, and Orders , 21
PRICESProducer Prices... 22Consumer Prices 23Changes in Producer Prices for Finished Goods 24Changes in Consumer Prices 24Prices Received and Paid by Farmers... 25
MONEY, CREDIT, AND SECURITY MARKETSMoney Stock, Liquid Assets, and Debt Measures 26Components of Money Stock and Liquid Assets 27Consumer Installment Credit..... 27Bank Loans and Investments, and Reserves... 28Sources and Uses of Funds, Nonfarm Nonfinancial Corporate Business 29Current Assets and Liabilities of Nonfinancial Corporations , 29Interest Rates and Bond Yields......,, 30Common Stock Prices and Yields 31
FEDERAL FINANCEFederal Receipts, Outlays, and Debt 32Federal Budget Receipts by Source and Outlays by Function 33Federal Sector, National Income Accounts Basis , 34
INTERNATIONAL STATISTICSIndustrial Production and Consumer Prices—Major Industrial Countries 35U.S. Merchandise Exports and Imports 35U.S. International Transactions , 36
General NotesDetail in these tables may not add to totals because of rounding.Unless otherwise noted* all dollar figures are in current dollars.Symbols used:
p Preliminary.r Revised.c Corrected.... Not available (also, not applicable).
! . IFor sale by the Superintendent of Documents, U.S. Government Printing Office,
Washington, B.C. 20402. Price $4.25 (single copy) ($5.35 foreign).
Subscription price: $25.00 per year; $31.25 for foreign mailing.
38 U.S. GOVERNMENT PRINTING OFFICE : 1984 0—35-069
Digitized for FRASER http://fraser.stlouisfed.org/ Federal Reserve Bank of St. Louis