Embed Size (px)
Citation preview
Are Mutual Funds Active Voters?
Peter Iliev
The Pennsylvania State University
Michelle Lowry
The Pennsylvania State University
April 17, 2013
Abstract:
We examine how the economics of voting shape mutual fund voting in the U.S. We find that the costs and benefits of assessing the issues up for vote are a significant determinant of mutual fund voting, exceeding in importance the fundamentals underlying the vote such as firm and director characteristics. Engaged mutual funds frequently disagree with ISS recommendations on contentious votes: a one standard deviation increase in a fund’s predicted net benefits of voting is associated with a 12 to 17% increase in the tendency to disagree with ISS. Our results raise questions about the extent of ISS’s influence and whether this influence sways vote outcomes away from the preferences of firm owners.
We thank the Smeal Research Grants Program for generously providing funding for this project. We also thank Utpal Bhattacharya, Fred Bereskin, Laura Field, Dennis Sheehan, Joel Vanden, Jared Williams, Svetla Vitanova, and seminar participants at Australian National University, Hong Kong University of Science and Technology, Penn State University, and the University of Melbourne for valuable comments. *Corresponding authors: Smeal College of Business, Penn State University, University Park, PA 16802. E-mail addresses: [email protected] and [email protected].

Are Mutual Funds Active Voters?
Abstract:
We examine how the economics of voting shape mutual fund voting in the U.S. We find that the costs and benefits of assessing the issues up for vote are a significant determinant of mutual fund voting, exceeding in importance the fundamentals underlying the vote such as firm and director characteristics. Engaged mutual funds frequently disagree with ISS recommendations on contentious votes: a one standard deviation increase in a fund’s predicted net benefits of voting is associated with a 12 to 17% increase in the tendency to disagree with ISS. Our results raise questions about the extent of ISS’s influence and whether this influence sways vote outcomes away from the preferences of firm owners.
1
1. Introduction
How do the owners of the firm influence the firm? Because firm owners are not involved in
day-to-day decisions, they have to exert influence through other channels. One of the primary
channels through which owners can shape a firm’s corporate governance is through the proxy voting
process. However, the ways in which they exercise this right is a matter of debate. Prior literature
suggests that the votes of the largest class of firm owners, mutual funds, are swayed by conflicts of
interest. For example, Davis and Kim (2007) find that mutual funds that manage corporate pension
plans are more likely to adopt a policy of voting with management, and Chou, Ng, and Wang (2013)
find that funds with weaker governance structures are more likely to vote with management.
While conflicts of interest contribute to differences in funds’ voting strategies, we argue that
the fundamental economics of voting likely represent a much larger influence. Funds face both
costs and benefits to independently assess agenda items up for vote in portfolio companies, and we
conjecture that these costs and benefits vary widely across funds. When the net benefits are
negative, Securities and Exchange Commission rules1 prevents mutual funds from simply not
voting. As shown by a simple model, such funds will rationally adopt a rule of following the
recommendation of a proxy advisory service company, for example Institutional Shareholder
Services (ISS). In contrast, funds with positive net benefits are predicted to independently decide on
their vote.
We develop an index of predicted active voting, which is based on four factors that proxy for
funds’ costs of researching items up for vote in portfolio companies: fund size, membership in a top
1 “The federal securities laws do not specifically address how an adviser must exercise its proxy voting authority for its clients. Under the Advisers Act, however, an adviser is a fiduciary that owes each of its clients duties of care and loyalty with respect to all services undertaken on the client's behalf, including proxy voting. The duty of care requires an adviser with proxy voting authority to monitor corporate events and to vote the proxies. To satisfy its duty of loyalty, the adviser must cast the proxy votes in a manner consistent with the best interest of its client and must not subrogate client interests to its own. “ SEC Final Rule IA-2106, March 10, 2003.

2
5 fund family, location in an area with high fund concentration, and fund turnover. Economies of
scale in researching items up for vote and advantages in information collection suggest that funds’
net benefits of voting will vary along these dimensions. Empirical analyses provide strong support:
among contentious director votes, a one standard deviation increase in this index is associated with a
12% lower probability of funds following ISS’s recommendation. The difference in the extent of
ISS’s influence is even starker among contentious compensation and governance votes: the ISS
recommendation explains a substantial fraction of passive funds’ voting patterns, but it has little
predictive power for actively voting funds. Further , we find that the influence of funds’ net benefits
of voting are of equal or greater importance than the underlying firm and director fundamental
characteristics.
The finding that a group of funds follows ISS recommendations almost indiscriminately is
consistent with the ISS recommendation being significantly related to vote outcomes (see, e.g.,
Bethel and Gillan (2002), Morgan, Poulsen, Wolf and Yang (2011), Daines, Gow and Larcker
(2010), Larcker, McCall and Ormazabal (2012)). However, our findings highlight the fact that the
firm owners who most actively assess the companies and the issues up for vote frequently disagree
with these recommendations. Recommendations of proxy advisory service firms appear to push vote
outcomes away from the preferences of this class of engaged firm owners.
To better understand the sources of this divergence of opinion, we focus on two potential
sources of disagreement. We first consider the different incentive structures of ISS versus actively
voting mutual funds. ISS has been accused of minimizing costs by issuing ‘blanket
recommendations’, i.e., of uniformly recommending For or Against certain governance or
compensation policies, without consideration of company specifics. In contrast, fund owners are
clearly more concerned with company specifics, as they are focused on the company returns. Do
fund owners agree with this one-size-fits all approach advocated by ISS? Our evidence suggests that
they do not. We find that the extent of disagreement between the actively voting funds and the
3
passively voting funds is greatest among these near-blanket recommendations.
Second, we examine whether the overall level of uncertainty surrounding the firms with
items up for vote contributes to observed differences in voting patterns. We find no evidence that the
extent of disagreement stems from the more opaque information environment of certain firms:
actively voting funds are no more likely to disagree with ISS on smaller firms or on firms with
greater analyst disagreement.
In the final part of the paper, we examine the extent to which funds’ investment decisions and
investment returns are related to their voting policies. Our findings suggest that fund voting is
significantly related to the funds’ investment decisions. Funds that vote in a direction different than
the one recommended by ISS or whose vote is contrary to the overall vote outcome are significantly
more likely to sell their shares in the subsequent quarter. Moreover, we find no evidence that the
resources that actively voting funds spend investigating the corporate governance issues of portfolio
firms are wasted. To assess this issue, we compare the performance of funds that vote with ISS most
often with those that vote with ISS least often, i.e., passive voters versus active voters. Results from
a four factor model suggest that the most passive funds earn lower abnormal returns, though the
difference in performance between the passive and active funds is not statistically significant.
Our paper relates to several strands of literature. First, we contribute to the literature on
shareholder voting. The majority of research to date examines the ways in which voting patterns
relate to the item up for vote, for example director attendance or CEO compensation. Our
understanding of how the characteristics of the voters affect vote outcomes is much more limited.
Related papers in this vein include Chou, Ng, and Wang (2013), Matvos and Ostrovsky (2010), and
Davis and Kim (2007), who examine the governance structure of funds, the management friendliness
of funds, and the fund-firm business ties, respectively. None of these papers examines the strong
economic incentives behind fund votes. A contemporaneous working paper by Choi, Fisch and
Kahan (2012) considers the severity of passive voting by focusing on a sample of uncontested
4
director elections by several of the largest mutual funds. Our paper takes a more general approach to
the ways in which voter characteristics potentially affect vote outcomes, considering both the costs
and benefits of active voting, and examining the effects of these costs and benefits on a large sample
of mutual funds’ voting decisions.
Second, our paper contributes to an active field within the finance literature focused on the
importance of the shareholder base. Boknaruk and Ostberg (2012) find that the shareholder base is
associated with the firm’s costs of financing, and Becker, Ivkovic and Weisbenner (2011) find that
the shareholder base affects the payout policy. Evidence in this paper suggests that differences in
shareholder composition potentially affect vote outcomes, something about which managers care
deeply.
Finally, our analysis also relates to the contention that there may be costly side effects to
voting. Yermack (2010) notes that shareholders lack specific information, and this may cause them
to make poor choices. Our results suggest that this concern is likely an important one. For example,
funds associated with smaller families and funds with higher turnover are more likely to find it
optimal to outsource the voting process, passively following ISS recommendations, rather than
making the decision in-house.
The remainder of the paper proceeds as follows. Section two considers the voting decision
from the perspective of a mutual fund, where this decision is based on the fund’s costs and benefits
of active voting. Section three discusses the data and provides descriptive statistics. Section four
presents univariate evidence on active voting, and section five examines the determinants of active
voting in a multivariate framework. In section six, we investigate the sources of deviation between
ISS and actively voting funds. Section seven examines the relation between fund voting and both
investment choices and returns. Finally, section eight concludes.
5
2. The costs and benefits of active voting
We start by analyzing mutual funds’ voting decisions in the presence of proxy advisors. We
can think of both a mutual fund and ISS as receiving a signal regarding an agenda item up for vote,
for example a director. ISS observes a noisy signal about the true type (“High” or “Low”) and makes
a voting recommendation. The mutual fund buys the ISS recommendation, receives its own noisy
private signal and decides to vote “For” or “Against”. As we more formally model in Appendix I, a
fund’s decision to follow its own signal versus that of ISS depends on the relative precision of the
two signals. Funds with less precise information are more likely to value ISS’s signal over their own,
and they will thus passively follow the recommendation of ISS. The model suggests that an increase
in the fund precision will relate to a higher probability of the fund voting differently than the ISS
recommendation, with the effect being stronger for contentious issues (which can be proxied by ISS
recommendations to vote Against).
Bringing this theoretical construct to empirics requires proxies for the precision of funds’
signals. Basic economics provides a strong argument for fund characteristics being related to the
precision of their signals. For some funds, the costs of researching and assessing the items up for
vote in each portfolio company outweigh the benefits. Such funds are unlikely to conduct
meaningful independent research, and thus the precision of their signals is likely to be quite low. In
contrast, for other funds the benefits far outweigh the associated costs, meaning that these funds have
strong incentives to conduct independent research and will consequently have much more precise
signals.
Clearly some institutions consider the benefits of voting to be high. For example, Aggarwal,
Saffi and Sturgess (2012) find that institutions such as mutual funds call back lended securities
around the time of contentious votes, suggesting that these entities consider the value of voting to be
sufficiently high that they are willing to give up the revenue from lending. The associated costs are
primarily information-based, and they vary across funds due to differences in both funds’ ex ante
6
knowledge about a firm and their costs of gathering and analyzing additional information. We focus
on four fund characteristics related to the costs and benefits of informed voting. In addition, we also
consider two factors specific to the relation between the fund and the firm.
Our first two proxies for active voting are based on an economies-of-scale argument. Larger
funds are likely to have larger positions within a stock, meaning that research costs can be spread
over a wider asset base. Similarly, within larger fund families multiple funds are likely to own the
same stock. Thus, we posit that larger funds and funds in top five fund families will enjoy lower unit
costs of active voting and thus be more likely to actively vote.
Our third proxy for the costs of gathering and analyzing information for purposes of active
voting is motivated by Hong, Kubik and Stein (2005). Hong et al. posit that fund managers who
work in the same city are more likely to exchange ideas, for example because they regularly meet at
local investor conferences or interact socially. This potentially lowers the costs of gathering and
evaluating information on a company. We thus predict that funds located in a Metropolitan
Statistical Area (MSA) with a high fund concentration are more likely to be active voters.
Our final fund-level proxy for the net benefits of voting is fund turnover. Funds with low
turnover can spread the costs of collecting information over time; information collected about proxy
items in one year will in many cases also be relevant the following year. In addition, funds with
lower turnover are also more likely to realize the benefits of any changes in governance, in the form
of higher returns. Prior literature suggests that the benefits of better governance may take some time
to be realized. For example, Cunat, Gine and Guadalupe (2012) find that shareholder votes that
result in the removal of anti-takeover provisions are associated with long-run increases in shareholder
value. Brav, Jiang, Partnoy and Thomas (2008) find that hedge funds, who invest in a firm with a
stated purpose that is related to corporate governance, maintain their holdings for a median of one
year. Thus, we predict that low turnover funds will be more likely to engage in active voting.
In addition to fund-specific factors, we also include two proxies that capture the relation
7
between a fund and each individual firm in which the fund is invested. Our first fund-firm measure
is the fund’s investment in the firm as a percent of fund total net assets. The benefits of active voting
are a function of future expected returns, meaning that they should be related to the size of a mutual
fund’s investment in a firm. A firm representing a larger fraction of a fund’s total net assets is
clearly more important to overall fund performance than a firm in which the fund has less capital
invested. Thus, we predict that investment as a percent of fund total net assets will be positively
related to active voting.
Finally, the net benefits of voting should be positively related to the fund’s investment as a
percentage of total firm equity value. A fund’s ability to affect the vote outcome is obviously greater
if it controls a greater percentage of the votes, meaning that a fund with a greater percentage
ownership in a firm will have higher benefits of voting. Moreover, investor relations departments of
many companies have policies of regularly contacting their largest shareholders, suggesting that
funds with greater ownership will have lower costs of obtaining information. Both of these factors
suggest that fund ownership in a company will be positively related to active voting.
3. Data
Since 2003, mutual funds have been required to report their votes on all shares held. These
votes are reported on form N-PX, submitted to the SEC. Institutional Shareholder Services (ISS) has
compiled the votes by the top 250 mutual fund families into its Voting Analytics database. The data
include votes on all agenda items in both regularly scheduled annual meetings and special meetings.
Funds have the option of voting For, Against, Abstain, or Withhold; for conciseness we aggregate
Against, Abstain and Withhold together. Further data on funds, including fund holdings and fund
characteristics, are obtained from the CRSP mutual fund database. We take care to obtain the highest
quality match possible between ISS data and CRSP data. Because there is no unique fund identifier
that is common to these two data sources, we use EDGAR to download all fund names and tickers
8
from the mandatory semi-annual reports filed by registered investment companies (form N-SAR).
Following Matvos et al. (2010), we match the ISS data to the EDGAR data based on fund and family
name, and then match via ticker to the CRSP mutual fund database. From CRSP, we collect the most
recent holdings that fall within the 90 days prior to the vote date. In addition, we obtain fund
expense ratios, fund total net assets, fund turnover, fund family, and fund location. In cases where
funds have multiple classes, fund expense ratios and fund turnover represent an average across
classes, weighted by the total net assets of each class. Because tickers are only available in the
EDGAR header files starting in September 2005, we restrict our sample to the 2006 – 2010 period.
Information on the firms is obtained from CRSP, Compustat, Execucomp, IRRC and
Thompson 13F filings. Our final sample consists of 2,177 unique mutual funds across 239 different
families. There are 39,635 separate agenda items that are voted on in 5,858 shareholder meetings of
1,602 different firms.
Descriptive statistics on fund characteristics and votes are found in Appendix II and Table 1.
Throughout our analysis, we focus on three groups of votes: director-related, compensation-related,
and governance-related. Director votes include only management-proposed directors up for
election.2 As shown in Table 1, our sample includes 2,867,504 director votes, which represent votes
by 2,171 unique mutual funds across 5,622 different elections in 1,537 different firms.
Compensation votes include management proposals related to employee compensation plans,
for example stock purchase plans and option repricings. In addition, they also include shareholder
proposals related to compensation, for example proposals to limit executive compensation or to
provide more disclosure on executive compensation. In total, as shown in Table 1, our sample
includes 328,160 votes on compensation-related issues.
Our final vote category consists of governance-related proposals. These include proposals
related to items that comprise the G-Index as well as proposals on dual-class share structures, joint 2 There is a very small number of shareholder proposed directors, less than 0.1% of the total sample, which we omit.
9
CEO-Chairman positions, changing the size of the board, and requiring majority vote for election of
directors.3 These governance-related agenda items include both management proposals and
shareholder proposals. In total, our sample includes 177,497 votes on governance-related issues.
Table 1 shows that director proposals receive by far the most support, with management
recommending voting in favor of the director 100% of the time and ISS recommending voting in
favor of the director 93% of the time. Consistent with these high support rates and also with the
results of Cai, Garner and Walkling (2009) and Fischer, Gramlich, Miller and White (2009),
approximately 94% of funds’ votes are in agreement with the recommendation of ISS and/or
management. In comparison, management only recommends voting for 71% of the compensation
proposals and 32% of the governance proposals. On each of these categories, ISS recommends
voting with management only a portion of the time: in 70% of compensation-related matters, and
40% of governance issues. Interestingly, in compensation matters funds appear to be equally likely
to follow the recommendation of ISS or management. However, funds are substantially more likely
to follow ISS’s recommendation in governance issues (76% of votes are consistent with ISS,
compared to 61% of votes consistent with management).
Descriptive statistics regarding the characteristics of the mutual funds, firms, CEOs, and
directors are presented in Appendix II. Our regressions (in subsequent tables) are estimated at the
vote level, and thus these descriptive statistics are presented at the vote level as well. Fund
characteristics are measured at the fund holdings report date preceding each vote and company
variables are measured at end of the fiscal year preceding the vote. Focusing on the factors that we
posit to be related to the net benefits of active voting, Top 5 families account for 28% of the votes,
and funds in MSAs with a high fund concentration (defined as funds located in one of the top five
3 For details on the components of the G-Index, please see Gompers, Iishi, and Metrick (2003).
10
MSAs based on number of mutual funds within the MSA) account for 56% of the votes.4 On
average, votes are made by funds with total net assets of $4.1 billion, and investments equal to 0.87%
of total net assets and 0.15% of total company market value of equity.
As stated above, we examine director, compensation, and governance votes separately, due to
the unique factors that affect each of these agenda items. Our analysis of director votes controls for
director characteristics, and the analysis of compensation votes controls for CEO characteristics. All
of the analyses control for company characteristics. A description of control variables in these
categories along with variable means are also provided in Appendix 1I.
4. Descriptive evidence on informed voting
4.1. Univariate evidence
This section presents statistics on the prevalence of passive voting, as well as preliminary
evidence on our main hypothesis that funds with higher net benefits of active voting are more likely
to be active voters. As a first measure of passive voting, we calculate the percent of mutual funds
that always follow the advice of another entity. For each of the 2,177 funds in our sample, we
calculate the percentage of times they vote with management and the percentage of times they vote
with ISS. For example, Fidelity Magellan Fund voted on 3,806 agenda items (across 252 firms)
within our 2006 - 2010 sample period: 90% of these votes were consistent with management’s
recommendation, and 83% of these votes were consistent with ISS’s recommendation. After
calculating the analogous percentages for each fund in our sample, we plot these percentages in
histograms. Specifically, Panel A of Figure 1 places funds into percentiles, with the lowest
percentile containing funds whose votes are consistent with management’s recommendation in less
than one percent of the cases. The highest percentile contains funds whose votes are consistent with
4 The top 5 families are Fidelity, Vanguard, T. Rowe Price, Sate Street, and Goldman Sachs. The 5 MSAs with the highest fund concentration are Boston, Chicago, New York City, Philadelphia, and San Francisco.
11
management’s recommendation more than 99% of the time.5 Panel B shows a similar analysis, based
on the percent of votes that are consistent with ISS’s recommendation. Funds with less than 10 votes
are excluded from all figures.
The top panel of Figure 1 shows that most funds vote consistent with management more than
75% of the time. The distribution is approximately bell-shaped (though slightly skewed) between
75% and 98%. However, there is a noticeable spike in the above 99% bin: almost 8% of funds
appear to follow a simple rule of indiscriminately voting with management, compared to less than
5% in each of the lower two bins.
The bottom panel of Figure 1 indicates that there is an even more dramatic tendency of funds
to adopt a simple rule of following ISS. Over 25% of funds indiscriminately vote with ISS across all
firms in their portfolio across the five years in our sample. In comparison, the density of funds at
every other percentile point is around 5% or less. Interestingly, based on a relatively small sample
(118 funds) of survey responses, McCahery, Sautner, and Starks (2011) conclude that 17% of funds
always follow a proxy advisory service firm. Our evidence based on a much larger sample suggests
that the practice is even more prevalent.6 The evidence that passive funds are more likely to follow
ISS than management is consistent with the predictions of our model. Figure 2 shows that there is a
strong tendency to indiscriminately vote with ISS across every category of agenda item.
Approximately 29%, 23%, and 21% of funds exclusively vote with ISS on director, compensation,
and governance-related issues, respectively.
As suggested by the model, we hypothesize that this tendency to passively follow the advice
of ISS is more likely among funds with higher costs and/or lower benefits of informed voting. To
test this conjecture, Table 2 categorizes the mutual funds in our sample according to the factors that
we posited in Section 2 to be related to the costs and benefits of informed voting. The first column
5 The majority of funds in this bin are consistent with management’s recommendation 100% of the time. 6 To the extent that some funds rely on a proxy advisory service other than ISS, we actually under-estimate the frequency of passive voting.
12
defines the composition of the high net benefits of voting group in each row, and all funds not
meeting this definition are put into the low net benefits group.
Looking first at the top row of Table 2, funds that are part of a Top 5 family are categorized
as having high net benefits of active voting. The ability to spread the costs of collecting information
across many funds in a family means that the per-fund costs should be relatively low and the net
benefits high. All other funds are put into the low net benefits group. Consistent with predictions,
only 4% of this high net benefits group passively follow ISS’s recommendation over 99% of the
time, compared to 29% of the low net benefits group. The categorization of funds based on fund size
yields similar insights, with larger funds following ISS in 18% of cases, compared to a much greater
rate of 31% among smaller funds. In row three, the finding that only 20% of funds located in MSAs
with high fund concentration passively follow ISS, compared to 33% of funds located in lower fund-
concentration locales, is consistent with the proximity of many fund managers facilitating the
exchange of information and thus lowering the costs of informed voting. In a similar vein, low
turnover funds are also significantly less likely to indiscriminately follow ISS.
4.2 Principal Factor Analysis
Each mutual fund has a certain tendency to independently evaluate the agenda items up for
vote in portfolio companies, though this precise tendency is not observed by researchers. The
previous section develops four fund characteristics as well as two fund-firm relationship measures
that likely represent different factors that contribute to funds’ decision of whether it is optimal to
actively vote, versus following the recommendations of a proxy advisory service company.
However, each of these measures captures a different dimension of the actively voting decision, and
there exists an obvious interaction between these factors. For example, a fund of a given size is more
likely to actively vote if it is also part of a Top 5 family or if it also has low turnover.
We use principal factor analysis to define one parsimonious proxy for funds’ net benefits of
13
voting. Our approach is related to that of Bushee (1998), who uses similar techniques to categorize
institutions based on their trading strategies. We employ principal factor analysis to extract a
common factor from our four fund-level proxies for net benefits of voting: fund size, membership in
Top 5 family, location in Top Fund MSA, and Fund turnover.7 To the extent that this approach
enables us to extract the incentives of a fund to actively vote, we would expect top family
membership, fund size, and MSA with high fund concentration to share a positive correlation, but
fund turnover to be negatively correlated with the principal factor. Table 3 confirms that the factor
loadings of each of the four variables has the predicted sign. Moreover, as further evidence of the
power of this factor, the eigenvector is 1.57, and eigenvectors on all other factors are below 1.
Following the Kaiser criterion (Kaiser, 1960), we only retain the factor with an eigenvector above 1.8
The last row of Table 2 provides further evidence that our proxy represents a parsimonious
measure of the net benefits of voting. Among funds with an above-median value of this predicted
active voting measure, only 12.5% follow ISS over 99% of the time. In contrast, the analogous rate
among funds with low predicted active voting is almost three times as high, at 33.1%.
Because this principal factor is developed at the fund level, it is not possible to incorporate
the fund-firm relationship proxies. Thus, for purposes of our main analysis we continue to examine
the two fund-firm relationship proxies separately. In a separate analysis, we form an ordinal index
based on all six net benefits of voting proxies (the four firm-level measures plus the two fund-firm
relationship measures). Because this ordinal index measure is a count variable, it has the
disadvantage of not incorporating the continuous nature of many of the variables; continuous variable
are converted into dummies based on whether observations are above or below the median value.
7 We employ principal factor analysis, as this technique is recommended when the analysis is confirmatory in the sense that the researcher can develop predictions regarding the number of factors and the signs of the variables vis-à-vis the factor. Inferences based on principal components analysis are similar. 8 The principal factor is estimated at the fund and shareholder meeting level and has a mean of 0 and standard deviation of 1. In our estimations, we use the factor at the individual vote level. The mean of the principal factor at the vote level is 0.10 with a standard deviation of 1.06 because active funds tend to vote on more companies.
14
Perhaps not surprisingly, the main results (presented in the next section) are somewhat weaker using
this measure.
5. Determinants of informed voting in a multivariate regression framework
This section presents evidence on the relations between funds’ net benefits of active voting
and their voting patterns in a multivariate estimation framework. Our primary objective is to
examine the importance of economic factors behind mutual fund voting. Following our model, we
test the extent to which funds with incentives to vote independently reach different conclusions than
ISS when voting on contentious issues. Ertimur, Ferri, and Oesch (2012) and Choi et al. (2012) show
that the influence of the ISS recommendation varies with the reasons behind the recommendation, for
example with director attendance rates or compensation structures. Thus, we separately examine
agenda items by category, so that we can include appropriate controls in each regression.
Regressions of directors up for election control for the characteristics of the director, such as
committee membership and tenure, whereas compensation-related regressions control for the CEO
characteristics and compensation. Section 5.1 focuses on director elections, and Section 5.2 on
agenda items related to compensation and governance. Section 5.3 discusses possible econometric
concerns.
5.1. Director Elections
Shareholders rely on directors to protect their interests, and shareholders’ ability to vote on
directors helps ensure that directors fulfill this role (see Adams, Hermalin, and Weisbach (2010) for a
survey of the literature related to the roles of directors.) All firms have management-proposed
directors up for vote each year, and mutual funds must vote on each of them.9 When evaluating a
9Voting For a director is equivalent to voting with management because all directors in our sample are recommended by management.
15
director, funds may consider director characteristics, firm characteristics, and/or the ISS
recommendation; across all funds, each of these factors influences the percent of votes with
management. We hypothesize that the predicted active voting mutual funds will place less weight on
the ISS recommendation than other funds. Specifically, we posit that the predicted active voters are
less likely than other funds to vote with management when ISS recommends voting For.
Analogously, we posit that these predicted active voters are more likely to vote with management
when ISS recommends Against. We test this conjecture in two ways. First, we subset our sample
into cases where ISS recommends voting For versus Against the director, and we examine the
relation between fund type and voting patterns. Second, using the entire sample, we employ
interactive terms within our nonlinear framework, by following Greene’s (2010) approach.
Results of the first approach, the use of two subsamples to examine the influence of ISS
among different types of funds, are reported in Table 4. We estimate probit models, where the
dependent variable is a dummy equal to one if a mutual fund votes For a director at the company
meeting, and zero otherwise. The sample in Column 1 consists of all cases where ISS recommended
voting Against management, and the sample in Column 2 consists of all cases where ISS
recommended For. Our variables of interest are the predicted active voter measure (from the
principal factor analysis) and the two measures of the fund-firm relationship, fund investment as a
percent of fund total net assets and fund investment as a percent of firm equity. In addition, we
include a battery of control variables, for example other fund characteristics, director characteristics,
and firm-specific characteristics. All regressions also include year and industry fixed effects, and
standard errors are clustered at the fund level.
Column 1 focuses on the subsample of cases where ISS recommends voting Against
management, a subsample that arguably contains a greater portion of more contentious votes and thus
represents a strong testing ground for our hypothesis. Consistent with predictions, the coefficient on
the predicted active voting proxy has a positive sign, indicating that actively voting funds are
16
significantly more likely than other funds to vote For management when ISS recommends Against.
These funds’ higher net benefits of voting cause them to independently assess the issues, and they
frequently disagree with the conclusions of ISS. In addition to the high statistical significance (z-
stat=7.18), the economic significance of this effect is striking. A one standard deviation increase in
predicted active voting is associated with a 12.6% lower likelihood of agreeing with ISS (which
equates to a higher probability of voting with management). This economic magnitude far outweighs
any of the other firm- or director-level effects for which we control. In fact, the next largest effects
are also associated with fund characteristics, rather than with the underlying firm or director
characteristics. A one standard deviation increase in the fund’s expense ratio is associated with a 5%
increase in the probability of voting with management, and one standard deviation increases in the
measures of the fund investment size (fund investment/fund total net assets and fund investment/firm
equity) are each associated with 3% increases in the probability of voting with management. In
comparison, one standard deviation increases in each of the firm and director characteristics are
associated with voting changes of less than 2%.
Turning to Column 2, we first note that the coefficient on the predicted active voting proxy
has a sign opposite to that in column 1, as predicted by our model. In the column 1 subsample
consisting of ISS Against recommendations, these funds were more likely than other funds to vote
with management, whereas among the column 2 subsample of ISS For recommendations these funds
are less likely to vote with management. Consistent with this subsample representing less
contentious issues on average, the economic effect of predicted active voter is smaller than in the
column 1 subsample. However, the magnitude still continues to be larger than that of most other
variables. A one standard deviation increase in predicted active voting is associated with a 1.3%
lower likelihood of voting with management.10 In comparison, director independence is associated
10 By construction, predicted active voting (i.e., the principal factor) has mean zero and standard deviation one. However, because the principal factor analysis is conducted at the fund level and these regressions are conducted at
17
with a 1% increased probability of fund support, and directors who own more than 1% of the firm
shares are just 0.24% more likely to receive For votes. At the firm level, a one standard deviation
increase in excess firm returns is associated with an 0.1% increased probability of a director at that
firm receiving a For vote. In sum, while prior literature has focused on the importance of the
underlying fundamentals of the director and the firm, we find that the influence of funds’ net benefits
of voting are of equal or greater importance.
The fund-firm relationship proxies for net benefits of voting in Column 2 show mixed results.
We predict coefficients on both these variables to be negative in Column 2; funds that have greater
dollars invested should be more likely to invest the resources to independently vote and thus be less
likely to simply follow ISS and vote with management. Consistent with predictions, investment as a
percent of fund TNA loads negatively, however the coefficient is not significant at conventional
levels. Contrary to predictions, the coefficient on investment as a percent of total firm equity is
significantly positive. We conjecture that these findings reflect the tendency of funds to take large
positions in firms that they believe are being well-run, suggesting they are less likely to conclude that
any particular director is doing a poor job.
The estimated effects of the control variables are largely consistent with prior literature.
Funds are more likely to vote with management in bigger firms, in firms with more positive
performance, and in firms that are better governed. We also include two controls focused on
investors’ assessment of the overall governance of the firm. There may be relatively little
disagreement regarding items up for vote at a well-governed firm, meaning agenda items will be
agreed to nearly unanimously and even a fund devoting considerable resources toward informed
voting would be unlikely to disagree on the issue. To capture such effects we first include a dummy
variable equal to one if ISS recommends voting against at least one other item up for vote at the same
the vote level, the standard deviation of predicted active voting across all regression observations is not exactly equal to one. Within this subsample, the standard deviation of predicted active voting is 1.06, making the economic significance of a one standard deviation increase in this variable equal to 1.4%.
18
firm meeting. Consistent with this variable capturing firms about which there is more disagreement,
we find that it is significantly negatively related to votes with management. Second, we include
average support for this firm by mutual funds in the previous calendar year. Consistent with higher
past support capturing better governance, we find that this variable is significantly positively related
to votes with management.
We have also estimated similar regressions to those reported in Table 4 using each of the four
individual proxies for funds’ net benefits of voting, rather than the predicted active voter proxy from
the factor analysis. Results from these alternative specifications (not tabulated) show that each of the
hypothesized fund proxies for net benefits of voting independently affect voting patterns. Funds that
are larger, have lower turnover, are from Top 5 families, and are from MSA’s with higher fund
concentration all have higher (lower) probabilities of voting with management when ISS
recommends Against (For).11 Results are also similar if we aggregate all four fund characteristics into
an ordinal index that ranges from zero to four.
We use subsamples rather than interaction terms in Table 4 because Ai and Norton (2003)
and Greene (2010) show that the interpretation of interaction terms in nonlinear models is extremely
difficult. In fact, neither the sign, magnitude, nor statistical significance of interaction terms in
nonlinear models can be interpreted directly. Rather, the true effect depends on the value of the
independent variable, with the effect varying across different values of the independent variable.
Because the coefficient on the interaction term in the regression only provides information on the
interaction at a single point, it is relatively uninformative.
Following Greene (2010), we examine the effects of fund activism conditional on ISS
recommendations (across the entire sample) through graphical analyses, which depict interaction
effects over a range of values for the independent variables of interest. Figure 3 is based on a probit
11 All of these effects are significant at the 5% level or higher, with the exception of fund turnover in the ISS Against subsample and fund size in the ISS For subsample.
19
regression similar to that shown in Table 4, where the dependent variable equals one if a fund votes
with management, zero otherwise. However, we now include the entire sample of fund votes in one
regression and we include both the active voter measure and this measure interacted with a dummy
variable equal to one if ISS recommends voting with management and zero otherwise. Analogously,
we also include both the fund-firm relationship measures and these measures interacted with the ISS
dummy. Figure 3 includes three panels, one for the active voter measure, one for fund investment in
the firm as a percent of fund total net assets, and one for fund investment in the firm as a percent of
firm equity. For each panel, we hold all other variables at their means and calculate the predicted
probability that a fund with varying values of the net benefits proxy will vote with management,
conditional on ISS’s recommendation.
Panel A of Figure 3 shows results for the predicted active voter measure. The solid line
shows the tendencies of funds of different activism levels to vote with management when ISS
recommends voting For, and the dashed line represents cases where ISS recommends Against. The
slope of each line captures the difference in the probability that the two types of funds (active vs.
passive) will vote with management, conditional on the ISS recommendation; shaded regions around
these lines represent 95% confidence intervals.
Results further support the conclusions drawn from Table 4: active voter funds are
substantially less likely than other funds to follow ISS’s recommendation. The solid line has a slight
negative slope, indicating that active voter funds are less likely to vote with management than other
funds, conditional on ISS recommending For. Much more dramatic, we observe a strong positive
slope to the dashed line: the most active voter funds are 2 ½ times more likely than the most passive
funds (71% versus 29%) to disagree with ISS, i.e., to vote with management when ISS recommends
voting Against. From a firm’s perspective, the potential ramifications of being owned by actively
voting versus passive funds are substantial. Consider a director election where ISS recommends
voting Against a certain director. Our results suggest that a firm owned entirely by low activism
20
funds would not receive majority approval on this director. Conditional on ISS recommending
Against, only 29% such funds would tend to vote For management, on average. In contrast, a firm
owned by high activism funds would obtain an easy majority of 71% approval. On the flip side, in
cases where ISS recommends For, a firm owned entirely by passive funds would have near 100%
support for the director, while a firm owned by active funds would have only 92% support. Cai et al.
(2009) suggest that voting differences of such magnitudes can have substantial effects on firm
policies, for example on CEO turnover, CEO compensation, and firm governance structures. In sum,
results indicate that ISS is pushing vote outcomes away from the preferences of the most engaged
owners, the actively voting mutual funds.
In Panel B, we see that the effect of the size of a fund’s investment in a firm, relative to total
fund net assets, is similarly substantial. Focusing on cases where ISS recommends Against
management (the dashed line) and holding all other variables at their means, a fund would be
predicted to follow ISS’s recommendation about 45% of the time (1 – 55% prob of voting with
management) for a firm in which it had a small position, compared to only 20% in a firm for which it
had a large position, relative to total fund assets. In a similar vein, Panel C shows that the size of a
fund’s investment relative to the total equity value of the firm is also strongly related to voting
patterns.
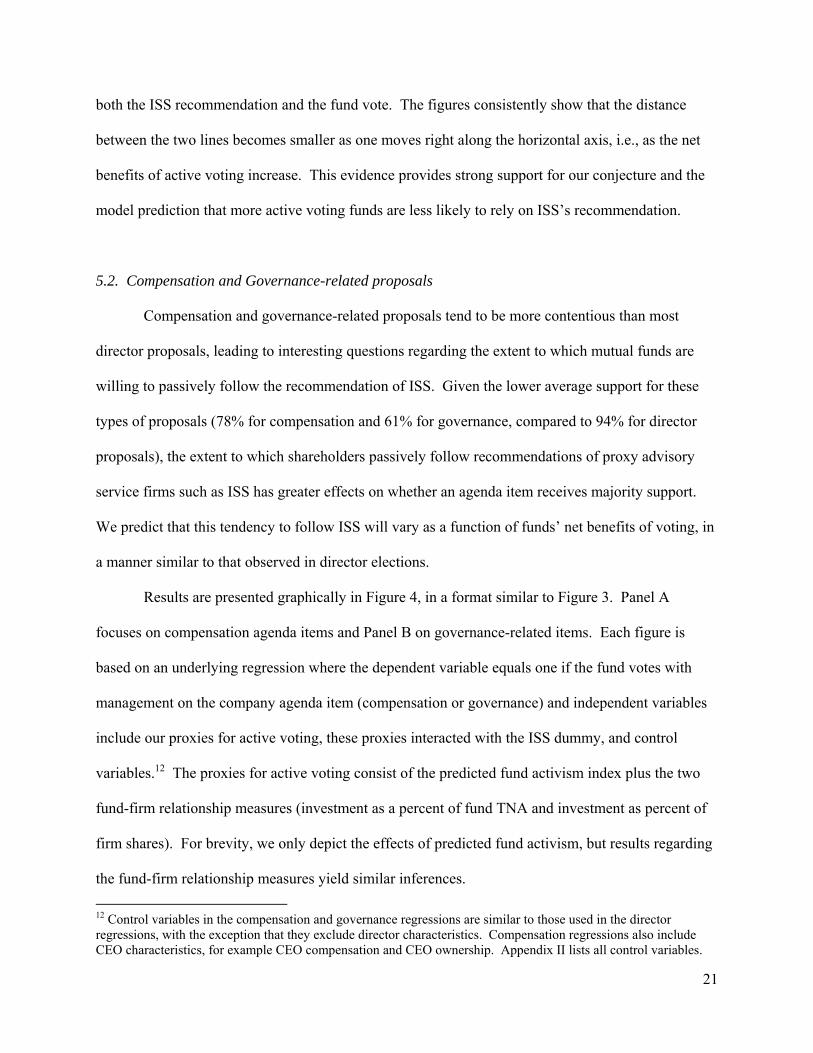
In each figure, the distance between the two lines provides a summary measure of the
influence of ISS for funds with different values of the net benefits of voting proxy. A fund that
indiscriminately followed ISS all the time would have zero probability of voting with management
when ISS recommends voting Against (the dashed line) and 100% probability of voting with
management when ISS recommends voting For (the solid line). Thus, the distance between the two
lines would be one. In contrast, the distance between these two lines will be substantially smaller for
a fund that pays no attention to the ISS recommendation: the distance will only reflect the effects of
common information that we cannot perfectly control for, i.e., underlying information that drives
21
both the ISS recommendation and the fund vote. The figures consistently show that the distance
between the two lines becomes smaller as one moves right along the horizontal axis, i.e., as the net
benefits of active voting increase. This evidence provides strong support for our conjecture and the
model prediction that more active voting funds are less likely to rely on ISS’s recommendation.
5.2. Compensation and Governance-related proposals
Compensation and governance-related proposals tend to be more contentious than most
director proposals, leading to interesting questions regarding the extent to which mutual funds are
willing to passively follow the recommendation of ISS. Given the lower average support for these
types of proposals (78% for compensation and 61% for governance, compared to 94% for director
proposals), the extent to which shareholders passively follow recommendations of proxy advisory
service firms such as ISS has greater effects on whether an agenda item receives majority support.
We predict that this tendency to follow ISS will vary as a function of funds’ net benefits of voting, in
a manner similar to that observed in director elections.
Results are presented graphically in Figure 4, in a format similar to Figure 3. Panel A
focuses on compensation agenda items and Panel B on governance-related items. Each figure is
based on an underlying regression where the dependent variable equals one if the fund votes with
management on the company agenda item (compensation or governance) and independent variables
include our proxies for active voting, these proxies interacted with the ISS dummy, and control
variables.12 The proxies for active voting consist of the predicted fund activism index plus the two
fund-firm relationship measures (investment as a percent of fund TNA and investment as percent of
firm shares). For brevity, we only depict the effects of predicted fund activism, but results regarding
the fund-firm relationship measures yield similar inferences.
12 Control variables in the compensation and governance regressions are similar to those used in the director regressions, with the exception that they exclude director characteristics. Compensation regressions also include CEO characteristics, for example CEO compensation and CEO ownership. Appendix II lists all control variables.
22
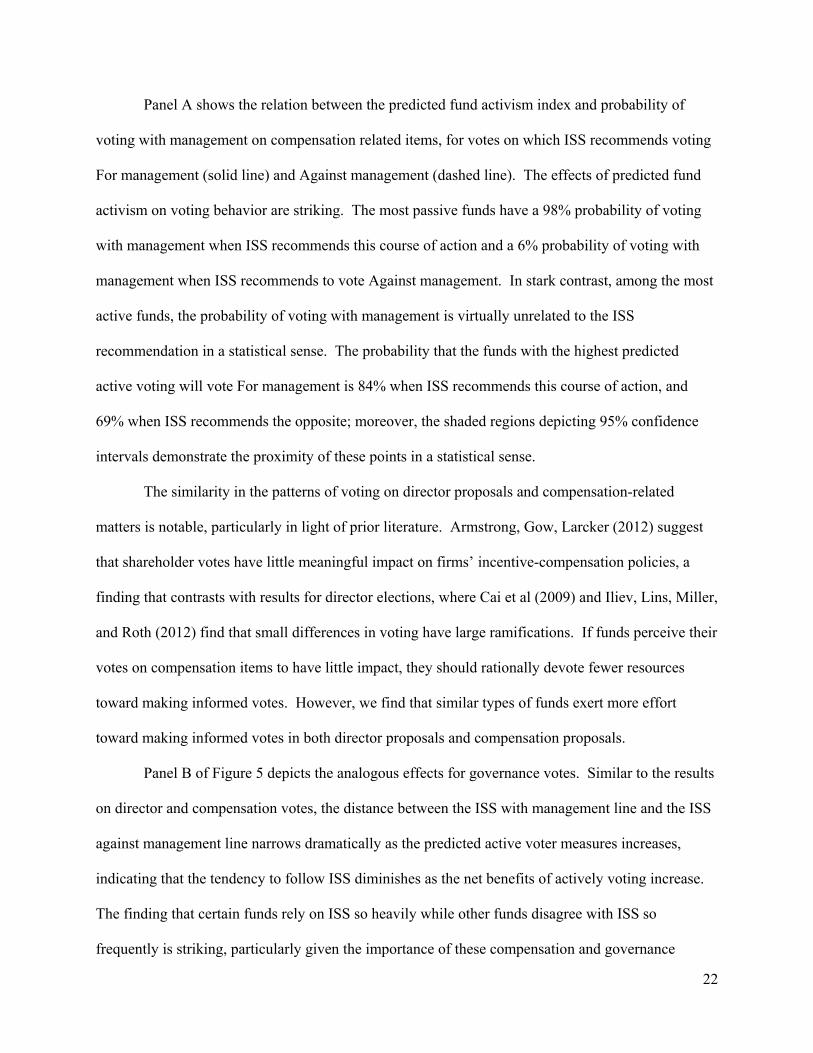
Panel A shows the relation between the predicted fund activism index and probability of
voting with management on compensation related items, for votes on which ISS recommends voting
For management (solid line) and Against management (dashed line). The effects of predicted fund
activism on voting behavior are striking. The most passive funds have a 98% probability of voting
with management when ISS recommends this course of action and a 6% probability of voting with
management when ISS recommends to vote Against management. In stark contrast, among the most
active funds, the probability of voting with management is virtually unrelated to the ISS
recommendation in a statistical sense. The probability that the funds with the highest predicted
active voting will vote For management is 84% when ISS recommends this course of action, and
69% when ISS recommends the opposite; moreover, the shaded regions depicting 95% confidence
intervals demonstrate the proximity of these points in a statistical sense.
The similarity in the patterns of voting on director proposals and compensation-related
matters is notable, particularly in light of prior literature. Armstrong, Gow, Larcker (2012) suggest
that shareholder votes have little meaningful impact on firms’ incentive-compensation policies, a
finding that contrasts with results for director elections, where Cai et al (2009) and Iliev, Lins, Miller,
and Roth (2012) find that small differences in voting have large ramifications. If funds perceive their
votes on compensation items to have little impact, they should rationally devote fewer resources
toward making informed votes. However, we find that similar types of funds exert more effort
toward making informed votes in both director proposals and compensation proposals.
Panel B of Figure 5 depicts the analogous effects for governance votes. Similar to the results
on director and compensation votes, the distance between the ISS with management line and the ISS
against management line narrows dramatically as the predicted active voter measures increases,
indicating that the tendency to follow ISS diminishes as the net benefits of actively voting increase.
The finding that certain funds rely on ISS so heavily while other funds disagree with ISS so
frequently is striking, particularly given the importance of these compensation and governance

23
policies.
In sum, results throughout this section demonstrate that funds with higher net benefits of
voting exhibit distinctly different patterns of voting than funds with lower net benefits. This effect is
substantial in economic terms and it is observed across all types of proposals: director,
compensation, and governance. Among the most active funds, ISS appears to have little influence.
However, ISS’s influence is substantial across the most passive funds. Thus, while mutual funds
have a fiduciary duty to vote, the vote outcomes arguably do not represent a weighted average of the
opinions of all shareholders. Rather, they disproportionately reflect the opinion of one entity, and
this entity is not even an owner of the firm. The finding that the more engaged firm owners disagree
so often with the recommendations of ISS raises provocative questions regarding the substantial
influence of proxy advisory service companies.
5.3. Robustness
Active funds might be more likely to voice their concerns through the proxy process, rather
than sell the stock and vote with their feet. However, both findings of prior literature and additional
empirical analyses mitigate concerns that these issues may bias our results. First, while Parrino, Sias,
and Starks (2003) find an increase in institutional selling prior to CEO turnover, this selling is
concentrated among institutional investors other than mutual funds. Moreover, they find no evidence
that this selling stems from a belief that governance structures make direct action too costly. In a
similar vein, survey evidence of McCahery et al. (2010) indicates that the majority of mutual funds
regularly employ both strategies, i.e., the selling of shares and voting against the company, when
they are discontent. Second, Helwege, Intintoli and Zhang (2012) note that exit may lose its impact
as a governance tool as institutions are increasingly constrained to hold large capitalization stocks
regardless of performance, and they find that institutional investors are less likely to rely on a
strategy of voting with their feet in more recent years. Following Helwege et al’s intuition that
24
voting with their feet is less likely among the largest firms, we have re-estimated our regressions
based on the sample of S&P500 firms. Results in this subsample are qualitatively similar to those
reported on the broader sample used throughout the paper. Third, Duan and Jiao (2011) find that
mutual funds are especially likely to vote Against management rather than exit in cases where ISS
recommends voting Against management: results for such subsamples are reported throughout the
paper. Finally, to the extent that different types of funds choose to invest into different types of
firms, these effects are likely to particularly affect the amount of a firm that a fund owns. However,
our regressions are equally-weighted rather than value-weighted, in the sense that each fund with
ownership in a firm equates to one observation, regardless of the value of the fund’s holdings.
A second source of concern relates to the agenda items up for vote. Schoar and Washington
(2011) show that firms are more likely to propose certain agenda items following periods of strong
performance. While this potentially affects the relation between performance and vote outcomes, it
does not introduce any apparent bias on the relation between the votes of active versus passive
mutual funds. Moreover, such selection issues do not apply to the sample of director votes.
6. Why do ISS and actively voting funds reach different conclusions?
Evidence presented thus far indicates that two sets of informed entities, ISS and actively
voting mutual funds, are both analyzing companies and the issues up for vote but are frequently
reaching different conclusions. This finding is consistent with the idea that active voting funds use
additional information when making their decisions, but it raises the question of what factors
contribute to these differing conclusions. We analyze this issue in two ways. First, we consider the
different incentive structures of ISS compared to mutual funds. While mutual funds should rationally
consider both the costs of researching issues and the benefits in terms of higher potential returns, ISS
arguably benefits less from higher firm returns and thus may be more focused on the cost side.
Second, we consider the firm’s information environment. The lack of easily available information on
25
more opaque firms may affect the extent to which these parties’ votes are in the same direction.
6.1. Incentive structures of ISS vs. mutual funds
ISS and firm owners differ substantially in terms of their costs and benefits of researching
items up for vote in companies. On the cost side, ISS has committed to providing recommendations
on all agenda items across an extraordinarily wide array of companies. In contrast, each mutual fund
is focused only on those companies where it has invested, and it has the option to rely on a proxy
advisory service company such as ISS (thus avoiding all research costs) in cases where the research
costs are too high to justify, e.g., on smaller dollar investments. On the benefit side, mutual funds
are focused on the value of their portfolios, and in particular on the expected returns associated with
a governance change. As a result, funds have strong incentives to consider the specific effects of
each agenda item on each individual company. In contrast, ISS does not own shares in the
underlying companies. ISS’s revenues come from its customers, meaning the recommendations must
be of sufficient quality that customers value its product. These two factors potentially cause ISS to
be more focused on the costs of assessing all the issues up for vote across an extremely wide array of
companies, rather than on the ways in which a certain governance structure would differentially
affect each company.
Consistent with an effort to minimize costs, ISS has been accused of issuing blanket
recommendations, i.e., of always recommending against certain issues without considering the
specifics of the company.13 The existence of blanket recommendations combined with passive
funds’ tendencies to blindly follow ISS would potentially prevent companies from tailoring corporate
governance practices to their specific situation. Recent research suggests this may be costly for
companies. For example, Coles, Daniel and Naveen (2008) and Johnson, Karpoff, and Yi (2012)
13 See, e.g., “Companies look to the SEC to rein in proxy advisory service companies”, Compliance Week, June 5, 2012.
26
emphasize that one size fits all approaches on issues related to governance are unlikely to be optimal.
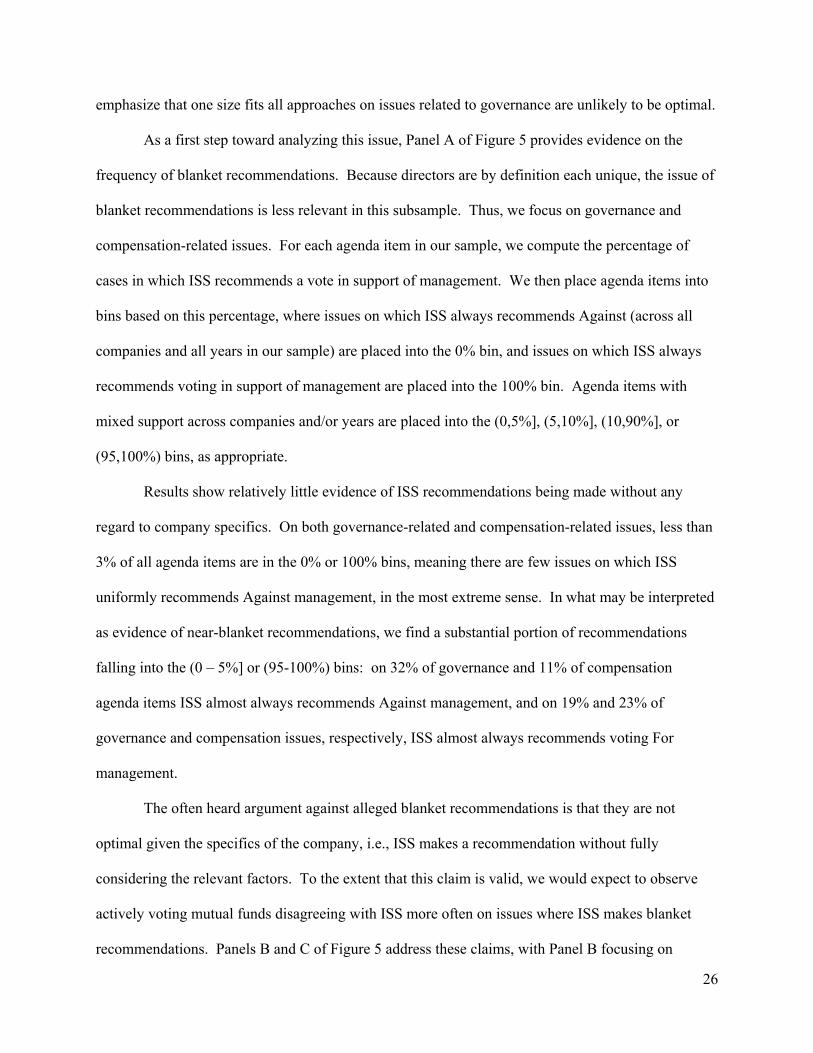
As a first step toward analyzing this issue, Panel A of Figure 5 provides evidence on the
frequency of blanket recommendations. Because directors are by definition each unique, the issue of
blanket recommendations is less relevant in this subsample. Thus, we focus on governance and
compensation-related issues. For each agenda item in our sample, we compute the percentage of
cases in which ISS recommends a vote in support of management. We then place agenda items into
bins based on this percentage, where issues on which ISS always recommends Against (across all
companies and all years in our sample) are placed into the 0% bin, and issues on which ISS always
recommends voting in support of management are placed into the 100% bin. Agenda items with
mixed support across companies and/or years are placed into the (0,5%], (5,10%], (10,90%], or
(95,100%) bins, as appropriate.
Results show relatively little evidence of ISS recommendations being made without any
regard to company specifics. On both governance-related and compensation-related issues, less than
3% of all agenda items are in the 0% or 100% bins, meaning there are few issues on which ISS
uniformly recommends Against management, in the most extreme sense. In what may be interpreted
as evidence of near-blanket recommendations, we find a substantial portion of recommendations
falling into the (0 – 5%] or (95-100%) bins: on 32% of governance and 11% of compensation
agenda items ISS almost always recommends Against management, and on 19% and 23% of
governance and compensation issues, respectively, ISS almost always recommends voting For
management.
The often heard argument against alleged blanket recommendations is that they are not
optimal given the specifics of the company, i.e., ISS makes a recommendation without fully
considering the relevant factors. To the extent that this claim is valid, we would expect to observe
actively voting mutual funds disagreeing with ISS more often on issues where ISS makes blanket
recommendations. Panels B and C of Figure 5 address these claims, with Panel B focusing on
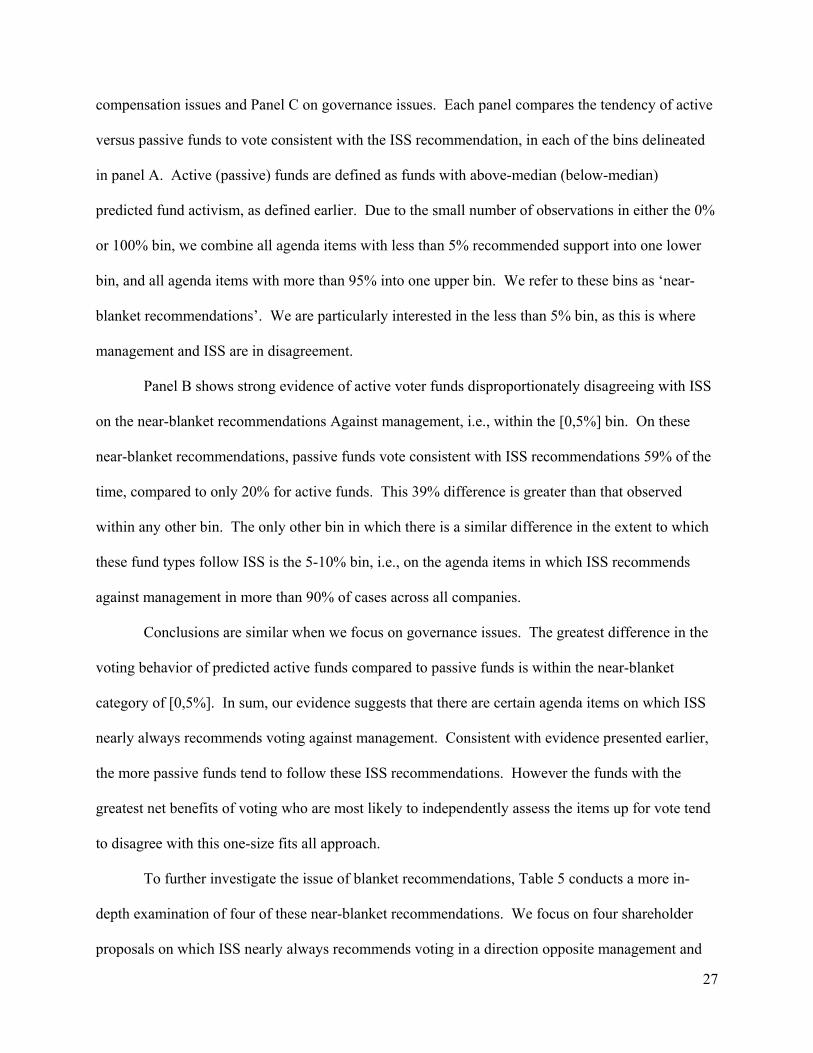
27
compensation issues and Panel C on governance issues. Each panel compares the tendency of active
versus passive funds to vote consistent with the ISS recommendation, in each of the bins delineated
in panel A. Active (passive) funds are defined as funds with above-median (below-median)
predicted fund activism, as defined earlier. Due to the small number of observations in either the 0%
or 100% bin, we combine all agenda items with less than 5% recommended support into one lower
bin, and all agenda items with more than 95% into one upper bin. We refer to these bins as ‘near-
blanket recommendations’. We are particularly interested in the less than 5% bin, as this is where
management and ISS are in disagreement.
Panel B shows strong evidence of active voter funds disproportionately disagreeing with ISS
on the near-blanket recommendations Against management, i.e., within the [0,5%] bin. On these
near-blanket recommendations, passive funds vote consistent with ISS recommendations 59% of the
time, compared to only 20% for active funds. This 39% difference is greater than that observed
within any other bin. The only other bin in which there is a similar difference in the extent to which
these fund types follow ISS is the 5-10% bin, i.e., on the agenda items in which ISS recommends
against management in more than 90% of cases across all companies.
Conclusions are similar when we focus on governance issues. The greatest difference in the
voting behavior of predicted active funds compared to passive funds is within the near-blanket
category of [0,5%]. In sum, our evidence suggests that there are certain agenda items on which ISS
nearly always recommends voting against management. Consistent with evidence presented earlier,
the more passive funds tend to follow these ISS recommendations. However the funds with the
greatest net benefits of voting who are most likely to independently assess the items up for vote tend
to disagree with this one-size fits all approach.
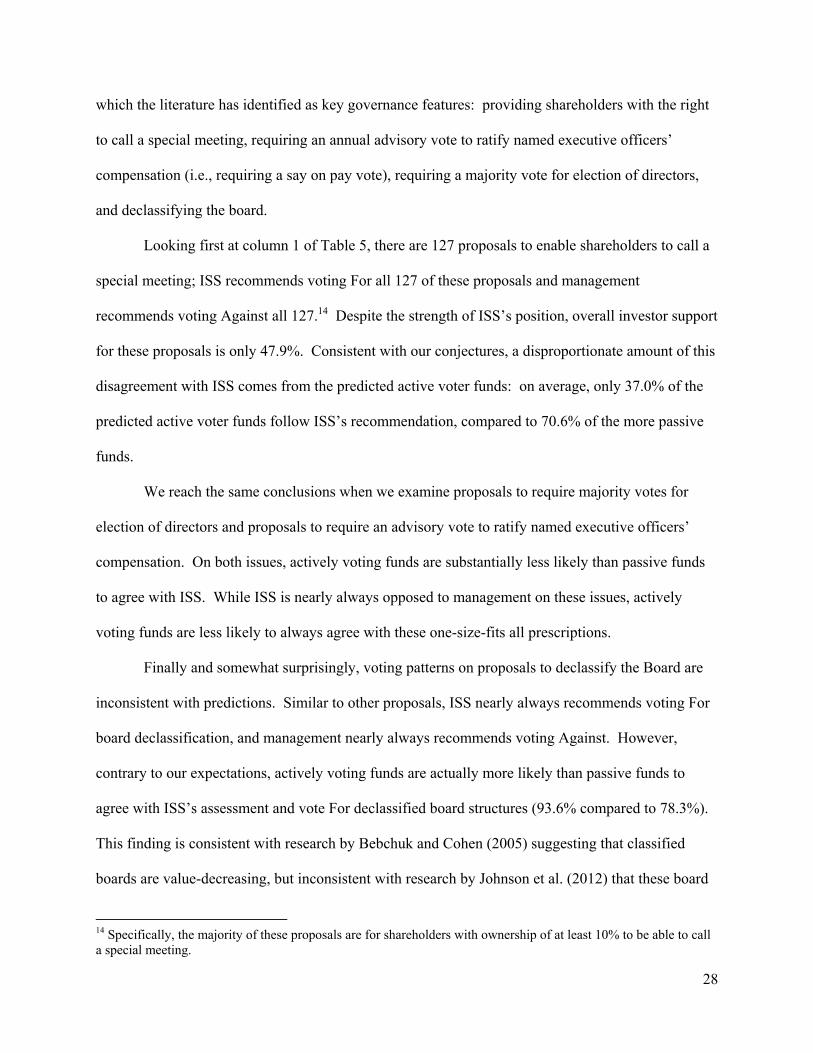
To further investigate the issue of blanket recommendations, Table 5 conducts a more in-
depth examination of four of these near-blanket recommendations. We focus on four shareholder
proposals on which ISS nearly always recommends voting in a direction opposite management and
28
which the literature has identified as key governance features: providing shareholders with the right
to call a special meeting, requiring an annual advisory vote to ratify named executive officers’
compensation (i.e., requiring a say on pay vote), requiring a majority vote for election of directors,
and declassifying the board.
Looking first at column 1 of Table 5, there are 127 proposals to enable shareholders to call a
special meeting; ISS recommends voting For all 127 of these proposals and management
recommends voting Against all 127.14 Despite the strength of ISS’s position, overall investor support
for these proposals is only 47.9%. Consistent with our conjectures, a disproportionate amount of this
disagreement with ISS comes from the predicted active voter funds: on average, only 37.0% of the
predicted active voter funds follow ISS’s recommendation, compared to 70.6% of the more passive
funds.
We reach the same conclusions when we examine proposals to require majority votes for
election of directors and proposals to require an advisory vote to ratify named executive officers’
compensation. On both issues, actively voting funds are substantially less likely than passive funds
to agree with ISS. While ISS is nearly always opposed to management on these issues, actively
voting funds are less likely to always agree with these one-size-fits all prescriptions.
Finally and somewhat surprisingly, voting patterns on proposals to declassify the Board are
inconsistent with predictions. Similar to other proposals, ISS nearly always recommends voting For
board declassification, and management nearly always recommends voting Against. However,
contrary to our expectations, actively voting funds are actually more likely than passive funds to
agree with ISS’s assessment and vote For declassified board structures (93.6% compared to 78.3%).
This finding is consistent with research by Bebchuk and Cohen (2005) suggesting that classified
boards are value-decreasing, but inconsistent with research by Johnson et al. (2012) that these board
14 Specifically, the majority of these proposals are for shareholders with ownership of at least 10% to be able to call a special meeting.
29
structures can be value-increasing in certain cases and also inconsistent with research by Bates,
Becher, and Lemmon (2008) who find little evidence that classified boards contribute to managerial
entrenchment.
In sum, our results provide some evidence that is consistent with allegations regarding ISS’s
issuance of blanket recommendations. There are clearly important issues on which ISS is
predisposed to recommending against management, and on many of these issues active voter mutual
funds are most likely to come to a different conclusion than ISS. However, on one issue that has
received considerable attention, classified boards, both actively voting funds and ISS appear to adopt
a near blanket approach.
6.2. Information environment of the firm
The availability of information varies widely across firms. Certain firms are generally
considered to be less transparent, making it more difficult to evaluate the firm and to assess the
optimality of the governance structure. This opacity may affect voting patterns in different ways.
First, mutual funds, including actively voting funds, may be more likely to conclude that the costs of
researching items up for vote in such companies are too high, and they may be more likely to follow
ISS. Alternatively, if actively voting funds continue to independently research the items up for vote
in such companies, the greater level of opacity may lead to a greater probability that ISS and these
funds observe different information sets and reach a different conclusion.
We empirically investigate these possibilities using a variety of proxies for firm opacity, for
example firm size and analyst dispersion. We regress fund votes (one if a fund votes with
management, zero otherwise) on the index of fund activism and this index interacted with the firm
uncertainty proxy (e.g., firm size or firm analyst dispersion). We also include the control variables
used in earlier tables. Conceptually, we are interested in the combined effects of mutual fund
activism, ISS recommendation, and firm uncertainty on a fund’s likelihood of voting with
30
management. Given the difficulty of interpreting such three-way interaction terms, we limit our
sample to those cases where ISS recommends Against management. As discussed earlier, this
sample should contain the cases that are characterized by the most disagreement regarding the
optimal course of action.
Results (not tabulated) provide little evidence that the divergence between ISS’s votes and
those of the actively voting mutual funds is related to firm opacity. The extent of disagreement is not
significantly related to firm size or analyst dispersion. For completeness, we also examine whether
the extent of disagreement is related to other firm characteristics, for example past returns, financial
leverage, and past governance. However, we similarly find no significant differences.
7. Relation between Fund Voting and Fund Investments
Our findings highlight the extent to which funds vary in their attention to portfolio firms’
governance. While many funds passively follow ISS, there are also many funds that appear to devote
considerable resources toward voting and frequently disagree with ISS. Given the overwhelming
impact that ISS recommendations have on vote outcomes, this raises the question of what funds do
when they reach a conclusion opposite to ISS. Specifically, are they more likely to sell shares? In a
related vein, it raises questions related to the benefits of investing resources in evaluating the
corporate governance of portfolio companies: do actively voting funds outperform passive funds?
Section 7.1 examines the relation between voting and subsequent ownership changes, and Section 7.2
investigates the link with performance.
7.1. Relation between voting and subsequent ownership changes
If a fund invests considerable resources and determines that a given governance attribute is
detrimental to performance, it will likely vote against implementation of such an attribute at the
annual meeting. However, if ISS reaches a different conclusion, there is a relatively small
31
probability that the vote outcome will go in the direction that the fund wishes. In such cases, are
funds more likely to decrease their shareholdings? Table 6 examines this issue. Specifically, we
examine the change in share holdings conditional on the fund reaching the same conclusion as ISS
versus a different conclusion.
For each fund, we calculate the percent of agenda items at each company meeting in which
the funds voted in a direction consistent with ISS, and we categorize each fund, company meeting
pair based on this percentage. There are 272,196 cases where the fund agrees with ISS on all issues
and 6,713 cases where ISS disagrees with ISS on all issues. Remaining observations are classified
into at least 50% agreement (91,601 cases) and less than 50% agreement (12,466 cases).
We collect shares held for each fund at the quarter immediately prior to the meeting and at
the quarter immediately following. We measure the change in share ownership as (shares held after
the vote – shares held before the vote) / (shares held before the vote). To mitigate the influence of
outliers, we winsorize this measure at the 0.5% level. Values lower than 0% indicate that the funds
reduced holdings in the portfolio firms, on average.15
Table 6 shows that the average change in fund ownership varies substantially across the four
categories. In cases where the fund agrees with ISS on all of the issues, the change in holdings
equals -3.14%. In comparison, among the cases where a fund disagrees with ISS on some, but less
than half of the agenda items, the funds are substantially more likely to divest shares: the average
fund decreases its holdings by 5.15%. Finally, within the subsample where the fund disagrees with
ISS on all issues, the funds decrease their holdings by 8.58%. For robustness, we have also
examined this issue in a multivariate framework. Specifically, we regress the change in a fund’s
ownership in a firm on a measure of a fund’s disagreement with ISS and fund- and firm-specific
characteristics. We employ two measures of disagreement with ISS: % of issues at a particular
15 By definition this measure is only calculated across the companies in which the fund owned some shares prior to the meeting; to the extent that funds buy shares in new companies during the quarter following the meeting, our measures will on average be less than 0%.
32
company meeting on which the fund votes in a direction opposite to the ISS recommendation, and a
dummy equal to one if the fund disagrees with ISS on more than 50% of the issues at a company
meeting. Fund- and firm-specific characteristics are similar to those used in earlier tables. Using
either specification, the measure of disagreement with ISS is significantly negatively related to
change in ownership the following quarter (results not tabulated).
In sum, the relation between fund votes and share ownership changes provides further
evidence that certain funds feel very strongly about the governance structures of the portfolio
companies. They are significantly more likely to sell shares of the portfolio companies whom they
perceive to be adopting or maintaining a governance structure that they perceive as value-destructive.
7.2. Relation between Fund Voting and Fund Returns
The relation between funds’ net benefits of voting and the tendency to follow ISS as well as
the relations between fund voting and share ownership changes suggest that certain funds invest
considerable resources evaluating the corporate governance structures of portfolio companies. In
contrast, other funds appear to indiscriminately follow ISS on all agenda items. Do funds that invest
resources in corporate governance earn a return on this investment? If in-depth evaluation of
companies’ corporate governance enables funds to make better investments, then the actively voting
mutual funds may earn higher returns. Alternatively, if the resources invested in corporate
governance are wasted, then we would expect the more actively voting mutual funds to earn lower
returns.
Table 7 examines this issue. We estimate four-factor regressions across different groups of
funds. Specifically, we place all mutual funds into terciles based on the percent of the time they vote
with ISS over our 2006 – 2010 sample period. We then calculate monthly net-of-fee returns to each
of these portfolios across the same period. Following Fama and French (1993) and Carhart (1997),
the portfolio returns minus the risk free rate are regressed on the market return minus the risk-free
33
rate (RMRF), returns on a portfolio of small firms minus returns on a portfolio of big firms (SMB),
returns on a high BM portfolio minus returns on a low BM portfolio (HML), and returns on a high
momentum portfolio minus returns on a low momentum portfolio (UMD).16 The alpha from this
regression represents a measure of abnormal performance.
Looking at Table 7, we see no evidence that the actively voting mutual funds are ‘wasting’
money through their in-depth evaluations of corporate governance. In fact, there is some suggestion
that these funds perform slightly better. The low-disagreement portfolio has an alpha of -0.07% (t-
statistic of -1.63), compared to an alpha of -0.04% (t- statistic of -0.80) on the high-disagreement
portfolio. Combining these two portfolios into a long-short portfolio, which is long in the high
disagreement funds and short in the low disagreement funds, yields an alpha of 0.04 (t-statistic =
1.19). While the alpha on the high minus low portfolio is not significant at conventional levels, we
note that the regression is estimated on only 60 observations, suggesting that low power may
contribute to this lack of significance. At a minimum, there is no evidence that high activism funds
would do better by passively following ISS.
8. Conclusion
Mutual funds have a fiduciary duty to vote their shares in the best interests of their
shareholders. While it is straight-forward to ascertain that a mutual fund is voting its shares, it is
generally less clear whether the fund’s vote reflects its own evaluation of what would be in the best
interests of the shareholders. We develop a simple model that demonstrates that funds will
optimally follow the recommendation of an informed advisor unless they possess superior
information. Consistent with this intuition, we find that certain types of mutual funds are
16 Results are robust to estimating calendar portfolio returns using daily returns and to using either the four-factor model or the seven-factor model suggested by Cremers, Patajisto, and Zitzewitz (2012).
34
systematically more likely to use their own information, rather than indiscriminately following the
recommendations of a proxy advisory service company.
The variation in funds’ attention to these corporate governance-related agenda items up for
vote is driven by the costs and benefits of actively voting. Funds rationally assess the net benefits of
voting, and only devote the necessary resources to make an informed vote when these net benefits are
sufficiently large. We find that the funds with stronger incentives to actively vote are significantly
less likely to passively follow the advice of ISS.
Our findings emphasize that mandating shareholder participation, for example through
voting, can have unforeseen consequences. In particular, the mandating of voting results in proxy
advisory service firms controlling a large block of voting power and commanding a large influence
on governance practices within firms. As a result, the opinion of ISS will be overrepresented relative
to the opinions of other informed entities, for example actively voting mutual funds. We find that
funds that disagree with ISS recommendations on a given company are disproportionately likely to
sell their shares in that company following the vote.
References
Adams, R., Hermalin, B., Weisbach, M., 2010. The role of boards of directors in corporate
governance: a conceptual framework and survey. Journal of Economic Literature 48, 58-107.
Aggarwal, R., Saffi, P., Sturgess, J., 2012. The role of institutional investors in voting: evidence
from the securities lending market. Working paper.
Ai, C., Norton, E., 2003. Interaction terms in logit and probit models. Economic Letters 80, 123-129.
Armstrong, C., Gow, I., Larcker, D., 2012. The efficacy of shareholder voting: evidence from
equity compensation plans. Working paper.
Bates, T., Becher, D., Lemmon, M., 2008. Board classification and managerial entrenchment:
evidence from the market for corporate control. Journal of Financial Economics 87, 656-677.
Bebchuk, L., Cohen, A., 2005. The costs of entrenched boards. Journal of Financial Economics 78,
409-433.
Becker, B., Ivkovic, Z., Weisbenner, S., 2011. Local dividend clienteles. Journal of Finance 66, 655-
684.
Bethel, L., Gillan, S., 2002. The impact of the institutional and regulatory environment on
shareholder voting. Financial Management 31, 29-54.
Bikhchandani, S., Hirshleifer, D., Welch, I., 1992. A theory of fads, fashion, custom, and cultural
change as informational cascades. Journal of Political Economy 1992, 992 – 1026.
Boknaruk, A., Ostberg, P., 2012. The shareholder base and payout policy. Working paper.
Brav, A., Jiang, W., Partnoy, F., Thomas, R., 2008. Hedge fund activism, corporate governance, and
firm performance. Journal of Finance 63, 1729-1775.
Bushee, B., 1998. The Influence of Institutional Investors on Myopic R&D Investment Behavior.
Accounting Review 73, 305-333.
Cai, J., Garner, J., Walkling, R., 2009. Electing directors. Journal of Finance 64, 2389 – 2420.
Carhart, M., 1997. On persistence of mutual fund performance. Journal of Finance 52, 57-82.
Choi, S., Fisch, J., Kahan, M., 2012. Voting through agents: how mutual funds vote on director
elections. Working paper.
Chou, J., Ng, L., Wang, Q., 2013. Are Better Governed Funds Better Monitors? Journal of Corporate
Finance, Forthcoming.
Coles, J., Daniel, N., Naveen, L., 2008. Boards: does one size fit all? Journal of Financial
Economics 87, 329-356.
Cremers, M., Petajisto, A., Zitzewitz, E., 2012. Should benchmark indices have alpha? Revisiting
performance evaluation, Critical Finance Review, forthcoming.
Cunat, V., Gine, M., Guadalupe, M., 2012. The vote is cast: the effect of corporate governance on
shareholder value. Journal of Finance, forthcoming.
Davis, G., Kim, E., 2007. Business Ties and Proxy Voting by Mutual Funds. Journal of Financial
Economics, 85, 552-570.
Daines, R., Gow, I., Larcker, D., 2010. Rating the ratings: how good are commercial governance
ratings? Journal of Financial Economics 98, 489-461.
Duan, Y., Jiao, Y., 2011. The Role of Mutual Funds in Corporate Governance: Evidence from
Mutual Funds’ Proxy Voting and Trading Behavior. Working paper.
Ertimur, Y., Ferri, F., Oesch, D., 2012. Shareholder votes and proxy advisors: evidence form say on
pay. Working paper.
Fama, E., French, K., 1993. Common risk factors in the returns on stocks and bonds. Journal of
Financial Economics 33, 3-56.
Fischer, P., Gramlich, J., Miller, B., White, H., 2009. Investor Perceptions of board performance:
evidence from uncontested director elections. Journal of Accounting and Economics 48,
172-189.
Gompers, P., Iishi, J., Metrick, A., 2003. Corporate governance and equity prices. Quarterly Journal
of Economics 118, 107-155.
Greene, W., 2010. Testing hypotheses about interaction terms in nonlinear models. Economic Letters
107, 291-296.
Helwege, J., Intintoli, V., Zhang, A., 2012. Voting with their feet or activism? Institutional
investors’ impact on CEO turnover. Journal of Corporate Finance 18, 22-37.
Hong, H., Kubik, J., Stein, J., 2005. Thy neighbor’s portfolio : word-of-mouth effects in the
holdings and trades of money managers. Journal of Finance 60, 2801 – 2824.
Iliev, P., Lins, K., Miller, D., Roth, L., 2012. Shareholder voting and corporate governance around
the world. Working paper.
Johnson, W., Karpoff, J., Yi, S., 2012. Why do IPO firms have takeover defenses? Working paper.
Kacperczyk, M., Sialm, C., Zheng, L., 2005. On the industry concentration of actively managed
equity mutual funds. Journal of Finance 60, 1983-2011.
Kaiser, H. F. (1960). The application of electronic computers to factor analysis. Educational and
Psychological Measurement, 20, 141-151.
Larcker, D.., McCall, A., Ormazabal, G., 2012. The Economic Consequences of Proxy Advisor Say-
on-Pay Voting Policies. Stanford Graduate School of Business Research Paper No. 2105.
Matvos, G., Ostrovsky, M., 2010. Heterogeneity and peer effects in mutual fund proxy voting.
Journal of Financial Economics 98, 90-112.
McCahery, J., Sautner, Z., Starks, L., 2011. Behind the scenes: the corporate governance
preferences of institutional investors. Working paper.
Morgan, A., Poulsen, A., Wolf, J., Yang, T., 2011. Mutual funds as monitors: evidence from mutual
fund voting. Journal of Corporate Finance 17, 914-928.
Parrino, R., Sias, R., Starks, L., 2003. Voting with their feet: institutional ownership changes around
forced CEO turnover. Journal of Financial Economics 68, 3-46.
Schoar, A., Washington E., 2011. Are the seeds of bad governance sown in good times? Working
paper.
Yermack, D., 2010. Shareholder voting and corporate governance. Annual Review of Financial
Economics 2, 103-125.
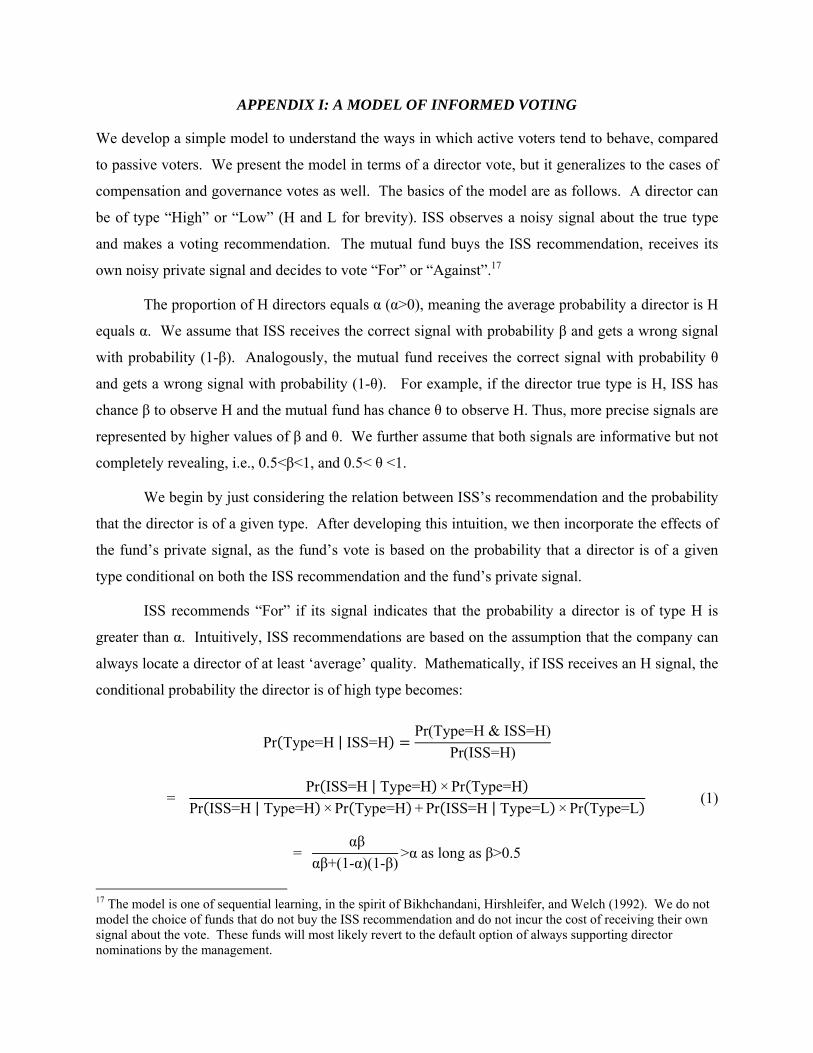
APPENDIX I: A MODEL OF INFORMED VOTING
We develop a simple model to understand the ways in which active voters tend to behave, compared
to passive voters. We present the model in terms of a director vote, but it generalizes to the cases of
compensation and governance votes as well. The basics of the model are as follows. A director can
be of type “High” or “Low” (H and L for brevity). ISS observes a noisy signal about the true type
and makes a voting recommendation. The mutual fund buys the ISS recommendation, receives its
own noisy private signal and decides to vote “For” or “Against”.17
The proportion of H directors equals α (α>0), meaning the average probability a director is H
equals α. We assume that ISS receives the correct signal with probability β and gets a wrong signal
with probability (1-β). Analogously, the mutual fund receives the correct signal with probability θ
and gets a wrong signal with probability (1-θ). For example, if the director true type is H, ISS has
chance β to observe H and the mutual fund has chance θ to observe H. Thus, more precise signals are
represented by higher values of β and θ. We further assume that both signals are informative but not
completely revealing, i.e., 0.5<β<1, and 0.5< θ <1.
We begin by just considering the relation between ISS’s recommendation and the probability
that the director is of a given type. After developing this intuition, we then incorporate the effects of
the fund’s private signal, as the fund’s vote is based on the probability that a director is of a given
type conditional on both the ISS recommendation and the fund’s private signal.
ISS recommends “For” if its signal indicates that the probability a director is of type H is
greater than α. Intuitively, ISS recommendations are based on the assumption that the company can
always locate a director of at least ‘average’ quality. Mathematically, if ISS receives an H signal, the
conditional probability the director is of high type becomes:
Pr Type=H | ISS=HPr(Type=H & ISS=H)
Pr(ISS=H)
= Pr ISS=H | Type=H × Pr Type=H
Pr ISS=H | Type=H × Pr Type=H + Pr ISS=H | Type=L × Pr Type=L (1)
= αβ
αβ+(1-α)(1-β)>α as long as β>0.5
17 The model is one of sequential learning, in the spirit of Bikhchandani, Hirshleifer, and Welch (1992). We do not model the choice of funds that do not buy the ISS recommendation and do not incur the cost of receiving their own signal about the vote. These funds will most likely revert to the default option of always supporting director nominations by the management.
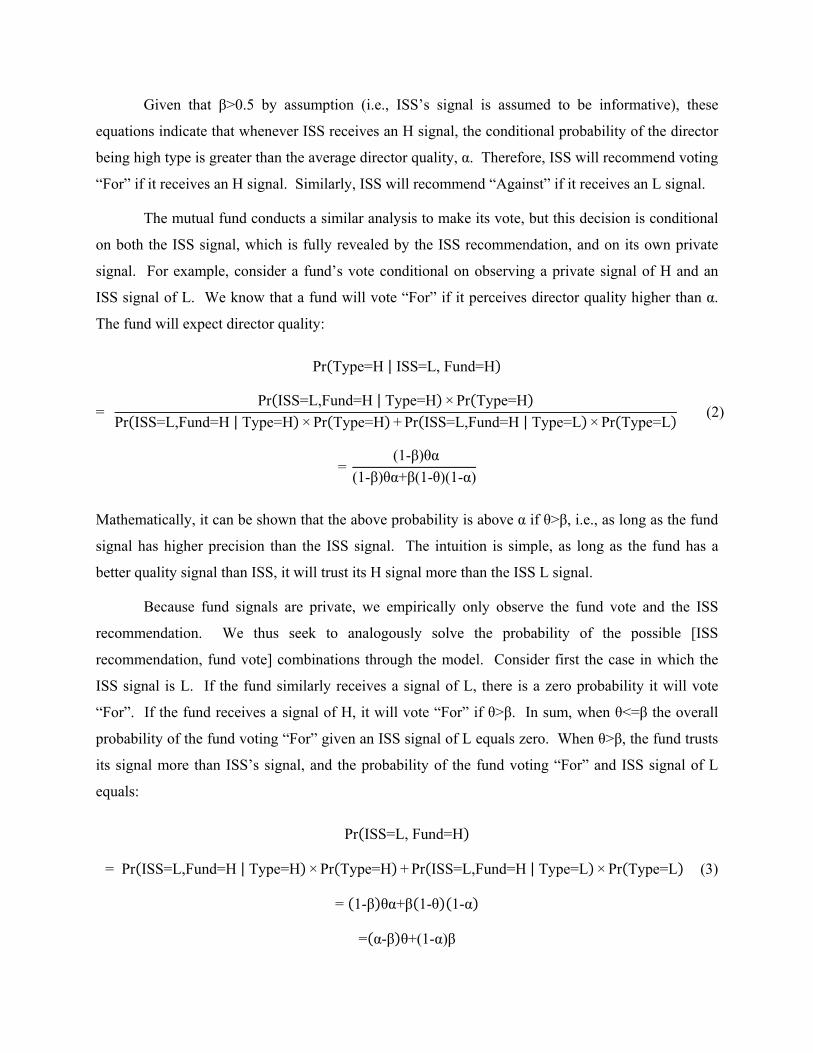
Given that β>0.5 by assumption (i.e., ISS’s signal is assumed to be informative), these
equations indicate that whenever ISS receives an H signal, the conditional probability of the director
being high type is greater than the average director quality, α. Therefore, ISS will recommend voting
“For” if it receives an H signal. Similarly, ISS will recommend “Against” if it receives an L signal.
The mutual fund conducts a similar analysis to make its vote, but this decision is conditional
on both the ISS signal, which is fully revealed by the ISS recommendation, and on its own private
signal. For example, consider a fund’s vote conditional on observing a private signal of H and an
ISS signal of L. We know that a fund will vote “For” if it perceives director quality higher than α.
The fund will expect director quality:
Pr Type=H | ISS=L, Fund=H
= Pr ISS=L,Fund=H | Type=H × Pr Type=H
Pr ISS=L,Fund=H | Type=H × Pr Type=H + Pr ISS=L,Fund=H | Type=L × Pr Type=L (2)
= (1-β)θα
(1-β)θα+β(1-θ)(1-α)
Mathematically, it can be shown that the above probability is above α if θ>β, i.e., as long as the fund
signal has higher precision than the ISS signal. The intuition is simple, as long as the fund has a
better quality signal than ISS, it will trust its H signal more than the ISS L signal.
Because fund signals are private, we empirically only observe the fund vote and the ISS
recommendation. We thus seek to analogously solve the probability of the possible [ISS
recommendation, fund vote] combinations through the model. Consider first the case in which the
ISS signal is L. If the fund similarly receives a signal of L, there is a zero probability it will vote
“For”. If the fund receives a signal of H, it will vote “For” if θ>β. In sum, when θ<=β the overall
probability of the fund voting “For” given an ISS signal of L equals zero. When θ>β, the fund trusts
its signal more than ISS’s signal, and the probability of the fund voting “For” and ISS signal of L
equals:
Pr ISS=L, Fund=H
= Pr ISS=L,Fund=H | Type=H × Pr Type=H + Pr ISS=L,Fund=H | Type=L × Pr Type=L (3)
= 1-β θα+β 1-θ 1-α
= α-β θ+(1-α)β
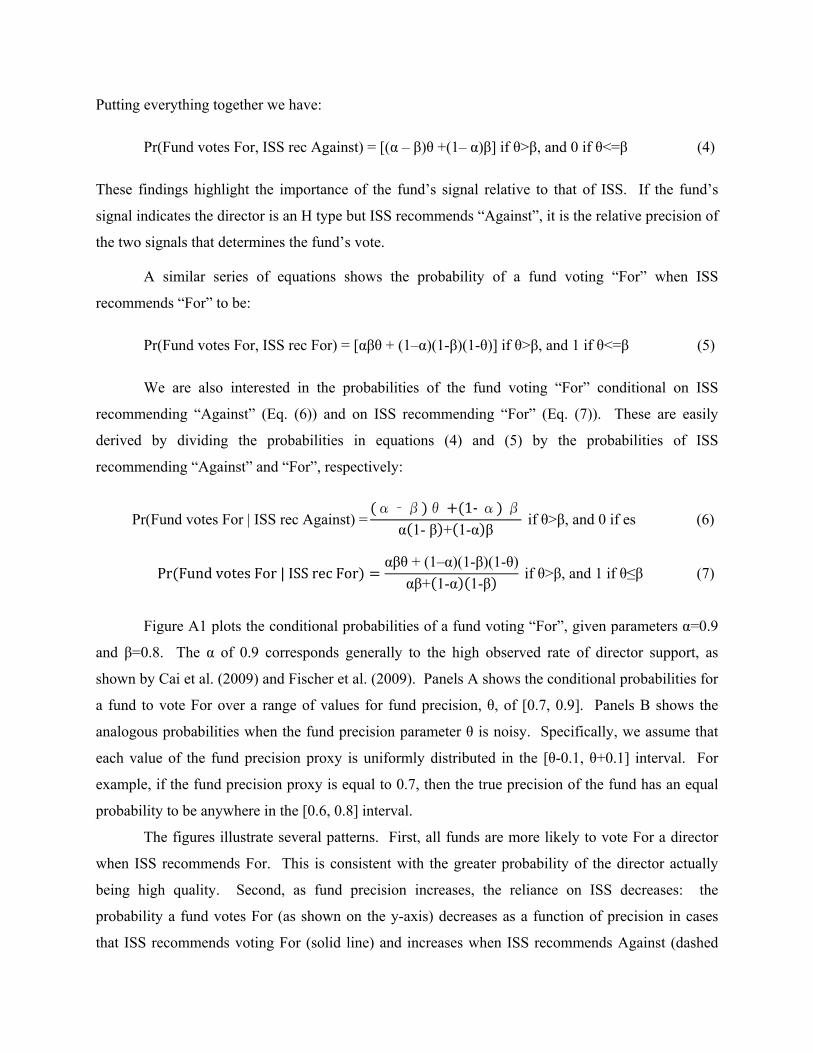
Putting everything together we have:
Pr(Fund votes For, ISS rec Against) = [(α – β)θ +(1– α)β] if θ>β, and 0 if θ<=β (4)
These findings highlight the importance of the fund’s signal relative to that of ISS. If the fund’s
signal indicates the director is an H type but ISS recommends “Against”, it is the relative precision of
the two signals that determines the fund’s vote.
A similar series of equations shows the probability of a fund voting “For” when ISS
recommends “For” to be:
Pr(Fund votes For, ISS rec For) = [αβθ + (1–α)(1-β)(1-θ)] if θ>β, and 1 if θ<=β (5)
We are also interested in the probabilities of the fund voting “For” conditional on ISS
recommending “Against” (Eq. (6)) and on ISS recommending “For” (Eq. (7)). These are easily
derived by dividing the probabilities in equations (4) and (5) by the probabilities of ISS
recommending “Against” and “For”, respectively:
Pr(Fund votes For | ISS rec Against) =α–β θ 1‐α β
α 1- β + 1-α β if θ>β, and 0 if es (6)
Pr FundvotesFor|ISSrecForαβθ + (1–α)(1-β)(1-θ)
αβ+ 1-α 1-βif θ>β, and 1 if θ≤β (7)
Figure A1 plots the conditional probabilities of a fund voting “For”, given parameters α=0.9
and β=0.8. The α of 0.9 corresponds generally to the high observed rate of director support, as
shown by Cai et al. (2009) and Fischer et al. (2009). Panels A shows the conditional probabilities for
a fund to vote For over a range of values for fund precision, θ, of [0.7, 0.9]. Panels B shows the
analogous probabilities when the fund precision parameter θ is noisy. Specifically, we assume that
each value of the fund precision proxy is uniformly distributed in the [θ-0.1, θ+0.1] interval. For
example, if the fund precision proxy is equal to 0.7, then the true precision of the fund has an equal
probability to be anywhere in the [0.6, 0.8] interval.
The figures illustrate several patterns. First, all funds are more likely to vote For a director
when ISS recommends For. This is consistent with the greater probability of the director actually
being high quality. Second, as fund precision increases, the reliance on ISS decreases: the
probability a fund votes For (as shown on the y-axis) decreases as a function of precision in cases
that ISS recommends voting For (solid line) and increases when ISS recommends Against (dashed
line). Put differently, the narrowing distance between the two lines represents a decrease in higher
precision funds’ tendencies to follow ISS’s recommendation.
The main implication from the model can be thought of as a type of information cascade,
where funds with lower precision than the ISS signal (θ<β) always vote in accordance with ISS.
Defining an “actively voting fund” as a fund with higher precision than ISS and a “passive fund” as a
fund with lower precision than ISS, the model predicts that actively voting funds will disagree with
ISS more often than passive funds.
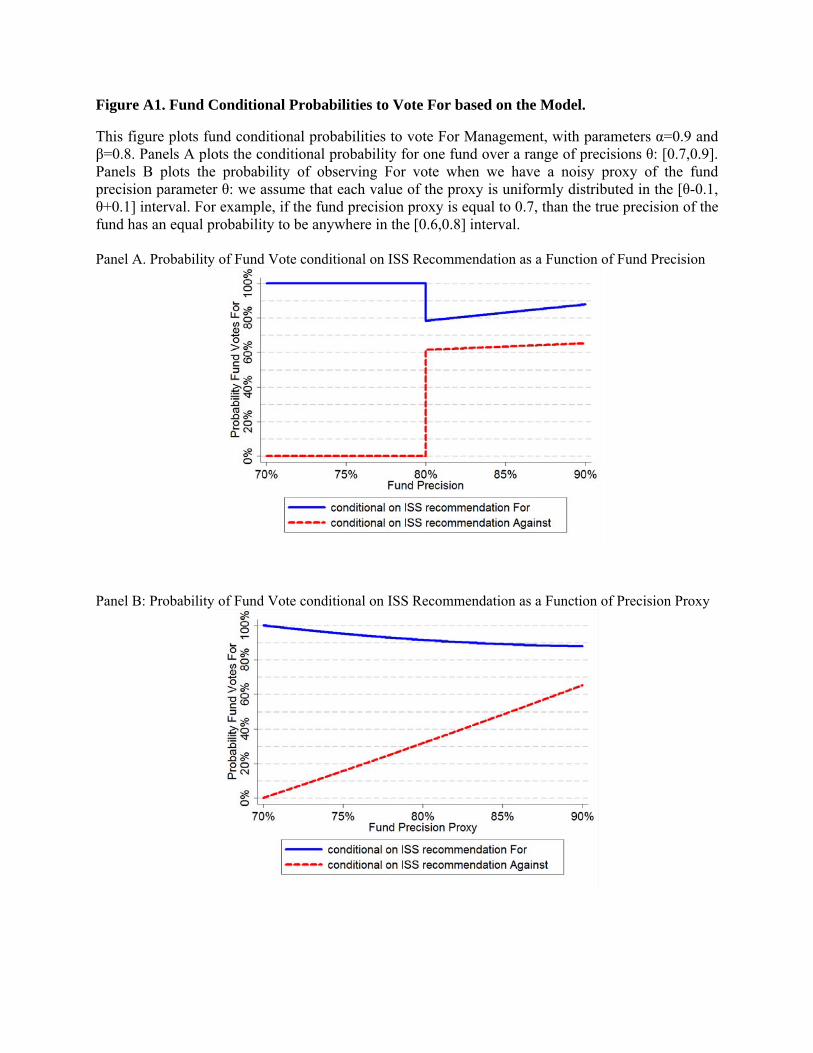
Figure A1. Fund Conditional Probabilities to Vote For based on the Model.
This figure plots fund conditional probabilities to vote For Management, with parameters α=0.9 and β=0.8. Panels A plots the conditional probability for one fund over a range of precisions θ: [0.7,0.9]. Panels B plots the probability of observing For vote when we have a noisy proxy of the fund precision parameter θ: we assume that each value of the proxy is uniformly distributed in the [θ-0.1, θ+0.1] interval. For example, if the fund precision proxy is equal to 0.7, than the true precision of the fund has an equal probability to be anywhere in the [0.6,0.8] interval. Panel A. Probability of Fund Vote conditional on ISS Recommendation as a Function of Fund Precision
Panel B: Probability of Fund Vote conditional on ISS Recommendation as a Function of Precision Proxy
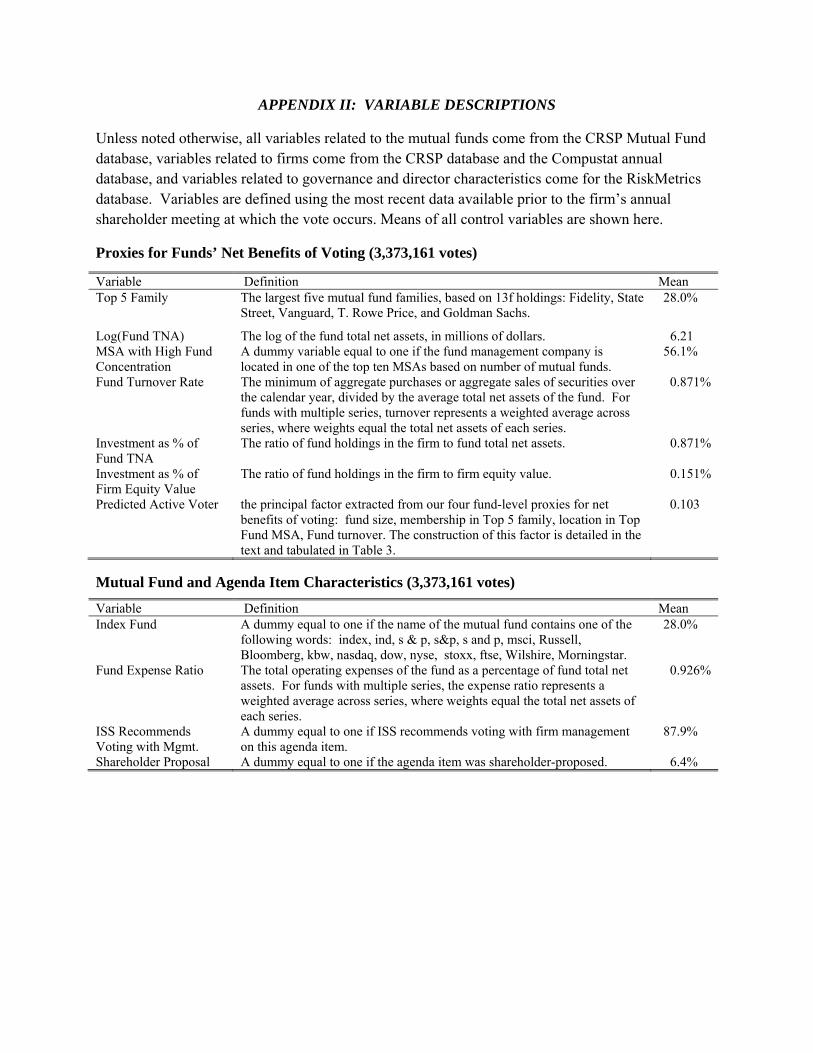
APPENDIX II: VARIABLE DESCRIPTIONS
Unless noted otherwise, all variables related to the mutual funds come from the CRSP Mutual Fund database, variables related to firms come from the CRSP database and the Compustat annual database, and variables related to governance and director characteristics come for the RiskMetrics database. Variables are defined using the most recent data available prior to the firm’s annual shareholder meeting at which the vote occurs. Means of all control variables are shown here.
Proxies for Funds’ Net Benefits of Voting (3,373,161 votes)
Variable Definition Mean Top 5 Family The largest five mutual fund families, based on 13f holdings: Fidelity, State
Street, Vanguard, T. Rowe Price, and Goldman Sachs. 28.0%
Log(Fund TNA) The log of the fund total net assets, in millions of dollars. 6.21 MSA with High Fund Concentration
A dummy variable equal to one if the fund management company is located in one of the top ten MSAs based on number of mutual funds.
56.1%
Fund Turnover Rate The minimum of aggregate purchases or aggregate sales of securities over the calendar year, divided by the average total net assets of the fund. For funds with multiple series, turnover represents a weighted average across series, where weights equal the total net assets of each series.
0.871%
Investment as % of Fund TNA
The ratio of fund holdings in the firm to fund total net assets. 0.871%
Investment as % of Firm Equity Value
The ratio of fund holdings in the firm to firm equity value. 0.151%
Predicted Active Voter the principal factor extracted from our four fund-level proxies for net benefits of voting: fund size, membership in Top 5 family, location in Top Fund MSA, Fund turnover. The construction of this factor is detailed in the text and tabulated in Table 3.
0.103
Mutual Fund and Agenda Item Characteristics (3,373,161 votes)
Variable Definition Mean Index Fund A dummy equal to one if the name of the mutual fund contains one of the
following words: index, ind, s & p, s&p, s and p, msci, Russell, Bloomberg, kbw, nasdaq, dow, nyse, stoxx, ftse, Wilshire, Morningstar.
28.0%
Fund Expense Ratio The total operating expenses of the fund as a percentage of fund total net assets. For funds with multiple series, the expense ratio represents a weighted average across series, where weights equal the total net assets of each series.
0.926%
ISS Recommends Voting with Mgmt.
A dummy equal to one if ISS recommends voting with firm management on this agenda item.
87.9%
Shareholder Proposal A dummy equal to one if the agenda item was shareholder-proposed. 6.4%
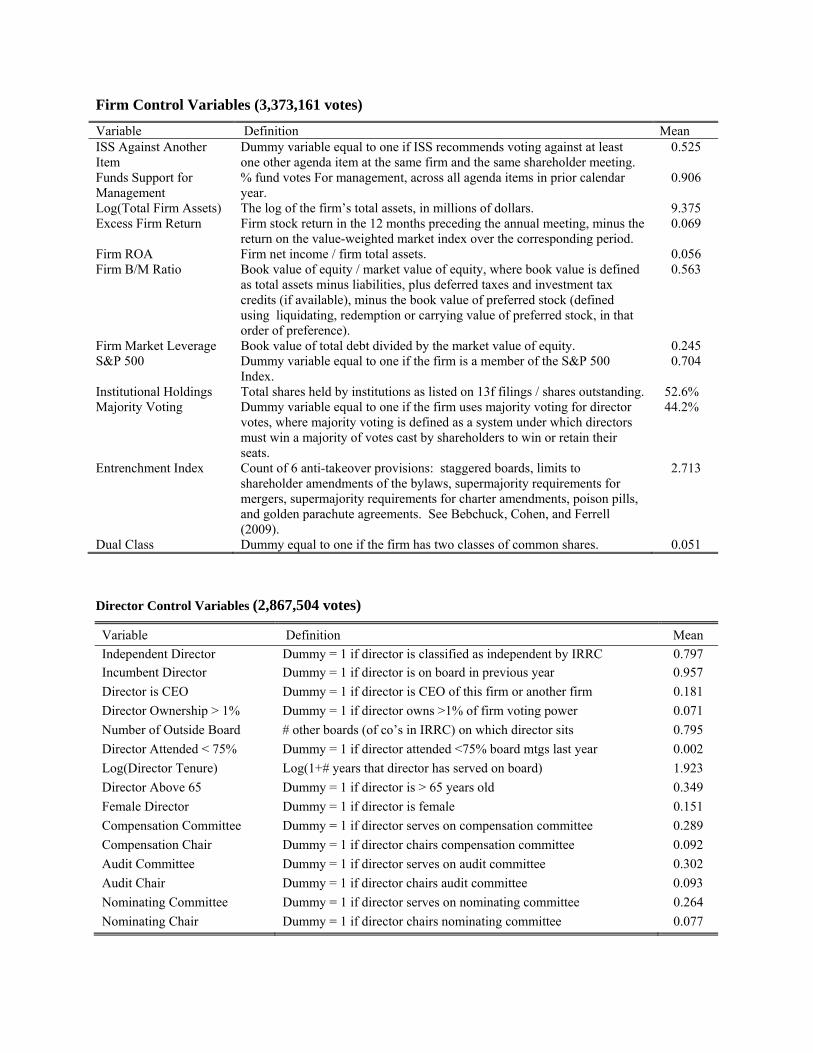
Firm Control Variables (3,373,161 votes)
Variable Definition Mean ISS Against Another Item
Dummy variable equal to one if ISS recommends voting against at least one other agenda item at the same firm and the same shareholder meeting.
0.525
Funds Support for Management
% fund votes For management, across all agenda items in prior calendar year.
0.906
Log(Total Firm Assets) The log of the firm’s total assets, in millions of dollars. 9.375 Excess Firm Return Firm stock return in the 12 months preceding the annual meeting, minus the
return on the value-weighted market index over the corresponding period. 0.069
Firm ROA Firm net income / firm total assets. 0.056 Firm B/M Ratio Book value of equity / market value of equity, where book value is defined
as total assets minus liabilities, plus deferred taxes and investment tax credits (if available), minus the book value of preferred stock (defined using liquidating, redemption or carrying value of preferred stock, in that order of preference).
0.563
Firm Market Leverage Book value of total debt divided by the market value of equity. 0.245 S&P 500 Dummy variable equal to one if the firm is a member of the S&P 500
Index. 0.704
Institutional Holdings Total shares held by institutions as listed on 13f filings / shares outstanding. 52.6% Majority Voting Dummy variable equal to one if the firm uses majority voting for director
votes, where majority voting is defined as a system under which directors must win a majority of votes cast by shareholders to win or retain their seats.
44.2%
Entrenchment Index Count of 6 anti-takeover provisions: staggered boards, limits to shareholder amendments of the bylaws, supermajority requirements for mergers, supermajority requirements for charter amendments, poison pills, and golden parachute agreements. See Bebchuck, Cohen, and Ferrell (2009).
2.713
Dual Class Dummy equal to one if the firm has two classes of common shares. 0.051
Director Control Variables (2,867,504 votes)
Variable Definition Mean
Independent Director Dummy = 1 if director is classified as independent by IRRC 0.797 Incumbent Director Dummy = 1 if director is on board in previous year 0.957
Director is CEO Dummy = 1 if director is CEO of this firm or another firm 0.181
Director Ownership > 1% Dummy = 1 if director owns >1% of firm voting power 0.071
Number of Outside Board # other boards (of co’s in IRRC) on which director sits 0.795
Director Attended < 75% Dummy = 1 if director attended <75% board mtgs last year 0.002
Log(Director Tenure) Log(1+# years that director has served on board) 1.923
Director Above 65 Dummy = 1 if director is > 65 years old 0.349
Female Director Dummy = 1 if director is female 0.151
Compensation Committee Dummy = 1 if director serves on compensation committee 0.289
Compensation Chair Dummy = 1 if director chairs compensation committee 0.092
Audit Committee Dummy = 1 if director serves on audit committee 0.302
Audit Chair Dummy = 1 if director chairs audit committee 0.093
Nominating Committee Dummy = 1 if director serves on nominating committee 0.264
Nominating Chair Dummy = 1 if director chairs nominating committee 0.077
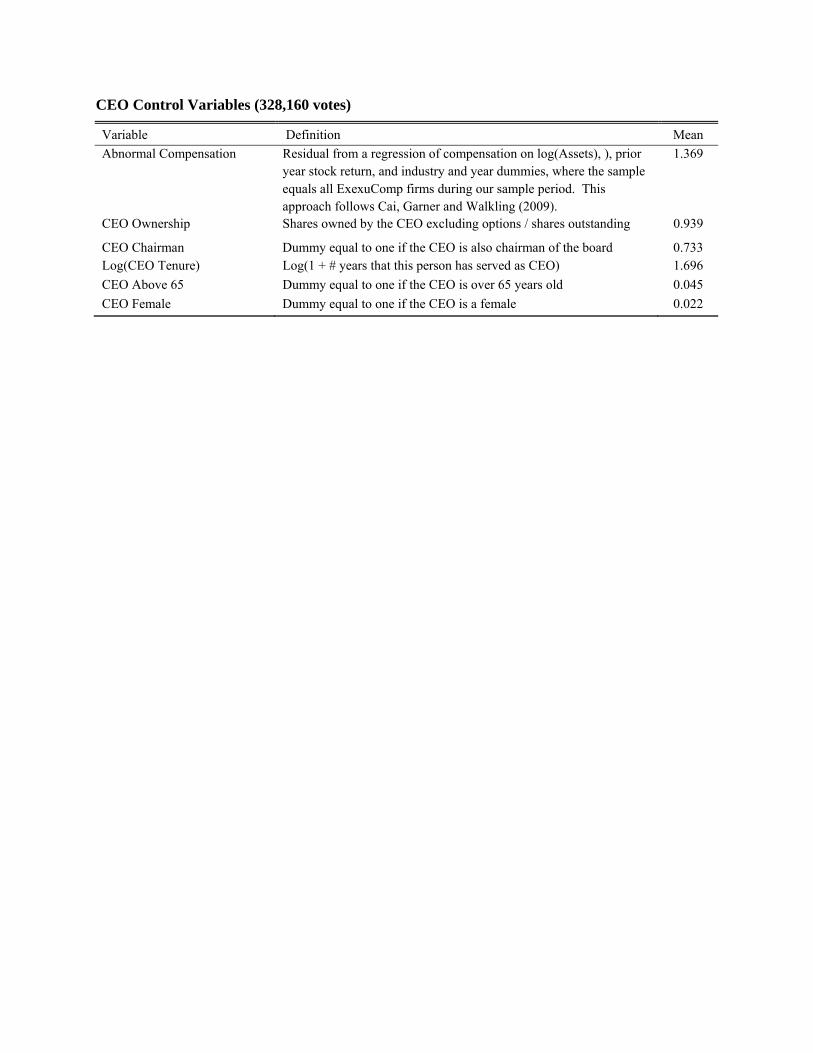
CEO Control Variables (328,160 votes)
Variable Definition Mean
Abnormal Compensation Residual from a regression of compensation on log(Assets), ), prior year stock return, and industry and year dummies, where the sample equals all ExexuComp firms during our sample period. This approach follows Cai, Garner and Walkling (2009).
1.369
CEO Ownership Shares owned by the CEO excluding options / shares outstanding 0.939
CEO Chairman Dummy equal to one if the CEO is also chairman of the board 0.733 Log(CEO Tenure) Log(1 + # years that this person has served as CEO) 1.696
CEO Above 65 Dummy equal to one if the CEO is over 65 years old 0.045
CEO Female Dummy equal to one if the CEO is a female 0.022
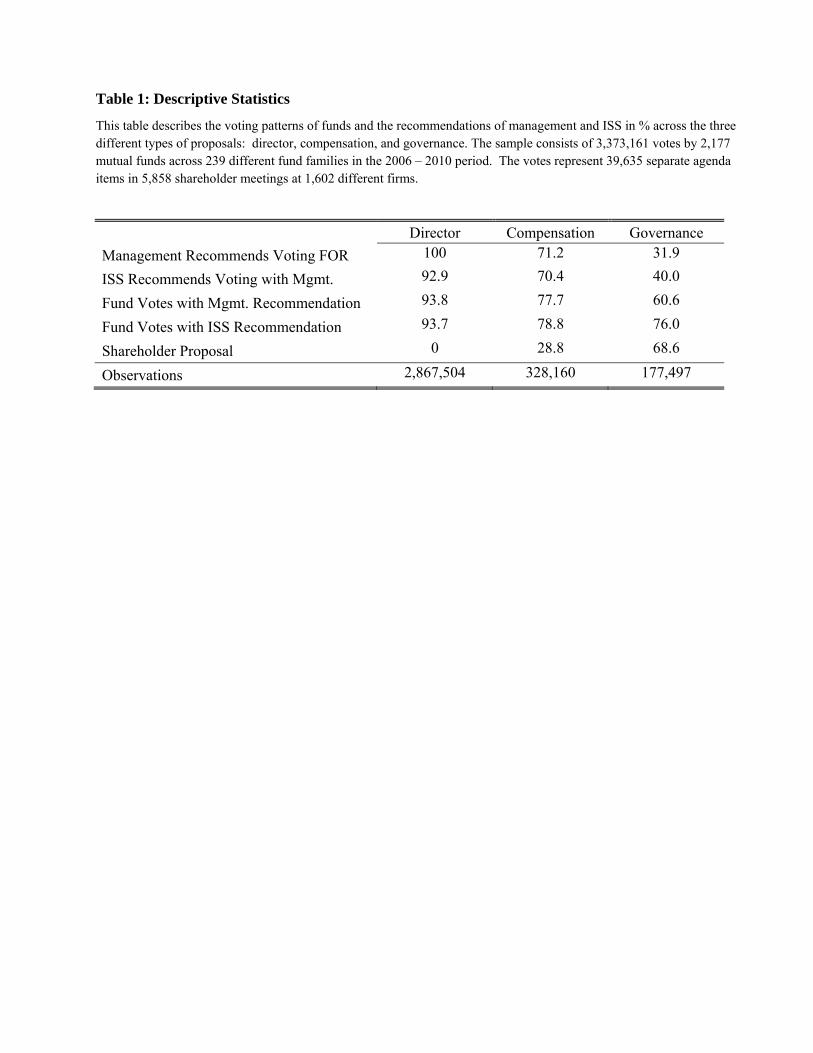
Table 1: Descriptive Statistics
This table describes the voting patterns of funds and the recommendations of management and ISS in % across the three different types of proposals: director, compensation, and governance. The sample consists of 3,373,161 votes by 2,177 mutual funds across 239 different fund families in the 2006 – 2010 period. The votes represent 39,635 separate agenda items in 5,858 shareholder meetings at 1,602 different firms.
Director Compensation Governance
Management Recommends Voting FOR 100 71.2 31.9
ISS Recommends Voting with Mgmt. 92.9 70.4 40.0
Fund Votes with Mgmt. Recommendation 93.8 77.7 60.6
Fund Votes with ISS Recommendation 93.7 78.8 76.0
Shareholder Proposal 0 28.8 68.6
Observations 2,867,504 328,160 177,497

Table 2: Percent of funds voting with ISS rec., based on funds’ net benefits of informed voting
To compare funds with high versus low net benefits of informed voting, this table shows the percent of funds in each group to vote with ISS in more than 99% of cases between 2006 – 2010. We require at least 10 votes per fund. Proxies for high net benefits of voting are: Top 5 Family, above-median fund TNA, located in an MSA with above-median fund concentration and funds with below-median turnover. Funds not belonging to each of these groups are considered to have low net benefits of voting. Variables are defined in more detail in Appendix II. Asterisks denote that the difference between the high and low net benefits of voting groups are significantly different from zero at the 1% (***), 5% (**), or 10% (*) levels.
% of Funds following ISS recommendation
Measure of HIGH Net Benefits of Informed Voting High Group Low Group Difference
Fund is in a Top 5 Family 4.0 29.0 -25.0***
High Total Net Assets Fund 17.6 31.1 -13.5***
Fund in MSA with High Fund Concentration 19.8 32.6 -12.8***
Low Turnover Rate Fund 21.1 29.7 -8.6***
High Predicted Active Voter (Factor Analysis) 12.5 33.1 -20.6***
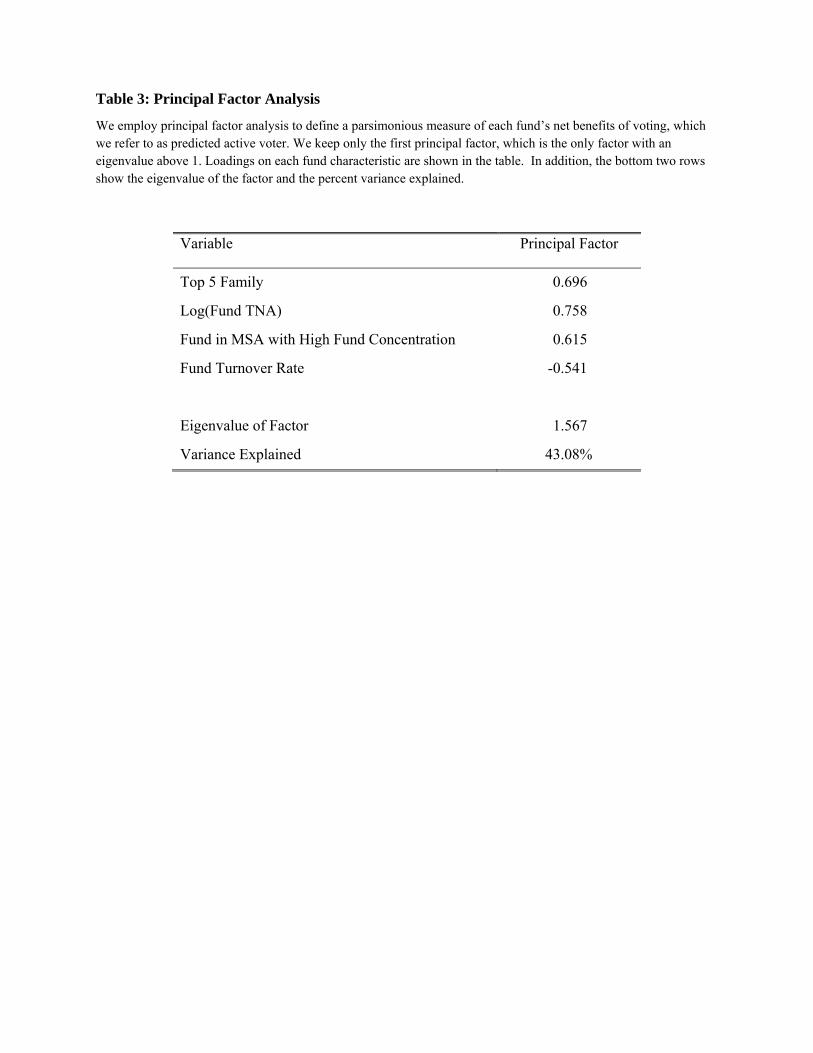
Table 3: Principal Factor Analysis
We employ principal factor analysis to define a parsimonious measure of each fund’s net benefits of voting, which we refer to as predicted active voter. We keep only the first principal factor, which is the only factor with an eigenvalue above 1. Loadings on each fund characteristic are shown in the table. In addition, the bottom two rows show the eigenvalue of the factor and the percent variance explained.
Variable Principal Factor
Top 5 Family 0.696
Log(Fund TNA) 0.758
Fund in MSA with High Fund Concentration 0.615
Fund Turnover Rate -0.541
Eigenvalue of Factor 1.567
Variance Explained 43.08%
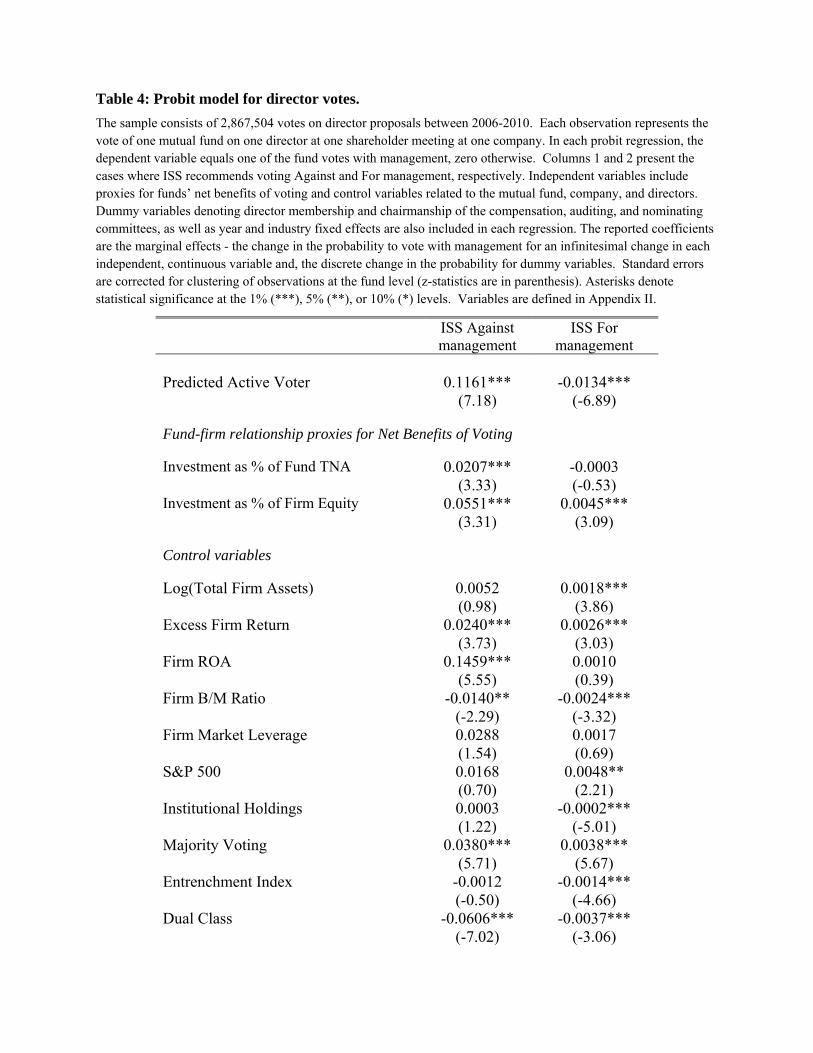
Table 4: Probit model for director votes.
The sample consists of 2,867,504 votes on director proposals between 2006-2010. Each observation represents the vote of one mutual fund on one director at one shareholder meeting at one company. In each probit regression, the dependent variable equals one of the fund votes with management, zero otherwise. Columns 1 and 2 present the cases where ISS recommends voting Against and For management, respectively. Independent variables include proxies for funds’ net benefits of voting and control variables related to the mutual fund, company, and directors. Dummy variables denoting director membership and chairmanship of the compensation, auditing, and nominating committees, as well as year and industry fixed effects are also included in each regression. The reported coefficients are the marginal effects - the change in the probability to vote with management for an infinitesimal change in each independent, continuous variable and, the discrete change in the probability for dummy variables. Standard errors are corrected for clustering of observations at the fund level (z-statistics are in parenthesis). Asterisks denote statistical significance at the 1% (***), 5% (**), or 10% (*) levels. Variables are defined in Appendix II.
ISS Against management
ISS For management
Predicted Active Voter 0.1161***
(7.18) -0.0134***
(-6.89)
Fund-firm relationship proxies for Net Benefits of Voting
Investment as % of Fund TNA 0.0207*** (3.33)
-0.0003 (-0.53)
Investment as % of Firm Equity 0.0551*** (3.31)
0.0045*** (3.09)
Control variables
Log(Total Firm Assets) 0.0052 (0.98)
0.0018*** (3.86)
Excess Firm Return 0.0240*** (3.73)
0.0026*** (3.03)
Firm ROA 0.1459*** (5.55)
0.0010 (0.39)
Firm B/M Ratio -0.0140** (-2.29)
-0.0024*** (-3.32)
Firm Market Leverage 0.0288 (1.54)
0.0017 (0.69)
S&P 500 0.0168 (0.70)
0.0048** (2.21)
Institutional Holdings 0.0003 (1.22)
-0.0002*** (-5.01)
Majority Voting 0.0380*** (5.71)
0.0038*** (5.67)
Entrenchment Index -0.0012 (-0.50)
-0.0014*** (-4.66)
Dual Class -0.0606*** (-7.02)
-0.0037*** (-3.06)
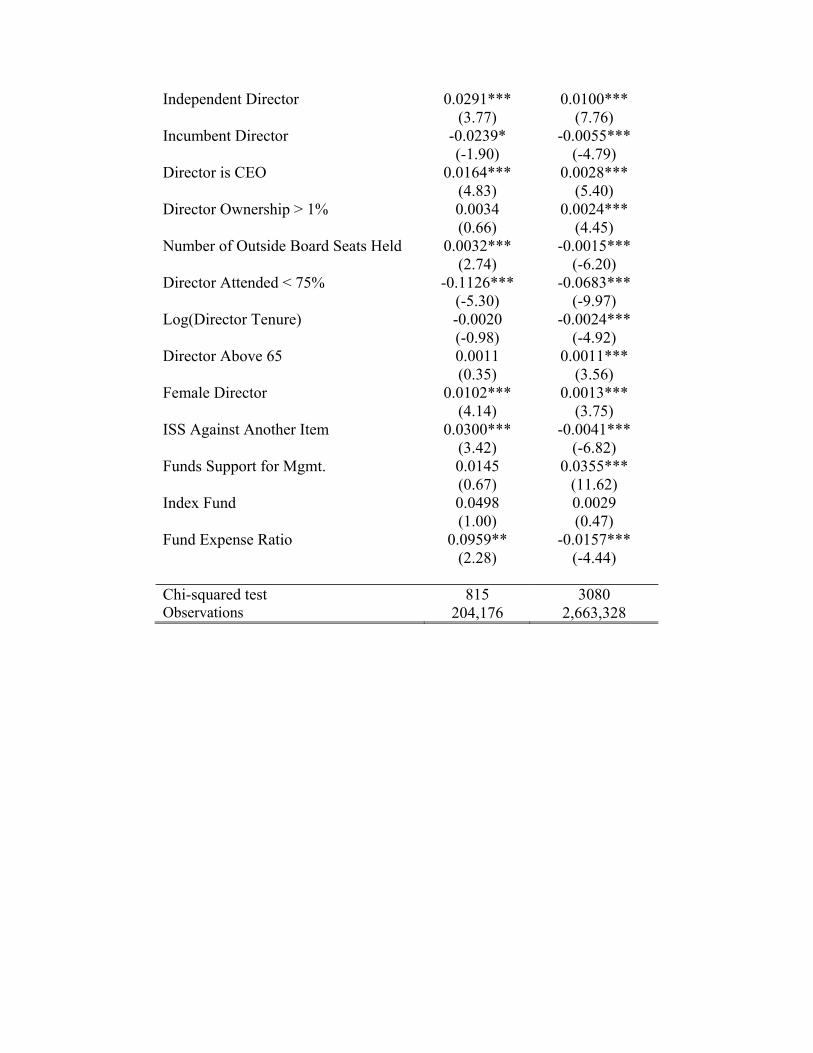
Independent Director 0.0291*** (3.77)
0.0100*** (7.76)
Incumbent Director -0.0239* (-1.90)
-0.0055*** (-4.79)
Director is CEO 0.0164*** (4.83)
0.0028*** (5.40)
Director Ownership > 1% 0.0034 (0.66)
0.0024*** (4.45)
Number of Outside Board Seats Held 0.0032*** (2.74)
-0.0015*** (-6.20)
Director Attended < 75% -0.1126*** (-5.30)
-0.0683*** (-9.97)
Log(Director Tenure) -0.0020 (-0.98)
-0.0024*** (-4.92)
Director Above 65 0.0011 (0.35)
0.0011*** (3.56)
Female Director 0.0102*** (4.14)
0.0013*** (3.75)
ISS Against Another Item 0.0300*** (3.42)
-0.0041*** (-6.82)
Funds Support for Mgmt. 0.0145 (0.67)
0.0355*** (11.62)
Index Fund 0.0498 (1.00)
0.0029 (0.47)
Fund Expense Ratio 0.0959** (2.28)
-0.0157*** (-4.44)
Chi-squared test 815 3080 Observations 204,176 2,663,328
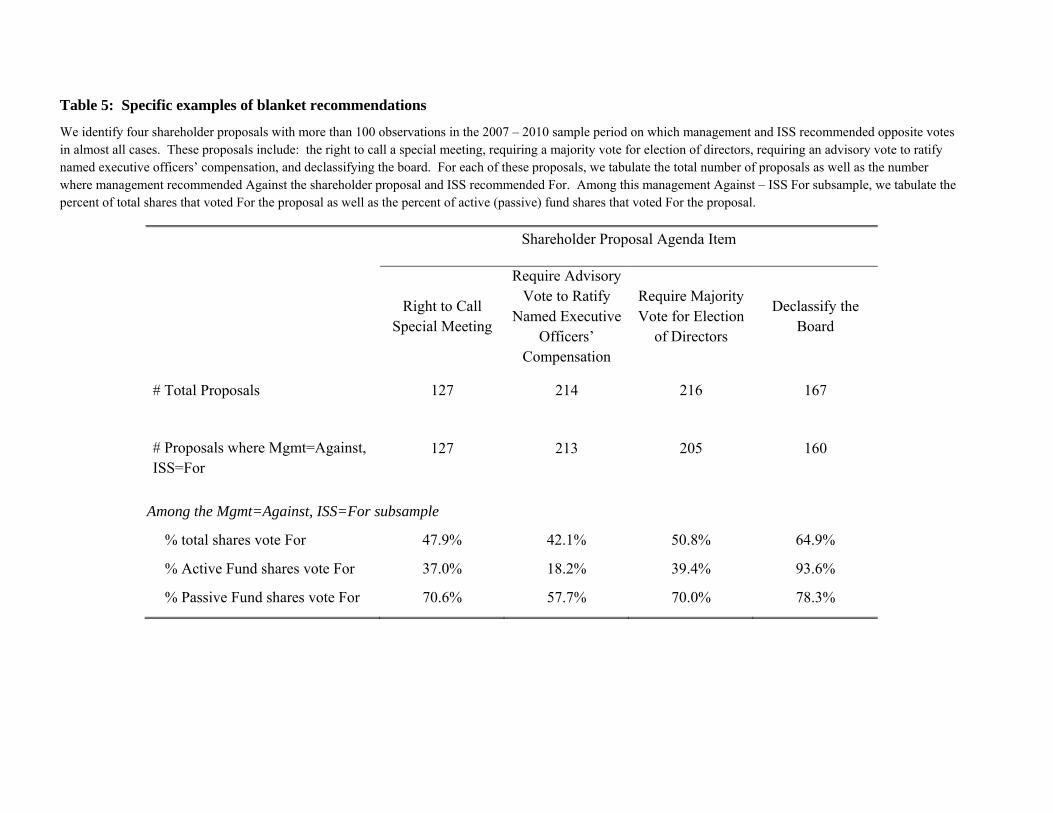
Table 5: Specific examples of blanket recommendations
We identify four shareholder proposals with more than 100 observations in the 2007 – 2010 sample period on which management and ISS recommended opposite votes in almost all cases. These proposals include: the right to call a special meeting, requiring a majority vote for election of directors, requiring an advisory vote to ratify named executive officers’ compensation, and declassifying the board. For each of these proposals, we tabulate the total number of proposals as well as the number where management recommended Against the shareholder proposal and ISS recommended For. Among this management Against – ISS For subsample, we tabulate the percent of total shares that voted For the proposal as well as the percent of active (passive) fund shares that voted For the proposal.
Shareholder Proposal Agenda Item
Right to Call Special Meeting
Require Advisory Vote to Ratify
Named Executive Officers’
Compensation
Require Majority Vote for Election
of Directors
Declassify the Board
# Total Proposals 127 214 216 167
# Proposals where Mgmt=Against, ISS=For
127 213 205 160
Among the Mgmt=Against, ISS=For subsample
% total shares vote For 47.9% 42.1% 50.8% 64.9%
% Active Fund shares vote For 37.0% 18.2% 39.4% 93.6%
% Passive Fund shares vote For 70.6% 57.7% 70.0% 78.3%
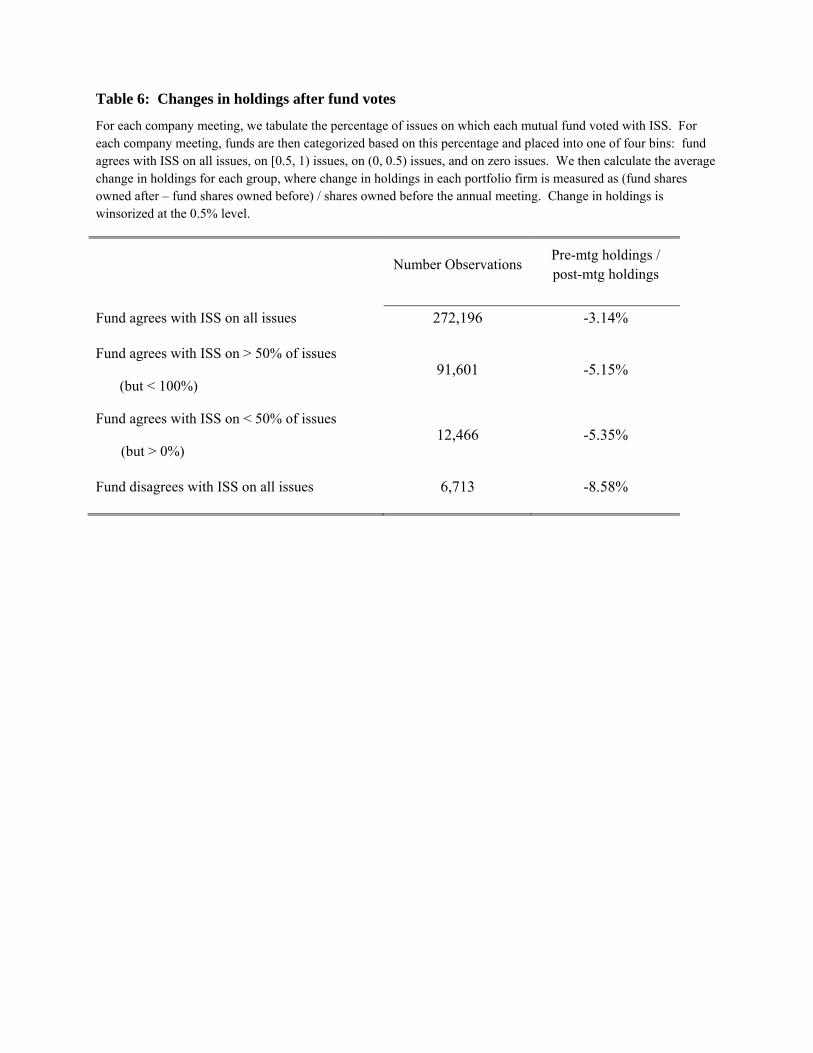
Table 6: Changes in holdings after fund votes
For each company meeting, we tabulate the percentage of issues on which each mutual fund voted with ISS. For each company meeting, funds are then categorized based on this percentage and placed into one of four bins: fund agrees with ISS on all issues, on [0.5, 1) issues, on (0, 0.5) issues, and on zero issues. We then calculate the average change in holdings for each group, where change in holdings in each portfolio firm is measured as (fund shares owned after – fund shares owned before) / shares owned before the annual meeting. Change in holdings is winsorized at the 0.5% level.
Number Observations
Pre-mtg holdings / post-mtg holdings
Fund agrees with ISS on all issues 272,196 -3.14%
Fund agrees with ISS on > 50% of issues
(but < 100%) 91,601 -5.15%
Fund agrees with ISS on < 50% of issues
(but > 0%) 12,466 -5.35%
Fund disagrees with ISS on all issues 6,713 -8.58%
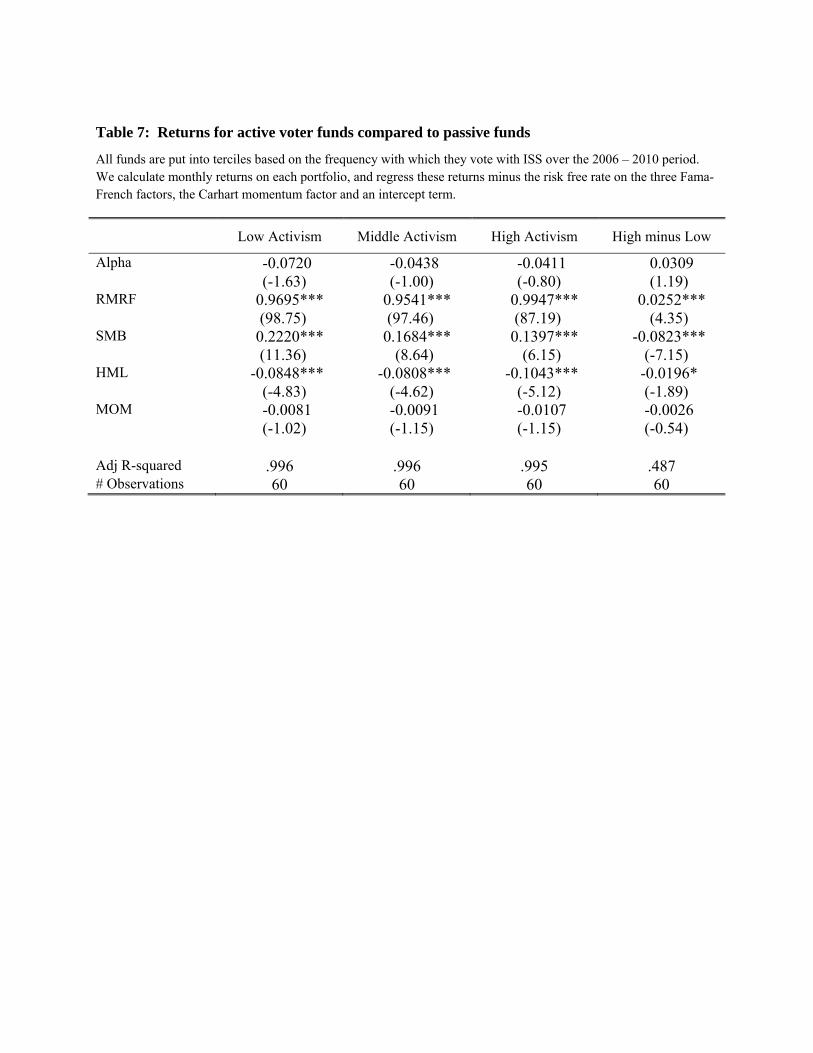
Table 7: Returns for active voter funds compared to passive funds
All funds are put into terciles based on the frequency with which they vote with ISS over the 2006 – 2010 period. We calculate monthly returns on each portfolio, and regress these returns minus the risk free rate on the three Fama-French factors, the Carhart momentum factor and an intercept term.
Low Activism Middle Activism High Activism High minus Low
Alpha -0.0720 (-1.63)
-0.0438 (-1.00)
-0.0411 (-0.80)
0.0309 (1.19)
RMRF 0.9695*** (98.75)
0.9541*** (97.46)
0.9947*** (87.19)
0.0252*** (4.35)
SMB 0.2220*** (11.36)
0.1684*** (8.64)
0.1397*** (6.15)
-0.0823*** (-7.15)
HML -0.0848*** (-4.83)
-0.0808*** (-4.62)
-0.1043*** (-5.12)
-0.0196* (-1.89)
MOM -0.0081 (-1.02)
-0.0091 (-1.15)
-0.0107 (-1.15)
-0.0026 (-0.54)
Adj R-squared .996 .996 .995 .487 # Observations 60 60 60 60
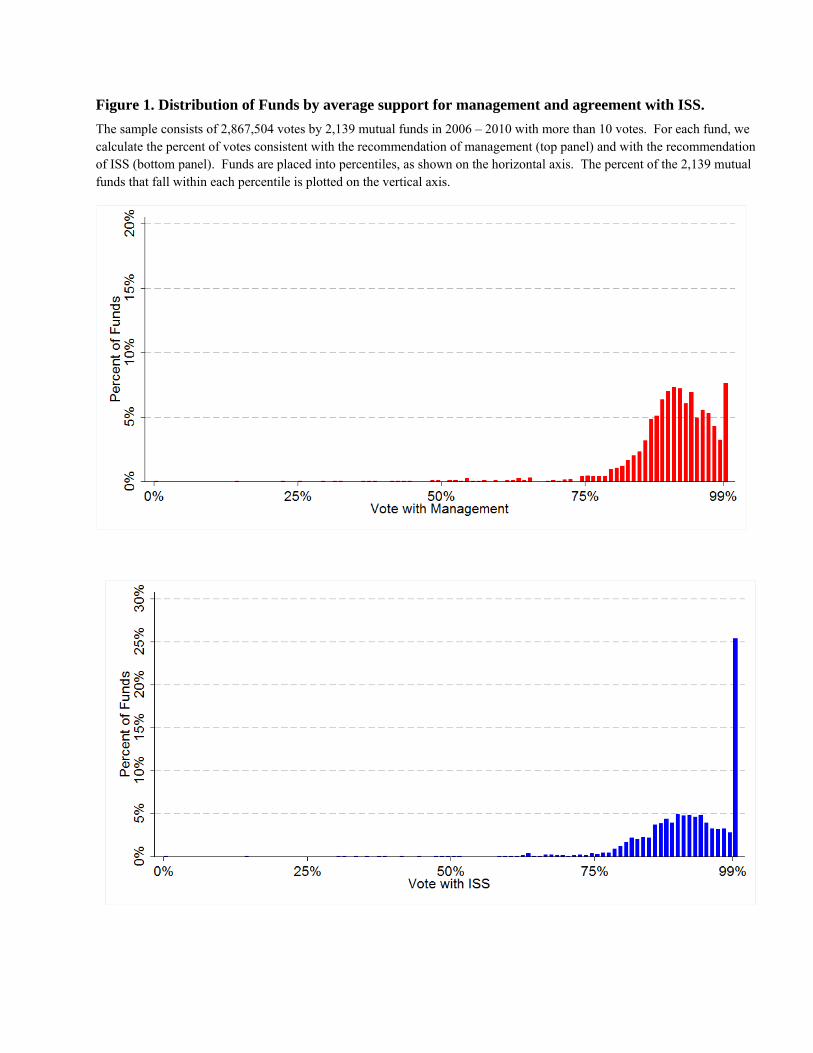
Figure 1. Distribution of Funds by average support for management and agreement with ISS.
The sample consists of 2,867,504 votes by 2,139 mutual funds in 2006 – 2010 with more than 10 votes. For each fund, we calculate the percent of votes consistent with the recommendation of management (top panel) and with the recommendation of ISS (bottom panel). Funds are placed into percentiles, as shown on the horizontal axis. The percent of the 2,139 mutual funds that fall within each percentile is plotted on the vertical axis.
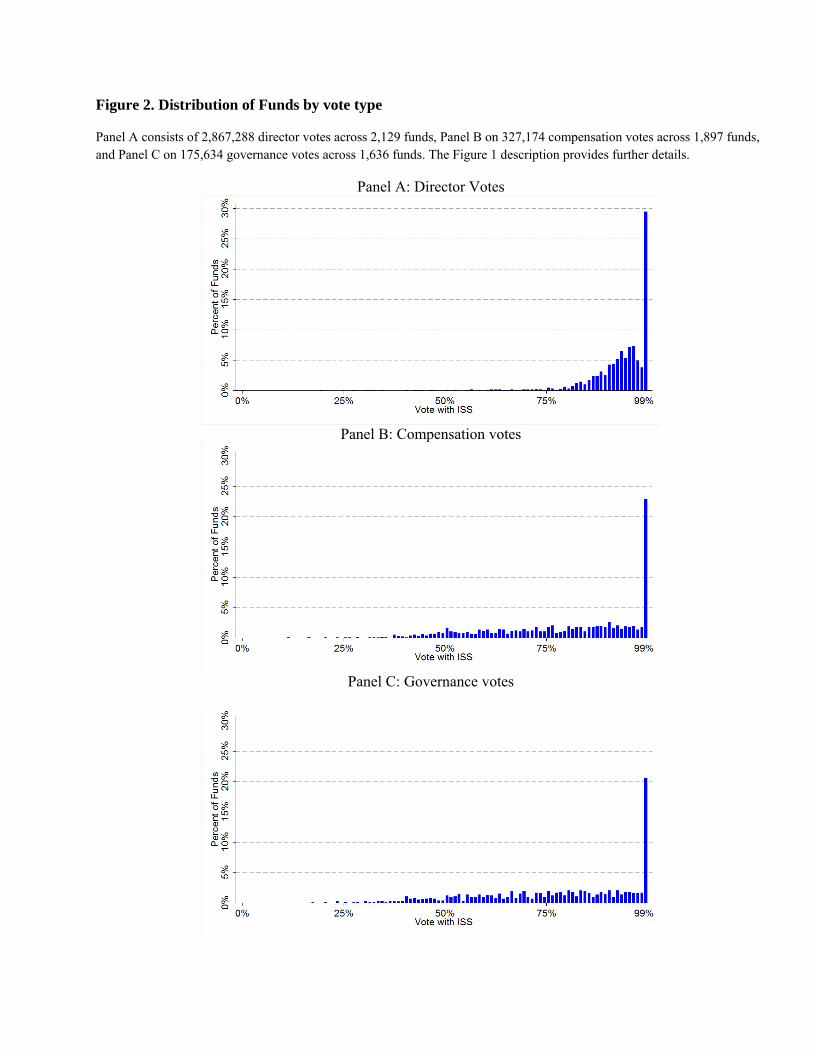
Figure 2. Distribution of Funds by vote type
Panel A consists of 2,867,288 director votes across 2,129 funds, Panel B on 327,174 compensation votes across 1,897 funds, and Panel C on 175,634 governance votes across 1,636 funds. The Figure 1 description provides further details.
Panel A: Director Votes
Panel B: Compensation votes
Panel C: Governance votes
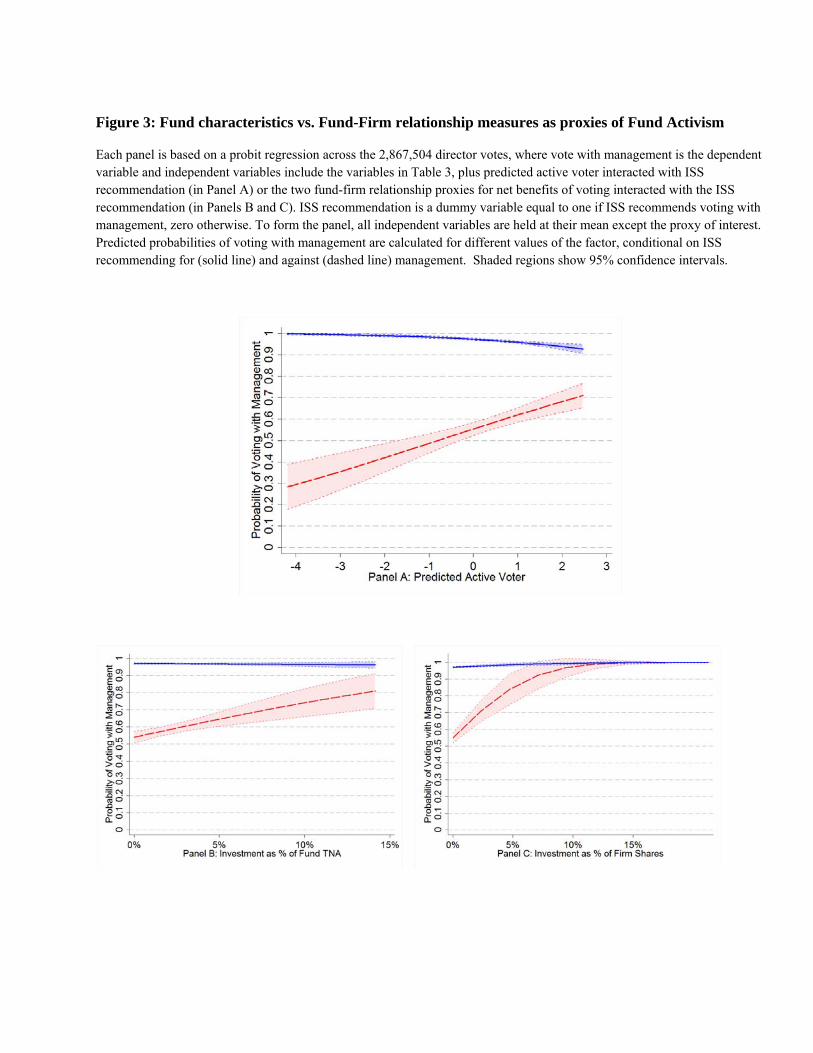
Figure 3: Fund characteristics vs. Fund-Firm relationship measures as proxies of Fund Activism
Each panel is based on a probit regression across the 2,867,504 director votes, where vote with management is the dependent variable and independent variables include the variables in Table 3, plus predicted active voter interacted with ISS recommendation (in Panel A) or the two fund-firm relationship proxies for net benefits of voting interacted with the ISS recommendation (in Panels B and C). ISS recommendation is a dummy variable equal to one if ISS recommends voting with management, zero otherwise. To form the panel, all independent variables are held at their mean except the proxy of interest. Predicted probabilities of voting with management are calculated for different values of the factor, conditional on ISS recommending for (solid line) and against (dashed line) management. Shaded regions show 95% confidence intervals.
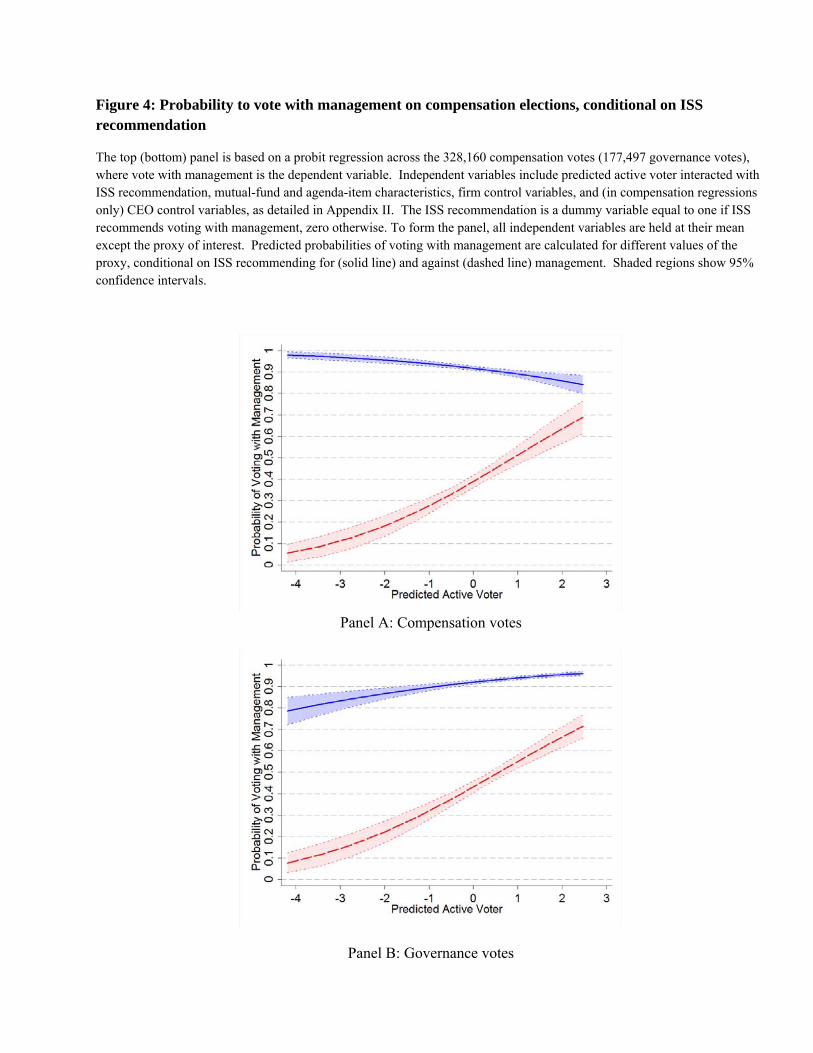
Figure 4: Probability to vote with management on compensation elections, conditional on ISS recommendation
The top (bottom) panel is based on a probit regression across the 328,160 compensation votes (177,497 governance votes), where vote with management is the dependent variable. Independent variables include predicted active voter interacted with ISS recommendation, mutual-fund and agenda-item characteristics, firm control variables, and (in compensation regressions only) CEO control variables, as detailed in Appendix II. The ISS recommendation is a dummy variable equal to one if ISS recommends voting with management, zero otherwise. To form the panel, all independent variables are held at their mean except the proxy of interest. Predicted probabilities of voting with management are calculated for different values of the proxy, conditional on ISS recommending for (solid line) and against (dashed line) management. Shaded regions show 95% confidence intervals.
Panel A: Compensation votes
Panel B: Governance votes
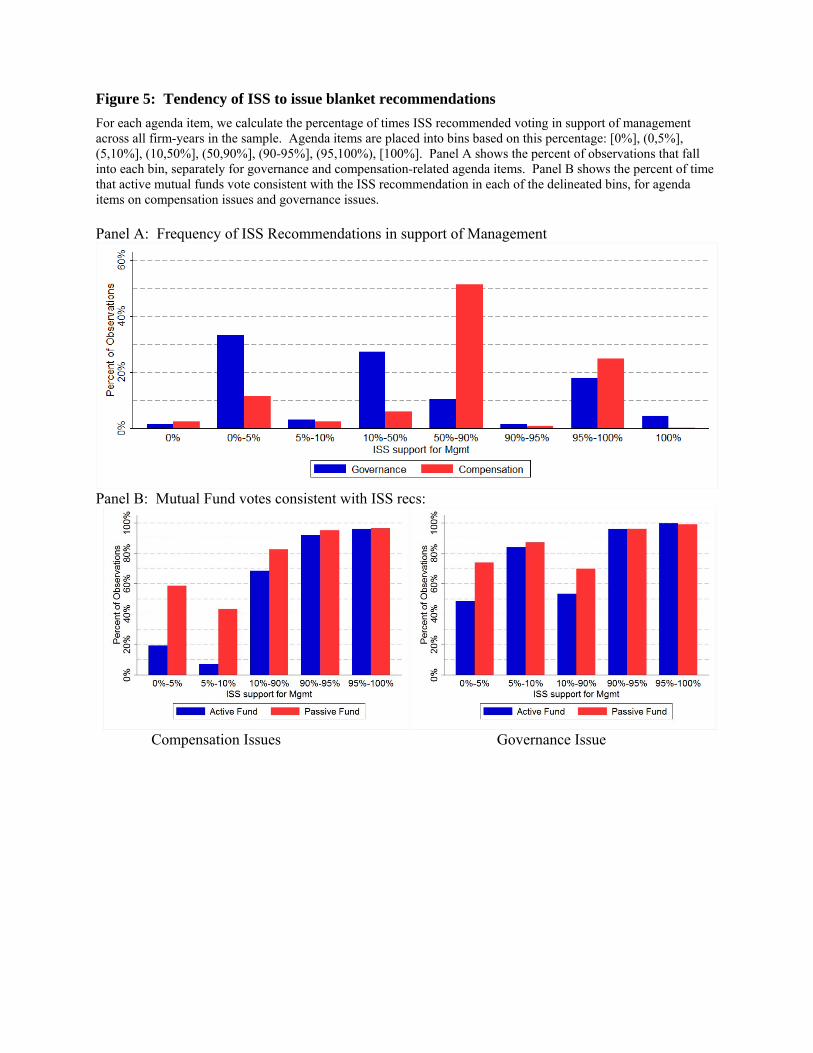
Figure 5: Tendency of ISS to issue blanket recommendations
For each agenda item, we calculate the percentage of times ISS recommended voting in support of management across all firm-years in the sample. Agenda items are placed into bins based on this percentage: [0%], (0,5%], (5,10%], (10,50%], (50,90%], (90-95%], (95,100%), [100%]. Panel A shows the percent of observations that fall into each bin, separately for governance and compensation-related agenda items. Panel B shows the percent of time that active mutual funds vote consistent with the ISS recommendation in each of the delineated bins, for agenda items on compensation issues and governance issues. Panel A: Frequency of ISS Recommendations in support of Management
Panel B: Mutual Fund votes consistent with ISS recs:
Compensation Issues Governance Issue