Embed Size (px)
Citation preview
Zurich Universities of Applied Sciences and Arts
Effective density of aircraft engine PM revisited: Effects of engine thrust, engine type, fuel, and sample conditioning
1
Federal Office of Civil Aviation FOCA
Lukas Durdina1, Beni T. Brem2, Miriam Elser3, David Schönenberger3, Julien G. Anet1
1 Centre for Aviation, ZHAW School of Engineering, Winterthur, 8400, Switzerland2 Laboratory for Atmospheric Chemistry, Paul Scherrer Institute, Villigen, 5232, Switzerland3 Empa, Dübendorf, 8600, Switzerland
DMA-CPMA-CPC for mass and sizeclassification in a standardizedsampling and measurement system
It really worked!
How we collected exhaust samples behind the engines

Zurich Universities of Applied Sciences and Arts
Effective density of non-volatile PM from large turbofan engines is useful for modeling and emissions testing. There is very limited good quality data.
2
• Applications• Estimation of PM number from mass emissions for airport air quality modeling (with
modeled particle size distributions)• Estimation of PM mass emissions from measured size distributions (especially
beneficial at ultra-low concentrations)• Correction for paticle losses in standardized sampling systems for aircraft turbine engine
emissions• Particle morphology information for health effects
Zurich Universities of Applied Sciences and Arts
Measurements were done on various in-service large turbofans with samples extracted at the engine exit plane and 25 m downstream using the DMA-CPMA-CPC setup
3
Engine Test type Sampling location
Fuel Eff. density measurement method
5 CFM56 variants
3 PW4000 variants
Short test(pass-off test)
Engine exit plane
Jet A-1 Fast - SMPS-CPMA
CFM56-7B Dedicatedtesting
Engine exit plane
Jet A-1 and 32% SAF blend
Fast - SMPS-CPMA
CFM56-7B Dedicated testing
~25 m downstream of the exhaust nozzle
Jet A-1 Slow - scanning CPMA, with and without a Catalytic Stripper
0.002 0.005 0.02 0.05 0.2 0.5 20.01 0.1 10
5000
10000
15000
20000
150 nm
100 nm
50 nm
dN/d
log
mp/c
m3
Particle mass mp [fg]
20 nm
• CPMA step scan of DMA classified particles at a selected mobility size
• Long stabilization and scan time of up to 10 min for sizes <50 nm
← 4 data points took more than 30minutes (very high engine cost!)
Slow method – DMA - scanning CPMA
10 1000
200000
400000
600000
800000dN
/dlo
gDp/c
m3
Dp [nm]
0.003 0.005 0.007 0.01 0.02 0.05 0.1 0.2 0.5 1 2
CPMA mass set point [fg]
Fast method – SMPS-CPMA • SMPS scan with CPMA running
between the DMA and the CPC at a fixed mass set point
• Delay time for SMPS scan must be determined down to 0.05s
← scan time of ~ 1 min per massset point
Particle mass in femtograms (fg) – 10-18 kg
DMA selected mobility sizes
Effective density = mass set point / volume of a sphere with diameter equal to the GMD of the size distribution for the mass set point
Effective density = GMD of the mass distribution / volume of a sphere with diameter equal to the DMA-selected mobility size
DMA-CPMA-CPC setup
Zurich Universities of Applied Sciences and Arts
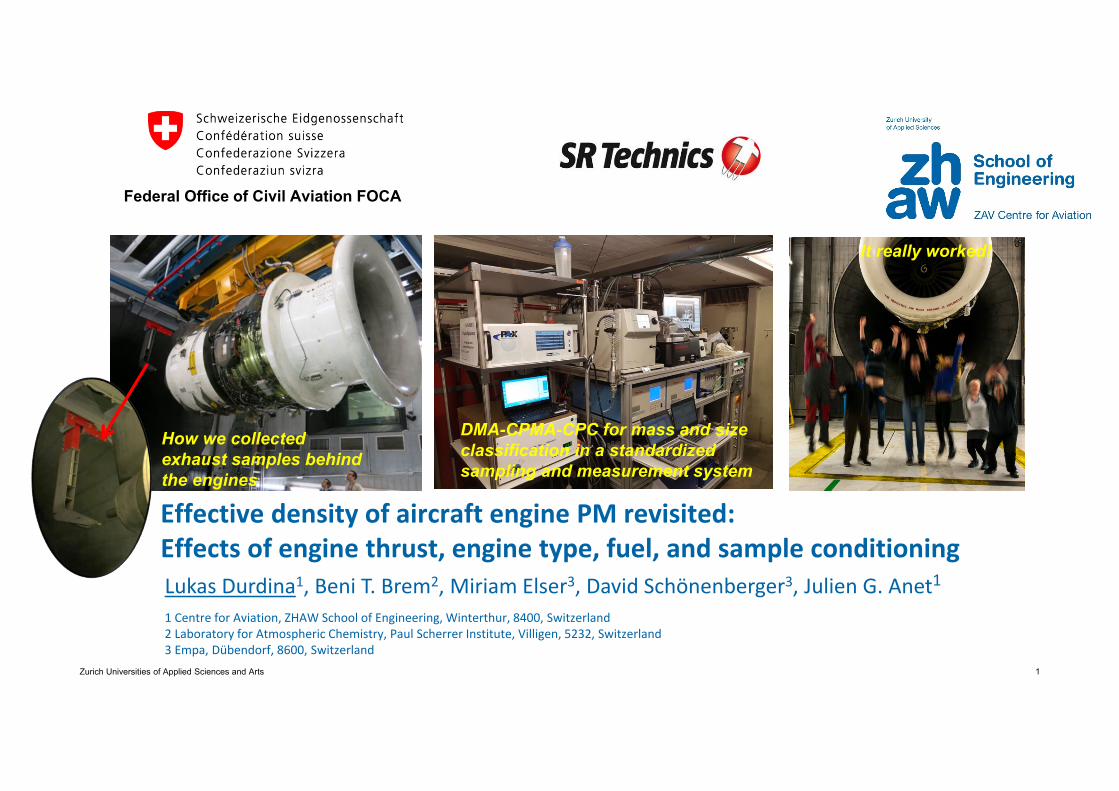
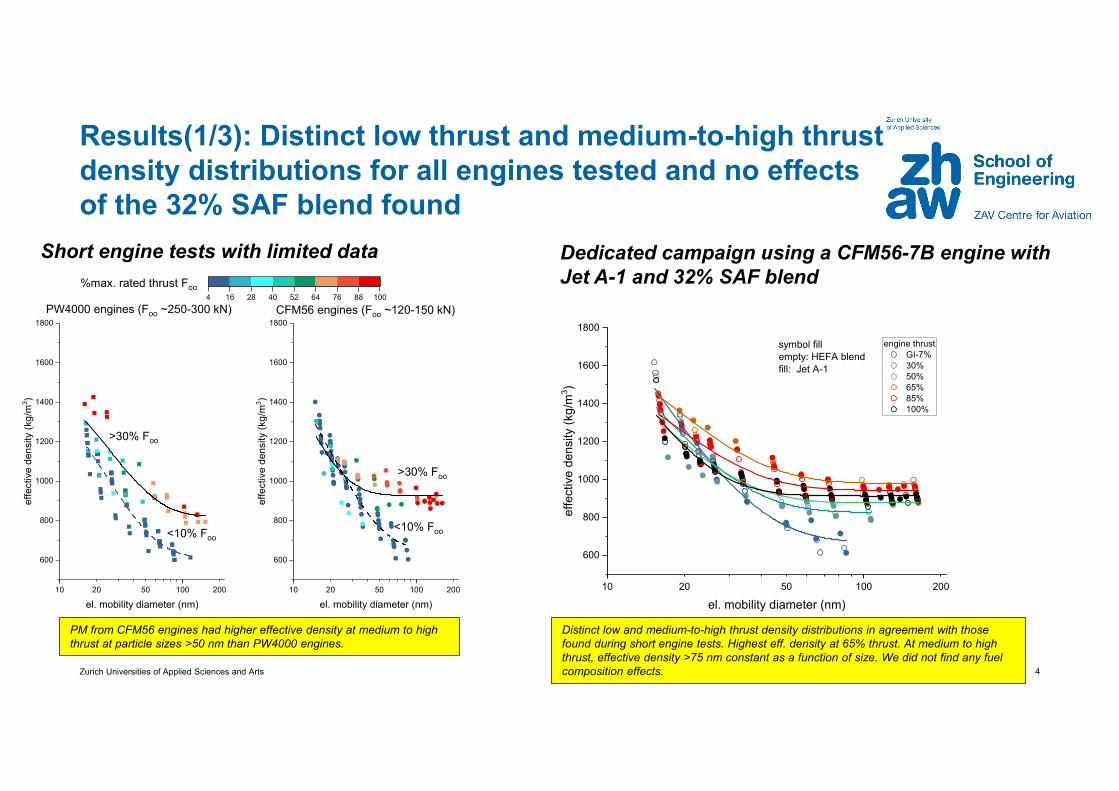
Results(1/3): Distinct low thrust and medium-to-high thrustdensity distributions for all engines tested and no effectsof the 32% SAF blend found
4
20 50 20010 100
600
800
1000
1200
1400
1600
1800
20 50 20010 100
600
800
1000
1200
1400
1600
1800
effe
ctiv
e de
nsity
(kg/
m3 )
el. mobility diameter (nm)
4 16 28 40 52 64 76 88 100%max. rated thrust Foo
>30% Foo
<10% Foo
PW4000 engines (Foo ~250-300 kN) CFM56 engines (Foo ~120-150 kN)
effe
ctiv
e de
nsity
(kg/
m3 )
el. mobility diameter (nm)
>30% Foo
<10% Foo
PM from CFM56 engines had higher effective density at medium to high thrust at particle sizes >50 nm than PW4000 engines.
Short engine tests with limited data
20 50 20010 100
600
800
1000
1200
1400
1600
1800engine thrust
GI-7% 30% 50% 65% 85% 100%
effe
ctiv
e de
nsity
(kg/
m3 )
el. mobility diameter (nm)
symbol fillempty: HEFA blendfill: Jet A-1
Distinct low and medium-to-high thrust density distributions in agreement with those found during short engine tests. Highest eff. density at 65% thrust. At medium to high thrust, effective density >75 nm constant as a function of size. We did not find any fuel composition effects.
Dedicated campaign using a CFM56-7B engine withJet A-1 and 32% SAF blend
Zurich Universities of Applied Sciences and Arts
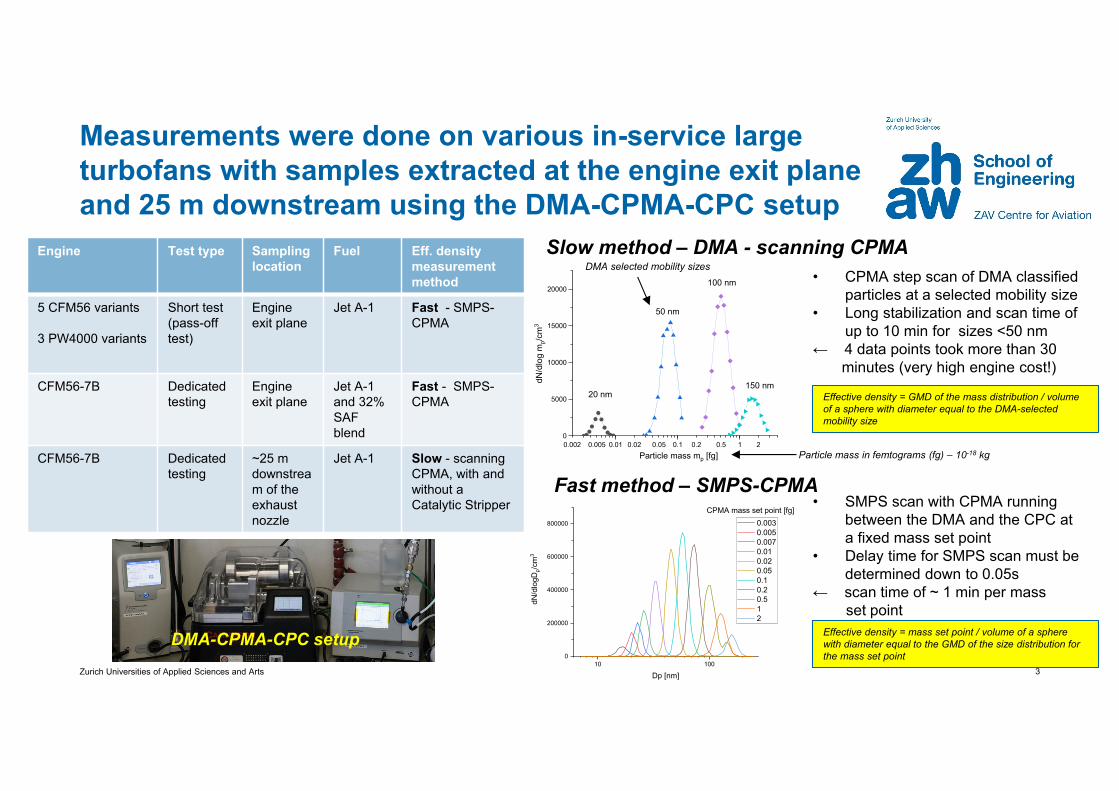
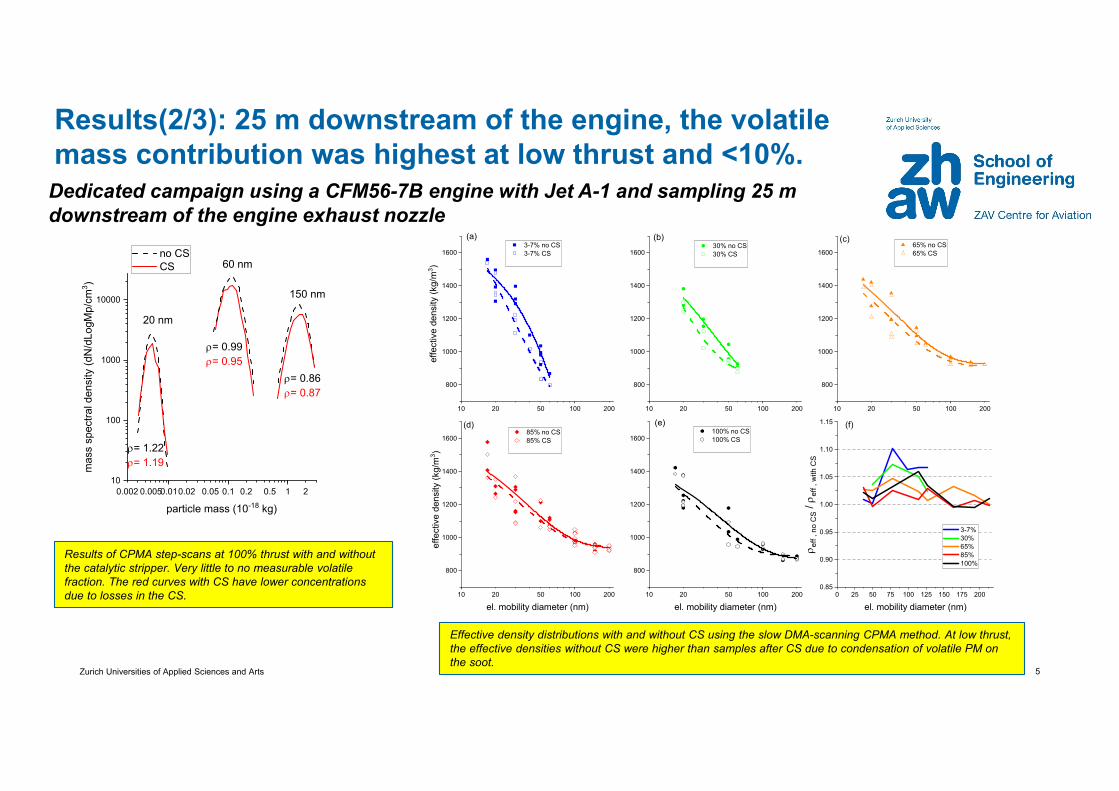
Results(2/3): 25 m downstream of the engine, the volatile mass contribution was highest at low thrust and <10%.
5
20 50 20010 100
800
1000
1200
1400
1600
20 50 20010 100
800
1000
1200
1400
1600
20 50 20010 100
800
1000
1200
1400
1600
20 50 20010 100
800
1000
1200
1400
1600
20 50 20010 100
800
1000
1200
1400
1600
0 25 50 75 100 125 150 175 2000.85
0.90
0.95
1.00
1.05
1.10
1.15 (f)(e)(d)
(c)(b) 3-7% no CS 3-7% CS
effe
ctiv
e de
nsity
(kg/
m3 )
(a) 30% no CS 30% CS
65% no CS 65% CS
85% no CS 85% CS
effe
ctiv
e de
nsity
(kg/
m3 )
el. mobility diameter (nm)
100% no CS 100% CS
el. mobility diameter (nm)
eff
, no
CS
/ ef
f , w
ith C
S
el. mobility diameter (nm)
3-7% 30% 65% 85% 100%
0.002 0.005 0.02 0.05 0.2 0.5 20.01 0.1 110
100
1000
10000
mas
s sp
ectra
l den
sity
(dN
/dLo
gMp/
cm3 )
= 0.86= 0.87
= 0.99= 0.95
150 nm
60 nm
particle mass (10-18 kg)
no CS CS
20 nm
= 1.22= 1.19
Results of CPMA step-scans at 100% thrust with and without the catalytic stripper. Very little to no measurable volatile fraction. The red curves with CS have lower concentrations due to losses in the CS.
Effective density distributions with and without CS using the slow DMA-scanning CPMA method. At low thrust, the effective densities without CS were higher than samples after CS due to condensation of volatile PM on the soot.
Dedicated campaign using a CFM56-7B engine with Jet A-1 and sampling 25 m downstream of the engine exhaust nozzle
Zurich Universities of Applied Sciences and Arts
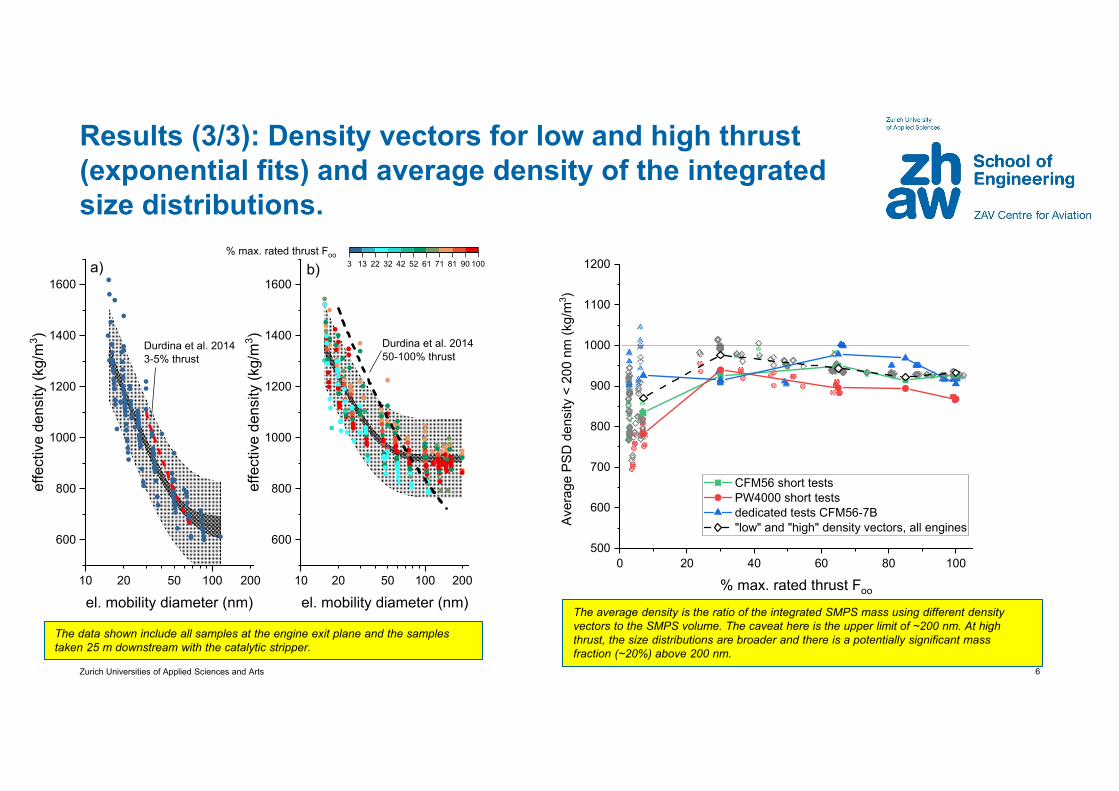
Results (3/3): Density vectors for low and high thrust (exponential fits) and average density of the integrated size distributions.
6
20 50 20010 100
600
800
1000
1200
1400
1600
20 50 20010 100
600
800
1000
1200
1400
1600
Durdina et al. 20143-5% thrust
effe
ctiv
e de
nsity
(kg/
m3 )
el. mobility diameter (nm)
a) b)ef
fect
ive
dens
ity (k
g/m
3 )
el. mobility diameter (nm)
3 13 22 32 42 52 61 71 81 90 100% max. rated thrust Foo
Durdina et al. 201450-100% thrust
The data shown include all samples at the engine exit plane and the samples taken 25 m downstream with the catalytic stripper.
0 20 40 60 80 100500
600
700
800
900
1000
1100
1200
Aver
age
PSD
den
sity
< 2
00 n
m (k
g/m
3 ) % max. rated thrust Foo
CFM56 short tests PW4000 short tests dedicated tests CFM56-7B "low" and "high" density vectors, all engines
The average density is the ratio of the integrated SMPS mass using different density vectors to the SMPS volume. The caveat here is the upper limit of ~200 nm. At high thrust, the size distributions are broader and there is a potentially significant mass fraction (~20%) above 200 nm.

Zurich Universities of Applied Sciences and Arts
Conclusions
7
• We provide new data on PM effective density for large turbofan engines• We confirmed the thrust dependence of effective density distributions for various
engine types• The mass-mobility relationship reported previously underestimated effective densities
at high thrust at sizes > 75 nm. Mass-mobility exponents determined from power lawfits depend on the size range of the data available. Thus, the exponent may bemeaningless if only data in a very narrow size range is available.
Zurich Universities of Applied Sciences and Arts
Additional information
8

Zurich Universities of Applied Sciences and Arts
Particle mass vs mobility diameter with Jet A-1 and 32% SAF blend
9
20 50 20010 1000.002
0.005
0.02
0.05
0.2
0.5
2
0.01
0.1
1
20 50 20010 1000.002
0.005
0.02
0.05
0.2
0.5
2
0.01
0.1
1
20 50 20010 1000.002
0.005
0.02
0.05
0.2
0.5
2
0.01
0.1
1
20 50 20010 1000.002
0.005
0.02
0.05
0.2
0.5
2
0.01
0.1
1
3-7% Foo Jet A-1 3-7% Foo HEFA
Mp
[10-1
8 kg]
Dp [nm]
30% Foo Jet A-1 30% Foo HEFA
Mp
[10-1
8 kg]
Dp [nm]
85% Foo Jet A-1 85% Foo HEFA
Mp
[10-1
8 kg]
Dp [nm]
100% Foo Jet A-1 100% Foo HEFA
Mp
[10-1
8 kg]
Dp [nm]
• Open symbols: Jet A-1• Filled symbols: 32% HEFA blend• No fuel effect observed
Zurich Universities of Applied Sciences and Arts
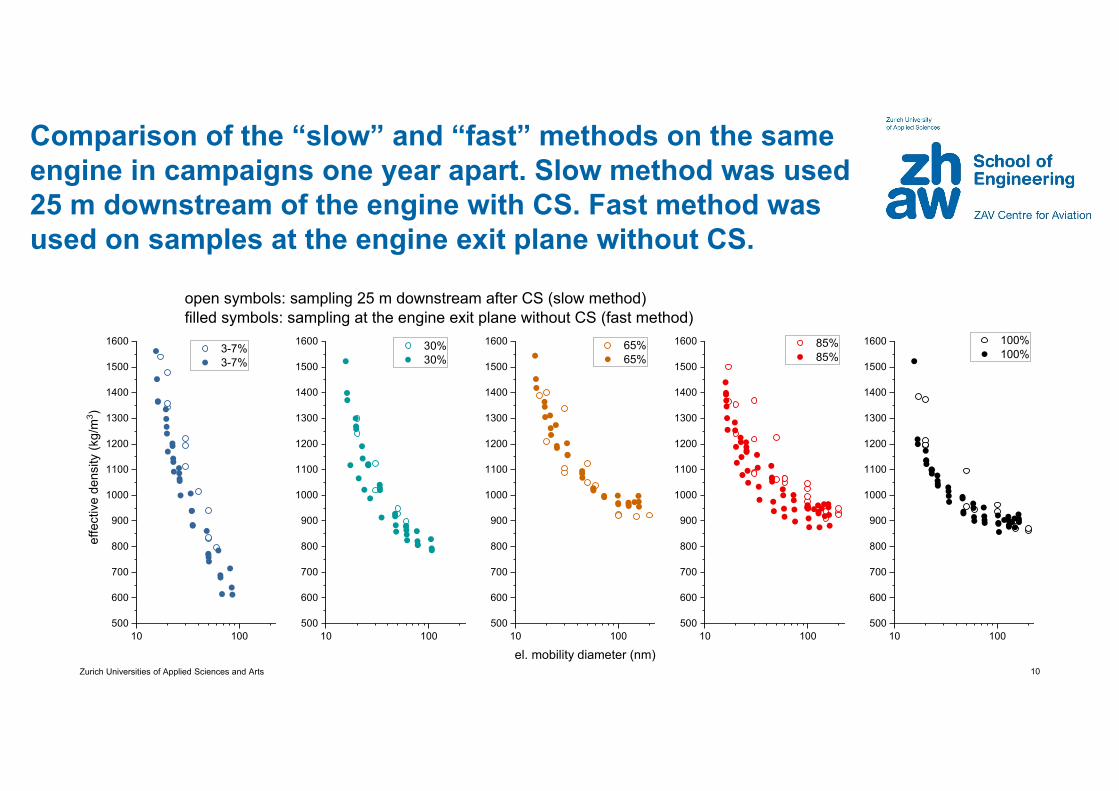
Comparison of the “slow” and “fast” methods on the same engine in campaigns one year apart. Slow method was used 25 m downstream of the engine with CS. Fast method was used on samples at the engine exit plane without CS.
10
10 100500
600
700
800
900
1000
1100
1200
1300
1400
1500
1600
10 100500
600
700
800
900
1000
1100
1200
1300
1400
1500
1600
10 100500
600
700
800
900
1000
1100
1200
1300
1400
1500
1600
10 100500
600
700
800
900
1000
1100
1200
1300
1400
1500
1600
10 100500
600
700
800
900
1000
1100
1200
1300
1400
1500
1600 3-7% 3-7%
effe
ctiv
e de
nsity
(kg/
m3 )
open symbols: sampling 25 m downstream after CS (slow method)filled symbols: sampling at the engine exit plane without CS (fast method)
30% 30%
65% 65%
el. mobility diameter (nm)
85% 85%
100% 100%
Zurich Universities of Applied Sciences and Arts
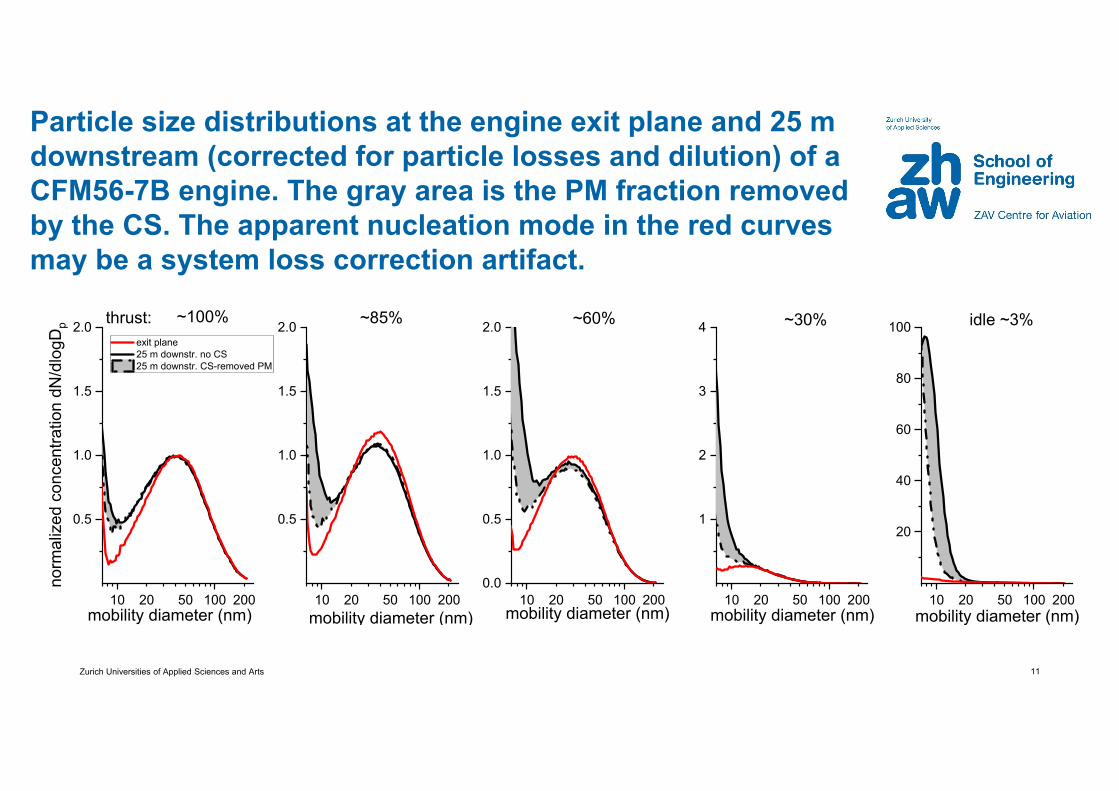
Particle size distributions at the engine exit plane and 25 m downstream (corrected for particle losses and dilution) of a CFM56-7B engine. The gray area is the PM fraction removed by the CS. The apparent nucleation mode in the red curves may be a system loss correction artifact.
11
20 50 20010 100
0.5
1.0
1.5
2.0
20 50 20010 100
0.5
1.0
1.5
2.0
20 50 20010 1000.0
0.5
1.0
1.5
2.0
20 50 20010 100
1
2
3
4
20 50 20010 100
20
40
60
80
100
norm
aliz
ed c
once
ntra
tion
dN/d
logD
p
mobility diameter (nm)
exit plane 25 m downstr. no CS 25 m downstr. CS-removed PM
~100% ~85% ~60% ~30%thrust:
mobility diameter (nm) mobility diameter (nm) mobility diameter (nm)
idle ~3%
mobility diameter (nm)
Zurich Universities of Applied Sciences and Arts
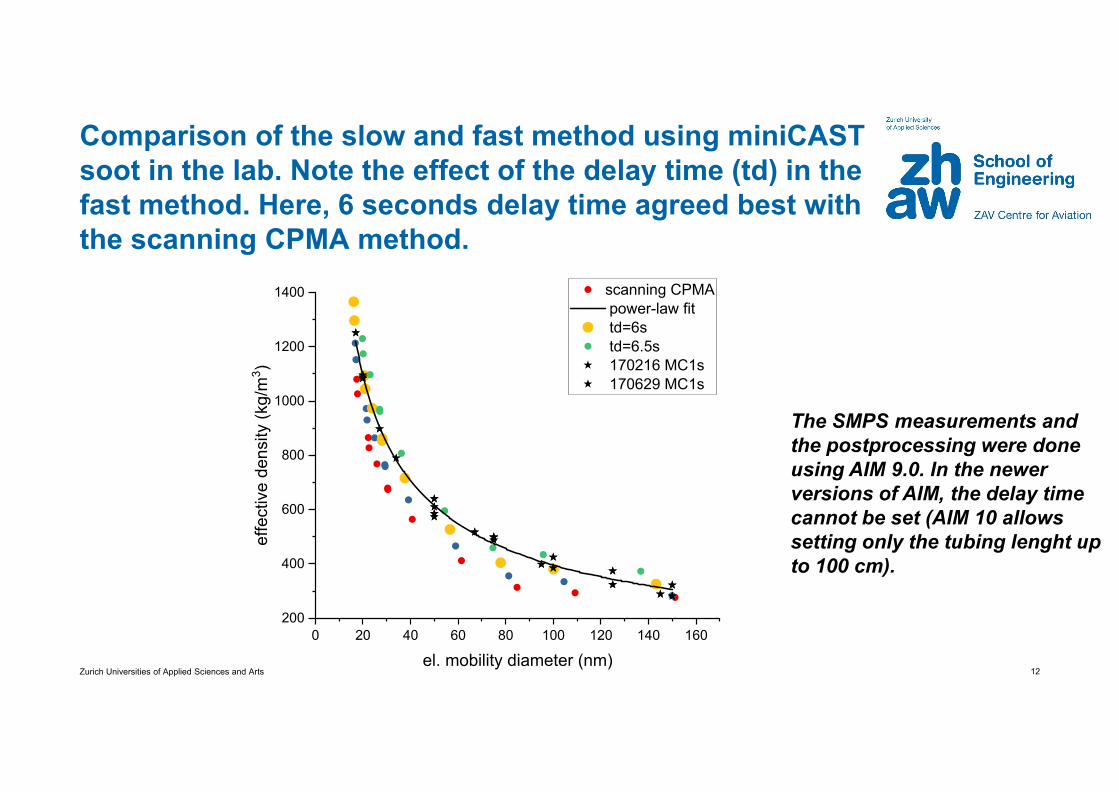
Comparison of the slow and fast method using miniCASTsoot in the lab. Note the effect of the delay time (td) in the fast method. Here, 6 seconds delay time agreed best with the scanning CPMA method.
12
The SMPS measurements and the postprocessing were doneusing AIM 9.0. In the newerversions of AIM, the delay time cannot be set (AIM 10 allowssetting only the tubing lenght upto 100 cm).
0 20 40 60 80 100 120 140 160200
400
600
800
1000
1200
1400 scanning CPMA power-law fit td=6s td=6.5s 170216 MC1s 170629 MC1s
effe
ctiv
e de
nsity
(kg/
m3 )
el. mobility diameter (nm)